Embed Size (px)
Citation preview
Effect of Dissolved Carbon Dioxide on Very-High-Gravity
Fermentation
A Thesis submitted to the College of Graduate Studies and Research
in partial fulfillment of the requirements for the degree of
Master of Science
In the Department of Chemical and Biological Engineering,
University of Saskatchewan,
Saskatoon, Saskatchewan
By
Shyam Srinivasan
©Copyright Shyam Srinivasan, August 2012. All rights reserved
i
PERMISSION TO USE
I agree that this thesis, presented in partial fulfillment of the requirements for a Master of
Science degree from the University of Saskatchewan, be made freely available for inspection by
the Libraries of the University of Saskatchewan. I further agree that permission to copy this
thesis, in whole or in part, for scholarly purposes only be granted by the professor who
supervised the work presented in this thesis. In his absence, such permission shall be granted by
the Head of the Department of Chemical and Biological Engineering or the Dean of the College
of Graduate Studies and Research. Copying, publishing or use of this thesis or part thereof for
financial gain shall not be permitted without my written consent. Due recognition shall be given
to me and the University of Saskatchewan for any scholarly use of materials in this thesis in
whole or part thereof.
All requests for permission pertaining to use of materials in this thesis in whole or part
thereof for the purpose of copying should be addressed to
Head of the Department of Chemical & Biological Engineering
University of Saskatchewan, Saskatoon, SK, S7N 5A9
Canada
ii
ABSTRACT
The stoichiometric relationship between carbon dioxide (CO2) generated and glucose
consumed during fermentation can be utilized to predict glucose consumption as well as yeast
growth by measuring the CO2 concentration. Dissolved CO2 was chosen as opposed to off-gas
CO2 due to the high solubility of CO2 in the fermentation broth as well as its ability to reflect on
yeast growth more accurately than off-gas CO2. Typical very-high-gravity (VHG) ethanol
fermentation is plagued by incomplete glucose utilization and longer durations. Aiming to
improve substrate utilization and enhance VHG fermentation performance, characteristics of
dissolved CO2 concentration in fermentation broths using Saccharomyces cerevisiae were
studied under batch conditions. Based on this study a novel control methodology based on
dissolved CO2 was developed and its effectiveness on enhancing VHG fermentation was
evaluated by measuring the fermentation duration, glucose conversion efficiency and ethanol
productivity.
Four different initial concentrations 150, 200.05±0.21, 250.32±0.12, and 300.24±0.28 g
glucose/L were used for batch ethanol fermentation without control. Zero substrate was indicated
for 150 and 200.05±0.21 g glucose/L by a characteristic abrupt drop in dissolved CO2
concentration. On the other hand sluggish fermentation and incomplete substrate utilization were
witnessed for 250.32±0.12, and 300.24±0.28 g glucose/L. A material balance equation was
developed to compensate for the inability of the dissolved CO2 profiles to accurately predict the
different growth phases of yeast.
iii
Dissolved CO2 was controlled at three distinct levels of 500, 750 and 1000 mg/L using
aeration rates of 820 and 1300 mL/min for initial concentrations of 259.72±7.96 and
303.92±10.66 g glucose/L. Enhancement of VHG fermentation was achieved in the form of
complete glucose utilization and higher ethanol productivities and shorter fermentation duration
in comparison to batches without control. Complete glucose utilization was facilitated under
~250 and ~300 g glucose/L in 27.02±0.91 and 36.8±3.56 h respectively. Irrespective of the
control set points and aeration rates, ethanol productivities of 3.98±0.28 g/L-h and 3.44±0.32
g/L-h were obtained for 259.72±7.96 and 303.92±10.66 g glucose/L respectively. The glucose
conversion efficiencies for both 259.85±9.02 and 299.36±6.66 g glucose/L when dissolved CO2
was controlled were on par with that of batches without control.
Keywords: dissolved carbon dioxide, very-high-gravity fermentation, control, Saccharomyces
cerevisiae, ethanol productivity
iv
ACKNOWLEDGEMENTS
My gratitude goes to my supervisor, Dr. Yen-Han Lin for his guidance and support
throughout the course of my project. I appreciate his constant appraisals of my work and his
invaluable troubleshooting skills whenever I was in a pinch. I sincerely thank my committee
members Dr. Jian Peng and Dr. Oon-Doo Baik who have provided me without invaluable
comments and suggestions for all my reports and presentations.
I also thank the staff at the Department of Chemical and Biological Engineering,
especially, Mr. Dragan Cekic, and Mr. Rlee Prokopishyn for their technical expertise. I also
thank Mr. Richard Blondin and Ms. Heli Eunike for their patience and help with the HPLC and
other equipments despite my impatience.
I would not have been able to complete my work if not for the help provided by fellow
lab partner Sijing Feng. Our mutual discussions have given me invaluable knowledge on a lot of
subjects including but not limited to the current work. Thank you for enriching my life and
maintaining a lively atmosphere in the lab throughout the course of my work.
Finally I thank my parents and sister who have supported me from afar for the past two
years.
v
TABLE OF CONTENTS
PERMISSION TO USE i
ABSTRACT ii
ACKNOWLEDGEMENTS iv
TABLE OF CONTENTS v
LIST OF TABLES vii
LIST OF FIGURES viii
NOMENCLATURE xi
CHAPTER 1 LITERATURE REVIEW
1.1 Introduction
1.1.1 Very-High-Gravity fermentation
1.1.2 Glycolysis in Saccharomyces cerevisiae
1.1.3 Carbon dioxide in Fermentation
1.1.3.1 Fermentation Measurement using Carbon dioxide
1.1.3.2 Carbon dioxide Inhibition in Ethanol Fermentation
1.1.3.2.1 Carbon dioxide behavior in aqueous systems
1.1.3.2.2 Mechanism of carbon dioxide inhibition
1.1.3.2.3 Effects of carbon dioxide inhibition on microorganisms
1.1.4 Role of Oxygen in Ethanol Fermentation
1.1.5 Carbon dioxide Removal in Submerged Fermentations
1.1.6 Redox Potential based Control of Very-High-Gravity Fermentation
1.2 Knowledge Gaps
1.3 Objectives
1.4 Approach
1
1
2
3
7
8
9
11
12
15
19
21
22
25
26
26
CHAPTER 2 EXPERIMENTAL MATERIALS AND METHODS
2.1 Strain and Growth Media
2.1.1 Yeast Pre-culture
2.2 Batch Fermentation
2.2.1 Experimental Set up
2.2.2 Measurement of Dissolved Carbon dioxide and Redox Potential
2.2.3 Control of Dissolved Carbon dioxide Concentration
2.2.3.1 Carbon dioxide Control using Calcium hydroxide
2.2.3.2 Carbon dioxide Control using Air
2.2.4 Fermentation Conditions
2.2.5 Analytical Analysis
28
28
29
30
30
30
32
32
34
34
35
vi
2.2.5.1 Analysis of Carbohydrates and Organic Acids
2.3 Determination of Ethanol Toxic Concentrations
35
35
CHAPTER 3 RESULTS AND DISCUSSIONS
3.1 Dissolved Carbon dioxide Concentration and Yeast Growth
3.1.1 Dissolved Carbon dioxide Concentration and Evolution
3.1.2 Effect of Ethanol Toxicity and Osmosis on Carbon dioxide Evolution
3.2 Dissolved Carbon dioxide Control in Very-High-Gravity Fermentation
3.2.1 Characteristics of Dissolved Carbon dioxide Profiles in the Presence of Control
3.2.2 Comparison of Profiles in the Presence and Absence of Control
3.2.3 Effect of Dissolved Carbon dioxide Set Point on Very-High-Gravity
Fermentation
3.2.3.1 Dissolved Carbon dioxide Controlled at 500 mg/L
3.2.3.1.1 Effect of carbon dioxide removal
3.2.3.1.2 Effect of oxygen supply
3.2.3.2 Dissolved Carbon dioxide Controlled at 750 mg/L
3.2.3.2.1 Effect on dissolved carbon dioxide profiles
3.2.3.2.2 Effect on aeration
3.2.3.2.3 Effect on metabolite consumption and production
3.2.3.2.4 Effect on yeast growth and viability
3.2.3.3 Dissolved Carbon dioxide Controlled at 1000 mg/L
3.2.3.3.1 Effect on dissolved carbon dioxide profile
3.2.3.3.2 Effect on aeration
3.2.3.3.3 Effect on metabolite consumption and production
3.2.3.3.4 Effect on yeast growth and viability
3.2.4 Effect of Dissolved Carbon dioxide Control on Glucose Conversion Efficiency
and Ethanol Productivity
3.3 Comparison with Redox Potential Measurement and Profiles
3.3.1 Similarities between Dissolved Carbon dioxide and Redox Potential
Measurements
3.3.2 Contrasts between Dissolved Carbon dioxide and Redox Potential
Measurements
37
37
41
47
50
51
57
69
60
60
64
66
66
71
73
76
77
77
77
81
81
82
86
86
88
CHAPTER 4 CONCLUSIONS 91
CHAPTER 5 FUTURE RECOMMENDATIONS 94
REFERENCES 96
APPENDIX 105
vii
LIST OF TABLES
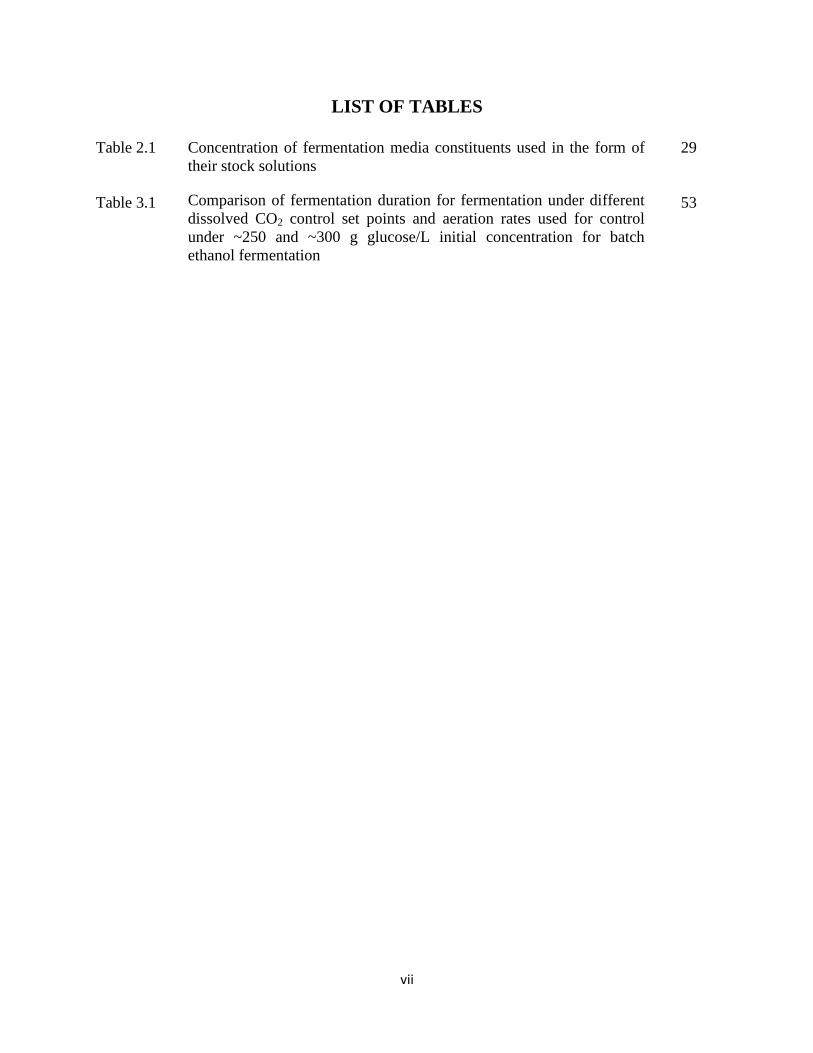
Table 2.1 Concentration of fermentation media constituents used in the form of
their stock solutions
29
Table 3.1 Comparison of fermentation duration for fermentation under different
dissolved CO2 control set points and aeration rates used for control
under ~250 and ~300 g glucose/L initial concentration for batch
ethanol fermentation
53
viii
LIST OF FIGURES
Figure 1.1 Schematic of the glycolytic pathway in unicellular organisms for
glucose utilization
5
Figure 2.1 Line diagram of the experimental set-up used to perform batch ethanol
fermentation
31
Figure 3.1 Representative profiles of biomass and dissolved CO2 concentration
and dissolved CO2 accumulation observed during batch ethanol
fermentation in the absence of control for a) 150 and b) 200.05±0.21 g
glucose/L initial concentration
42
Figure 3.2 Representative profiles of biomass and dissolved CO2 concentration
and dissolved CO2 accumulation observed during batch ethanol
fermentation in the absence of control for a) 250.32±0.12 and b)
300.24±0.28 g glucose/L initial concentration
43
Figure 3.3 Representative concentration profiles of glucose and ethanol for a)
150, b) 200.05±0.21, c) 250.32±0.12 and d) 300.24±0.28 g glucose/L
initial concentration
44
Figure 3.4 Representative plots of ethanol concentration and cell viability profiles
corresponding to profiles in Figures 3.1- 3.3
48
Figure 3.5 Concentration profiles of a) dissolved CO2 and biomass and b) glucose
and ethanol representing the 4 regions of the dissolved CO2
concentration profile observed in the presence of control for initial
concentration of 259.72±7.96 g glucose/L
54
Figure 3.6 Concentration profiles of a) dissolved CO2 and biomass and b) glucose
and ethanol representing the 4 regions of the dissolved CO2
concentration profile observed in the presence of control for initial
concentration of 303.92±10.66 g glucose/L
55
Figure 3.7 Representative profiles of dissolved CO2 concentration controlled at
500 mg/L under aeration rates of a) 820 and b) 1300 mL/min for initial
concentration of 263.76±5.55 g glucose/L
61
Figure 3.8 Profiles of glucose and ethanol concentration and cell viability
representing duplicate experiments with dissolved CO2 controlled at
500 mg/L under aeration rates of a) 820 and b) 1300 mL/min for initial
concentration of 263.76±5.55 g glucose/L. A final ethanol
concentration of 103.31±2.19 g/L was obtained irrespective of the
aeration rates.
62
Figure 3.9 Representative profiles of dissolved CO2 concentration controlled at
67
ix
750 mg/L under aeration rates of a) 820 and b) 1300 mL/min for initial
concentration of 259.85±9.02 g glucose/L
Figure 3.10 Representative profiles of dissolved CO2 concentration controlled at
750 mg/L under aeration rates of a) 820 and b) 1300 mL/min for initial
concentration of 308.49±12.87 g glucose/L. Observed values were
obtained from duplicate experiments.
68
Figure 3.11 Profiles of glucose and ethanol concentration and cell viability
representing duplicate experiments with dissolved CO2 controlled at
750 mg/L under initial concentrations and aeration rates of a)
259.85±9.02 and 820, b) 259.85±9.02 and 1300, c) 308.49±12.87 and
800 and d) 308.49±12.87 g glucose/L and 1300 mL/min respectively.
69
Figure 3.12 Quantity of oxygen bubbled through the fermentation broth
representing the quantity of air bubbled through for initial
concentrations of a) and b) under different set points and aeration rates.
72
Figure 3.13 Maximum biomass and glycerol concentrations measured during the
course of batch ethanol fermentation for different dissolved CO2 set
points and aeration rates for initial concentrations of a) 259.72±7.96
and b) 303.92±10.66 g glucose/L in duplicate experiments for each
case listed
75
Figure 3.14 Representative profiles of dissolved CO2 concentration controlled at
1000 mg/L under aeration rates of a) 820 and b) 1300 mL/min for
initial concentration of 255.55±8.65 g glucose/L
78
Figure 3.15 Representative profiles of dissolved CO2 concentration controlled at
1000 mg/L under aeration rates of a) 820 and b) 1300 mL/min for
initial concentration of 299.36±6.66 g glucose/L. Observed values
were obtained from duplicate experiments.
79
Figure 3.16 Profiles of glucose and ethanol concentration and cell viability
representing duplicate experiments with dissolved CO2 controlled at
1000 mg/L under initial concentrations and aeration rates of a)
255.55±8.65 and 820, b) 255.55±8.65 and 1300, c) 299.36±6.66 and
800 and d) 299.36±6.66 g glucose/L and 1300 mL/min respectively.
80
Figure 3.17 Substrate conversion efficiencies obtained in the presence of control
for initial concentration of a) 259.72±7.96 and b) 303.92±10.66 g
glucose/L from duplicate experiments.
83
Figure 3.18 Ethanol productivities obtained in the presence of control for initial
concentration of a) 259.72±7.96 and b) 303.92±10.66 g glucose/L from
duplicate experiments.
84
x
Figure 3.19 A comparison of the a) ORP and b) dissolved CO2 profiles observed
under control of the respective quantities for ~300 g glucose/L initial
concentration showing the four distinct regions of each profile. Figure
3.19a was adapted from Lin et al. (2010) and Figure 3.19b is same as
Figure 3.6 and Figure 3.10a.
87
xi
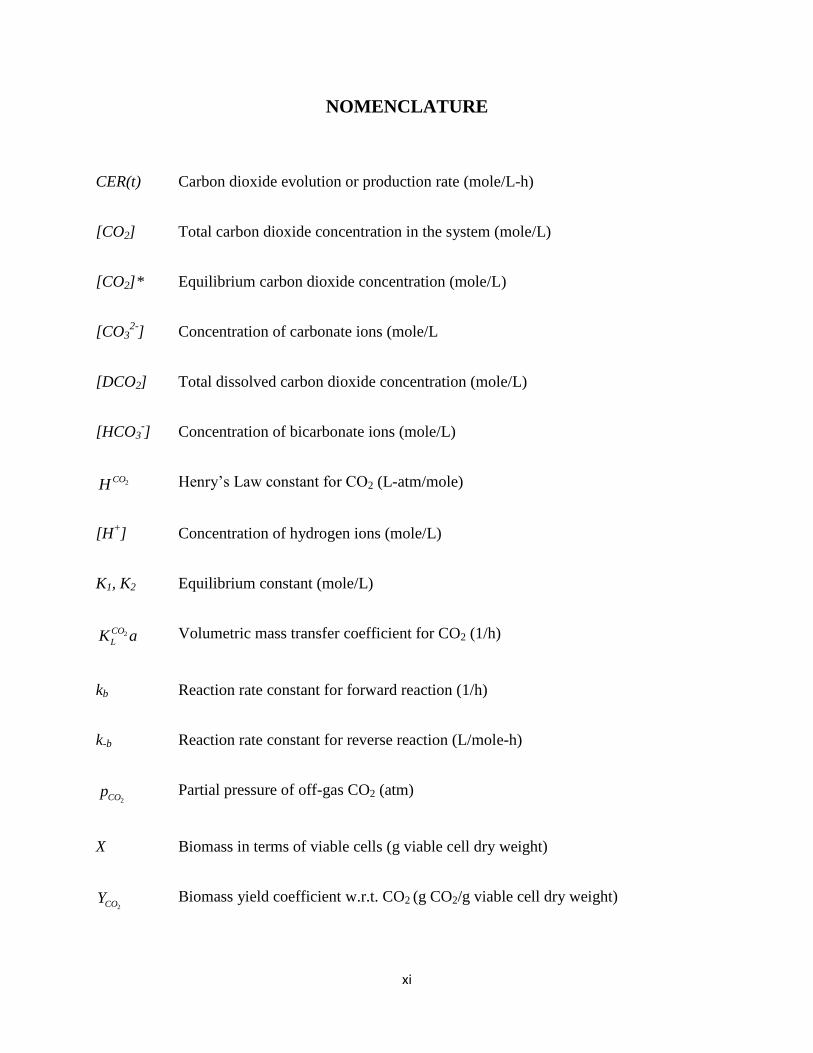
NOMENCLATURE
CER(t) Carbon dioxide evolution or production rate (mole/L-h)
[CO2] Total carbon dioxide concentration in the system (mole/L)
[CO2]* Equilibrium carbon dioxide concentration (mole/L)
[CO32-
] Concentration of carbonate ions (mole/L
[DCO2] Total dissolved carbon dioxide concentration (mole/L)
[HCO3-] Concentration of bicarbonate ions (mole/L)
2COH Henry’s Law constant for CO2 (L-atm/mole)
[H+] Concentration of hydrogen ions (mole/L)
K1, K2 Equilibrium constant (mole/L)
2CO
LK a Volumetric mass transfer coefficient for CO2 (1/h)
kb Reaction rate constant for forward reaction (1/h)
k-b Reaction rate constant for reverse reaction (L/mole-h)
2COp Partial pressure of off-gas CO2 (atm)
X Biomass in terms of viable cells (g viable cell dry weight)
2COY Biomass yield coefficient w.r.t. CO2 (g CO2/g viable cell dry weight)
xii
µ Specific growth rate of S. cerevisiae (1/h)
Maximum specific growth rate of S. cerevisiae (1/h)
1
CHAPTER 1
LITERATURE REVIEW
1.1 Introduction
Ethyl alcohol or ethanol, as it is commonly known, is a major alcohol in today’s energy
intensive economy. Ethanol is used as biodiesel and is increasingly being used as a substitute for
petroleum based fuels in blended forms. The current decline in fossil fuel production and
increase in their cost has made alternative fuels like bio-ethanol and bio-diesel more attractive.
The main source of ethanol for both food and energy industries are cereals and grains like corn
and maize that are fermented to produce ethanol. Currently, work on using cellulose to produce
ethanol through biochemical and physiochemical processes has gained more importance as an
alternative to food grains and cereals. The very essence of bio-ethanol production is the
conversion of monosaccharaides or sugars present in these sources to ethanol through oxidation.
While glucose is the most common monosaccharaide, sugars derived from cellulose also contain
pentose and xylose depending on the source of cellulose.
Saccharomyces cerevisiae, otherwise known as baker’s yeast in general, is the most
common species of yeast used in fermentation of glucose to ethanol. Ethanol obtained through
traditional fermentation processes, used for the production of edible alcohol, tend to be of very
low concentrations (10-12% v/v), thereby increasing downstream processing costs. The
requirement for high ethanol concentration to reduce downstream processing costs has been
satisfied by very-high-gravity (VHG) ethanol fermentation where typical feed sugar
concentrations used for ethanol production are over 250g/L. Apart from producing higher
2
ethanol concentrations and being an energy efficient process, VHG fermentation processes also
increase the annual ethanol productivity (Devantier et al., 2005; Feng et al., 2012; Ho and
Shanahan, 1986; Ingledew and Lin, 2011; Piddocke et al., 2009; Saerens et al., 2008; Wang et
al., 2007;). All these advantages accrue together to lower per batch operating costs given that
majority of current VHG fermentation processes are batch processes.
1.1.1 Very-High-Gravity Ethanol Fermentation
Very-high-gravity fermentation was extensively studied by Thomas et al., (1994) and
Devantier et al., (2005). In VHG ethanol fermentation the high glucose concentrations induce
additional osmotic stress on the yeast cells during the initial growth phase (lag phase), while the
very high final ethanol concentration inhibit yeast survival towards the end of the process leading
to loss of cell viability (Feng et al., 2012; Lin et al., 2010; Liu et al., 2011a, 2011b; Piddocke et
al., 2009). High inhibitory ethanol concentrations are observed only under VHG conditions due
to high feed glucose concentrations used in the process (Feng et al., 2012; Ingledew and Lin,
2011; Lin et al., 2010; Liu et al., 2011a, 2011b). Ethanol concentrations over 40 g/L exert
inhibition on yeast metabolism. Inhibition turns to toxicity when ethanol concentrations in the
fermentation broth exceed ~90 g/l (Feng et al, 2012; Lin et al., 2010). Inhibitory stresses
combined with loss of cell viability result in shifting of metabolic flux away from ethanol
production. These effects have been further elaborated in the following sections.
Ethanol being a primary metabolite is produced during the growth phases of yeast, viz.,
lag and exponential phases rather than the stationary phase where secondary metabolites are
typically produced. Thus, microbial growth is a requirement for ethanol production. Ethanol
production is not efficient in a completely anaerobic or aerobic environment. This necessitates
the availability of O2 for microbial growth and efficient ethanol production. This was
3
demonstrated by Lin et al. (2010) and Liu et al. (2011a, 2011b). They concluded that sparging air
through the fermentation broth during the course of fermentation improved yeast viability and
consequently ethanol production. Therefore it has been stressed that despite the advantages of
ethanol fermentation under VHG environments, inhibitions due to the lack of oxygen, high initial
glucose concentrations and high final ethanol concentrations need to be taken into consideration
while designing efficient fermentation processes in general for the production of bio-ethanol
(Hill, 2006; Ho and Shanahan, 1986; Jones and Greenfield, 1982; Kuhbeck et al., 2007;
Kuriyama et al., 1993;).
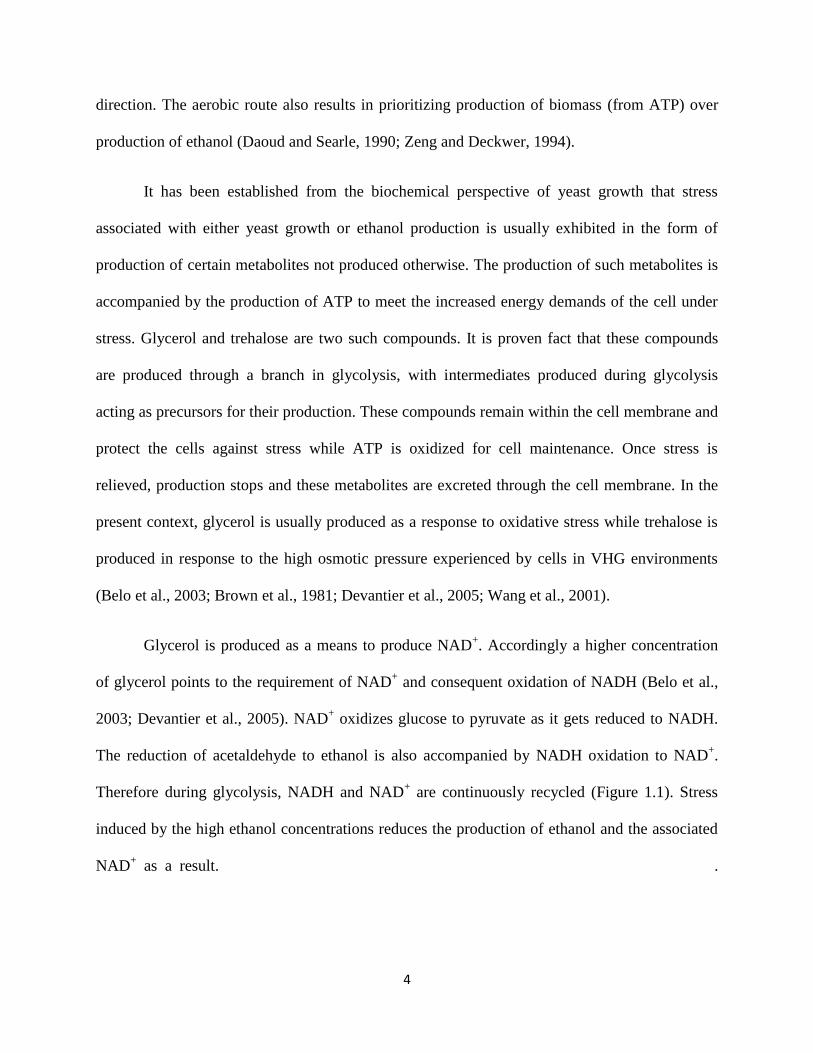
1.1.2 Glycolysis in Saccharomyces cerevisiae
The production of ethanol from glucose in S. cerevisiae follows the Glycolytic pathway.
Glycolysis culminates in two distinct metabolisms; aerobic and anaerobic. Figure 1.1 represents
a simplified representation of glycolysis in unicellular organisms. The acetaldehyde-ethanol
shuttle is a part of anaerobic metabolism and is preceded by the catalysis of Pyruvate to
Acetaldehyde and carbon dioxide (CO2). Hence, ethanol production is accompanied by the
simultaneous production of CO2, a by-product of glycolysis. The CO2 produced is known to
exert a certain degree of inhibitory pressure on growth and survival of microorganisms (Jones
and Greenfield, 1982; Lacoursiere et al., 1986; McIntyre and McNeil, 1997; McIntyre and
McNeil, 1998; Mostafa and Gu, 2003; Pattison et al., 2000; Saucedo-Castaneda and Trejo-
Hernandez, 1994).
Acetaldehyde is reduced to ethanol with concomitant oxidation of NADH to NAD+. In
the presence of oxygen, the aerobic route leads to the production of Acetyl-CoA (Ac-CoA) from
Pyruvate culminating in the Tricarboxylic Acid (TCA) cycle and production of ATP. Metabolites
like Acetic, Succinic and Pyruvic Acid are produced when metabolic flux is present in this
4
direction. The aerobic route also results in prioritizing production of biomass (from ATP) over
production of ethanol (Daoud and Searle, 1990; Zeng and Deckwer, 1994).
It has been established from the biochemical perspective of yeast growth that stress
associated with either yeast growth or ethanol production is usually exhibited in the form of
production of certain metabolites not produced otherwise. The production of such metabolites is
accompanied by the production of ATP to meet the increased energy demands of the cell under
stress. Glycerol and trehalose are two such compounds. It is proven fact that these compounds
are produced through a branch in glycolysis, with intermediates produced during glycolysis
acting as precursors for their production. These compounds remain within the cell membrane and
protect the cells against stress while ATP is oxidized for cell maintenance. Once stress is
relieved, production stops and these metabolites are excreted through the cell membrane. In the
present context, glycerol is usually produced as a response to oxidative stress while trehalose is
produced in response to the high osmotic pressure experienced by cells in VHG environments
(Belo et al., 2003; Brown et al., 1981; Devantier et al., 2005; Wang et al., 2001).
Glycerol is produced as a means to produce NAD+. Accordingly a higher concentration
of glycerol points to the requirement of NAD+ and consequent oxidation of NADH (Belo et al.,
2003; Devantier et al., 2005). NAD+ oxidizes glucose to pyruvate as it gets reduced to NADH.
The reduction of acetaldehyde to ethanol is also accompanied by NADH oxidation to NAD+.
Therefore during glycolysis, NADH and NAD+ are continuously recycled (Figure 1.1). Stress
induced by the high ethanol concentrations reduces the production of ethanol and the associated
NAD+ as a result. .
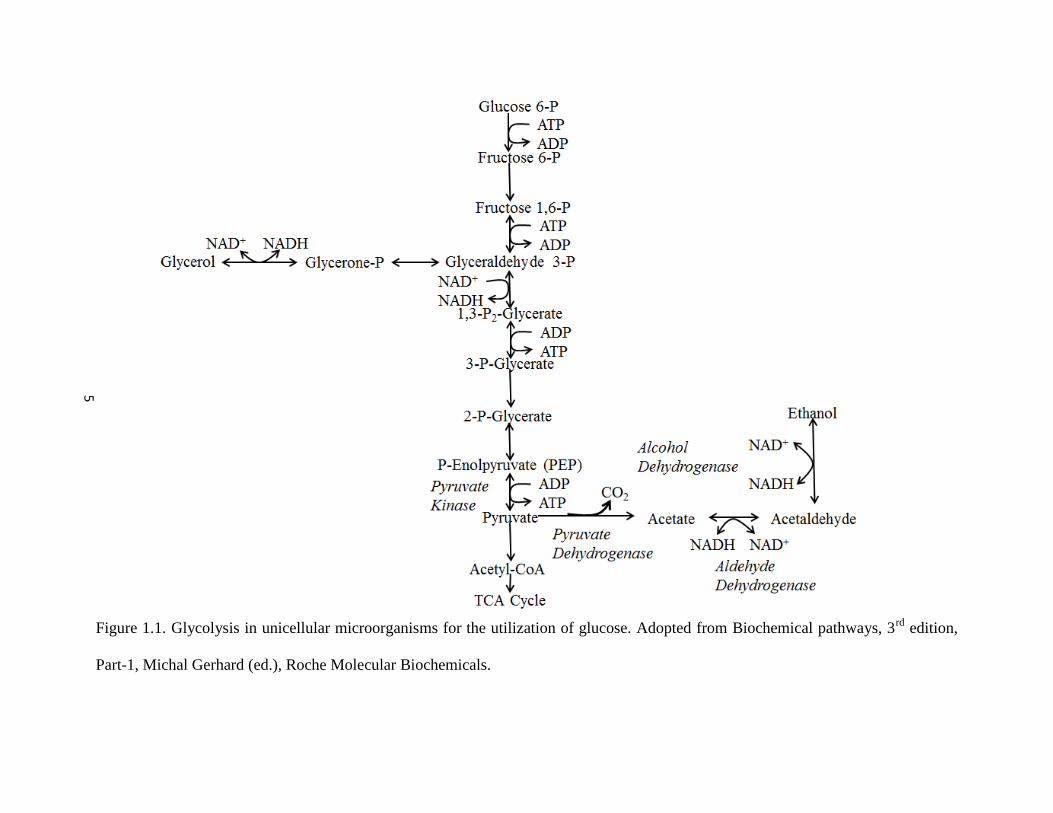
Figure 1.1. Glycolysis in unicellular microorganisms for the utilization of glucose. Adopted from Biochemical pathways, 3rd
edition,
Part-1, Michal Gerhard (ed.), Roche Molecular Biochemicals.
5
6
In order to compensate for the loss of production of NAD+, theoretically, metabolic flux shifts
from production of pyruvate to production of other metabolites that are accompanied by the
oxidation of NADH to NAD+. Generation of Glycerol from Glyceraldehyde-6-phosphate is one
such mechanism.
Glycerol is also known to play the role of a redox sink. Consequently, a higher
concentration of glycerol in the broth also points to the oxidative stress in the fermentation broth.
In VHG broths the very high sugar concentrations apart from resulting in higher osmotic
pressures on yeast also increase the viscosity of the medium. This reduces the O2 solubility and
as a result O2 concentration in the broth (Devantier et al., 2005; Gros et al., 1999; Ho and
Shanahan, 1986; Schumpe and Deckwer, 1979; Schumpe et al., 1982; Verbelen et al., 2009). On
the other hand, trehalose is produced to compensate for the higher osmotic stress witnessed
during the initial stages under VHG conditions. Osmosis affects the intercellular transport
characteristics of the cell membrane. Trehalose is known to act as an osmo-protectant and
maintain intercellular nutrient transport through the cell membrane under high osmotic pressures.
These metabolites although improve yeast survival under stress, are sources of drain of carbon
source from the intended product.
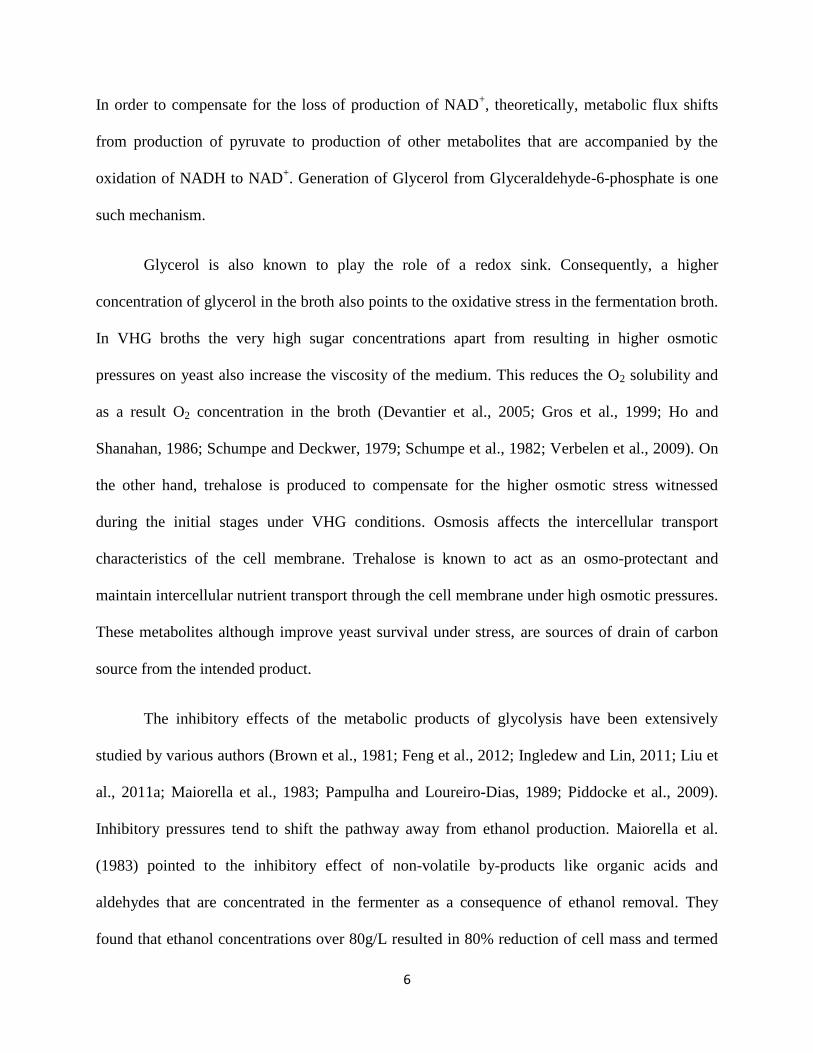
The inhibitory effects of the metabolic products of glycolysis have been extensively
studied by various authors (Brown et al., 1981; Feng et al., 2012; Ingledew and Lin, 2011; Liu et
al., 2011a; Maiorella et al., 1983; Pampulha and Loureiro-Dias, 1989; Piddocke et al., 2009).
Inhibitory pressures tend to shift the pathway away from ethanol production. Maiorella et al.
(1983) pointed to the inhibitory effect of non-volatile by-products like organic acids and
aldehydes that are concentrated in the fermenter as a consequence of ethanol removal. They
found that ethanol concentrations over 80g/L resulted in 80% reduction of cell mass and termed
7
it as the inhibitory concentration. The findings of later authors regarding inhibitions induced by
high feed glucose concentrations (Feng et al., 2012; Ingledew and Lin, 2011; Liu et al., 2011a)
agreed with that of Maiorella et al. (1983). Maiorella et al. (1983) also hypothesized from their
investigations that ethanol productivity (g ethanol/g cell) could be increased as a result of certain
type of inhibitions. Inhibitions that usually affect the membrane transport characteristics of the
cells were the focused upon for this study. Thus, the various forms of inhibition experienced
during the course of fermentation tend to reduce the efficiency of conversion of glucose to
ethanol in turn affecting fermentation performance.
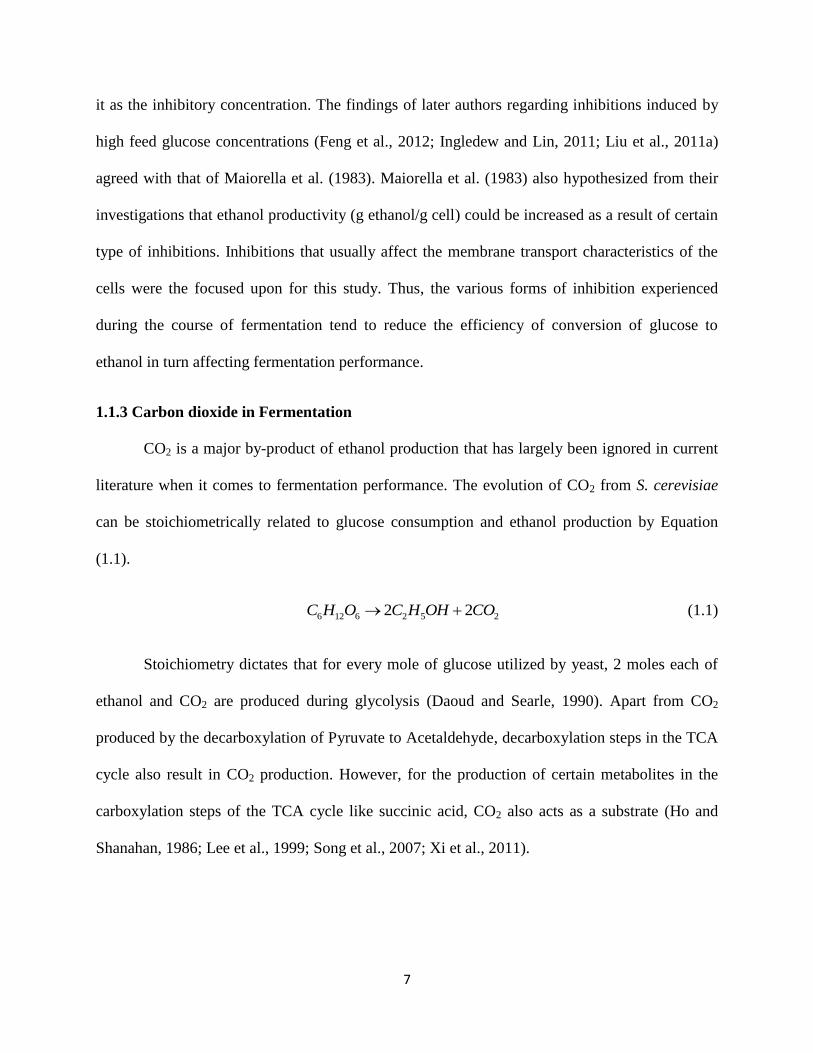
1.1.3 Carbon dioxide in Fermentation
CO2 is a major by-product of ethanol production that has largely been ignored in current
literature when it comes to fermentation performance. The evolution of CO2 from S. cerevisiae
can be stoichiometrically related to glucose consumption and ethanol production by Equation
(1.1).
6 12 6 2 5 22 2C H O C H OH CO (1.1)
Stoichiometry dictates that for every mole of glucose utilized by yeast, 2 moles each of
ethanol and CO2 are produced during glycolysis (Daoud and Searle, 1990). Apart from CO2
produced by the decarboxylation of Pyruvate to Acetaldehyde, decarboxylation steps in the TCA
cycle also result in CO2 production. However, for the production of certain metabolites in the
carboxylation steps of the TCA cycle like succinic acid, CO2 also acts as a substrate (Ho and
Shanahan, 1986; Lee et al., 1999; Song et al., 2007; Xi et al., 2011).
8
1.1.3.1 Fermentation Measurement using Carbon dioxide
Due to the stoichiometric relationship between glucose utilization, ethanol production,
and yeast growth, the CO2 evolved is a direct measure of yeast activity in the fermentation broth.
Hence, monitoring CO2 concentration should enable monitoring of the fermentation process in
an inexpensive manner (Chen et al., 2008; Dahod, 1993; Daoud and Searle, 1990; El Haloui et
al., 1988; Royce and Thornhill, 1991). Carbon dioxide has been widely used as a measure of
fermentation progress by several investigators (Golobic and Gjerkes, 1999; Manginot et al.,
1997; Montague et al., 1986; Saucedo-Castaneda and Trejo-Hernandez, 1994;Taherzadeh et al.,
1999).
Theoretical models have been proposed by El Haloui et al. (1988) to determine the
concentration of ethanol and glucose on-line during fermentation based on the volume of CO2
present in the off-gas stream of the fermenter. This model was found applicable even under VHG
environments when induced stresses were not taken into account. The only drawback of this
model was the use of off-gas CO2 measurements. Measurements based on off-gas CO2 tend to be
erroneous due to the dissolution of CO2 in the fermentation broth. Dahod, (1993) in his
investigations concurred that the dissolved CO2 concentration was always higher than the
equilibrium gas phase CO2 concentration. The variation between dissolved CO2 and the
corresponding equilibrium gas phase concentration increased with increase in air flow rates. This
variation and dependence were higher for broths of higher viscosity than for broths of lower
viscosity. The observation was extrapolated and concluded that dissolved and off-gas CO2 never
exist in equilibrium in fermentation systems except under near plug flow conditions (Ho and
Shanahan, 1986). Works of several authors (Montague et al., 1986; Pattison et al., 2000; Renger
et al., 1992) in the area of CO2 inhibition assumed near equilibrium conditions between off-gas
9
and dissolved CO2. However, a few earlier authors (Dixon and Kell, 1989; Ho and Shanahan,
1986; Jones and Greenfield, 1982; Royce and Thornhill, 1991; Royce P. N., 1992; Zosel et al.,
2011) recommended against assuming such equilibrium environments except under specific
conditions.
Typically the solubility of CO2 is about 10 times greater than that of oxygen in aqueous
media (Kawase et al., 1992; Schumpe and Deckwer, 1979; Schumpe et al., 1982). The protein
rich fermentation broths tend to further decrease CO2 desorption as a result of increased binding
of CO2 to the organic molecules on the cell membrane and in the broth. According to Kruger et
al. (1992), Kuriyama et al. (1993) and Kuhbeck et al. (2007) the presence of ethanol during VHG
fermentation also enhances CO2 solubility in the broth. Carbon dioxide is 4.5 times more soluble
in aqueous solutions containing ethanol (Isenschmid et al., 1995). The exact threshold of ethanol
concentration was not mentioned though. This has been argued in terms of decrease in pH with
increase in ethanol concentration as well. As described later in Section 1.1.3.2.1, lower pH favors
the presence of CO2 as dissolved CO2. Although dissolution of CO2 in the fermenter broth was
accounted for in the models of El Haloui et al. (1988) by the use of constants, most off-gas
measurements do not account for this discrepancy. Hence, monitoring fermentations through
measurement of dissolved CO2 concentration is much more relevant and reliable than those
based on the measurement of off-gas CO2.
1.1.3.2 Carbon dioxide Inhibition in Ethanol Fermentation
However despite its ability to represent fermentation progress, CO2 has been known to
have an inhibitory effect on microorganisms typically used in fermentations. Various studies
have been conducted on the effects of different parameters on fermentation processes using S.
Cervisiae like, pH (Dombek and Ingram, 1987), temperature (Saerens et al., 2008), pitching rate
10
(Verbelen et al., 2009), oxygen requirement (Bonnefond et al., 2002; Verbelen et al., 2009;) and
addition of certain flavor active solids (Kuhbeck et al., 2007). Although these apparently visible
inhibitions have so far been taken into consideration in industrial VHG ethanol fermentation, the
effect of CO2 produced during yeast metabolism has largely been neglected due to the fact that
this effect is not as conspicuous as other forms of inhibition (El-Sabbagh et al., 2006; Jones and
Greenfield, 1982; Kuriyama et al., 1993; Kruger et al., 1992; McIntyre and McNeil, 1997;
McIntyre and McNeil, 1998; Mostafa and Gu, 2003; Shimoda et al., 2001). Current literature
only takes into account inhibitory pressures experienced due to high glucose feeds and high final
ethanol concentrations but not inhibitions exerted by CO2 into consideration (Brown et al., 1981;
D'Amore and Stewart, 1987; Devantier et al., 2005; Feng et al., 2012; Liu et al., 2011a, 2011b;).
Primary work in the area of CO2 inhibition was pioneered by Jones and Greenfield
(1982). Works performed in the last 3 decades have been built upon this work as a basis. Jones
and Greenfield (1982) were of the opinion that CO2 not only played the role of an inhibitor in
fermentations using S. cerevisiae, but also a role in improving yeast survival under conditions of
stress in the fermentation broth. They put forward a theory that CO2 is involved in two different
roles in the metabolism of S. cerevisiae; one that of a product of decarboxylation reactions
(conversion of Pyruvate to Acetaldehyde) or that of a substrate in carboxylation reactions
(production of Succinic acid from Ac-CoA in the TCA cycle). They opined that presence of
excessive CO2 in the fermenter would result in growth inhibition while excessive stripping of
CO2 would also stymie yeast metabolism during fermentation. Before reviewing various effects
that CO2 has on microorganism growth and survival there is a need to look at different inhibition
mechanisms of CO2. These theories vary in two aspects. While one set of theories have been
11
proposed based on the influence of bicarbonate (3HCO ) ions, the other set of theories focus on
the effect of CO2 itself in its dissolved form otherwise known as dissolved CO2 or CO2 (aq.).
1.1.3.2.1 Carbon dioxide behavior in aqueous systems
All theories pertaining to inhibition of microbial activity by CO2 have been proposed on
the basis of the behavior of CO2 in aqueous environments. This description is necessary in order
to justify the use of CO2 measurements as measures of microbial activity (Dixon and Kell, 1989;
Royce, 1992; Yagi and Yoshida, 1977). CO2 in aqueous environments primarily can exist as
three different species viz., CO2 (aq.) or dissolved CO2, 3HCO ions and carbonate ions ( 2
3CO
).The pH of the aqueous system governs the equilibrium between the three species as described
by Equation (1.2-1.5). The existence of CO2 as either dissolved CO2, 3HCO or 2
3CO ions hence
depends on the fermentation media in the present case, irrespective of the organism used for
fermentation (Daoud and Searle, 1990; Frick and Junker, 1999; Golobic and Gjerkes, 1999;
Zosel et al., 2011). The general behavior of the three species was described through Figure 1 of
Zosel et al. (2011). According to Zosel et al. (2011) and Frick and Junker (1999), an increase in
dissolved CO2 is usually witnessed with a decrease in pH. Under pH of 4-6 that are prevalent in
ethanol fermentation systems, CO2 exists primarily as dissolved CO2 with very minor
concentrations of3HCO ions. The concentration of 2
3CO ions under this pH range is close to zero
and between a pH of 6 and 7, is less than 0.3% (Dixon and Kell, 1989; Frahm, et al., 2002; Zosel
et al., 2011).
2 2 3( ) CO aqueous H CO (1.2)
2 2 ( ) ( )CO gas phase CO aqueous (1.3)
12
7
2 2 3 1 5.35 10 mol/LCO H O H HCO K (1.4)
2 11
3 3 2 6.12 10 mol/LHCO H CO K (1.5)
Due to the instantaneous nature of conversion of dissolved CO2 to carbonic acid ( 2 3H CO
) the reactions illustrated by Equations (1.2) and (1.3) are combined and generally written as
Equation (1.4). Several investigators (Jones and Greenfield, 1982; Royce and Thornhill, 1991)
postulated that CO2 produced through the oxidation of glucose is released into the aqueous phase
as dissolved CO2 prior to being desorbed into the fermenter headspace. Based on this premise
other studies (McIntyre and McNeil, 1997, 1998; Royce and Thornhill, 1991; Royce P. N., 1992)
held the view that the effect of dissolved CO2 will be much more pronounced and observable
than that of off-gas CO2 in the fermenter headspace. Certain physiochemical aspects were also
discussed in this regard.
1.1.3.2.2 Mechanism of carbon dioxide inhibition
Carbon dioxide inhibition of microorganism growth can be classified into two distinct
categories; inhibition due to3HCO ions and inhibition due to dissolved CO2. Despite the fact
that two different species are involved, the underlying mechanism of inhibition remains the
same. Effects exerted by bicarbonate ions or dissolved CO2 molecules are at the extracellular as
well as intracellular level. While extracellular effects depend on the species, intracellular effects
do not.
Extracellular effects are localized to the cell membrane hence are generally termed as
membrane effects irrespective of the species causing it. These membrane effects result in a cell
membrane with altered properties. The change in membrane characteristics due to 3HCO ions
13
has been chiefly attributed to the change in dielectric properties of the membrane. The cell
membrane is predominantly made up of sterols, lipids and unsaturated fatty acids (UFA) that
contribute towards maintenance of cell integrity and rigidity. The effect of 3HCO ions has been
posited to be on the charged phospholipid head groups on the surface of the membrane.
However, details pertaining to the mechanism of this effect are absent. On the other hand
dissolved CO2 is absorbed into the cell membrane. The absorbed CO2 molecules react with the
sterols and UFA and change the order of the membrane which also modifies membrane fluidity.
Altered membrane properties affect transport characteristics across the membrane (Dixon and
Kell 1989).
In S. cerevisiae, E.coli, Aspergillus niger and other microbes the uptake of glucose during
glycolysis from the media is through an active transport mechanism (Galazzo and Bailey, 1990).
This transport is regulated by the intracellular Glucose-6-Phosphate concentration through a
feedback mechanism that controls the glucose uptake rate as well. The disruption of membrane
characteristics results in increased energy requirement for glucose uptake by these
microorganisms during metabolism. The increased energy demands of the cell for cell
maintenance are met by shift in metabolic flux from the production of NADH and NAD+ to
production of ATP and ADP. This essentially results in diversion of energy to cell maintenance.
The trickle-down effect of this phenomenon is an observed decrease in microbial metabolism
during fermentation in terms of growth as well as metabolite production. Thus, change in
membrane characteristics affects intercellular nutrient transport resulting in metabolic inhibition
(Dixon and Kell, 1989; Verduyn et al., 1990).
14
At the intracellular level both 3HCO ions as well as dissolved CO2 have the same effect
on cell metabolism. These effects are pinned upon the delicate intracellular pH balance.
Intracellular pH for microorganisms like S. cerevisiae is generally neutral at 7 (Devantier et al.,
2005; Dixon and Kell, 1989; Dombrek and Ingram, 1987; Galazzo and Bailey, 1990; McIntyre
and McNeil, 1997; Pampulha and Loureiro-Dias, 1989; Shimoda et al., 2001). The heavy influx
of either species transported into the cells through the cell membrane affects the intracellular pH
balance. Authors have extensively studied the intracellular effect of external pH on yeast
metabolism (Dombrek and Ingram, 1987; Pampulha and Loureiro-Dias, 1989). Pampulha and
Loureiro-Dias (1989) concluded that the regulation of internal pH of the cell is affected by
change in external pH of the fermentation media resulting in an intracellular condition non-
conducive for glycolysis. Galazzo and Bailey (1990) described the effect of unbalanced pH in
terms of enzyme activity during glycolysis. The conversion of Pyruvate to Ethanol is dependent
on the activity of pyruvate kinase, an enzyme whose allosteric constant decreases with increase
in intracellular pH. Allosteric constants usually represent the equilibrium constant between two
different forms of an allosteric protein/enzyme. The decrease in allosteric constant of pyruvate
kinase reduces the binding affinity of Phosphoenolpyruvate (PEP). PEP is an important
intermediate in the conversion of Pyruvate to Acetaldehyde. These changes in the cell
biochemistry due to disturbances in the balance between intracellular and extracellular pH results
in reduced ethanol production. In addition, more ATP is produced by the cell to offset pH
imbalances. Energy in cells in the form of ATP serves two purposes; cell growth/reproduction
and cell maintenance. ATP produced to offset the pH imbalance results in diversion of flux
towards cell maintenance rather than cell growth/reproduction (Daoud and Searle, 1990; Galazzo
and Bailey, 1990).
15
The influx of 3HCO ions tends to make the intracellular as well as extracellular
environment more alkaline (Verduyn et al., 1990). This upsets the above explained pH balance.
Consequently cessation of cell activity is witnessed resulting in cell death. The effect of
dissolved CO2 has also been proposed to be similar in nature to 3HCO
ion based inhibition.
Proponents of this theory (Dixon and Kell, 1989; El-Sabbagh et al., 2006; Jones and Greenfield,
1982; Royce, 1992; Shen et al., 2004; Shimoda et al., 2001) have suggested that dissolved CO2
absorbed into the cell results in intracellular bicarbonate imbalance. In this context Jones and
Greenfield (1982) and Dixon and Kell (1989) have advocated that intracellular and extracellular
pH regulate the ratio of dissolved CO2 to 3HCO ions both within and outside the cells. Increase
in pH as a result of dissolved CO2 absorption into the cells results in an increase of 3HCO ion
concentration within the cells.
Thus, theories proposed seem to agree on the fact that the CO2, whether in its native
dissolved form or as 3HCO ion, projects its effect on microorganisms on both intracellular as
well as extracellular fronts starting with its absorption into the cell membrane. In contrast,
literature also points out the importance of the presence of CO2 in the fermentation system as
dissolved CO2 to aid in the growth and survival of yeast cells by playing a role in the
construction of the cell membrane and facilitating transport through the membrane (in
carboxylation reactions) (Dixon and Kell, 1989; Jones and Greenfield, 1982).
1.1.3.2.3 Effects of carbon dioxide inhibition on microorganisms
A few authors who have studied CO2 inhibition in S.cerevisiae and other microorganisms
(Dixon and Kell, 1989; McIntyre and McNeil, 1997, 1998; Shang et al., 2003; Lacoursiere et al.,
1986) have determined CO2 based inhibition to have varied effects on different microorganisms.
16
These microbes come from a variety of genus and species like Aspergillus niger, Escherichia
coli, Penicillium chrysogenum and Ralstonia eutropha. Inhibition due to dissolved CO2 can be
classified into two different categories based on the source of CO2. The effects of CO2 are
evaluated by either supplying CO2 from an external source into the fermenter otherwise known
as exogenous CO2 or by measuring CO2 generated by the microorganism as a metabolic by-
product, otherwise known as autogenous CO2.
Studies conducted by Dixon and Kell (1989) on the effects of pressurized CO2 on
microbial growth have revealed that a CO2 partial pressure (2COp ) higher than 6 atm has a
negative effect on yeast growth. Other authors have also laid out similar claims with regards to
the relationship between CO2 partial pressure and CO2 based inhibition of growth in
microorganisms. Shimoda et al. (2001) studied inhibitory effects of CO2 as well as temperature
on S. cerevisiae and represented these effects in terms of decimal reduction time value or D-
value. The D-values were representative of the death kinetics of the cells. From these values they
were able to deduce that the D-values exponentially decreased with increasing CO2 partial
pressures. In addition, they were also able to validate previous claims alluding CO2 inhibition to
change in membrane fluidity by linking a similar phenomenon that was caused due to thermal
stresses. Renger et al. (1992) studied the impact of 2COp on fermentations using S. cerevisiae to
produce higher alcohols in brewery fermentations. They determined that increased CO2 partial
pressures reduced production of esters and fusel alcohols and attributed this reduction in
production to growth inhibition caused by CO2. Jones and Greenfield (1982) earlier cited that
2COp had to be in the range of at least 0.3-0.5 atm to have an inhibitory effect on the growth of S.
cerevisiae. Shen et al. (2004) measured off-gas autogenous CO2 in immobilized cell fermenters.
He concluded that CO2 in the fermentation apart from inhibiting growth also altered the
17
production of esters and higher alcohols, commonly known as flavor active volatiles, during the
preparation of alcoholic beverages using S. cerevisiae. His investigations also revealed the
relationship between CO2 concentration and production of flavor active volatiles by showing that
additional CO2 sparged into the fermenter further reduced production of flavor active volatiles in
the range of 15-18%. These findings were in agreement with a previous study in this area
conducted by Renger et al. (1992). Shen et al. (2004) also proposed the use of cells in
immobilized form to reduce CO2 inhibition by not only protecting the cells from exposure to
dissolved CO2 but also by reducing the concentration of CO2 in the fermentation broth through
gas stripping. He also alluded to the stripping of certain volatiles that might inhibit yeast growth
under higher concentrations due to gas sparging.
On the other hand Pattison et al. (2000) classified CO2 inhibition in the culture of
mammalian cells at two levels; acute and severe or prolonged. It was termed acute when the
observed inhibition was short lived but not strong enough to be irreversible and severe or
prolonged when the effect of inhibition was irreversible and carried over beyond the period of
exposure to CO2. The effects were investigated over a wide variety of partial pressures ranging
from 50 to 250 mm Hg. Their investigations also revealed that the observed inhibition was lower
and reversible when exposed to gradually increasing2COp . A sudden increase in partial pressures
from 50 to 250 mm Hg in contrast resulted in maximum and irreversible damage to the
mammalian cell culture.
Shang et al. (2003) evaluated the inhibitory effect of CO2 on growth in an aerobic fed-
batch culture of R. eutropha by measuring off-gas CO2. They proposed that operating lab scale
fermenters under very low gas flow rates (0.42vvm) would simulate conditions similar to large
scale fermenters where accumulation of CO2 is significant to be measured in the off-gas. It was
18
concluded that although CO2 pulse in the early exponential phase reduced cell growth rate to
one-third of the standard value, the lag phase was the most sensitive to CO2 inhibition. But,
while evaluating inhibition caused by autogenous CO2, this is not of concern as the quantity of
CO2 produced in the lag phase is relatively insignificant to that produced in the exponential
phase.
McIntyre and McNeil (1997, 1998) concluded from their study of A. niger and a few
filamentous fungi that dissolved CO2 effected a change in cell morphology along with growth
inhibition. A similar change in cell morphology was also observed in Z. mobilis and
Streptococcus mutants by Dixon and Kell (1989) due to dissolved CO2. Galazzo and Bailey
(1990) postulated that the effects of CO2 inhibition on yeast and ethanol production are
essentially separate and decoupled. They attributed this to feedback effects of products generated
post glycolysis. The conversion of Pyruvate to Acetaldehyde is governed by pyruvate
dehydrogenase. This conversion releases CO2 as a by-product. An increase in the concentration
of CO2 is known to affect pyruvate dehydrogenase activity consequently affecting acetaldehyde
production and alcohol dehydrogenase activity. According to Galazzo and Bailey (1990) this sort
of inhibition has a higher magnitude of effect on the conversion of pyruvate to Ac-CoA than on
the conversion of pyruvate to acetaldehyde. This was extrapolated to conclude that CO2
inhibition only affects yeast growth and not ethanol production during fermentation.
In contrast to these studies, Kuriyama et al. (1993) suggested that higher CO2
concentrations actually increase ethanol productivity per cell. To support the claim, they
suggested that higher CO2 concentrations decreased cell viability due to inhibition and this
resulted in higher ethanol produced per cell. The reduction in the number of cells also agrees
with the findings of Isenschmid et al. (1995). They observed that the presence of CO2 either in
19
the off-gas or aqueous phase reduced the number of larger cells. They argued that decrease in
cells larger than 5.6x10⁻¹¹
mL in volume could be a result of the solvent effect exerted by CO2
and could result in reduced fermentation rates. They also proposed a mechanism wherein stress
alters activity of certain key enzymes in glycolysis. They attributed this alteration under high
CO2 partial pressure to the shift in equilibrium during glycolysis. Since CO2 is a by-product of
the pyruvate-dehydrogenase system, higher CO2 concentration tends to shift equilibrium to the
pyruvate side thereby resulting in increased pyruvate production. This increase in pyruvate
translates to increased acetaldehyde production followed by ethanol. This effect is similar to
those proposed by Galazzo and Bailey (1990). Thus, support in literature exists for both theories;
the one where inhibitions and stress reduce growth as well as metabolite production and the other
where inhibitions limit growth but enhance metabolite production, effectively decoupling growth
and ethanol production.
1.1.4 Role of Oxygen in Ethanol Fermentation
Oxygen (O2) has been deemed as an important constituent in aerobic fermentation
processes. In certain cases of aerobic fermentation the depletion of O2 in the fermentation system
has been cited as reason for decreased biomass as well as product yield (Belo et al., 2003;
Ligthelm et al., 1988). The process of ethanol production through fermentation by S. cerevisiae
is essentially an anaerobic process while the generation of biomass during this process is O2
dependent. Metabolic flux in Figure 1.1 is directed elsewhere from pyruvate instead of the
production of acetaldehyde during biomass production (Zeng and Deckwer, 1994). Energy in the
form of ATP is required for cell growth. In this regard Daoud and Searle (1990) proposed two
separate equations, Equations (1.6) and (1.7), for anaerobic and aerobic fermentation of glucose
by S. cerevisiae respectively. According to these equations, aerobic oxidation of glucose releases
20
more energy in the form of ATP in comparison to anaerobic oxidation. The energy released in
the process is used for cell growth and maintenance.
6 12 6 2 5 22 2 2C H O C H OH CO ATP (1.6)
6 12 6 2 2 26 6 6 28C H O O CO H O ATP (1.7)
Investigators (Fornairon-Bonnefond et al., 2002; Verduyn et al., 1990) were of the
opinion that addition of O2 to the fermentation broth during sluggish fermentation reduces
fermentation time because of the effect of O2 on cell viability. In light of this fact it is worth
mentioning that cell viability is an important parameter to look for in ethanol fermentation
(Brown et al., 1981). Cell viability is highly dependent on the structural integrity and fluidity of
the cell membrane. Verbelen et al. (2009) stressed on the importance of the role of sterols and
UFA in maintaining membrane fluidity. The improvement in cell viability was attributed to the
increased structural integrity caused by the increased production of ergosterol and other sterols
that makes up the cell membrane in the presence of O2. The work of Verduyn et al. (1990)
bolster this fact by pointing towrads the inability of S. cerevisiae to grow anaerobically in the
absence of added sterols and UFA which are synthesized only in the presence of oxygen.
Verbelen et al. (2009) were also able to correlate the effect of oxygenation to cell density used in
high cell density (HCD) fermentations and conclude that optimized oxygenation during high-
gravity fermentation is necessary to achieve acceptable improvement in fermentation efficiency
and yeast cell viability.
On the other hand researchers have also pointed towards the existence of toxicity due to
excess oxygen in the system (Belo et al., 2003; Fornairon-Bonnefond et al., 2002;). Fornairon-
Bonnefond et al. (2002) hypothesized that excess O2 would result in increased membrane fluidity
21
due to oxidation of sterols and UFA that make up the cell membrane thereby increasing cell
susceptibility to inhibition by compounds like ethanol. This fact was pointed out by Belo et al.
(2003) and termed as hyperoxia. Hyperoxia was witnessed when S. cerevisiae was cultivated
under hyperbaric conditions of O2 partial pressure greater than 0.32 MPa. It was postulated that
hyperoxia damaged cells due to peroxidation of the cell membrane resulting in loss of metabolite
production. Membrane effects similar to those observed under CO2 inhibition were also reported.
In this respect it is worth mentioning that oxidative stress as a consequence of over oxidation can
be identified through measurement of intracellular glutathione concentration. Intracellular
glutathione is produced as opposed to glycerol due to oxidative stress brought about by
hyperoxia (Devantier et al., 2005).
1.1.5 Carbon dioxide Removal in Submerged Fermentations
Several authors (D'Amore and Stewart, 1987; Kuhbeck et al., 2007; Reddy and Reddy,
2005; Shen et al., 2004;) have shown that the addition of particulate materials improves
fermentation. While D'Amore and Stewart (1987) and Reddy and Reddy (2005) have argued it to
be due to the osmoprotectant nature of these particulates owing to their nutritional contribution to
cell maintanance, others like Kuhbeck et al. (2007) and Shen et al. (2004) have advocated the
positive effect in terms of physical phenomena occuring in the presence of the added
particulates. It has been postulated that addition of particulates provides higher nucleaton sites
for dissolved CO2 to form bubbles and desorp from the aqueous media. Kuhbecket al. (2007)
postulated that addition of particulate matter induces a bubbling effect that results not only in the
decrease of dissolved CO2 concentration due to CO2 desorption but also increases concentration
of cells in suspension. The increase of cells in suspension improves the surface area of contact
between the cells and the fermentation broth consequently improving cell metabolic rates and
22
metabolite production due to improved mass transfer rates. It was also advocated that the
additional nutrient effect offered by trub particulates could be a reason for improvement in
fermentation rate under HCD conditions. This gains significance because of the fact that VHG
fermentation broths are more viscous than traditional fermentation broths that generally contain
less than 12% (w/v) sugar. In terms of mass transfer required for desorption of CO2 from the
aqueous to the gas phase, higher viscocity reduces the mass transfer coefficient.
Increasing fermenter gas flow rates in aerobic fermentations has been suggested as one of
the methods of reducing dissolved CO2 cocentration (Frick and Junker, 1999; Shang et al., 2003).
Although Frick and Junker (1999) suggest that increase in air flow rates would improve CO2
stripping from the fermentation broth as a result of increase in mass transfer gradient, this
suggestion becomes moot in lab scale anaerobic processes due to low volume, low aeration rates
and small scale of the process. The importance of the scale of the process has been stressed by
various authors (Dahod, 1993; Frick and Junker, 1999; Ho and Shanahan, 1986; Mostafa and Gu,
2003;). Shang et al. (2003) have also proposed pumping inert gas into the fermenter to reduce
CO2 concentration within the fermenter to prevent inhibition. Since, maintaining a significant
and specific O2 partial pressure is not a requirement for VHG fermentation using S. cerevisiae,
either of these methods should not pose a considerable challenge. But, decrease in O2
concentration due to increase in inert gas partial pressure could result in lowering yeast growth
and hence fermentation rate.
1.1.6 Redox Potential based Control of Very-High-Gravity Fermentation
The combination of oxidation and reduction reactions mentioned earlier in Section 1.1.2,
otherwise known as redox reactions results in the medium being electron rich or electron
deficient. This addition or subtraction of charge results in a net potential difference in the
23
fermentation media (Lin et al., 2010). This potential, otherwise known as redox potential or
oxidation-reduction potential (ORP) is used as a measure of fermentation progress.
Redox potential profiles for VHG ethanol fermentation under different glucose
concentrations were reported by Lin et al. (2010). Lin et al. (2010) reported that the different
regions depicted for the ORP profile correspond to different levels of yeast activity (Fig. 1 of Lin
et al., 2010). The decreasing region or Region I corresponded to lag and exponential phases
where reducing power outweighs the oxidizing power indicating increase in yeast activity.
Metabolic activity is at its highest in the middle of the exponential phase. Increased activity is
usually accompanied by net NADH production and hence increased presence of electrons in the
system. This is observed as a steeply decreasing ORP. The flatness of Region II was attributed to
the balance between oxidzing and reducing powers in the system owing to the air supplied to the
fermentation broth as a consequence of ORP control. This balance is due to the oxidizing nature
of oxygen in air that acts as an electron acceptor. Towards the end, equilibrium shifts towards a
highly oxidizing environment as a result of ethanol toxification, substrate exhaustion and the
resulting reduction in metabolic activity. An increase in ORP is usually a sign of reducing
concentration of electrons in the system. Hence, the increasing ORP values in Regions III and IV
represent the late stationary and death phases. This is the case when yeast activity decreases
accompanied by the consumption of NADH.
Redox potential has been used in several instances as a measure of fermentation progress
in VHG ethanol fermentations. Feng et al. (2012) is a classic example of such work. Redox
potential here was used to determine the point at which fresh feed was to be delivered for a fed-
batch ethanol fermentation process. But, the inability to completely consume glucose in the case
of 250g/L feed glucose concentration resulted in the failure of this process being used for
24
glucose concentrations higher than 200g/L. One of the interesting conclusions obtained through
this study was the ability of yeast to adapt to ethanol concentrations higher than 85g/L resulting
in cell viabilities over 90% even towards the end of a given cycle when substrate concentrations
were close to zero.
Liu et al. (2011a, 2011b) utilized ORP as a control measure to improve fermentation
efficiencies in VHG environments. They hypothesized ORP could be controlled by sparging air
into the fermentation broth. The basis behind their hypothesis was that ORP being a measure of
the number of electrons/protons in the system, the oxygen supplied into the fermenter would act
as an electron acceptor and maintain the balance of electrons between source and sink. A higher
ORP indicated an abundant supply of electron acceptors while a lower ORP indicated a dearth in
electron acceptors to compensate for the electrons released into the system by yeast.
Controlled fermentations were carried out in batch and continuous modes to assess their
efficacies. It was concluded that maintaining ORP at specific levels (-50, -100 and -150mV) had
different effects on the ethanol productivity of the process. While it was easy to maintain control
for a longer period at -50mV, the duration of control reduced with decrease in the ORP values.
The results also pointed to increased ethanol production at -150mV level when compared to -
50mV for four different feed glucose concentrations (150, 200, 250 and 300g/L). Although, these
results were promising, the major flaw with the control methodology utilizing ORP was the
nature of the measurement made. Redox potential being a measure of electron activity is relative
in nature. A relative measure changes with each process run depending on the initial conditions
of the process. Thus, this stresses for a need for a novel control technique based on absolute
measurements like dissolved CO2 concentration.
25
1.2 Knowledge Gaps
A priori observations and fermentation process designs have taken into account only the
inhibitory effects of external parameters like the presence of O2 (aerobic/anaerobic), pH and
temperature on the efficacy of the process. Although, inhibitions due to ethanol and glucose
concentrations were considered, they did not account for the inhibitory effect of metabolic CO2
that is present as dissolved CO2. Moreover, only relations modeled on off-gas measurements
exist to relate CO2 evolution to the growth and activity of microorganisms. These relations do
not take into account either inhibitions caused by high concentrations of ethanol and glucose in
the fermentation system or the absence of equilibrium between off-gas and dissolved CO2 in lab
scale fermenters. Although authors have tried to establish various relations between off-gas and
dissolved CO2, the applicability of these relations to anaerobic fermentations has been severely
restricted and in some cases impossible.
With earlier literature showing the use of CO2 evolution rate in the off-gas stream to
determine microbial activity, the ability of dissolved CO2 to do the same has not been shown.
However, works focused on a novel device for measuring dissolved CO2 have been published
(Kocmur et al., 1999; Shoda and Ishikawa, 1981; Sipior et al., 1996). The relations established so
far between CO2 evolution, glucose consumption and ethanol production no longer seem to be
applicable for VHG environments. Moreover the focus of these investigations being CO2 in the
off-gas streams, their utility is rendered moot due to the absence of any measurement during the
initial hours (0-12h) of fermentation (Daoud and Searle, 1990; Golobic and Gjerkes, 1999)
owing to supersaturation of the fermentation broth with CO2. Despite this drawback authors have
persisted in their measurement of off-gas CO2 to evaluate microbial growth, metabolite
production and fermentation progress.
26
In addition to these drawbacks there is an utter lack of alternative control methodologies
for VHG fermentations for bio-ethanol production. The use of ORP, a relativistic measure,
although unconventional might result in non-optimized and reduced ethanol production.
Determining the relationship between glucose concentration, cell growth and CO2 evolution
could help in designing new processes and process control schemes for complete utilization of
glucose in VHG fermentations. Moreover the new control methodology could help in alleviating
dissolved CO2 based inhibitions in VHG fermentations and improve fermentation performance.
1.3 Objectives
Based on the knowledge gaps identified above the objectives established for the current
investigation are listed below. The current investigation proposes to
i. Observe dissolved CO2 and metabolite concentration profiles for batch fermentations
using S. cerevisiae under different glucose concentrations.
ii. Assess and develop a semi-empirical relationship between dissolved CO2 concentration,
CO2 evolution and other physiochemical and biological fermentation parameters like
glucose consumption and ethanol production to yeast growth.
iii. Develop a novel and alternative control strategy based on dissolved CO2 measurement.
iv. Explore the ability of the developed control strategy to improve ethanol production and
fermentation performance under VHG conditions.
1.4 Approach
To observe the dissolved CO2 concentration profiles during VHG fermentation, a
commercial dissolved CO2 sensor was used in batch fermentations under various glucose
concentrations. Distinctions between high gravity and very-high-gravity fermentations were
27
created by using four different glucose concentrations; two concentrations each for high (150 and
200 g/L and very-high-gravity (250 and 300 g/L) conditions.
Development of the semi-empirical relationship was achieved through the application of
basic mass balance principles. The physical significance of the terms in the equation was
reiterated through various physiochemical and biochemical processes occurring in the
fermentation system and a comprehensive analysis of the characteristics of the dissolved CO2
concentration profiles obtained through direct measurement during fermentation.
Control of dissolved CO2 was achieved through a series of experiments designed with
different CO2 set points (SP) and different control strategies. Two primary control strategies
were explored during the course of this investigation; one involving the use of calcium
hydroxide, an inorganic particulate compound and the other using air sparged through the
fermentation broth. Due to the inability of calcium hydroxide to sustain cell viabilities at
acceptable levels, only dissolved CO2 control with air was explored further through utilization of
two different aeration rates.
The quantity of air supplied along with the final ethanol concentration, glucose
conversion efficiency and ethanol productivity were used to evaluate the effectiveness of this
novel control strategy and elucidate the advantages and disadvantages of using such control in
batch fermentations to efficiently produce high concentrations of ethanol.
28
CHAPTER 2
EXPERIMENTAL MATERIALS AND METHODS
2.1 Strain and Growth Media
Ethanol RedTM
strain of Saccharomyces cerevisiae obtained as dry yeast from Lesaffre
Yeast Corp. (Milwaukee, MI, USA) was used during the course of this investigation. Prior to
utilizing them batch fermentations, the dry yeast was rehydrated with 50 mL sterilized water, and
cultured in YPD agar (10 g/L yeast extract, 10 g/L peptone, 20 g/L dextrose, and 20 g/L agar).
Two sub-culture steps were performed to purify yeast strains and were stored in YPD agar
coated petri dishes at 4 °C for later use.
The fermentation media was divided into three portions; part A: the required glucose
concentration in 600 mL of reverse osmosis (RO) water; part B: 1% (w/v) of yeast extract, 0.2%
(v/v) of MgSO4 and 1% (v/v) of Urea in 100 mL of RO water; part C: 0.1% (w/v) of L-(+)-
Sodium Glutamate Monohydrate, 0.5% (v/v) of KH2PO4, 0.1% (v/v) of (NH4)2SO4 and 0.1%
(v/v) each of H3BO3, Na2MoO4, MnSO4·H2O, CuSO4, KI, FeCl3·6H2O, CaCl2·2H2O and
ZnSO4·7H2O in 100 mL of RO water. The concentration of each stock solution used in the media
is given in Table 2.1. These portions were steam sterilized at 121 °C for 15 min as such and
mixed aseptically in the fermenter/bioreactor after they cooled down to room temperature prior
to fermentation. The fermentation media was made-up to the working volume by adding
sterilized RO water to the mixture. Yeast extract was obtained from HiMedia Laboratories
(Mumbai, India). All other chemicals were of reagent grade or higher purity.
29
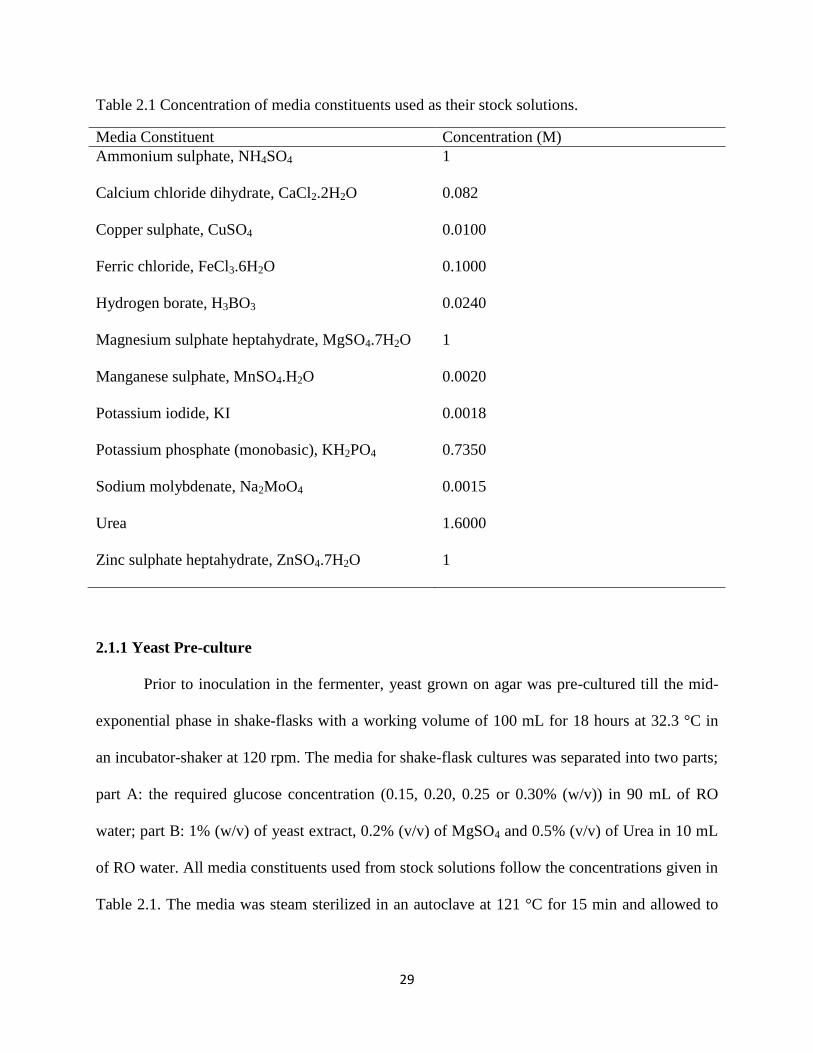
Table 2.1 Concentration of media constituents used as their stock solutions.
Media Constituent Concentration (M)
Ammonium sulphate, NH4SO4 1
Calcium chloride dihydrate, CaCl2.2H2O 0.082
Copper sulphate, CuSO4 0.0100
Ferric chloride, FeCl3.6H2O 0.1000
Hydrogen borate, H3BO3 0.0240
Magnesium sulphate heptahydrate, MgSO4.7H2O 1
Manganese sulphate, MnSO4.H2O 0.0020
Potassium iodide, KI 0.0018
Potassium phosphate (monobasic), KH2PO4 0.7350
Sodium molybdenate, Na2MoO4 0.0015
Urea 1.6000
Zinc sulphate heptahydrate, ZnSO4.7H2O 1
2.1.1 Yeast Pre-culture
Prior to inoculation in the fermenter, yeast grown on agar was pre-cultured till the mid-
exponential phase in shake-flasks with a working volume of 100 mL for 18 hours at 32.3 °C in
an incubator-shaker at 120 rpm. The media for shake-flask cultures was separated into two parts;
part A: the required glucose concentration (0.15, 0.20, 0.25 or 0.30% (w/v)) in 90 mL of RO
water; part B: 1% (w/v) of yeast extract, 0.2% (v/v) of MgSO4 and 0.5% (v/v) of Urea in 10 mL
of RO water. All media constituents used from stock solutions follow the concentrations given in
Table 2.1. The media was steam sterilized in an autoclave at 121 °C for 15 min and allowed to
30
cool down to room temperature prior to mixing. Yeast inoculation from agar plates was done
aseptically after mixing.
2.2 Batch Fermentation
2.2.1 Experimental Set up
Production and concentrations of ethanol and CO2 by S. cerevisiae from glucose
substrates under VHG conditions was investigated using a batch fermentation process. The
fermentation apparatus used in the work were jar fermenters (Model: Omni Culture, New York,
NY, USA) with a capacity of 2 L and a 1 L working volume (Figure 2.1). The fermenter was
covered with a detachable stainless steel (SS) lid screwed to the top of the jar to maintain sterility
during the process. The cover was equipped with ports accessible for measuring temperature,
agitation speed, dissolved CO2 concentration and redox potential. Agitation was achieved
through a six-bladed impeller mounted to the agitator shaft that was fixed to the SS cover.
2.2.2 Measurement of Dissolved Carbon dioxide and Redox Potential
Measurement of dissolved CO2 was done using a commercial autoclavable dissolved CO2
sensor (InPro®5000, Mettler-Toledo, Bedford, MA, USA). The measurement was done using an
M400 controller (Mettler-Toledo, Bedford, MA, USA) and acquired using LabView (Version
8.5, National Instrument, Austin, TX, USA). The calibration of the sensor was performed using
1-point and 2-point procedures provided by the manufacturer using pH buffers of 7.0 and 9.21 at
25 °C. It is to be noted that the measurement of dissolved CO2 by the InPro®5000 is based on the
Severinghaus potentiometric principle (Janata, 2009; Kocmur et al., 1999), which has been
previously used to develop and build custom dissolved CO2 sensors (Ho and Shanahan, 1986;
Shoda and Ishikawa, 1981; Zosel et al., 2011;) .
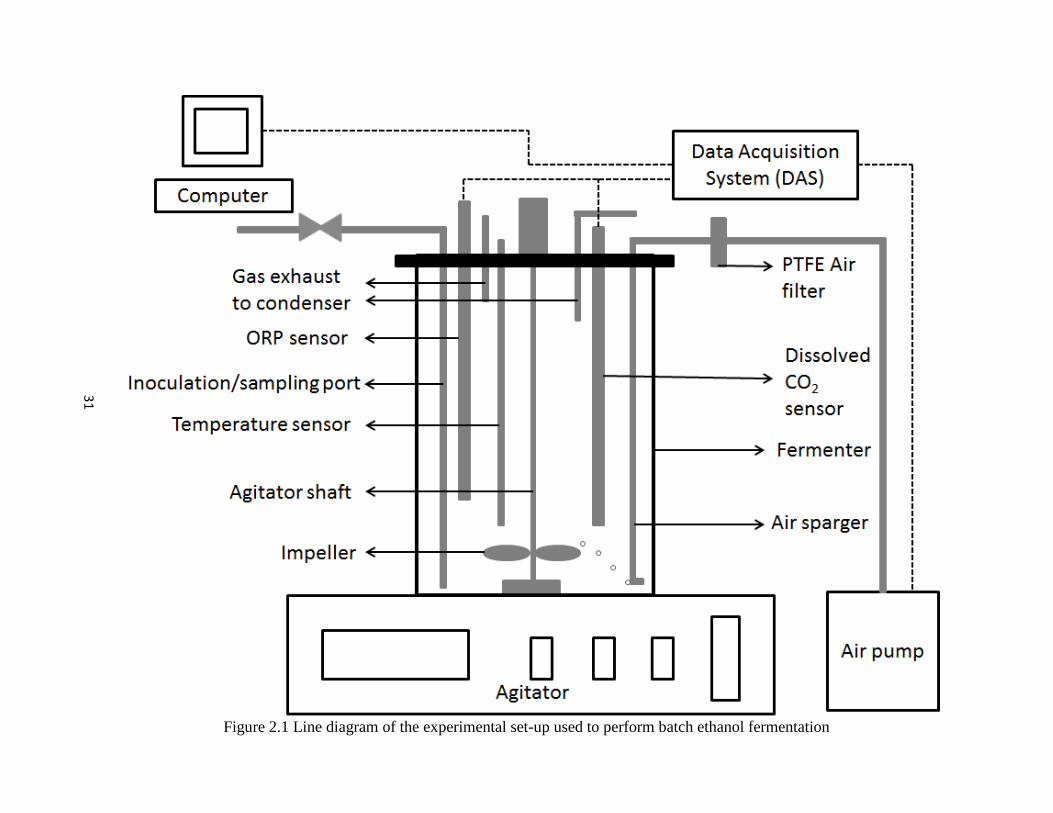
Figure 2.1 Line diagram of the experimental set-up used to perform batch ethanol fermentation
31
32
Autoclavable ORP electrodes from Cole-Parmer Inc. (12 mm x 250 mm, Vernon Hills, IL, USA)
were used to measure ORP values during batch fermentations. All measurements made through
different sensors were acquired using a custom built data acquisition system (DAS) and
LabView.
2.2.3 Control of Dissolved Carbon dioxide Concentration
Dissolved CO2 concentrations during fermentations were controlled using two different
techniques. Control was achieved by either using a mixture of calcium hydroxide (Ca(OH)2) and
fermentation media or air. Dissolved CO2 control set points were set based on the maximum
solubility of CO2 in aqueous fermentation media. The maximum solubility of CO2 in
fermentation media is in the range of 1.5-1.8 g/L (Spinnler et al., 1987). The solubility of CO2 is
influenced by the presence of organic and inorganic salts in the fermentation media (Royce and
Thornhill, 1991; Royce P. N., 1992). Based on this premise three different dissolved CO2 control
set points were chosen for glucose feeds of ca. 250 g/L while two different set points were
chosen for glucose feeds of ca. 300 g/L. Control of dissolved CO2 was achieved using a PID
control algorithm implemented through a LabView VI (Version 8.5, National Instrument, Austin,
TX, USA).
2.2.3.1 Carbon dioxide Control using Calcium hydroxide
Calcium hydroxide is a well-known absorbent for CO2 and is being investigated as a
primary sink for CO2 in sequestration studies (Rendek et al., 2006). The ability of Ca(OH)2 to
store CO2 is enhanced by its ability to store it in solid form as calcium carbonate (CaCO3). The
conversion of Ca(OH)2 to CaCO3 follows Equation 2.1
2 2 3 2( )Ca OH CO CaCO H O
(2.1)
33
Calcium carbonate is an inert solid as far as ethanol fermentation is concerned. Calcium
carbonate does not ionize and hence has negligible to no effect on yeast growth and survival and
hence ethanol production. Moreover, the removal of the CaCO3 formed as a result of CO2
absorption can be achieved through simple decantation of the spent fermentation broth. This is
possible since CaCO3 is insoluble in aqueous media.
The ability of calcium hydroxide to absorb CO2 is based on the dissociation of calcium
hydroxide to calcium (Ca2+
) and hydroxide (OH-) ions in aqueous solution (Equation 2.2). The
dissociation of Ca(OH)2 is highly favored as indicated by the very high value of its dissociation
constant (pKa = 13). The mechanism for the absorption of CO2 is illustrated in Equations (2.3).
The bicarbonate ion is derived through equilibrium reactions described earlier in Equations (1.4-
1.5). Although fermentation pH does not support high concentrations of CO2 in the form of
3HCO ions, the increase in pH brought about by the addition of calcium hydroxide would shift
the equilibrium towards the conversion of CO2 (aq.) to 3HCO as per Equations (1.4-1.5). In
order to counteract the effect of dilution brought about by addition of an aqueous solution to the
fermentation media, the Ca(OH)2 suspension was mixed with fresh glucose feed with final feed
glucose and Ca(OH)2 concentrations of 250 g/L and 20 g/L respectively.
2
2( ) 2Ca OH Ca OH (2.2)
2
3 3Ca HCO CaCO H
(2.3)
For the purpose of controlling dissolved CO2 concentration in the broth the fermenter was
made accessible to three peristallic pump heads (Model 7013-20 and Model 7014-20, Cole-
Parmer Canada Inc., QC, Canada). The smaller head was connected to the nutrient and control
34
solution reservoir, while the bigger head was used to discharge spent fermentation broth from the
fermenter. The working volume was kept constant by maintaining the harvesting tube at a fixed
position. Level maintenance was achieved through simultaneous addition of nutrient and control
solution and removal of spent broth to and from the fermenter respectively through the PID
controller.
2.2.3.2 Carbon dioxide Control using Air
Based on the acquired dissolved CO2 concentration signal, the PID controller was used to
actuate an air pump. Air from the pump was passed through a polytetrafluoroethylene (PTFE)
membrane filter (PN 4251, Pall Corporation, Ann Arbor, MI, USA) prior to being bubbled
through the broth by a sparger. As mentioned earlier in Section 1.1.4, air was selected based on
is ability to not only remove dissolved CO2 but also supply O2 to the broth.
2.2.4 Fermentation Conditions
The fermentation of glucose to ethanol was carried out aseptically in the steam sterilized
fermenter at a working volume of 1 L. The variation in initial glucose concentrations among
experiments in the absence as well as presence of control was expressed in terms of standard
deviation values between the different initial glucose concentrations. It is to be noted that
experiments were performed in triplicate for batches without control and in duplicate for batches
under dissolved CO2 control. The media in the fermenter was inoculated with yeast from the pre-
culture flask at 5 % of the working volume, and the pitching rate was adjusted to ca. 107 viable
yeast cells per mL for all experiments. The temperature of the broth was maintained at 33 °C by
circulating water at 33 °C through the equipped heating/cooling coil of the fermenter. The
agitation speed was maintained at 150 rpm for the duration of fermentation. Samples for
analytical analysis were withdrawn as 5-mL fermentation broth aliquots every 4-6 hours.
35
2.2.5 Analytical Analysis
The withdrawn aliquots were analyzed for biomass and cell viability. The biomass was
estimated semi-empirically in terms of optical density (OD) measurements made using a
colorimeter (KlettTM
Colorimeter, Belart, NJ, USA) at 600nm. The OD values were calibrated
for different values against cell dry weight (CDW) of yeast in order to obtain biomass
concentrations for different OD values. Cell viabilities were estimated using the methylene violet
staining technique (Smart et al., 1999). In this technique yeast cells were stained with methylene
violet stain and observed and counted under a microscope on a hemacytometer (Hausser
Scientific, Horsham, PA, USA).
2.2.5.1 Analysis of Carbohydrates and Organic Acids
2 mL of the aliquots were centrifuged at 10,000 rpm for 10 minutes and the
concentrations of sugars and organic acids in the culture supernatants were analyzed by HPLC
(Series 1100, Agilent Technologies, Mississauga, ON) equipped with a refractive index (RI)
detector ( HP 1047A, Hewlett Packard, Mississauga, ON). The metabolites were separated using
an ion exclusion ION-300 column (Transgenomic, Inc., Omaha, NE, USA) with 8.5 mM H2SO4
at 0.4 mL/min as mobile phase. The column temperature was maintained at 65 °C and the RI
detector temperature was maintained at 35 °C during the course of analysis. Each sample was
injected into the column three times as 10 µL injections each and subject to analysis.
2.3 Determination of Ethanol Toxic Concentrations
Toxic ethanol concentration limits were determined with the help of shake-flask
experiments. Shake-flasks with media composition same as that described in Section 2.1.1 were
used for this purpose. In addition to the growth medium, ethanol in concentrations varying from
4 % (v/v) through 12 % (v/v) in 2 % increments were added to the shake-flasks. The flasks were
36
inoculated with yeast and cultured at 32.8 °C at 120 rpm for 24 hours. Measurements of biomass,
cell viability and analysis of carbohydrates, organic acids and ethanol were made every two
hours during this culture period. Procedures for same have been described earlier in Section 2.2.
The biomass and ethanol concentrations were smoothed by a three-parameter logistic growth
model as described in Section 2 of Liu et al. (2011a). A plot of biomass production rate (first-
order derivative of biomass concentration against time) vs. ethanol concentration was created.
The ethanol concentration corresponding to where the biomass production rate approaches to
zero was considered to be the ethanol toxic concentration. This toxic ethanol concentration limit
was determined to be 85 g/L.
37
CHAPTER 3
RESULTS AND DISCUSSIONS
The observed dissolved CO2 concentration profiles in the presence and absence of control
for four different glucose concentrations of 150, 200.05±0.21, 250.32±0.12, and 300.24±0.28 g/L
are discussed here. While feeds of ~150 and ~200 g glucose/L represent high-gravity
fermentations, very-high-gravity fermentations are represented by feeds of ~250 and ~300 g
glucose/L. These profiles are representative of the absolute concentration of CO2 present in the
form of dissolved CO2. Section 3.1 deals with batch fermentations in the absence of any form of
control. A theoretical equation based on these observations and relating yeast activity with
dissolved CO2 concentration has also been developed in Section 3.1. The observed dissolved
CO2 profiles have been interpreted in terms of this mathematical relationship. Sections 3.2
discusses results obtained in the presence of a dissolved CO2 based control methodology in detail
and contrasts them with those observed in the absence of control in terms of fermentation rate,
performance and efficiency of conversion of glucose to ethanol. A short comparison of the
dissolved CO2 profiles observed under control with the ORP profiles observed in an earlier work
(Lin et al., 2010) is also presented in Section 3.3.
3.1 Dissolved Carbon dioxide Concentration and Yeast Growth
To render a theoretical aspect to the measured dissolved CO2 concentrations and establish
a theoretical relationship in terms of physiochemical and biological processes that occur in the
fermentation broth, a mass balance equation based on dissolved CO2 was developed. This mass
balance is shown in Equation (3.1). The left hand side (LHS) of Equation (3.1) relates the
accumulation of CO2 as dissolved CO2 in the fermentation broth as a result of the deficit between
38
generation and removal of dissolved CO2 from the fermentation broth owing to the solubility of
CO2 represented on the right hand side (RHS) of Equation (3.1).
2
2
2 -
3 2
CO desorption rate Rate of accumulation Rate of conversion CO evolution rate
of CO in aqueous by physiochemicalby yeast of HCO from CO
processphase
(3.1)
The first term on the RHS of Equation (3.1) refers to the rate of generation or production
of CO2, otherwise known as CO2 evolution rate (CER(t)), by yeast as a result of metabolic
activity. Metabolic activity being a function of yeast growth can be represented in terms of yeast
specific growth rate and instantaneous biomass concentration (Equation 3.2). A constant is used
to represent the quantity of CO2 generated per unit concentration of biomass. Thus, CER(t) is
related to yeast growth with the assumption that µ is representable of and 2COY is regarded as
constant over the period of fermentation.
2( ) COCER t XY
(3.2)
During VHG batch ethanol fermentation S. cerevisiae follows four distinct growth phases
viz. lag, exponential, stationary and death phase (Lin et al., 2010; Liu et al., 2011a). While an
increase in viable biomass is usually witnessed from the lag to the exponential phase, it remains
nearly constant during the stationary phase and decreases abruptly in the death phase.
Consequently, CER(t) being a function of viable biomass and CO2 being a metabolic by-product,
the value of CER(t) increases with the viable cell concentration during the lag and exponential
phases and begins decreasing during the stationary phase. As viable cell concentrations drop
during the death phase, so does the associated CER(t) in Equation (3.2) due to the decline in X.
This decrease in CO2 evolution can be attributed to the slowing down of yeast metabolism in the
39
stationary phase and the absence of it in the death phase. Thus Equation (3.2) relates CO2
produced during fermentation to yeast activity in the fermenter. In addition, this equation can
also be utilized to relate ethanol production to yeast activity during fermentation. Ethanol being a
primary metabolite is produced only in the presence of active growth. Hence, a decrease in
CER(t) not only indicates a reduction in viable cells, but also points to reduction in ethanol
production during fermentation.
To mathematically express the conversion of dissolved CO2 to 3HCO ions as a result of
pH fluctuations affecting the equilibrium between the different forms of existence of CO2 in
aqueous media, Equations (1.4-1.5) are considered. Based on these equations, the term
corresponding to the third term on the RHS of Equation (3.1) was derived in Appendix. The
derived term is given in Equation (3.3).
3 12 3
1
([ ]) [ ][ ] [ ]
[ ]
bd HCO k H KCO HCO
dt K H
(3.3)
Equation (3.3) considers CO2 present only in the form of 3HCO ion and not as 2
3CO ion due to
the pH of the system. Under pH of 4-6 witnessed in the present case, it was reported that less
than 0.3% of CO2 exists as 2
3CO , about 3% exists as 3HCO and the rest exists as dissolved CO2.
Carbon dioxide present as dissolved CO2 over and above the equilibrium concentration, in
theory, is desorbed into the fermenter headspace (Frahm, et al., 2002; Fig. 1 of Zosel et al.,
2011).
Desorption of CO2 from the aqueous to the gas phase is a physical process contingent
upon the concentration gradient of CO2 between these two phases. This aspect of CO2 behavior
is represented in the 2nd
term on the RHS of Equation (3.1). In mass transfer, the rate of transfer
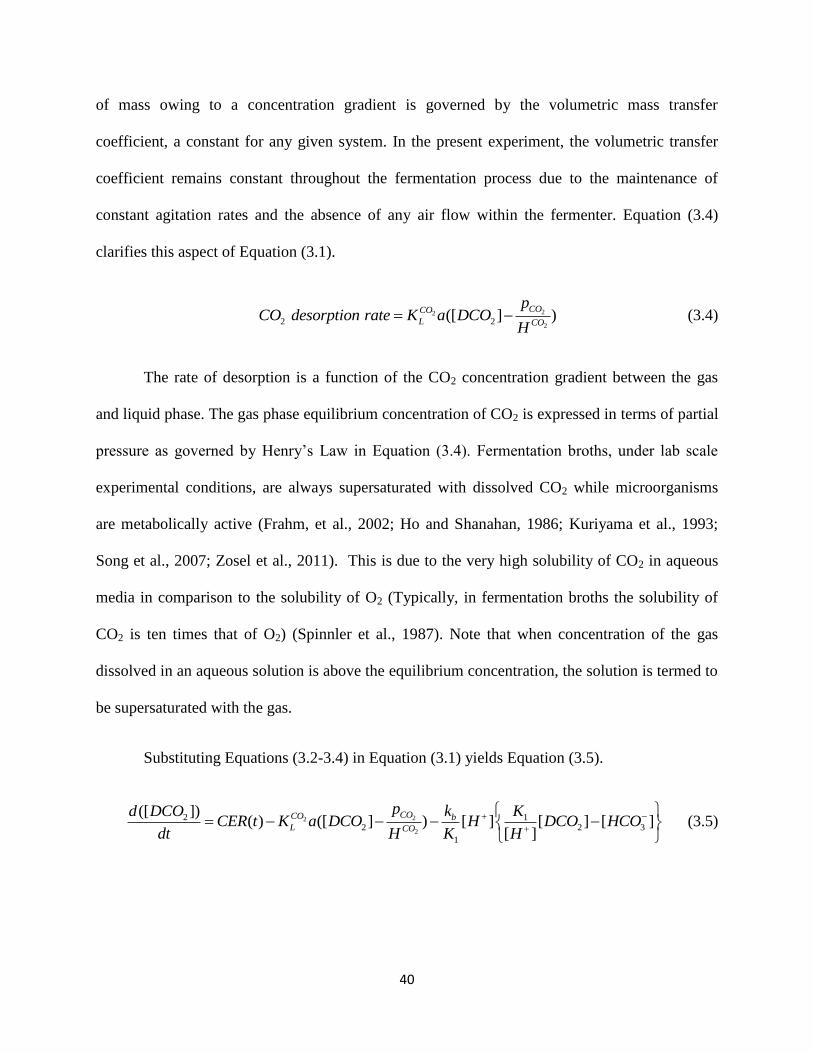
40
of mass owing to a concentration gradient is governed by the volumetric mass transfer
coefficient, a constant for any given system. In the present experiment, the volumetric transfer
coefficient remains constant throughout the fermentation process due to the maintenance of
constant agitation rates and the absence of any air flow within the fermenter. Equation (3.4)
clarifies this aspect of Equation (3.1).
22
22 2 ([ ] )
COCO
L CO
pCO desorption rate K a DCO
H
(3.4)
The rate of desorption is a function of the CO2 concentration gradient between the gas
and liquid phase. The gas phase equilibrium concentration of CO2 is expressed in terms of partial
pressure as governed by Henry’s Law in Equation (3.4). Fermentation broths, under lab scale
experimental conditions, are always supersaturated with dissolved CO2 while microorganisms
are metabolically active (Frahm, et al., 2002; Ho and Shanahan, 1986; Kuriyama et al., 1993;
Song et al., 2007; Zosel et al., 2011). This is due to the very high solubility of CO2 in aqueous
media in comparison to the solubility of O2 (Typically, in fermentation broths the solubility of
CO2 is ten times that of O2) (Spinnler et al., 1987). Note that when concentration of the gas
dissolved in an aqueous solution is above the equilibrium concentration, the solution is termed to
be supersaturated with the gas.
Substituting Equations (3.2-3.4) in Equation (3.1) yields Equation (3.5).
22
2
2 12 2 3
1
([ ])( ) ([ ] ) [ ] [ ] [ ]
[ ]
COCO bL CO
p kd DCO KCER t K a DCO H DCO HCO
dt H K H
(3.5)
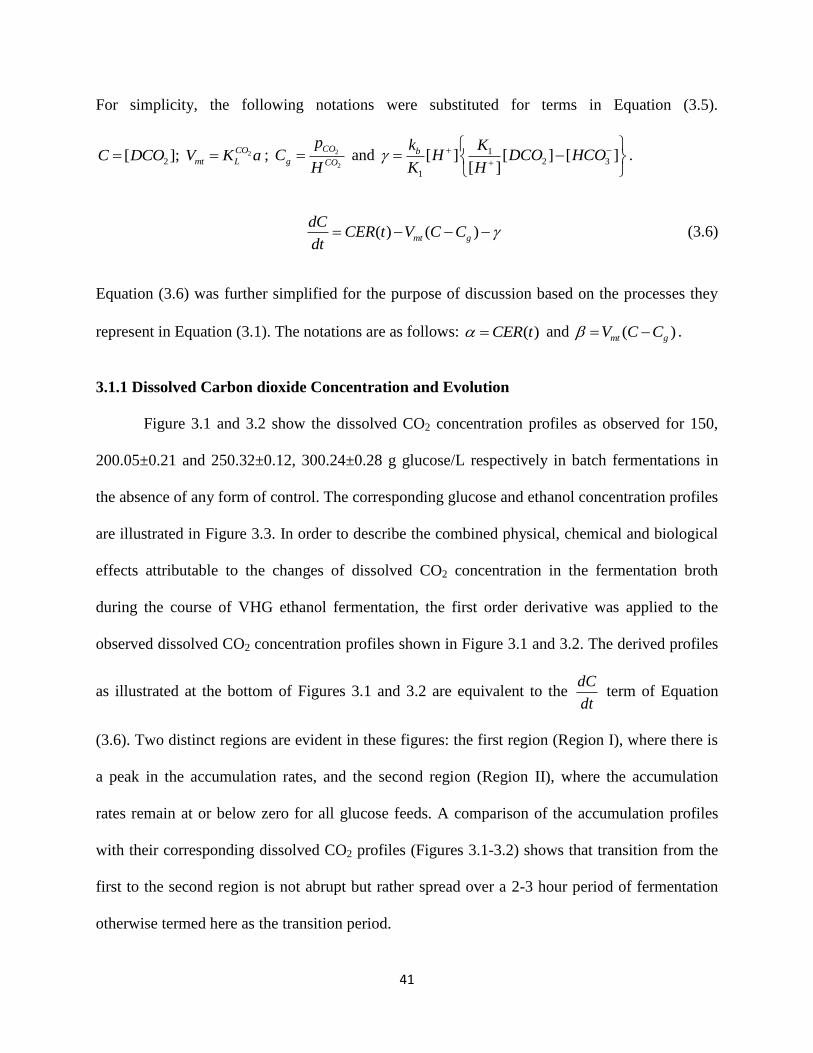
41
For simplicity, the following notations were substituted for terms in Equation (3.5).
2
2[ ]; CO
mt LC DCO V K a ; 2
2
CO
g CO
pC
H and 1
2 3
1
[ ] [ ] [ ][ ]
bk KH DCO HCO
K H
.
( ) ( )mt g
dCCER t V C C
dt (3.6)
Equation (3.6) was further simplified for the purpose of discussion based on the processes they
represent in Equation (3.1). The notations are as follows: ( )CER t and ( )mt gV C C .
3.1.1 Dissolved Carbon dioxide Concentration and Evolution
Figure 3.1 and 3.2 show the dissolved CO2 concentration profiles as observed for 150,
200.05±0.21 and 250.32±0.12, 300.24±0.28 g glucose/L respectively in batch fermentations in
the absence of any form of control. The corresponding glucose and ethanol concentration profiles
are illustrated in Figure 3.3. In order to describe the combined physical, chemical and biological
effects attributable to the changes of dissolved CO2 concentration in the fermentation broth
during the course of VHG ethanol fermentation, the first order derivative was applied to the
observed dissolved CO2 concentration profiles shown in Figure 3.1 and 3.2. The derived profiles
as illustrated at the bottom of Figures 3.1 and 3.2 are equivalent to the dC
dt term of Equation
(3.6). Two distinct regions are evident in these figures: the first region (Region I), where there is
a peak in the accumulation rates, and the second region (Region II), where the accumulation
rates remain at or below zero for all glucose feeds. A comparison of the accumulation profiles
with their corresponding dissolved CO2 profiles (Figures 3.1-3.2) shows that transition from the
first to the second region is not abrupt but rather spread over a 2-3 hour period of fermentation
otherwise termed here as the transition period.
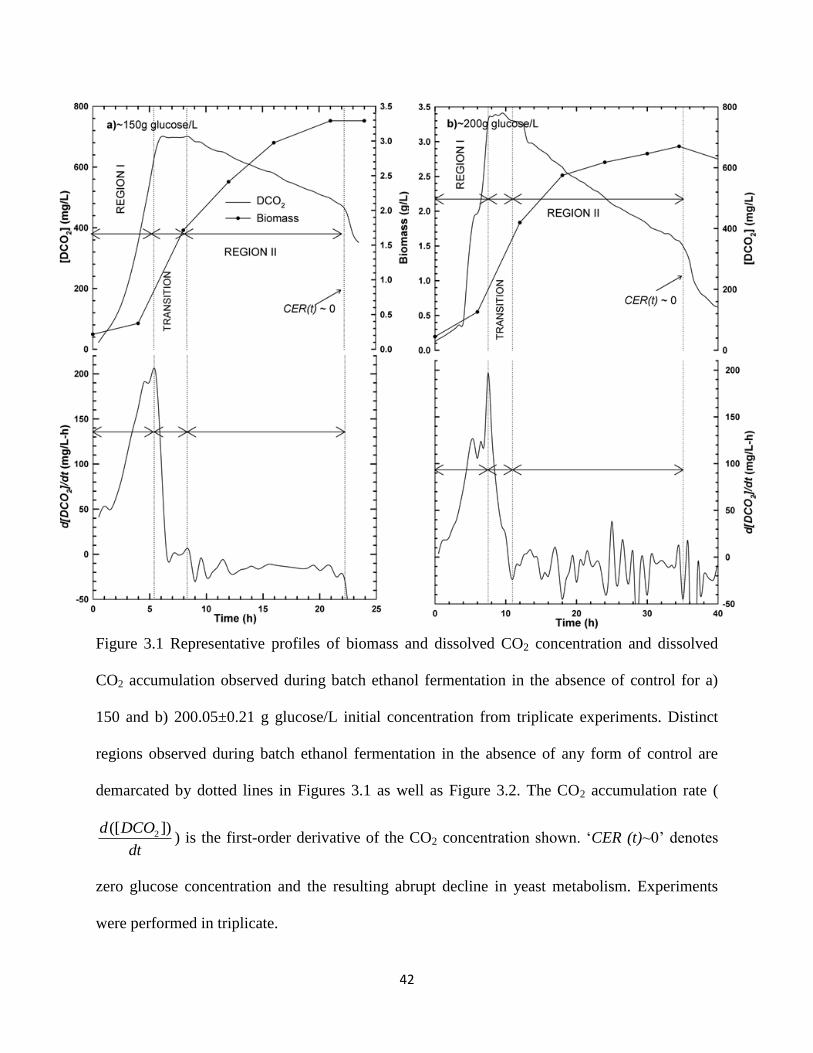
42
Figure 3.1 Representative profiles of biomass and dissolved CO2 concentration and dissolved
CO2 accumulation observed during batch ethanol fermentation in the absence of control for a)
150 and b) 200.05±0.21 g glucose/L initial concentration from triplicate experiments. Distinct
regions observed during batch ethanol fermentation in the absence of any form of control are
demarcated by dotted lines in Figures 3.1 as well as Figure 3.2. The CO2 accumulation rate (
2([ ])d DCO
dt) is the first-order derivative of the CO2 concentration shown. ‘CER (t)~0’ denotes
zero glucose concentration and the resulting abrupt decline in yeast metabolism. Experiments
were performed in triplicate.
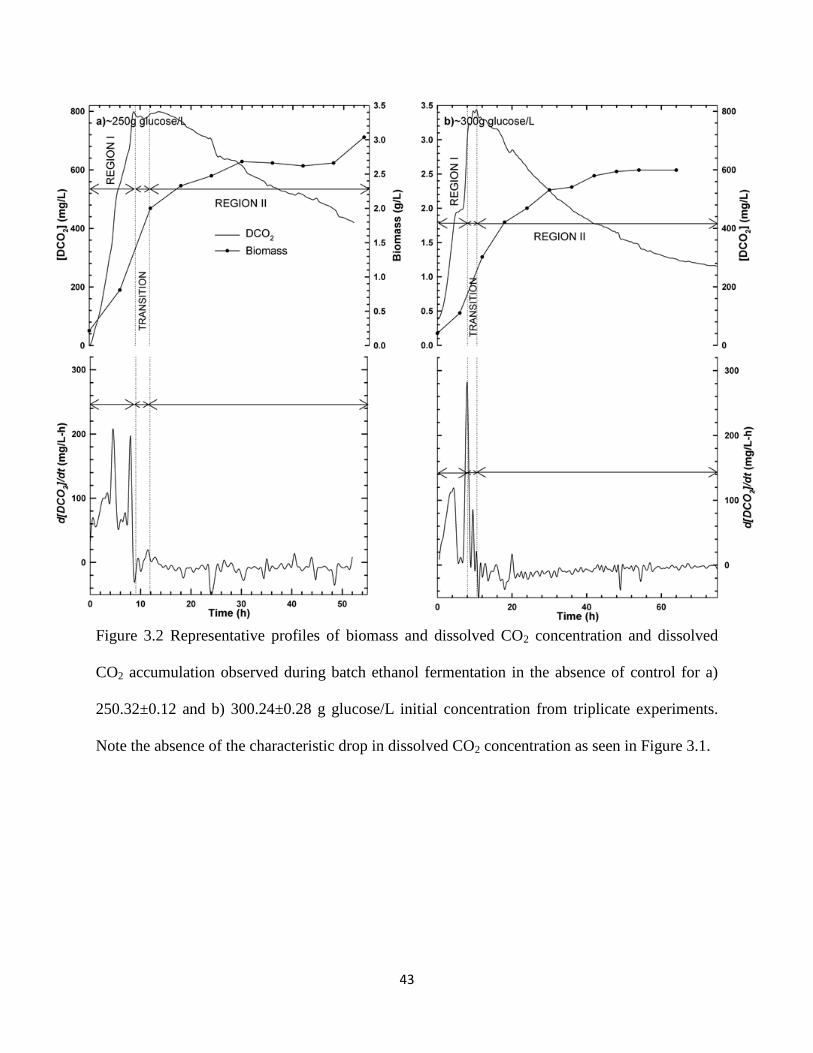
43
Figure 3.2 Representative profiles of biomass and dissolved CO2 concentration and dissolved
CO2 accumulation observed during batch ethanol fermentation in the absence of control for a)
250.32±0.12 and b) 300.24±0.28 g glucose/L initial concentration from triplicate experiments.
Note the absence of the characteristic drop in dissolved CO2 concentration as seen in Figure 3.1.
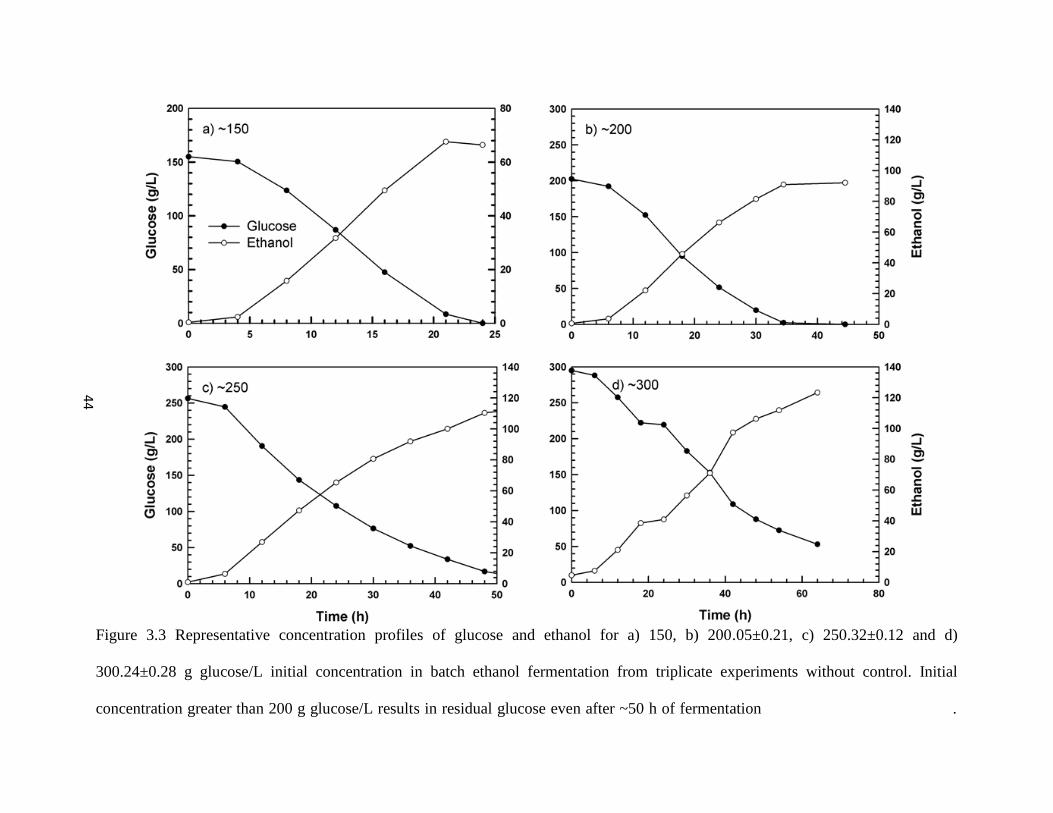
Figure 3.3 Representative concentration profiles of glucose and ethanol for a) 150, b) 200.05±0.21, c) 250.32±0.12 and d)
300.24±0.28 g glucose/L initial concentration in batch ethanol fermentation from triplicate experiments without control. Initial
concentration greater than 200 g glucose/L results in residual glucose even after ~50 h of fermentation .
44
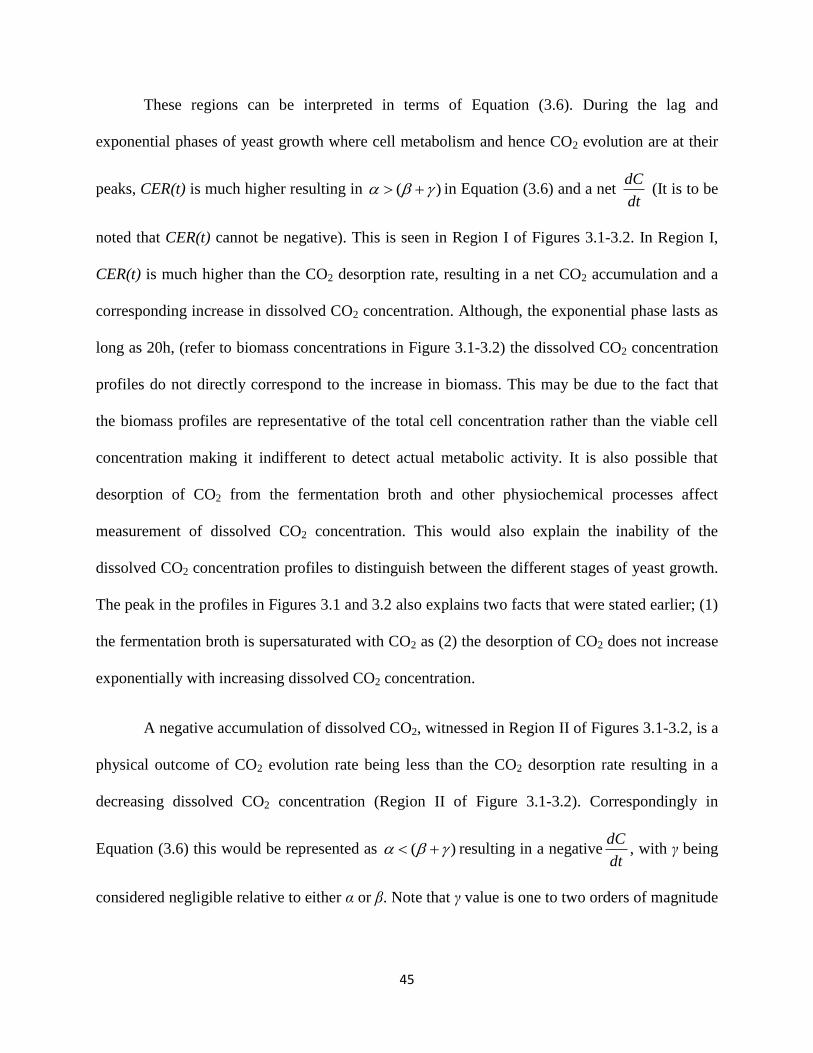
45
These regions can be interpreted in terms of Equation (3.6). During the lag and
exponential phases of yeast growth where cell metabolism and hence CO2 evolution are at their
peaks, CER(t) is much higher resulting in ( ) in Equation (3.6) and a net dC
dt (It is to be
noted that CER(t) cannot be negative). This is seen in Region I of Figures 3.1-3.2. In Region I,
CER(t) is much higher than the CO2 desorption rate, resulting in a net CO2 accumulation and a
corresponding increase in dissolved CO2 concentration. Although, the exponential phase lasts as
long as 20h, (refer to biomass concentrations in Figure 3.1-3.2) the dissolved CO2 concentration
profiles do not directly correspond to the increase in biomass. This may be due to the fact that
the biomass profiles are representative of the total cell concentration rather than the viable cell
concentration making it indifferent to detect actual metabolic activity. It is also possible that
desorption of CO2 from the fermentation broth and other physiochemical processes affect
measurement of dissolved CO2 concentration. This would also explain the inability of the
dissolved CO2 concentration profiles to distinguish between the different stages of yeast growth.
The peak in the profiles in Figures 3.1 and 3.2 also explains two facts that were stated earlier; (1)
the fermentation broth is supersaturated with CO2 as (2) the desorption of CO2 does not increase
exponentially with increasing dissolved CO2 concentration.
A negative accumulation of dissolved CO2, witnessed in Region II of Figures 3.1-3.2, is a
physical outcome of CO2 evolution rate being less than the CO2 desorption rate resulting in a
decreasing dissolved CO2 concentration (Region II of Figure 3.1-3.2). Correspondingly in
Equation (3.6) this would be represented as ( ) resulting in a negativedC
dt, with γ being
considered negligible relative to either α or β. Note that γ value is one to two orders of magnitude
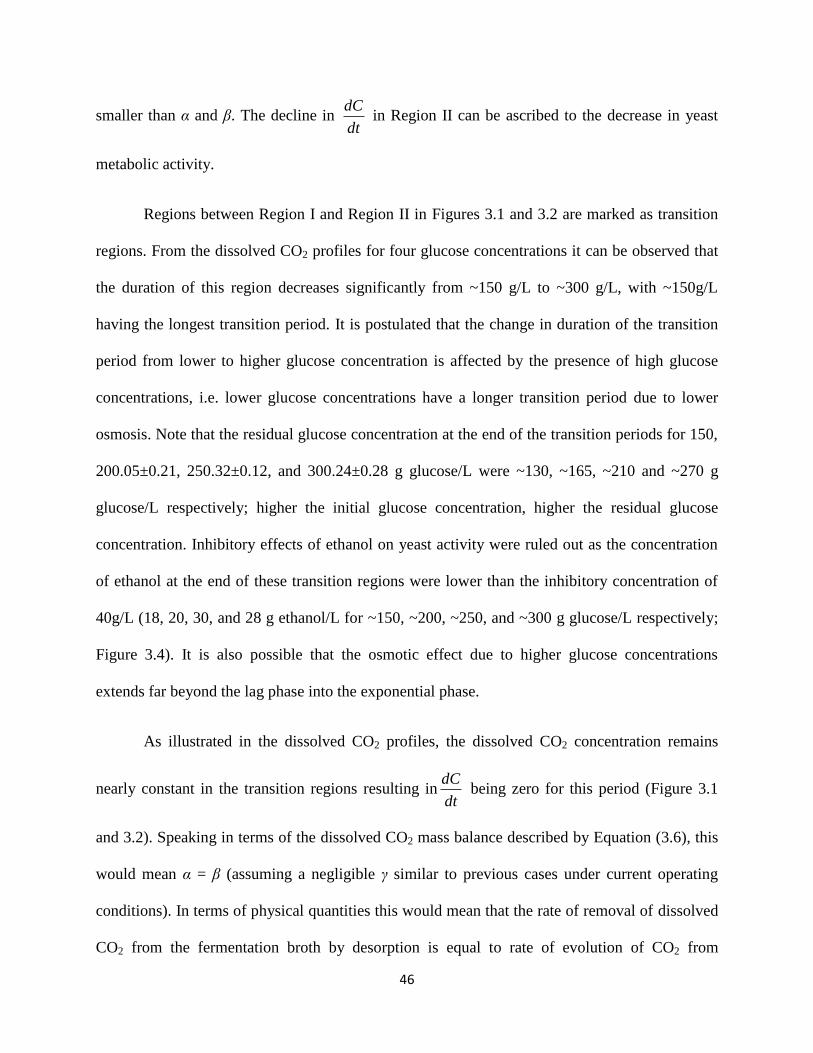
46
smaller than α and β. The decline in dC
dt in Region II can be ascribed to the decrease in yeast
metabolic activity.
Regions between Region I and Region II in Figures 3.1 and 3.2 are marked as transition
regions. From the dissolved CO2 profiles for four glucose concentrations it can be observed that
the duration of this region decreases significantly from ~150 g/L to ~300 g/L, with ~150g/L
having the longest transition period. It is postulated that the change in duration of the transition
period from lower to higher glucose concentration is affected by the presence of high glucose
concentrations, i.e. lower glucose concentrations have a longer transition period due to lower
osmosis. Note that the residual glucose concentration at the end of the transition periods for 150,
200.05±0.21, 250.32±0.12, and 300.24±0.28 g glucose/L were ~130, ~165, ~210 and ~270 g
glucose/L respectively; higher the initial glucose concentration, higher the residual glucose
concentration. Inhibitory effects of ethanol on yeast activity were ruled out as the concentration
of ethanol at the end of these transition regions were lower than the inhibitory concentration of
40g/L (18, 20, 30, and 28 g ethanol/L for ~150, ~200, ~250, and ~300 g glucose/L respectively;
Figure 3.4). It is also possible that the osmotic effect due to higher glucose concentrations
extends far beyond the lag phase into the exponential phase.
As illustrated in the dissolved CO2 profiles, the dissolved CO2 concentration remains
nearly constant in the transition regions resulting indC
dt being zero for this period (Figure 3.1
and 3.2). Speaking in terms of the dissolved CO2 mass balance described by Equation (3.6), this
would mean α = β (assuming a negligible γ similar to previous cases under current operating
conditions). In terms of physical quantities this would mean that the rate of removal of dissolved
CO2 from the fermentation broth by desorption is equal to rate of evolution of CO2 from
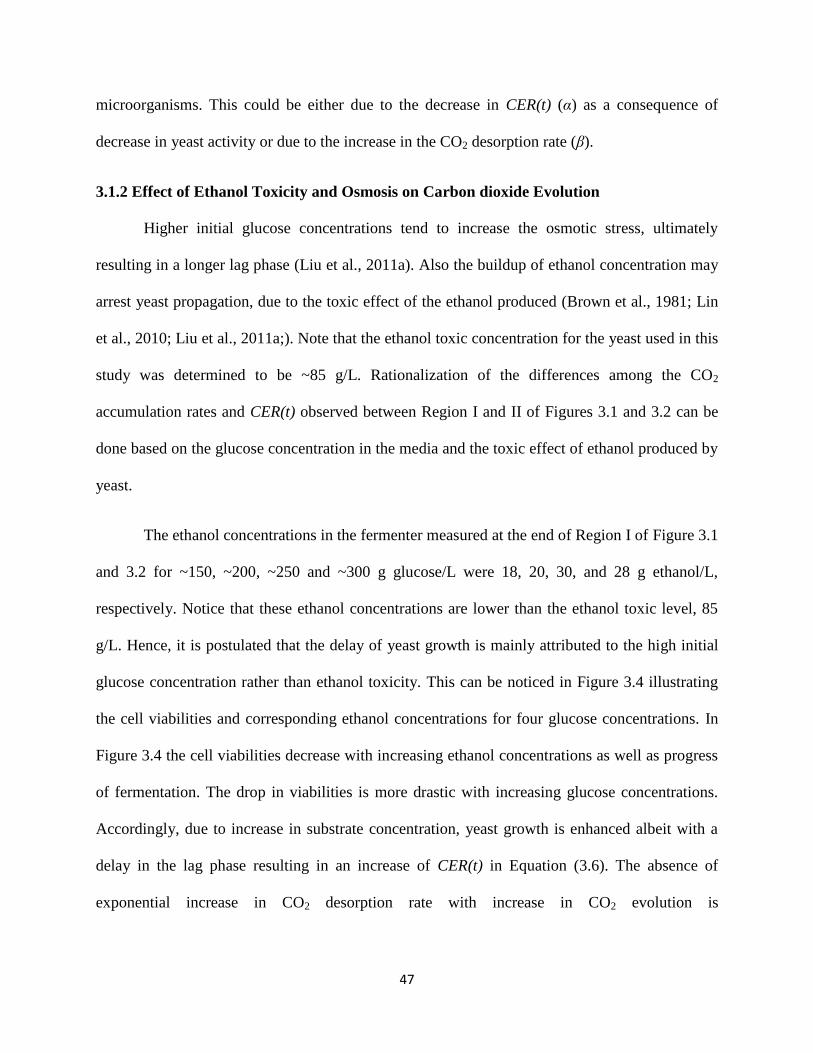
47
microorganisms. This could be either due to the decrease in CER(t) (α) as a consequence of
decrease in yeast activity or due to the increase in the CO2 desorption rate (β).
3.1.2 Effect of Ethanol Toxicity and Osmosis on Carbon dioxide Evolution
Higher initial glucose concentrations tend to increase the osmotic stress, ultimately
resulting in a longer lag phase (Liu et al., 2011a). Also the buildup of ethanol concentration may
arrest yeast propagation, due to the toxic effect of the ethanol produced (Brown et al., 1981; Lin
et al., 2010; Liu et al., 2011a;). Note that the ethanol toxic concentration for the yeast used in this
study was determined to be ~85 g/L. Rationalization of the differences among the CO2
accumulation rates and CER(t) observed between Region I and II of Figures 3.1 and 3.2 can be
done based on the glucose concentration in the media and the toxic effect of ethanol produced by
yeast.
The ethanol concentrations in the fermenter measured at the end of Region I of Figure 3.1
and 3.2 for ~150, ~200, ~250 and ~300 g glucose/L were 18, 20, 30, and 28 g ethanol/L,
respectively. Notice that these ethanol concentrations are lower than the ethanol toxic level, 85
g/L. Hence, it is postulated that the delay of yeast growth is mainly attributed to the high initial
glucose concentration rather than ethanol toxicity. This can be noticed in Figure 3.4 illustrating
the cell viabilities and corresponding ethanol concentrations for four glucose concentrations. In
Figure 3.4 the cell viabilities decrease with increasing ethanol concentrations as well as progress
of fermentation. The drop in viabilities is more drastic with increasing glucose concentrations.
Accordingly, due to increase in substrate concentration, yeast growth is enhanced albeit with a
delay in the lag phase resulting in an increase of CER(t) in Equation (3.6). The absence of
exponential increase in CO2 desorption rate with increase in CO2 evolution is
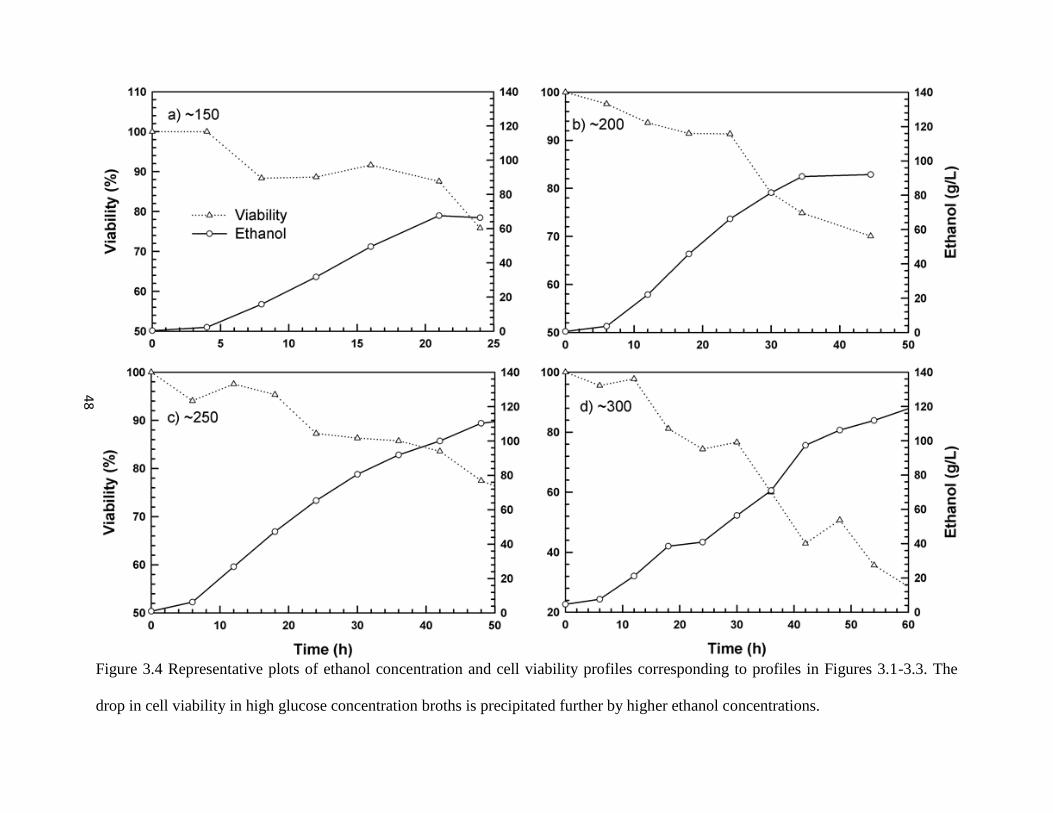
Figure 3.4 Representative plots of ethanol concentration and cell viability profiles corresponding to profiles in Figures 3.1-3.3. The
drop in cell viability in high glucose concentration broths is precipitated further by higher ethanol concentrations.
48
49
reflected in the corresponding increase in dissolved CO2 concentration and dC
dt as shown in
Figures 3.1 and 3.2. It was also inferred that due to the inability of the dissolved CO2 profiles to
differentiate among the distinct growth stages, especially the lag and exponential phases, it was
not possible to observe the osmotic effect of higher glucose concentration on the lag phase from
the existing dissolved CO2 profiles.
In Region II of Figures 3.1 and 3.2, the glucose concentrations after 10-12h of
fermentation are much lower than initial values, indicating a moderate reduction in osmotic
stress for all four glucose feeds. At initial concentrations of ~150 and ~200 g glucose/L, final
ethanol concentrations seen at the end of fermentation when, glucose is completely utilized, are
68 and 72 g/L respectively (Figure 3.3). Hence, yeast metabolism and the production of CO2
were hampered by glucose depletion rather than ethanol toxicity (Figure 3.3 and 3.4). At initial
concentrations of ~250 and ~300 g glucose/L, although sufficient glucose (75 and 150 g/L) is
present even following the peak in CO2 concentrations (32 and 34h respectively, where typically
stationary phase begins; Lin et al., 2010; Liu et al., 2011a), the corresponding ethanol
concentration exceeds the toxic level of 85 g/L (Figure 3.3 and 3.4). As fermentation continues,
the adverse effect of ethanol toxicity worsens. The decrease in dissolved CO2 concentration and
evolution rates inferred from Region II of Figures 3.1 and 3.2 can be attributed to the death of
yeast cells that cease to survive in ethanol concentrations exceeding the toxic level (Figure 2 in
Lin et al. (2010) and Figure 3.4). Cessation of yeast growth and survival directly impacts the
value of CER(t) and CO2 accumulation. This is witnessed from Figure 3.2 where once past the
transition region the dissolved CO2 concentration starts decreasing and dC
dt become increasingly
negative.
50
From Equation (3.6) and Region II of Figure 3.1 and 3.2 it was further concluded that
once accumulation of CO2 in the aqueous phase ceased, there was no change in the rate of
decrease of dissolved CO2 concentration and the value of dC
dt remained fairly constant till
CER(t) approached zero (denoted by CER(t)~0 for the case of ~150 and ~200 g glucose/L and
illustrated in Figure 3.1). But for the case of ~250 and ~300 g glucose/L there was no abrupt
decline in the dissolved CO2 concentration leading us to the observation that the point of
CER(t)~0 was not evident from Figure 3.2. This observation led to the conclusion that the CO2
desorption rate remained almost constant irrespective of the changing CER(t) provided, the
assumption of a slowly decreasing CER(t) is valid. Thus from Equation (3.6) it can be inferred
that the rate of CO2 desorption remains fairly constant during the entire fermentation process.
This strengthens the fact that equilibrium between off-gas CO2 and dissolved CO2 does not exist
under our current experimental conditions. Furthermore, the decreasing gradient between
dissolved and off-gas CO2 concentrations will result in a reduced driving force for CO2
desorption from the fermentation broth. Hence, it is postulated that the rate of desorption of CO2
will decrease with decrease in dissolved CO2 concentration in the fermentation broth.
3.2 Dissolved Carbon dioxide Control in Very-High-Gravity Fermentation
Subsequently, control of dissolved CO2 concentration was incorporated into the VHG
fermentation process. Earlier Liu et al. (2011a) had concluded that incorporating an ORP based
control strategy did not provide any benefit to fermentations processes operated under initial
concentrations less than 200 g glucose/L. In addition, glucose was completely consumed in
fermentations with initial substrate concentration less that 200 g glucose/L within a reasonable
period of time (Figure 3.1) Aiming to improve ethanol fermentation for feeds greater than 200 g
glucose/L, dissolved CO2 was controlled at three different levels of 500, 750 and 1000 mg/L for
51
the case of ~250 g glucose/L and at two levels of 750 and 1000 mg/L for ~300 g glucose/L. The
dissolved CO2 concentration profiles for each individual case have been presented in this section
along with the corresponding biomass, glucose and ethanol concentration profiles.
Control was achieved either using Ca(OH)2 or air. Control with Ca(OH)2 although was
capable of absorbing dissolved CO2 and maintaining dissolved CO2 levels as dictated by the set
points despite its very low solubility, addition of Ca(OH)2 to the fermentation broth reduced the
ethanol concentration in the broth. Reduction of ethanol concentration defeated the very purpose
of VHG ethanol fermentation which is to produce high concentrations of ethanol. Addition of
Ca(OH)2 also increased the pH of the fermentation broth beyond 6. This resulted in an
environment non-conducive for yeast growth. Yeast ceases to function at or close to neutral pH.
Hence, this caused cell viabilities to drop below 50 % after ~6 h of fermentation when control
was initiated. A drop in cell viabilities would reduce yeast growth as well as ethanol production
rates. As control using Ca(OH)2 did not yield the desired results, following discussions
pertaining to control are based on control achieved using air in their entirety
3.2.1 Characteristics of Dissolved Carbon dioxide Profiles in the Presence of Control
In their basic form the dissolved CO2 profiles for initial concentrations of ~250 g
glucose/L, can be split into 4 distinct regions irrespective of the level of control and aeration rate
used. Figures 3.5 and 3.6 illustrate differentiation of the dissolved CO2 profile into four distinct
regions for the case of ~250 and ~300 g glucose/L respectively with dissolved CO2 controlled at
750 mg/L. These four regions have been hypothesized to represent the different levels of yeast
activity and growth phases during fermentation. Initially yeast metabolism is known to be slow
during the lag and early exponential phases of growth resulting in slower production of CO2. The
osmotic effects induced by high initial glucose concentrations are known to compound this effect
52
resulting in an increased duration for the lag phase. The low biomass concentrations in Region I
stand witness to this fact (Figure 3.5 and 3.6). Longer lag phase is seen in the form of increase in
fermentation duration for ~300 g glucose/L in comparison to ~250 g glucose/L (Table 3.1).
Hence, Region I in Figures 3.5 and 3.6 was hypothesized to characterize the lag phase and the
very early part of the exponential phase.
The lag phase paves way for the exponential phase towards the end of Region I. Region
II of Figures 3.5 and 3.6 characterize yeast growth during the mid and late exponential phases.
The increase in metabolic activity in this phase results in increased CO2 production and
accumulation. In addition to the usual increase in metabolic rates witnessed in the mid-
exponential phase, the supply of oxygen during transition from Region I to Region II, as a
consequence of control is known to further enhance yeast vitality and consequently ethanol
production (In reference to Equation (3.6), CER(t) is at its highest in this region). The sparged air
in addition to supplying oxygen also aids in the stripping of dissolved CO2 from the fermentation
broth. Despite increased desorption, dissolved CO2 profiles depict an increase in the dissolved
CO2 concentration over and above the set point values in Region II of Figures 3.5 and 3.6. This
increase in concentration that can be construed as a net dissolved CO2 accumulation, has been
postulated to represent the additional increase in CER(t) owing to oxygen supply as well as CO2
removal..
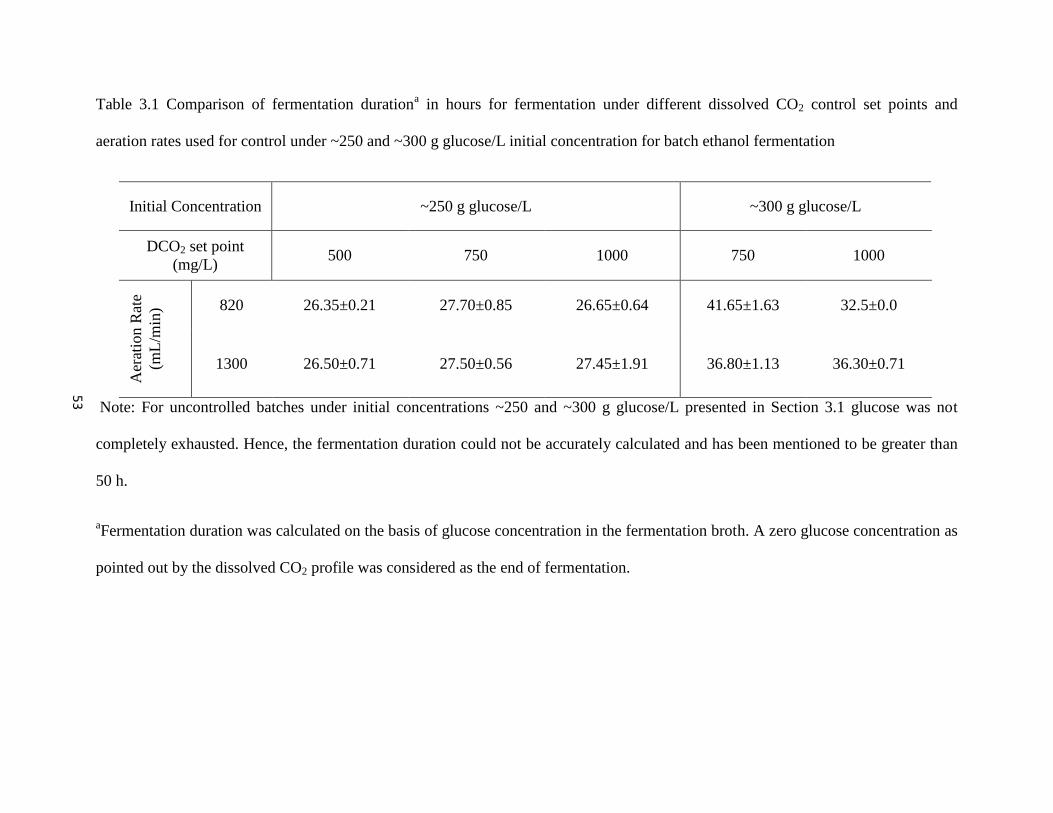
Table 3.1 Comparison of fermentation durationa in hours for fermentation under different dissolved CO2 control set points and
aeration rates used for control under ~250 and ~300 g glucose/L initial concentration for batch ethanol fermentation
Initial Concentration ~250 g glucose/L ~300 g glucose/L
DCO2 set point
(mg/L) 500 750 1000 750 1000
Aer
atio
n R
ate
(mL
/min
) 820 26.35±0.21 27.70±0.85 26.65±0.64 41.65±1.63 32.5±0.0
1300 26.50±0.71 27.50±0.56 27.45±1.91 36.80±1.13 36.30±0.71
Note: For uncontrolled batches under initial concentrations ~250 and ~300 g glucose/L presented in Section 3.1 glucose was not
completely exhausted. Hence, the fermentation duration could not be accurately calculated and has been mentioned to be greater than
50 h.
aFermentation duration was calculated on the basis of glucose concentration in the fermentation broth. A zero glucose concentration as
pointed out by the dissolved CO2 profile was considered as the end of fermentation.
53
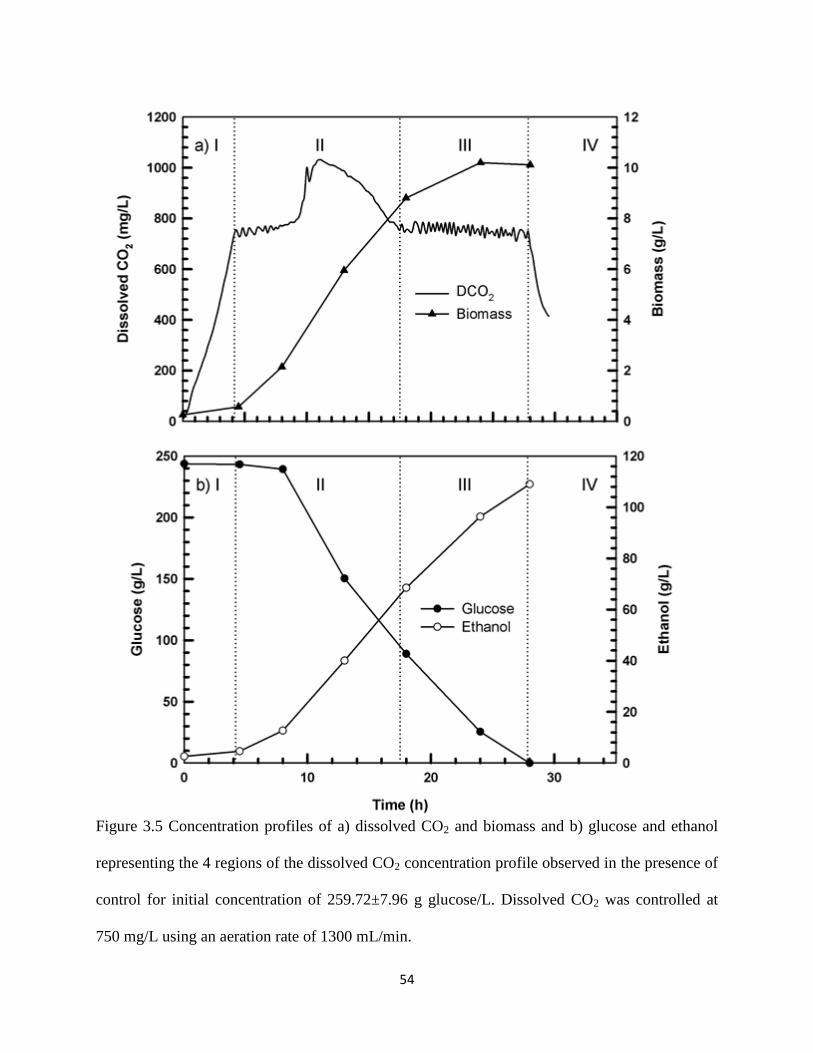
54
Figure 3.5 Concentration profiles of a) dissolved CO2 and biomass and b) glucose and ethanol
representing the 4 regions of the dissolved CO2 concentration profile observed in the presence of
control for initial concentration of 259.72±7.96 g glucose/L. Dissolved CO2 was controlled at
750 mg/L using an aeration rate of 1300 mL/min.
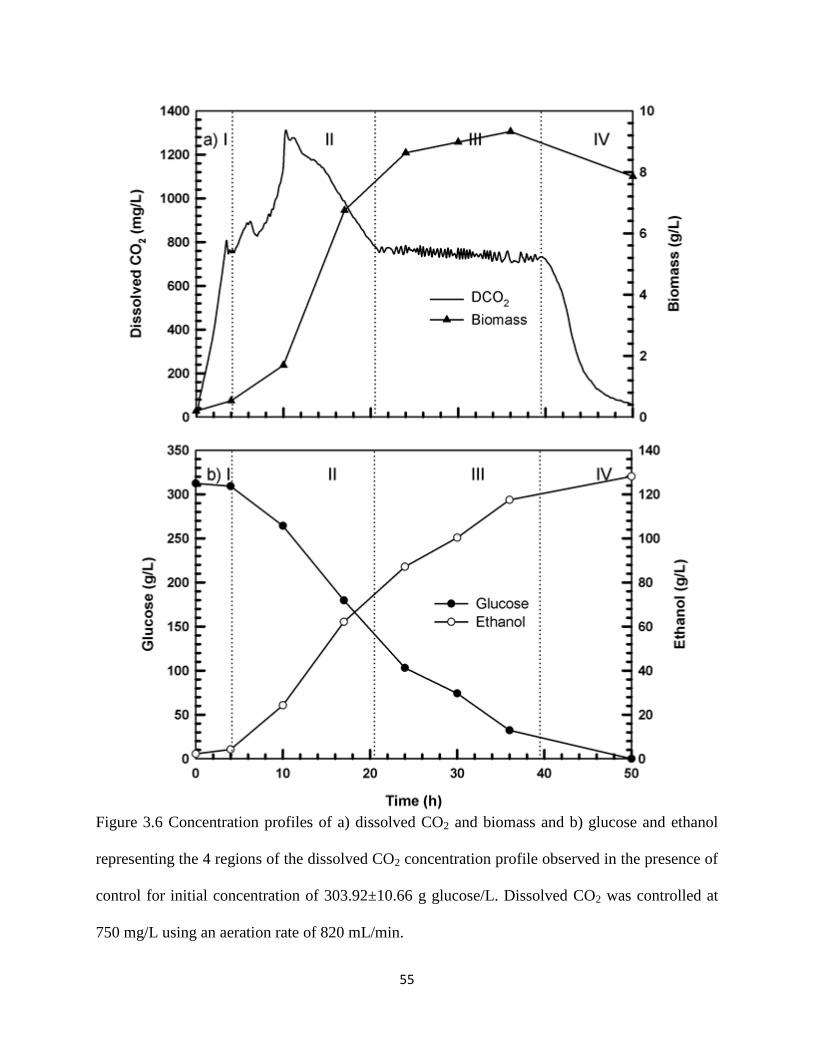
55
Figure 3.6 Concentration profiles of a) dissolved CO2 and biomass and b) glucose and ethanol
representing the 4 regions of the dissolved CO2 concentration profile observed in the presence of
control for initial concentration of 303.92±10.66 g glucose/L. Dissolved CO2 was controlled at
750 mg/L using an aeration rate of 820 mL/min.
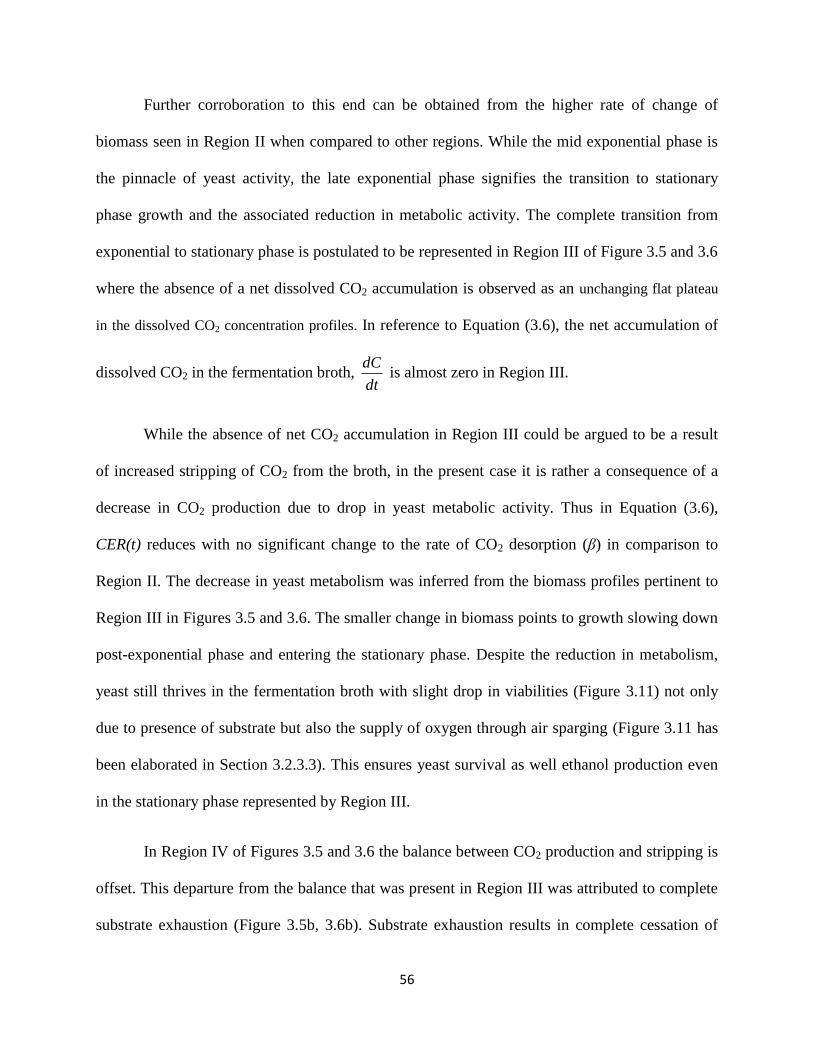
56
Further corroboration to this end can be obtained from the higher rate of change of
biomass seen in Region II when compared to other regions. While the mid exponential phase is
the pinnacle of yeast activity, the late exponential phase signifies the transition to stationary
phase growth and the associated reduction in metabolic activity. The complete transition from
exponential to stationary phase is postulated to be represented in Region III of Figure 3.5 and 3.6
where the absence of a net dissolved CO2 accumulation is observed as an unchanging flat plateau
in the dissolved CO2 concentration profiles. In reference to Equation (3.6), the net accumulation of
dissolved CO2 in the fermentation broth, dC
dt is almost zero in Region III.
While the absence of net CO2 accumulation in Region III could be argued to be a result
of increased stripping of CO2 from the broth, in the present case it is rather a consequence of a
decrease in CO2 production due to drop in yeast metabolic activity. Thus in Equation (3.6),
CER(t) reduces with no significant change to the rate of CO2 desorption (β) in comparison to
Region II. The decrease in yeast metabolism was inferred from the biomass profiles pertinent to
Region III in Figures 3.5 and 3.6. The smaller change in biomass points to growth slowing down
post-exponential phase and entering the stationary phase. Despite the reduction in metabolism,
yeast still thrives in the fermentation broth with slight drop in viabilities (Figure 3.11) not only
due to presence of substrate but also the supply of oxygen through air sparging (Figure 3.11 has
been elaborated in Section 3.2.3.3). This ensures yeast survival as well ethanol production even
in the stationary phase represented by Region III.
In Region IV of Figures 3.5 and 3.6 the balance between CO2 production and stripping is
offset. This departure from the balance that was present in Region III was attributed to complete
substrate exhaustion (Figure 3.5b, 3.6b). Substrate exhaustion results in complete cessation of
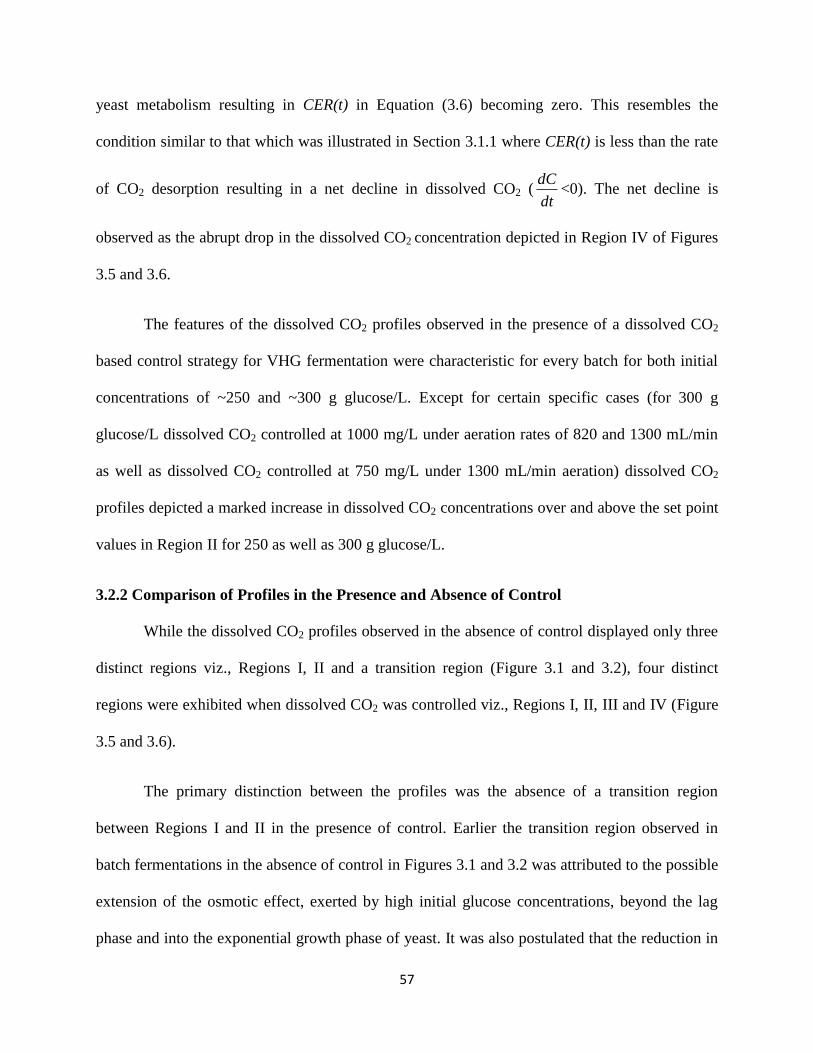
57
yeast metabolism resulting in CER(t) in Equation (3.6) becoming zero. This resembles the
condition similar to that which was illustrated in Section 3.1.1 where CER(t) is less than the rate
of CO2 desorption resulting in a net decline in dissolved CO2 (dC
dt<0). The net decline is
observed as the abrupt drop in the dissolved CO2 concentration depicted in Region IV of Figures
3.5 and 3.6.
The features of the dissolved CO2 profiles observed in the presence of a dissolved CO2
based control strategy for VHG fermentation were characteristic for every batch for both initial
concentrations of ~250 and ~300 g glucose/L. Except for certain specific cases (for 300 g
glucose/L dissolved CO2 controlled at 1000 mg/L under aeration rates of 820 and 1300 mL/min
as well as dissolved CO2 controlled at 750 mg/L under 1300 mL/min aeration) dissolved CO2
profiles depicted a marked increase in dissolved CO2 concentrations over and above the set point
values in Region II for 250 as well as 300 g glucose/L.
3.2.2 Comparison of Profiles in the Presence and Absence of Control
While the dissolved CO2 profiles observed in the absence of control displayed only three
distinct regions viz., Regions I, II and a transition region (Figure 3.1 and 3.2), four distinct
regions were exhibited when dissolved CO2 was controlled viz., Regions I, II, III and IV (Figure
3.5 and 3.6).
The primary distinction between the profiles was the absence of a transition region
between Regions I and II in the presence of control. Earlier the transition region observed in
batch fermentations in the absence of control in Figures 3.1 and 3.2 was attributed to the possible
extension of the osmotic effect, exerted by high initial glucose concentrations, beyond the lag
phase and into the exponential growth phase of yeast. It was also postulated that the reduction in
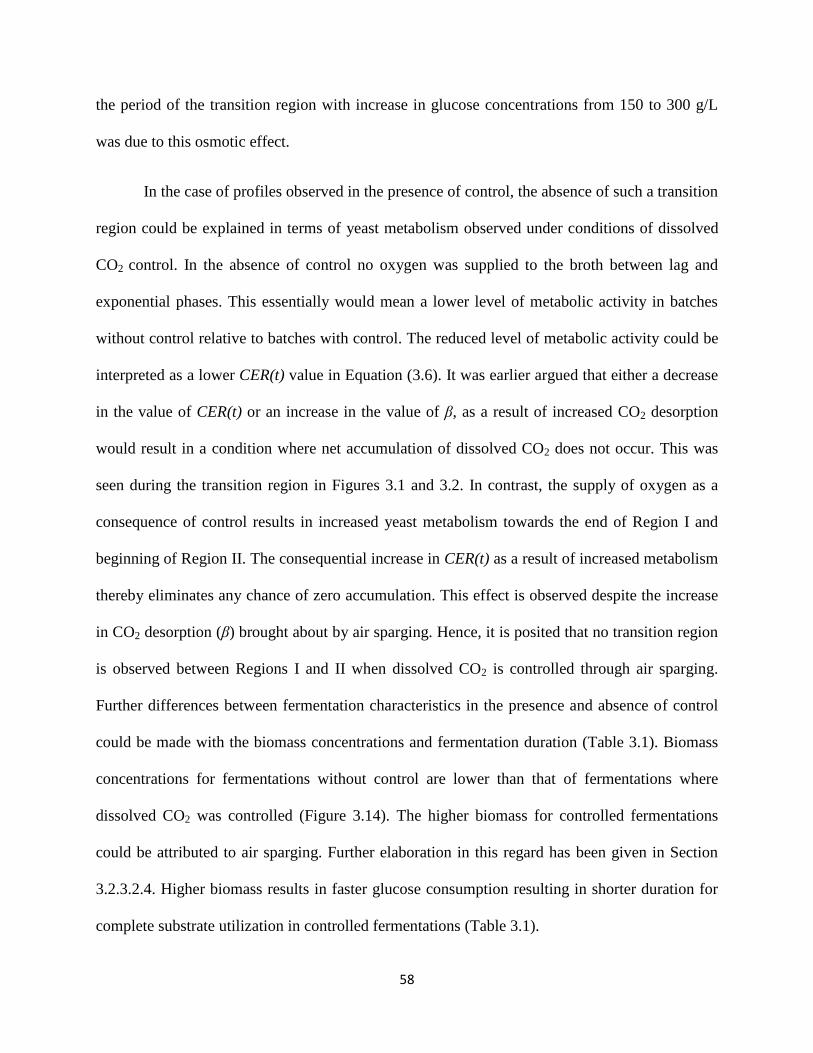
58
the period of the transition region with increase in glucose concentrations from 150 to 300 g/L
was due to this osmotic effect.
In the case of profiles observed in the presence of control, the absence of such a transition
region could be explained in terms of yeast metabolism observed under conditions of dissolved
CO2 control. In the absence of control no oxygen was supplied to the broth between lag and
exponential phases. This essentially would mean a lower level of metabolic activity in batches
without control relative to batches with control. The reduced level of metabolic activity could be
interpreted as a lower CER(t) value in Equation (3.6). It was earlier argued that either a decrease
in the value of CER(t) or an increase in the value of β, as a result of increased CO2 desorption
would result in a condition where net accumulation of dissolved CO2 does not occur. This was
seen during the transition region in Figures 3.1 and 3.2. In contrast, the supply of oxygen as a
consequence of control results in increased yeast metabolism towards the end of Region I and
beginning of Region II. The consequential increase in CER(t) as a result of increased metabolism
thereby eliminates any chance of zero accumulation. This effect is observed despite the increase
in CO2 desorption (β) brought about by air sparging. Hence, it is posited that no transition region
is observed between Regions I and II when dissolved CO2 is controlled through air sparging.
Further differences between fermentation characteristics in the presence and absence of control
could be made with the biomass concentrations and fermentation duration (Table 3.1). Biomass
concentrations for fermentations without control are lower than that of fermentations where
dissolved CO2 was controlled (Figure 3.14). The higher biomass for controlled fermentations
could be attributed to air sparging. Further elaboration in this regard has been given in Section
3.2.3.2.4. Higher biomass results in faster glucose consumption resulting in shorter duration for
complete substrate utilization in controlled fermentations (Table 3.1).
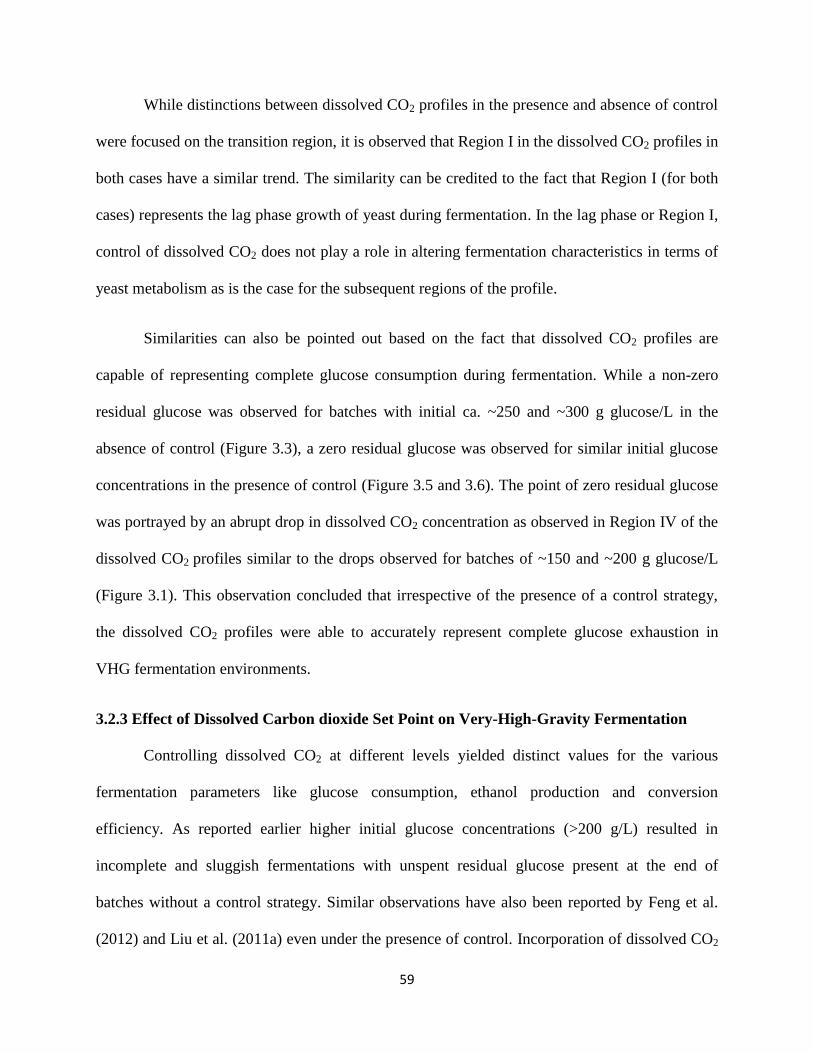
59
While distinctions between dissolved CO2 profiles in the presence and absence of control
were focused on the transition region, it is observed that Region I in the dissolved CO2 profiles in
both cases have a similar trend. The similarity can be credited to the fact that Region I (for both
cases) represents the lag phase growth of yeast during fermentation. In the lag phase or Region I,
control of dissolved CO2 does not play a role in altering fermentation characteristics in terms of
yeast metabolism as is the case for the subsequent regions of the profile.
Similarities can also be pointed out based on the fact that dissolved CO2 profiles are
capable of representing complete glucose consumption during fermentation. While a non-zero
residual glucose was observed for batches with initial ca. ~250 and ~300 g glucose/L in the
absence of control (Figure 3.3), a zero residual glucose was observed for similar initial glucose
concentrations in the presence of control (Figure 3.5 and 3.6). The point of zero residual glucose
was portrayed by an abrupt drop in dissolved CO2 concentration as observed in Region IV of the
dissolved CO2 profiles similar to the drops observed for batches of ~150 and ~200 g glucose/L
(Figure 3.1). This observation concluded that irrespective of the presence of a control strategy,
the dissolved CO2 profiles were able to accurately represent complete glucose exhaustion in
VHG fermentation environments.
3.2.3 Effect of Dissolved Carbon dioxide Set Point on Very-High-Gravity Fermentation
Controlling dissolved CO2 at different levels yielded distinct values for the various
fermentation parameters like glucose consumption, ethanol production and conversion
efficiency. As reported earlier higher initial glucose concentrations (>200 g/L) resulted in
incomplete and sluggish fermentations with unspent residual glucose present at the end of
batches without a control strategy. Similar observations have also been reported by Feng et al.
(2012) and Liu et al. (2011a) even under the presence of control. Incorporation of dissolved CO2
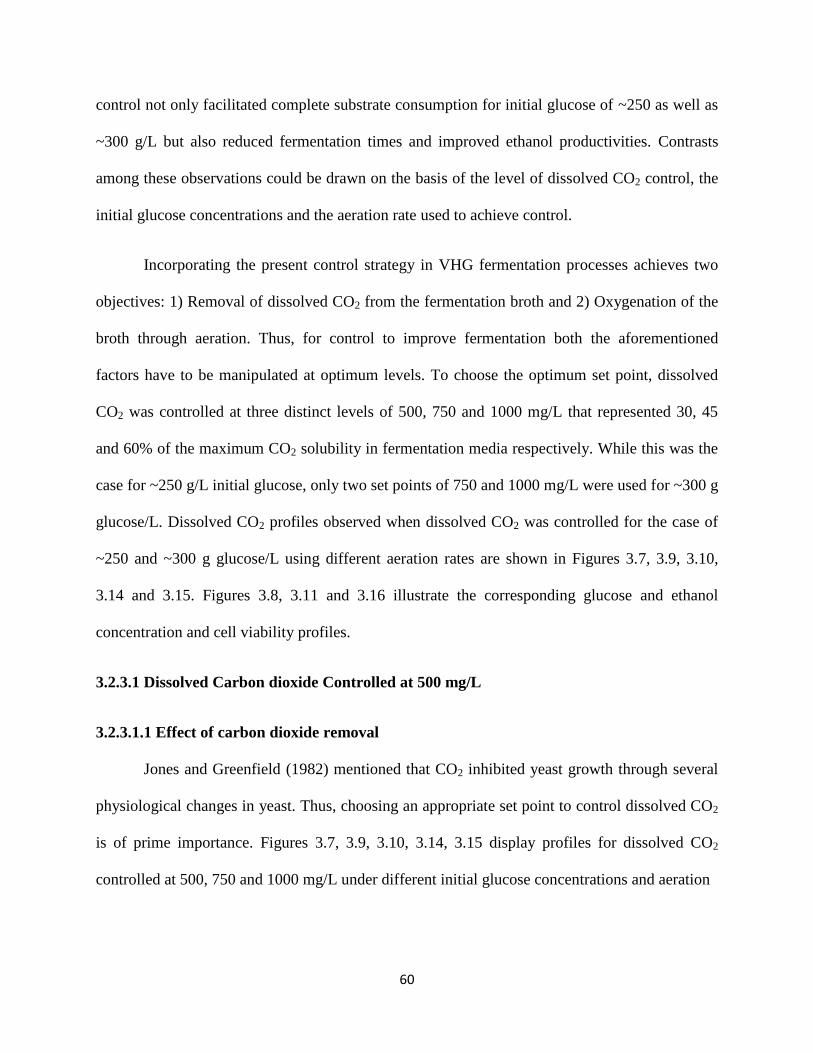
60
control not only facilitated complete substrate consumption for initial glucose of ~250 as well as
~300 g/L but also reduced fermentation times and improved ethanol productivities. Contrasts
among these observations could be drawn on the basis of the level of dissolved CO2 control, the
initial glucose concentrations and the aeration rate used to achieve control.
Incorporating the present control strategy in VHG fermentation processes achieves two
objectives: 1) Removal of dissolved CO2 from the fermentation broth and 2) Oxygenation of the
broth through aeration. Thus, for control to improve fermentation both the aforementioned
factors have to be manipulated at optimum levels. To choose the optimum set point, dissolved
CO2 was controlled at three distinct levels of 500, 750 and 1000 mg/L that represented 30, 45
and 60% of the maximum CO2 solubility in fermentation media respectively. While this was the
case for ~250 g/L initial glucose, only two set points of 750 and 1000 mg/L were used for ~300 g
glucose/L. Dissolved CO2 profiles observed when dissolved CO2 was controlled for the case of
~250 and ~300 g glucose/L using different aeration rates are shown in Figures 3.7, 3.9, 3.10,
3.14 and 3.15. Figures 3.8, 3.11 and 3.16 illustrate the corresponding glucose and ethanol
concentration and cell viability profiles.
3.2.3.1 Dissolved Carbon dioxide Controlled at 500 mg/L
3.2.3.1.1 Effect of carbon dioxide removal
Jones and Greenfield (1982) mentioned that CO2 inhibited yeast growth through several
physiological changes in yeast. Thus, choosing an appropriate set point to control dissolved CO2
is of prime importance. Figures 3.7, 3.9, 3.10, 3.14, 3.15 display profiles for dissolved CO2
controlled at 500, 750 and 1000 mg/L under different initial glucose concentrations and aeration
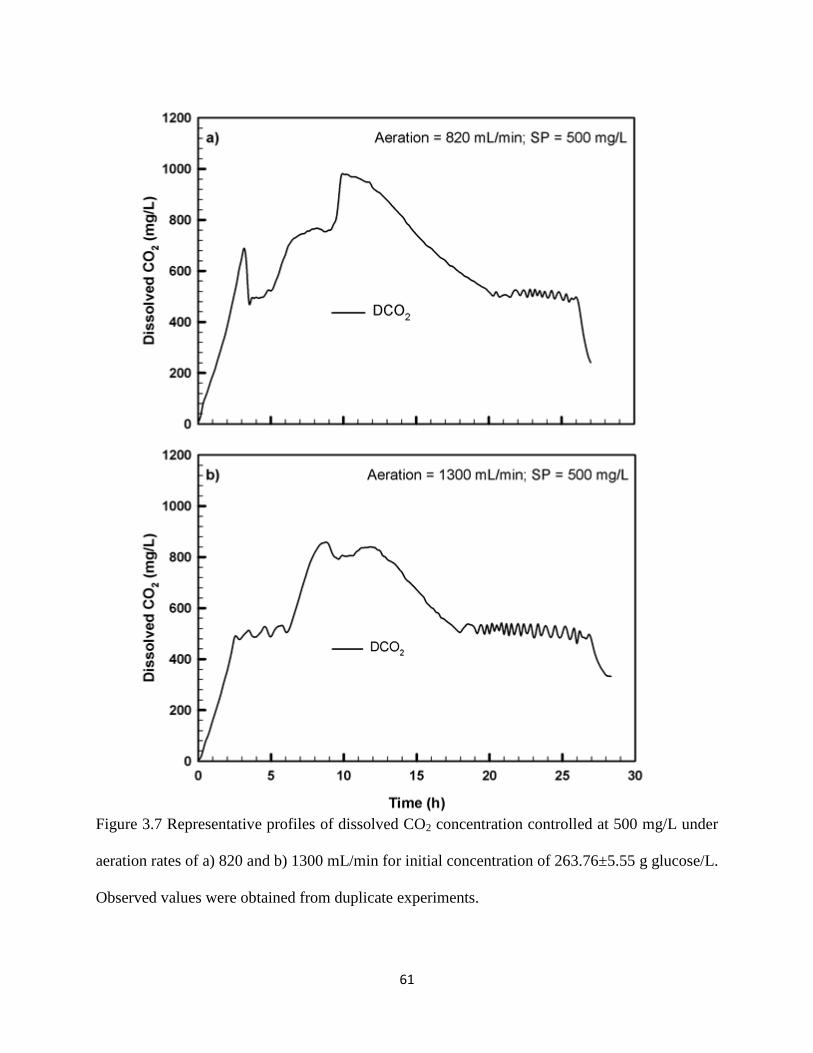
61
Figure 3.7 Representative profiles of dissolved CO2 concentration controlled at 500 mg/L under
aeration rates of a) 820 and b) 1300 mL/min for initial concentration of 263.76±5.55 g glucose/L.
Observed values were obtained from duplicate experiments.
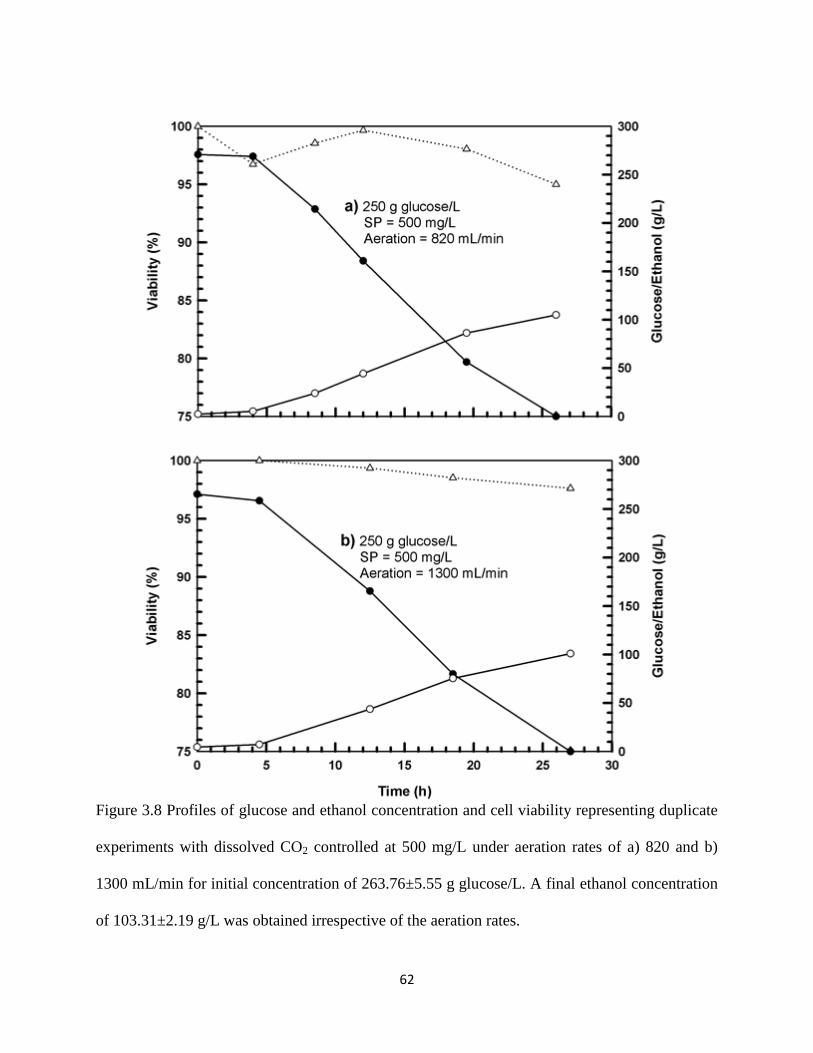
62
Figure 3.8 Profiles of glucose and ethanol concentration and cell viability representing duplicate
experiments with dissolved CO2 controlled at 500 mg/L under aeration rates of a) 820 and b)
1300 mL/min for initial concentration of 263.76±5.55 g glucose/L. A final ethanol concentration
of 103.31±2.19 g/L was obtained irrespective of the aeration rates.
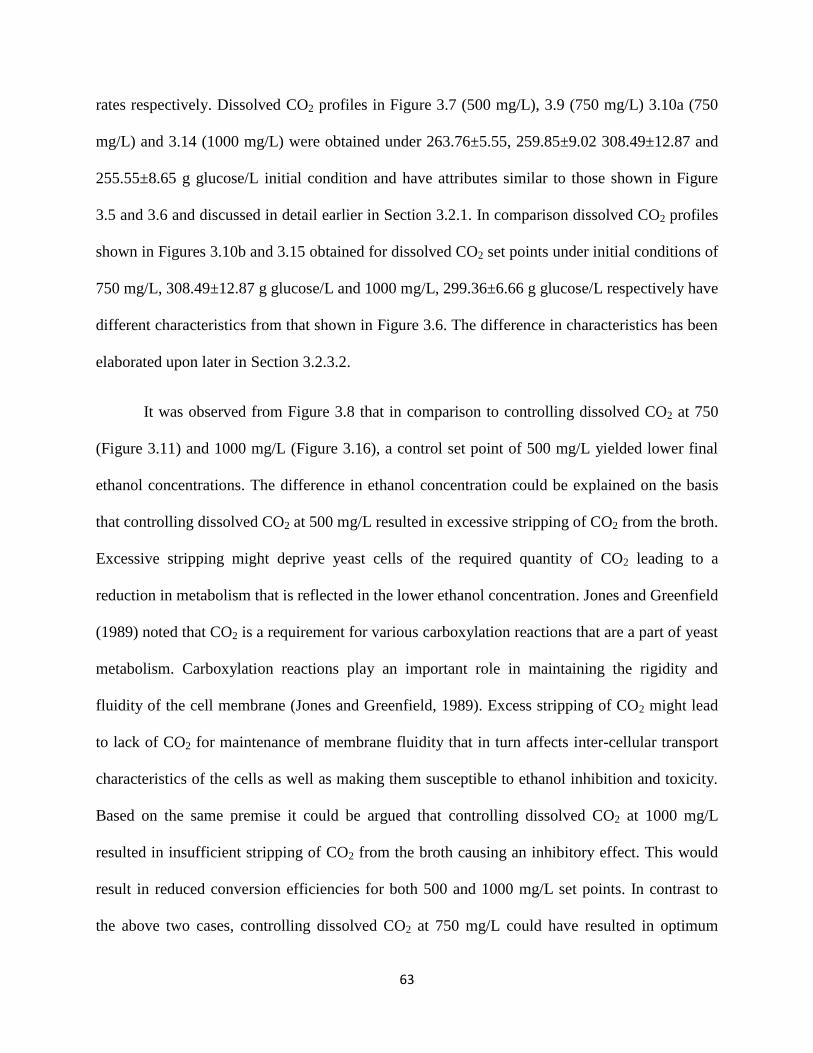
63
rates respectively. Dissolved CO2 profiles in Figure 3.7 (500 mg/L), 3.9 (750 mg/L) 3.10a (750
mg/L) and 3.14 (1000 mg/L) were obtained under 263.76±5.55, 259.85±9.02 308.49±12.87 and
255.55±8.65 g glucose/L initial condition and have attributes similar to those shown in Figure
3.5 and 3.6 and discussed in detail earlier in Section 3.2.1. In comparison dissolved CO2 profiles
shown in Figures 3.10b and 3.15 obtained for dissolved CO2 set points under initial conditions of
750 mg/L, 308.49±12.87 g glucose/L and 1000 mg/L, 299.36±6.66 g glucose/L respectively have
different characteristics from that shown in Figure 3.6. The difference in characteristics has been
elaborated upon later in Section 3.2.3.2.
It was observed from Figure 3.8 that in comparison to controlling dissolved CO2 at 750
(Figure 3.11) and 1000 mg/L (Figure 3.16), a control set point of 500 mg/L yielded lower final
ethanol concentrations. The difference in ethanol concentration could be explained on the basis
that controlling dissolved CO2 at 500 mg/L resulted in excessive stripping of CO2 from the broth.
Excessive stripping might deprive yeast cells of the required quantity of CO2 leading to a
reduction in metabolism that is reflected in the lower ethanol concentration. Jones and Greenfield
(1989) noted that CO2 is a requirement for various carboxylation reactions that are a part of yeast
metabolism. Carboxylation reactions play an important role in maintaining the rigidity and
fluidity of the cell membrane (Jones and Greenfield, 1989). Excess stripping of CO2 might lead
to lack of CO2 for maintenance of membrane fluidity that in turn affects inter-cellular transport
characteristics of the cells as well as making them susceptible to ethanol inhibition and toxicity.
Based on the same premise it could be argued that controlling dissolved CO2 at 1000 mg/L
resulted in insufficient stripping of CO2 from the broth causing an inhibitory effect. This would
result in reduced conversion efficiencies for both 500 and 1000 mg/L set points. In contrast to
the above two cases, controlling dissolved CO2 at 750 mg/L could have resulted in optimum
64
stripping of CO2 so as to not only diminish the effect of inhibition but also support cell
maintenance at optimum levels for efficient ethanol production. Ethanol concentrations in the
fermentation broth exceeding ~90 g/L (Figure 3.8, 3.11 and 3.16) also tend to exacerbate the
aforementioned effects. Reduction in glucose consumption rates are also a possibility as a result.
3.2.3.1.2 Effect of oxygen supply
While the hypothesis stated earlier explains the differences among the set points based on
dissolved CO2 concentration, it did not explain the effect that aeration would have on these
dissolved CO2 levels. Two different aeration rates (820 and 1300 mL/min) were studied for the
purpose of stripping dissolved CO2 from the fermentation broth to achieve control. Generally
aeration rates were seen to be interrelated to the dissolved CO2 set points.
Dissolved oxygen concentrations in VHG broths are less in comparison to their low
gravity counterparts because of the higher gravity and viscosity (Schumpe and Deckwer, 1979;
Schumpe et al., 1982). The need for oxygen during fermentation is further necessitated by the
very nature of the process itself. Although ethanol production in yeast is essentially anaerobic,
yeast growth and proliferation require oxygen. Furthermore, the production of a primary
metabolite like ethanol is dependent on yeast growth. Aeration improves the dissolved O2 level
in the broth leading to increase in cell viability (Fornairon-Bonnefond et al., 2002; Ligthelm et
al., 1988; Verduyn et al., 1990).
Yeast viability in the absence of air supply was observed to characteristically reduce with
the progress of batch fermentation (Figure 3.4). This was not just due to progressive substrate
depletion but also a concomitant increase in ethanol concentrations. Ethanol concentrations over
40 g/L are known to cause inhibitions for yeast growth while concentrations over 85 g/L result in
65
cell death due to toxicity (Lin et al., 2010; Liu et al., 2011a, 2011b). Hence, it is possible that
supply of oxygen could have improved the ethanol tolerance of yeast resulting in higher cell
viabilities. Figures 3.8 shows cell viabilities to be over 90% for the entire duration of
fermentation when compared to those seen in Figure 3.4 for batches without control. Higher
viabilities not only result in higher CO2 production (as a result of increase in CER(t)) but also
result in faster consumption of glucose resulting in shorter durations in comparison to batches
without control (Table 3.1).
However more oxygen does not necessarily result in a parallel increase in fermentation
performance. Higher aeration in cases where dissolved CO2 was controlled at 500 mg/L could
have also resulted in hyperoxia eventually facilitating a reduction in cell metabolism (Belo et al.,
2003; Fornairon-Bonnefond et al., 2002) and hence a lower conversion efficiency and final
ethanol concentration. An argument could also be made that excess oxygen supplied could have
diverted the metabolic flux towards biomass generation rather than ethanol production resulting
in reduced efficiencies but not significant reduction in productivities (Zeng and Deckwer, 1994).
Based on the hypothesis that controlling dissolved CO2 at 500 mg/L not only resulted in
excessive stripping of CO2 from the broth but also excessive oxygenation leading to hyperoxia it
was postulated that control of dissolved CO2 at 500 mg/L would have lower conversion
efficiency than when dissolved CO2 was controlled at 750 mg/L. Hence, it was decided not to
control dissolved CO2 at 500 mg/L for ~300 g glucose/L. Subsequently it would also be proved
in Section 3.2.4 that controlling dissolved CO2 at 500 mg/L for ~250 g glucose/L was indeed
inefficient despite the similarity in the duration of fermentation among the different control set
points.
66
3.2.3.2 Dissolved Carbon dioxide Controlled at 750 mg/L
In VHG fermentation initial glucose concentration was seen to play an important role in
determining the duration of every batch of fermentation. Seeing how two different initial glucose
concentrations were fermented using the same dissolved CO2 control set point, it was necessary
to discuss the effects such a control had on various measurable parameters like the concentration
profiles of dissolved CO2, glucose, ethanol and biomass. The dissolved CO2 profiles for control
at 750 mg/L under different aeration rates and initial glucose concentrations are shown in Figure
3.9 and 3.10. Figure 3.11 illustrates the corresponding glucose, ethanol and biomass
concentration and cell viability profiles.
3.2.3.2.1 Effect on dissolved carbon dioxide profiles
Although, characteristics of dissolved CO2 profiles for ~250 g glucose/L when dissolved
CO2 was controlled at 750 mg/L (Figure 3.9), resembled that shown in Figure 3.5 and discussed
in Section 3.2.1, it was observed that dissolved CO2 profiles differed from Figure 3.6 for the case
of ~300 g glucose/L (Figure 3.10b) depending on the set point as well as the aeration rate used to
achieve control. It was observed that the difference between Figure 3.10b and Figure 3.6 was
restricted to Region II of Figure 3.6 or Figure 3.10a. In Section 3.2.1 it was established that the
increase in dissolved CO2 concentration over the set point value in Region II of Figures 3.5 and
3.6, despite the presence of control could be due to a combination of physiochemical as well as
biological processes. While yeast metabolism was the only biological activity in the fermenter,
discussions on physiochemical processes were restricted to CO2 desorption. Based on this
postulation it was deduced that the rise in dissolved CO2 concentration was a result of increased
yeast activity and increased CO2 dissolution.
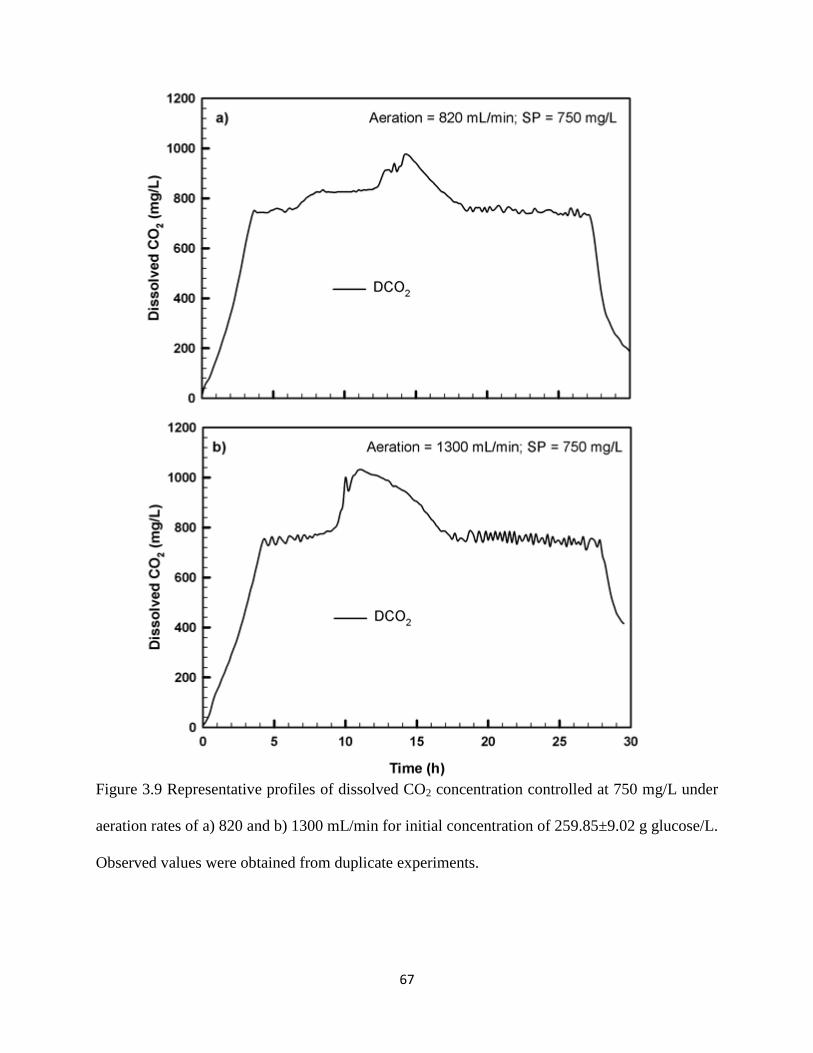
67
Figure 3.9 Representative profiles of dissolved CO2 concentration controlled at 750 mg/L under
aeration rates of a) 820 and b) 1300 mL/min for initial concentration of 259.85±9.02 g glucose/L.
Observed values were obtained from duplicate experiments.
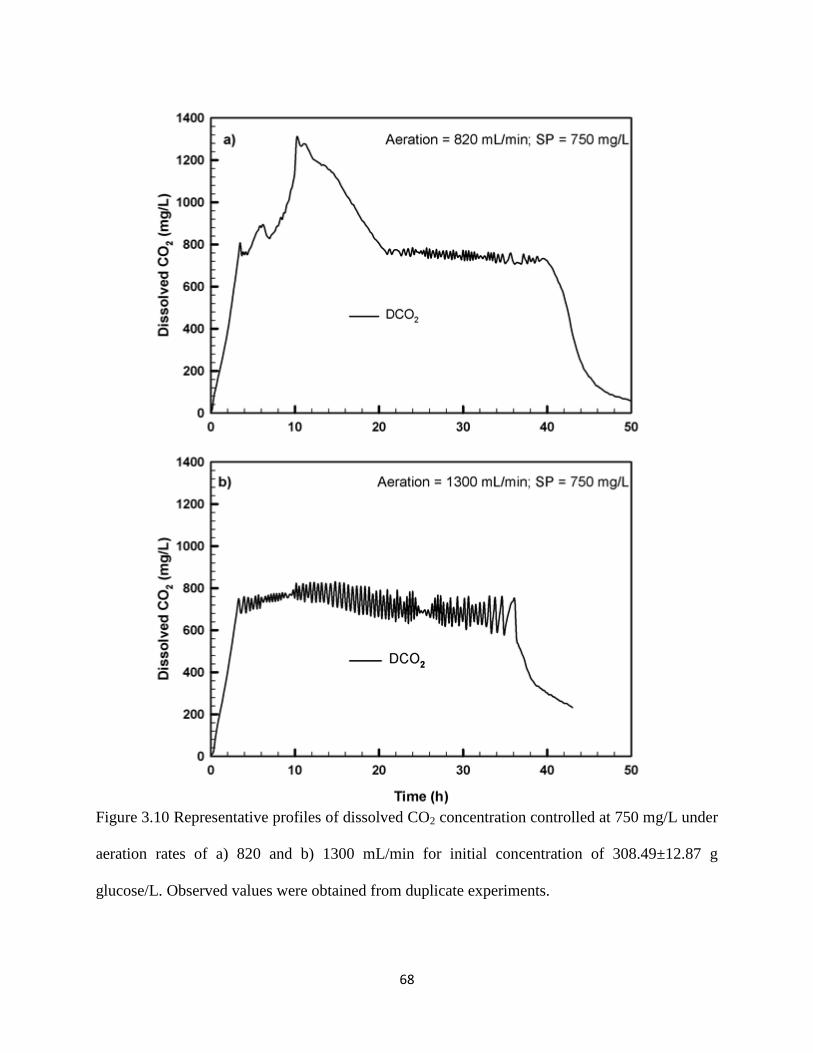
68
Figure 3.10 Representative profiles of dissolved CO2 concentration controlled at 750 mg/L under
aeration rates of a) 820 and b) 1300 mL/min for initial concentration of 308.49±12.87 g
glucose/L. Observed values were obtained from duplicate experiments.
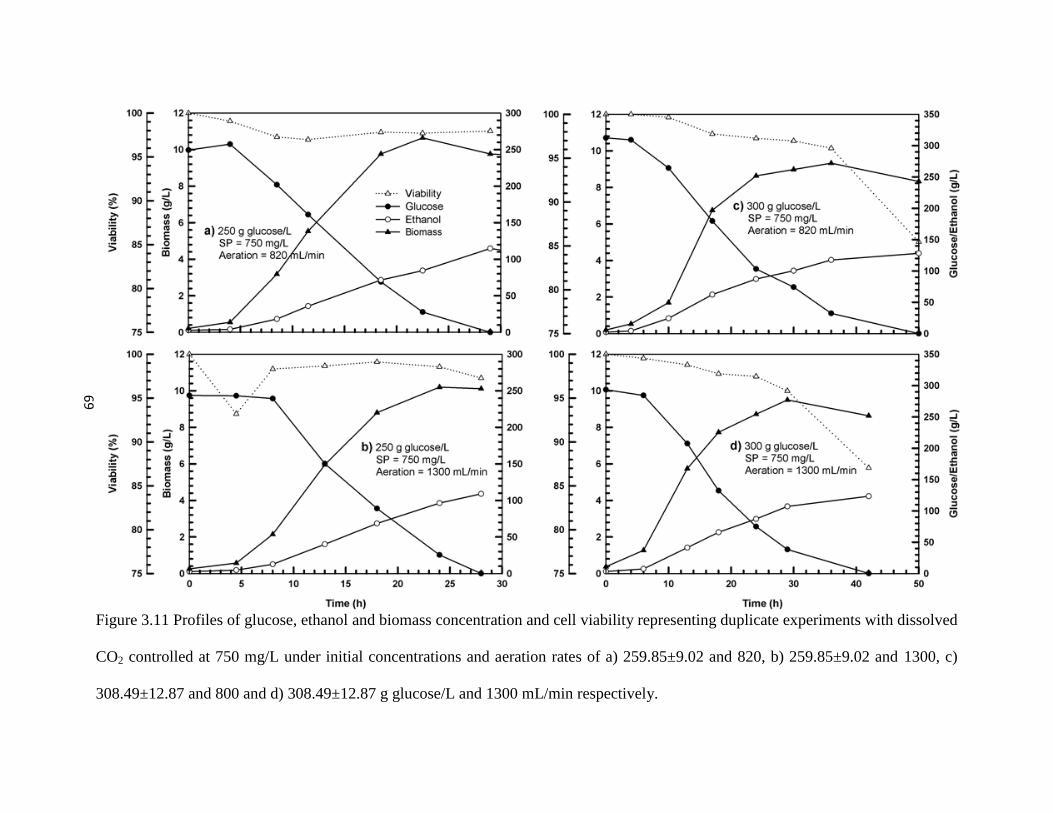
Figure 3.11 Profiles of glucose, ethanol and biomass concentration and cell viability representing duplicate experiments with dissolved
CO2 controlled at 750 mg/L under initial concentrations and aeration rates of a) 259.85±9.02 and 820, b) 259.85±9.02 and 1300, c)
308.49±12.87 and 800 and d) 308.49±12.87 g glucose/L and 1300 mL/min respectively.
69
70
Therefore, the loss of resemblance between Figures 3.10a and b in Region II was construed as a
lack of increase in yeast activity as well as improved stripping of dissolved CO2. These effects
could arise due to various reasons.
The first and foremost reason could be the higher osmotic pressure in the case of ~300 g
glucose/L. In comparison to the ~250 g glucose/L case, initial concentrations of ~300 g
glucose/L experience higher osmosis. This could be witnessed in the slow rate of decrease of
glucose concentration as well as slow rate of increase in biomass concentration in Figure 3.11c
and 3.11d when compared to that seen in Figure 3.11a and 3.11b. Osmosis could also explain the
higher duration of fermentation required for ~300 g glucose/L to attain zero residual glucose
(Table 3.1). On the other hand, the higher quantity of substrate supplied to the fermenter may in
itself be responsible for the longer duration required to completely exhaust glucose to mark the
end of fermentation in the case of ~300 g glucose/L.
It could be argued that certain physiochemical effects pertaining to the solubility of CO2
in the fermentation broth could have also affected the dissolved CO2 profiles. Chief among them
are broth viscosity and pH. Viscosity of the fermentation broth increases with increase in specific
gravity of the broth or an increase in the initial glucose concentration. Increased broth viscosity
not only lowers the solubility of oxygen but also improves the binding of dissolved CO2 to the
protein molecules present in the broth (Dixon and Kell, 1989; Ho and Shanahan, 1986).
Increased binding reduces the rate and quantity of CO2 desorption from the broth thereby
enhancing dissolved CO2 accumulation and inhibition as well. As for pH, it is known to affect
the equilibrium of dissolved CO2 mentioned in Equation (1.4-1.5). Lower pH favors the presence
of CO2 as dissolved CO2. Fermentation broth pH is known to drop from 5.5 to 3.9 when left
uncontrolled with the progress of fermentation thereby facilitating CO2 dissolution rather than
71
desorption. Thus viscosity and pH do not play a significant role towards the effects observed in
Region II of the dissolved CO2 profiles for 300 g glucose/L in Figures 3.10.
The second reason for a lack of resemblance in Region II could be the aeration rate. A
lower CER(t) as a result of osmosis combined with a higher aeration rate results in removing
excess dissolved CO2 thereby preventing net accumulation in Region II of Figure 3.10b as
opposed to that seen in Figures 3.5-3.6 or Figure 3.10a.
3.2.3.2.2 Effect on aeration
It was earlier pointed out in Section 3.2.3.1.2 that the effect brought about by a change in
aeration rate is interrelated with that brought about by change in dissolved CO2 set point for a
given glucose concentration. Higher set points would mean lesser CO2 would have to be
removed in comparison to its lower set point equivalent. This would mean that lesser quantity of
air is needed to remove the corresponding dissolved CO2 accumulated in the broth. This can be
verified from Figure 3.12 illustrating the quantity of oxygen supplied for each case. Data shown
in Figure 3.12 was estimated with the assumption that 21% of air was oxygen by volume under
experimental conditions. Considering the fact that the duration of fermentation as well as control
did not vary much between the two aeration rates for a given glucose concentration it is no
surprise that more oxygen was bubbled through when higher aeration rates were used. It can
also be noted from this figure that the quantity of oxygen bubbled through decreases
progressively with increase in the dissolved CO2 set point. Hence, the quantity of oxygen
bubbled through for control at 750 mg/L was lower than the case of 500 mg/L when initial
glucose was at ~250 g/L. But, the difference in the duration of fermentation is seen to have
impacted the quantity of oxygen bubbled through for the case of ~300 g glucose/L with
dissolved CO2 controlled at 750 mg/L (Figure 3.12). .
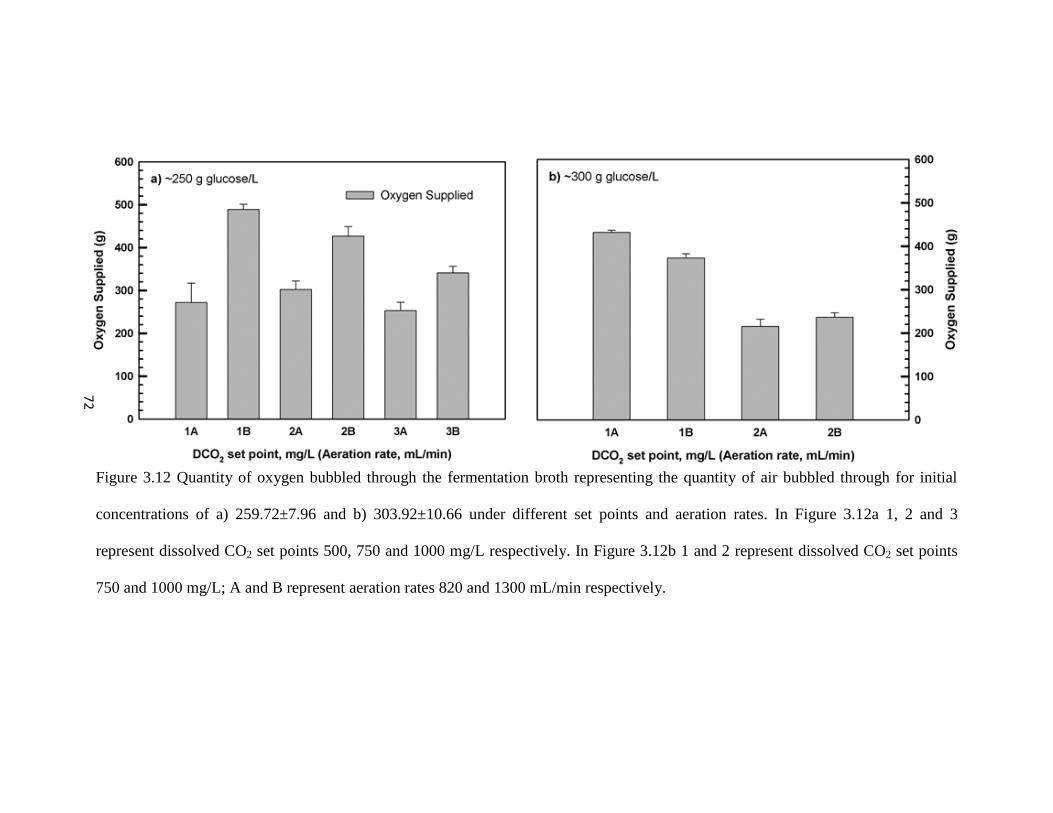
Figure 3.12 Quantity of oxygen bubbled through the fermentation broth representing the quantity of air bubbled through for initial
concentrations of a) 259.72±7.96 and b) 303.92±10.66 under different set points and aeration rates. In Figure 3.12a 1, 2 and 3
represent dissolved CO2 set points 500, 750 and 1000 mg/L respectively. In Figure 3.12b 1 and 2 represent dissolved CO2 set points
750 and 1000 mg/L; A and B represent aeration rates 820 and 1300 mL/min respectively.
72
73
Here the trend in the quantity of oxygen supplied is reversed, i.e. a higher quantity of oxygen is
supplied when control is achieved using an aeration rate of 820 mL/min than when an aeration
rate of 1300 mL/min is used (Figure 3.12). This difference has solely been attributed to the
longer duration of fermentation under aeration rates of 820 mL/min (Table 3.1) in comparison to
aeration rates of 1300 mL/min for ~300 g glucose/L. The longer duration also explains the
general increase in the quantity of oxygen supplied for the case of ~300 g glucose/L when
compared to the case of ~250 g glucose/L for both dissolved CO2 set points of 750 and 1000
mg/L.
It is highly probable that the higher quantity of oxygen supplied was in part also
responsible for the distinction seen in Region II of Figure 3.10b from Figure 3.10a. Higher
aeration in conjunction with higher dissolved CO2 set points result in more efficient stripping of
CO2 from the broth and prevents net accumulation of dissolved CO2. Reduction in metabolic
activity also plays an important role as it results in reduced net CER(t).
3.2.3.2.3 Effect on metabolite consumption and production
Controlling dissolved CO2 at 750 mg/L yielded the highest final ethanol concentration
amongst the three set points for 250 g glucose/L (Figure 3.11). While rate of change of ethanol
concentration did not vary much with aeration rates, they varied with initial glucose
concentrations. Slower change in ethanol as well as biomass concentration was observed with
increase in initial glucose concentration (Figure 3.11). This was reasoned to be due to higher
osmosis in higher glucose concentrations during the first 10-12 h of fermentation.
74
However, during the later stages of fermentation the above said reasoning would not hold
when glucose concentrations have reduced and osmosis is negligible (glucose concentrations
after 12-15 h are lower than ~150 g/L for 250 g glucose/L and ~200 g/L for 300 g glucose/L). In
comparison, the ethanol concentrations at this point are higher than their initial values and over
the inhibitory concentration of 40 g/L (Figure 3.11). While this would explain the decrease in
growth as well as associated glucose consumption and ethanol production in the case of ~250 g
glucose/L, it would also explain the reduced cell viabilities seen in the case of ~300 g glucose/L
despite oxygen supply. Although controlling dissolved CO2 at 750 mg/L improved fermentations
for both initial glucose concentrations, fermentation was longer for ~300 g glucose/L (Table 3.1)
along with a need for increased air supply (Figure 3.12).
Glucose and ethanol aside, glycerol was one other metabolite whose concentrations
followed a particular trend with variation in glucose concentrations (Figure 3.13). There were no
appreciable differences in glycerol concentration with changes in aeration rate and dissolved CO2
set points. Despite the fact that supply of oxygen results in alleviating oxidative stresses
associated with reduced dissolved oxygen concentration, glycerol concentrations increase with
increasing initial glucose (Figure 3.13). While the increase in substrate alone could not result in
an increase in glycerol, it stands to reason that other associated factors may also be responsible.
These factors may include but not limited to the higher osmotic pressure as well as ethanol
inhibition and toxicity seen with increasing glucose concentrations.
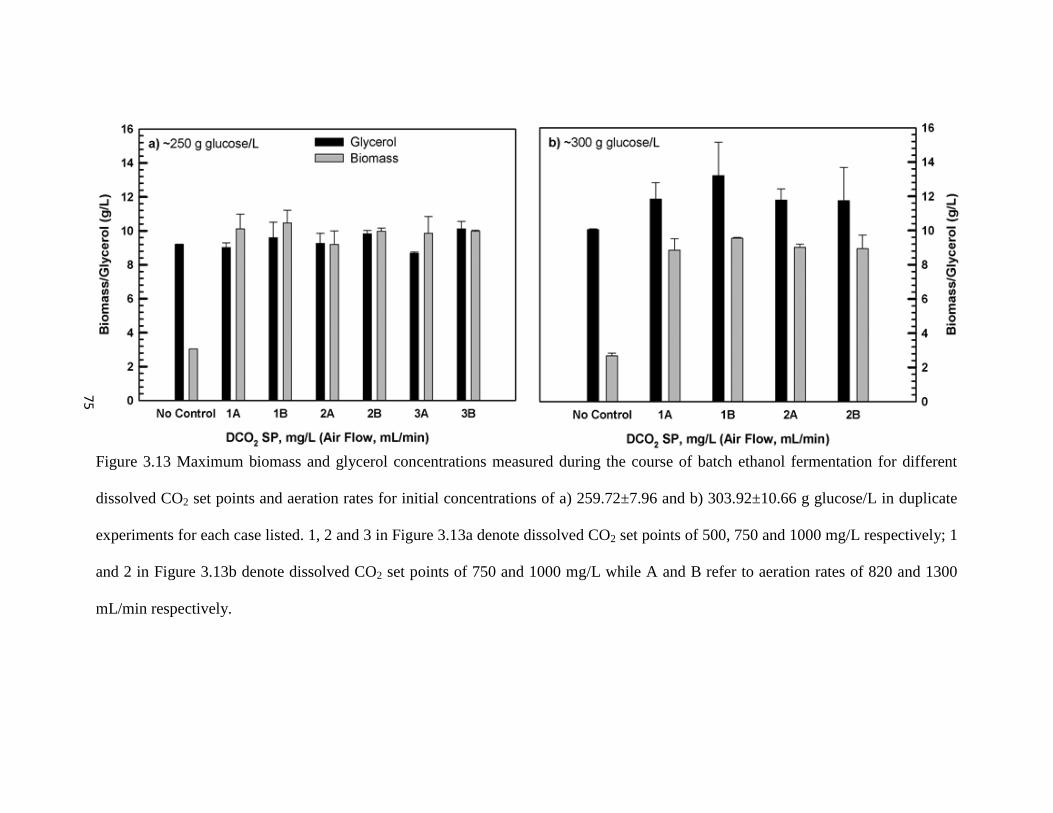
Figure 3.13 Maximum biomass and glycerol concentrations measured during the course of batch ethanol fermentation for different
dissolved CO2 set points and aeration rates for initial concentrations of a) 259.72±7.96 and b) 303.92±10.66 g glucose/L in duplicate
experiments for each case listed. 1, 2 and 3 in Figure 3.13a denote dissolved CO2 set points of 500, 750 and 1000 mg/L respectively; 1
and 2 in Figure 3.13b denote dissolved CO2 set points of 750 and 1000 mg/L while A and B refer to aeration rates of 820 and 1300
mL/min respectively.
75
76
3.2.3.2.4 Effect on yeast growth and viability
Changes in yeast growth and survival characteristics also tend to affect metabolite
consumption and production patterns. As pointed out earlier controlling dissolved CO2 at 750
mg/L could be the optimum level in relation to the quantity of CO2 stripped as well as oxygen
supplied. This could have resulted in not only the increased cell viabilities explained earlier but
consequential higher biomass concentrations relative to the VHG fermentation batches without
control (Figure 3.13). However, differences in biomass concentration and cell viability profiles
were observed between the two glucose concentrations (Figure 3.11).
Yeast growth is affected in the lag phase due to osmosis associated with high glucose
concentrations. Osmosis not only leads to slower growth but also to slower ethanol production as
noted in the previous section (Figure 3.11). But, this does not explain the reduction in the
maximum biomass concentration with increase in glucose concentration (Figures 3.11 and 3.13).
This observation has been made despite the higher viabilities seen in the case of ~300 g
glucose/L (Figure 3.11c and 3.11d). It is expected that the higher ethanol concentrations are
responsible for this effect. Although in comparison to the 250 g glucose/L case, ethanol
concentrations are at similar levels (~110 g/L) for 300 g glucose/L at 30 h of fermentation, it is
likely that despite the increase in cell viability, cell tolerance to higher ethanol concentrations is
reduced with increase in glucose concentration. This would not only explain the reduction in
ethanol production with increase in broth ethanol concentration but also the concomitant
reduction in cell viabilities with the progress of fermentation for ~300 g glucose/L in comparison
to ~250 g glucose/L (Figure 3.11a and 3.11b). The associated reduction in cell metabolism and
growth should also explain the lower biomass concentrations observed for the case of ~300 g
glucose/L especially during the final stages of fermentation.
77
3.2.3.3 Dissolved Carbon dioxide Controlled at 1000 mg/L
While controlling dissolved CO2 at 750 mg/L had a plethora of positive influence on
fermentation performance, controlling dissolved CO2 at 1000 mg/L did not significantly change
the interpretation of fermentation performance. These changes although insignificant, were
observed due to change in the initial glucose concentration. Figure 3.14 and 3.15 show the
dissolved CO2 profiles under ~250 and ~300 g glucose/L initial concentration for different
aeration rates respectively. The corresponding glucose, ethanol and biomass concentration and
cell viability profiles are plotted in Figure 3.16.
3.2.3.3.1 Effect on dissolved carbon dioxide profile
As explained earlier and illustrated in Figure 3.5, 3.6 and 3.10 differences in dissolved
CO2 profiles between ~250 and ~300 g glucose/L were restricted to Region II. All arguments
pertaining to this effect were presented earlier in Section 3.2.3.2.1 and no deviations from
phenomenon observed in Figure 3.10b were observed in Figure 3.15, i.e., Region II in Figure
3.15 was similar to Region II of Figure 3.10b. Thus, distinctions in the dissolved CO2 profiles are
glucose concentration dependent rather than set point or aeration dependent.
3.2.3.3.2 Effect on aeration
Lower oxygen supply and a higher dissolved CO2 set point could be blamed for increase
in CO2 inhibition in the broth. However, inhibitory effects due to dissolved CO2 do remain to be
seen and studied before such a justification could be made. The observed cell viabilities (>90%)
and biomass concentrations in both ~250 and ~300 g glucose/L (Figure 3.16) stand witness to the
fact that yeast metabolism is not inhibited at the macroscopic level. Lower oxygen supply for
dissolved CO2 controlled at 1000 mg/L seen in Figure 3.12 could be justified in terms of the
shorter fermentation duration seen for these cases in comparison to control at 750 mg/L (Table
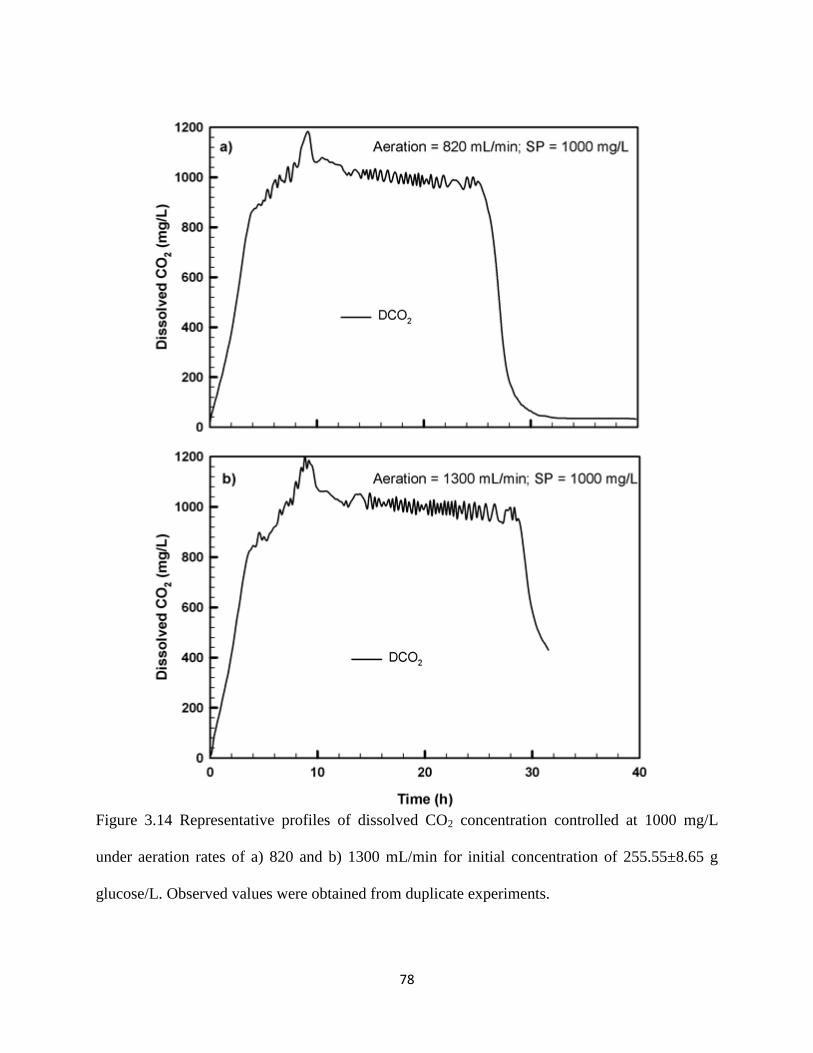
78
Figure 3.14 Representative profiles of dissolved CO2 concentration controlled at 1000 mg/L
under aeration rates of a) 820 and b) 1300 mL/min for initial concentration of 255.55±8.65 g
glucose/L. Observed values were obtained from duplicate experiments.
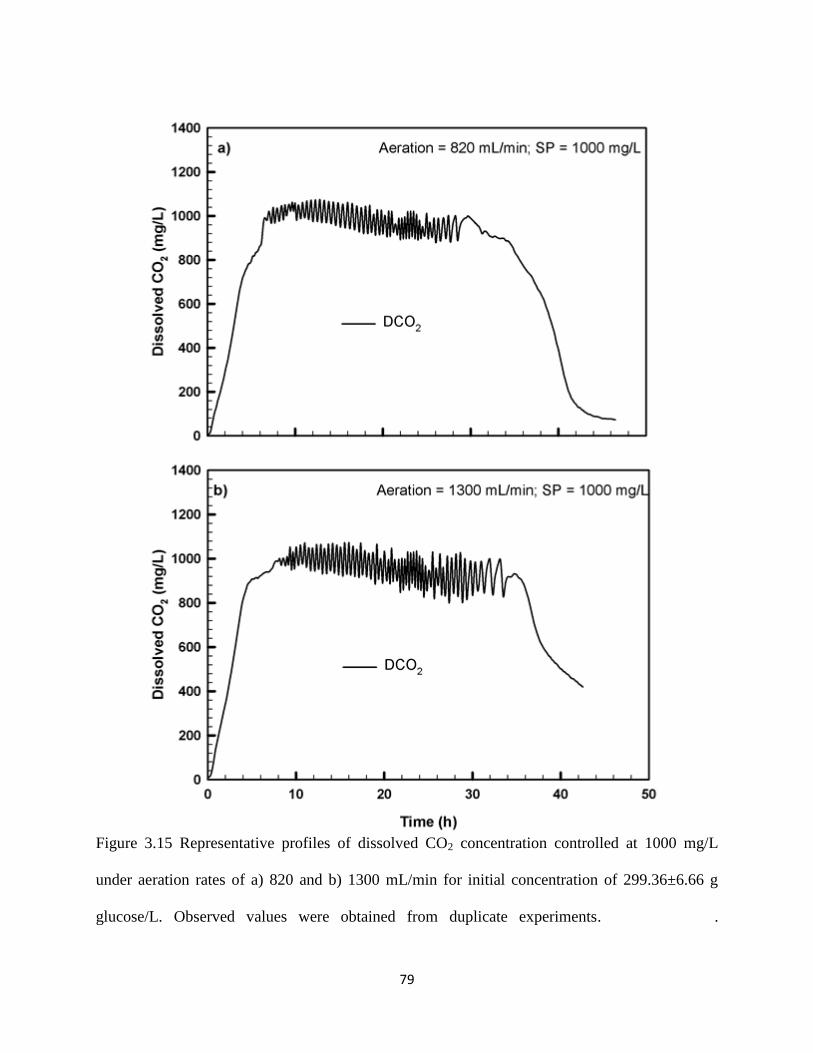
79
Figure 3.15 Representative profiles of dissolved CO2 concentration controlled at 1000 mg/L
under aeration rates of a) 820 and b) 1300 mL/min for initial concentration of 299.36±6.66 g
glucose/L. Observed values were obtained from duplicate experiments. .
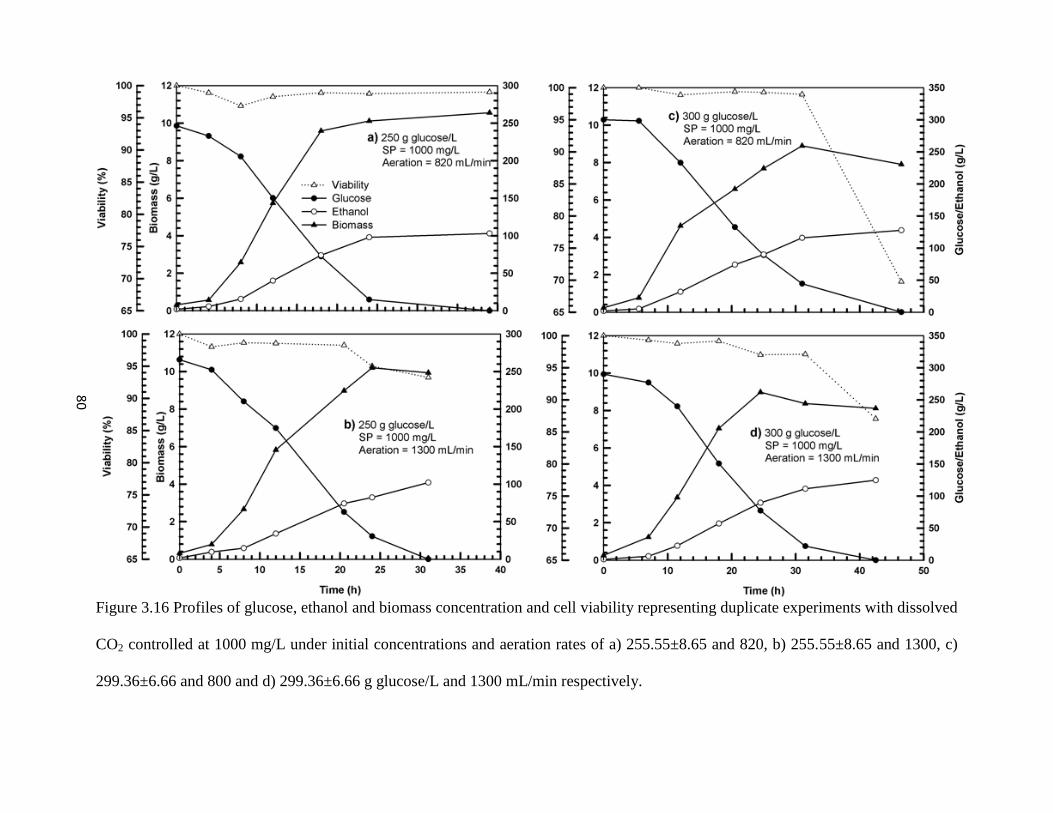
Figure 3.16 Profiles of glucose, ethanol and biomass concentration and cell viability representing duplicate experiments with dissolved
CO2 controlled at 1000 mg/L under initial concentrations and aeration rates of a) 255.55±8.65 and 820, b) 255.55±8.65 and 1300, c)
299.36±6.66 and 800 and d) 299.36±6.66 g glucose/L and 1300 mL/min respectively.
80
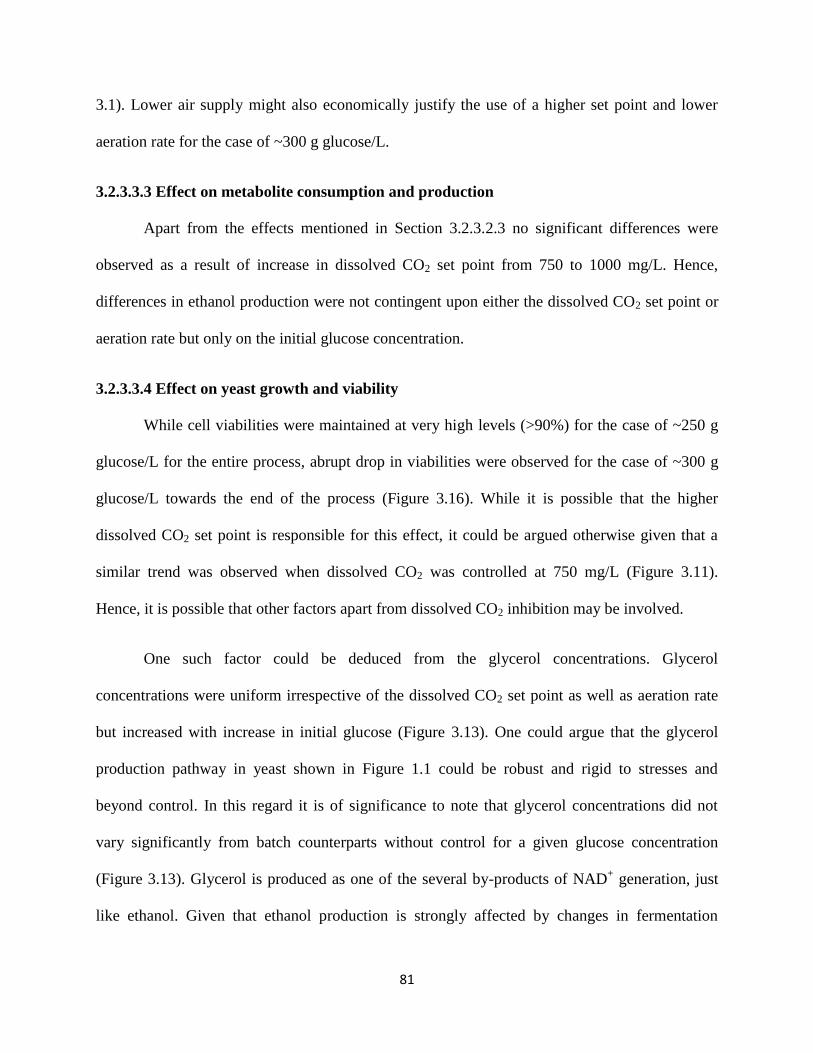
81
3.1). Lower air supply might also economically justify the use of a higher set point and lower
aeration rate for the case of ~300 g glucose/L.
3.2.3.3.3 Effect on metabolite consumption and production
Apart from the effects mentioned in Section 3.2.3.2.3 no significant differences were
observed as a result of increase in dissolved CO2 set point from 750 to 1000 mg/L. Hence,
differences in ethanol production were not contingent upon either the dissolved CO2 set point or
aeration rate but only on the initial glucose concentration.
3.2.3.3.4 Effect on yeast growth and viability
While cell viabilities were maintained at very high levels (>90%) for the case of ~250 g
glucose/L for the entire process, abrupt drop in viabilities were observed for the case of ~300 g
glucose/L towards the end of the process (Figure 3.16). While it is possible that the higher
dissolved CO2 set point is responsible for this effect, it could be argued otherwise given that a
similar trend was observed when dissolved CO2 was controlled at 750 mg/L (Figure 3.11).
Hence, it is possible that other factors apart from dissolved CO2 inhibition may be involved.
One such factor could be deduced from the glycerol concentrations. Glycerol
concentrations were uniform irrespective of the dissolved CO2 set point as well as aeration rate
but increased with increase in initial glucose (Figure 3.13). One could argue that the glycerol
production pathway in yeast shown in Figure 1.1 could be robust and rigid to stresses and
beyond control. In this regard it is of significance to note that glycerol concentrations did not
vary significantly from batch counterparts without control for a given glucose concentration
(Figure 3.13). Glycerol is produced as one of the several by-products of NAD+ generation, just
like ethanol. Given that ethanol production is strongly affected by changes in fermentation
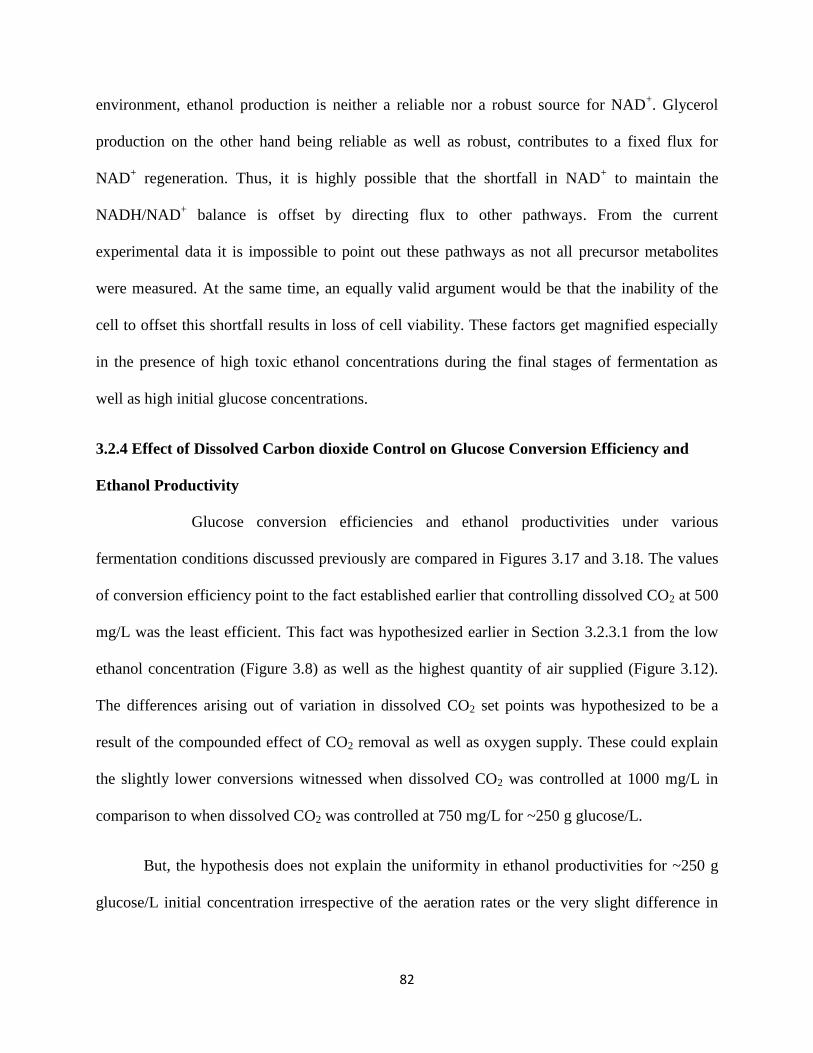
82
environment, ethanol production is neither a reliable nor a robust source for NAD+. Glycerol
production on the other hand being reliable as well as robust, contributes to a fixed flux for
NAD+ regeneration. Thus, it is highly possible that the shortfall in NAD
+ to maintain the
NADH/NAD+ balance is offset by directing flux to other pathways. From the current
experimental data it is impossible to point out these pathways as not all precursor metabolites
were measured. At the same time, an equally valid argument would be that the inability of the
cell to offset this shortfall results in loss of cell viability. These factors get magnified especially
in the presence of high toxic ethanol concentrations during the final stages of fermentation as
well as high initial glucose concentrations.
3.2.4 Effect of Dissolved Carbon dioxide Control on Glucose Conversion Efficiency and
Ethanol Productivity
Glucose conversion efficiencies and ethanol productivities under various
fermentation conditions discussed previously are compared in Figures 3.17 and 3.18. The values
of conversion efficiency point to the fact established earlier that controlling dissolved CO2 at 500
mg/L was the least efficient. This fact was hypothesized earlier in Section 3.2.3.1 from the low
ethanol concentration (Figure 3.8) as well as the highest quantity of air supplied (Figure 3.12).
The differences arising out of variation in dissolved CO2 set points was hypothesized to be a
result of the compounded effect of CO2 removal as well as oxygen supply. These could explain
the slightly lower conversions witnessed when dissolved CO2 was controlled at 1000 mg/L in
comparison to when dissolved CO2 was controlled at 750 mg/L for ~250 g glucose/L.
But, the hypothesis does not explain the uniformity in ethanol productivities for ~250 g
glucose/L initial concentration irrespective of the aeration rates or the very slight difference in
Figure 3.17 Glucose conversion efficiencies obtained in the presence of control for initial concentration of a) 259.72±7.96 and b)
303.92±10.66 g glucose/L from duplicate experiments. 1, 2 and 3 in Figure 3.17a denote dissolved CO2 set points of 500, 750 and
1000 mg/L respectively; 1 and 2 in Figure 3.17b denote dissolved CO2 set points of 750 and 1000 mg/L while A and B refer to
aeration rates of 820 and 1300 mL/min respectively. Conversion efficiency was calculated as [Ethanol Produced]
100 %[Glucose Consumed] 0.511
83
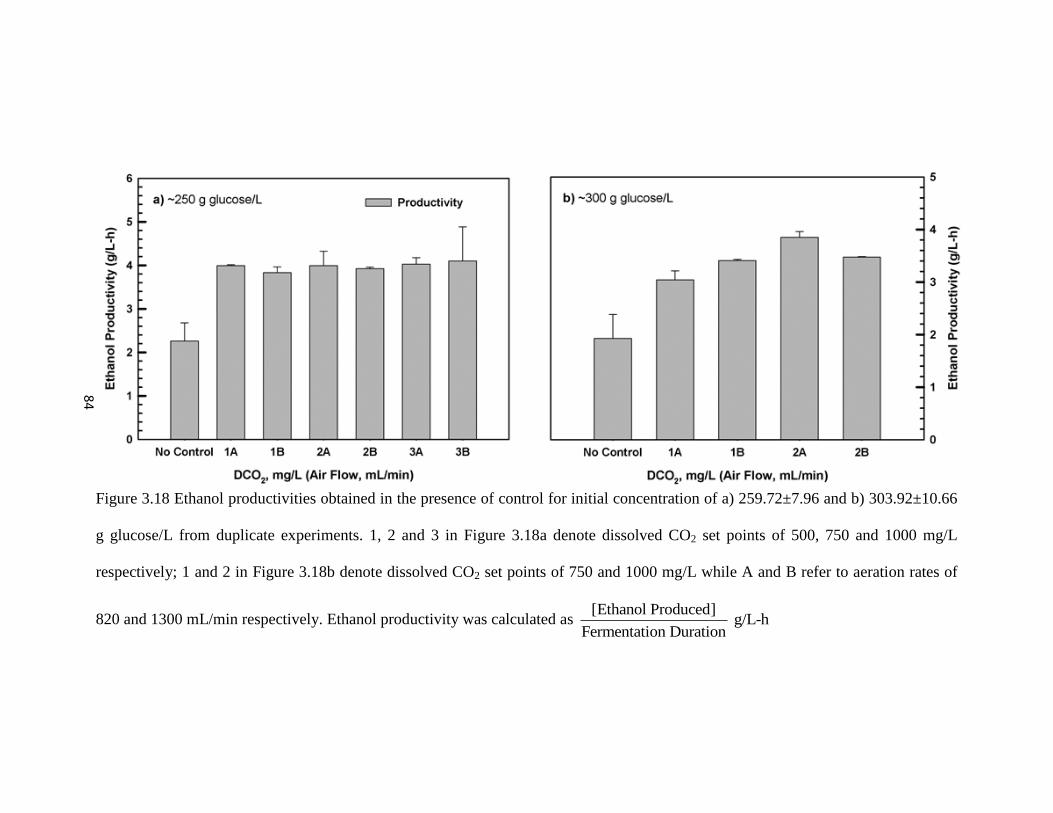
Figure 3.18 Ethanol productivities obtained in the presence of control for initial concentration of a) 259.72±7.96 and b) 303.92±10.66
g glucose/L from duplicate experiments. 1, 2 and 3 in Figure 3.18a denote dissolved CO2 set points of 500, 750 and 1000 mg/L
respectively; 1 and 2 in Figure 3.18b denote dissolved CO2 set points of 750 and 1000 mg/L while A and B refer to aeration rates of
820 and 1300 mL/min respectively. Ethanol productivity was calculated as [Ethanol Produced]
g/L-hFermentation Duration
84
85
conversion efficiencies between 750 and 1000 mg/L for either glucose concentrations (Figure
3.18). It is possible that bubbling of air for dissolved CO2 control is responsible for this effect.
Air bubbling is also known to have a positive influence on the physiochemical aspects of
fermentation. Air bubbling not only strips dissolved CO2 from the broth but also increases the
concentration of cells that are in suspension. Increase in the suspended cell concentration
improves mass transfer. The summation of these effects could explain the very small variation in
conversion efficiencies among the 750 and 1000 mg/L dissolved CO2 set points for different
aeration rates under a given initial glucose concentration.
Increase in suspended cell concentration could also explain the variations seen in the
biomass estimations of processes under control (Figure 3.11 and 3.16). Suspended cell
concentration is typically higher when air is being bubbled through the broth. In the absence of
any air bubbling, cells tend to precipitate from the fermentation broth. Since the final biomass
estimated is usually in the absence of any air bubbling, biomass estimations tend to be
significantly lower than a previous measurement. An increase in suspended cell concentration
translates into an increase in number of active cells. This combined with the higher viabilities
and higher biomass (Figure 3.13) could explain the higher fermentation rates and ethanol
productivities as seen in the form of reduced fermentation times and complete glucose utilization
even for glucose concentrations as high as 300 g/L. This physiochemical effect could also be
responsible for the higher ethanol productivities seen when dissolved CO2 was controlled at 1000
mg/L rather than at 750 mg/L for ~300 g glucose/L (Figure 3.19).
However, ethanol productivities and conversion efficiencies for ~300 g glucose/L were
lower than that of ~250 g glucose/L by 13.77±9.60 % and 2.27±5.27 % respectively irrespective
86
of the dissolved CO2 set points and aeration rates. The relatively lower biomass concentrations
(Figure 3.13) may be responsible in part for the reduced conversion efficiencies and ethanol
productivities seen in the ~300 g glucose/L case. In addition, longer duration of fermentation
(Table 3.1) in the case of ~300 g glucose/L could be a factor for decrease in ethanol
productivities. Longer durations in conjunction with higher osmosis and increasing ethanol
concentrations as the fermentation progresses also tend to induce collective inhibitory pressure in
this regard as explained earlier. In addition, physiochemical effects of lower pH and higher broth
viscosity exacerbate the inhibitory effects of dissolved CO2 thereby affecting fermentation
performance.
3.3 Comparison with Redox Potential Measurement and Profiles
3.3.1 Similarities between Dissolved carbon dioxide and Redox Potential Measurements
Relationship between dissolved CO2 and ORP profiles was established through their
mutual association to yeast growth in terms of similarities and contrasts between the two
measurement profiles. Figure 3.19 compares profiles of dissolved CO2 and ORP for VHG
ethanol fermentations in the presence of dissolved CO2 and ORP based control methodologies
under similar initial glucose of ~300 g/L. Visually, the two bath tub-shaped profiles are seen to
be mirror images of each other. Due to the nature of ORP measurement the scrutiny of this
discussion is restricted to the two major drawbacks of VHG ethanol fermentation; osmotic
effects due to high initial glucose feeds and inhibition and toxicity due to high final ethanol
concentrations. While osmotic effects increase the duration of the lag phase, ethanol inhibition
and toxicity reduce cell viability resulting in sluggish fermentations and incomplete substrate
utilization (Feng et al., 2012; Lin et al., 2010; Liu et al., 2011a). Hence, similarity between the
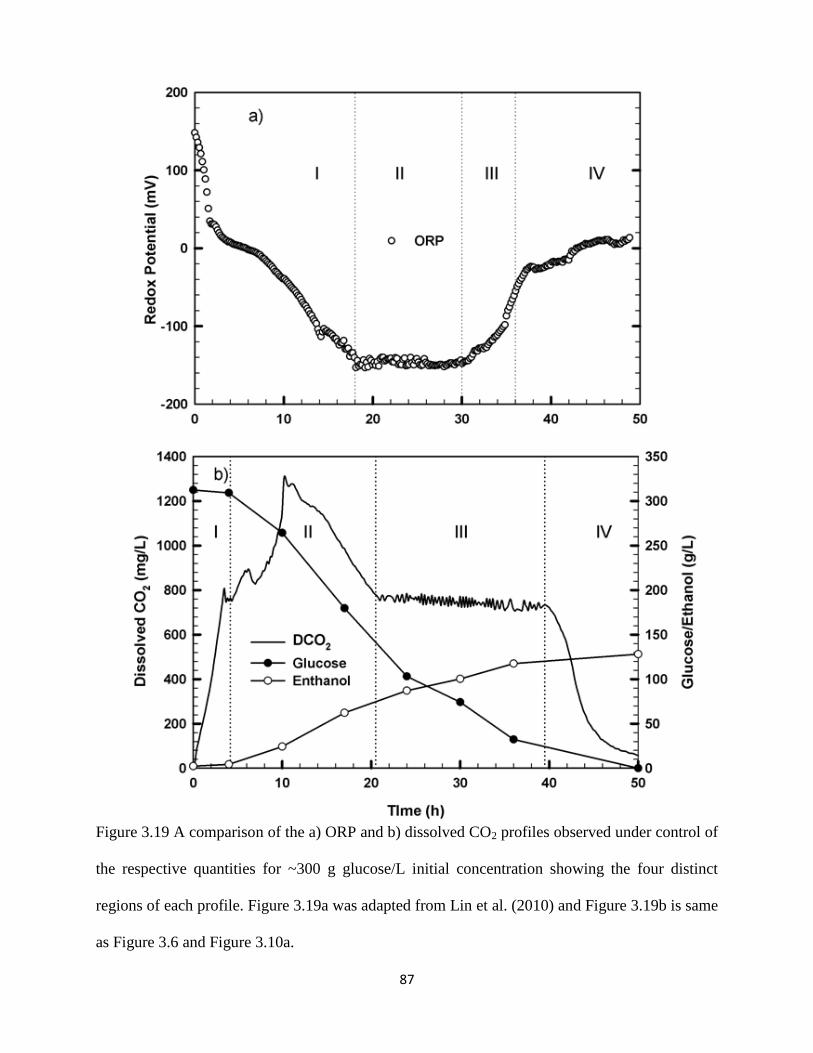
87
Figure 3.19 A comparison of the a) ORP and b) dissolved CO2 profiles observed under control of
the respective quantities for ~300 g glucose/L initial concentration showing the four distinct
regions of each profile. Figure 3.19a was adapted from Lin et al. (2010) and Figure 3.19b is same
as Figure 3.6 and Figure 3.10a.
88
measurement of ORP and dissolved CO2 are restricted to Regions I and IV of both profiles. The
increment in lag phase duration can be observed as a decrease in slope of the ORP and dissolved
CO2 curves in Region I of the respective figures (Figure 3.19). Region IV is a result of
decreasing yeast activity in both cases. In reference to Fig. 3.19b (Region IV) where VHG
fermentation was conducted under ~300 g glucose/L condition, it can be seen that the
concentration of ethanol is well beyond the toxic limit of 85 g/L, and glucose is nearly utilized.
In comparison, 12.53±11.06 g glucose/L was unfermented when ORP control was implemented.
Hence, it was hypothesized that although differences exist in Region IV in terms of the glucose
concentration represented by the two profiles, both measurements represent the common element
of cessation/reduction in yeast activity and conseuquential end of fermentation. ORP
measurements are capable of representing loss of cell viability as a result of ethanol toxicity but
not due to glucose exhaustion. In contrast, loss of cell activity or metabolism as a result of
substrate exhaustion was much more accurately represented and conspicuously observed in
fermentations with dissolved CO2 based control irrespective of the feed glucose concentrations.
3.3.2 Contrasts between Dissolved Carbon dioxide and Redox Potential Measurements
Although there are similarities that exist between the two measurements in terms of
physical and dynamic properties of the system they represent, these similarities do not extend
beyond Regions I and IV. The contrast between the two profiles on the other hand can be drawn
in terms of physio-chemical and biological factors that ultimately result in cessation of yeast
metabolism and hence fermentation. These contrasts focus on Regions II and III of either profile.
In Regions II and III although the profiles capture similar regions of yeast growth, the difference
in quantities they measure is the reason for their dissimilar nature. In Region II of the dissolved
89
CO2 curve, an increase in yeast activity is witnessed as a result of oxygen supplied to the system
(Section 3.2.1); while no change in activity is seen in the case of ORP (referring to Regions II).
Even if there were a change in activity, it is not possible to observe the change through
measurement of ORP. This is due to the very nature of ORP control that is based on maintaining
a redox balance in the system. Control action in case of ORP measurement is initiated in
response to imbalance of redox powers. Redox potential measurements are thus relative in
nature, constrained upon the initial electron/proton/redox activity in the fermentation broth. A
low initial redox potential would result in more air being pumped into the system to maintain the
redox balance during ORP control. In the case of dissolved CO2 based control, dissolved CO2 set
point values are based on the solubility of CO2 for a given media under given conditions of
temperature and pressure. Moreover, initial dissolved CO2 concentrations remain the same in the
absence of any yeast activity prior to inoculation, i.e. an accurate estimate of yeast activity can
be made for a given dissolved CO2 concentration based on the size of the inoculum, which is not
possible in case of ORP measurements. Hence, dissolved CO2 measurements are absolute unlike
their ORP counterparts. Evidently control of dissolved CO2 levels is not based on maintaining a
balance between relativistic measures but absolute measures instead.
Region III in the dissolved CO2 curve is very similar in appearance to Region II of the
ORP curve. While the zero slope regions in both the curves cannot be explained in terms of
either the glucose or ethanol concentrations, it can be seen that alteration in yeast activity if any,
due to the supply of air cannot be deciphered from the ORP curve. This is regarded as one of the
major drawbacks of using a relativistic measure to control VHG ethanol fermentations. These
similar regions (Region II in Fig. 3.19a and Region III in Fig. 3.19b) also represent regions of
perfect control in their respective cases; i.e., a balance between reduction and oxidation is
90
reached in case of ORP, and a balance between production and consumption of CO2 is reached in
case of dissolved CO2.
Thus, despite the similarities and contrasts between ORP and dissolved CO2
measurement, when used in conjunction with each other they shall be capable of representing
cessation of yeast metabolism due to both glucose exhaustion as well as ethanol toxicity.
91
CHAPTER 4
CONCLUSIONS
In the current study, a comprehensive analysis of the characteristics of dissolved CO2
concentration profiles obtained through direct measurement during fermentation was presented.
Dissolved carbon dioxide measurement was established as an important method for measuring
the progress of VHG ethanol fermentation because of its ability to exemplify transient changes in
dissolved CO2 concentration. Due to the absence of apparent delays in measurement in contrast
to off-gas measurements, it was also found that dissolved CO2 measurements were true
representations of biological activity in the fermenter. The concentration profiles of dissolved
CO2 were also able to represent the extent of glucose consumption in the fermentation broth in
the presence as well as absence of control.
Contrary to available literature where most relationships involving CO2 in fermentation
are based on off-gas measurements, dissolved CO2 was used to develop an equation to study
dissolved CO2 concentrations in terms of physiochemical and biological properties of the VHG
fermentation system. The equation developed on the basis of material balance principles was
able to relate the measured dissolved CO2 concentration with actual CO2 evolution from yeast
and hence yeast activity. This equation was able to corroborate the cessation of yeast activity due
to substrate exhaustion as represented by the dissolved CO2 concentration. It was also concluded
that the rate of desorption of CO2 from the fermentation broth after cessation of yeast activity
remained constant.
In addition, an alternative control methodology based on the measured dissolved CO2
was proposed and its effectiveness evaluated in batch VHG fermentation systems. Two
92
techniques involving Ca(OH)2 and air were evaluated for this purpose. Addition of an inorganic
compound like Ca(OH)2 while effectively reduced dissolved CO2 concentration, also increased
the pH of the fermentation broth consequently reducing cell viabilities. In addition it also
resulted in diluting the broth ethanol concentration effectively nullifying the effect of VHG
fermentation.
Incorporating a dissolved CO2 based control methodology utilizing air improved
otherwise sluggish batch fermentation for glucose concentrations higher than 200 g/L.
Completion of fermentation was marked by zero residual glucose in the fermentation broth as
represented by the dissolved CO2 concentration. Control also achieved conversion efficiencies of
81.00±5.18 and 81.07±2.25 % for 259.72±7.96 and 303.92±10.66 g glucose/L respectively and
higher ethanol productivities of 3.98±0.28 for 259.72±7.96 and 3.44±0.32 g/L-h g/L-h for
303.92±10.66 g glucose/L when compared to batches without control. Higher ethanol
productivities were characterized by reduction in fermentation duration to ~27 h and ~37 h for
~250 and ~300 g glucose/L initial concentration respectively
Among the various dissolved CO2 set points studied for ~250 g glucose/L, maintaining
dissolved CO2 at 750 mg/L using either aeration rate resulted in the highest conversion efficiency
of 83.75±4.11 %. However, no distinction could be drawn among the uniform ethanol
productivities for all set points as well as aeration rates. It was concluded that this was a result of
optimum oxygen supply as well as CO2 stripping thereby enhancing performance of VHG
fermentation.
In comparison for ~300 g glucose/L, the conversion efficiencies did not vary across set
points and aeration rates but, controlling dissolved CO2 at 1000 mg/L yielded higher ethanol
93
productivity of 3.66±0.23 g/L-h than control at 750 mg/L that yielded 3.23±0.23 g ethanol/L-h.
Further from the corresponding quantities of oxygen supplied it was determined that controlling
dissolved CO2 at 1000 mg/L would make more economic sense than control at 750 mg/L due to
the lower quantity of oxygen that was pumped in.
Higher ethanol productivities observed under control were attributed to higher cell
viabilities and biomass concentrations. However, the positive effect that air supply had on cell
viabilities was mitigated by the magnified and collective effects of increase in glucose
concentration and the associated increase in ethanol concentration as well. This was witnessed as
abrupt drops in cell viabilities with the progress of fermentation. In conjunction, maximum
biomass concentrations also dropped with increase in initial glucose concentration.
The insignificant change in glycerol concentration in contrast to ethanol and biomass
concentrations in the presence as well as absence of control under a given glucose concentration
was concluded to be a result of the glycerol production pathways being more robust in S.
cerevisiae.
It was also established that while redox potential may be sensitive to the activity of yeast
in the fermenter, dissolved CO2 measurement is directly correlated to yeast activity in the
fermenter and can discern the moment of zero residual glucose much more accurately than the
redox potential profiles. In comparison to the ORP controlled counterparts, higher ethanol
productivities were achieved. Thus, it was established that ethanol production through VHG
fermentation could be improved despite its drawbacks by utilizing an appropriate control
strategy.
94
CHAPTER 5
FUTURE RECOMMENDATIONS
While the current process provides across the board improvements to the existing VHG
fermentation process, recommendations and suggestions for further improvement of the process
have been suggested in this section. These recommendations are based on the lab-scale
observations and their interpretations made in Section 3.2.
One of the primary observations of concern is the lower conversion efficiencies in
comparison to batches without control. While the higher productivities might off-set certain costs
associated with reduced efficiencies, it is highly imperative that efficiencies be improved before
industrial implementation. In this regard a change in approach to the type of process is
suggested. It was earlier reported that implementing a repeated-batch process (Her et al., 2004)
with ORP measurement improved glucose utilization and conversion for 200 g glucose/L (Feng
et al., 2012). It is suggested that a similar process scheme be followed in the presence of
dissolved CO2 control to improve conversion efficiencies. It is hypothesized that implementing
such a process and control scheme would improve conversion efficiencies from the current ~84%
to at least 90% with concomitant improvement in annual ethanol production. The
implementation of repeated-batch processes is facilitated by the dissolved CO2 profiles that could
be utilized to determine the point for fresh feed introduction in such processes. In addition it was
suggested that repeated-batch processes increase ethanol tolerance of yeast thereby reducing
ethanol inhibition and toxicity. Although the process failed to account for the inhibitory effect of
CO2, the process itself provided considerable improvement in ethanol production under VHG
environments through improved conversion efficiencies and ethanol productivities in comparison
95
to batch and continuous processes. It is hypothesized that when used in conjunction with a
dissolved CO2 control methodology, such a process scheme would also be able to account for
inhibitions due to dissolved CO2.
Although the glycerol production in yeast during fermentation was established as a robust
pathway, diversion of carbon substrate from ethanol production is of primary concern. Diversion
of metabolic flux away from glycerol production and towards ethanol production might improve
conversion efficiencies. It is recommended that such endeavors be undertaken through metabolic
flux analysis and subsequent development of improved strains that are capable of converting
glucose to ethanol more efficiently.
Regardless of the advantages that air supply offers, operation of industrial scale air
compressors might increase operating costs per batch. It is recommended that apart from the
conclusion drawn from the study regarding 750 mg/L as the most efficient set point, further
optimization of air supply and dissolved CO2 set point needs to be done to build upon the cost
savings achieved under the current process scheme. Also of importance in this regard is the study
of the deleterious effects of excess dissolved CO2 as well as excess dissolved O2.
Due to the ability of ORP measurements to point out ethanol toxicity in the broth more
accurately, it is being suggested that future investigations in this area try utilizing ORP as well as
dissolved CO2 measurement in conjunction with each other to determine points of glucose
exhaustion and ethanol toxicity.
96
REFERENCES
Belo, I., Pinheiro, R., and Mota, M. (2003). Fed-batch cultivation of Saccharomyces cerevisiae
in a hyperbaris bioreactor. Biotechnol. Prog. , 19, 665-671.
Brown, S. W., Oliver, S. G., Harrison, D. E., and Righelato, R. C. (1981). Ethanol Inhibition of
yeast growth and fermentation: Differences in the magnitude and complexity of the effect. Eur. J
Appl. Microbiol. Biotechnol. , 11, 151-155.
Chen, Y., Krol, J., Huang, W., Cino, J. P., Vyas, R., Mirro, R., et al. (2008). DCO2 measurement
used in rapamycin fed-batch fermentation process. Process Biochem. , 43, 351-355.
Dahod, S. K. (1993). Dissolved carbon dioxide measurement and its correlation with operating
parameters in fermentation processes. Biotechnol. Progr. , 9, 655-660.
D'Amore, T., and Stewart, G. G. (1987). Ethanol tolerance of yeast. Enzyme Microb. Technol. ,
9, 322-330.
Daoud, I. S., and Searle, B. A. (1990). On-line monitoring of brewery fermentation by
measurement of CO2 evolution rate. J. Inst. Brew. , 96, 297-302.
Devantier, R., Scheithauer, B., Villas-Boas, S. G., Pederson, S., and Olsson, L. (2005).
Metabolite profiling for analysis of yeast stress response during very high gravity ethanol
fermentations. Biotechnol. Bioeng. , 90 (6), 703-714.
Dixon, N. M., and Kell, D. B. (1989). The inhibition by CO2 on growth and metabolism of
micro-organisms. A review. J. Appl. Bacteriol. , 67, 109-136.
97
Dombrek, K. M., and Ingram, L. O. (1987). Ethanol production during batch fermentation with
Saccharomyces Cerevisiae: Changes in glycolytic enzymes and internal pH . Appl and Environ
Microbiol , 1286-1291.
El Haloui, N., Picque, D., and Corrieu, G. (1988). Alcoholic fermentation in winemaking: On-
line measurement of density and carbon dioxide evolution. J. Food Eng. , 8, 17-30.
El-Sabbagh, N., McNeil, B., and Harvey, L. M. (2006). Dissolved carbon dioxide effects on
growth, nutrient composition, penicillin synthesis and morphology in batch cultures of
Penicillium chrysogenum. Enzyme Microb. Technol. , 39 (1), 185-190.
Feng, S., Srinivasan, S., and Lin, Y.-H. (2012). Redox potential-driven repeated batch ethanol
fermentation under very-high-gravity conditions. Process Biochemistry , 47 (3), 523-527.
Fornairon-Bonnefond, C., Demaretz, V., Rosenfeld, E., and Salmon, J.-M. (2002). Oxygen
addition and sterol synthesis in Saccharomyces cerevisiae during enological fermentation. J.
Biosci. Bioeng. , 93 (2), 176-182.
Frahm, B., Blank, H.-C., Cornand, P., Oelbner, W., Guth, U., Lane, P., et al. (2002).
Determination of dissolved CO2 concentration and CO2 production rate of mammalian cell
suspension culture based on off-gas measurement. J. Biotechnol. , 99, 133-148.
Frick, R., and Junker, B. (1999). Indirect methods for characterization of carbon dioxide levels in
fermentation broth. J. Biosci. Bioeng. , 87 (3), 344-351.
Galazzo, J. L., and Bailey, J. E. (1990). Fermentation pathway kinetics and metabolic flux
control in suspended and immobilized Saccharomyces cerevisiae. Enzyme Microb. Technol. , 12,
162-172.
98
Golobic, I., and Gjerkes, H. (1999). On-line estimation of specific growth rate in bacitracin
fermentation process. AIChe J. , 45 (12), 2550-2556.
Gros, J. B., Dussap, C. G., and Catte, M. (1999). Estimation of O2 and CO2 solubility in
microbial culture media. Biotechnol. Prog. , 15, 923-927.
Her, S. -L., Duan, K. -J., Sheu, D. -C., and Lin, C. -T. (2004). A repeated batch process for
cultivation of Bifidobacterium longum. J. Ind. Microbiol. Biotechnol. , 31, 427-432.
Ho, C. S., and Shanahan, J. F. (1986). Carbon dioxide transfer in bioreactors. CRC Crit. Rev.
Biotechnol. , 4 (2), 1-68.
Ingledew, W., and Lin, Y.-H. (2011). Biofuels and bioenergy: Ethanol from starch based
feedstocks. In M.-Y. Murray, Comprehensive Biotechnology (2 ed., Vol. 3, pp. 37-49). Elsevier.
Isenschmid, A., Marison, I. W., and von Stockar, U. (1995). The influence of pressure and
temperature of compressed CO2 on the survival of yeast cells. J. Biotechnol. , 39, 229-237.
In J. Janata (2009), Principles of Chemical Sensors (Second ed., pp. 171-173). New York:
Springer.
Jones, R. P., and Greenfield, P. F. (1982). Effect of carbon dioxide on yeast growth and
fermentation. Enzyme Microb. Technol. , 4, 210-223.
Kawase, Y., Halard, B., and Moo-Young, M. (1992). Liquid phase mass transfer coeeficients in
bioreactors. Biotechnol. Bioeng. , 39 (11), 1133-1140.
99
Kocmur, S., Corton, E., Haim, L., Locascio, G., and Galagosky, L. (1999). CO2-Potentiometric
determination and electrode construction, a hands-on approach. J. Chem. Ed. , 76 (9), 1253-
1255.
Kruger, L., Pickerell, A. T., and Axcell, B. (1992). The senstivity of different brewing strains to
carbon dioxide inhibition: Fermentation and production of flavour-active volatile compounds. J.
Inst. Brew. , 98, 133-138.
Kuhbeck, F., Muller, M., Back, W., Kurz, T., and Krottenthaler, M. (2007). Effect of hot trub
and particle addition on fermentation performance of Saccharomyces Cerevisiae. Enzyme and
Microbial Technology , 41, 711-720.
Kuriyama, H., Mahakarnchanakul, W., Matsui, S., and Kobayashi, H. (1993). The effect of 2COp
on yeast growth and metabolism under continuous fermentation. Biotechnol. Lett. , 15 (2), 189-
194.
Lacoursiere, A., Thompson, B. G., Kole, M. M., Ward, D., and Gerson, D. F. (1986). Effects of
carbon dioxide concentration on anaerobic fermentations of Escherichia coli. Appl. Microbiol.
Biotechnol. , 23, 404-406.
Lee, C. P., Lee, G. W., Kwon, S., Lee, Y. S., and Chang, N. H. (1999). Succinic acid production
by Anaerobiospirillum succiniciproducens: effects of the H2/CO2 supply and glucose
concentration. Enzyme Microbiol. Technol. , 24, 549-554.
Ligthelm, M. E., Prior, B. A., and du Preez, J. C. (1988). The oxygen requirements of yeasts for
the fermentation of D-xylose and D-glucose to ethanol. Appl. Microbiol. Biotechnol. , 28, 63-68.
100
Lin, Y.-H., Chien, W.-S., and Duan, K.-J. (2010). Correlations between reduction-oxidation
potential profiles and growth patterns of Saccharomyces cerevisiae during very-high-gravity
fermentation. Process Biochem. , 45, 765-770.
Liu, C.-G., Lin, Y.-H., and Bai, F.-W. (2011a). A kinetic growth model for Saccharomyces
cerevisiae grown under redox potential-controlled very-high-gravity environment. Biochemical
Engineering Journal , 56, 63-68.
Liu, C.-G., Lin, Y.-H., and Bai, F.-W. (2011b). Ageing vessel configuration for continuous redox
potential-controlled very-high-gravity fermentation. J. Biosci. Bioeng. , 111 (1), 61-66.
Maiorella, B., Blanch, H. W., and Wilke, C. R. (1983). By-product inhibition effects on ethanolic
fermentation by Saccharomyces cerevisiae. Biotechnol. Bioeng. , 25, 103-121.
Manginot, C., Sablaryolles, J. M., Roustan, J. L., and Barre, P. (1997). Use of constant rate
alcoholic fermentation to compare the effectiveness of different nitrogen sources added during
the stationary phase. Enzyme Microbiol. Technol. , 20, 373-380.
McIntyre, M., and McNeil, B. (1997). Effects of elevated dissolved CO2 levels on batch and
continuous cultures of Aspergillus Niger A60. Appl Environ Microbiol , 4171-4177.
McIntyre, M., and McNeil, B. (1998). Morphogenetic and biochemical effects of dissolved
carbon dioxide on filamentous fungi in submerged cultivation. . Appl Microbiol Biotechnol ,
291-298.
Montague, G. A., Morris, A. J., Wright, A. R., Aynsley, M., and Ward, A. C. (1986). Online
estimation and adaptive control of penicillin fermentation. IEE Proceedings , 133 (5), 240-246.
101
Mostafa, S. S., and Gu, X. (2003). Strategies for improved dCO2 removal from large-scale fed-
batch cultures. Biotechnol. Prog. , 19, 45-51.
Pampulha, M. E., and Loureiro-Dias, M. C. (1989). Combined effect of acetic acid, pH and
ethanol on intracellular pH of fermenting yeast. Appl. Microbiol. Biotechnol. , 31, 547-550.
Pattison, R. N., Swamy, J., Mendenhall, B., Hwang, C., and Frohlich, B. T. (2000). Measurement
and control of disolved carbon dioxide in mammalian cell culture processes using an in situ fibre
optic chemical sensor. Biotechnol. Prog. , 16, 769-774.
Piddocke, M. P., Kreisz, S., Heldt-Hansen, H. P., Nielsen, K. F., and Olsson, L. (2009).
Physiological characterization of brewer's yeast in high-gravity beer fermentations with glucose
or maltose syrups as adjuncts. Appl. Microbiol. Biotechnol. , 453-464.
Reddy, L. V., and Reddy, O. V. (2005). Improvement of ethanol production in very-high-gravity
fermentation by horse gram (Dolichos biflorus) flour supplementation. Letters in Applied
Microbiology , 41, 440-444.
Rendek, E., Ducom, G., and Germain, P. (2006). Carbon dixode sequestration in municipal solid
wast incinerator (MSWI) bottom ash. J. Haz. Mat. , B128, 73-79.
Renger, R. S., van Hateren, S. H., and Luyben, K. C. (1992). The formation of esters and higher
alcohols during brewery fermentation; The effect of carbon dioxide pressure. J. Inst. Brew. , 98,
509-513.
Royce, P. N. (1992). Effect of changes in pH and carbon dioxide evolution rate on the measured
respiratory quotient of fermentations. Biotechnol. Bioeng. , 40, 1129-1138.
102
Royce, P. N., and Thornhill, N. F. (1991). Estimation of dissolved carbon dioxide concentrations
in aerobic fermentations. AIChE J. , 37 (11), 168-1686.
Saerens, S. M., Verbelen, P. J., Vanbeneden, N., Thevelein, J. M., and Delvaux, F. R. (2008).
Monitoring the influence of high-gravity brewing and fermentation temperature on flavour
formation by analysis of gene expression levels in brewing yeast. Appl. Microbiol. Biotechnol. ,
80, 1039-1051.
Saucedo-Castaneda, G., and Trejo-Hernandez, M. R. (1994). On-line automated monitoring and
control systems for CO2 and O2 in aerobic and anaerobic solid-state fermentations. Proc.
Biochem. , 29, 13-24.
Schumpe, A., and Deckwer, W.-D. (1979). Estimation of O2 and CO2 solubilities in fermentation
media. Biotechnol. Bioeng. , 21, 1075-1078.
Schumpe, A., Quicker, G., and Deckwer, W.-D. (1982). Gas solubilities in microbial culture
media. In Advances in Biochemical Engineering/Biotechnology (Vol. 24, pp. 1-38).
Berlin/Heidelberg: Springer.
Shang, L., Jiang, M., Ryu, C. H., Chang, H. N., Cho, S. H., and Lee, J. W. (2003). Inhibitory
effect of carbon dioxide on the fed-batch culture of Ralstonia eutropha: Evaluation by CO2 pulse
injection and autogenous CO2 methods. Biotechnol and Bioengineering , 312-320.
Shen, H. -Y., De Schrijver, S., Moonjai, N., Verstrepen, K. J., Delvaux, F., and Delvaux, F. R.
(2004). Effects of CO2 on the formation of flavour volatiles during fermentation with
immobilized brewer's yeast. Appl. Microbiol. Biotechnol. , 64, 636-643.
103
Shimoda, M., Cocunubo-Castellanos, J., Kago, H., Miyake, M., Osajima, Y., and Hayakawa, I.
(2001). The influence of dissolved carbon dioxide concentration on the death kinetics of
Saccharomyces cerevisiae. J. Appl. Microbiol. , 91, 306-311.
Shoda, M., and Ishikawa, Y. (1981). Carbon dioxide sensor for fermentation systems.
Biotechnol. and Bioengng. , 23 (2), 461-466.
Sipior, J., Randers-Eichhorn, L., Lakowicz, J. R., Carter, G. M., and Rao, G. (1996). Phase
flurometric optical carbon dioxide gas sensor for fermentation off-gas monitoring. Biotechnol.
Prog. , 12, 266-271.
Smart, K., Chambers, K., Lambert, I., and Jenkins, C. (1999). Use of methylene violet staining
procedures to determine yeast viability and vitality. J. Am. Soc. Brew. Chem. , 57 (1), 18-23.
Song, H., Lee, J. W., Choi, S., You, J. K., Hong, W. H., and Lee, S. Y. (2007). Effects of
dissolved CO2 levels on the growth of Mannheimia succiniciproducens and succininc acid
production. Biotechnol. Bioeng. , 98 (6), 1296-1304.
Spinnler, H. E., Bouillane, C., Desmazeaud, M. J., and Coorieu, G. (1987). Measurement of
partial pressure of CO2 for estimating the concentration of Streptococcus thermophilis in
coculture with Lactobacillus bulgaricus. Appl. Microbiol. Biotechnol. , 25, 464-470.
Taherzadeh, M. J., Gustafsson, L., Niklasson, C., and Liden, G. (1999). Conversion of furfural in
aerobic and anaerobic batch fermentation of glucose by Saccharomyces cerevisiae. J. Biosci.
Bioeng. , 87 (2), 169-174.
104
Thomas, K. C., Hynes, S. H., and Ingledew, W. M. (1994). Effects of particulate materials and
osmoprotectants on very-high-gravity ethanolic fermentation by Saccharomyces cerevisiae.
Appl. and Environmental Microbio. , 60 (5), 1519-1524.
Verbelen, P. J., Saerens, S. M., Van Mulders, S. E., Delvaux, F., and Delvaux, F. R. (2009). The
role of oxygen in yeast metabolism during high cell density brewery fermentations. Appl
Microbiol Biotechnol , 1143-1156.
Verduyn, C., Postma, E., Scheffers, W. A., and van Dijken, J. (1990). Physiology of
Saccharomyces cerevisiae in anaerobic glucose-limited chemostat cultures. Journal of General
Microbiology , 136, 395-403.
Xi, Y.-l., Chen, K.-q., Li, J., Fang, X.-j., Zheng, X.-y., Sui, S.-s., et al. (2011). Optimization of
culture conditions in CO2 fixation for succininc acid production using Actinobacillus
succinogenes. J. Ind. Microbiol. Biotechnol. , 38, 1605-1612.
Yagi, H., and Yoshida, F. (1977). Desorption of carbon dioxide from fermentation broths.
Biotechnol. Bioeng. , 19, 801-819.
Zeng, A.-P., and Deckwer, W.-D. (1994). Pathway analysis of oxygen utilization and
tricarboxylic acid cycle activity in Saccharomyces cerevisiae growing on glucose. J. Biotechnol.
, 37, 67-77.
Zosel, J., Oelbner, W., Decker, M., Gerlach, G., and Guth, U. (2011). The measurement of
dissolved and gaseous carbon dioxide concentration. Meas. Sci. Technol. , 22, 1-46.
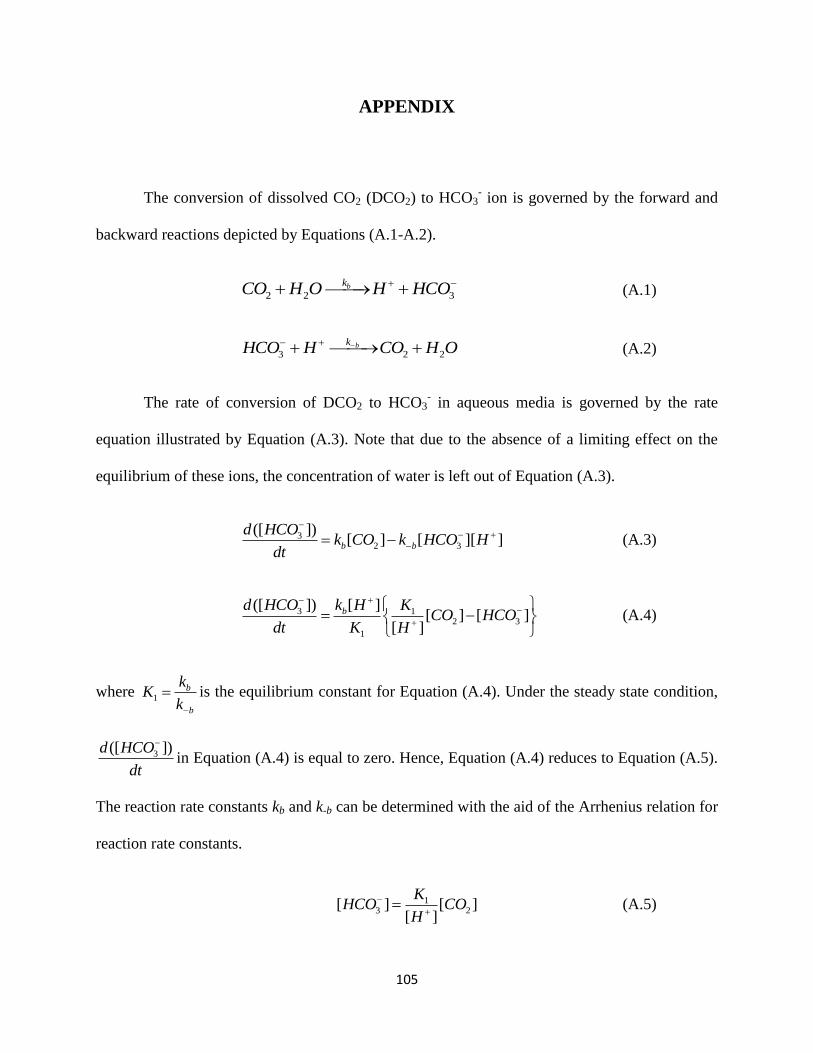
105
APPENDIX
The conversion of dissolved CO2 (DCO2) to HCO3- ion is governed by the forward and
backward reactions depicted by Equations (A.1-A.2).
2 2 3 bkCO H O H HCO (A.1)
3 2 2bk
HCO H CO H O (A.2)
The rate of conversion of DCO2 to HCO3- in aqueous media is governed by the rate
equation illustrated by Equation (A.3). Note that due to the absence of a limiting effect on the
equilibrium of these ions, the concentration of water is left out of Equation (A.3).
32 3
([ ])[ ] [ ][ ]b b
d HCOk CO k HCO H
dt
(A.3)
3 12 3
1
([ ]) [ ][ ] [ ]
[ ]
bd HCO k H KCO HCO
dt K H
(A.4)
where 1
b
b
kK
k
is the equilibrium constant for Equation (A.4). Under the steady state condition,
3([ ])d HCO
dt
in Equation (A.4) is equal to zero. Hence, Equation (A.4) reduces to Equation (A.5).
The reaction rate constants kb and k-b can be determined with the aid of the Arrhenius relation for
reaction rate constants.
13 2[ ] [ ]
[ ]
KHCO CO
H
(A.5)

106
Note that [CO2] in Equation (A.5) refers to the dissolved CO2 concentration that is symbolized as
[DCO2] in Equation (3.6).
![[PPT]Common Laboratory Tests - Stritch School of · Web viewCommon Laboratory Tests Carbon Dioxide Content The carbon dioxide content (CO2) measures the H2CO3, dissolved CO2 and bicarbonate](https://img.pdfslide.net/doc/110x75/5aafa8127f8b9a25088dc752/pptcommon-laboratory-tests-stritch-school-of-viewcommon-laboratory-tests-carbon.jpg)