Embed Size (px)
Citation preview
Effect of Emergency Care for Congestive Heart
Failure on Short Term Outcomes
A Major Qualifying Project Report
WORCESTER POLYTECHNIC INSTITUTE
Submitted By:
Joseph Everett
April 2013
SPONSOR: UMASS MEDICAL SCHOOL, Chad Darling, M.D.
Advisor: Jill Rulfs
Table of Contents
1. Introduction……………………………………………………………………….4
1.1 Major Qualifying Project Objectives………………………………………….4
2. Background………………………………………………………………………..5
2.1 Heart Failure…………………………………………………………………..5
2.1.1 Introduction………………………………………………………….5
2.2 Congestive Heart Failure……………………………………………………...5
2.2.1 Congestive Heart Failure Classification…………………………….5
2.2.2 Heart Failure Symptoms…………………………………………….6
2.2.3 Causes of Heart Failure……………………………………………..6
2.2.4 Diagnosis of Heart Failure…………………………………………..7
2.2.5 Heart Failure Treatment……………………………………………..8
2.2.6 Prognosis…………………………………………………………….9
2.3 Heart Failure Burden on Hospitals…………………………………………...9
3. Methodology……………………………………………………………………..10
3.1 Clinical Methods……………………………….…………………………….10
3.2 Methods of Analysis.................................................................................…...11
4. Results……………………………………………………………………………12
5. Discussion…………………………………………………………………………20
6. Conclusions and Recommendations………………………………………………22
7. Works Cited…………………………………………………………...…………..23
List of Figures and Tables
Table 1 – Summary of Experimental Data………………………………………………12
Figure 1 – Gender Distribution for Low Blood Pressure Group……………..………….12
Figure 2 – Gender Distribution for Normal Blood Pressure Group……………………..13
Figure 3 – Gender Distribution for High Blood Pressure Group………………………..13
Figure 4 – Patient Ages for Each Group…………………………………………...……14
Figure 5 – Patient Length of Stay for Each Group……………………………………...15
Figure 6 – Average Patient Length of Stay for Each Group………………………...…..15
Figure 7 – Length of Stay vs. Diuretic Dose………………………………………...…..16
Figure 8 – Average Diuretic Dose for Each Group……………………………………..17
Figure 9 - T-test for Low Blood Pressure Group for Length of Stay………………...….18
Figure 10 - T-test for Normal Blood Pressure Group for Length of Stay……………….18
Figure 11 - T-test for High Blood Pressure Group for Length of Stay……………….....19
Figure 12 - T-test for Low Blood Pressure Group for Diuretic Dose………………...…19
Figure 13 - T-test for Normal Blood Pressure Group for Diuretic Dose………………..20
Figure 14 - T-test for High Blood Pressure Group for Diuretic Dose…………………..20
1. Introduction The purpose of this project is to evaluate short term-outcomes of
congestive heart failure patients based on the emergency department treatment
they receive. The primary short term outcome that will be evaluated is length of
hospital stay. The “primary entry point into the health care system” for these
patients is the emergency department (Rogers, 2006). Despite this fact, the
treatment of congestive heart failure is not concretely defined, making the
treatment options variable. Researching the short term outcomes of the most
common treatment, administration of diuretics, can serve to provide healthcare
providers with a more focused approach. As a result, the patient will receive
better care, and the hospital will save resources through quicker treatment.
1.1 Major Qualifying Project Objectives
The primary hypothesis for this project states that the administration of the
most common treatment option, diuretics, within 2 hours of Emergency
Department admission will result in improved short-term outcomes for the
patient. Length of stay is the major variable being measured. The project used an
observational approach, with patients being voluntarily enrolled. Enrolled patients
were observed in the ER and information was gathered from their charts. The
initial goal was to accurately enroll patients with congestive heart failure based on
pre-set criteria. The second goal, following enrollment, was to compile data
regarding the patient health and care throughout their stay in the emergency
department and ICU if applicable.
2. Background 2.1 Heart Failure
2.1.1 Introduction
The medical condition known as heart failure is classified by the inability of the
heart to provide the body with an adequate amount of oxygenated blood. Often resulting
from age or congenital conditions, this inefficient pumping results in a lack of oxygen
that starves the tissues and organs of the body of an essential molecule. The asphyxiation
of the body’s cells can lead to potentially fatal results. Heart failure is not to be confused
with cardiac arrest or a heart attack, as the heart is still pumping during heart failure.
However the inefficient pumping over the course of time leads to more serious problems.
Heart failure is a relatively common condition in older populations, with 1 in 10 persons
over the age of 75 affected. Hospitalization for heart failure occurs in about 2000 per
100,000 person-years, making treatment costs for hospitals a major financial concern (4).
Heart failure is generally divided into a few different classifications. The first
class is called acute heart failure. This subcategory is considered an emergency, abrupt
situation where the hearts capacity to function is directly impaired. An example of this
would include a heart attack in a patient who already has heart failure but was in a stable
state. This type of non-congestive heart failure would not involve the buildup of fluid in
the tissues that surround the heart. This research project will not be focusing on this type
of heart failure.
The second classification, which is the focus of this project, is congestive heart
failure. This condition is a more gradual weakening of the heart’s pumping action over
time. As a result of this, there begins to be some regurgitation of blood in the wrong
direction. This backflow can result in the buildup of fluid in the tissues of the body or in
the lungs, depending on which side of the heart is lagging.
Heart failure is often a secondary diagnosis of another medical condition. This
inefficient pumping of the heart will most likely begin as a result of conditions such as
high blood pressure, diabetes, coronary artery disease, or a previous myocardial
infarction. This overlap sometimes leads to mis- or late diagnosis, as well as a wide
variety of doctor prescribed treatments. No matter which option is chosen by doctors, the
rapid administration of treatment can greatly improve the short term outcomes and
prognosis.
2.2 Congestive Heart Failure
2.2.1. Congestive Heart Failure Classification
In congestive heart failure, the inefficient pumping of the heart will cause buildup
of fluid in the body. This buildup, called edema, is the main factor in the distinction
between congestive or non-congestive heart failure. The heart can fail on either of its two
sides, each class resulting in a different set of symptoms (2). When the patient has left-
sided heart failure, the edema occurs in the lungs due to inefficient ventricular pumping.
This backflow usually is a result of a hardened ventricle that will not relax enough to
allow enough blood to enter the heart. This type is most common in women (5). When
the heart failure occurs on the right side, fluid will back up into the tissues of the body
due to decreased arterial function. The most common manifestation of this is swelling in
the legs and feet. In more severe cases, this buildup can result in abdomen swelling as
well.
Once congestive heart failure has been diagnosed, it can be classified into either
systolic or diastolic. The former is a tag given when the pumping action of the heart is
weakened, making the ejection fraction of the heart less than 55%. Ejection fraction is the
amount of blood pushed through the heart in a normal beat; normal values range between
55 and 70 percent. Diastolic heart failure is the result of a toughened heart muscle,
resulting in rigidity (3). This prevents the muscle from filling properly, resulting in fluid
backup into the lungs.
2.2.2 Heart Failure Symptoms
Heart failure is a difficult condition to diagnose due to its wide variety of
symptoms. It is often the result of other conditions, making recognition of the disease
more difficult. The chief complaint of many of the patients will be shortness of breath, or
dyspnea. This difficulty breathing is a result of the fluid retention in the lungs and is
indicative of diastolic heart failure. The patient will also notice shortness of breath doing
daily activities or laying down. This is because the fluid will cover a greater surface area
when the patient is prone, making gas exchange in the lungs much more difficult. This
may occur at night while sleeping, or even when a patient is in a semi reclined position.
If the patient has systolic heart failure, the chief complaint is often edema of the
legs or feet. This is called peripheral edema, and is most common after the patient has
been standing or sitting for a longer period of time. Doctors can diagnose this type of
edema through its unique pitting characteristics. This is the tendency of the skin to
become indented when pressed, and then slowly fill (3).
Symptoms that have also been recorded and do not have ties to a specific type of
heart failure include weakness, dizziness, irregular heartbeat, nausea, fatigue, and
coughing.
2.2.3 Causes of Heart Failure
Congestive heart failure is a result of a pre-existing medical condition, or a
number of problems. It is a gradual wearing down of the heart for one reason or another
and for this reason can affect a patient slowly. Some of the main causes for the
weakening of the heart’s pumping action include coronary artery disease, damaged heart
valves, arrhythmias, high blood pressure, and heart muscle damage. These conditions all
affect the heart in different ways, but all lead to the same end.
Coronary artery disease occurs as a result of plaque from blood building up inside
the arteries that supply oxygenated blood to the heart muscle. As with any muscle, a
reduced supply of oxygen causes a reduction in efficiency, in this case the pumping of the
heart. Eventually, this type of buildup can cause a heart attack, making the patient even
more at risk for heart failure.
The heart is a very complex muscle, and contains four valves that help regulate
blood flow efficiently. If one of these valves is damaged, the pumping action of the pump
would have a cog in the wheel. This can be thought of as a rower on a boat being out of
sync with the others; the boat would not be as fast or accurate as previously. One of the
more common problems is valvular stenosis, or the valve opening being smaller than is
normal due to stiffness, most often due to fused leaflets of the valve. This causes the heart
to have to pump harder to force blood through this small opening. In addition to fused
leaflets, valves can be loose and leak. This condition causes blood to regurgitate
backwards, making it so the heart has to work harder to get this blood through it. Both
these valvular disorders cause the heart to become overworked, which can lead to heart
failure.
Arrhythmias and high blood pressure are less common causes of heart failure, but
still present problems for the patient. If the heart has an arrhythmia that causes the heart
to work harder, it will eventually weaken enough to cause heart failure. Patients with high
blood pressure have more blood force through the arteries due to a constriction of the
vessels. This in itself causes the heart to work harder to contract in order to force blood
into the already pressurized arteries. A harder working heart can become overworked or
stiffer as a result of this extra work, which can potentially lead to heart failure.
Patients who have had a myocardial infarction in the past are considered high risk
for heart failure. Heart attacks will often result in tissue death in the heart, and sometimes
in scar tissue. Because scar tissue cannot perfuse blood, it is considered dead, and
subsequently will not contribute to the beating action of the heart. This indicates that the
healthy part of the heart will need to compensate.
2.2.4 Diagnosis of Heart Failure
Heart failure is a difficult disease to diagnose. There are a number of major steps
in the determination of whether or not a person has heart failure. These include a physical
examination, check of past medical history, chest x-rays, electrocardiograms, blood tests,
and echocardiograms.
The patient will first present to the emergency department with some sort of
complaint. Doctors are looking for more elderly patients complaining of shortness of
breath brought on by exertion or laying down. In addition, peripheral edema is also
looked for. Following this, a check is made into the past medical history of the patient.
This will provide the physician information about the contributors to heart failure. If the
patient has conditions such as coronary artery disease, damaged heart valves,
arrhythmias, high blood pressure, or a history of myocardial infarctions, the doctor can
begin to suspect heart failure. In addition, if the patient has ever had heart failure, they
are immediately suspected of having another incident.
Physical examination of the patient is usually the next step. Here the doctor will
ask about symptoms, including onset, pain, severity, frequency, and duration. In addition,
lungs will be auscultated, listening for crackles or rales in the lungs, which indicate fluid
in the lungs. Following this, the doctor will move to more advanced diagnostic
procedures. A chest x-ray may be done to confirm the presence of fluid as well as
cardiomegaly, or an enlargement of the heart. In addition, heart valve problems may be
seen in the x-ray.
A major indicator of heart failure in a patient is the level of brain natriuretic
peptide, or BNP, in their blood. This hormone is endogenous, and is released into the
blood from stretched ventricles of the heart, indicating strain. The strain to the heart over
a long period of time will cause this level to elevate. Any number over the 500 pg/mL
level is a red flag for the physician and indicates heart failure. This test is minimally
invasive and is one of the best indicators for both the presence and severity of the heart
failure. In addition, kidney and thyroid function may be measured. White blood cell
counts are also taken, mainly to rule out pneumonia, which can have many of the same
symptoms as heart failure.
The physician will usually order an electrocardiogram, or EKG, as a part of the
diagnosis. This test measures the electric activity of the heart, showing any underlying
condition that may contribute to heart failure. If the physician sees fit, an echocardiogram
may be performed. This test uses ultrasound to create a moving picture of the heart. This
is then used to measure the ejection fraction of the heart, which can be used to diagnose a
patient.
2.2.5 Heart Failure Treatment
The treatment of heart failure is as diverse as its symptoms. The treatment can
range from medications to surgeries. The most common prescribed medications are
diuretics, vasodilators, nitrates, inotropes, digitalis, beta-blockers, natriuretic peptides and
nitroglycerin. The surgical options include the repair of heart valves and bypass to
improve pumping action. Despite all these options, the majority of patients will receive a
diuretic of some kind.
In all, about 90% of patients will receive a diuretic of some kind (1). This serves
to rid the body of built-up fluid, as well as prevent the continuation of the problem.
Because both systolic and diastolic forms of congestive heart failure involve the
accumulation of fluid in the body, diuretics can be seen as a blanket treatment for
suspected heart failure. This in itself shows the need of this treatment to be further
evaluated in terms of effectiveness and impact on short term outcomes.
The purpose of a diuretic is to cause the kidneys to filter excess salt and water
from the body. The lower blood volume is easier for the heart to pump, alleviating the
symptoms in the short term. Three types of diuretics commonly used as treatment are
thiazides, potassium sparing, and loop acting diuretics. Thiazides reduce sodium levels
and water in the body, while also dilating blood vessels to lower blood pressure.
Potassium sparing diuretics do the same thing; however they do not target potassium.
Loop acting diuretics cue the kidneys to increase urine output, reducing water and blood
pressure.
The most common diuretic administered in hospitals is Lasix. Lasix is
furosemide, a compound that acts on the renal system to increase urine output. It is a loop
acting diuretic, and is typically the first line of treatment in congestive heart failure.
Because Lasix is the principle diuretic administered at the project site, it will be the focus
of the investigation into the short term outcomes.
2.2.6 Prognosis
Patients diagnosed with heart failure have a bleak prognosis. Once diagnosed,
over half of the patients will die within 1-5 years, depending on severity of the symptoms
(2). An accurate prognosis can be made through the determination of ejection fraction.
The prognosis of the patient becomes worse ass the ejection fraction decreases. In all
about 10% of heart failure patients die per year (5). This leads to the need for a better
treatment system. If the best short term treatment plan can be developed, patients could
have better long term prognoses.
2.3 Heart Failure Burden on Hospitals
Heart failure is the fourth leading cause of hospitalization in the emergency room
(2). The prevalence of the disease puts an extreme burden on hospitals, both in terms of
finances as well as personnel and other resources. Heart failure was the cause of 3.4
million hospital visits in 2006, as well as cost hospitals 37.2 billion dollars for emergency
and in-patient care in 2009 (2). Heart failure typically affects patients at or above the age
of 65; this means that effective and efficient emergency care of CHF becomes
increasingly important as more of the population reaches the age most effected (6). The
goal of improving care is getting the patient out of the hospital as quickly as possible
while still providing proper care.
3. Methodology
3.1 Clinical Methods
The methodology for this clinical study followed the protocol outlined by Dr.
Chad Darling in the IRB form. Once admitted to the emergency room, each patient was
screened for any symptoms of congestive heart failure. These chief complaints included
but were not limited to symptoms such as shortness of breath, chest pain, edema, fatigue,
and previously diagnosed congestive heart failure. Once considered a potential candidate
for the study, more research was done into the patient demographics and health history. A
history of congestive heart failure was a strong indicator for inclusion, as were
demographics such as old age. Ultimately, inclusion was based on the researcher’s
decision and patient consent. In general patients were approached if they were over the
age of 18, as well as if they were presenting to the Emergency Department with dyspnea
that pointed toward acute heart failure.
Even if a patient exhibited all the required signs of having congestive heart
failure, there were still some factors that automatically called for them to be excluded
from the study. These criteria were designed to keep the patients’ health interests in mind,
as well as to preserve the ethics of the study. These exclusion criteria included a doctor
diagnosed final primary or secondary diagnosis that was not classified as heart failure,
heart failure occurring directly after or in conjunction with an acute myocardial
infarction, dyspnea caused by other health problems such as asthma, mental
incapacitation leading to the inability to provide informed consent, and pregnancy.
If these criteria indicated a patient may be a good candidate, the patient records
and medical file for the current hospital stay were analyzed. The next step was to seek out
the initial diagnosis of a doctor. The doctor was questioned as to what he or she thought
the patient of interest was suffering from. If the answer was congestive heart failure, the
patient would be immediately approached. If the doctor was unsure, or did not think the
patient was suffering from congestive heart failure, then the researcher had a decision to
make. If the patients’ medical history and current file seemed to point to congestive heart
failure, the patient was approached. The reason for this was that a patient needed to be
enrolled as early as possible so the vital signs and quality of care could be assessed. The
risk in doing this was that once a patient was enrolled in the study, they would be
included in all data analysis. This would apply even for those patients who eventually
were diagnosed with a different ailment.
Approaching a patient was the next step. The most important part of this step was
to ensure the comfort of the patient, as well as to be clear about what was being studied
through the administration of informed consent. In addition, the patient was to be
informed that the researchers were not caregivers, and the care of the patient was not
being altered in any way. The patient was asked permission to enter the room, and if
granted access the study was explained to them. They were told the study was strictly
observational with neutral outcomes for the patient. It was stressed that the study
involved patients who were potential candidates for congestive heart failure, and
inclusion was in no way a confirmed diagnosis of any medical condition. Patients were
told about the release of medical records as well as current treatments and records of
things such as vital signs, urine output, etc., should they consent. If the patient was
mentally able and willing, a consent form and medical records release form were
completed and signed.
Following this, the patient was asked to complete a series of wellness scales.
These were scales measuring a patient’s severity of shortness of breath and how they felt.
These scales were completed a number of different times throughout the patients stay.
These scales are relevant for the complete study of Dr. Darling, however will not be used
in the data analysis of this project. They can be found in Appendix 3.
Using the electronic patient file, relevant data were collected. Data that will be
used in this project include demographics including age, gender, height and weight, vital
signs at various points during the stay, the prescribing of diuretics by physicians, and
eventually the total length of stay. Vital signs were typically taken at triage, 1 hour, 2
hours, and 3 hours, and included blood pressure, respiratory rate, heart rate, and percent
of oxygen saturation. Additional information that was collected that will not be used in
this project included any electrocardiograms, at home medicine lists, and urine output.
3.2 Methods of Analysis
When the course of the data collection was complete, there were far too many
variables to analyze together. In order to draw accurate conclusions, some variables
needed to be eliminated from the study. Demographics are important to making
relationships and the variables of age and gender were included. The main variable of
focus is length of stay, which is directly correlated to patient health and financial burden
on hospitals. Additionally, the main treatment being focused on will be the administration
of diuretics due to its prevalence of use in the emergency department.
Data analysis will be relatively simple, as the relationships that will be drawn are
direct ones. Analysis methods that will be used are those including averaging and
graphical representations. Simple graphs will make up the majority, with box and whisker
plots used for a representation of standard deviation, average, and error.
In order to analyze the significance of the data, t-tests will be undertaken. These
will assume unequal variance due to the groups having differing sizes. The length of stay
and diuretic doses for each group will be compared to the control group, which will be
the entire patient pool. These t-tests will show whether the derived data are due to
random chance rather than significant relationships.
4. Results:
The data from the testing period was quantified and arranged into a large table.
The full results can be seen in Appendix 1, while the variables are defined in Appendix 2.
Below, in Table 1, a summary of the most commonly used data is present.
Table 1 – Summary of Experimental Data
As can be seen by the table, the longest average length of stay was present in the
low blood pressure group. In addition, all groups have similar average ages and BMI.
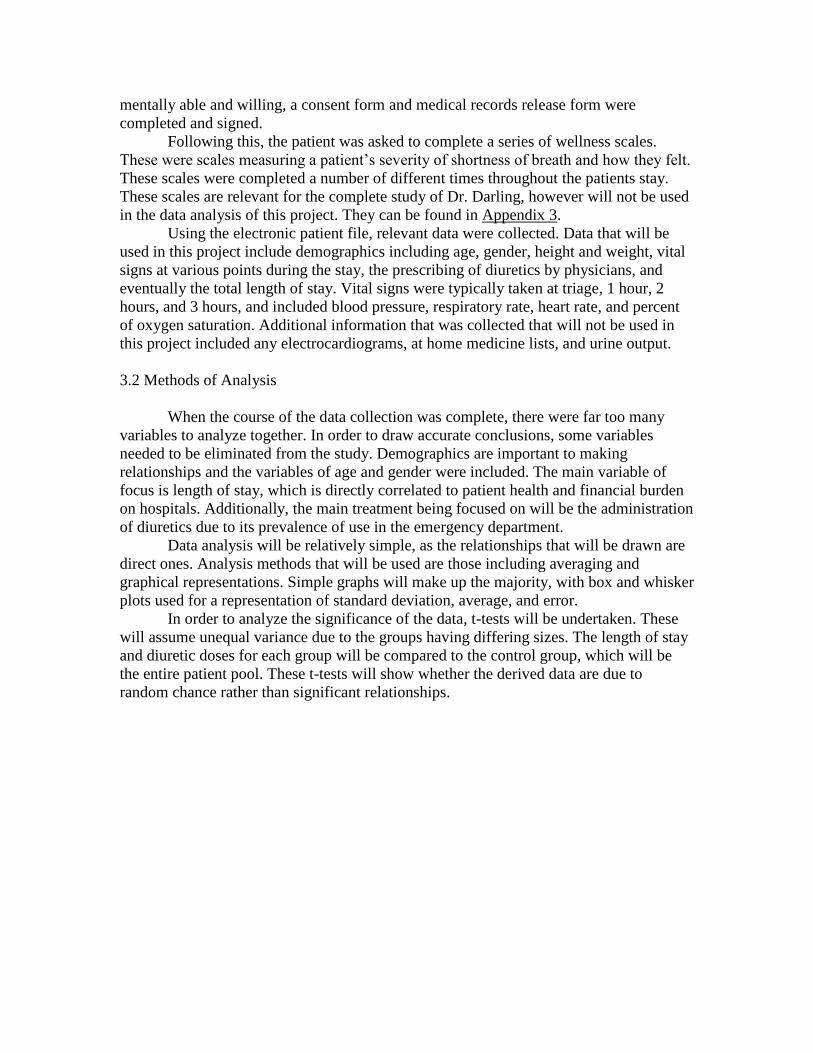
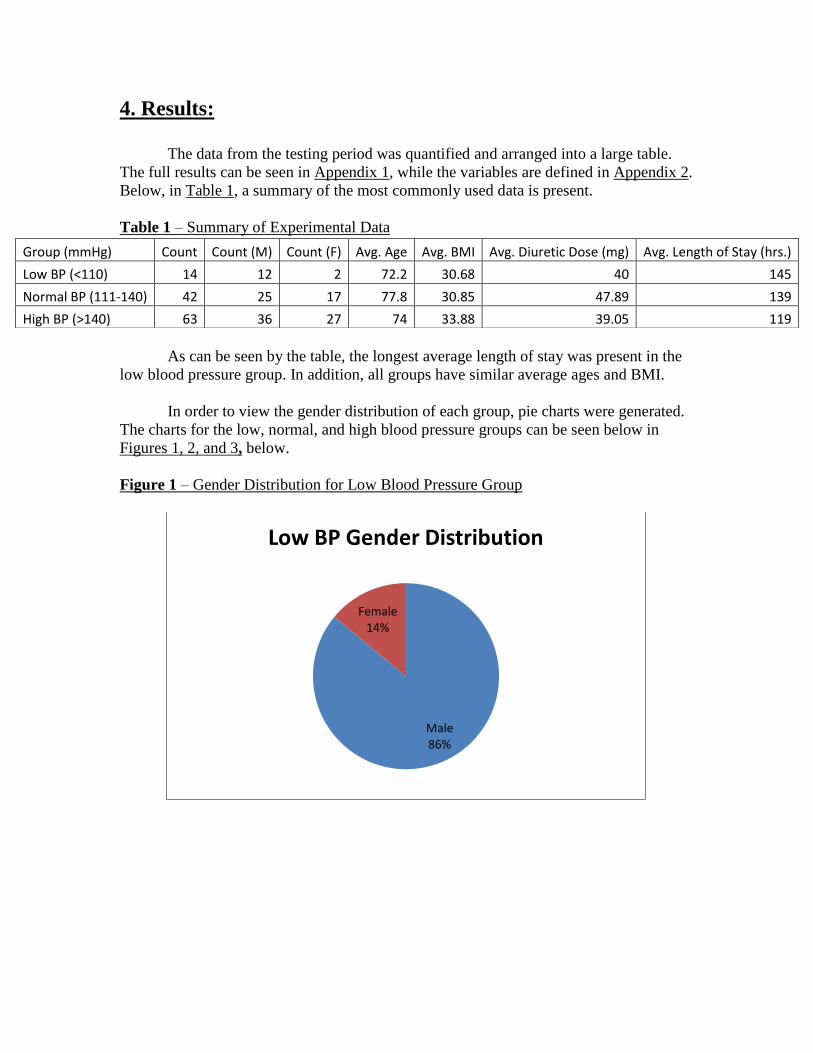
In order to view the gender distribution of each group, pie charts were generated.
The charts for the low, normal, and high blood pressure groups can be seen below in
Figures 1, 2, and 3, below.
Figure 1 – Gender Distribution for Low Blood Pressure Group
Male 86%
Female 14%
Low BP Gender Distribution
Group (mmHg) Count Count (M) Count (F) Avg. Age Avg. BMI Avg. Diuretic Dose (mg) Avg. Length of Stay (hrs.)
Low BP (<110) 14 12 2 72.2 30.68 40 145
Normal BP (111-140) 42 25 17 77.8 30.85 47.89 139
High BP (>140) 63 36 27 74 33.88 39.05 119
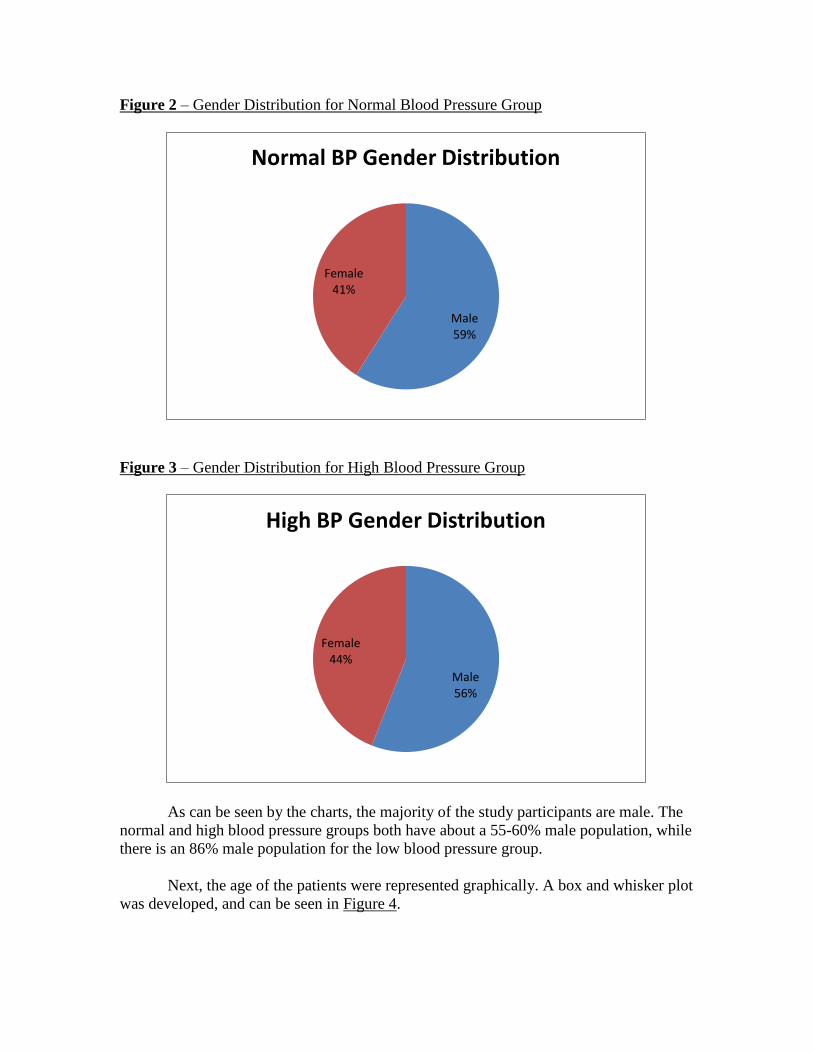
Figure 2 – Gender Distribution for Normal Blood Pressure Group
Figure 3 – Gender Distribution for High Blood Pressure Group
As can be seen by the charts, the majority of the study participants are male. The
normal and high blood pressure groups both have about a 55-60% male population, while
there is an 86% male population for the low blood pressure group.
Next, the age of the patients were represented graphically. A box and whisker plot
was developed, and can be seen in Figure 4.
Male 59%
Female 41%
Normal BP Gender Distribution
Male 56%
Female 44%
High BP Gender Distribution
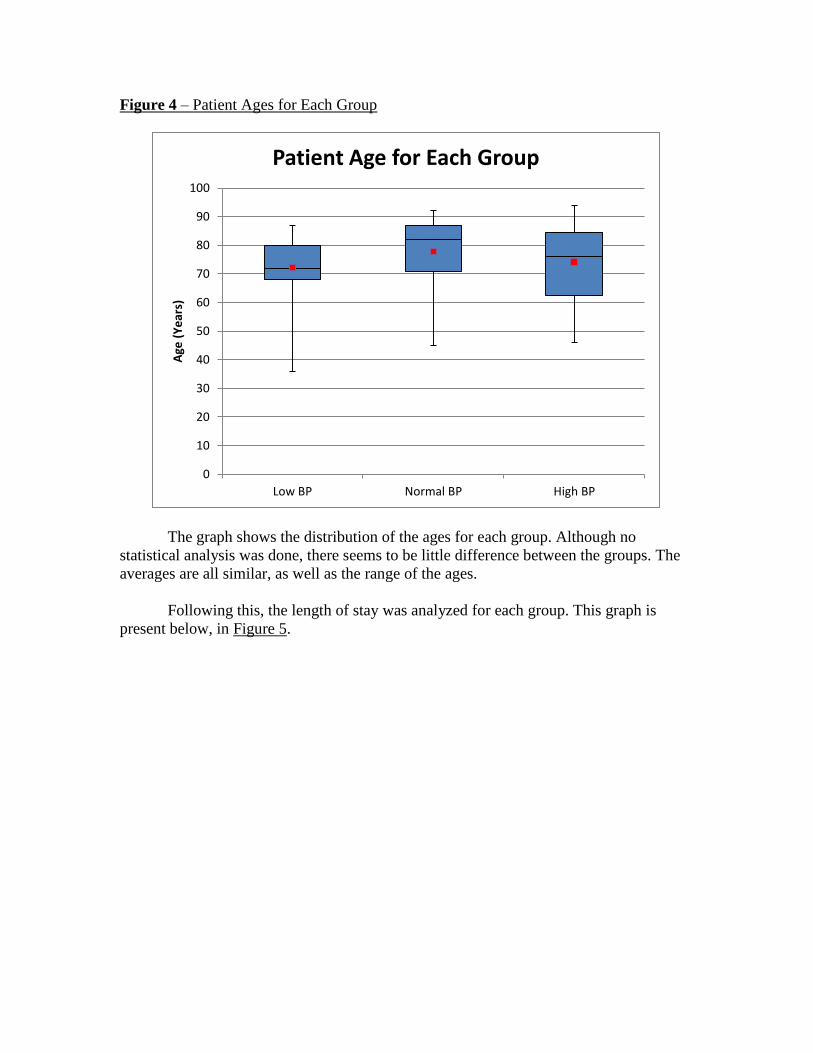
Figure 4 – Patient Ages for Each Group
The graph shows the distribution of the ages for each group. Although no
statistical analysis was done, there seems to be little difference between the groups. The
averages are all similar, as well as the range of the ages.
Following this, the length of stay was analyzed for each group. This graph is
present below, in Figure 5.
0
10
20
30
40
50
60
70
80
90
100
Low BP Normal BP High BP
Age
(Y
ear
s)
Patient Age for Each Group
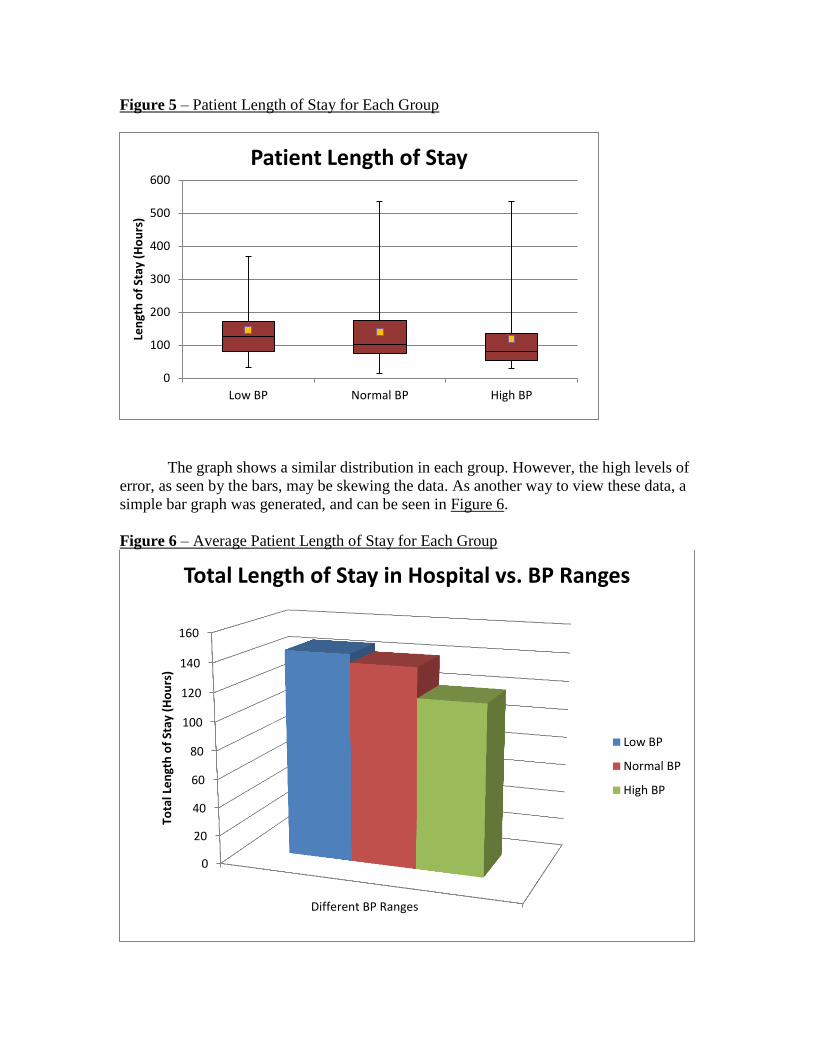
Figure 5 – Patient Length of Stay for Each Group
The graph shows a similar distribution in each group. However, the high levels of
error, as seen by the bars, may be skewing the data. As another way to view these data, a
simple bar graph was generated, and can be seen in Figure 6.
Figure 6 – Average Patient Length of Stay for Each Group
0
100
200
300
400
500
600
Low BP Normal BP High BP
Len
gth
of
Stay
(H
ou
rs)
Patient Length of Stay
0
20
40
60
80
100
120
140
160
Different BP Ranges
Tota
l Le
ngt
h o
f St
ay (
Ho
urs
)
Total Length of Stay in Hospital vs. BP Ranges
Low BP
Normal BP
High BP
The graph shows a trend that suggests a successive decrease in length of stay for each
blood pressure range. To further analyze the results, diuretic doses were measured in
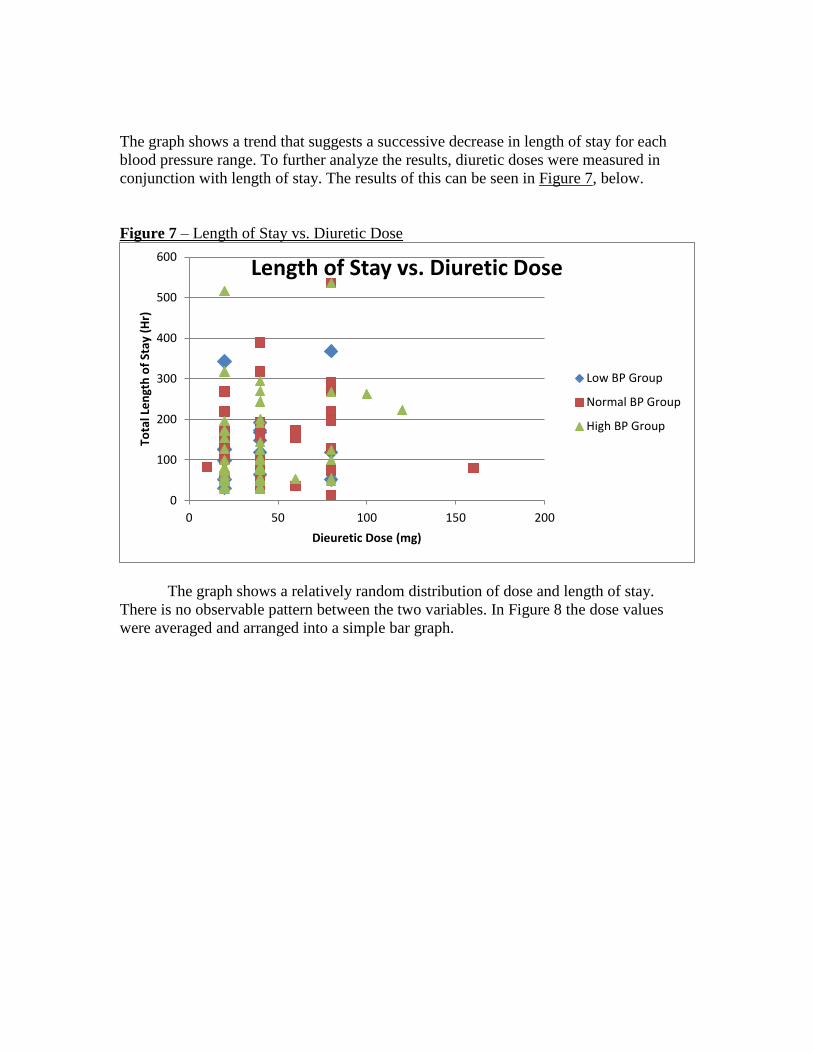
conjunction with length of stay. The results of this can be seen in Figure 7, below.
Figure 7 – Length of Stay vs. Diuretic Dose
The graph shows a relatively random distribution of dose and length of stay.
There is no observable pattern between the two variables. In Figure 8 the dose values
were averaged and arranged into a simple bar graph.
0
100
200
300
400
500
600
0 50 100 150 200
Tota
l Le
ngt
h o
f St
ay (
Hr)
Dieuretic Dose (mg)
Length of Stay vs. Diuretic Dose
Low BP Group
Normal BP Group
High BP Group
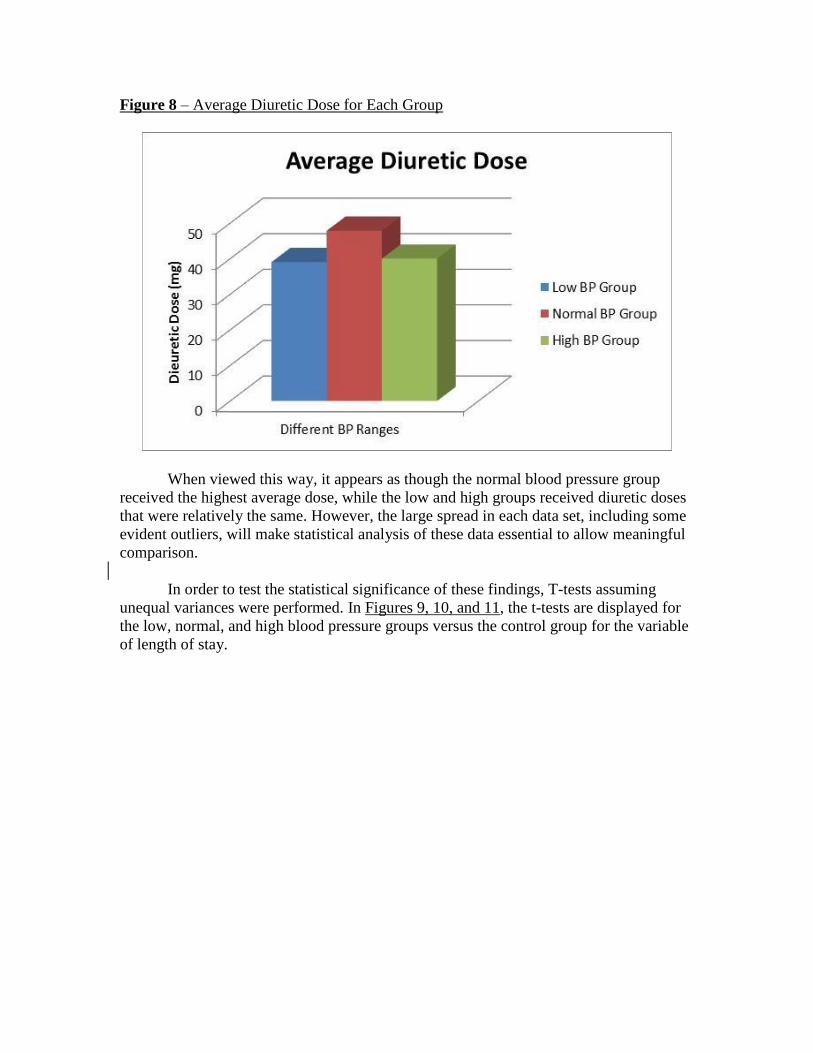
Figure 8 – Average Diuretic Dose for Each Group
When viewed this way, it appears as though the normal blood pressure group
received the highest average dose, while the low and high groups received diuretic doses
that were relatively the same. However, the large spread in each data set, including some
evident outliers, will make statistical analysis of these data essential to allow meaningful
comparison.
In order to test the statistical significance of these findings, T-tests assuming
unequal variances were performed. In Figures 9, 10, and 11, the t-tests are displayed for
the low, normal, and high blood pressure groups versus the control group for the variable
of length of stay.
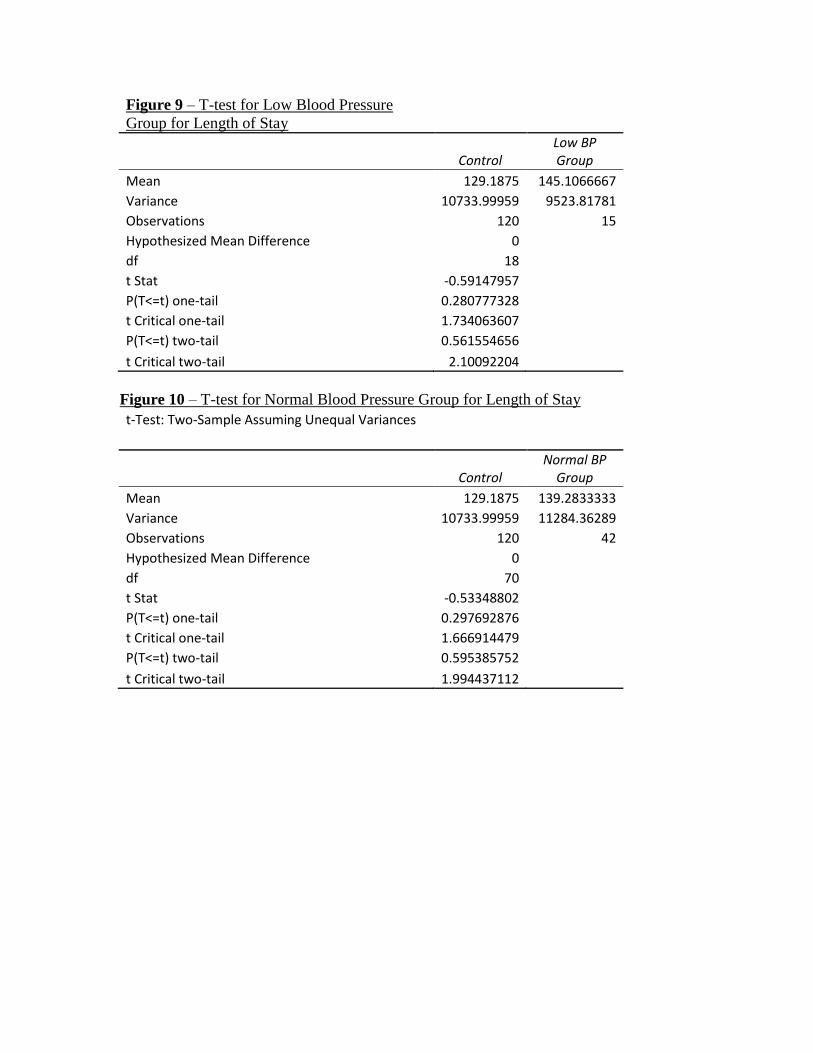
Figure 9 – T-test for Low Blood Pressure
Group for Length of Stay
Control Low BP Group
Mean 129.1875 145.1066667
Variance 10733.99959 9523.81781
Observations 120 15
Hypothesized Mean Difference 0
df 18
t Stat -0.59147957
P(T<=t) one-tail 0.280777328
t Critical one-tail 1.734063607
P(T<=t) two-tail 0.561554656
t Critical two-tail 2.10092204
Figure 10 – T-test for Normal Blood Pressure Group for Length of Stay
t-Test: Two-Sample Assuming Unequal Variances
Control Normal BP
Group
Mean 129.1875 139.2833333
Variance 10733.99959 11284.36289
Observations 120 42
Hypothesized Mean Difference 0
df 70
t Stat -0.53348802
P(T<=t) one-tail 0.297692876
t Critical one-tail 1.666914479
P(T<=t) two-tail 0.595385752
t Critical two-tail 1.994437112
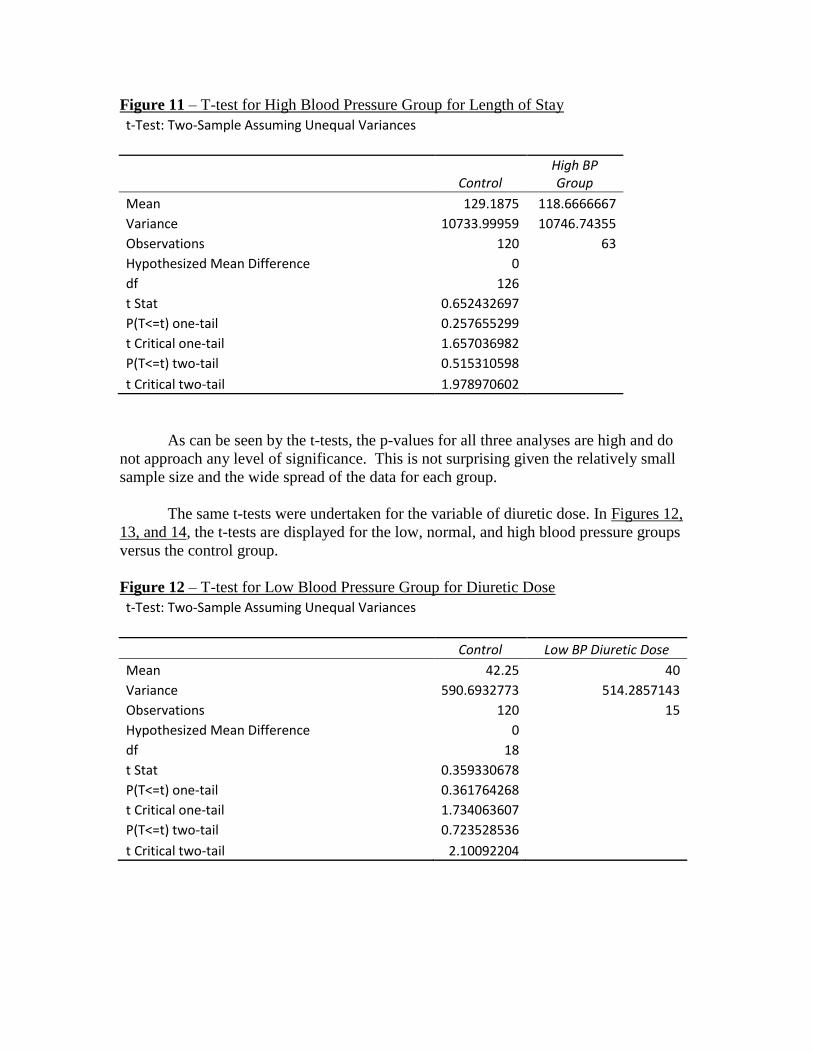
Figure 11 – T-test for High Blood Pressure Group for Length of Stay
t-Test: Two-Sample Assuming Unequal Variances
Control High BP Group
Mean 129.1875 118.6666667
Variance 10733.99959 10746.74355
Observations 120 63
Hypothesized Mean Difference 0
df 126
t Stat 0.652432697
P(T<=t) one-tail 0.257655299
t Critical one-tail 1.657036982
P(T<=t) two-tail 0.515310598
t Critical two-tail 1.978970602
As can be seen by the t-tests, the p-values for all three analyses are high and do
not approach any level of significance. This is not surprising given the relatively small
sample size and the wide spread of the data for each group.
The same t-tests were undertaken for the variable of diuretic dose. In Figures 12,
13, and 14, the t-tests are displayed for the low, normal, and high blood pressure groups
versus the control group.
Figure 12 – T-test for Low Blood Pressure Group for Diuretic Dose
t-Test: Two-Sample Assuming Unequal Variances
Control Low BP Diuretic Dose
Mean 42.25 40
Variance 590.6932773 514.2857143
Observations 120 15
Hypothesized Mean Difference 0
df 18
t Stat 0.359330678
P(T<=t) one-tail 0.361764268
t Critical one-tail 1.734063607
P(T<=t) two-tail 0.723528536
t Critical two-tail 2.10092204
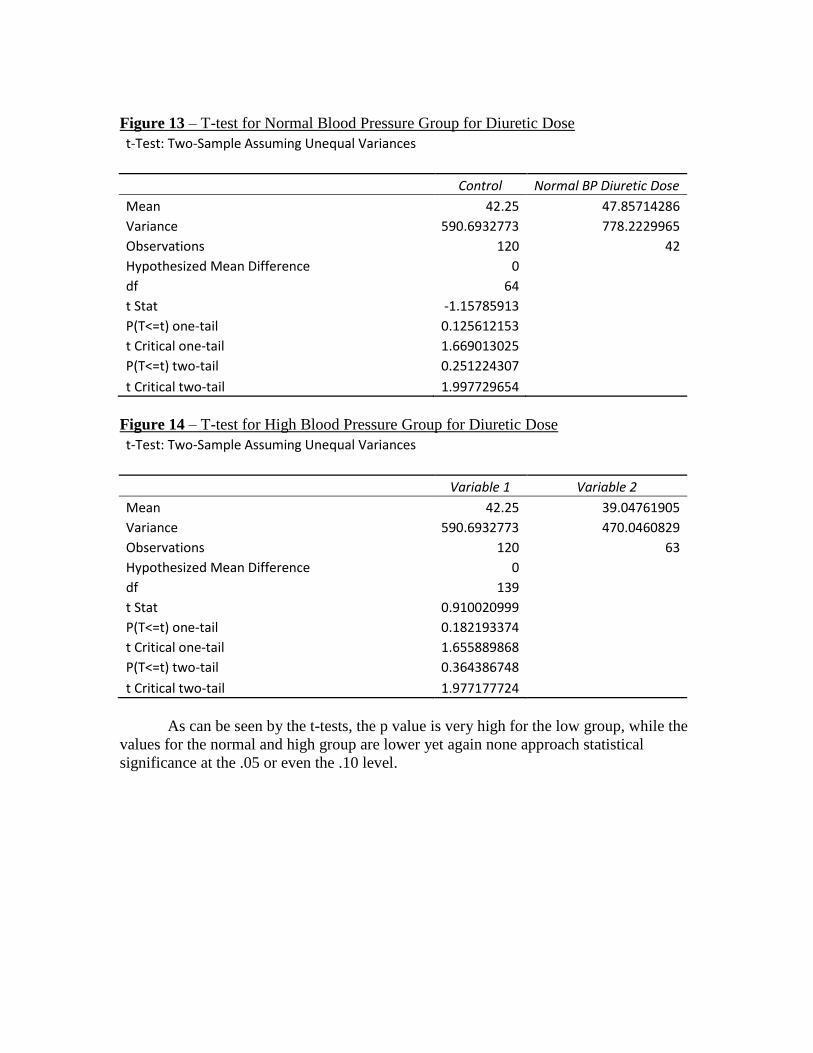
Figure 13 – T-test for Normal Blood Pressure Group for Diuretic Dose
t-Test: Two-Sample Assuming Unequal Variances
Control Normal BP Diuretic Dose
Mean 42.25 47.85714286
Variance 590.6932773 778.2229965
Observations 120 42
Hypothesized Mean Difference 0
df 64
t Stat -1.15785913
P(T<=t) one-tail 0.125612153
t Critical one-tail 1.669013025
P(T<=t) two-tail 0.251224307
t Critical two-tail 1.997729654
Figure 14 – T-test for High Blood Pressure Group for Diuretic Dose
t-Test: Two-Sample Assuming Unequal Variances
Variable 1 Variable 2
Mean 42.25 39.04761905
Variance 590.6932773 470.0460829
Observations 120 63
Hypothesized Mean Difference 0
df 139
t Stat 0.910020999
P(T<=t) one-tail 0.182193374
t Critical one-tail 1.655889868
P(T<=t) two-tail 0.364386748
t Critical two-tail 1.977177724
As can be seen by the t-tests, the p value is very high for the low group, while the
values for the normal and high group are lower yet again none approach statistical
significance at the .05 or even the .10 level.
5. Discussion
The purpose of this project was to collect and analyze data regarding the early
treatment of congestive heart failure in the emergency department. Patients presented to
the ED with various complaints and were screened for symptoms of CHF. If they met the
criteria, they would be entered into the study after providing consent. Data regarding
these patients were collected throughout the length of their stay at the hospital and
subsequently compiled.
This project focused on patients with confirmed congestive heart failure who
received diuretics during their stay at the hospital. Patients were separated based on their
systolic blood pressures into three groups, and the data collected on these groups was
analyzed. In Table 1, the demographics of each group can be seen. There are more
patients presenting with high blood pressure than those with low, however there are some
apparent similarities and differences among the three groups. The average ages and BMI
of the groups are similar. The average dose of diuretic was almost identical for the low
and high blood pressure groups, with the average dose being higher for the patients with
normal blood pressure. Based on simple averages, those patients who received diuretics
and had low blood pressure stayed at the hospital for over a day longer than the high
blood pressure group. However, all of these observations are based on visual
interpretation of the average data; when the data was analyzed using the t-tests, the p-
values showed there was no statistically significant difference for the length of stay or the
diuretic dosing among the groups. Clearly a much larger data set will be required before
any evidence-based decisions can be made. In particular, care must be taken not to reach
any conclusions based on visual differences in data display without a statistical analysis.
Additionally, once the larger data set has been collected, it must be evaluated for normal
distribution in order to be certain the appropriate statistical analyses are used.
While the raw data for the questions regarding dosing and length of stay will need
to be further analyzed in order to draw appropriate conclusions, there are some trends
worth noting. In the low blood pressure group, 86% of the patients were male. This is in
contrast to the 59% and 56% male patients in the normal and high blood pressure groups.
Reasons for this are unknown; however it may be due to the smaller sample size for the
low blood pressure group. These figures also reflect national averages (2).
In all groups, the average age was between 72 and 77 years old. In box and
whisker plots, it is evident that the majority of the patients in each group fall at a
relatively similar age; somewhere between retirement age and low to mid 80’s. These
data are significant because they shows that age will not likely be a factor in data analysis
due to the close relation between each group.
Length of stay is one of the most important variables to study, as it is the main
indicator of both patient wellbeing and burden on the hospital. Here there is a great deal
of variability in the data set; some patients have a length of stay over double or triple the
average time for their respective groups. Looking at simple averages for the groups there
appears to be an increase in average length of stay as blood pressure decreases. While not
significant, this apparent trend certainly deserves further attention.
During the course of data collection, it became apparent that many different
courses of treatments were prescribed to patients by different doctors. Despite this, the
most common treatment was the administration of diuretics to patients presenting with
CHF. The patients that are being studied are those who received these diuretics. Again
using simple averages for the three groups, similar values of average diuretic dose for the
low and high blood pressure groups is evident. Again, due to higher p-values, more
research needs to be done to determine whether these trends are significant. This can be
achieved with a larger patient pool size.
.
6. Conclusions and Recommendations
During this project, data were collected for an in-depth look into the effect of
emergency care of congestive heart failure on short term outcomes. It is the
overwhelming consensus that there is a need for a better treatment protocol for
congestive heart failure. The most surprising finding was an apparent similarity in the
average dose of diuretic administered to patients with differing blood pressure. Diuretics
by nature lower blood pressure, and the further lowering of an already low systolic blood
pressure could actually be making patients sicker, thus prolonging their stay. Essential
body processes such as ion exchange, waste filtration and homeostasis are all governed in
part by a proper balance of water and salts, concentrations of which diuretics lower. This
may be causing the length of stay of those patients with low blood pressure to be
increased. Diuretics are certainly a good treatment option for those patents presenting
with high or even normal blood pressure, however they should not be used as a blanket
treatment for all patients presenting with chief complaints associated with congestive
heart failure.
The need for evidence based medical decision-making is clear. In order to
develop treatment standards to optimize patient wellbeing and minimize the financial
burden of care for the patient and the hospital, there needs to be more in-depth analysis of
patient data such as that done here. This clearly will necessitate the study of a larger
patient pool. However even small data sets such as this one may indicate that there is a
need for the use of standard protocols based on factors of clinical importance such as
blood pressure in CHF.
7. Works Cited
1. Darling, C. M. (2011, August). Acute Decompensated Heart Failure (ADHF) in
the Emergency Department. Worcester, Massachusetts, United States: UMASS
Medical School.
2. Centers of Disease Control and Prevention. (1994, February 11). Mortality from
Congestive Heart Failure -- United States, 1980-1990. Retrieved November 2011,
from cdc.gov: http://www.cdc.gov/mmwr/preview/mmwrhtml/00024847.htm
3. Collins, S. (2005). Emergency Department Observation of Heart Failure:
Preliminary Analysis of Safety and Cost. CHF, 68-72.
4. "Furosemide." Professional Monograph. American Society of Health-System
Pharmacists, 1 Apr. 2010. Web. 10 Apr. 2013.
5. Hall, Margaret J., Ph.D., Shaleah Levant, M.P.H., and Carol J. DeFrances, Ph.D.
"Hospitalization for Congestive Heart Failure: United States, 2000–
2010." Centers for Disease Control and Prevention. Centers for Disease Control
and Prevention, 16 Oct. 2012. Web. 10 Apr. 2013.
6. Peacick, W. (2002). Effective Observation Unit Treatment of Decompensated
Heart Failure. CHF, March/April.