Embed Size (px)
Citation preview

1
Effect of Fe doping on the structural, morphological, optical, magnetic and
dielectric properties of BaSnO3
Jibi John1, Suresh S 1,2, Savitha Pillai.S3, Reji Philip4and V.P. Mahadevan Pillai1* 1Department of Optoelectronics, University of Kerala, Kariavattom 695581, Thiruvanthapuram,
Kerala, India. 2Department of Electronics, SreeAyyappa College, Eramallikkara, Chengannur, Kerala, India
3Department of Physics, University of Kerala, Kariavattom 4Light and Matter Physics Group, Raman Research Institute, Bangalore 560080, India
* E-mail:[email protected]
Abstract
Doping at the possible A or B site in the ABO3 perovskite can alter the structural, morphological
and optical properties of the compounds. Perovskite alkaline earth stannate BaSnO3 doped with
Fe resulted in BaSn1-xFexO3 compounds having different concentrations (x=0.00, 0.01, 0.02,
0.03, 0.05 and 0.07) were prepared by solid-state method. The Rietveld analyzes were performed
to determine the phase purity and the changes in structural parameters. Morphological analysis
identifies the formation of hexagonal nanorods with doping. The non linear optical property of
the prepared samples shows optical power limiting behaviour. Magnetic property signifies the
existence of ferromagnetic order and EPR studies reveal the possible ferromagnetic ordering of
Fe doped samples. Dielectric loss decreases with Fe doping and has a gradual decrease in the
higher frequency regime and has applications in high frequency devices.
Key words: Perovskite oxide, Rietvield refinement, Hexagonal nanorods, Optical limiting
behavior, Ferromagnetic order.
1. Introduction
Alkaline-earth stannates belong to the perovskite-type oxides having the general formula ASnO3
(A = Ba, Sr, Ca) have attracted considerable attention nowadays due to their interesting physical
properties such as high optical transparency, photocatalytic activity, ferroelectricity,
superconductivity, and magnetism [1-4]. Among various perovskites, BaSnO3 is a semiconductor
with a cubic structure having a wide bandgap of 3.4 eV [5,6]. It can remain stable even at high
temperatures [7]. BaSnO3 has been found applications in thermally stable capacitors, dye-

2
sensitized solar cells, photocatalyst, humidity sensors and gas sensors [8-10]. Appropriate doping
in BaSnO3 leads to interesting magnetic, semiconducting and ferroelectric properties [11]. The
partial substitution at the cationic and the anionic sites leads to a change in the properties while
preserving the perovskite structure [12]. The oxygen vacancies are common in these structures
which in turn affect the physio-chemical properties of materials [13]. The dopant atoms at Ba2+
and Sn4+ cationic sites will enhance in the physical properties and also cause a change in the
octahedral tilting of the perovskite structure. Upadyay et al., doped La on BaSnO3 at Ba site and
found that there is a decrease in the lattice parameter and grain size with increase in lanthanum
doping concentration [14]. They attributed the conduction and dielectric relaxation to hopping of
electrons among Sn2+ or Sn3+ and Sn4+ ions [14]. High electrical mobility of 320 cm2(Vs)-1 at
room temperature and superior thermal stability at high temperatures is reported in La doped
BaSnO3 [15]. The reduction in the bandgap of Co-doped BaSnO3is ascribed due to the crystallite
size variation and defects such as oxygen vacancies [16]. Due to the capability of doping in A
and B sites, high electron mobility and oxygen stability, BaSnO3 has large potential applications
as a system to combine the versatile perovskite structure and the semiconductor technologies
[17].
Moura et al., reported that Fe doping decreased the bandgap energy of BaSnO3 and favored the
photocatalytic reaction due to the formation of intermediate levels inside the bandgap [18].The
observation of ferromagnetism in Mn and Fe-doped BaSnO3 is an important leap in the literature
that opened up the path for BaSnO3 dilute magnetic semiconductor (DMS) applications [11, 22].
DMS are formed when a small quantity of magnetic ions are doped with semiconductors. The
utilization of spin and charges of electrons in the DMS materials have attracted in the application
of spintronic devices [11]. The magnetic properties of Cr doped BaSnO3 nanostructures
synthesized by chemical precipitation method has showed a change from diamagnetic to
ferromagnetic behavior [23]. Manju et al., reported the effect of Fe/Co ions on the structural and
magnetic properties of BaSnO3 nanoparticles and found that the ferromagnetic property varies
gradually with increase in substitution of Co content. [24]. James et al., reported that the
presence of oxygen vacancies, structural deformation and surface morphology of Fe doped
BaSnO3 have improved the magnetic properties of BaSnO3 [19]. Licheron et al., reported a
superconducting behavior of Ba(Sn0.7Sb0.3)O3 sample [20]. Singh et al., reported the dielectric
properties of La doped BaSnO3 and found that the remnant polarization and the coercive field

3
decreases with increase of La in the lattice [21]. To the best of our knowledge, detailed structural
analysis using the Rietveld analysis of XRD, and measurement of nonlinear optical absorption
and dielectric properties, are not reported so far for Fe doped BaSnO3.
There are different methods for the preparation of BaSnO3. Many preparation methods were
reported to obtain nanoparticles of BaSnO3 with cubic perovskite structure such as sol-gel
method [25] hydrothermal method [26] and modified combustion technique [27] etc. In the
present work, BaSn1−xFexO3 (x =0, 0.01, 0.02, 0.03, 0.05 and 0.07) compounds were prepared by
the solid-state reaction method, and the structural, morphological, optical, electronic and their
magnetic properties have been investigated in detail.
2. Experimental Details
The powder samples of pure BaSnO3 and doped BaSn1-xFexO3 (x=1, 2, 3, 5 and 7 mol %
concentration) were synthesized by solid-state reaction method. BaCO3, SnO2 and Fe2O3
powders (Sigma, purity-99.99%) were taken in stoichiometric ratio and is mixed using an agate
mortar and pestle. The mixture is then grinded well-using acetone as the mixing media. The
powder thus grinded was taken in a platinum crucible and is heated at a temperature of 1250 °C
in a programmable furnace for 6 h at a rate 5 °C min-1 and was allowed to cool down naturally to
room temperature. To ensure the complete reaction, these mixtures were again milled and further
heated at a temperature of 1250 °C for 6h. The prepared Fe doped BaSnO3 samples with x =
0.00, 0.01, 0.02, 0.03, 0.05 and 0.07 are denoted as BF0, BF1, BF2, BF3, BF5 and BF7
respectively. The synthesized pure BaSnO3 and Fe doped BaSnO3samples were analyzed by
different characterization techniques. The crystalline purity of the prepared samples was
characterized by the Bruker Advance 8 XRD diffractometer. The XRD pattern was recorded
using Cu-KαL radiation of wavelength 1.5406 Å and at a scan speed of 2° min-1 in the 2θ range
20-80°with a step size of 0.04°. FTIR spectra were recorded by Perkin Elmer FT-IR/FIR Frontier
Spectrometer in the frequency range of 400- 4000 cm-1. Micro-Raman spectra of the synthesized
powders were recorded with excitation radiation of a wavelength of 633 nm from a helium ion
laser using Labram- HR 800 spectrometer (Horiba JobinYvon) equipped with Synapse CCD
camera system maintained at -70 °C having a spectral resolution of about 1 cm-1. Nova Nano
SEM-450 Field Emission Scanning Electron Microscope (FEI- USA) was used for analyzing the
surface morphology of the synthesized samples. Perkin Elmier Lambda 950 spectrophotometer

4
was used for capturing the UV-Visible spectrum in the wavelength range of 2300–250 nm. Open
aperture Z-scan experiments were done using a frequency doubled Q-switched Nd:YAG laser of
wavelength 532 nm for measuring the third order nonlinear absorption coefficient. Magnetic
properties were studied using a Lakeshore 7410S Vibrating Sample Magnetometer (VSM) of
sensitivity 10-7 emu and magnetic field resolution of ± 0.001%. Electron spin resonance studies
were performed at X-band, 9.5 GHz (JEOL, Model:FA200). The dielectric properties of the pure
and Fe doped compounds were studied using HIOKI3532-50LCR Hi TESTER.
3. Results and Discussion
3.1 XRD Analysis
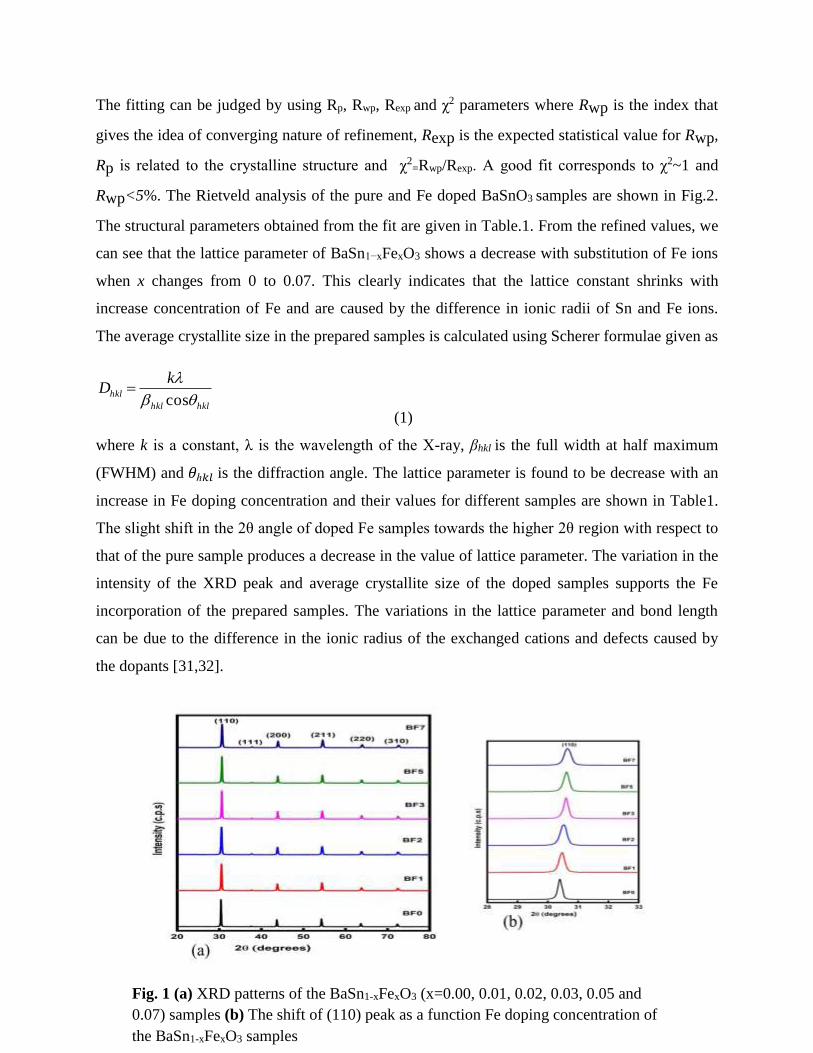
Fig.1(a) shows the XRD patterns of the BaSn1-xFexO3 (x=0.00, 0.01, 0.02,0.03, 0.05 and 0.07)
prepared by solid-state method. The XRD patterns of pure BaSnO3 and Fe doped BaSnO3
samples consist of six peaks which are indexed to (110), (111), (200), (211), (200) and
(310)lattice ref planes of cubic BaSnO3 perovskite structure with space group Pm3m. All the
peaks in the diffraction patterns are well-matched with the JCPDS Ref. Code 15 -0780 [22]. The
sharp and intense nature of the diffraction peaks shows the high-quality polycrystalline nature of
the prepared samples. It can be seen that the most intense (110) peak suffers a progressive shift
towards higher diffraction angle with increase in Fe doping concentration (BF1 to BF7) in the
BaSnO3 lattice (Fig.1(b)). The slight shift in the peak position with increase in doping
concentration Fe may be due to the difference in ionic radius of the host (Sn4+) ion and dopant
(Fe3+) ion. The ionic radius of Sn4+ ion (0.69 Å) is larger than that of Fe3+ (0.55Å) ion with low-
spin state or Fe 3+(0.645 Å) ion with high-spin state and can result in the distortion of host lattice
[28]. Further, the presence of any additional peaks correspond to secondary phases are not visible
in the XRD patterns and it gives an evidence for the partial substitution of Fe ions in the host
lattice. The peak broadening and decrease in crystallite size with doping concentration also
confirms that the dopant Fe ion involves in the growth mechanism of the synthesized
compounds. The Rietveld analysis of XRD was done to understand the changes in structural
parameters with Fe doping. The refinement of powder XRD patterns of BaSn1−xFexO3 samples
were carried out with the GSAS II software [29]. The background was fitted using shifted
Chebyschev function and the peak profile parameters were refined using pseudo-Voigt functions.
5
The fitting can be judged by using Rp, Rwp, Rexp and χ2 parameters where Rwp is the index that
gives the idea of converging nature of refinement, Rexp is the expected statistical value for Rwp,
Rp is related to the crystalline structure and χ2=Rwp/Rexp. A good fit corresponds to χ2~1 and
Rwp<5%. The Rietveld analysis of the pure and Fe doped BaSnO3 samples are shown in Fig.2.
The structural parameters obtained from the fit are given in Table.1. From the refined values, we
can see that the lattice parameter of BaSn1−xFexO3 shows a decrease with substitution of Fe ions
when x changes from 0 to 0.07. This clearly indicates that the lattice constant shrinks with
increase concentration of Fe and are caused by the difference in ionic radii of Sn and Fe ions.
The average crystallite size in the prepared samples is calculated using Scherer formulae given as
(1)
where k is a constant, λ is the wavelength of the X-ray, βhkl is the full width at half maximum
(FWHM) and 𝜃ℎ𝑘𝑙 is the diffraction angle. The lattice parameter is found to be decrease with an
increase in Fe doping concentration and their values for different samples are shown in Table1.
The slight shift in the 2θ angle of doped Fe samples towards the higher 2θ region with respect to
that of the pure sample produces a decrease in the value of lattice parameter. The variation in the
intensity of the XRD peak and average crystallite size of the doped samples supports the Fe
incorporation of the prepared samples. The variations in the lattice parameter and bond length
can be due to the difference in the ionic radius of the exchanged cations and defects caused by
the dopants [31,32].
Fig. 1 (a) XRD patterns of the BaSn1-xFexO3 (x=0.00, 0.01, 0.02, 0.03, 0.05 and
0.07) samples (b) The shift of (110) peak as a function Fe doping concentration of
the BaSn1-xFexO3 samples
hklhkl
hkl
kD
cos

6
Doping of an element can cause lattice deformation and introduce strain in the lattice of the
compound. Williamson and Hall method can be used for finding the crystallite size and strain
caused by the dopants in the host lattice [33]. Williamson and Hall relation is given by
𝛽ℎ𝑘𝑙𝑐𝑜𝑠𝜃ℎ𝑘𝑙 =𝑘λ
D′+ 2ηsinθhkl ----- (2)
where D′ is the average crystallite size in nanometers, η is the microstrain.The slope of the
Williamson–Hall (W-H) plot gives the strain and from the Y intercept, we can calculate the
average crystallite size. From Fig.3 it is found that all the prepared samples have tensile strain
and this can be due to the incorporation of the dopant ions in the host lattice. The lattice strain of
the pure and the Fe doped BaSnO3 calculated from the W-H plot is shown in Table 1. The value
of the strain in the compounds is found to be decreased with an increase in dopant concentration.
Thus the XRD analysis suggests the incorporation of dopant ion in the host Ba-Sn-O lattice.
Fig. 2. Rietveld refinement of pure and Fe doped BaSnO3 samples

7
Table 2 Atomic coordinates and Uiso parameters of pure and Fe-doped BaSnO3 compounds
Atom
site
x y z Uiso
BF0 Ba 0.5000 0.5000 0.5000 0.012(11)
Sn 0 0 0 0.009(11)
O 0 0 0.5 0.009(12)
BF3 Ba 0.5000 0.5000 0.5000 0.019(4)
Sn 0 0 0 -0.011(4)
Fe 0 0 0 -0.011
O 0 0 0.5 -0.000(10)
Table 1.Rietveld refined structural parameters of pure and Fe doped BaSnO3 samples
Parameters BF0 BF1 BF2 BF3 BF5 BF7
a=b=c
(Å)
4.1161(2) 4.1134 (1) 4.1133(3) 4.1132 (3) 4.1101(3) 4.1063 (4)
α=β=γ 90 90 90 90 90 90
volume 69.736 69.592 69.601 69.601 69.432 69.239
density 7.239 7.239 7.223 7.2083 7.195 7.185
Rexp 0.0852 0.130 0.117 0.118 0.1126 0.111
Rwp 0.095 0.116 0.1039 0.0779 0.119 0.127
(χ2) 1.240 1.135 1.186 1.054 1.072 1.144
Bond length
Sn-O
2.0582 2.05663 2.05672 2.05672 2.0550 2.0531
Crystallite
size (nm)
45 38 34 30 35 31
Lattice
strain
0.0050(14) 0.0042(23) 0.0039(17) 0.0038(26) 0.0037(63) 0.00242(95)

8
3.2 Raman analysis
Micro Raman analysis is a sensitive tool to determine the structural changes in pure and doped
samples. The partial substitution or replacement of atoms A or B cations in an ideal perovskite
ABO3 (cubic) lowers the symmetry of the structure and this can be clearly evidenced from the
Raman spectroscopy [34]. Fig.4 shows the micro Raman spectra of BaSnO3 and Fe doped
BaSnO3 samples. In general, the BaSnO3 having an ideal cubic structure with space group Pm3m
did not show first-order Raman scattering because of its centrosymmetric crystal structure [27].
The Raman bands observed in Raman spectra of these samples can be due to the presence of
defects or dopants. The undoped sample exhibit the Raman modes at 140, 193,332, 410, 561,
712, 835 and 1056 cm-1. These modes are due to the six fundamental vibrations of SnO6
octahedron which has Oh symmetry, in the distorted perovskite structure. The bands found at
561, 190 and 140 cm−1 are due to Raman active v2Eg, v4F1u and v5F2g modes respectively [35].
The difference in the spectral behavior of the pure BaSnO3 and Fe doped BaSnO3samplescan be
Fig. 3 Williamson–Hall plot of pure BaSnO3 and Fe doped BaSnO3 samples

9
clearly evidenced from the Raman spectra. The bands at 561, 657, 712 cm-1 are attributed to the
Sn-O vibration modes. The observed band shift and the enhanced broadening observed for the
Sn-O bond can be attributed to the distortion of SnO6 octahedron due to the Fe incorporation of
Fe in the host lattice. The band observed around 650 cm-1 shows a systematic shift towards the
lower wavenumbers as the Fe doping concentration increases. The medium intense band
observed at 561 cm-1 in the Raman spectrum of pure BaSnO3 sample can be due to the second
order Raman mode and its intensity decreases and appears as a shoulder band in the Raman
spectra of Fe doped samples. Also the intensity of the Raman band around 410 cm-1 decreases in
Fe doped samples. The band around 835 cm-1 possibly due to the defect induced oxygen
vacancies and shows a systematic band shift towards higher wave numbers as Fe doping
concentration increases. The intensity and broadening of the band around 835 cm-1 gets enhanced
as Fe doping concentration increases. The band 1056 cm-1 appears in the pure BaSnO3 and Fe
doped BaSnO3 with low Fe doping concentration. In samples with higher doping concentration,
the intensity gets suppressed and appears as broad band. The peak obtained at 220, 330 cm-1 in
the pure and Fe doped compound correspond to the defects or oxygen vacancies in BaSnO3 [35].
Fig. 4 Micro-Raman spectra of pure BaSnO3 and Fe doped BaSnO3 samples
10
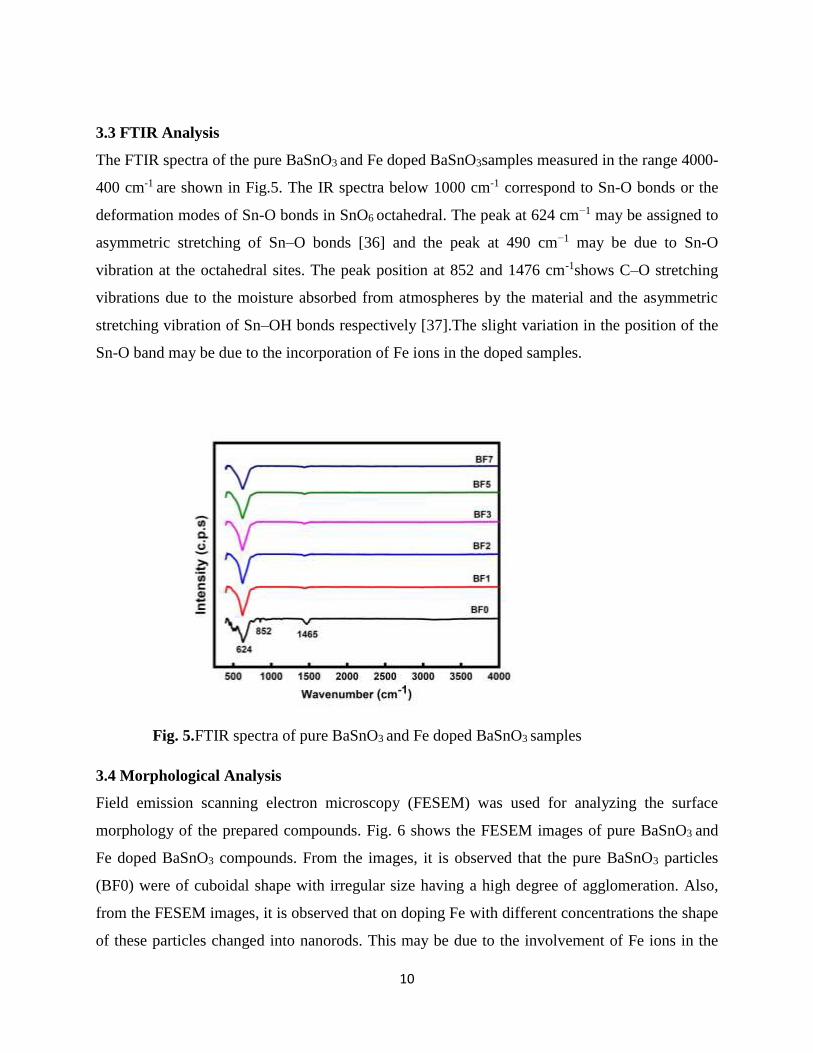
3.3 FTIR Analysis
The FTIR spectra of the pure BaSnO3 and Fe doped BaSnO3samples measured in the range 4000-
400 cm-1 are shown in Fig.5. The IR spectra below 1000 cm-1 correspond to Sn-O bonds or the
deformation modes of Sn-O bonds in SnO6 octahedral. The peak at 624 cm−1 may be assigned to
asymmetric stretching of Sn–O bonds [36] and the peak at 490 cm−1 may be due to Sn-O
vibration at the octahedral sites. The peak position at 852 and 1476 cm-1shows C–O stretching
vibrations due to the moisture absorbed from atmospheres by the material and the asymmetric
stretching vibration of Sn–OH bonds respectively [37].The slight variation in the position of the
Sn-O band may be due to the incorporation of Fe ions in the doped samples.
3.4 Morphological Analysis
Field emission scanning electron microscopy (FESEM) was used for analyzing the surface
morphology of the prepared compounds. Fig. 6 shows the FESEM images of pure BaSnO3 and
Fe doped BaSnO3 compounds. From the images, it is observed that the pure BaSnO3 particles
(BF0) were of cuboidal shape with irregular size having a high degree of agglomeration. Also,
from the FESEM images, it is observed that on doping Fe with different concentrations the shape
of these particles changed into nanorods. This may be due to the involvement of Fe ions in the
Fig. 5.FTIR spectra of pure BaSnO3 and Fe doped BaSnO3 samples

11
growth mechanism and will alter the surface morphology. The size and shape of compounds
depend on nucleation and grain growth processes. In general, the particles with higher surface
energies tend to grow faster than those with lower surface energies which results in non-uniform
growth and the particles tend to minimize their surface free energy by growing into larger
particles [38]. Thus the poly-dispersed particles combine together to form hexagonal rod like
structure [36]. The equilibrium shape of a crystal corresponds to the minimization of the total
surface energy, which varies with the orientation of the crystal [39]. The formation of rod-shaped
particles is more pronounced for 3 mol% Fe dopant concentration. Fig.7 shows the EDS mapping
and spectra of Fe doped BaSnO3 (BF3) sample and it confirms the presence of the constituent
elements in the prepared compounds. The TEM images (Fig.8(a),8(c)) and the SAED pattern
(Fig. 8(b), 8(d)) of pure and Fe doped samples shown respectively support the FESEM analysis.
The formation of a rod-shaped particle of the Fe doped sample can be confirmed from the TEM
analysis.

12
Fig.6. FESEM of pure and Fe-doped BaSnO3 samples

13
Fig.7.EDS mapping and spectra of BF3 sample
Fig. 8 (a), (c) TEM images, (b) and (d) SAED pattern of pure and Fe
doped BaSnO3 (BF3) samples

14
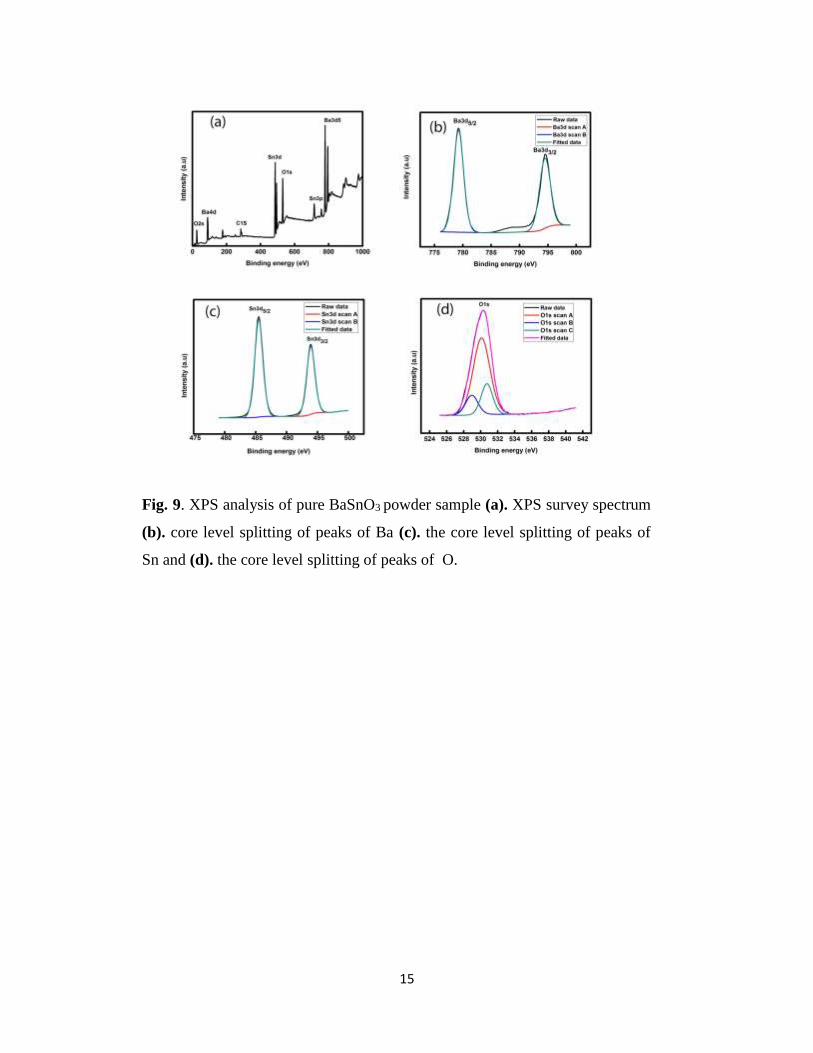
3.5. XPS Analysis
The oxidation state and surface chemical composition of elements present in the prepared pure
BaSnO3 and Fe doped BaSnO3 compound were analyzed by X-ray photoemission spectroscopy
(XPS). The XPS survey spectrum of pure BaSnO3 compound is shown in Fig. 9 (a) and it shows
peaks correspond to elements Ba, Sn, O and C. The C1s peak can be due to the presence of
contamination on the surface of the synthesized compound. The fitted and core-level XPS
spectra of Ba with doublet peaks having binding energy 779.6 eV and 794.9 eV corresponding to
Ba 3d5/2 and Ba 3d3/2 states respectively are shown in Fig. 9(b). The separation between the peak
Ba 3d5/2 and Ba 3d3/2 states representing the binding energy 15.3 eV confirms that the valence
state of barium is in Ba2+ state [40, 41]. Fig.9(c) shows the core level splitting of the Sn3d
spectrum having the spin-orbital splitting, for the Sn (3d) state with 3d5/2 and 3d3/2 states having
doublet peaks with binding energy values 485.4 eV and 493.8 eV respectively with a peak
separation of 8.4 eV. The separation of Sn spin-orbit doublet corresponds to the Sn4+ state [42,
43]. The deconvoluted and core level O1s spectrum of the pure sample is shown in Fig. 9(d). The
deconvoluted O1s have three peaks corresponding to binding energies 528.78, 530.09 and 530.64
eV respectively. The lower binding energy corresponds to the lattice oxygen species (O2−) [44].
The intermediate and the higher binding energy values correspond to the adsorption oxygen
species and the oxygen vacancy present in the compound respectively [44].
15
Fig. 9. XPS analysis of pure BaSnO3 powder sample (a). XPS survey spectrum
(b). core level splitting of peaks of Ba (c). the core level splitting of peaks of
Sn and (d). the core level splitting of peaks of O.
16
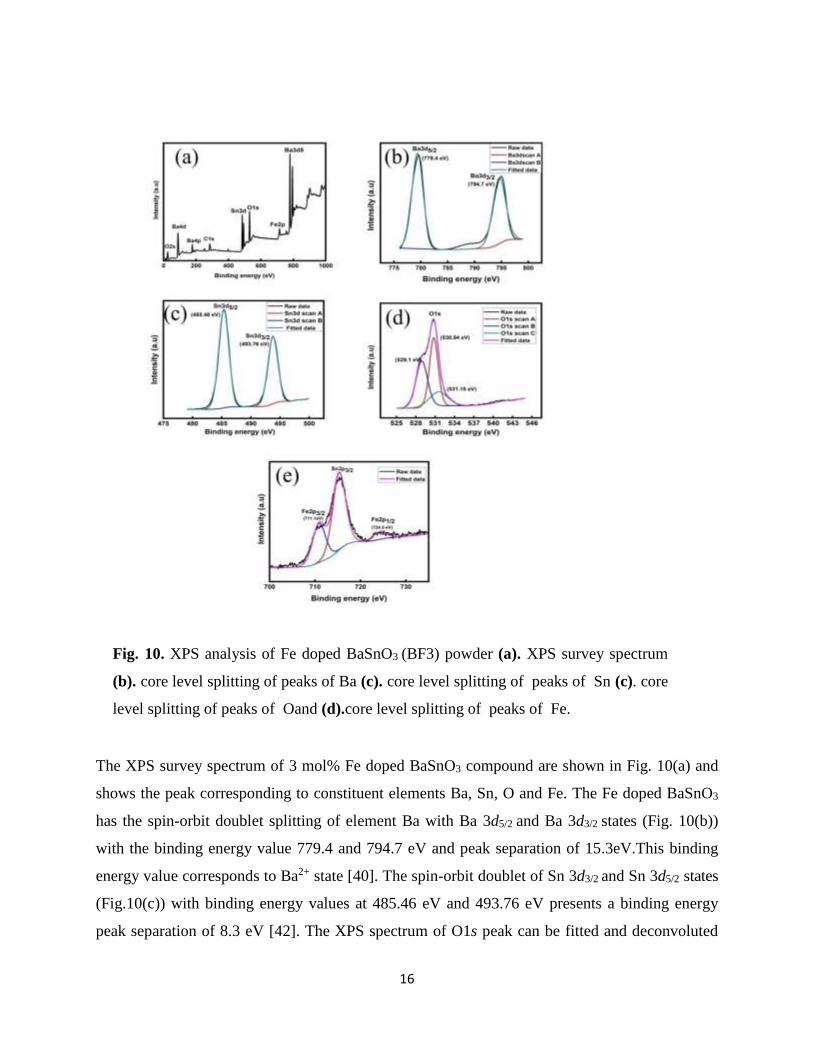
The XPS survey spectrum of 3 mol% Fe doped BaSnO3 compound are shown in Fig. 10(a) and
shows the peak corresponding to constituent elements Ba, Sn, O and Fe. The Fe doped BaSnO3
has the spin-orbit doublet splitting of element Ba with Ba 3d5/2 and Ba 3d3/2 states (Fig. 10(b))
with the binding energy value 779.4 and 794.7 eV and peak separation of 15.3eV.This binding
energy value corresponds to Ba2+ state [40]. The spin-orbit doublet of Sn 3d3/2 and Sn 3d5/2 states
(Fig.10(c)) with binding energy values at 485.46 eV and 493.76 eV presents a binding energy
peak separation of 8.3 eV [42]. The XPS spectrum of O1s peak can be fitted and deconvoluted
Fig. 10. XPS analysis of Fe doped BaSnO3 (BF3) powder (a). XPS survey spectrum
(b). core level splitting of peaks of Ba (c). core level splitting of peaks of Sn (c). core
level splitting of peaks of Oand (d).core level splitting of peaks of Fe.
17
into three peaks centered at 529.1 eV, 530.94 eV and 531.15 eV (Fig.10 (d)). The lowest binding
energy (529.16 eV) peak is associated with lattice oxygen. The peak corresponding to binding
energy at 530.94 eV corresponds to the adsorption oxygen species (O22−) and the peak
corresponding to the binding energy 531.15 eV represents the oxygen vacancy in the compound
[44,45]. The binding energy shift of the lattice oxygen and the shoulder peak indicates that the Fe
ions indeed influence the optical properties of the BaSnO3 compound and it is also confirmed
from the UV-Visible analysis with Fe dopant concentration. The fitted and core-level XPS
spectrum of Fe doped BF3 sample is shown in Fig. 10(e). The observed binding energy of Fe in
711.1 and 724.5 eV correspond well with the characteristics of Fe3+ and confirms Fe in 3+
oxidation state (Fig.4. 10 (e))[46]. The peak around 715.4eV corresponds to theSn 3p3/2 state of
the Sn element.
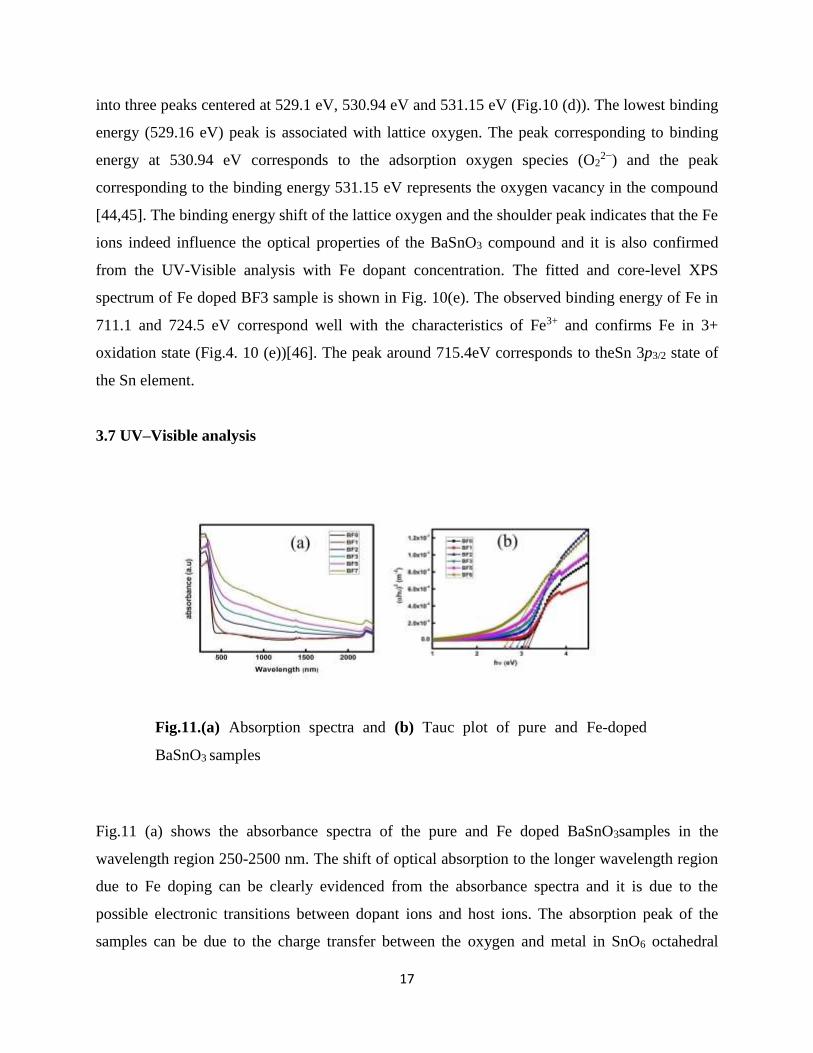
3.7 UV–Visible analysis
Fig.11 (a) shows the absorbance spectra of the pure and Fe doped BaSnO3samples in the
wavelength region 250-2500 nm. The shift of optical absorption to the longer wavelength region
due to Fe doping can be clearly evidenced from the absorbance spectra and it is due to the
possible electronic transitions between dopant ions and host ions. The absorption peak of the
samples can be due to the charge transfer between the oxygen and metal in SnO6 octahedral
Fig.11.(a) Absorption spectra and (b) Tauc plot of pure and Fe-doped
BaSnO3 samples

18
groups. The optical band gap (Eg) values of pure and doped samples were determined using the
Tauc plot equation [40] given as
ngEhAh (3)
where α is the absorption coefficient, h is the Planck’s constant, ν is the frequency of radiation
and A is the band edge sharpness. For all the samples the straight line Tauc plot is obtained for
the case of exponent n = ½ which corresponds to direct allowed transition [47]. By extrapolating
the plot between (αhν)2 versus hν, the bandgap energy of pure and doped BaSnO3 samples can be
found out which is shown in Fig.11 (b). The bandgap energy value for pure BaSnO3 was found
to be 3.15 eV which is in agreement with the previously reported value [22]. It is found that the
bandgap energy value decreases systematically with increase in Fe doping concentration. There
will be a formation of new intermediate energy levels due to the dopant atoms in the host lattice.
Similar behavior of redshift in the bandgap of the Cr and Mn doped BaSnO3 nanostructures is
reported [48, 49]. Thus the optical absorption spectrum clearly gives an evidence for the
interaction between the host BaSnO3 lattice and the doped Fe atoms.
3.8 Nonlinear Optical Properties
The nonlinear optical properties of pure and Fe doped BaSnO3samples were measured by the
open aperture Z-scan technique. The samples were excited using a Q-switched Nd:YAG laser at
the second harmonic emission at wavelength of 532 nm. In this experiment, the laser beam is
focused using a convex lens. The sample is placed at different positions with respect to the focal
point, and the corresponding optical transmissions are measured. The position-transmission
curve thus obtained is called the open aperture Z-scan curve, from which the nonlinear
absorption coefficient of the sample can be calculated. The open aperture Z-scan transmittance of
the prepared BaSn1-xFexO3 (x =0, 0.01, 0.03, 0.05 and 0.07) samples are shown in Fig.12(a). The
circles represent the experimental data and the solid lines represent theoretical fits to the data.
The valley shape of the open aperture Z-scan curves indicates strong reverse saturable absorption
(RSA) taking place in the samples.
The nonlinear absorption coefficient can be found out by
𝛼(𝐼) =α0
(1+I
Is)
+ 𝛽𝐼 (4)

19
Where α0 is the linear absorption coefficient at the excitation wavelength, ‘I’ is the input laser
intensity, Is is the saturation intensity and β is the third order RSA coefficient. The corresponding
differential equation describing the nonlinear propagation of light through the sample is given by
𝑑𝐼
𝑑𝑧 ′= − [
α0
(1+I
Is)
+ 𝛽𝐼] 𝐼 (5)
which can be fitted numerically to the measured data to find Is and β. Here, z' is the propagation
distance within the sample [49]. The normalized transmittance plotted as a function of input
intensity (Fig.4.12(b)) reveals the RSA behavior of the samples. Values of β and Is, calculated
from the numerical best fits to the experimental data, are given in Table 3. It is interesting to note
that as the Fe doping concentration is increased the reverse saturable absorption coefficient
increases systematically. The increase of β values with Fe dopant concentration may be due to
the decrease in the variation of bandgap energy of the samples. The obtained β values are fairly
high, of the order of 10-11 mW-1.Also it is to be noted that as the Fe doping concentration is
increased the value of saturation intensity decreases. The highest value of β (1.1x10⁻¹⁰ m/W) and
the lowest value of saturation intensity (0.3x 10¹³W/m2) is obtained for BF7 samples. The strong
RSA nature of these samples makes them ideal candidates for optical power limiting
applications. A similar trend of increase of β values and decrease of Is value with increase in
doping concentration is obtained for Mn doped samples [49].

20
Fig.12.(a) Open-aperture Z-scan curves measured for pure and Fe
doped BaSnO3 samples. (b) The normalized transmittance calculated as
a function of input intensity. Symbols are data points while solid curves
are numerical fits calculated using equation 5.
Table 3. Nonlinear optical parameters of the prepared pure and Fe doped
BaSnO3 samples.
Sample code Is
(W/m2)
Nonlinear
absorption coefficient
(m/W)
BF0 1.4 x 10¹³ 0.3 x10⁻¹⁰
BF1 1.0 x 10¹³ 0.48 x10⁻¹⁰
BF3 0.8 x 10¹³ 0.66 x10⁻¹⁰
BF5 0.4 x 10¹³ 0.86 x10⁻¹⁰
BF7 0.3 x 10¹³ 1.1 x10⁻¹⁰

21
3.6 Photoluminescence analysis
PL is a sensitive technique used for the analysis of defect states and the disorder cluster
parameters present in the prepared samples. Fig. 13 shows the room temperature PL spectra of
pure and Fe doped BaSnO3 compounds when excited with a radiation of wavelength of 350 nm.
Doping of iron creates defects in BaSnO3 system. Pure and Fe doped BaSnO3 compounds exhibit
emission at 395nm (3.1eV) which corresponds to the band edge. UV-Visible spectra show a
systematic decrease of band gap energy with increase in Fe doping concentration. In the PL
spectra also these peaks show a red shift. The blue-green emission peak with 450 nm and 465 nm
can be attributed to the transitions within the defect centers, such as oxygen vacancies in the
compounds [47, 48]. An emission peak at 480nm (2.57eV) is attributed to the transitions of Sn
3P01 -1D2. The peak at 492 nm (2.52eV) can be ascribed to Ba 3P0
2 - 3D3 transitions. The less
intense peak observed near 515 nm is due to Ba 3P0-3D1 transitions [48].
Fig.13. PL spectra of pure and Fe doped BaSnO3 powder
samples with different Fe dopant concentration

22
3.9 Magnetization studies
The field-dependent magnetization of pure and Fe-doped BaSnO3 compounds is shown in
Fig.14. As reported, undoped sample (BF0) shows diamagnetic nature [29] and with an increase
in Fe doping concentration there arises a positive value of magnetic moments. The magnetic
moment monotonically varies with Fe concentration. The inset of Fig. 14 shows the well-defined
hysteresis loop of Fe doped BaSnO3 compounds with coercivity ranges from 73 to 235 Oe which
indicate the existence of ferromagnetic domains in the Fe doped samples. The possible reasons
for the FM ordering at room temperature has been explained by various authors [29,40]. It is
reported that the spin of the electron trapped in the oxygen vacancy interacts with each spin of Fe
ions within its orbital and results in Fe-Vo-Fe configuration which leads to ferromagnetic order
between the two Fe ions. Also, the observed magnetic moments can be due to F-centre exchange
(FCE) mechanism of Fe-V0-Fe in which direct ferromagnetic coupling of metal ions takes place
through an oxygen vacancy [50]. Pratiba et al., reported the origin of ferromagnetic behavior in
Fe doped BaSnO3 is through electrons trapped at defects such as the oxygen vacancies (F center)
form a bound magnetic polaron [51]. Coey et al., [52] reported the bound magnetic polaron
(BMP) model for the observed ferromagnetism in Fe doped CaSnO3 and for magnetic ordering in
insulating systems. When the concentration of Fe increases, oxygen vacancies are expected to
arise near Fe sites and d electrons of Fe are supposed to interact through FCE [49, 53]. Thus, Fe
spins may align parallel along the field which leads to ferromagnetic coupling and increased
magnetization behavior in the prepared compounds.

23
Fig.14. M-H curve of pure and Fe-doped BaSnO3 at T= 300K

24
3.10 EPR Studies
Electron Paramagnetic Resonance (EPR) studies were used to study the magnetic microstructure
and the presence of unpaired electrons. Fig.15 shows the EPR spectra of pure and Fe doped
BaSnO3 samples recorded at room temperature. From the figure, it is observed that pure and all
Fe doped BaSnO3 compounds exhibits resonance signals. It is known that the pure BaSnO3
compound is found to be EPR inactive due to the absence of unpaired electrons [54]. But in the
present work, EPR is active for pure BaSnO3 compound which reveal the presence of F-centers
created by the electrons trapped at (oxygen) anion vacancies [55]. Since the samples have
prepared by high temperature solid-state synthesis route, that can lead to the formation oxygen
vacancies. The oxygen vacancies act as double electron donors having charge carriers and the
spins can polarize through exchange interactions. The sharp resonance signal that appeared with
g ~ 2.0 may be attributed to the oxygen vacancy electron center [36, 56]. In the case of Fe-doped
samples, the intensity of F-center signal is higher compared with that of pure sample and the g
value is found to be ~1.99. It is reported that the g value of isolated Fe3+ions is very close to that
of a free electron [57]. Hence, the observed signals at ~ 338 Oe indicate the presence of isolated
Fe3+ ions. It is also noted that there appears broad and less intensity signals at higher field region
and it can be due to the ferromagnetic coupling of Fe3+ pairs [22]. The broad ferromagnetic
Fig.15. EPR spectra of pure and Mn-doped BaSnO3 samples

25
resonance signal with g value of 1.95 is caused by the exchange interactions between Fe3+ ions
[58]. The EPR studies reveal the possible ferromagnetic ordering of Fe doped samples.
3.11 Dielectric Analysis
Dielectric properties of a material such as dielectric constant, dielectric loss will depend on
different parameters such as frequency of the applied field, temperature, structure, particle size
etc. and is an important property for designing optoelectronic devices. Figure 16 shows the
dielectric properties of pure and Fe doped BaSnO3in a wide range of frequencies taken at room
temperature. The dielectric constant (Fig.16 (a)) is found to be decreasing with increasing
frequency for all the pure and Fe doped samples. The dielectric constant is maximum for low
frequency and is minimum for high frequency and this behavior can be due to Maxwell-Wagner
model polarization [59] in which material is composed of conducting grains separated by poor
conducting grain walls. At low frequency, grain boundary is more effective and at high
frequency grains are effective. For higher frequency, due to accumulated charge carriers within
the grain boundary, it cannot follow the applied field, which decreases the dielectric constant
[60]. It is reported that the high values of dielectric constant at low frequencies can be due to
oxygen vacancies, grain boundaries effect, interfacial dislocations, charged defects, and space
charge polarization due to heterogeneous dielectric structure [61]. The decrease in dielectric
constant with Fe doping may be due to the decrease in polarizability caused by the neutralization
Fig. 16 Variation of (a) dielectric constant (b) loss tangent for pure and Fe
doped BaSnO3

26
of Fe ions with oxygen ions [62]. Fig. 16 (b) shows the variation of dielectric loss (tan δ) values
of prepared pure and Fe doped BaSnO3 as a function of frequency. The energy loss in the system
with the applied field is represented by loss tangent (tanδ). From the Fig.16 (b), we can see that
dielectric loss values decrease with the increase of frequency for pure and doped samples which
may be due to the space charge polarization. The pure BaSnO3 sample has maximum loss which
decreases with Fe doping and has a gradual decrease in the higher frequency regime.
Fig. 17 shows the variation of conductivity with the frequency of pure and Fe doped BaSnO3.
The ac electrical conductivity of the synthesized pure and Fe compounds is calculated using the
relation
σ (ac) = Ԑ'Ԑ0ωtanδ -----(6)
where Ԑ0 and Ԑ' are the permittivity of free space and material respectively and ω is the
frequency of the applied field. The conductivity of all the samples is found to be increasing with
the increase of frequency and this may be due to the hopping between the charge carriers. For a
particular frequency, conductivity is found to decrease with the increase in Fe concentration.
Similar behavior is reported in the case of Co-doped ZnO [63]. The reason behind this may be
due to the increase in Fe concentration produces defect ions such as oxygen vacancies in the host
system segregate at the grain boundaries. The grain boundary defect barrier leads to the blockage
Fig.17. Variation in ac conductivity of pure and Fe doped
BaSnO3 with frequency

27
to the flow of charge carriers and results in decreases in conductivity with Fe dopant
concentration [64]. The Fe dopant in the host lattice ceases the hopping mechanism resulting in
the decrease of electrical conductivity with an increase in Fe concentration. Also, the DC
electrical resistivity of the Fe doped compounds is found to increase with doping concentration
and is in the range of 107Ωm.
4. Conclusion
Perovskite pure and Fe doped BaSnO3 compounds were synthesized by the solid-state method.
XRD patterns reveal that the pure and the doped samples have the polycrystalline cubic phase.
Rietveld analysis gives information about the change in the lattice parameter and the Sn-O bond
lengths of Fe doped samples. The structural identification of the prepared compounds was done
by micro-Raman and FTIR spectra. The morphological behavior shows that there is a change in
the shape of particles from cuboidal to rod shape. The elemental analysis of the prepared
compounds was done by EDS and XPS analysis. The presence of oxygen vacancies was
confirmed from the XPS and EPR analysis. The observed enhancement in the feeble magnetic
moments with Fe doped BaSnO3 compounds is beneficial in spintronic device applications. The
nonlinear optical absorption exhibited by the synthesized compounds can be used for optical
power limiting applications. The observed decrease in the dielectric loss with Fe doped samples
has useful applications in optoelectronics and in high frequency devices.
References
1. Zhe Wang, Hanjong Paik, Zhen Chen, David A. Muller, Darrell G. Schlom, Epitaxial
integration of high-mobility La-doped BaSnO3 thin films with silicon, APL Mater. 7,
022520 (2019) doi: 10.1063/1.5054810
2. T. Ishihara, K. Kometani, M. Hashida, Y. Takita, J. Mixed Oxide Capacitor of BaTiO3–
PbO as a New Type CO2 Gas Sensor, Am. Chem. Soc. 75, 613 (1992)
3. J. Cerda, J. Arbiol, R. Diaz, G Dezanneau, J. R. Morante,Synthesis of perovskite-
type BaSnO3 particles obtained by a new simple wet chemical route based on a Sol–gel
process, Mater. Lett. 56 (2002)131-136
4. A.M. Azad, L.L.W. Shyan, P.T. Yen, N.C. Hon,. Microstructural evolution in
MSnO3 ceramics derived via self-heat-sustained (SHS) reaction technique Ceram. Int. 26,
(2000), 685
5. Qinzhuang Liu , Jianjun Liu, Bing Li, Hong Li, Guangping Zhu, Kai Dai, Zhongliang
Liu, Peng Zhang, and Jianming Dai, Composition dependent metal-semiconductor

28
transition in transparent and conductive La-doped BaSnO3 epitaxial films Appl. Phys.
Lett. 101, 241901 (2012); https://doi.org/10.1063/1.4770299
6. U. Lumpe, J. Gerblinger, H. Meixner, Nitrogen oxide sensors based on thin films of
BaSnO3, Sens. Actuators B 26–27, 97 (1995)
7. M.G. Smith, J.B. Goodenough, A. Manthiram, R.D. Taylor, W. Peng, C.W. Kimbal, J.
Tin and antimony valence states in BaSn0.85Sb0.15O3−δ, Solid State Chem. 98 (1992) 181.
8. P.H. Borse, U.A. Joshi, S. M. Ji, J. S. Jang, J. S. Lee. Band gap tuning of lead-substituted
BaSnO3 for visible light photocatalysis, Appl. Phys. Lett. 90, (2007) 03410
9. Bernhard Ostrick , Maximilian Fleischer, Uwe Lampe, Hans Meixner, Preparation of
stoichiometric barium stannate thin films: Hall measurements and gas sensitivities
Sensors and Actuators B 44 (1997) 601–606
10. A.Marikutsa, M.Rumyantseva, A.Baranchikov, Alexander Gaskov, Nanocrystalline
BaSnO3 as an Alternative Gas Sensor Material: Surface Reactivity and High Sensitivity
to SO2 Materials, 8, (2015), 6437-6454 276
11. K. Balamurugan, N. H. Kumar, B. Ramachandran, M.S. Ramachandra Rao, J. A.
Chelvane,P.N. Santhosh, Magnetic and optical properties of Mn-doped BaSnO3 Solid
State Communications 149 (2009) 884-887
12. A. L. M. de Oliveira, V.Bouquet, V.Dorcet, S. Ollivier, S. Députier, A. Gouveia de
Souza, M. SiuLi, E. Longo, I. Távora Weber, I.M.Garcia, Evolution of the structural and
microstructural characteristics of SrSn1-xTixO3 thin films under the influence of the
composition, the substrate and the deposition method dos Santos, M.Guilloux-Viry,
Surf.Coat.Technol.313 (2017) 361-373.doi:10. 1016/j.surfcoat.2017.01.082
13. S.A. Wolf, Spintronics: A Spin-Based Electronics Vision for the Future Science 294,
1488–1494 (2001)
14. Upadhyay S, Parkash O and Kumar D, Synthesis, structure and electrical behaviour of
lanthanum-doped barium stannate, J. Phys. D: Appl. Phys. (2004) 37 1483
15. H. J. Kim, U. Kim, T. H. Kim, J. Kim, H. M. Kim, B. G. Jeon, W. J. Lee, H. S. Mun, K.
T. Hong, J. Yu,Physical properties of transparent perovskite oxides (Ba,La)SnO3 with
high electrical mobility at room temperature, Phys. Rev. B 86, 165205 (2012).
16. D.S. Gao, X.D. Gao, Y.Q. Wu, T.T. Zhang, J.N. Yang, X.M. Li, Epitaxial Co doped
BaSnO3 thin films with tunable optical bandgap on MgO substrate, Applied Physics A
(2019) 125:158
17. U. Kim, C. Park,1 T. Ha, R. Kim, H. S. Mun, H. M. Kim, H. J. Kim, T. H. Kim, N. Kim,
J.Yu, K.H.Kim, J. H. Kim, K. Char, Dopant-site-dependent scattering by dislocations in
epitaxial films of perovskite semiconductor BaSnO3, APL Materials 2, 056107 (2014)
18. K. F. Moura, L.Chantellea, D. Rosendoa, E. Longob, I.M.G. Effect of Fe3+ Doping in
the Photocatalytic Properties of BaSnO3 Perovskitedos Santosa, Materials Research.
2017; 20(Suppl. 2): 317-324
19. K.Balamurugan, N.H.Kumar, J.A.Chelvane, P.N,Santhosh, Room temperature
ferromagnetism in Fe-doped BaSnO3, J. Alloys Compd. 472, 9–12 (2009)

29
20. M. Avinash, M. Muralidharan, K. Sivaji, Structural, optical and magnetic behaviour of
Cr doped BaSnO3 perovskite nanostructures, Physica B: Condensed matter 570 (2019),
157-165
21. M.R. Manju, V.P. Kumar, V. Dayal, Investigation of ferromagnetic properties in
Fe/Co substituted BaSnO3 perovskite stannates, Physica B 500 (2016) 14–19
22. K.K James, A. Aravind, M.K Jayaraj, Structural, optical and magnetic properties of Fe-
doped barium stannate thin films grown by PLD, Appl. Surf. Sci. 282 (2013)121–5
23. M. Licheron, G. Jouan, E. Husson, J.Characterization of BaSnO3 powder obtained by a
modified sol-gel route, J Eur.Ceram. Soc. 17 (1997) 1453-1457.
24. P.H. Borse, U.A. Joshi, S. M. Ji, J. S. Jang, J. S. Lee. Band gap tuning of lead-substituted
BaSnO3 for visible light photocatalysis, Appl. Phys. Lett. 90, (2007) 034103
25. D. Fengtao, C. Bin, C. Hualei, N. Ruiyuan, C. Zhuo, Mater. Res. Bull. 44 (2009) 1930–
1934
26. Li Hui Bi, Tang Wen Yi, Luo Juan Li, Xiao Ting, Li Wei Da, Hu, Yan Xiao, Min Yuan,
Fabrication of porous BaSnO3 hollow architectures using BaCO3@SnO2 core–shell
nanorods as precursors, Appl. Surf. Sci. 257 (2010) 197-202
27. A.S. Deepa, S. Vidya, P.C. Manua, Sam Solomon, Annamma John, J.K. Thomas,
Structural and optical characterization of BaSnO3nanopowder synthesized through a
novel combustion technique, J. Alloys Compd. 509 (2011) 1830–1835
28. E. Swatsitang, A.Karaphun, S. Phokha, T. Putjuso Characterization and magnetic
properties of BaSn1 –xFexO3 nanoparticles prepared by a modified sol– gel method,
J.Sci.Technol (2016) 77, 78–84
29. Toby, B. H., & Von Dreele, R. B. (2013). "GSAS-II: the genesis of a modern open-
source all purpose crystallography software package". Journal of Applied
Crystallography, 46(2), 544-549.
30. S. Sumithra, N.V. Jaya, Band gap tuning and room temperature ferromagnetism in Co
doped Zinc stannate nanostructures, Physica B 493, 35 (2016)
31. J.U. Brehm, M. Winterer, and H. Hahn, Synthesis and local structure of doped
nanocrystalline zinc oxides, J.Appl. Phys. 100, 1 (2006).
32. S.Sumithra, N.V. Jaya, Structural, optical and magnetization studies of Fe-doped CaSnO3
nanoparticles via hydrothermal route, J. Mater. Sci. Mater. Electron. 29, 4048 (2018).
33. M. Muralidharan, V. Anbarasu, A. E.Perumal, K. Sivakumar, Room temperature
ferromagnetism in Cr doped SrSnO3 perovskite system, J.Mater Sci: Mater Electron 28,
(2017), 4125–4137
34. Lucena, G.L., Maia, A.S., Souza, A.G. Structural changes in Fe-doped SrSnO3
perovskites during thermal analysis. J.Therm.Anal Calorim 115, (2014),137–144.275
35. S.A. Salehizadeh, H.M. Chenari, M. Shabani, H.A. Ahangar, R. Zamiri, A. Rebelo, J.
S. Kumar, M.P.F.Graca, J.M.F. Ferreira, Structural and impedance spectroscopy
characteristics of BaCO3/BaSnO3/SnO2 nanocomposite: observation of a non-monotonic
relaxation behavior RSC Adv.8, 2100 (2018). doi: 10.1039/c7ra12442b.

30
36. S.Sumithra, N.V. Jaya, Structural, optical and magnetization studies of Fe-doped
CaSnO3 nanoparticles via hydrothermal route, J.Mater. Sci. Mater. Electron. 29,4048
(2018).
37. J. Bohnemann, R. Libanori, M. Moreira, E. Longo, High-efficient microwave synthesis
and characterization of SrSnO3 Chem. Eng. J. 155, (2009), 905–909
38. M.C.F. Alves, M.R. Nascimento, S.J.G. Lima, P.S. Pizani, J.W.M. Espinosa, E. Longo,
L.E.B. Soledade, A.G. Souza, I.M.G.Santos, Influence of synthesis conditions on
carbonate entrapment in perovskite SrSnO3, Mater. Lett. 63, (2009), 118–120
39. Souza, A.E., Santos, G., Barra, B., Macedo, W.D. Jr., Teixeira, S.R., Santos, C.M.,
Longo, E.Photoluminescence of SrTiO3: Influence of Particle Size and Morphology
Cryst. Growth Des. 12(11), (2012), 5671–5679
40. M.R. Manju, K.S. Ajay, N.M. D'Souza, S. Hunagund, R.L. Hadimani, V. Dayal,
Enhancement of Ferromagnetic Properties in Composites of BaSnO3 and CoFe2O4, J.
Magn. Magn. Mater. (2017)
41. S. H. Butt, M. S. Rafique, K. Siraj, A. Latif, A. Afzal, M. S. Awan, S. Bashir, N. Iqbal,
Epitaxial thin-film growth of Ruddlesden–Popper-type Ba3Zr2O7 from a BaZrO3 target by
pulsed laser deposition, Appl. Phys. A 122:658 (2016)
42. J. John, S. Suresh, S. R. Chalana, V. P. Mahadevan Pillai, Effect of substrate temperature,
laser energy and post- deposition annealing on the structural, morphological and optical
properties of laser-ablated perovskite BaSnO3 films, Appl. Phys. A 125, (2019) 743.
43. W.Ahmad, D. Liu, W.Ahmad, Y. Wang, P. Zhang, T. Zhang, H. Zheng, Z. D. Chen, S.
Li, Physisorption of Oxygen in SnO2 Nanoparticles for Perovskite Solar Cells, IEEE J.
Photovolt.9, (2019), 200-206
44. J. John, S.R. Chalana, R. Prabhu, V.P.M. Pillai, Effect of oxygen pressure on the
structural and optical properties of BaSnO3 films prepared by pulsed laser deposition
method, Appl. Phys. A 125, (2019), 155.
45. J. Socratous, K.K. Banger, Y. Vaynzof, A. Sadhanala, A.D. Brown, A. Sepe, U. Steiner,
H. Sirringhaus, Adv. Funct. Mater. (2015). https ://doi.org/10.1002/adfm.20140 4375
46. K. Lee, S. Shin, T. Degen, W.Lee, Y. S. Yoon, In situ analysis of SnO2/Fe2O3/RGO to
unravel the structural collapse mechanism and enhanced electrical conductivity for
lithium-ion batteries Nano Energy, 32 (2017) 397–407
47. D.L Wood, J. Tauc, Weak absorption tails in amorphous semiconductors. Phys. Rev. B 5,
(1972) 3144
48. M. Avinash, M. Muralidharan, K. Sivaji, Physica B: Condensed matter 570 (2019),
157-165
49. J John, M. Dhananjaya, S. Suresh, S. Savitha Pillai, M. Sahoo, O. M. Hussain,R.Philip,
V. P. Mahadevan Pillai, Journal of Materials Science: Materials in Electronics (2020)
50. F. La Mattina, J.G. Bednorz, S.F. Alvarado, A. Shengelaya, K.A. Müller, H. Keller,
Controlled oxygen vacancies and space correlation with Cr3+ in SrTiO3 Phys. Rev. B 80,
075122 (2009)
51. G. Prathiba, S. Venkatesh, N.H. Kumar,Structural, magnetic and semiconducting

31
properties of Fe doped SrSnO3 Solid State Commun. 150(31–32), 1436 (2010)
52. J.M.D Coey, M. Venkateshan, Donor impurity band exchange in dilute ferromagnetic
oxides, Nat Mater 4, (2005) 173–179
53. F.T.G. Vieira, G.P. Casali, S.J.G. De Lima, M. SiuLi, E. Longo, A.D. Maia, A.G. Souza,
I.M. Photoluminescence in SrSnO3:Fe3+ Perovskite Dos Santos, Curr. Phys. Chem. 4, 21
(2014)
54. A. Sarkar, S. K. De. Defect and Optical Properties of Sb doped and hydrogenated
BaSnO3, Semicond. Sci. Technol. 33, (2018), 035018
55. J.E.Wertz, J.R.Bolton, Electron Spin Resonance Elementary Theory and Practical
Applications, first ed., New York,Chapman and Hall, 1986
56. J. Meng, Q. Lin, T. Chen, X. Wei, J. Li, Z. Zhang, Oxygen vacancy regulation on
tungsten oxides with specific exposed facets for enhanced visible-lightdriven
photocatalytic oxidation Nanoscale, 2018, 10, 2908-2915
57. V. Singh, G. Sivaramaiah, J.L. Rao, N. Singh, A.K. Srivastava, P.K. Singh, S.U. Pawar,
H. Gao, P. Mardina, J. Combustion synthesized Fe doped CeO2 powder-characterization,
optical absorption and EPR spectroscopy Mater. Sci. 27, 4494 (2016)
58. I. Ardelean, P. Pascuta, L.V. Giurgiu, EPR and Magnetic Susceptibility Investigations of
Fe2O3B2O3-KCl Glasses, Int. J. Mod. Phys. B 17, (2003), 3049
59. K.W. Wagner, Zur theorie der unvollkommenen dielektrika, Annalen der Physik 345 (5) (
1913) 817‐855
60. I. Gul, A. Abbasi, F. Amin, M. Anis‐ur‐Rehman, A. Maqsood, Structural, magnetic and
electrical properties of Co1−xZnxFe2O4 synthesized by co-precipitation method,
Journal of magnetism and magnetic materials 311 (2) (2007) 494‐499
61. S. Sharma, K.Nanda, R.S. Kundu, R. Punia, N. Kishore, Journal of Atomic, Molecular,
Condensate & Nano Physics, (2015) 15–31
62. M.M. Hassan, A.S.Ahmed, M.Chaman, WasiKhan, A.H.Naqvi, A.Azam, Structural
and frequency dependent dielectric properties of Fe3+ doped ZnO nanoparticles
Materials Research Bulletin 47, (2012) 3952–3958 268
63. S. A.Ansari, A. Nisar, B. Fatma, W. Khan, A.H. Naqvi, Investigation on structural,
optical and dielectric properties of Co doped ZnO nanoparticles synthesized by gel-
combustion route, Material Science and Engineering B,177, 428-435 (2012)
64. R. Zamiri, A. Kaushal, A. Rebelo, J.M.F. Ferreira, Ceramics International,40,1635-1639,
(2013), http://dx.doi.org/10.1016/j.ceramint.2013.07.054


![Effect of doping and sintering in structure and magnetic ... · is doping with transition metal (TM) ions (Fe, Cr, V, Ni, Mn) in semiconducting hosts, such as TiO 2 [5], ZnS [6],](https://img.pdfslide.net/doc/110x75/5f4d2eac12a0d14da47b725b/effect-of-doping-and-sintering-in-structure-and-magnetic-is-doping-with-transition.jpg)


![Research Article Influence of Fe-Doping on the Structural ...downloads.hindawi.com/journals/jnt/2016/8281247.pdf · ders ZnO-Fe received by pulsed electron beam evaporation [ , ],](https://img.pdfslide.net/doc/110x75/60044c0b8c8cca7b686c6b92/research-article-influence-of-fe-doping-on-the-structural-ders-zno-fe-received.jpg)