Embed Size (px)
Citation preview
European Journal of Business, Economics and Accountancy Vol. 5, No. 6, 2017 ISSN 2056-6018
Progressive Academic Publishing, UK Page 1 www.idpublications.org
EFFECT OF FIRM SIZE ON INNOVATION AMONG
MANUFACTURING COMPANIES IN NIGERIA
Oluyinka Isaiah Ogungbade
Department of Economics
Accounting and Finance, Jomo
Kenyatta University of
Agriculture and Technology
Nairobi, KENYA
Tobias Olweny
Department of Economics
Accounting and Finance, Jomo
Kenyatta University of
Agriculture and Technology
Nairobi, KENYA
O. Oluoch
Department of Business
Administration, Jomo
Kenyatta University of
Agriculture and Technology
Nairobi, KENYA
ABSTRACT
The relation between firms’ size and innovations has produced confounding theoretical and
empirical results. Many earlier authors claim that large firms adopt new innovations more
than small firms while few authors argued otherwise. This study sheds light on the relation by
investigating the choice of advanced manufacturing technology and modern management
accounting practices among the manufacturing companies in Nigeria that are not listed on
Nigeria stock exchange. A retrospective longitudinal survey was conducted to examine the
usage of advanced manufacturing technology and modern management accounting practices
during a period of 5 years (2011-2015). A structured questionnaire was personally
administered among the management accountants/Head of accounts and Finance units of 154
manufacturing companies that were randomly sampled from the main directory of
manufacturers association of Nigeria. 133 useful completed questionnaires were retrieved.
The data were subjected to descriptive analysis and logistic regression. The outcome of the
study shows that firms’ size has a significant effect on both manufacturing technology and
management accounting practices. Unlike many earlier findings, the study established a
negative relation which implies that smaller firms applied advanced manufacturing
technology and modern management accounting practices more than larger firms.
Keywords: Firms size, Innovations, Manufacturing technology, Management accounting
practices.
INTRODUCTION
The 21st century business firms are exposed to various kinds of innovations as a result of
globalization which turns the whole world into a global village. The decisions on whether to
adopt/apply new innovations are often times being faced by many business firms.
Technological and administrative innovations are increasingly becoming essentials for any
businesses firms that want to thrive and compete favourably in the dynamic business
environment of the 21st century.
Nigerian manufacturing sector and Small and Medium term Enterprises were given great
attention by the transformation agenda (2011-2015) which focused on SMEs and
manufacturing companies among others. Various programmes targeted at transforming and
innovating the sector were carried out by the government during the period. Such
programmes include the launching of National Enterprise Development Programme
(NEDEP), National Micro , Small and Medium- Term Enterprises policy, establishing the

European Journal of Business, Economics and Accountancy Vol. 5, No. 6, 2017 ISSN 2056-6018
Progressive Academic Publishing, UK Page 2 www.idpublications.org
N200 billion SME/Manufacturing Refinancing and Restructuring Fund by the Central Bank
of Nigeria (CBN) in March, 2010 and increased commitment of Bank of industry to SME and
manufacturing sector during the period(Gyong, 2012; Mid-Term Report, 2013). There was
also a record of 13 percent increase in capacity for design and fabrication of machines and
equipment and transfer of improved post harvest processing technologies to SMEs and
establishment of same in the geo-political zones of the country(Mid-Term Report , 2013).
However, despite the importance of technological and administrative innovations in the
survival of business in the 21st century, the adoption rate of the new innovations differs across
business organizations. The adoption of innovation by firms relates to various factors
comprising the financial capabilities of the firm, availability of the specialists and
infrastructures among others(Abdel-Kader & Luther, 2008; Askarany & Smith, 2008;
Haldma & Lääts, 2002). It is further argued that financial capabilities, specialists and
infrastructures needed to adopt new innovations are much more available in large firms than
small firms(Abdel-Kader & Luther, 2008; Askarany & Smith, 2008). On the contrary,
Nooteboom (1994) claims that small firms bring technological change to the market more
quickly than large businesses. The claims of Nooteboom rest on the premises of less
bureaucracy, greater motivation, better survey of the entirety of the project, and greater
proximity to the market associated to small firms while Feldman(1994) posits that small
businesses are the prime source of technological change in certain industries.
Intensifying global competition and rapid advancement of manufacturing technology are two
realties in today’s business environment. The combined effect of these two realities have
shifted the business strategic priorities toward quality, cost effectiveness and responsiveness
to marketplace changes (Gunawardana, 2006). Globalization brings in new technology and
makes a developing country open to greater competition (Kassim, Md-Mansur, & Idris, 2003;
Ominunu, 2015). With the advent of digital technologies, a variety of issues relating to
pricing strategies, cost management and control mechanisms are evident as there are
alterations in management accounting systems, structures, thinking, and practices(Bhimani,
2003). To this end, sophisticated management accounting practices have been developed and
recommended for practice toprovide management with frequent, detail and correct financial
and non-financial information for informed management decision. Business innovation can
come in form of technological and administrative advancement. The advanced manufacturing
technologies and sophisticated management accounting techniques are the technological and
administrative innovations respectively(Askarany & Smith, 2008).This study examined the
effect of firms’ size on manufacturing technology and management accounting practices.
LITERATURE REVIEW
This section comprises the review of theoretical and empirical literature
Theoretical and Empirical Review
Diffusion of Innovation Theory
Diffusion of innovation theory, developed by Rogers in 1962, is one of the oldest social
science theories; it originated in communication to explain how, over time, an idea or product
gains momentum and diffuses (or spreads) through a specific population or social
system(Léger & Swaminathan, 2007).Rogers and Scott(1997) define innovation, as simply
“an idea perceived as new by the individual and diffusion as the process by which an
innovation is communicated through certain channels over time among the members of a
social system, or a special type of communication concerned with the spread of messages that

European Journal of Business, Economics and Accountancy Vol. 5, No. 6, 2017 ISSN 2056-6018
Progressive Academic Publishing, UK Page 3 www.idpublications.org
are perceived as new ideas. The result of this diffusion is that people, as part of a social
system, adopt a new idea, behavior, or product.
There are technological and administrative innovations that manufacturing companies are
confronted with in the dynamic business environment of 21st century. Examples of
technological innovations confronting the manufacturing firms are the advanced
manufacturing technologies such as; Robotics, Flexible Manufacturing System, Computer-
Aided Design, Testing Machine, Computer Integratedmanufacturing and Just in Time among
others(Askarany & Smith, 2008). Administrative innovation includes Management
accounting innovations which refers to emergence of contemporary management accounting
techniques or the adoption of “newer” or modern forms of management accounting systems
such as activity based costing, target costing, life cycle costing, balanced score card, kaizen
costing, product profitability analysis, throughput accounting, total quality management and
value chain management(Ajibolade, 2013; Chenhall, 2008).Accounting methods can also be
considered as innovations, and accounting change, consequently, is subject to the diffusion of
innovations theory(Askarany & Smith, 2008). Contemporary management accounting
techniques differ from the conventional techniques in the sense that the former are strategic-
focused that combine both financial and non-financial information(Bhimani & Bromwich,
2010; Chenhall & Langfield-Smith, 1998).
Gosselin(1997) categorizes the innovation process into four stages: adoption, preparation,
implementation, and routinization. The adoption stage involves the identification of the need
for change by the company and the decision to adopt or reject the change subject to some
contextual factors. During the preparation stage, the organization engages in employees
training, extensive use of consulting services, and purchasing of computer software. During
this stage, the company might modify its previous decision and even stop the installation
process. The implementation stage consists of introducing the innovation and evaluating its
effects. During the routinization, the innovation turns into regular practices of the firms. This
study examined the innovation of modern management accounting practices and advanced
manufacturing technology based on their application among the manufacturing companies in
Nigeria. To this end, the study tested the following hypotheses:
H01 There is no significant difference on the choice of manufacturing technology among
the manufacturing companies in Nigeria based on their firms’ size
H02 There is no significant difference on the choice of management accounting practices
among the manufacturing companies in Nigeria based on their firms’ size
Empirical Review
Virtually all of the management accounting practices employed by firms today and
explicated in leading cost accounting textbooks had been developed by 1925(Kaplan, 1984).
These old management accounting techniques are referred to as traditional management
accounting practices. The traditional management accounting practices such as standard
costing, absorption costing and marginal costing provide information that is too late, too
aggregated and too historical and therefore criticized of relevance loss in a 21st business
environment characterized by stiff competition and advanced manufacturing technology
which require more sophisticated management accounting information for managers to make
informed decisions(Bhimani & Bromwich, 2010; Jhonson & Kaplan, 1987; Kaplan, 1984;
Mat & Smith, 2014; Watts, Yapa, & Dellaportas, 2014). The modern management accounting
techniques which were developed as a results of deficiencies in the traditional techniques

European Journal of Business, Economics and Accountancy Vol. 5, No. 6, 2017 ISSN 2056-6018
Progressive Academic Publishing, UK Page 4 www.idpublications.org
include activity based costing, target costing, life cycle costing, backflush costing, throughput
accounting, balanced scored card, and just in time among others(Ajibolade, 2013).
Traditional manufacturing is defined as the act of convertingraw materials into finished
products by using manual or mechanized transformational techniques to add value to achieve
targeted objectives without precluding society's overall interests(Thareja, 2005). Advanced
Manufacturing technology (AMT) represents a wide variety of mainly computer-based
systems, which provide adopting firms with the potential to improve manufacturing
operations greatly. Another definition is Advanced manufacturing technology refers to a
family of technologies that include computer-aided design (CAD) and engineering systems,
materials resource planning systems, automated materials handling systems, robotics,
computer controlled machines, flexible manufacturing systems, electronic data interchange
and computer-integrated manufacturing systems(Gunawardana, 2006).
The relationship between cost of a product or service and the technology involved cannot be
over emphasized. The quest for lower operating costs and improved manufacturing efficiency
has forced many manufacturing firms to embark on various advanced manufacturing projects
(Gunawardana, 2006).To understand cost behaviour and cost drivers, it is necessary to
understand the relevant technology because cost is determined by both the technologies
available for production and the relative prices of the inputs. Minimising costs requires the
selection of the optimal technology given the relative prices of the inputs utilised (Bhimani &
Bromwich, 2010). The advanced manufacturing technologies include; computer aided
manufacturing, computer aided process planning, computer aided engineering, testing
machine, just in time, flexible manufacturing system, numerical control and direct numerical
control among others(Askarany & Smith, 2008; Mat, 2010).
Some authors believe that large companies adopt innovations more easily than smaller ones
do because they have a capability of managing the risk, abundant available resources and a
strong infrastructure(Ayadi & Affes, 2014; Lucas, Prowle, & Lowth, 2013). On the contrary,
small businesses suffer from the lack of resources, from financial difficulties and from the
scarcity of professionals, the thing which can lead to difficulties in adopting innovations(Ko,
Kim, Kim, & Woo, 2008).Having investigated the effect of firm size on adoption of modern
management accounting practices among 100 Tunisian companies; the findings of Ayadi and
Affes (2014) show that large firms adopt new management accounting techniques more than
the small firms do.
In the same vein, Askarany and Smith(2008) found a significant positive relationship
between business size and both technological innovation and the implementation of ABC. An
inference from their study shows that large firms adopt ABC more than small firms do.
Similarly, Lucas et al.(2013) conclude that larger organisations do more management
accounting than smaller ones. Erserim(2012) also found out a relationship between firm size
and the management accounting practices. Similarly, based on a sample of 144 responses
from a survey of members of the Australian Association of Practice Managers (AAPM), King
et al., (2010) established that the adoption of written budgets is related to firm size.
In like manner, the empirical investigation of 658 manufacturing companies in UK by Abdel-
Kader and Luther(2008) shows that firm size influences the choice of management
accounting practices. The authors sent two versions of questionnaire to Management
accountants and production managers; measuring firm size based on number of employees
and management accounting practices on 7-point likert scale ranging from never used to

European Journal of Business, Economics and Accountancy Vol. 5, No. 6, 2017 ISSN 2056-6018
Progressive Academic Publishing, UK Page 5 www.idpublications.org
often used. They argue that large firms adopt more sophisticated MAPs than small firms as
moving from traditional to modern MAPs requires resources and specialists only affordable
by large firms. Their findings lend credence to the arguments of Albu and Albu(2012) that an
increase in size is usually associatedwith a tighter control on the environment and an increase
in the firms’ resources, as well as with an increased use of control techniques. Also ,Haldma
and Lääts(2002) argue that the sophistication level of cost accounting and budgeting systems
tends to increase in the line with a firm’s size.
On the contrary, Nooteboom (1994) claims that small firms bring technological change to the
market more quickly than large businesses. The claims of Nooteboom rest on the premises of
less bureaucracy, greater motivation, better survey of the entirety of the project, and greater
proximity to the market associated to small firms while Feldman(1994) posits that small
businesses are the prime source of technological change in certain industries. Similarly, Van
Triest and Elshahat(2007)do not find any correlation between the size of the firms and the
management accounting practices.
RESEARCH METHOD
A retrospective longitudinal survey was adopted to find the relation between firms size and
the type of manufacturing technology and management accounting practices among
manufacturing companies in Nigeria over a period of 5 years (2011-2015). A structured
questionnaire was personally handed over to the management accountants/Head of
Account/Finance unit or their representatives in some cases. 154 companies were randomly
selected out of the 448 manufacturing companies in Lagos and its immediate environs which
were extracted from the Main directory of Manufacturers Association of Nigeria.
The research instrument developed by Baines and Langfield-Smith (2003) was adapted to
measure manufacturing technology and management accounting practices. Respondent were
asked to state how they have used the advanced manufacturing technologies on a 5-point
likert rating scale ranging from never used to very frequently used. The scale adopted from
Khandwalla (1977) was used to measure the complexity of their manufacturing process
ranging from customized production, small batch of similar goods, large batch, mass
production and continuous production representing increasing level of complexity and
standardization. Likewise, they were asked to rate their level of automation on a 5 point likert
rating scale from very little automation to completely automated. The composite figure of the
responses was determined and the average was found. The index below average was regarded
as traditional and coded as “0” while the index above average was regarded as modern and
coded as “1”,
In like manner, management accounting practices was measured based on their level of usage
during the period of five years (2011-2015). The use of 15 modern management accounting
techniques including; activity based costing, activity based budgeting, activity based
management, target costing, throughput accounting, backflush costing, life cycle costing,
product profitability analysis, quality costing, kaizen costing, balanced score card, just in
time, value chain analysis, benchmarking and shareholders’ value analysis/ economic value
added (EVA) was tested on 5 point Likert rating scale from never used to very frequently
used. The average of the index value was calculated; index value below average was regarded
as traditional and coded as “0” while index value above average was regarded as modern
management accounting practices and coded as “1”.

European Journal of Business, Economics and Accountancy Vol. 5, No. 6, 2017 ISSN 2056-6018
Progressive Academic Publishing, UK Page 6 www.idpublications.org
Firm size was measured using the number of employees ranging from less than 10 to over
1,000. Firms were categorized into 6 based on number of employees. The categories include;
less than 10, 10-49, 50- 199, 200 – 500, 501 – 1000, over 1,000. Average of the employees’
number was calculated and index below average was classified as small firms and coded as
“0” while the index value above average was classified as large and coded as “1”.
Model Specification
The study used two models, the fist one representing the causal relation between firms’ size
and manufacturing technology and the second one showing the causal relation between firms’
size and management accounting practices.
…eq.1
…eq.3.2
Where = coefficients of the Firms size for relation between manufacturing technology and firms
size.
= coefficients of the Firms size for relation between management accounting practices and
firms size.
RESULTS AND DISCUSSION
Factor Analysis
Factor analysis is important because it is easier to focus on some key factors rather than
having to consider too many variables that may be trivial, and so factor analysis is useful for
placing variables into meaningful categories(Yong & Pearce, 2013). This study adopts
Principal-components method (or simply P.C. method) of factor analysis because it explains
more variance than would the loadings obtained from any other method of factoring (Kothari,
2004). Field (2009) posit that a factor is reliable if it has four or more loadings of at least 0.6
regardless of sample size while Pituch and Stevens (2016) suggests using a cut-off of 0.4,
irrespective of sample size, for interpretative purposes.
The outcome of factor analysis on management accounting practices table 1 shows that all the
items reached the acceptable threshold of 0.4 and accepted for further statistical analysis.
This acceptance implies that data gathered had relatively high internal consistency and could
be generalized as a reflection of the opinion of all respondents in the target population on the
effect of changes in manufacturing technology on management accounting practices among
the manufacturing companies in Nigeria.
Table 1 Factor Analysis for modern management accounting practices
Component Matrix
Component
1
Quality Costing .678
Target Costing .675
Throughput Accounting .658
Activity Based Budgeting .658
life Cycle Costing .629
Backflush Costing .616
Just in Time .543
Activity Based Costing .402
Product Profitability analysis .400
Benchmarking .258
Shareholdervalue analysis/Economic Value Analysis -.091
Extraction Method: Principal Component Analysis.

European Journal of Business, Economics and Accountancy Vol. 5, No. 6, 2017 ISSN 2056-6018
Progressive Academic Publishing, UK Page 7 www.idpublications.org
Table 2 Reliability tests for management accounting practices
Reliability Statistics
Cronbach's Alpha N of Items
.727 9
Table 3 Factor Analysis of advanced manufacturing technology Components
Testing Machine .709
Numerical Control .668
Just in Time .615
Computer Aided Processing .611
Robotics .592
Computer Aided Engineering .582
Computer Integrated Manufacturing .565
Flexible Manufacturing .552
Computer Aided Manufacturing .375
Direct Numerical Control .305
Table 0 Reliability test for manufacturing technology
Reliability Statistics Cronbach's Alpha N of Items
.764 9
Descriptive Analysis of Manufacturing Technology
The usage of 9 advanced manufacturing companies during 2011-2015 was tested. Even thou
the mode show virtually all the advanced manufacturing technologies listed were used except
Robotics. However, not all the technologies listed were used by them but on average,
manufacturing companies in Nigeria used Flexible manufacturing system, Computer Aided
Manufacturing, Testing machine and computer integrated manufacturing.
Table 5 Descriptive Analysis of Manufacturing Technology
Never
Used
Rearly
Used
Not sure Frequently
Used
Very
Frequently
used
Sub total
Row N % Row N
%
Row N % Row N % Row N % Mean Mode Sd
Robotics 39.4% 22.4% 12.4% 22.9% 2.9% 2.02 1 1.23
Flexible manufacturing
system
5.8% 11.1% 3.5% 61.4% 18.1% 4.32 4 0.97
Computer Aided
Manufacturing
9.9% 10.5% 8.8% 47.4% 23.4% 4.19 4 1.01
Computer Aided Engineering 8.7% 22.7% 18.0% 37.8% 12.8% 3.37 4 1.01
Computer Aided Process
Planning
6.4% 31.6% 8.2% 37.4% 16.4% 3.29 4 1.06
Testing Machines 5.8% 11.6% 21.5% 43.0% 18.0% 4.09 4 1.08
Just in Time 5.2% 33.7% 16.3% 34.3% 10.5% 2.98 4 0.79
Numerical Control 5.3% 24.0% 14.6% 39.2% 17.0% 2.88 4 1.41
Computer Integrated
Manufacturing
5.8% 14.5% 9.3% 45.3% 25.0% 4.17 4 1.24
Management Accounting Practices
Similarly, this study found out that manufacturing companies in Nigeria practice some
modern management accounting techniques. The modern management accounting techniques
that manufacturing companies in Nigeria used to provide information for management

European Journal of Business, Economics and Accountancy Vol. 5, No. 6, 2017 ISSN 2056-6018
Progressive Academic Publishing, UK Page 8 www.idpublications.org
decision during the period include activity based costing, activity based budgeting, activity
based management, target costing, quality costing, product profitability analysis, value chain
analysis and benchmarking. The analysis results show that life cycle costing, just in time,
throughput accounting, backflush costing, balanced score card and kaizen costing were not
frequently used during the period. Similarly, the outcome of this analysis partially confirms
the findings of Oyerogba(2015) that Balanced score card and activity based management
have not been embraced by manufacturing companies in Nigeria.
Table 6 Descriptive Statistics for modern management accounting practices
Never
Used
Rarely
Used
Not
sure
Frequently
Used
Very
Frequently
used
Sub-total
Row N
%
Row N
%
Row N
%
Row N % Row N % Mean Mode Sd
Activity- Based Costing 3.5% 5.2% 2.3% 68.0% 20.9% 4.03 4 1.19
Activity Based Budgeting 2.3% 16.4% 4.7% 41.5% 35.1% 4.19 4 1.03
Activity Based
Management
1.7% 20.3% 4.7% 48.8% 24.4% 4.35 4 1.08
Target Costing 1.2% 19.8% 22.1% 34.3% 22.7% 3.95 4 0.98
life Cycle Costing 7.0% 19.9% 29.8% 28.1% 15.2% 3.46 3 0.88
Quality Costing 2.3% 24.0% 8.8% 40.9% 24.0% 4.02 4 1.35
Just in Time 2.9% 31.6% 18.7% 33.3% 13.5% 3.42 4 1.22
Throughput Accounting 8.1% 11.6% 27.9% 35.5% 16.9% 3.31 4 1.26
Backflush Costing 4.7% 15.2% 34.5% 28.1% 17.5% 3.37 3 1.08
Product Profitability
analysis
2.9% 5.3% 4.7% 40.4% 46.8% 4.24 5 1.42
Balanced Score Card 3.5% 30.2% 16.3% 31.4% 18.6% 2.98 4 1.30
Kaizen Costing 14.5% 32.0% 22.1% 26.2% 5.2% 3.05 2 1.24
Value Chain Analysis 3.5% 12.8% 9.9% 59.3% 14.5% 4.08 4 0.96
Benchmarking 1.2% 10.5% 11.0% 52.9% 24.4% 4.10 4 1.09
Effectoffirms’sizeonmanufacturingtechnology
Omnibus tests of model coefficient give a Chi-square of 14.734 with additional 1 degree of
freedom. This is a test of null hypothesis that adding another variable to the model has
significantly increased the researcher’s ability to predict the decisions made by the
respondents. Since the model is significant at 0.05, the hypothesis is rejected, implying that
adding another variable to the model has not significantly changed the prediction about
respondents’ decision.
Table 7 Omnibus Tests of Model Coefficients for manufacturing technology
Chi-square Df Sig.
Step 1
Step 14.734 1 .000
Block 14.734 1 .000
Model 14.734 1 .000
The essence of -2 Log likelihood is to see whether adding another variable to the model
would lead to a significant reduction in its value. Cox & Snell R Square can be interpreted
like R2 in multiple regressions but cannot reach the maximum of 1. Nagelkerke R Square can
also be interpreted like R2 in multiple regressions and it can reach 1. Nagelkerke R Square
result implies that firm size contributes about 14% variation in manufacturing technology
Table 8 Model Summary for manufacturing technology
Step -2 Log likelihood Cox & Snell R Square Nagelkerke R Square
1 163.269a .105 .142
a. Estimation terminated at iteration number 4 because parameter estimates changed by less than .001.

European Journal of Business, Economics and Accountancy Vol. 5, No. 6, 2017 ISSN 2056-6018
Progressive Academic Publishing, UK Page 9 www.idpublications.org
Table 9 shows that 73.1% of traditional manufacturing technology was correctly classified
while 60.5% of the advanced manufacturing technology was correctly classified. The overall
percentage of correct classification is 65.4%.
Table 9 Classification Table
Observed Predicted
TECHNOLOGY Percentage Correct
0 1
Step 1 TECHNOLOGY
0 38 14 73.1
1 32 49 60.5
Overall Percentage 65.4
a. The cut value is .500
Given the non-liner nature of logistic regression, it is difficult to interpret the relations
between the predictor and the probability that y=1 directly. Notwithstanding the above
limitation, statisticians have shown that the relation can be interpreted using a concept called
the odd ratio. The odd in favour of an event occurring is defined as the probability that the
event will occur divided by the probability that the event will not occur((Anderson, Sweeney,
& Williams, 2011). The p-values .000 indicates that firms size significantly influence the
choice of manufacturing technology. A parameter that is more crucial in the interpretation of
logistic regression is Exp (B) also known as the odd ratio. The odd ratio that is greater than 1
implies that as the predictor increases the odd of outcome occurring increasers while a value
that is lower than 1 implies that as the predictor increases the odd of outcome occurring
decreases(Field, 2009). Therefore, Exp (B) which is .241 implies that as the firms’ size
increases the odd of manufacturing firms using advanced manufacturing technology
decreases. Therefore, based on p-value, hypothesis 1 is not accepted
H01 There is no significant difference on the choice of manufacturing technology among
the manufacturing companies in Nigeria based on their firms’ size
Table 10 Variables in the Equation
B S.E. Wald df Sig. Exp(B)
Step 1a
NEWFIRMSIZEAVERAG
E
-1.425 .387 13.584 1 .000 .241
Constant 1.253 .303 17.089 1 .000 3.500
a. Variable(s) entered on step 1: NEWFIRMSIZEAVERAGE.
The outcome of this analysis shows that firms’ size significantly influences the type of
manufacturing technology that the firms used during the period. This result is supported by
many earlier empirical studies that firms size has a significant effect on adoption of
technological innovation(Askarany & Smith, 2008). However, unlike the findings of many
earlier studies that large firms use advance manufacturing technology more than small firms
do, the result of this study shows that the likelihood of small firms using advanced
manufacturing technology is more than that of the large firms. This lends credence to the
findings of Stock Greis and Fischer (2002) that smaller firms exhibit higher levels of
dynamic innovation performance. The findings of this study is also supported by the claim of
Rosnah, Ahmad and Osman (2004) that advanced manufacturing technology can be
implemented in smaller firms and are more successful than in bigger firms. In both developed
and developing economies, the small and medium scale enterprises (SMEs) are the backbone
of the industrialization process. With globalization and free trade agreements, the SMIs are
under increasing pressure to adopt advanced manufacturing technologies to be competitive or

European Journal of Business, Economics and Accountancy Vol. 5, No. 6, 2017 ISSN 2056-6018
Progressive Academic Publishing, UK Page 10 www.idpublications.org
simply to survive(Rosnah et al., 2004) . It however contradicts the findings of Kennedy and
Hyland (2003) that larger firms use advanced manufacturing technologies more than the
small firms both in OECD and non-OECD countries. The outcome of this study could be due
to the claims of Nooteboom (1994) that small firms adopt new innovation more than large
firms because of less bureaucracy, greater motivation, better survey of the entirety of the
project, and greater proximity to the market associated to small firms.
Effect of Firm Size on Choice of Management Accounting Practices
Omnibus tests of model coefficient give a Chi-square of 5.322 with 1 degree of freedom not
significant at 0.005. This is a test of null hypothesis that adding another variable to the model
has not significantly increased the researcher’s ability to predict the decisions made by the
respondents. Since the model is significant at 0.05, the hypothesis is not accepted, implying
that adding another variable to the model has not significantly changed the prediction about
respondents’ decision.
Table 11 Omnibus Tests of Model Coefficients
Chi-square Df Sig.
Step 1
Step 5.322 1 .021
Block 5.322 1 .021
Model 5.322 1 .021
-2 Log likelihood is 175.726, Cox & Snell R Square is .039 while Nagelkerke R Square is
.053. It implies that firm size contributes 5.3% variation in management accounting practices.
Table 12 Model Summary for management accounting practices
Step -2 Log likelihood Cox & Snell R Square Nagelkerke R Square
1 175.726a .039 .053
a. Estimation terminated at iteration number 3 because parameter estimates changed by less than .001.
Table 13 shows that 64.3% of traditional manufacturing technology was correctly classified
while 55.8% of the advanced manufacturing technology was correctly classified. The overall
percentage of correct classification is 59.4%.
Table 13 Classification Table
a
Observed Predicted
MANAGEMENT ACCOUNTING
PRACTICES
Percentage
Correct
0 1
Step 1
MANAGEMENT
ACCOUNTING PRACTICES
0 36 20 64.3
1 34 43 55.8
Overall Percentage 59.4
a. The cut value is .500
Exp (B) which is .439 implies that as the firms’ size increases the odd of manufacturing firms
using modern management accounting practices decreases. The p-values .023 indicates that
firms size significantly influence the choice of management accounting practices. Therefore,
hypothesis 2 is not accepted.
H02 There is no significant difference on the choice of management accounting practices
among the manufacturing companies in Nigeria based on their firms’ size.

European Journal of Business, Economics and Accountancy Vol. 5, No. 6, 2017 ISSN 2056-6018
Progressive Academic Publishing, UK Page 11 www.idpublications.org
Table 14 Variables in the Equation B S.E. Wald df Sig. Exp(B)
Step 1a
NEWFIRMSIZEAVERAG
E
-.823 .361 5.188 1 .023 .439
Constant .765 .271 7.999 1 .005 2.150
a. Variable(s) entered on step 1: NEWFIRMSIZEAVERAGE.
The hypothesis is not accepted because the analysis shows that there is a significant
difference on the choice of management accounting practices based on the firms’ size. This
finding is supported by the claims of many earlier authors that firms size has a significant
effect on the choice of management accounting practices(Abdel-Kader & Luther, 2008; Albu
& Albu, 2012). However, unlike the findings of many earlier authors which established a
positive relation between firm size and modern management accounting practices, this study
established a negative relation. This implies that smaller firms used modern management
accounting techniques more than the small firms. This could be due to the claims of
Nooteboom (1994) that smaller firms adopts new innovation more than bigger firms because
of less bureaucracy, greater motivation, better survey of the entirety of the project, and
greater proximity to the market associated to small firms. Moreover, this study contradicts the
findings of Van Triest and Elshahat(2007) who claim that there is no correlation between the
size of the firms and the management accounting practices.
SUMMARY AND CONCLUSION
The study examined the effect of firms’ size on the technological and administrative
innovations during a period of five years (2011-2015). Advanced manufacturing technologies
were used to proxy technological innovation while modern management accounting practices
were used to proxy administrative innovations. The study established that firms’ size
significantly influenced both the technological and administrative innovations that they used
during the period. Unlike the findings of many earlier authors that established a positive
relations between the firms size and innovation, this study established a negative relationship
which implies that as the firms size increases, their probability of adopting new innovations
decreases.
This could be due to various programmes under the transformation agenda (2011-2015)
which focused on transforming and innovating SMEs and manufacturing companies. Such
programmes enabled them greater access to funds which must have enabled them to afford
the costs of some modern manufacturing equipments. Their usage of modern manufacturing
equipments must have been responsible for their choice of modern management accounting
practices.
In conclusion, firms’ size is one of the firms’ characteristics which greatly determine the
application of new innovations. It is a key driver of the type of technological an
administrative innovations in manufacturing companies. Specifically, it significantly
influences the choice of manufacturing technology and management accounting practices.
However, this study only investigated the non-listed manufacturing companies in Nigeria.
Any generalization beyond the scope of the study should be taken with caution. A further
study that combines both listed and non listed manufacturing and service companies is
recommended. Also an investigation of the causal relation between management accounting
practices and manufacturing technology among non-listed companies is suggested for future
studies.

European Journal of Business, Economics and Accountancy Vol. 5, No. 6, 2017 ISSN 2056-6018
Progressive Academic Publishing, UK Page 12 www.idpublications.org
REFERENCES
Abdel-Kader, M. G., & Luther, R. G. (2008). The Impact of Firm Characteristics on
Management Accounting Practices : A UK- Based Empirical Analysis. The British
Accounting Review, (April 2016), 1–39. https://doi.org/10.1016/j.bar.2007.11.003
Abdel-Kader, M., & Luther, R. (2008). The impact of firm characteristics on management
accounting practices : A UK-based empirical analysis. British Accounting Review,
40(2008), 2–27. https://doi.org/10.1016/j.bar.2007.11.003.
Ajibolade, S. O. (2013). Drivers of Choice of Management Accounting System Designs in
Nigerian Manufacturing Companies. International Journal of Business and Social
Research(IJBSR), 3(September), 45–57.
Albu, N., & Albu, C. (2012). Factors Associated with the Adoption and Use of Management
Accounting Techniques in Developing Countries : The Case of Romania. Journal of
International Financial Management & Accounting, 2011(November 2011), 245–267.
https://doi.org/10.1111/jifm.12002
Anderson, D. R., Sweeney, D. J., & Williams, T. A. (2011). Statistics for Business and
Economics (11th ed.). US: South-Western Gengage Learning.
Askarany, D., & Smith, M. (2008). Diffusion of innovation and business size: A longitudinal
study of PACIA. Managerial Auditing Journal, 23, 900–916.
Ayadi, F., & Affes, H. (2014). Contextual factors impact on the use of new management
accounting practices : An empirical analysis in the Tunisian context. Journal of
Research in International Business and Management, 4(3), 45–55.
Baines, A., & Langfield-Smith, K. (2003). Antecedents to management accounting change: A
structural equation approach. Accounting, Organizations and Society, 28(7–8), 675–698.
https://doi.org/10.1016/S0361-3682(02)00102-2
Bhimani, A. (2003). Management Accounting in the Digital Economy. Oxford University
Press.
Bhimani, A., & Bromwich, M. (2010). Management Accounting : r etrospect and p rospect
(1st ed.). US: Elsevier Ltd.
Bhimani, A., & Bromwich, M. (2010). Management Accounting: Prospect and Retrospect.
Great Britan: ELSEVIER.
Chenhall, R. H. (2008). Accounting for the Horizontal Organization. Handbooks of
Management Accounting Research, 3, 517–550. https://doi.org/10.1016/S1751-
3243(07)03001-5
Chenhall, R., & Langfield-Smith, K. (1998). Factors influencing the role of management
accounting in the development of performance measures within organizational change
programs. Management Accounting Research, 9(May), 361–386.
https://doi.org/10.1006/mare.1998.0080
Erserim, A. (2012). The impacts of organisational culture, firm’s characteristics and external
environment of firms on management accounting practices : an empirical research on
industrial firms in Turkey. Procedia-Social and Behavioral Sciences, 62(2011), 372–
376. https://doi.org/10.1016/j.sbspro.2012.09.059
Feldman, M. A. P. (1994). Knowledge Complementing and Innovation. Small Business
Economics, 6(5), 363–372.
Field, A. (2009). Discovering Statistics Using SPSS (3nd ed.). London: SAGE Publication
Ltd.
Gosselin, M. (1997). The effect of strategy and organization structure on the adoption and
implementation of activity-based costing. Accounting, Organizations and Society, 22,
105–122.
Gunawardana, K. D. (2006). Introduction of Advanced Manufacturing Technology: a

European Journal of Business, Economics and Accountancy Vol. 5, No. 6, 2017 ISSN 2056-6018
Progressive Academic Publishing, UK Page 13 www.idpublications.org
literature review. Sabaragamuwa University Journal, 6(1), 116–134.
https://doi.org/10.4038/suslj.v6i1.1694
Gyong, J. E. (2012). A Social Analysis of the Transformation Agenda of President Goodluck
Ebele Jonathan. European Scientific Institute, 8(16), 95–113.
Haldma, T., & Lääts, K. (2002). Influencing Contingencies on Management Accounting
Practices in Estonian Manufacturing Companies.
Jhonson, H. T., & Kaplan, R. S. (1987). Relevance lost: The rise and fall of management
accounting. Boston: Harvard Business School Press.
Kaplan, R. S. (1984). The Evolution of Management Accounting. Accounting Review, 59(3),
390–418.
Kassim, M. Y., Md-Mansur, K., & Idris, S. (2003). Globalization and its impact on Malaysia
economy. Reinventing Sabah: Global Challenges and Policy Responses, 95–111.
Kennedy, J., & Hyland, P. (2003). A comparison of manufacturing technology adoption in
SMEs and large companies . In 16th Annual Conference of Small Enterprise Association
of Australia and New Zealand, 28 September – 1 October 2003. Ballarat.
Khandwalla, P. N. (1977). The Design of organisation. New York: Harcourt Brace
Jovanovich inc.
King, R., Clarkson, P. M., & Wallace, S. (2010). Budgeting practices and performance in
small healthcare businesses. Management Accounting Research, 2(1), 40–55.
Ko, E., Kim, S. H., Kim, M., & Woo, J. Y. (2008). Organizational Characteristics and the
CRM adoption process. Journal of Business Research, 65–74.
Léger, A., & Swaminathan, S. (2007). Innovation Theories: Relevance and Implications For
Developing Country Innovation. Berlin.
Lucas, M., Prowle, M., & Lowth, G. (2013). Management Accounting Practices of ( UK )
Small-Medium-Sized Enterprises ( SMEs ). Chartered Institute of Management
Accounting, 9(4), 1–13.
Mat, T. Z. T. (2010). Management Accounting and Organisational Change: Impact of
Alignment of Management Accounting Systems, Structure and Strategy on Performance.
Edith Cowan University, Perth Western Australia.
Mat, T. Z. T., & Smith, M. (2014). The Impact of Changes in Environment and AMT on
Management Accounting Practices and Organizational Strategy, Structure and
Performance. Journal of Applied Management Accounting Research, 12(1), 55–82.
Mid-Term Report of ( May 2011 – May 2013 ) Taking Stock , Moving Forward. (2013).
Nooteboom, B. (1994). Innovation and Diffusion in Small Firms: Theory and Evidence.
Small Business Economics, 6(5), 327–348.
Ominunu, O. G. (2015). Management Information and Accounting System and organizational
Performance in Nigeria. American Journal of Social and Management Sciences, 6(1), 1–
17. https://doi.org/10.5251/ajsms.2015.6.1.17
Pituch, K. A., & Stevens, J. P. (2016). Applied multivariate statistics for the social sciences :
analyses with SAS and IBM’s SPSS (6th ed.). New York: New York Routlegde.
Rogers, E. M., & Scott, K. L. (1997). Diffusion of Innovation Model and Outreach from the
National Network of Libraries of Medicine to Native American Communities. Retrieved
November 25, 2015, from http://nnlm.gov/pnr/eval/rogers.html
Rosnah, M., Megat Ahmad, M., & Osman, M. R. (2004). Barriers To Advanced
Manufacturing Technologies Implementation in the Small and Medium Scales Industries
of a Developing Country. International Journal of Engineering and Technology, 1(1),
39–46.
Stock, G. N., Greis, N. P., & Fischer, W. A. (2002). Firm size and dynamic technological
innovation. Technovation, 22(9), 537–549.
https://doi.org/https://doi.org/10.1016/S0166-4972(01)00061-X

European Journal of Business, Economics and Accountancy Vol. 5, No. 6, 2017 ISSN 2056-6018
Progressive Academic Publishing, UK Page 14 www.idpublications.org
Thareja, P. (2005). MANUFACTURING PARADIGMS IN 2010. In Proceedings of
National Conference on Emerging trends in Manufacturing Systems, JMIT, Radaur,
March 15-16, 2005. (p. 6).
Van Triest, S., & Elshahat, M. . (2007). “The use of costing information in Egypt: a research
note,.” Journal of Accounting & Organizational Change, 3, 328–343.
Watts, D., Yapa, P. W. ., & Dellaportas, S. (2014). The Case of a Newly Implemented
Modern Management Accounting system in a Multinational Manufacturing Companies.
Australian Accounting Business and Finance Journal, 8(2).
Yong, A. G., & Pearce, S. (2013). A Beginner ’ s Guide to Factor Analysis : Focusing on
Exploratory Factor Analysis, 9(2), 79–94.

European Journal of Business, Economics and Accountancy Vol. 5, No. 6, 2017 ISSN 2056-6018
Progressive Academic Publishing, UK Page 15 www.idpublications.org
TREASURY MANAGEMENT POLICY AND IMPROVEMENT IN
REVENUE BASE IN NIGERIA
*OGUNDANA Oyebisi; *NJOGO Bibiana; *IMEOPARIA Lawrence; **OJUA Michael &
*OGUNLEYE Olusogo
*Department of Accounting, Bells University of Technology, Ota, Ogun State
** Department of Accounting, Covenant University, Ota, Ogun State
ABSTRACT
Recent decreases experienced in the federal government level of revenue generation have
brought about an urgent need to improve the national revenue base through an effective and
efficient Treasury Management. This revenue generation decrease at the Federal level would
invariably affect the state and local government since certain percentage of their revenue is
derived from the federation account. As a result of this decline in government revenue, The
Federal Government is compelled to pull funds from the excess crude account and a
continuous pull from this account would bring about amongst other consequences a drastic
reduction in the country’s foreign reserve. To avoid such problems, there is the need for a
proper Treasury Management Policy and Practice in the Nigerian System at all levels of
Government.
Keywords: Management, revenue, policy, treasury.
1.0 INTRODUCTION
Available reports have shown that in recent months, there has been a reduction in the monthly
allocation from the federation account to the 36 states in Nigeria and the Federal Capital
Territory. This has given rise to many complaints regarding the adverse effect this is having
on the smooth running of activities at the State and Local Government level, including non-
payment of salaries, poor infrastructural facilities, pending pension benefits amongst others
(Office of the Accountant General of the Federation, 2014). This of course is not good
enough for the country as it is able to stall economic growth and development as well as dent
the image of the country at the international level.
Government at the three (3) tiers is established alongside other basic functions and role; to
provide social and infrastructural services to the citizens to enable an improvement of overall
wellbeing of the populace. To accomplish this primary objective, government must put in
place an effective and an efficient Treasury Management policy and practice which would
bring about optimal generation of revenue and efficient/judicious utilization of the revenue
raised.
The Treasury department is the golden animal that lays egg applied for economic planning
and development of the areas in local government structure (Nwosu & Okafor, 2013). The
Treasury department is one of such departments which act as the ministry of finance for the
council. The Treasury department is responsible for the generation and collection of external
and internal revenue due to the local government, the judicious utilization/disbursement of
revenue collected and the preparation of annual budget for consideration of the finance
committee and subsequent approval by the approving authority.

European Journal of Business, Economics and Accountancy Vol. 5, No. 6, 2017 ISSN 2056-6018
Progressive Academic Publishing, UK Page 16 www.idpublications.org
An efficient Treasury Management Policy and Practice would bring about provision of social
amenities, better infrastructural facilities, provision of employment opportunities,
improvement of standard of living, better accountability and transparency e.t.c. all of these
are what people at the grassroots level requires from local government. Thus, no matter the
level of financial resources in the hands of government, if there is no proper treasury
management policy and practice in place to ensure that revenue generated are used
economically, effectively and efficiently, the desired objectives of such government would
not be achieved (Hamid, 2011)
This paper is therefore focused on the Local Government as one of the tiers of the
Government of Nigeria. The main objective of this paper is therefore to discuss the role of
Treasury Management in improving the revenue base at the Local Government through
internally generated revenue.
This paper is divided into four sections. Section one (1) examines the concepts of Treasury
and Treasury Management, section two (2) discusses the function of the Treasury department
and the Legal Framework guiding the Treasury Management Department, section three (3)
states the Research Method, section four (4) centers on Treasury Management and
improvement on Revenue Base and ways of enhancing Internally Generated Revenue through
the Treasury department, section five (5) is conclusion
2.0 LITERATURE REVIEW
2.1 CONCEPTUAL FRAMEWORK
2.1.1 Concept of Treasury and Treasury Management in Nigeria
According to Hamid (2011), “The treasury is the unit/department that is charged with the
responsibility and management of public funds, creating and safeguarding effective internal
control, creating the conditions for prompt and efficient provisions of services and proper
maintenance and preservation of necessary records of all financial transactions”.
Treasury Management may be defined as the management of government revenue generated,
government cash flows, management of money and capital market transactions, effective and
efficient control of risk associated with this activities and the pursuant of optimum
performance consistent with these risks (Hamid, 2011).
The treasurer as the head of the Treasury department is the financial director of the local
government charged with the responsibility of ensuring proper working of the treasury and
the financial requirement of the council.
2.2 Functions of Treasury Management in enhancing revenue in the Public Sector
According to Hamid (2011), the under listed are some of the functions of Local Government
Treasury department:
2.2.1 Management of Government Bank Account: The Treasury department has the
responsibility of supervising Government bank accounts (including all extra-budgetary
funds). All banking arrangement must be negotiated by the Treasury department, this would
enable government select the banks with better opportunities and services such as: lower
interest on borrowings, higher interest on savings, lower commission on turnover and faster
services etc. the treasurer is expected to receive regularly (month end) a statement from the
Local Government Bank, this statement must be critically analyzed for the purpose of
preparing a reconciliation to ensure there is no form of fraud or error that has taken place.

European Journal of Business, Economics and Accountancy Vol. 5, No. 6, 2017 ISSN 2056-6018
Progressive Academic Publishing, UK Page 17 www.idpublications.org
2.2.2 Debt Management: In order to avoid a situation of uncontrolled indebtedness, the
treasurer should be the only one as the finance director, permitted to borrow money on behalf
of the Local Government. The money borrowed should either be channeled into projects
(project loans) or for financing budget deficit. The Local Government in fulfillment of its
accountability function is expected to disclose to the relevant legislation its level of
indebtedness, and publish statistics of the government debt.
2.2.3 Cash Management: Cash Management can be defined as having the right amount of
money to fund government expenditure in a timely manner as well as meeting its obligation
as they fall due (Dikwa, 2014). Cash Management involves basically control of cash inflows
(that is, revenue collected either by the treasury department or commercial banks must be
swiftly processed and made available for use), control of cash outflows (this is to ensure the
sufficiency of cash until the due date of payment) and control of disbursements (to ensure
that all payment made are within the budget and there is no form of mis-management of
funds).
2.2.4 Management of Foreign Grants and Aid: All forms of grant (in cash or in kind)
must be duly budgeted and expenditures financed using grant must be subjected thoroughly
to scrutiny by the treasury officer. This is to ensure there is no form of mis-appropriation of
fund or misplacement of priority.
2.2.5 Management of Government Financial Asset: The treasury department is expected
to manage the government shares in companies and to manage loans granted by the
government. The treasury department is expected to do this by ensuring the authorization of
disbursements and tracking payments. The treasury department gets vivid information of
those companies where the Local Government holds shares on capital appreciation, share
dividend, bonus shares e.t.c.
2.2.6 Financial Planning and Forecasting: Financial planning involves the preparation of
budget implementation plan, annual and monthly cash plan and monthly forecast. These
various plans must be prepared by the Treasury department to ensure that cash outflows are
compatible with cash inflows, and just in case borrowings are needed, to ensure that
borrowing plans are in place.
2.2.7 Financial Control: Financial control can be defined as the process which assures that
financial resources are obtained economically and used effectively and efficiently for the
purpose of actualizing set goals (Oshisami, 1994).
2.2.8 Preparation, Expenditure and Control of Budget: Here, the Treasury department
passes a form across to several heads of department within the confines of the Local
Government. This form enables them disclose the information relating to their financial needs
and the various persons and things required to aid the fulfillment of those needs. Once these
forms are filled, they are passed back to the Treasury department and this department makes
this financial need known to the legislation for approval (and of course this is also subject to
prior scrutiny by the Treasurer before he presents it to the legislation). The Treasury is
therefore expected to presents the budget which would now be a compilation of the various
financial needs received from the various departments.
2.2.9 Risk Management: One of the most important functions of the Treasury department
is management and control of risk associated with treasury activities. Some of this risks are:

European Journal of Business, Economics and Accountancy Vol. 5, No. 6, 2017 ISSN 2056-6018
Progressive Academic Publishing, UK Page 18 www.idpublications.org
Liquidity risk (risk that the Local Government would run out of cash needed to carry out its
activities), Interest rate risk (Risk that the Local Government fails to get good value for its
cash dealings), Inflation risk (Risk that growth in the authority’s investment income does not
keep pace with the effect of inflation on its outgoings).
2.2.10 Books of Account: The purpose of accounting is to provide relevant and reliable
accounting information to users to aid decision making. To unable the provision of this
information, the treasury department is therefore expected to keep proper books of accounts,
records and forms to enable the documentation of government transactions on a daily basis.
The books of account to be kept include: cashbook, ledgers, journals, records of assets and
liabilities, stores receipt etc.
2.2.11 Stores Administration: For every item needed in the Local Government due
approval must be gotten from the Treasurer and his approval is subject to consideration of
factors such as: availability of the item within the budget, availability of adequate money to
cover such item, necessity/urgency of such item and his level of authority to approve such
expenditure.
2.3 Legal Framework for Public Treasury Management in Nigeria
Public Sector Treasury Management is governed by the following regulatory framework:
2.3.1 Nigeria Constitution: The 1999 constitution of the Federal Republic of Nigeria is
one of the legal frameworks guiding and regulating the receipts and payments of
funds. The constitution provides guideline with respect to financial reporting
process in Local Government accounting, budgeting and auditing.
2.3.2 Audit Ordinance of 1956 (act of 1956): This act regulates and guides
Government audit of financial accounts, records and transactions.
2.3.3 The Finance Act of 1958: The Finance Act of 1958 regulates the accounting
system, books of accounts to be kept and the procedure for preparing final
accounts and financial statement.
2.3.4 Financial Regulations: These are the accounting manual of government at all
level which provides guidance on accounting and financial matters. They set out
the steps to be followed in treating most government transactions.
2.3.5 Gazette: The Gazette is a periodically published government official newsletter
containing government policy statements like appointment of new officers,
retirement, financial statement, contract advertisement etc.
2.3.6 Finance/Treasury Circular: These are administrative tools used to amend the
existing provisions of financial regulations. They are periodic communications
made or releases issued by the Ministry of Finance. They are specific guides of
the operations of public sector financial transactions.
2.3.7 Appropriation Act: This act states the amount to be spent on each program to be
embarked upon by the government based on the approved estimate.
3.0 Research Method
This paper is an Exploratory research based on Library research; hence, it is a theoretical
review of various authors work on the subject matter.
4.0 Treasury Management and Improvement in Revenue Base
The local government has three (3) main sources of revenue, they are: External Revenue,
Internal Revenue, Loan. This section focuses on examining the various options of
Internally Generated Revenue available to the Local Government and how this option
can be taken advantage of.

European Journal of Business, Economics and Accountancy Vol. 5, No. 6, 2017 ISSN 2056-6018
Progressive Academic Publishing, UK Page 19 www.idpublications.org
Internally Generated Revenue: This refers to those revenue sources that are generated
mainly by sub-national entities such as Local Government within the areas of jurisdiction
as specified in the 1999 constitution (Oyaghire, 2014). This can be referred to other
sources of revenue internally generated (within the country) other than the statutory
allocation from the State or Federal Government (Nwosu & Okafor, 2013). According to
Nwosu & Okafor (2013), the sources of Internally Generated Revenue at the Local
Government level are:
4.1.1 Taxes: Tax is payable by all citizens of Nigeria. According to Act No. 21 of
1998, the taxes payable to the Local Government amongst others include:
Market Taxes, Cattle tax payable etc.
4.1.2 Tenement Rate: This is one of the most dependable sources of revenue to the
Local Government if well harnessed. This involve tax on landed properties,
commercial and residential buildings and even right of occupancy fees on
land in the rural areas (excluding those collectable by the Federal and State
government) etc.
4.1.3 Rent: This is another type of internally generate revenue that the Local
Government can take advantage of. The treasury department must ensure the
full harnessing of this area of revenue generation. It includes rent on
residential/commercial buildings.
4.1.4 Interest and Dividend: Local Government at times also take advantage of
investing in profitable ventures, the interest and dividend derivable from this
investment serves as another source of income to the government. Treasury
Department must make sure all interest and dividend are collected duly.
4.1.5 Local License fees and fines: This includes a long list of different revenues
derivable from licenses and fees charged. According to Nwosu and Okafor
(2013), this licenses and fees can be sub-divided into eight (8) different
headings:
a). Fines: Fees accruing from wrong parking charges, Throwing of dirt on the
floor,
b). General License:, Bicycle license fees, truck, canoe, wheelbarrow license
fees
c). Food control: Slaughter slab fees
Security: Goldsmith and gold sellers license fees
Social: Merriment and road closure fees, marriage, radio and Television
license fees
Health: birth and death registration fees, domestic animal license fees
Economic: tenders fees and contractors registration fees
Engineering works and survey: hire of plants charges
4.1.6 Miscellaneous fees: Public convenience, sewage and refuse disposal fees,
customary burial ground permit, signboard and advertisement permit fees, on
and off liquor fees, domestic animal license, vehicle radio license fees etc.
4.2 Ways of Enhancing/Improving Internally Generated Revenue through the
Treasury Department
a. Reliable Database: To ensure a proper assessment of taxes due to the local government
and optimum revenue collection process, a reliable and robust database is necessary. The
Treasury department should ensure that a comprehensive database is in place.
b. Monitoring of delegated authorities: Agencies having power to collect revenue on
behalf of the Local Government must be adequately monitored by the Treasury

European Journal of Business, Economics and Accountancy Vol. 5, No. 6, 2017 ISSN 2056-6018
Progressive Academic Publishing, UK Page 20 www.idpublications.org
Department to ensure that all revenue collected on their behalf are remitted as and when
due:
c. Enforcement of Sanctions: There should be appropriate sanctions for revenue diversion,
failure to remit collections, delayed remittance, and revenue consumption without
appropriation.
d. Prosecution of offenders: Loss of revenue through corruption and other illegal means is
responsible for the inability of the Local Government to perform their provision of social
services function. Therefore, offenders who indulge in any form of channeling of
revenue generated by the Local Government to personal account must be duly
prosecuted to serve as deterrence to upcoming fraudsters.
e. Training and Development of Staff: Staff of the Treasury department of the Local
Government must be adequately trained in the area of collection of Internally Generated
Revenue.
f. Appropriate Remuneration and Motivation: There is the need to reward and motivate
the entire treasury staff appropriately in view of the challenges of their function and the
delicate nature of revenue collection. This would discourage the treasury staff from
stealing part of the money gathered from internally generated revenue
g. Deployment of appropriate Technology: There is the need to acquire and intensify the
use of modern technology in matters of revenue collection and management this is
because efficient resource management is significantly technology-driven.
5.0 CONCLUSION Local Government must see to it that its harnesses fully the option of Internally Generated
Revenue as a medium of generating revenue and increasing its revenue base. The Local
Government can achieve this only with the existence of an efficient Treasury Department in
place. The Treasury Department must be guided by the Legal framework put in place to
perform its role as the live wire of the Local Government.
REFERENCES
Okafor, O. and Nwosu, M. (2013). Financial management in Local Government: The Nigeria
Experience, International Journal of Financial research, Vol. 4 (4)
Hamid, K. (2011). Standard treasury management policy and practice: The starting point of
fraud prevention, being a paper presented at a seminar for senior Local Government
officials of Jigawa State on the theme “Emerging issues in Local Government
Auditing and Treasury Management” held at Dutse, Jigawa State from 25th
to 27th
October, 2011.
Institute of Chartered Accountant of Nigeria (2009). Public Sector Accounting and Finance
Oshisami, K. (1994). Government accounting and financial control, Ibadan, Nigeria:
Spectrum Books Limited.
Office of the Accountant General of the Federation (2014). Transforming the Nigerian
treasury to enhance accountability and fiscal responsiveness.
Oyaghire, B. (2014). Improving the National revenue base through effective treasury
management and accountability

European Journal of Business, Economics and Accountancy Vol. 5, No. 6, 2017 ISSN 2056-6018
Progressive Academic Publishing, UK Page 21 www.idpublications.org
A META-ANALYSIS OF 20 YEARS OF STUDIES ON INTELLECTUAL
CAPITAL (1997-2017)
Driss Tsouli
PhD student in intellectual capital, National school of management Tangier, MOROCCO
&
Bouchra Elabbadi
Research professor, National school of management Tangier, MOROCCO
ABSTRACT
Leif Edvinsson introduced the intellectual capital in his 1997 Long Range Planning journal
article. 2017 marks 20 years since that article. This anniversary had motivated us to review
the state of research on intellectual capital, to highlight a number of research questions
pertaining to country, institutional and individual productivity, publication frequency, and
favorite inquiry methods were proposed. To this end, we reviewed 372 articles published in
business, management and accounting journals in the period 1997-2011.the findings of this
literature review are presented in three part. First, the reviewed articles are categorized by
topics, research settings, and research method. Second, the contributions of research to the
field and the lessons learned from these studies are discussed. Third, knowledge gaps in
existing intellectual capital research are identified, leading to consideration of several ideas
for future research.
Keywords: Intellectual capital, accounting business and management, literature review.
INTRODUCTION
2017 marks 20 years since the first publication of the intellectual capital article by Leif
Edvinsson in the June issue of long range planning journal. After a year’s research activity
inside the Swedish insurance company Skandia, Edvinsson [11] disseminated their findings
through an Intellectual Capital measurement framework which he developed and called the
Skandia navigator. Edvinsson’s original version of developing intellectual capital at Skandia
expanded on mere value creation measures based on intangible assets, categorized by three
perspectives: human capital, structural capital and customer capital. Following that article,
there has been a remarkable increase in articles, books, and conferences. In June 2001
Thomas Stewart former editor at Harvard business review has published on the cover of this
review: the brainpower and intellectual capital was becoming America’s most valuable asset.
So intellectual capital became part of a new form of value creation.
10 years later Guthrie, Ricceri and Dumay [15] published a critique review of the field of
intellectual capital accounting research, they showed that there is an increase in research in
the field of intellectual capital, with focus on developed countries, public listed companies
and on management control and strategy areas, and more empirical studies.
As a starting point our paper considers the argument of Guthrie, Ricceri and Dumay [15],
“Reflections and projections: A decade of Intellectual Capital Accounting Research“, as
published in the British Accounting Review and it’s an extension of the seminal paper
seminal paper on ICA, “Intellectual capital literature review: Measurement, reporting and
management” as published in the Journal of Intellectual Capital.

European Journal of Business, Economics and Accountancy Vol. 5, No. 6, 2017 ISSN 2056-6018
Progressive Academic Publishing, UK Page 22 www.idpublications.org
Guthrie, Ricceri and Dumay [15] was chosen as the starting point because it appeared in the
first volume of British accounting review and has to date been cited 120 times (Scopus at 1
January 2017), we develop a descriptive meta-analysis of over 945 journal articles, using a
method previously employed to select and categorise academic papers (see also [4] [16]).
This analysis is used to evaluate, identify and address future research agendas. In doing so,
our paper answers four inter related research questions:
1. What is the scholarship field of intellectual capital?
2. What has happened in the field of IC over the 20 years?
3. How and why is the field changing?
4. What is the future of IC?
Our paper has four further sections. Section two offers a brief review of the original article
and a general review of contemporary IC literature, establishing what constitutes the field of
IC. Section three outlines our research method followed by a descriptive meta-analysis of the
IC papers. Section four discusses issues associated with the field of IC. Last, a conclusion
outlining an agenda of future IC research is provided.
The evolving research on intellectual capital
The concept of intellectual capital (IC) is complex and poorly understood [22] .there are
various viewpoint about IC, its components and structure and its role in value creation of an
organization.
In the 1990s, many scholars focused their research on the nature of IC, its structure and role
in an organization’s value. Different authors made an attempt to formulate a definition of IC
by means of many approaches, by including some elements characterizing the concept, by
using the structure of intellectual capital and by broadening the concept of knowledge, etc.
Edvinsson and Malone [12] defined intellectual capital as knowledge that can be converted
into value. This work inspired others and after 1997 saw the proliferation of conferences on
IC; the myriad of books, working papers, and journal articles; and the large number of
consulting firms offering products and services centered around IC, are testament to the
growing awareness in the area [22].
According to Guthrie, Ricceri, Dumay [15], and Giuliani [19], the research on IC has passed
by three stages:
The first-stage: focused on why recognizing and understanding the potential of IC
towards creating and managing sustainable competitive advantage is important. And
to make the invisible visible, relied on the old adage “what gets measured gets
managed” .The publications has target to argue that “intellectual capital is something
significant and should be measured and reported”, without referring to specific
empirical research [12] [22] [23] [24].
The second stage: established IC research on how capital and labour markets react to
the potential for IC to create value and how IC should be managed in order to create
and maintain a sustainable competitive advantage. In this case, the attention of
scholars and practitioners moved from the analyses of production of IC measurements
In other words, in this stage the focus was on how IC measurements, together with
images and narratives, affect an organization or the capital market [9] [20].
The third stage: the implementation of IC and it utilizations inside organizations. In
other words, this stage is focused on the analysis of the use of IC measurements in

European Journal of Business, Economics and Accountancy Vol. 5, No. 6, 2017 ISSN 2056-6018
Progressive Academic Publishing, UK Page 23 www.idpublications.org
practice, to the exam of the interplay between them and IC mobilization and
management and to the investigation of the effects, the benefits and the drawbacks of
measuring IC [6] [15]. Thus, this stage is devoted to critically investigate how
organizations understand and adopt IC as a management technology [7] [20].
Research method
Our method for selecting and reviewing the papers utilized in our study is similar to method
used by to Broadbent and Guthrie [4], and Guthrie, Ricceri , and Dumay [15].
The review process was conducted in five different stages. In the first stage, the core research
objectives were formulated based on the work of Petty and Guthrie [22]. Based on this
research objective, several classifications/codes, boundaries and definitions were determined
in order to select articles on IC. The data set was restricted to a twenty year period from 1997
to 2016.
The second stage involved the selection of journals. The journals consist of two specialist
journals, journal of intellectual capital (JIC), and International Journal of Learning and
Intellectual Capital (IJLIC).
In the third stage, we analyzed the titles and abstracts of all articles published in the journals
during the period (a total of 372) with Scopus (Scopus is a bibliographic database containing
abstracts and citations for academic journal articles. It covers nearly 22,000 titles from over
5,000 publishers).
The fourth stage pilot tested and adapted our classification system, based on the framework
employed in [4], on a sample of papers (Table 1). The first criterion is Organisational Focus
(A). The second criterion is the country Focus of the study (B). The third criterion is Focus of
IC Literature (C). The fourth criterion is based on the Research Method used (D).
Finally, in the fifth stage we utilized the classifications to establish a range of descriptive
statistics, allowing us to understand the patterns emerging from the reviewed articles. This
provides the basis for our meta-analysis and discussion of the IC field over the period in
question. The following section outlines the meta-analysis and is followed by an open
discussion of our findings.
Table 1 Classification system for analysing IC articles. A. Organisational focus
A1. Public listed
A2. Private - SMEs
A3. Public sector
A4. General/other
B. Location
B1. North America
B2. Asia
B4. Continental Europe
B5. Other
C. Focus of ICA literature
C1. Auditing
C2. Accountability and governance
C3. Management control/strategy
C4. Performance measurement
C5. Other (including general)

European Journal of Business, Economics and Accountancy Vol. 5, No. 6, 2017 ISSN 2056-6018
Progressive Academic Publishing, UK Page 24 www.idpublications.org
D. Research methods
D1. Case/field study/interviews
D2. Survey/questionnaire/other empirical
D3. Theoretical: literature review/empirical
---------------------------------------------------------------------------------------------------------------------------
Source: Adapted from Broadbent and Guthrie (2008) [4].
Meta-analysis
The purpose of this section is to provide a meta-analysis of the IC articles selected and to
answer our proposed question two: “What has happened in the field of IC over the past
twenty years?” and question three: “How and why is the field changing?”
The total number of articles focusing on IC was 372 and, of these, 287 articles were
published in JIC (see Table 2).
Table 2 number of articles focusing on IC Journal name Journal code IC articles % articles
Journal of intellectual capital JIC 287 77.15
International Journal of Learning and
Intellectual Capital
IJLIC 85 22.85
Total IC articles 372 100
Table 2 highlights how journal of intellectual capital published 287 of the 372 (77.15%) total
IC articles. The yearly pattern of published articles in Fig. 1 shows a spike in 2015 of articles.
Figure 1: evolution of publications per year
Organisational focus
Table 4 highlights the extent of research in terms of different types of organisations. It
demonstrates that apart from general other (A4), the most commonly researched organisation
is public sector (A3) with 99 articles and Public listed companies. There are very few articles
on SME. In examining public sector, as an organisational focus, it was found that many of the
studies focused on the content, determinants and measurements. For Public listed companies
it was found that many of research focused on the consequences of IC disclosure in capital
markets and relation between human capital disclosure and value creation ( [1] [3] [14] [9]
[21]).

European Journal of Business, Economics and Accountancy Vol. 5, No. 6, 2017 ISSN 2056-6018
Progressive Academic Publishing, UK Page 25 www.idpublications.org
Table 3: Organisational focus
Total %
A1. Public listed
65 17.46%
A2. Private - SMEs
20 5.72%
A3. Public sector
99 26.62%
A4. General/other
188 50.2%
Total 372 100%
Location
Table 4 illustrates the country focus or the geographical location of the work undertaken. As
highlighted in the table for the selected journals the most active regions were: continental
Europe with 121 (32.5%) papers, followed by Asia with 63 (16.9%) and North America with
72 (17%). The North America (Canada and USA), as a research site, and its authors have
been relatively silent with only 47 (12.6%) papers. Not surprisingly, Continental Europe is in
the forefront of IC because, since the 1990s, European authors, especially Scandinavian
countries, have continuously published IC articles and books [5]. Continental European
articles mainly focus on the European nations, indicating the strong tradition of IC research in
Europe.
Table 4 Location
Total %
B1. North America
47 12.6%
B2. Asia
63 16.9%
B4. Continental Europe
121 32.5%
B5. Other
141 38%
Total 372 100%
Focus of IC literature
Table 5 represents the focus of the IC literature. The most popular focus of IC is Performance
measurement which has 89 papers. We also observe how more than two thirds of the
published articles use a “management control/strategy” (C3). Little has been published about
accountability, governance (C2) and auditing (C1). The extent of publications in Performance
measurement, as the most researched area of interest, is highlighted in Table 5, representing
89 articles covering a wide range of management-related subjects. For instance, there were
articles on the Balanced Scorecards [13] and its use for managing IC.

European Journal of Business, Economics and Accountancy Vol. 5, No. 6, 2017 ISSN 2056-6018
Progressive Academic Publishing, UK Page 26 www.idpublications.org
Table 5 Focus of IC literature
Total %
C1. Auditing
1 0.2%
C2. Accountability and
governance
58 15.5%
C3. Management
control/strategy
72 19.5%
C4. Performance
measurement
89 23.9%
C5. Other (including general)
152 40.9%
Total 372 100%
Research methods
Next, Table 6 considers the research methods used within the selected articles depicting the
spread used to study IC. The Table shows that Survey/questionnaire/other empirical is the
most commonly used, followed by Case/field study/interviews. There are fewer articles on
Theoretical: literature review/empirical that link theory with empirics.
Table 6 Research methods.
Total %
D1. Case/field
study/interviews
97 26%
D2.
Survey/questionnaire/other
empirical
238 64%
D3. Theoretical: literature
review/empirical
37 10%
Total 372 100%
CONCLUSION –THE FUTURE OF INTELLECTUAL CAPITAL
In conclusion we find that over twenty years, the study of intellectual capital has made
undeniable advances and become more mature. The area is today much more recognized not
only by academics from different disciplinary fields, but also by other important societal
stakeholders (professionals, policymakers, managers, etc.)
The future research directions are to challenge the status quo, and employ innovative
methodologies, experiment with the novel. In the future more critical field studies which will
provide empirical studies of IC in action and help develop broader theoretical research.

European Journal of Business, Economics and Accountancy Vol. 5, No. 6, 2017 ISSN 2056-6018
Progressive Academic Publishing, UK Page 27 www.idpublications.org
The conclusion of this article should be considered after taking into account the following
limitations. First, the selection of journals was restricted to two. Results could vary if more
journals were scrutinised and if other forms of scholarly activities were included only
(articles). Second, although the coding process was performed systematically with utmost
care to allow consistency, there could be errors of omission and coding could have also been
affected by coder bias.
REFERENCES
[1] Abdolmohammadi, M. J. (2005). Intellectual capital disclosure and market capitalization.
Journal of Intellectual Capital, 6(3), 397–416.
[2] Bozzolan, S., Favotto, F., & Ricceri, F. (2003). Italian annual intellectual capital
disclosure: an empirical analysis. Journal of Intellectual Capital, 4(4), 543–558.
[3] Bozzolan, S., O’Regan, P., & Ricceri, F. (2006). Intellectual capital disclosure (ICD): a
comparison of Italy and the UK. Journal of Human Resource Costing & Accounting, 10(2),
92–113.
[4] Broadbent, J., & Guthrie, J. (2008). Public sector to public services: 20 years of
“contextual” accounting research. Accounting, Auditing & Accountability Journal, 21(2),
129–169.
[5] Bukh, P. N., & Johanson, U. (2003). Research and knowledge interaction: guidelines for
intellectual capital reporting. Journal of Intellectual Capital, 4(4), 576–587.
[6] Catasús, B. and Gröjer, J.-E. (2006), “Indicators: on visualizing, classifying and
dramatizing”, Journal of Intellectual Capital, Vol. 7 No. 2, pp. 187-203.
[7] Dumay, J. C. (2009a). Intellectual capital measurement: a critical approach. Journal of
Intellectual Capital, 10(2), 190–210.
[8] Dumay, J., & Guthrie, J. (2007). Disturbance and implementation of IC practice: a public
sector organisation perspective. Journal of Human Resource Costing and Accounting, 11(2),
104–121.
[9] Dumay, J., & Tull, J. (2007). Intellectual capital disclosure and price sensitive Australian
stock exchange announcements. Journal of Intellectual Capital, 8(2), 236–255.
[10] Dumay, J., Guthrie, J., & Farneti, F. (2010). Contemporary international sustainability
reporting guidelines for public and third sector organisations: a critical review. Public
Management Review, 13(4), 531–548.
[11] Edvinsson, L. (1997), “Developing intellectual capital at Skandia”, Long Range
Planning, Vol. 30.
[12] Edvinsson, L. and Malone, M.S. (1997), Intellectual Capital – The Proven Way to
Establish Your Company’s Real Value by Measuring its Hidden Brainpower, Judy Piatkus
Ltd, London
[13] Flamholtz, E. G. (2003). Putting balance and validity into the balanced scorecard.
Journal of Human Resource Costing & Accounting, 7(3), 15–26.
[14] Ghosh, D., & Wu, A. (2007). Intellectual capital and capital markets: additional
evidence. Journal of Intellectual Capital, 8(2), 216–235.
[15] Guthrie, J. Ricceri, F. and Dumay, J. (forthcoming 2011) “Reflections and
Projections: A Decade of Intellectual Capital Accounting Research”, British Accounting
Review.
[16] Guthrie, J., & Murthy, V. (2009). Past, present and possible future developments in
human capital accounting: a tribute to Jan-Erik Grojer. Journal of Human Resource Costing
& Accounting, 13(2), 125–142.

European Journal of Business, Economics and Accountancy Vol. 5, No. 6, 2017 ISSN 2056-6018
Progressive Academic Publishing, UK Page 28 www.idpublications.org
[17] Guthrie, J., & Parker, L. (2006). Editorial: the coming out of accounting research
specialisms. Accounting, Auditing & Accountability Journal, 19(1), 5–16.
[18]Johanson, U., Mårtensson, M., & Skoog, M. (2001). Measuring to understand intangible
performance drivers. European Accounting Review, 10(3), 407–437.
[19] Marco Giuliani Maria Serena Chiucchi Stefano Marasca , (2016),"A history of
intellectual capital measurements: from production to consumption", Journal of Intellectual
Capital, Vol. 17 Iss 3 pp. 590- 606
[20] Mouritsen, J., Larsen, H. T., & Bukh, P. N. (2005). Dealing with the knowledge
economy: intellectual capital versus balanced scorecard. Journal of Intellectual Capital, 6(1),
8–27.
[21] Murthy, V., & Abeysekera, I. (2007). Human capital value creation practices of software
and service exporter firms in India. Journal of Human Resource Costing & Accounting,
11(2), 84–103.
[22] Petty, R., & Guthrie, J. (2000). Intellectual capital literature review: measurement,
reporting and management. Journal of Intellectual Capital, 1(2), 155–176.
[23] Stewart, T. A. (1997). Intellectual capital: The new wealth of organisations. London:
Doubleday - Currency.
[24] Sveiby, K.-E. (2001). A knowledge-based theory of the firm to guide in strategy
formulation. Journal of Intellectual Capital, 2(4), 344–358.

European Journal of Business, Economics and Accountancy Vol. 5, No. 6, 2017 ISSN 2056-6018
Progressive Academic Publishing, UK Page 39 www.idpublications.org
EFFECT OF FINANCIAL MARKET INTEGRATION ON FOREIGN
PORTFOLIO INVESTMENT DIVERSIFICATION IN DEVELOPING
STOCK MARKETS
Suva, M. Mark
Jomo Kenyatta University of
Agriculture and Technology
RWANDA
Jaya Shukla
Jomo Kenyatta University of
Agriculture and Technology
RWANDA
Marcel Ndengo
Jomo Kenyatta University of
Agriculture and Technology
RWANDA
ABSTRACT
The purpose of this study was to analyze the effect of financial market development level on
foreign portfolio investment diversification in developing stock markets. The study sought to
affirm or reject the alternative hypotheses that financial market integration level has a
negative effect on international portfolio investment diversification. From a sampling frame
of 43 developing stock markets, the study constituted a sample of 20 markets through non-
probability multi-stage procedures. Using a data capture sheet, equity time series data was
collected and summarized into Roy’s Safety-First Ratio (RSFR) excess returns on a
benchmark of FTSE 100. Data analysis techniques involved were simple pairwise correlation
and Johansen cointegration to respectively measure short run and long run integration levels.
The study found financial market integration partly critical to international portfolio
investment diversification.
Keywords: Integration, Diversification, Developing markets.
INTRODUCTION
Analyzing stock market dependencies in frontier and emerging markets is critical to
investment diversification, more so with regard to financial downturns. This importance is
attached to the fact that in highly comovement markets, shock transmission from a market
can have significant effects on others, from different proximity and size dimensions. Diverse
historical evidence affirms this: - The 2007/8 sub-prime mortgage crisis caused a 53% dip in
developing markets composite index performance, a 20-year low, against a 19% fall in the
All-Country World Index over the same time. This dip was echoed by markets in different
regions. While Pakistan’s Karachi stock market index gained over 10,000 basis points (or
100%) in the 3rd
Quarter of 2008 (Crisis date was July 17, 2008), the rest of the markets lost-
Egypt (36%), Hungary and Russia (34%), Argentina (32%), India (24%); South Africa
(22%), MSCI (2016).
A similar situation occurred in 1997 when the Thai Baht was devalued, resulting in a
currency crisis. The turmoil spread to East Asia and Russia (which defaulted in 1998) and
subsequently to Brazil. This was named the Asian flu (Forbes & Ringobon, 2002). Other
relevant spillovers across markets were the Debt crises in 1982, the Russian Cold in August
1998 (including the LTCM crisis), the Brazilian Sneeze in January of 1999, the NASDAQ
Rash in April of 2000 and the European debt crisis of 2007/8 (2009, Krugman et al., 2013).
In October 1987, the Hong Kong market cratered and the crash spread west to Europe,
hitting the United States after other markets had already declined by a significant margin. The
Dow Jones Industrial Average (DJIA) for example, dropped 508 points to 1738.74 ( a

European Journal of Business, Economics and Accountancy Vol. 5, No. 6, 2017 ISSN 2056-6018
Progressive Academic Publishing, UK Page 40 www.idpublications.org
22.61% dip), and the crash quickly affected major stock markets around the globe
(Zwaniecki, 2007).
Understanding the dynamics of volatility or shock transmission is hence central to financial
research and hence this study. Although stock market shock transmission is associated with
different preconditions, empirical literature (for instance Beine and Candleon 2006; Eun
&Shim, 1989; Nathaniel et al., 2008) delineates a tripod of factors: Industrialization
(economic development) differences, the degree of financial market synchronization
(financial market integration) and the filtration of material information to the markets under
study (financial market contagion).
From empirical literature on stock market linkages and investment diversification, 2 classes
of studies emerge. The first class consists of Crisis contingent studies-those that investigate
diversification possibilities across a crisis breakpoint date (for example Esin, 2004, Murshid,
2004, Nathaniel et al., 2008, Forbes & Ringobon, 2002; Connolly & Wang, 2003). The
second is the non-crisis-contingent studies, which simply investigate stock market
comovements over an undivided time horizon (studies like: Corhay & Urbain, 1993, Erb et
al., 1994, Roll, 1992, King et al., 1994; Beine & Candleon, 2006).
The grey area of the foregoing studies is that none of them used a benchmark portfolio. At the
core sound financial investment decision making is benchmarking, an analyst must consider
the investment’s suitability (to investor objectives, investment characteristics and
benchmarks), communicating them in plain language (Eaton, 2014) and failure to do this is a
violation of Global Investment Professional standard III (C). The researches lack both a
market benchmark and a measure of excess risk. Consequently, to advise investors on risk
diversification based on the findings of the foregoing studies is professionally imprudent, and
may lead to sub-optimal portfolio construction. In order to address the gap, this study
incorporates the FTSE 100 benchmark to the workings of excess returns and Roy’s Safety-
First Ratio (RSFR) for measurement excess risk based on the benchmark.
LITERATURE REVIEW
Esin (2004) examined the effect of economic integration among Turkish and European stock
exchanges, seeking to establish the suitability of international portfolio diversification. Using
correlation and cointegration tests on a sample of fifteen EU member-countries and Turkey
on continental market index series over the 1990-2003 sample period, the author found the
series to be integrated of the same order and hence it was possible to conduct cointegration
tests on them. The markets’ correlations were more synchronized during the post-Euro sub-
period than the time period before. Johansen cointegration test yielded results to the effect
that countries in the same economic bloc had no pair-wise cointegration with regard to
customs union but there was intra-country long-term market relationship.
An earlier study on stock mart comovement was conducted by Christofi & Christofi (1983).
On a sample of common stock monthly market price averages of 1959 to 1978, they
examined fourteen industrial countries for annual and biennial correlation coefficients of the
US with each of the countries. The study used Box-Jenkins tests and non-parametric tests for
annual correlations, then examined the coefficients by dividing the twenty years into two sub-
periods, as fixed exchange rate environment and flexible exchange rate environments. The
results revealed that the inter-country correlation coefficients remained the same over the
sub-period years examined. Through Principal components analysis for the same period and

European Journal of Business, Economics and Accountancy Vol. 5, No. 6, 2017 ISSN 2056-6018
Progressive Academic Publishing, UK Page 41 www.idpublications.org
two equal sub-periods Christofi & Christofi’s research concluded that the national stock
market indices of the 14 sample countries were interrelated through a common factor whose
effect appeared to be consistent over time. It was therefore not possible to benefit from
international investment diversification.
Mathur and Subrahmanyam (1990), studied the Nordic and US market for index
interdependencies. They analyzed the index time series via correlations and Vector
Autoregression (VAR). While the correlations yielded the results that there were high
interdependencies among countries which had high economic interdependency, the VAR
analysis results indicated that the US market was only influential on Denmark and not any
other market hence each market was responsible for own its behaviour.
Roll (1992) examined the equity prices of 24 countries over the 1988-1991 sample period.
The research involved correlation analysis computed from daily dollar-denominated returns.
The results gave correlation levels of below 0.5 (low) for most (276) of the 326 coefficients
obtained. Roll also calculated correlations from the industry perspective and found them to be
different (generally higher) from those computed using raw stock price indices. One
conclusion of the study was that countries with similar industrial structures had highly
correlated markets yet the importance of regional characteristics should not be overlooked.
The study also concluded that stock indices in different countries generally exhibited
disparate behaviour, principally due to differences in index construction procedures, industry
composition of individual nations and the effect of exchange rates.
In a study of weekly stock price indices from France, Germany, Italy, Netherlands and the
UK for the period March 1975 to September 1991, Corhay & Urbain (1993) used
cointegration technique. Faulting the use of correlation on the grounds that it may harbour
some long run components due to the trended characteristic of its constituent data, they opted
to use common stochastic trends when the series were stationary, in order to examine whether
stock prices of two or more countries moved together. The authors concluded that
cointegration analysis could be used for finding the links between stock markets and the
results were the same for all the other European stock markets.
Erb et al. (1994) used correlation analysis to determine whether the G-7 nations had market
dependencies. They found that correlations among the G-7 countries were affected by the
business cycle, whereby the correlation was high during recession and low during recovery.
They further noted that these correlations were not symmetric in up and down markets. The
study concluded that integration initiative was not significantly responsible for market
coupling or comovement trending.
The foregoing empirical literature can be summarized to conclude that the different studies
conducted did not have generalizable findings on the effect of financial market integration
and investment diversification. Besides, the studies used indexes at level autoregressive or
differenced form but no benchmark was applied, rendering their application infeasible to
decision making on active returns. The market development contexts are also disparate, hence
the necessity of a research to address these gaps.
METHODOLOGY
Population
This study targeted all developing markets, both emerging and frontier markets as
documented in different sources of the sampling frame.

European Journal of Business, Economics and Accountancy Vol. 5, No. 6, 2017 ISSN 2056-6018
Progressive Academic Publishing, UK Page 42 www.idpublications.org
Sampling frame
The sampling frame at the time of this study was the MSCI database of developing markets.
According to MSCI (2016), the markets were 43 (including 23 emerging and 20 frontier).
The sampling frame is justified by the fact that MSCI has not only summarized the clusters
but has gone ahead and prepared indexes, stratified by different regions: - EMEA, Asia-
pacific, Europe; Latin America (Emerging markets) and a global frontier markets index,
while other indexes disregard these frontier markets on the claim of small size and
illiquidity. Besides, MSCI uses a common currency-the US dollar and index returns other
than the indexes themselves, contrary to the rest. Table 3.1 shows the sampling plan, in which
the countries in brackets contribute the main regional index constituents).
Table 3.1: Cluster samples
Stratum Size Main Countries
Frontier
23 (Kuwait, Argentina, Nigeria, Pakistan, Morocco), Bahrain,
Bangladesh, Bulgaria, Croatia, Estonia, Jordan, Kenya,
Lebanon, Luthania, Kazakhstan, Mauritius, Oman, ,
Romania, Serbia, Sri-Lanka, Tunisia, Vietnam, Slovenia.
Emerging 20 (Brazil, Chile, China, Colombia, Czech Republic), Egypt,
(Hungary, India), Indonesia, (South Korea, Malaysia,
Mexico, Peru,) Philippines, (Poland, Russia, South Africa,
Taiwan), Thailand; Turkey.
Source: MSCI Developing Markets Databases by Region (2016)
Sampling and Sampling Techniques
Out of the sampling frame of 43 countries, a total of 20 were selected in a multi-stage
sampling procedure. The 43 markets were clustered as either “Frontier” or “Emerging”.
From the countries that fit the definition of either frontier or emerging, the index constituents
were selected judgmentally according to the rules of constructing the Global Investable
Market Index (GIMI) methodology. From the MSCI (2016) database, the GIMI methodology
classifies index constituents on the basis of different parameters. These can be summarized as
in Table 3.2.
Table 3.2 Index constituents’ selection benchmarks
CLASS/MARKET Frontier markets Emerging Markets
Equity Universe Minimum
Size Requirement (UMSR)
U$ 120million U$ 150 million
Equity Universe free float-
adjusted market capitalization
0.25 of UMSR 0.5 of UMSR
Minimum length of trading ≥ 3 months before implementation date, except IPOs with
company and float Market Capitalization ≥1.8x of the Interim
Standard Index Cutoffs post sizable offering
Global minimum foreign
inclusion factor (FIF)
Larger FM: ≥ 0.15; If < 0.15, full Market capitalization
≥Interim Size-Segment cutoff; float Market Capitalization
must be ≥ 1.8x ½ UMSR.
Maximum stock price U$ 10,000
Minimum liquidity
requirement
Less: GIMI attached More: GIMI attached
Minimum foreign room
requirement
≥ 15%; if ≤25%, included with a 0.5 FIF adjustment
Source: MSCI (2016) GIMI parameters

European Journal of Business, Economics and Accountancy Vol. 5, No. 6, 2017 ISSN 2056-6018
Progressive Academic Publishing, UK Page 43 www.idpublications.org
Guided by the criteria in Table 3.2, the research from Table 3.3 judgmentally selected the 20
countries with the GIMI-compliant corporations making up the developing market indexes
(Frontier and emerging), and with the greatest contribution to the composite index market
capitalization. These market host countries were: Frontier-5 (Kuwait, Argentina, Nigeria,
Pakistan, Morocco, and emerging- 15 (Poland, Russia, South Africa, Taiwan, Hungary, India,
South Korea, Malaysia, Mexico, Peru, Brazil, Chile, China, Colombia, Czech Republic.
These countries (in Table 3.3) are the domiciles of the GIMI-compliant corporations making
up the developing market indexes.
Table 3.3 Market sampling procedure
Emerging Market constituents and (main countries
represented, Name of Stock market)
Frontier market constituents
and (main countries
represented)
Africa 92 (1): South Africa (Johannesburg)
121 (5): Kuwait(Kuwait-
KWSEIDX),
Argentina(Merval), Nigeria
(Nigeria), Pakistan (KSE 100);
Egypt (CASE 30).
Europe 171 (4): Russia (RTS index), Poland
(WIG), Hungary (BUX); Czech Republic
(PX 50).
Latin America 119(5): Brazil (Sao Paulo Bovespa),
Mexico(IPC All-Share), Chile (Santiago),
Colombia (Bogota); Peru (Lima)
Asia-Pacific 554 (5): China (Shanghai Composite),
Korea (Kospi), Taiwan (Taiex Weigted),
India (S&P BSE Sensex); Malaysia (Kuala
Lumpur).
All from 20 countries
Data Collection and processing
Using 17th
July 2007 as the sub-prime mortgage crisis breakpoint date, the research used
historical data on two 50-day sub-periods: -the pre-crisis and crisis periods. The secondary
data was obtained from Wall Street Journal via its online market database.
The analysis of the data was based on index returns instead of actual prices for two reasons: -
First, return is a complete and scale-free summary of the investment opportunity. Second,
returns are easier to handle than price series because the former have more attractive
statistical properties (Campbell, Lo, & MacKinlay, 1997). Continuously compounded returns
enjoy advantages over simple net returns. In a multi-period, setup, for example, the
continuously compounded return is simply the sum of continuously compounded one-period
returns involved. The statistical properties of log returns are also more pliable (Tsay, 2005,
Poon and Taylor, 1992; Nikkinen et al., 2008). Allowing for a passive investment
management strategy, let the index of an inter-market free float- adjusted market cap-
weighted portfolio at time = ( −1, ), be and the periodic returns be R . Following this,
the periodic absolute and log returns on the portfolio index will respectively be:
1)1( /)( tttt PPPR 3.1
Hence,
3.2
Equations (3.1) and (3.2) were the inputs of the data to be used on the time series data re-
organization.

European Journal of Business, Economics and Accountancy Vol. 5, No. 6, 2017 ISSN 2056-6018
Progressive Academic Publishing, UK Page 44 www.idpublications.org
Data summary involved computation of excess returns per unit of risk, using Roy’s Safety
First (RSF) ratio on the FTSE 100 index benchmark. Roy’s Safety-First Ratio is in the
equation (3.3).
p
Bp RRSR
3.3
Where r
Bp RR , and p are respectively the expected returns on the portfolio(to be) held, the
expected return of a benchmark portfolio (FTSE 100 index in this study) and the standard
deviation of the returns of the portfolio invested in.
Market integration Analysis
Market integration level was analyzed in two time dimensions. For the short run, the analysis
used was simple correlation of the market pairs while for the long run market integration was
measured using Johansen co integration tests.
RESULTS
Short run analysis of financial market integration
This section analyzed excess stock market index returns, benchmarked on Financial Times
Stock Exchange (FTSE) 100 world indexes. The correlation coefficients (short run dynamics)
and their significance are presented in Table 4.1.
Table 4.1 Benchmark return correlations
ARG BRA
ZIL
CHI
LE
CHI
NA
CZE
CH
EGX HUNG INDI
A
JOHA
NN
MAL
AY
MEX RUSS PAKI
ST
POL SKOR TAI
ARG 1.00
BRAZIL 0.56 1.00
CHILE 0.46 0.62 1.00
CHINA 0.34 0.42 0.19 1.00
CZECH 0.57 0.65 0.48 0.31 1.00
EGYPT 0.67 0.69 0.58 0.25 0.66 1.00
HUNGAR 0.54 0.65 0.62 0.28 0.74 0.53 1.00
INDIA 0.47 0.62 0.51 0.53 0.64 0.66 0.60 1.00
JOHANN 0.20 0.12 0.16 0.14 0.18 0.14 0.18 0.18 1.00
MALAYS 0.54 0.71 0.66 0.34 0.73 0.65 0.74 0.79 0.27 1.00
MEXICO 0.62 0.69 0.60 0.24 0.73 0.61 0.67 0.55 0.25 0.71 1.00
RUSSIA 0.30 0.46 0.21 0.17 0.55 0.42 0.50 0.41 0.14 0.48 0.27 1.00
PAKIST -0.22 -0.16
-
0.19
-
0.14
-
0.29 -0.28 -0.34 -0.29 -0.05 -0.21 -0.10 -0.39 1.00
POLAND 0.09 0.27 0.17 0.26
-
0.05 0.00 0.00 -0.03 0.01 0.05 -0.15 0.30 -0.12 1.00
SKOREA 0.66 0.81 0.66 0.50 0.81 0.67 0.76 0.65 0.22 0.74 0.67 0.54 -0.34 0.30 1.00
TAIWAN 0.56 0.78 0.70 0.47 0.68 0.69 0.64 0.61 0.20 0.71 0.61 0.58 -0.21 0.34 0.80 1.00
In Yellow Fill:significant correlations
Bold only: insignificant negative or zero correlations.
Not filled; not bold insignificant positive
correlations
From Table 4.1, Pakistan stock returns were negatively correlated with all the other markets.
These correlations were significant, except for South Korea. This means that there was
benefit of international investment diversification benefit for portfolio pairs involving
Pakistan. Investors should however be cautious in incorporating South Korea. Poland had 4
significant negative correlations (with Czech Republic, India, Malaysia and Pakistan), no
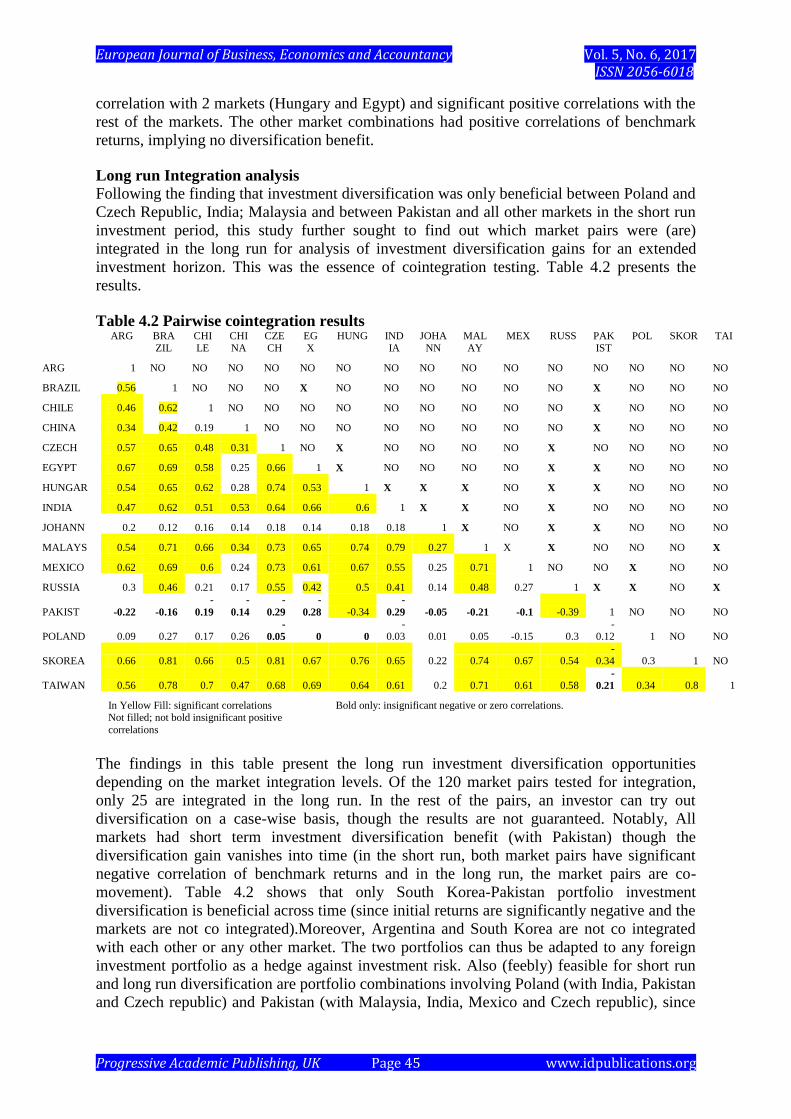
European Journal of Business, Economics and Accountancy Vol. 5, No. 6, 2017 ISSN 2056-6018
Progressive Academic Publishing, UK Page 45 www.idpublications.org
correlation with 2 markets (Hungary and Egypt) and significant positive correlations with the
rest of the markets. The other market combinations had positive correlations of benchmark
returns, implying no diversification benefit.
Long run Integration analysis
Following the finding that investment diversification was only beneficial between Poland and
Czech Republic, India; Malaysia and between Pakistan and all other markets in the short run
investment period, this study further sought to find out which market pairs were (are)
integrated in the long run for analysis of investment diversification gains for an extended
investment horizon. This was the essence of cointegration testing. Table 4.2 presents the
results.
Table 4.2 Pairwise cointegration results
ARG BRAZIL
CHILE
CHINA
CZECH
EGX
HUNG INDIA
JOHANN
MALAY
MEX RUSS PAKIST
POL SKOR TAI
ARG 1 NO NO NO NO NO NO NO NO NO NO NO NO NO NO NO
BRAZIL 0.56 1 NO NO NO X NO NO NO NO NO NO X NO NO NO
CHILE 0.46 0.62 1 NO NO NO NO NO NO NO NO NO X NO NO NO
CHINA 0.34 0.42 0.19 1 NO NO NO NO NO NO NO NO X NO NO NO
CZECH 0.57 0.65 0.48 0.31 1 NO X NO NO NO NO X NO NO NO NO
EGYPT 0.67 0.69 0.58 0.25 0.66 1 X NO NO NO NO X X NO NO NO
HUNGAR 0.54 0.65 0.62 0.28 0.74 0.53 1 X X X NO X X NO NO NO
INDIA 0.47 0.62 0.51 0.53 0.64 0.66 0.6 1 X X NO X NO NO NO NO
JOHANN 0.2 0.12 0.16 0.14 0.18 0.14 0.18 0.18 1 X NO X X NO NO NO
MALAYS 0.54 0.71 0.66 0.34 0.73 0.65 0.74 0.79 0.27 1 X X NO NO NO X
MEXICO 0.62 0.69 0.6 0.24 0.73 0.61 0.67 0.55 0.25 0.71 1 NO NO X NO NO
RUSSIA 0.3 0.46 0.21 0.17 0.55 0.42 0.5 0.41 0.14 0.48 0.27 1 X X NO X
PAKIST -0.22 -0.16
-
0.19
-
0.14
-
0.29
-
0.28 -0.34 -
0.29 -0.05 -0.21 -0.1 -0.39 1 NO NO NO
POLAND 0.09 0.27 0.17 0.26 -
0.05 0 0
-
0.03 0.01 0.05 -0.15 0.3
-
0.12 1 NO NO
SKOREA 0.66 0.81 0.66 0.5 0.81 0.67 0.76 0.65 0.22 0.74 0.67 0.54 -
0.34 0.3 1 NO
TAIWAN 0.56 0.78 0.7 0.47 0.68 0.69 0.64 0.61 0.2 0.71 0.61 0.58 -
0.21 0.34 0.8 1
In Yellow Fill: significant correlations
Bold only: insignificant negative or zero correlations.
Not filled; not bold insignificant positive
correlations
The findings in this table present the long run investment diversification opportunities
depending on the market integration levels. Of the 120 market pairs tested for integration,
only 25 are integrated in the long run. In the rest of the pairs, an investor can try out
diversification on a case-wise basis, though the results are not guaranteed. Notably, All
markets had short term investment diversification benefit (with Pakistan) though the
diversification gain vanishes into time (in the short run, both market pairs have significant
negative correlation of benchmark returns and in the long run, the market pairs are co-
movement). Table 4.2 shows that only South Korea-Pakistan portfolio investment
diversification is beneficial across time (since initial returns are significantly negative and the
markets are not co integrated).Moreover, Argentina and South Korea are not co integrated
with each other or any other market. The two portfolios can thus be adapted to any foreign
investment portfolio as a hedge against investment risk. Also (feebly) feasible for short run
and long run diversification are portfolio combinations involving Poland (with India, Pakistan
and Czech republic) and Pakistan (with Malaysia, India, Mexico and Czech republic), since

European Journal of Business, Economics and Accountancy Vol. 5, No. 6, 2017 ISSN 2056-6018
Progressive Academic Publishing, UK Page 46 www.idpublications.org
these markets have (insignificant) negative correlations of benchmark returns and are all not
I(1).
CONCLUSION
Both in the short run and long run investment horizons, only two market sets are
disintegrated: Poland and Egypt; Pakistan with any of Taiwan, South Korea, Poland,
Argentina, Czech Republic, India, Malaysia; Mexico. For the rest of stock market pairs, there
investment diversification would be infeasible.
REFERENCES
Beine, M. & Candelon, B. (2006). Liberalization and stock market co-movement between
emerging economies, CESinfo working paper, No. 2131
Campbell, J. Y. and Hamao, Y. (1992). Predictable equity returns in the United States and
Japan: A Study of long-term capital financial market integration. Journal of Finance,
47(1), 43-67
Christofi A., Christofi, P. and Philippatos, G. (1983. The inter-temporal stability of
international stock market relationships: Another View. Financial Management:
Winter, 63.
Clark, P. (1973). A subordinated stochastic process model with finite variance for
speculative prices. Econometrica, 41, 135-155.
Corhay, A., Rad A. and Urbain J. (1993). Common Stochastic Trends in European Stock
Markets. Economics Letters, 385(42).
Eaton, D. (2014). CFA level I preparation material. Kaplan University: Kaplan Inc.
Erb, C., Harvey, C. and Viskanta, T. (1994). Forecasting international equity correlations.
Financial Analysts Journal, November-December, 32-45.
Esin, Y. (2004). Financial market integration between Turkey and European Union
countries. Istanbul: Middle East Technical University.
Eun, S. Cheol & Shim, Sangdal. (1989). International transmission of stock market
movements.Journal of Financial and Quantitative Analysis, 24(2), 241-256.
Forbes, K.J. and Rigobon, R. (2002).No contagion, only interdependence: Measuring stock
market comovements.The Journal of Finance, 57(5).
King, M. and Wadhwani, S. (1990). Transmission of volatility between stock
markets.Review of Financial Studies, 3(1),5-33.
King, M., Sentana, E. & Wadhawi, S. (1994). Volatility and Links between National Stock
Markets. Econometrica,62(4)
Krugman, P., Obsfeld, M.; Melitz, J. (2013). International Economics: Policy and theory.
9th
edition. England: Pearson Education Ltd.
Mathur, I. and Subrahmanyam, V. (1990).Interdependencies among the Nordic and U.S.
stock markets.Scandinavian Journal of Economics, 92 (4), 587 – 597.
Nathaniel, F., Brenda, G. and Heiko, H. (2008).Transmission of liquidity shocks: Evidence
from the 2007 subprime crisis.IMF Working Paper No. WP/08/200.
Nikkinen, J., Omran, M., Sahlström, P., & Äijö, J. (2008).Stock returns and volatility
following the September 11 attacks: Evidence from 53 equity markets.International
Review of Financial Analysis, 17, 27-46.
Poon, S. H., & Taylor, S. J. (1992).Stock returns and volatility: An empirical study of the
UK stock market.Journal of Banking and Finance, 16, 37-59.
Roll, R.(1992).Industrial structure and the comparative behavior of international stock
market indices.The Journal of Finance, 3(4).

European Journal of Business, Economics and Accountancy Vol. 5, No. 6, 2017 ISSN 2056-6018
Progressive Academic Publishing, UK Page 47 www.idpublications.org
Tsay, R. S. (2005). Analysis of Financial Time Series. Hoboken: John Wiley & Sons, Inc.
Zwaniecki, A. (2007).Foreign companies in the United States bound by anti-bribery
Law.USINFO, 1.

European Journal of Business, Economics and Accountancy Vol. 5, No. 6, 2017 ISSN 2056-6018
Progressive Academic Publishing, UK Page 48 www.idpublications.org
FACTORS AFFECTING SHARE PRICE OF CEMENT INDUSTRY:
“A STUDY ON LISTED CEMENT COMPANIES OF DSE”
Md.Shohidul Islam, Murshedul Arafin & Fatema Tuz Zohora
Lecturer Department of Business Administration, City University
BANGLADESH
Corresponding Author Email: [email protected]
ABSTRACT
This report is about the Factors affecting the share price of the cement industry: A study on the
listed cement companies of DSE.‟ The objective of this study is to analyze the factors influence
in determining the share price of the listed cement companies in DSE. The study analyzes the
share price movement of the factor for a specific time period. The factors are mainly categorized
in three broad categories such as: dividend, company, country. Therefore, the factors included:
Dividend Announcement Date & Payout Amount, Disclosure of News, and Sharp Movement of
Market Index. After thorough analysis the study reveals that the most influential factors
contributing to the price movement of the listed cement companies are sharp movement of
market index as well as the disclosure of news whereas dividend did not affect that much
surprisingly. It was also found that the theoretical perspectives regarding the stock market are
often surpassed by different stock market volatility variables due to the inefficiency of the
existing capital market. Recommendations like decreasing the news circulation time, proper
monitoring system, awareness were made lastly to minimize the inefficiency and to attract more
educated investors to benefit the market in the long term.
Keywords: Share Price, Cement Industry, DSE, Factors, Dividend.
INTRODUCTION
Stock exchange is an important part of financial mechanism in Bangladesh. It works as a
supplement of fund raising through shares to spread the fund to deficit units of economy. Hence
it is undoubtedly a vital institute for economy of Bangladesh. The main objective of stock
exchange is to create a win-win situation for both investor and issuer through trading of stocks
and debt financing. With the supervision of government, investors gains confidence to invest in
share market. But only supervision is not enough to ensure financial gain for the investor. Other
particular analyses are also important to make investment decisions. This report focuses on some
crucial factors that have high impact on share prices. Based on historical data, the analyses were
to conclude the dependability of share price on the factors. Factors assumed to cause change in
share price are the dividend announcement news, other news regarding change in organization
structures (merger or acquisition), change DSE general index.
Objectives The main objective of the study are, To study and analyze movement of share price after the
Dividend Announcement Date & Payout Amount, To observe share price changes after
disclosure of important company based News circulated by DSE, To study the change in share
price with the sharp Movement of Market Index (DGEN).

European Journal of Business, Economics and Accountancy Vol. 5, No. 6, 2017 ISSN 2056-6018
Progressive Academic Publishing, UK Page 49 www.idpublications.org
Scope There are 5 cement companies enlisted in Dhaka Stock Exchange. To conduct the study, data of
all the 7 companies were collected. Daily data available in stock exchange and other secondary
sources were used for definite periods focusing on the study. The 5 cement companies are:
i.Aramit Cement Ltd ii.Confidence Cement Ltd iii.Heidelberg Cement Ltd iv.Lafarge Surma
Cement v.Meghna Cement Ltd .
Limitations Due to the volatility of share market, trends of the factors didn’t show relevance according to
the theory sometimes. Hence making any concrete interpretation was difficult.
An overall macro-economic study could have elevated the accuracy of the study.
Lack of availability of some confidential information about the companies also hindered the
study.
LITERATURE REVIEW
A large number of empirical studies have been conducted about the determinants of stock prices.
Several researchers examined the relationships between stock prices and selected factors which
could be either internal or external. The results show a variety of findings depending on the
scope of the study. Some of those factors could be common for all stock markets. In this section
some of these studies will be reviewed. (Rahman, 2006) found the negative correlation between
the beta and stock return, which is reason for inefficiency of market. The decomposition of stock
price movements is very sensitive to what assumption is made about the presence of permanent
changes in either real dividend growth or excess stock return (Wohar & Mark, 2006). (Hartono,
2004) examined that the positive recent earning information has significant relation with stock
prices when it follows negative dividend information, and vice versa. Dividend change
announcements elicit a greater change in stock price when the nature of the news (good or bad)
goes against the grain of the recent market direction during volatile times (Docking and Koch,
2005). (Glaser and Weber, 2007) found the Stock prices have a significant positive effect on long
term money demand and its omission can lead to serious misspecification in the money demand
function in both short and long term. (Joshep, and Vezos, 2006) assert that Foreign exchange
(FX) rate and interest rate risks are important financial and economic factors affecting the value
of common stocks. The results indicate a significant and negative relation between stock prices
and inflation and output growth negatively and significantly affect stock prices. (Dimitrios
Tsoukalas,2003) Exchange rate, industrial production, money supply, and consumer prices were
used as macroeconomic factors and reveal a strong relationship between stock prices with those
factors. (Bayesid Ali and Tanbir Ahmed, 2010) stated in their study that announcement of
dividend is considered to be a significant variable for stock price movement. Theories of finance
are never concrete. The laws in finance are seldom proven. However, the laws provide the ideas
about the mechanism of stock market (Bergen,2017). It explains the flow of funds around the
economy through stock exchange. The pattern fluctuates, but somehow stabilizes. Such
fluctuations raise confusion among the investors. They fall in dilemma about whether to invest in
stock market or not. They debate about the efficiency of stock market. That means whether the
available public information reflects the share price of a company or not. Rumors and
falsification started to dominate and tempered the peak of price of shares for so many companies.
In 2007, the stock exchange almost outperformed the previous years. In 2010, it gained almost
83% (Saha, 2012). Everything was going so well until the liquidity level hit the ceiling, calling
for a new policy and the implementation of policy disrupted the whole share market, reducing

European Journal of Business, Economics and Accountancy Vol. 5, No. 6, 2017 ISSN 2056-6018
Progressive Academic Publishing, UK Page 50 www.idpublications.org
the share price index sharply within few days in December 2010. Such unexpected price fall
crashed the whole Dhaka stock exchange, causing the investors great financial misery. The
abnormal growth of DSE finally became an eye wash. Such volatility and abnormality is always
sure to cause problem in financial condition of any country. Hence, it is important to study the
factors affecting the price of share more than any other factors existing. There are some factors
causing positive growth in share price and company profitability. For example, any news of
disclosure of dividend indicates that the performance of that particular company is being well in
the industry. So this news causes a temporary increase in share price. There are many other
factors which affect share price both positively and negatively. However, such impact not only
depends on those factors only but also on the macroeconomic condition of country as well.
Methodology
The report is mainly based on the findings and interpretations that came up after consulting the
secondary data and primary data.The secondary research was carried out elaborately to
generalize the idea of Dhaka stock exchange, its previous and current scenario. Though there
were many data regarding the different modes separately, the final sorting of data were made
based on the 5 cement companies.
Findings & Analysis Price movement of stocks in Dhaka Stock Exchange (DSE), more specifically of the listed
companies in the cement sector are affected by a number of factors; among which some key
factors have been taken considering the availability of quantitative data to calculate and show
actual price shift incurred by the below mentioned factors. The factors discussed in this part of
the report can be categorized broadly as company specific, industry specific, country specific,
and global market specific whereas a single factor isn’t strictly limited to fall into one single
category. This categorical aspect of the factors is going to provide insights into the movement of
share price of the listed cement companies from different angles and give a more overall view on
how closely the companies‟ share prices are related with the relevant factors, three factors have
been chosen based on the criterions mentioned above and the factors are as follows: Dividend
Announcement Date & Payout Amount, Disclosure of News, Sharp Movement of Market Index
(DGEN) .
Dividend Announcement Date & Payment Amount
A dividend is a systematic distribution of a portion of a company's earnings, to a segment of its
shareholders and is decided by the board of directors of the company. Dividends can be issued as
cash payments, as shares of stock, or as other property (Investopedia). Dividend are announced
and distributed in both interim and final periods, depending on the company policy.
In Bangladesh, cash payment is the main form of dividend disbursement. Both interim and final
dividend is given by the listed companies of the cement industry. Here, interim dividend is
announced mainly based on half yearly earnings and final dividend is given based on annual
earnings. The cement companies with previous January-December financial year (recently all
cement companies is changing their accounting year to July-June as par new BSEC notification)
announced their final dividend in March-May period while companies with July-June financial
year have announced their final dividend in a period ranging from September-November.
However, in both cases the share price of the companies should have affected positively/
negatively, based on the amount of dividend that has been announced to be distributed.

European Journal of Business, Economics and Accountancy Vol. 5, No. 6, 2017 ISSN 2056-6018
Progressive Academic Publishing, UK Page 51 www.idpublications.org
Impact of Dividend on Cement Companies’ Share Price To measure the impact of disclosure of dividend, a period of 15 trading days, both before and
after the date of dividend declaration has been taken to visualize the direction of share price
movement.
Aramit Cement:
Aramit Dividend: Oct 30, 2016
45
41.8
Pri
ce
40
36
33.1
35
30.2
Sh
are
30
31.4
25
12% cash dividend (total) for Jun 2016 (18 months)
20
5-Oct-16 12-Oct-16 19-Oct-16 26-Oct-16 2-Nov-16 9-Nov-16 16-Nov-16
Pre Dividend Price Post Dividend Price
On May 4, 2015, Aramit announced 10% cash dividend per share (means Tk. 1) for the year
ended at December 31, 2014, a positive price change after the dividend being announced can be
seen. 10% cash dividend is not high considering most of the listed companies in the cement. But
this dividend margin showed that the management has confidence in their company to pull
through and have better financial performance in the future and the investors have reflected their
trust which moved the share price upwards. Within, 4 days of the announcement date the share
price reached to Tk. 26.6, making the capital gain at 24.3%. Then the price moved a bit up &
down but ultimately hit the price of Tk. 26 within the 15 days period.In the new financial year of
July-June ending in 2016, Aramit announced its final dividend to be at 70%, by adding 20%
more to the interim dividend announced previously.
In this case, the price movement doesn’t follow previous post dividend declaration pattern. The
price was rising and falling by a significant amount before the announcement of dividend. Then
the announcement of dividend came when the price was Tk. 31.4 which then slightly rose to Tk.
33.1 three days after the announcement date. The price later fell gradually for other variables of
the stock market but not at the volatile rate that was present before the announcement of
dividend.

European Journal of Business, Economics and Accountancy Vol. 5, No. 6, 2017 ISSN 2056-6018
Progressive Academic Publishing, UK Page 52 www.idpublications.org
Confidence Cement
Confidence Dividend: Nov 1, 2016
135
127.8
125
Pri
ce
115
105
111.4
Sh
are
95 89.7
98.4
85
37.5% cash dividend (total) for Jun 2016 (18 months)
75
9-Oct-16 16-Oct-16 23-Oct-16
30-Oct-
16 6-Nov-16 13-Nov-16 20-Nov-16
Pre Dividend Price Post Dividend Price
On May 4, 2015, Confidence Cement announced 25% cash dividend for the year ended at
December 31, 2014.A change in share price is very much evident before and after the date of
dividend declaration. The price of the share fell by 17.70% till the date of declaration but then
rose by 27.65% to Tk. 88.4 during the 30 days trading period.In the new financial year of July-
June ending in 2016, Confidence announced its final dividend to be at 37.5% for the 18 months
period, by adding 10% more to the interim dividend announced previously. Here, the price
movement is again obvious of a sharp rise after the date of the announcement. The almost flat
line movement before the announcement date took a sharp upward to Tk. 127.8/ share, making
the capital yield almost 30% within one week of the announcement. But then the price fell for
due to share market volatility and parked at Tk. 111.4 at the end of 30 days period-still at a lot
higher price than the starting price of Tk. 89.7.

European Journal of Business, Economics and Accountancy Vol. 5, No. 6, 2017 ISSN 2056-6018
Progressive Academic Publishing, UK Page 53 www.idpublications.org
Heidelberg Cement
Heidelberg Dividend: Mar 1, 2015
540
531.1
520
Pri
ce
500
500.7
Sh
are
480
465.4
460
380% cash dividend for Dec
2014
440
8-Feb-15 15-Feb-15 22-Feb-15 1-Mar-15 8-Mar-15 15-Mar-15 22-Mar-15
Pre Dividend Price Post Dividend Price
On March 1, 2015, Heidelberg Cement announced 380% cash for the year ended at December
21, 2014.
In this case, an interesting reverse effect of dividend announcement is observed. The price rose
to Tk. 531.1 from Tk. 500.7 during the 15 days period before the declaration date, but then took
a downturn to ultimately reach at Tk. 465.4 within 15 post dividend trading days. This trend can
be explained as the investors‟ expectation of greater dividend declaration which fueled the price
rise before that day of announcement but then fell sharply after expectation being not met. Also,
dividend of Tk. 38 means a dividend yield of only 7% at the date of announcement which may
have also been a reason behind price downfall. Heidelberg Cement announced 300% cash for the
next year ended at December 31, 2015; 80% less than the previous year’s declared dividend. The
previous trend of price downfall after the dividend declaration can be observed. This can again
be accounted to investors‟ expectation and comparatively lower dividend yield of only 5% than
that of previous year, along with the company’s symbol of loss of confidence in their own
performance by announcing lower dividend rate. This ultimately led to investors‟ loss of
confidence too and hence the downfall of the price.

European Journal of Business, Economics and Accountancy Vol. 5, No. 6, 2017 ISSN 2056-6018
Progressive Academic Publishing, UK Page 54 www.idpublications.org
Lafarge Surma Cement
Lafarge Dividend: Mar 6, 2016
90
84.8
85
Pri
ce 80
74.7
75
Sh
are
73.5
69.6
70
65
10% cash dividend (total) for Dec
2015
60
11-Feb-16 18-Feb-16 25-Feb-16
3-Mar-
16 10-Mar-1617-Mar-16 24-Mar-16
Pre Dividend Price Post Dividend Price
On March 8, 2015 Lafarge Surma announced a 10% final cash dividend. a real case of
share market volatility can be observed. The price of the share was in a downward trend before
the announcement date. Then the price increased to Tk. 124.6 within 4 days of the declaration,
making the capital yield at almost 13% and decreased to Tk. 110.3 just after 2 days. Then the
price rose again and fell again; ultimately leading to Tk. 114.5 after the 15 days of dividend
declaration. Larfarge announced 10% cash dividend again for the year 2015 on March 6, 2016.
Here, it is seen that the price of Lafarge shares were in a sharp upward then downward pattern
before the dividend announcement. After the date of announcement, the price ultimately
decreased; but the movement of share price became more stable making the capital loss at only
5.31% after 15 days post dividend declaration date. As Lafarge is also changing its accounting
year to July-June, they announced an interim 5% cash dividend for the 12 months ended at
December 31, 2016.
It can be safely assumed that Lafarge’s share price is at more stable state than the previous year’s
announcement period. The price movement here is represented by almost a flat line; the only
significant change being 5% capital gain at Tk. 77.9 only after 4 days of dividend
announcement. The price ultimately fell to the announcement date price later.

European Journal of Business, Economics and Accountancy Vol. 5, No. 6, 2017 ISSN 2056-6018
Progressive Academic Publishing, UK Page 55 www.idpublications.org
Meghna Cement
Meghna Dividend: Apr 30, 2015
125
115.5
115
106.4
105 100.1
Pri
ce
95
Sh
are
85
75
74.8
65
55
15% cash dividend for Dec
2014
7-Apr-15 14-Apr-15 21-Apr-15
28-Apr-
15 5-May-15 12-May-15 19-May-15
Pre Dividend Price Post Dividend Price
For the year ended at December 31, 2014, Meghan Cement announced 15% cash dividend.
it can be perceived that the price of the stock of Meghna had a general decreasing pattern before
the date of the announcement. The decreasing pattern also continued for some days after the
dividend declaration, probably because of the low dividend yield and the time the investors took
to evaluate the newly announced dividend policy and company’s future prospects. Then the
dividend factor kicked in, making a sharp upward trend to a price of Tk. 115.5 from Tk. 74.8
with a capital yield of 54.4% within one week of the announcement date. Lastly, the price
decreased a little to Tk. 106.4, still being a lot higher than the price at the announcement date.
For the 18 months period ended at June, 2016, same % of dividend was declared by Meghna
Cement As the same amount of dividend was given for the 18 months period which was given
for the previous 12 months period, this indicated a fall in the company’s financial performance
and the investor’s didn’t take it positively. The share price decreased after the dividend
announcement date but the percentage decrease was only 4% at the end of the given period.
Factor Evaluation Dividend declaration showed a positive impact on share price movement in most cases; if the
dividend declaration didn’t take the share price upward, it at least stabilized the movement of
share price. Yet, dividend announcement also showed some unexpected downturn for which no
justifiable reason can be found. There are so many variables in the share market that dividend
solely couldn’t affect the price much enough to show the expected theoretical result.
Disclosure of News News, in some cases also known as PSI (Price Sensitive Information), is another factor that
greatly affects the stock prices in DSE. News can be positive, negative or neutral. In case of
cement companies of DSE, positive news are mainly about capacity expansion, acquisition,
merger etc. whereas negative news can be decrease in EPS, hiding information etc. Neutral news
like AGM date, transfer of shares among the sponsors does not have any impact on the share

European Journal of Business, Economics and Accountancy Vol. 5, No. 6, 2017 ISSN 2056-6018
Progressive Academic Publishing, UK Page 56 www.idpublications.org
price at all. For the purpose of logical analysis, one selected price sensitive news for each listed
cement companies have been taken from the latest two years news available at DSE‟s website.
Impact of News on Cement Companies’ Share Price To measure the impact of disclosure of news, a period of 7 trading days, both before and after the
date of news disclosure has been taken to visualize the direction of share price movement.
Aramit Cement
Aramit News: Dec 29, 2016
50
47.4
44.8
Pri
ce 45
40
Sh
are
35
37.2
30 34
25
Pre News Price Post News Price
On December 29, 2016, Aramit Cement informed to comply with BSEC regulations that Unit
2‟s commercial production will initiate from January 01, 2017, having a production capacity of
1,000 M. Tons per day (Dhaka Stock Exchange, 2016).After the news was disbursed, the price of
Aramit Cement’s stock started to rise, showing a forward effect. The price was already in an
upward trend, rising to Tk. 34/ share from Tk. 37.2/ share in 7 days; but started to skyrocket after
the disbursement of news. Within 3 trading days, the price increased by Tk. 10.2, reaching to
47.4 tk/ share and making the capital yield 27.4%. Expanding production capacity means that the
company is growing and is likely to have more profitability in the near future, which constitutes
as the main reason behind this price rise. Later, the price dropped a little and ended at Tk. 44.8
after the end of post 7 days period.

European Journal of Business, Economics and Accountancy Vol. 5, No. 6, 2017 ISSN 2056-6018
Progressive Academic Publishing, UK Page 57 www.idpublications.org
Confidence Cement
Confidence News: Nov 15, 2016
130
127.8
Pri
ce
125
120
115.5
Sh
are
115
112.3 110
110
105
Pre News Price Post News Price
It was on November 15, 2016 that Confidence Cement disclosed the news clarifying their EPS
for the period from July-September, 2015, stating that the company didn’t mention their income
from associate companies in that quarter as the information was not available. That income was
later restated in their Q1 ‟17 quarterly statements (Dhaka Stock Exchange, 2016). As it can be
observed from the graph, the price movement of Confidence was very much volatile before the
announcement of the news, rising from Tk. 112.3/ share to 127.8 and then again falling to 115.5
tk within just 7 days. But after the news, the price movement became a bit steady, following a
downward trend. This was mainly because of the skepticism that was existent in the investors‟
mind regarding this new source of income as it was not previously mentioned. This withholding
of information by the company was not taken lightly by the investors and as a result, the price
fell to Tk. 110 at the end.

European Journal of Business, Economics and Accountancy Vol. 5, No. 6, 2017 ISSN 2056-6018
Progressive Academic Publishing, UK Page 58 www.idpublications.org
Heidelberg Cement
Heidelberg News: Oct 27, 2016
555
551.5
550
Pri
ce
545
Sh
ar
e
544.8 545.8
540
541.9
535
530
Pre News Price
Post News Price
Heidelberg Cement announced on October 27, 2016 that Heidelberg Cement Central Europe East
Holding B.V. is acquiring 99.99% share of Meghna Energy Limited, a private company limited
engaged in generating and supplying electricity as a Small Power Plant in Bangladesh (Dhaka
Stock Exchange, 2016).Heidelberg’s share price was already in a declining trend when this news
was announced. Sometimes it takes some time to affect the price movement even after some
price sensitive event occurs, known as the „lagging effect, which is observed in this case. The
price continued its declining trend the next 3 days after the dissemination of the news, falling to
Tk. 541.9/ share. The effect of this positive news then can be observed through the sudden price
boost, increasing by around 10 tk within the next 4 days.
Lafarge Surma Cement
Lafarge News: Jul 12, 2015
130
125.9
Pri
ce
125
120
122.5
Sh
are
115 118.1
110.7
110
105
Pre News Price Post News Price

European Journal of Business, Economics and Accountancy Vol. 5, No. 6, 2017 ISSN 2056-6018
Progressive Academic Publishing, UK Page 59 www.idpublications.org
The company informed on July 12, 2015, “Lafarge S.A., one of the two sponsor groups of
Lafarge Surma Cement Ltd. (LSC), has merged with Holcim Ltd. to form Lafarge Holcim Ltd.
As a result of the above merger in the Group level, one of the Lafarge Surma’s sponsor groups is
now LafargeHolcim Ltd.” But in Bangladesh, they remained as separate entity for the time being
due to the current corporate structure (Dhaka Stock Exchange, 2016).The sudden change in price
due to this huge merger news is pretty evident from the above line chart. The price was following
a decreasing pattern before the news, falling from Tk. 118.1 to Tk. 100.7 per share during the
previous 7 trading days. But after that, a massive uplift in the movement of price is seen; within
6 days the price increased by around 15 tk with a capital gain of 13.7%. Lastly, the price fell a
little to Tk. 122.5/ share, at the end of 7 post trading days.
Meghna Cement
Meghna News: Nov 6, 2016
110
Pri
ce 105
102.9
101.2
100
Sh
are
95
93.5
90
85
Pre News Price Post News Price
On November 6 of 2016, Meghna Cement notified DSE in compliance to the BSEC regulations
that they have taken a price sensitive decision to import machineries and equipment valued at Tk.
244.79 crore to increase their annual production capacity (Dhaka Stock Exchange, 2016). The
direction of price before the news disclosure was a bit unstable. After the news disclosure, the
downward trend that is observed in price can be expressed as the effect of cost increment
because of this capacity expansion. Though capacity expansion is positive news, in an ideal
scenario this should lead the price downward as it means increased financing cost needed for this
expansion and decreased profitability for the time being. Therefore, what happened here goes
with the theoretical perspective of share price movement, which has made the share price fall by
9.1% in the next 7 trading days after the day of the announcement.
Factor Evaluation The impact of DSE news on share price has been consistent in most of the cases. Where positive
news was disbursed, the price increased and vice versa. But arguments can be made on whether
the price movement occurred when it was supposed to occur like it can be observed in case of
capacity expansion. Demonstration of both theoretical and expectation based movement of stock
price was found and it can be safely inferred that in case of established companies the price trend

European Journal of Business, Economics and Accountancy Vol. 5, No. 6, 2017 ISSN 2056-6018
Progressive Academic Publishing, UK Page 60 www.idpublications.org
was theoretical, but not for the emerging or growing companies.
Sharp Movement of Market Index (DGEN) The Dhaka Stock Exchange General Index or DGEN is a stock market index for the Stock
Exchange of Dhaka. It is mainly an index of the main market capitalizations of the listed
companies in DSE. It started on November 27, 2001 with a base-index of 817.62 points and the
shares were classified as A, B, G and N group of shares but excluded the Z group shares. So all
the calculations made by DGEN where excluding the Z group shares which ultimately led to the
obsolescence of this index. The calculations were done on the basis of price movement of
individual stocks. The faults in the DGEN index first came to notice in November, 2009 when
Grameenphone (GP) was listed on the DSE. After much controversy, on Jan 28 2013, the
regulator BSEC launched a new index, the DSEX, which was developed by the US-based
financial service organization Standard and Poor’s (Stock Market, 2013).
The Boom Banks & other financial institutions of Bangladesh had a lot of idle fund available to them due to
less business opportunities in the global recession period of 2009-10. To minimize this cost and
generate a greater return, theses financial institutions & its officials as well as the general people
took loan and invested in the capital market. This made a huge flow of liquidity in the share
market. The total number of BO (Beneficiary Owner) Account holders on 20th
December, 2010
reached to 3.21 million while the number was 1.25 million in December 2009, making it more
than double over one year (Saha, 2012). Such changes from 2009 to 2010 caused a drastic
change in the DGEN index. The index increased abnormally, breaking all the previous records.
Impact of the Boom Period on Cement Companies’ Share Price To measure the impact of the boom period, the DGEN index data were taken from 4
th July 2010
to 5th
December 2010, the time period in which the index increased significantly. Along with the
index, share price of the players of cement industry were taken of those dates. Data were plotted
in line graphs where the X axis defined the dates on a monthly interval. The Y axis on the right
hand side indicated the values of DGEN Index whereas Y axis on left hand side indicated the
actual values of share price in Taka. The red line denotes the DGEN index and the blue line
denotes the share price in this portion of analysis.

European Journal of Business, Economics and Accountancy Vol. 5, No. 6, 2017 ISSN 2056-6018
Progressive Academic Publishing, UK Page 61 www.idpublications.org
Aramit Cement
Aramit: Boom Period
100
10,000.0
0
80 8,000.00
DG
EN
In
dex
Sh
are
Pri
ce
60 6,000.00
40 4,000.00
20 2,000.00
0 -
4-Jul-10 4-Aug-10 4-Sep-10 4-Oct-10 4-Nov-10 4-Dec-10
Share Price DGEN
From the graph, it can be inferred clearly that the change in share price of Aramit cement
maintained a positive correlation with the changes in DGEN index. That means the price curve
and the index curve almost went line in line during that period. However, the increase in share
price was slightly above the rate of increase of DGEN index during the month of September
2010. But the price started to decrease in mid-October 2010, taking a stable increase in early
November 2010.
Confidence Cement
Confidence: Boom Period
300
10,000.0
0
250
8,000.00
In
dex
Pri
ce 200
6,000.00
150
Sh
are
DG
EN
100
4,000.00
50
2,000.00
0 -
4-Jul-10 4-Aug-10 4-Sep-10 4-Oct-10 4-Nov-10 4-Dec-10
Share Price DGEN

European Journal of Business, Economics and Accountancy Vol. 5, No. 6, 2017 ISSN 2056-6018
Progressive Academic Publishing, UK Page 62 www.idpublications.org
This graph also clearly indicates that the change in share price of Confidence cement maintained
a positive correlation with the changes in DGEN index. However, the increase in share price was
slightly below the rate of increase of DGEN index during the month of July 2010. But the price
started to increase in mid-October 2010, taking a stable increase in late November 2010 and
maintaining an almost equal increasing pattern in price per share along with the increase in
DGEN index
Heidelberg Cement
Heidelberg: Boom Period
450
10,000.0
0
400 9,000.00
350
8,000.00
300
7,000.00
Index
Pri
ce
250
6,000.00
5,000.00
Sh
are
DG
EN
200
4,000.00
150
3,000.00
100
2,000.00
50 1,000.00
0 -
4-Jul-10 4-Aug-10 4-Sep-10 4-Oct-10 4-Nov-10 4-Dec-10
Share Price DGEN
The graphical representation shows that the change in share price of Heidelberg cement also
went almost line in line with the change in DGEN Index. However, the increase in share price
was slightly above the rate of increase of DGEN index at the beginning of the month of October
2010. But the rate of increase in price started to decline at the beginning of November 2010. But
in the end the increasing rate of DGEN index became a bit higher than the price movement of
Heidelberg cements share.

European Journal of Business, Economics and Accountancy Vol. 5, No. 6, 2017 ISSN 2056-6018
Progressive Academic Publishing, UK Page 63 www.idpublications.org
Lafarge Surma Cement
Lafarge: Boom Period
60
10,000.0
0
50
8,000.00
Pri
ce 40
6,000.00
Index
30
Sh
are
DG
EN
20
4,000.00
10
2,000.00
0 -
4-Jul-10 4-Aug-10 4-Sep-10 4-Oct-10 4-Nov-10 4-Dec-10
Share Price DGEN
The change in share price of Lafarge cement also maintained a somewhat positive correlation
with the changes in DGEN index. That means with the increase in DGEN index, the price per
share of Confidence Cement also increased. The increasing rate in share price was almost same
with the rate of increase of DGEN index till the month of July 2010. But the price started to
increase sharply in early September 2010, but then again started to decline continuously even
with the increase in DGEN index.
Meghna Cement
Meghna: Boom Period
500
10,000.0
0
400 8,000.00
Index
Pri
ce
300 6,000.00
Sh
are
200 4,000.00
DG
E
N
100 2,000.00
0 -
4-Jul-10 4-Aug-10 4-Sep-10 4-Oct-10 4-Nov-10 4-Dec-10
Share Price DGEN
European Journal of Business, Economics and Accountancy Vol. 5, No. 6, 2017 ISSN 2056-6018
Progressive Academic Publishing, UK Page 64 www.idpublications.org
This graph also indicates that the change in share price of Meghna cement maintained a
positive trend with the changes in DGEN index during most of the period. . The increasing
rate in share price was almost same with the rate of increase of DGEN index till mid-
September 2010. But the price started to increase at the end of September 2010, and then
from late November 2010 maintained almost equal increasing rate in price per share along
with the increase in DGEN index.
Overall Evaluation
From an overall point of view, it is apparent that theoretical perspectives regarding share
market do not hold much value in real life scenario, at least in Bangladeshi stock market. All
the four factors discussed and analyzed here should have affected the stock price movement
unambiguously; yet inconsistency in various cases has been found in the evaluation.
Dividend is one of the strongest factors that should single-handedly control the share price
movement at the period it was announced. The capital gain at the period of dividend
declaration should have reflected the dividend amount; which cannot be established from the
analysis. The dividend factor also didn’t show any lagging effect, which should have been
present in an ideal scenario. Dividend effect here is completely company and investors
expectation based.
News is one of the strongest factors that affected the price direction of shares in the report.
Disclosure of news showed results from both types of perspectives; investors‟ enthusiasm
moved the price and the theoretical „lagging‟ effect was also found in the analysis.
The sharp movement of DGEN index is the only factor that showed almost line on line
movement along with the share price of then listed cement companies. During the Boom
period, all of the companies‟ share experienced price inflation and showed strong positive
correlation with the index pattern. Same scenario is evident in case of the Bust/ Crash period.
The unusual exchange rate fluctuation period also showed an impact on price, but that impact
should have shown a „lagging‟ effect. The cost of importing raw materials couldnt have
increased and affected the profitability of the companies almost instantly because of
inventories and companies‟ risk safety mechanism. But the price movement failed to show
such effect.
Therefore, overall it can be deduced that the disclosure of news and sharp movement of the
index within a short time period have the dominant impact on the share price of the listed
cement companies. The other two factors do not have that much strong relationship with
price movement; rather can easily be diminished by other volatility factors of the stock
market.
RECOMMENDATIONS
To identify the limitations of the factors discussed and the flawed characteristics of the price
sensitivity of the listed cement companies‟ shares, the overall evaluation of the analysis has
to be considered. In the cases where the factors failed to demonstrate consistency in terms of
price movement; it was due to the inefficiency and volatility of the market, where price is no
longer affected by these determinants. Some determinants are so much positive to the
investors that the theoretical perspective or even the financial performance of the companies

European Journal of Business, Economics and Accountancy Vol. 5, No. 6, 2017 ISSN 2056-6018
Progressive Academic Publishing, UK Page 65 www.idpublications.org
becomes irrelevant.
To minimize the effect of such inefficiency in terms of share price movement and the stock
market, the following recommendations are provided:
1. As DSE news is the main credible source of news for the stock market investors, the
time between the management’s taking of the decision and the news being published
in DSE‟s website should be reduced as much as possible.
2. A specific guideline regarding the accounting year change to July-June for the cement
companies should have been provided as many companies took this as an opportunity
not to publish their audited annual statement and declare their dividends.
3. Investors have to be made more aware and more educated investors should be made
involved in the capital market of Bangladesh. Without the awareness of investors and
educated investors, majority of the share transactions become prone to rumors instead
of actual news.
4. Proper monitoring system of the transactions, especially after disclosure of news and
dividend should be implemented so that the news and dividend can have the intended
affect after disclosure. Educated investors make decision based on these policies and
without ideal market reaction; they will leave which will make the market more
volatile.
5. The listed companies should be forced to publish their annual statements with proper
financial notes while making their previous years statement available for performance
analysis. Some cement companies (Aramit, Meghna) do not have proper information
available and their share price movement can easily be manipulated.
CONCLUSION
In conclusion, it can be said that the cement companies listed in Dhaka Stock Exchange
(DSE) are not that much different from the other listed companies. The factors that ideally
should affect the price of shares of other listed companies also influenced the price movement
of the cement companies in most cases. But the price movement of the shares in the cement
industry is still highly dependable on investors‟ expectations, rumors and other volatility
factors. This is why, the price of the shares of the listed cement companies went the most
coherently with the previous DGEN index as reflected the overall market condition. But in
can be said that the cement companies are doing better financially, basing on the dividend
they offer. All the listed companies are categorized in Class- A, which is also again a proof of
their success. But due to the in efficiency of the market, the price status of the listed cement
companies isn’t where it is supposed to be.
REFERENCES
Dhaka Stock Exchange. (2016, 12 29). News for: ARAMITCEM. Retrieved 1 3, 2017, from
Dhaka Stock Exchange Ltd.: http://www.dsebd.org/old_news.php
Dhaka Stock Exchange. (2016, 11 15). News for: CONFIDCEM. Retrieved 1 3, 2017, from
Dhaka Stock Exchange Ltd.: http://www.dsebd.org/old_news.php
Dhaka Stock Exchange. (2016, 10 27). News for: HEIDELBCEM. Retrieved 1 2, 2017, from
Dhaka Stock Exchange Ltd.: http://www.dsebd.org/old_news.php
Dhaka Stock Exchange. (2016, 10 27). News for: LAFSURCEML. Retrieved 1 4, 2017, from
Dhaka Stock Exchange Ltd.: http://www.dsebd.org/old_news.php
Dhaka Stock Exchange. (2016, 11 6). News for: MEGHNACEM. Retrieved 1 2, 2017, from
Dhaka Stock Exchange Ltd.: http://www.dsebd.org/old_news.php
Investopedia. (n.d.). Dividend. Retrieved January 15, 2017, from Investopedia:

European Journal of Business, Economics and Accountancy Vol. 5, No. 6, 2017 ISSN 2056-6018
Progressive Academic Publishing, UK Page 66 www.idpublications.org
http://www.investopedia.com/terms/d/dividend.asp
Saha, S. (2012). Stock market crash of Bangladesh in 2010-11: Reasons & roles of regulators.
Helsinki.
Saha, S. (2012). Stock market crash of Bangladesh in 2010-2011: Reasons and Roles of
Regulators Bangkok: Arcada.
Younus, D. S., & Islam, S. M. (n.d.). An Analysis of the Turmoil in the Stock Market: Issues
and Challenges for Monetary Policy. Dhaka: Bangladesh Bank
Rahman, M., Baten, A., Uddin, B., Zubayer, M..(2006. Fama-French’s CAPM: An empirical
investigation on DSE. Journal of Applied Sciences, 6(10), 2297 2301.
Wohar and Mark, E. 2006, “What drives stock prices? Identifying the determinants of stock
price movements”. Southern Economic Journal.
Hartono, Jogiyanto. 2004, “the Recency Effect of Accounting information,” Gadjah Mada
International Journal of Business, Vol. 6 No.1, p 85-116.
Glaser, M. and M. Weber 2007, Why Inexperienced Investors Do Not Learn: They Do Not
Know Their Past Portfolio Performance, Finance Research Letters, 4(4), 203-216
Docking, Diane S.; Koch, Paul D. 2005, “Sensitivity of Investor Reaction to MarketDirection
and Volatility: Dividend Change Announcements,” Journal ofFinancial Research, 28
(1), 21 -41.
Joseph LN, Vezos P 2006, “The sensitivity of US banks’ stocker turns to interest rate and
exchange rate changes”, Manage, Finance. 32(2): 182-1999
Dimitrios Tsoukalas 2003, “Macroeconomic Factors and Stock Prices in the Emerging
Cypriot Equity Market,” Managerial Finance, 29( 4), 87-92.
Ali ,Mohammad, Bayezid & Ahmed ,Tanbir, 2010, “Effect of Dividend on Stock Price in
Emerging Stock Market: Astudy on the Listed Private Commercial Banks in DSE” .
International journal of Economics and Finance,4,52-64
Stock market. (2013, August 1). Retrieved January 15, 2017, from risingbd.com:
http://www.risingbd.com/english/Good-bye_to_DSE_General_Index/4940
Bergen, J. V. (n.d.). Efficient market hypothesis. Retrieved January 25, 2017, from
investopedia.com: http://www.investopedia.com/articles/basics/04/022004.asp

European Journal of Business, Economics and Accountancy Vol. 5, No. 6, 2017 ISSN 2056-6018
Progressive Academic Publishing, UK Page 48 www.idpublications.org
THE EFFECT OF BOARD SIZE ON FIRM FINANCIAL
PERFORMANCE OF LISTED FIRMS IN NAIROBI SECURITY
EXCHANGE
1Adan Haji Shunu
Masters Student School of Business and Economics
Garissa University college P. o Box 1801- 70100 Garissa
Email:[email protected]
2Dr. Philip Bii
Lecturer School of Business And Economics
Garissa University College P.O Box 1801 -70100 Garissa
Email;[email protected]
3Dr Kennedy M . Ombaba
Lecturer School of Business and Economics
Garissa University College P.O Box 1801 70100 Garissa
ABSTRACT
The study sought to establish the effect of board size on the performance of listed firms in
Nairobi security exchange. It was guided by agency theory, upper enchlon theory which
captured the board’s monitoring role. The study used exploratory research design. The study
employed panel approach for a period covering ten years from 2006-2015. The target
population comprised of all 68 listed firms in Nairobi Securities Exchange. The study used
secondary data which was obtained from annual reports and NSE bulletins. Data was
analyzed using both descriptive and inferential statistics. Specifically, multiple regression
was used to test the hypothesis. The study found a significant positive effect of board size on
firm financial performance.
Keywords: Board size, financial performance, security exchange.
Introduction
Financial performance is used to measure firm's overall financial health over a given period
of time and can also be used to compare similar firms across the same industry or to compare
industries or sectors in aggregation. Rahman and Haniffa (2006) reasoned that financial
performance of a firm can be used to determine its operating performance that means that the
firm’s performance is in quantifiable metrics.
Board size is also viewed as a proxy to measure the diversity of the knowledge pool and the
availability of resources provided by the board from the perspective of resource dependence
theory. Boards in unlisted firms can potentially complement a management team’s
knowledge base (Gabrielsson and Huse, 2005; Minichilli et al., 2009). A larger board is more
likely to have a wider range of skills, knowledge, and expertise which, in turn may contribute
to both its monitoring and service roles (Corbetta and Salvato, 2004). Moreover a large board
may counter the weight of a CEO (Maere et al., 2014).
According to agency theory, the main argument in favor of a larger board of directors is that
the increase in the number of members raises their disciplinary control over the CEO
European Journal of Business, Economics and Accountancy Vol. 5, No. 6, 2017 ISSN 2056-6018
Progressive Academic Publishing, UK Page 49 www.idpublications.org
(Brédart, 2014). Jensen (1993) confirmed that the smaller board size is more correlated with
the quality of monitoring. Lipton and Lorsch (1992) also stated that the board might become
less effective in monitoring management when its size increases. They recommended that
board membership should be between eight and nine persons, and any additional benefits that
can be gained from the increased monitoring by additional membership will offset the costs
linked with slow decision making.
Empirical evidence on the effect of board size on firm performance provided mixed results.
While, Ahmadu et al. (2005), Chan and Li (2008), De Andres et al. (2005) and Mustafa
(2006) found that larger boards are associated with poorer performance, Beiner et al. (2004),
Bhagat and Black (2002) and Limpaphayom & Connelly (2006) found no significant
association between board size and firm performance.
The board of directors is one of the central institutions to ensure firms act in the interest of
their stakeholders and mitigate the agency problem between management and shareholders
(Fama and Jensen, 1983). Therefore, the board plays a significant role in ensuring that the
firms’ financial performance is sound. Therefore, this study will seek to find out the effect of
board size on firm financial performance in the listed firms in Nairobi Security Exchange
(NSE).
METHODOLOGY
This study used exploratory research design. The emphasis of exploratory studies is to study
a situation or problem in order to establish whether causal relationships exist between
variables. This design is suited to this study as it used secondary data on all variables and
relationships between variables was interrogated without making any attempt to influence the
variables.
Panel data was used in this study. Panel data entails studying of a particular subject within
multiple sites, periodically observed over a defined time frame (Gujrati, 2003). In this study
balanced panel data was used in which each cross section unit has same number of
observations.
The target population comprised of all firms listed in Nairobi Securities Exchange (NSE) in
Kenya. The total number of listed firms in Nairobi securities exchange at the end of 2015 is
68 (NSE handbook, 2015). The target population consists of 68 companies for the period
2006- 2015. However, listed firms to be included in the study are those that were trading on
the NSE during the period, and therefore firms that were listed after 2006 and those were
delisted or deregistered during the period of study was excluded from this study.
The panel data was collected from the yearly financial reports of the companies. The annual
reports from the NSE and CMA, and downloads of other journals from the company websites
was also used.
Secondary data was used in this study which was derived from secondary sources including
journals, Nairobi Securities Market reports, Capital Market Authority reports, the specific
company annual reports and their websites.

European Journal of Business, Economics and Accountancy Vol. 5, No. 6, 2017 ISSN 2056-6018
Progressive Academic Publishing, UK Page 50 www.idpublications.org
Data Analysis
The research employed both descriptive statistics and inferential statistics. Descriptive
statistics provided simple summaries about the sample and the observations were made. This
often involves summarizing the central nature of variables, it also comprised the spread or
range of scores, as well as the average difference each score is from the mean. Descriptive
statistics include measures of skewness, and kurtosis to indicate how asymmetric or lopsided,
and how peaked or heavy-tailed, respectively is a distribution of scores. Thus, descriptive
statistics summarize basic characteristics of a distribution such as central tendency and
standard deviations.
Inferential statistics was concerned with making predictions or inferences about the
population from observations and analyses of a sample. It allows generalization beyond the
sample data to a larger population. To address the issue of generalization, Chi-square was
used to tell the probability that the results of the analysis on the sample were a representation
of the population that the sample represented.
RESULTS AND DISCUSSIONS
The sample comprised of firms listed in Nairobi Securities Exchange. Secondary data was
collected for a period of ten years from 2006 to 2015. Twenty-five firms were removed from
the analysis as a result of incomplete data. The final sample comprised of 43 firms making a
total of 430 observations.
Descriptive Statistics
The means and standard deviations of the variables in the study are presented in the table
below.
Mean Std. Deviation N
ROA 1.106250 0.361890 430
Profitability Profitability 0.614836 430
Financial Leverage 0.409281 0.198333 430
Board Size 8.765625 2.314884 2.314884
Inferential Statistics
Research findings showed that board size had correlation coefficients of estimate which was
on β1= -0.005 (p-value = 0.0084) which is less than α = 0.05) implying that we reject the idea
stating that there is no significant effect between board size and firm performance.
CONCLUSION AND RECOMMENDATION
The findings seem to suggest that greater emphasis need to be taken by firms to have larger
board size which is argued and found in this study to have a positive implication on firm
performance. Future research could also explore on board characteristics and firm
performance by using different research method.

European Journal of Business, Economics and Accountancy Vol. 5, No. 6, 2017 ISSN 2056-6018
Progressive Academic Publishing, UK Page 51 www.idpublications.org
REFERENCES
Harris, M. & Raviv, A. (2008).A Theory of Board Control and Size. The Review of Financial
Studies, 21(4), 1797-1832.
Hermalin, B.E., Weisbach, M.S., (2003). Boards of directors as an endogenously determined
institution: A survey of the economic literature. FRBNY Economic Policy
Review 9, 7–26.
Jonas De Maere, Ann Jorissen, & Lorraine M. Uhlaner; (2014) Board Capital and the
Downward Spiral: Antecedents of Bankruptcy in a Sample of Unlisted
Firms.Corporate Governance: An International Review,
Johnson, S. G., Schnatterly, K., & Hill, A. D. (2013). Board composition beyond
independence: Social capital, human capital, and demographics. Journal of
Management, 39: 232–262.
Jonsson, E. I., 2005. The Role Model of the Board: A Preliminary Study of the Roles of
Icelandic Boards, Corporate Governance: An International Review, 13 (5),
710-717.
Kosmas Kosmidis & Antonios Stavropoulos (2014).Corporate failure diagnosis in SMEs; A
longitudinal analysis based on alternative prediction models. International
Journal of Accounting and Information Management. 22 No. 1,

European Journal of Business, Economics and Accountancy Vol. 5, No. 6, 2017 ISSN 2056-6018
Progressive Academic Publishing, UK Page 71 www.idpublications.org
THE CONTRIBUTION OF GEOGRAPHICAL INDICATIONS IN
SUSTAINABLE RURAL DEVELOPMENT (EVIDENCE FROM
NORTHERN ALBANIA)
Roland BARDHI1*
& Ilir KAPAJ2
1Mountain Areas Development Agency (MADA), Tirana, ALBANIA
2Department of Agribusiness, Faculty of Economy&Agribusiness, Agricultural University of Tirana, Tirana
ALBANIA
ABSTRACT
Geographical indications (GIs) are a form of protective labeling used to indicate the origin of
food and agricultural products. The role of protected geographical indicators as a promising
sustainable rural development tool is the basis for this paper. The protection of geographical
indications is a new practice and much research is still required for both sides of the debate.
The focus of this debate is: Can a Geographical Indication (GI) which indicates that a certain
product originates from a certain region with a given quality being attributable to its place of
origin, become a tool to promote socio-economic livelihoods of rural communities? The
research method employed for this study is a qualitative research approach. Two potential GI
products are used to investigate the benefits brought to rural areas through the protection of
GIs. The case studies include the GIs Chestnut and chestnut honey in two geographical
Albanian areas, Tropoja and Reç of M. Madhe areas. Twenty-five in-depth interviews were
conducted in 2016 for this study. The study identifies predominantly indirect links between
GIs and sustainable rural development (SRD), through economic and social benefits brought
to rural areas by the GIs investigated. This finding suggests that GIs are worthwhile for
implementation in Albania as a rural development tool. The initiative for development of GI
products was undertaken by BiodivBalkan Project, implemented in the North Albania, aiming
to link biodiversity with development of quality signs (GIs) in order to support rural
development and poverty reduction in the poorest areas of Albania.
Keywords: Geographical Indications, Agrobiodiversity, Rural development, BiodivBalkan
Project.
INTRODUCTION
This paper is intended to present the contribution given by development of geographical
indications of some unique products, originating from specific geographical areas in
sustainable rural development of these areas.
A geographical indication (GI) is a form of protection highlighted in the Trade Related
Aspects of Intellectual Property Rights (TRIPS) Agreement of the World Trade Organization
(WTO). It protects intangible economic assets such as the quality and reputation of a product
through market differentiation (Vandecandelaere, E., F. Arfini, G. Belletti and A. Marescotti
(eds.) (2010).
It is considered a promising tool at the international level to maintain multi functionality in
rural landscapes and involve local populations in biodiversity management and conservation.
Using the examples of creating GI for “Chestnuts” and “Chestnut Honey”, we discuss how a

European Journal of Business, Economics and Accountancy Vol. 5, No. 6, 2017 ISSN 2056-6018
Progressive Academic Publishing, UK Page 72 www.idpublications.org
GI can be successfully used by local producers and what conditions are needed for it to have
a positive impact on the rural development and its associated biodiversity.
GIs, in a general sense, are signs placed on products that have a clearly established origin and
poses qualities and reputation derived from its place of origin. GI provides a relevant tool to
protect and promote or enhance biodiversity (Larson Guerra, 2004). It is important therefore
not to only consider the biological characteristics of a geographical area, but also the local
knowledge and practices involved (Bérard and Marchenay, 2006) in order to achieve
biodiversity benefits.
It is generally agreed that GIs promote sustainable rural development because they:
• Help producers obtain premium prices for their products whilst guaranteeing safety
and quality to consumers;
• Improve redistribution of the added value to the actors (producers, processors etc)
throughout the production chain;
• Bring added value to the region of origin;
• Increase production, create local jobs and prevent rural exodus;
• Preserve landscapes, traditional knowledge and biodiversity;
Giovannucci et al., (2009) emphasizes that even with originality of a potential GI product, the
benefits will not accrue to the actors without the support of the legal and institutional
frameworks. Other factors that support GIs registration of products include; collective action,
prices and market for the product, specificity and reputation of product, support from other
actors along the value chain, production methods and link of a product characteristics to
history or tradition of the geographical area (Bramley and Biénabe, 2013).
There is much reference in economic and agrofood literature to the contribution of
geographical indications to rural development. This reference is predominantly theoretical,
signifying that there is a need for more empirical evidence demonstrating that geographical
indications promote rural development. Furthermore, there are many forms of geographical
indications each possibly impacting rural development differently (Barham, 2003). There is
far less literature specifically concentrating on the influence of GIs on sustainable rural
development than there is on origin labeled products in general. However from the many
researches done it is generally believed (Babcock & Clemens, 2004; Barham, 2002;
O’Connor and company, 2005; Rangnekar, 2004) that GIs do promote sustainable rural
development.
GIs serve also as a marketing tool that can add economic value to agricultural products by
conveying a cultural identity using the region of origin, acknowledging the value of specific
human skills and natural resources in the production process, and creating a unique identity
for the products (Babcock and Clemens, 2004).
GIs as promoters of rural development
Studies have shown that when the name of a product obtains a protection as a geographical
indication, there is a positive socio-economic impact on local communities. This is because
GIs:
increase production, create local jobs and prevent rural exodus;
help producers to obtain a premium price for their products in exchange for
guarantees offered to consumers on production methods and quality;
allow for a better redistribution of the added value in the production chain;

European Journal of Business, Economics and Accountancy Vol. 5, No. 6, 2017 ISSN 2056-6018
Progressive Academic Publishing, UK Page 73 www.idpublications.org
bring value to the land of origin;
have other indirect positive effects, such as on tourism (O’Connor and Company,
2005).
Chestnut and chestnut honeys in northern area of Albania are two potential GI products.
Chestnut. The chestnut (Castanea sativa Miller.) production in northern Albania (Tropoja and
Reçi regions) is one of the most important economic activities, providing good incomes for
the local population, which is considered as the poorest areas in Albanian. On the other hand
many stories aspects are related with this specie and could be considered as a logo for both
Reçi and Tropoja regions. There are a lot of traditional foods prepared by the chestnuts.
The forest stands are managed traditionally by the local population for timber production,
fruit production, shelter and recreate properties (MADA). Chestnut stands are an important
component of the Balkan Alps, which together with Spruce forests (Piceaexcelsa (Lam)
Link.), Beech forests (Fagussylvatica L.), Oaks and Hornbeam forests (traditionally managed
mostly assilvo-pastoral systems), Mediterranean evergreen shrubs (dominated by
Pomegranate-Punicagranatum L.) as well as alpine grass and dwarf vegetation, where
Blueberry (Vacciniummyrtyllus L.) takes place, but not only; represent a beautiful diversified
landscape, much preferred for the tourists and high potential for the economic development
and poverty eradication.
Biological points of view, all the chestnut stands are natural or naturally regenerated, which
locally isolated, represent, we think, a specific genetic patrimony.
Chestnut honey is one of the most a favorite honey varieties. It is not just unique flavor, not
very sweet and with an almost bitter aftertaste, that stimulates the taste bud that makes it so
special. Chestnut honey is also one of the healthiest honeys. It is rich in, mineral salts and
tannin, with a high proportion of fructose that resists crystallization and a relatively low
acidity, dark in color, ranging from yellowish brown to almost black. Of all the varieties of
honey, he has the most pronounced antimicrobial, antibacterial and antiseptic properties, and
therefore applies not only inside but also outside in the treatment of wounds, ulcers and sore
throat (MARDWA, 2012).
Due to this characteristics chestnut honey is much requested and its price is higher than most
of the other honey varieties. The chestnut honey produced in both regions (Tropoja and Reçi)
is well known. Perceptions on chestnut and chestnut honey reputation and quality by the
producers and consumers of these products have identified as potential for GI registration in
Albania, which have been attributed to the geographical area where the products are produced
and the initiatives by the stakeholders.
The honey has a unique taste and a white color which is attributed to specific floral plants
where bees obtain their nectar (Blakeney et al., 2012). Apart from increasing monetary value
and employment creation, this honey has promoted forest and biodiversity conservation
through a number of programs that include reforesting degraded areas (Bainkong, 2014) for
sustainable production.
MATERIALS AND METHODS
The study was conducted in northern area of Albania aiming to assess how production of the
potential GI chestnut and chestnut honey can contribute to rural development of these areas
(MADA, 2012).

European Journal of Business, Economics and Accountancy Vol. 5, No. 6, 2017 ISSN 2056-6018
Progressive Academic Publishing, UK Page 74 www.idpublications.org
In the framework of BiodivBalkan Project–Sustainable Rural Development, a comprehensive
inventory of the various local traditional products suitable for GIs development scheme has
been drawn up in 2013, through focused interviews with expert, farmers and other
stakeholders related to the traditional products. Based on this inventory, a typology of
stakeholders was prepared, comprising production practices and unique and typical
characteristics associated to the local production. This typology has been used in gathering
quantitative and qualitative data through structured interviews. Two questionnaires were
designed and prepared.
A questionnaire was prepared with different sections aiming at identifying the characteristics
of chestnut farms and production, chestnuts distribution and sale, technology used for
production; problems faced by chestnut and chestnuts honey producing farms. The areas
included in the study are Tropoja region and Malesia e Madhe region (Reç County). Face to
face interview with representatives of two chestnut and chestnut honey producers association
was conducted.
These areas have already seen the development of two GIs products (chestnut and chestnut
honey), which are official registered at Patents and Marks Office in Albania in 2016 and their
brand names are in use by their associations established in each areas.
The other questionnaire was used to assess the changes and implications of geographical
indications in rural development of respective areas (MADA, 2016). Twenty-five interviews
were conducted in both areas in late 2016, 11 stakeholders for each case study and a further 3
large retailers who were questioned about both products. The interviews for both case studies
were chosen from almost the same list of stakeholders directly involved in producing and/or
marketing of products.
The research method employed for this study was a qualitative research approach. The
interviews were conducted to the primary producers, collectors, processors and enterprises.
Than a comparison analysis of data between two periods, the inventory and data collected in
2013 and the data and results from interviews of 2016 was done.
The study identifies also predominantly indirect links between GIs and sustainable rural
development (SRD), through economic and social benefits brought to rural areas by the GIs.
This finding suggests that GIs are worthwhile for implementation in Albania as a rural
development tool. In this paper are described main results on the chestnut and chestnut honey
products, after their development as GIs product and their implications on economic, social
and environment aspects.
RESULTS AND DISCUSSION
Results from both questionnaires indicate that the GIs products (chestnut and chestnut honey)
are considered as very important contributors to the yearly income of farming family. In
general, all families interviewed admitted they are in better economic conditions after their
chestnut and chesnut honey production was launched in market with a brand new name and
with quality signs (GI indications).
The table below gives some information about the surface, number of trees, number of
beehives and total production for both products, in two regions in two periods.

European Journal of Business, Economics and Accountancy Vol. 5, No. 6, 2017 ISSN 2056-6018
Progressive Academic Publishing, UK Page 75 www.idpublications.org
Table 1: General situation of Chestnut and honey in Tropoja and Reçi
No Description of products Unit
2013 2016
Reçi
Area
Tropoja
Area
Reçi
Area
Tropoja
Area
Chestnut
1 Total surface ha 600 2000-
2400
600 2000-2400
2 Total number of trees no 33
000
188600 33 000 188600
3 Total chestnut production tons 350 1500 500 1680
Chestnut Honey
1 Number of Beekeepers no 125 400 130 420
2 Number of Beehives no 2500 6550 2650 7100
3 Total of Chestnut honey produced tons 24 60 27 70
Changes on productivity
Compared with the productivity of 2013 the productivity of chestnut and chestnut honey is
increased. The total chestnut production in Reçi area was increased by 150 tons, while in
Tropoja area by 180 tons. The increase in production was due to more people were involved
in harvesting of chestnuts.
The same increase was noticed in the productivity of chestnut honey. The quantity of
chestnut honey produced in Tropoja area in 2016 was 10 tons higher than in 2013, while in
Reçi was 3 tons higher 2016 compared with 2013.
Taking in account the total of chestnut production of two regions, the majority of farmers (52
%) produce less than 5 tons, about 22 % of farmers produce 5-8 tons, 16 % produce about 10
tons and 10 % of farmers produce more than 10 tons.
Chart1. Structure of Chestnut production by farms
Prices
The chestnut prices have been increasing every year despite the production increase. Actually
the price of fresh chestnut in both areas is almost the same. It varies from 100 ALL/kg to 130
ALL/kg and depends on the season. Compared to the 2013, the price of chestnut was
increased by 20-30 ALL/kg.
52% 22%
16% 10%
Chestnut Production
% of farms
Less than 5 tons
5 to 8 tons
till 10 tons
more than 10 tons

European Journal of Business, Economics and Accountancy Vol. 5, No. 6, 2017 ISSN 2056-6018
Progressive Academic Publishing, UK Page 76 www.idpublications.org
The superior quality chestnut was sold in Reçi with 280 ALL/kg. From the data gathered, the
price of Tropoja and Reçi chestnut is 20% higher than the chestnut coming from other
regions of Albania, although the origin of the product sold in the market is not always clear.
Regarding chestnut honey, due to its higher antiseptic and antioxidant properties, it is
considered as a natural medicament. These characteristics increase the price of chestnut
honey which actually is almost 30% higher than the price of mixed flower honey. Actually
the price of 1 kg of chestnut honey is 1500-2000 ALL, which is triple higher compared to
2013. There is a high demand in the internal and international market for chestnut honey,
which is promising for high prices even in the situation of a possible increase of the
production. Since the price of the chestnut honey is very much related to its chemical and
organo-leptical characteristics, an improvement in logo and labeling, where these
characteristics are easily noticed by customers, has contributed in increasing the prices.
Marketing channels
In 2013 the chestnut commercialization was not everywhere well organized. In most
prominent chestnut production areas in Albania (Reç and Tropoja areas) there were collectors
and wholesale traders that deal exclusively and continuously with fresh chestnuts, while in
other areas commercialization was performed sporadically by traders that deal mainly with
other agricultural products.
Based on the data of 2013, the most important chestnut collector and trader entity in Tropoja
was “AMLA Company”. In 2013 “AMLA” has collected, processed and traded almost 500-
600 tons of chestnut which was almost 45% of the total amount traded in the Tropoja area.
The other chestnut percentage (65 %) was sold direct by producers to local shops or
consumers.
Based on the data of 2016 the structure of marketing has changes. A high quantity of chestnut
was exported in Kosovo. The price was decided through negotiations between the farmers
and traders. The price of the chestnut was around 100-120 ALL/ kg. Since there is no
selecting process, the price is unique for whole production quantity. It changes only
according to the season. At the beginning of the harvestin period it is higher and it falls to
100 ALL/kg in November-December.
During the last year, 50% of chestnut produced in Tropoja has been exported to Kosovo. Due
to the short distance many farmers invented themselves as traders and started to export
chestnuts. These traders sell the collected product also in the local market, mainly in Tirana
and Shkodra. Based on the assessment made by the Project, small traders collected last year
almost 1500 tons, half of it was sold in Kosovo and half in the internal market.
The main chestnut trader’s entity is the Cooperative “Reçi Prodhimtar”. They sold last year
more than 500 tons of chestnut. Almost 90% of the product was exported. The largest
quantity is exported in Italy, where the cooperative has established good business linkages.
Smaller volumes of the product are sold to Kosovo traders. The main Albanian market is the
area between Tirana and Durrës, but part of the product is sold also in Shkodra and other
Albanian important cities.

European Journal of Business, Economics and Accountancy Vol. 5, No. 6, 2017 ISSN 2056-6018
Progressive Academic Publishing, UK Page 77 www.idpublications.org
Chart 2. Main distribution channels -Tropoja region Chart3. Distribution channels
-Reçi region
Compared to some other fruits and agriculture products, producers of chestnut do not have
problems with the chestnut sale. Since there is no selecting process and standardization of the
product, the price is unique for whole production quantity. It changes only according to the
season.
The marketing of chestnut honey in general and in particular in Tropoja and Reçi village is
moderately organized. Each beekeeper sells its own honey to occasional buyers or different
mediators. No defined marketing channels exist or are used for honey. Since the chestnut
honey product has a logo and label the price increased and no market problems were faced.
In fact the demand for this product is high. For this reason the producers have not yet face
any difficulties in marketing it.
Incomes
Most of the chestnut and chestnut honey producers confirmed that their incomes by both
products have been increased during 3 last years. Based on their responses their incomes have
been increase by about 30-35 %.
They admitted that the biggest incremental income share is dedicated to the increase in
chestnut production, considering two reasons, productivity and prices increase.
CONCLUSIONS
Literature indicates many positive effects of GIs on sustainable rural development, very
simply these can be categorized into ecological, economic and social effects. The two
products investigated do not have profound direct links to all of these elements, however
many indirect links were found. The Geographical Indications evaluated were least strongly
tied to ecological benefits, with stronger ties to economic and social values.
The rural development of the Northern Albania can be improved through the creation of
value added marketing channels for typical products, and GIs are a possible means towards
that and where products have particularities and a preferential position in markets.
Both products have: (i) better price in the market compared with similar production produced
in the other areas of the country; (ii) their specifities and characteristics have strong links
with their geographical area (territory); (iii) there is a high demand for these products in the
domestic and regional markets; (v) these products have a strong link with biodiversity.
50%
20%
20%
10%
Distribution channels
Exported
Wholesale markets
Direct to consumers
Supermarkets
90%
4% 6%
Distribution channels
Exported Direct to consumers Supermarkets
European Journal of Business, Economics and Accountancy Vol. 5, No. 6, 2017 ISSN 2056-6018
Progressive Academic Publishing, UK Page 78 www.idpublications.org
In both areas the local stakeholders (farmers, processors and traders) have a satisfactory level
of organization, which should be strengthened. “Reçi Prodhimtar” and “AMLA Company”
are two structures that can keep around them most of the farmers engaged in this sector. On
the other hand there is willingness for collaboration between the local actors.
There is enough evidence to show that the GIs investigated in this study are linked to more
than just economic benefits and are therefore trending toward Sustainable Rural
Development; however these links alone are not strong enough to say that GIs promote
sustainable rural development. A promising finding of the study was that although many of
the links between the GIs investigated and Sustainable Rural Development were indirect all
stakeholders agreed that GIs promote Sustainable Rural Development.
Protection of GIs could help to sustain economic activities and settlement in rural areas and
increase the life standards of the residents. Rural population is the prime beneficiaries of
these kinds of products in terms of income and employment generation. Moreover, under an
effective protection and marketing process, the economic activities in rural areas could
increase further not only by the growth of GI production but also by developments in the
other sector as well. While it is hard to obtain a competitive advantage based on technology
in rural areas and that advertisement costs are high for the local producers, GIs provide
important alternative advantages for the rural development by sending direct signal to the
consumer that the product is originated from a specific region with a certain quality not
requiring big investments on technology and advertisement.
Acknowledgements
This study was prepared under the BiodivBalkan Project – sustainable rural development of
Balkan Mountain areas.
The idea was to produce an inventory of the products arising from the biodiversity of the
Northern Albanian Mountains and study the commodity chains for these products. The
chestnut and chestnut honey products were pre-selected as two potential products, whose
characteristics and their quality is so linked with their territory. An additional objective was
to have the analysis of changes and improvements after the development of two GIs products,
focusing on their economic, social and ecological effects.
REFERENCES
Babcock, B. (2003): Geographical Indications, Property Rights, and Value-Added
Agriculture. (IAR 9:4:1-3).
Babcock, B. and Clements, R. (2004): Geographical indications and property rights:
protecting value-added agricultural products, MATRIC Briefing Paper 04-MBP 7.
Barham, E. (2002): Towards a Theory of Value-Based Labeling. Agriculture and Human
Values. 19(4): 349-360.
Barham, E. (2003): Translating Terroir: The Global Challenge of French AOC Labeling.
Journal of Rural Studies. 19: 127-138.
Bérard, L., Marchenay, P., (2006). Local products and geographical indications: taking
account of local knowledge and biodiversity. Int. Soc. Sci. J. 187, 109–116, 58.
Bramley, C. and E. Biénabe. (2013). Guidelines for Selecting Successful GI Products. p. 123-
136.
Giovannucci, D., Josling, T., Kerr, W., O’Connor, B. and Yeung, M.T. (2009). Guide to

European Journal of Business, Economics and Accountancy Vol. 5, No. 6, 2017 ISSN 2056-6018
Progressive Academic Publishing, UK Page 79 www.idpublications.org
geographical Indications. Linking products and their origins. International Trade
Centre. Geneva.
Larson Guerra, J. (2004). Geographical indications and biodiversity: bridges joining distant
territories. Bridges 8(2), 17–18.
Ministry of Agriculture Rural Development and Water Administration (MARDWA).
Agriculture statistics for the year 2012.
(http://www.bujqesia.gov.al/files/pages_files/14-02-25-01-33-
30Statistikat_e_Vitit_2012.pdf).
Mountain Areas Development Agency (MADA): National Study on Actual Situation and
perspective of nut trees (walnut, chestnut, hazelnut, almond) and pomegranate
development in Albania (2012), p.38-39.
Mountain Areas Development Agency (MADA): Impact Assessment of geographical
Indications on Rural Developmentin Northern Albania ( chestnut, honey, blueberries)
(2016), p.22-27.
O’Connor and Company (2005): Geographical Indications and the challenges for ACP
countries, A discussion paper, Agritrade, April 2005.
Rangnekar, D. (2004): The Socio-Economics of Geographical Indications, UNCTADICTSD
Project on IPRs and Sustainable Development, Issue Paper No. 8.
Vandecandelaere, E., F. Arfini, G. Belletti and A. Marescotti (eds.) (2010). Linking people,
places and products: A guide for promoting quality linked to geographical origin and
sustainable geographical indications. 2nd ed. FAO and SINER-GI, Rome.

European Journal of Business, Economics and Accountancy Vol. 5, No. 6, 2017 ISSN 2056-6018
Progressive Academic Publishing, UK Page 80 www.idpublications.org
RELATIONSHIP MARKETING STRATEGIES AND COMPETITIVE
ADVANTAGE IN SELECTED COMMERCIAL BANKS IN UASIN-
GISHU COUNTY
Andrew W. Wetosi
Student, Kisii University, KENYA
Dr. Kimutai Geoffrey
Coordinator of School of Business and Economics, Kisii University, Eldoret Campus
P.O Box 408-40200, Eldoret, KENYA
&
Dr. Yusuf Kibet
School of Business and Economics, Moi University P.O Box 74-30100, Eldoret, KENYA
ABSTRACT
After decades of vigorous expansion and prosperity, many firms lost sight of competitive
advantage in their scramble for growth and pursuit of diversification. Firms throughout the
world have faced slower growth as well as global competitors are no longer expanding their
customer relationships. Relationship marketing is heralded by some marketing academics and
practitioners as the new paradigm of marketing. However, despite the intense growth in the
adoption of Relationship marketing practices by organizations all over the world and the
widely accepted conceptual underpinnings of Relationship marketing strategy, conflicting
opinions and increased pessimism about the effectiveness of relationship marketing strategy
abound the marketing literature. Also studies done in literature did not focus on relationship
marketing especially in developing countries like Kenya. To this effect, scholars have called
for more rigorous studies to establish the usefulness of Relationship marketing as a strategic
orientation. The general objective of this study was to determine the effects of relationship on
competitive advantage in selected commercial banks in Uasin-Gishu County, Kenya. The
specific objectives of the study included, to find out the effect of customer focus on
competitive advantage among selected commercial banks in Uasin-Gishu County, to
determine the extent to which customer communication affect competitive advantage among
selected commercial banks in Uasin-Gishu County, to establish whether customer events
affect competitive advantage among selected commercial banks in Uasin-Gishu County and
to assess whether customer rewards affect competitive advantage among selected commercial
banks in Uasin-Gishu County. The study adopted descriptive survey research design and
targeted162sales and 104 marketing employees. The study employed convenience sampling
technique to help sample the subjects to participate in the study. Data was collected using a
questionnaire and was analyzed using both descriptive and inferential statistics. Data was
presented in tables and figures. It emerged from the study that customer focus played a role in
marketing of the banks products, all scores were above average on the statements which
supported the competitive advantage of the organization. On the influence of customers
communication on Competitive advantage, the study pointed out that it was to a very large
extent influencing the banks to gain their competitive advantage. It was also established that
the bank staff greatly influence this by frequently communicating to its customers hence
gaining a competitive base with other banks. In conclusion, the relationship marketing
strategies under the study have indeed proved to influence the competitive advantage of
organizations and specifically in banks. Customer Focus has been highlighted in a very great
extent to influence the customers towards having a good relationship and positive attitudes
towards the banks. It is also noted that the banks try their best to be honest to its customers

European Journal of Business, Economics and Accountancy Vol. 5, No. 6, 2017 ISSN 2056-6018
Progressive Academic Publishing, UK Page 81 www.idpublications.org
and therefore winning their behaviors and be influenced to purchase their products. This
increases the loyalty of customers to the bank and hence achieving their competitive
advantage. The study recommended that for those organizations which immensely depend on
competitive environments to maintain its stand, they should focus on relational strategies
which are customer centered in order to achieve their goals.
Keywords: Marketing Strategies, Customer Focus, and Competitive Advantage.
INTRODUCTION
Relationship marketing has become a vital issue that has led to important interest to both
academic and practitioners for more than two decades, (Frow& Payne, 2009). Relationship
marketing describes a marketing strategy which stems from direct response marketing
campaigns. It emphasizes on customer retention and satisfaction rather than concentrating on
sales volumes. Firms that practice relationship marketing acknowledge the long term value of
their customers (Frow& Payne, 2009). Christopher at al., (2002) asserted that the term
“relationship marketing” stems from the industrial and services marketing literature of the
1980s. According to Matute-Vallejo, Bravo, & Pina, (2010), services success of firms is
attached on their capability to uphold long-term interactions with customers that enables a
repeat of purchases and communicate positive involvements with the service provider to
others (Matute-Vallejo, Bravo, &Pina, 2010). The same way Ndubisi (2007) thinks that
constructing relationships with customers enables a company to acquire quality bases of
intelligence marketing which assists in good planning marketing strategy.
Relationship marketing has in so many years expanded to the banking sector (Gummesson,
2008). Comparisons have been drawn by Anderson (2005) and Gaurav (2008) said growing
competitions and operating costs on one side, and relationship marketing on the other. In this
view, the escalating operational costs and the ever stiffening competitive environment have
obliged business firms which include financial institutions to grow and maintain long-term
relationships with their customers. Kolter and Armstrong (2006) asserts that all the ways of
relationship marketing reinforce the rationale for commercial banks to use it as a way of
maintaining two-way relationships with customers and other stakeholders. Sin et al (2005)
outlined the paradigm shift that has been elicited by relationship marketing by demonstrating
the case of a cross-cultural study in Hong Kong, China. Sin et al. (2006) further showed six
components of relationship marketing orientation which included trust, communication,
shared values bonding; it also included reciprocity and empathy. The inferences of trust to
productivity, market share, development, and customer maintenance require banks to employ
it in their push to gain a strategic competitive advantage (Yudi, 2012).
In the global perspective, the issue of relationship marketing has much been studied. Brand,
culture, commitment, service, satisfaction, trust, loyalty, value, strategy, customer
relationship management, and marketing theory amongst others have been previously
discussed (Lages et al., 2009; Yudi, 2012). It is true that that the theme of relationship
marketing has been empirically studied in the USA and the UK. Continentally, Europe leads
the pack of researchers in relationship marketing at thirty four per cent between 2007 and
2011, Asia being the second at twenty nine per cent, America ( twenty five per cent), and
lastly Africa and Oceania at 6 per cent (Yudi, 2012).
According to William Desbordes (2011), service delivery system emphasizes that it is the
people that bring change. Even with the same product features service from one person to

European Journal of Business, Economics and Accountancy Vol. 5, No. 6, 2017 ISSN 2056-6018
Progressive Academic Publishing, UK Page 82 www.idpublications.org
another can change. There is therefore the need for an integrated service marketing method
that provides an even service as well as generating the problem will be in the area of
relationship marketing.
In today world of banking, financial institutions are undergoing through stiff competition
both from within the banking sector and outside. The strong competition has brought about
little or no distinction among the products being given due to product imitation hence no
bank can assert a substantive competitive edge over another. Service quality is therefore very
important to generate and sustain commendable relationships with customers and also to
retain abreast with their varying needs and behaviour. Many commercial banks have adopted
relationship marketing so that they remain competitive. The aim of this study is to establish
the effects of relationship marketing on the commercial banks’ competitive advantage in
Uasin-Gishu County, Kenya.
RESEARCH DESIGN AND METHODOLOGY
Research Design
The study used descriptive survey design because it is descriptive in nature (Mugenda and
Mugenda, 2003). The rationale for choosing this design was based on its ability to provide
the researcher with appropriate techniques for systematic collection of extensive data from a
large group of respondents through interviews and administration of questionnaires (Orodho,
2009).
Target Population
A target population is defined as a complete set of individuals, cases or objects with some
common observable characteristics (Mugenda & Mugenda, 2003). The study was conducted
in all banks in Uasin-Gishu County, targeting sales and marketing and team leaders. The
aforementioned team leaders and sales marketers are presumed to be the savviest with issues
touching on relationship marketing and customer retention in their respective banks. The total
target population was 600 sales team and 300 marketing team.
Banks in Uasin-Gishu County which make the target of this study are Barclays bank Ltd,
CFC Stanbic bank ltd, Prime Bank, Chase Bank, Diamond Trust bank Kenya ltd, Housing
finance, Kenya Commercial Bank ltd, National bank of Kenya ltd, NIC bank ltd, standard
chartered bank ltd, Equity bank ltd and cooperative bank ltd (Table 1).
Table 1: Target Population
Bank Sales team Bank marketing team
Kenya Commercial Bank 28 6
National bank 11 7
Equity bank 60 26
Cooperative bank 36 12
Standard chartered Bank 22 13
Barclays bank 26 17
NIC bank 6 10
Diamond Trust Bank 27 6
Prime bank 4 17
CFC Stanbic bank 22 11
Chase Bank 20 12
House Finance 12 5
Total population 274 142

European Journal of Business, Economics and Accountancy Vol. 5, No. 6, 2017 ISSN 2056-6018
Progressive Academic Publishing, UK Page 83 www.idpublications.org
Sample Size and Sampling Procedures
According to Mugenda and Mugenda (2003), in a larger population where time and resources
allow, a big sample should be taken. This enables findings to be a true representative of the
whole population. The small samples do not reproduce salient characteristics of the
accessible population to an acceptable degree. Calculating the sample size the study
employed Yamane’s formula.
(Yamane, 1967).
Where, n - Sample size, N – Population size, e- the level of precision.
Therefore the assumed sample size for Sales team is calculated as;
= 162 sales team
The assumed sample size for marketing team was
== 104 participants from the marketing team
The total sample size for the study was therefore be 266 participants
The study employed convenience sampling technique to help sample the subjects to
participate in the study. This was adopted because of its convenient accessibility and
proximity of the study subjects to the researcher. As such the researcher recruited the
participants’ until saturation or until the sample selected was reached.
Research Instruments
The study employed a structured questionnaire to collect primary data from the respondents.
Mugenda and Mugenda (2009) asserted that questionnaires are suitable in collecting data in
survey studies. The questionnaire was structured in such a way that it captured the
respondents‟ demographic information, but more importantly facilitated collection of data
pertinent to both independent and dependent variables. The instrument’s sections aimed to
capture data regarding the study variables which comprised of the various questions on a 5-
point Likert scale.
Data Analysis Techniques
According to Mugenda and Mugenda (2003) data editing classification and tabulation are the
processes of bringing out order, structure and meaning of mass information collected.
Statistical Package of Social Sciences (SPSS) version 22 was used to aid the analysis. It
adopted both descriptive and inferential statistics. Descriptive statistics involved frequencies,
percentages, means and standard deviations while inferential statistics will included chi-
square tests (p=>0.05) and the use multiple regression model to determine significant
relationships between variables where the p- value was used to determine whether observed
sample frequencies differ significantly from expected frequencies specified.
Multiple regression analysis was also be used to test hypothesis. In its simplest form multiple
regression analysis involved finding the best straight-line relationship to explain how the
variation in an outcome (or dependent) variable, Y, depends on the variation in a predictor (or
independent or explanatory) variable, X. Once the relationship is estimated, it is possible to
use the equation:
Y = b0 + b1X1 + b2X2 + b3X 3 + b3X 3 +e
Where:
X = The independent variables -
X1 – customer focus
X2 _ customer communications
X 3 – customer events
X 4- customer rewards

European Journal of Business, Economics and Accountancy Vol. 5, No. 6, 2017 ISSN 2056-6018
Progressive Academic Publishing, UK Page 84 www.idpublications.org
Y = The dependent variable (competitive advantage)
b = Independent Variable Coefficients e = Error margin
RESULTS AND DISCUSSIONS
The study involved descriptive and inferential statistics
Relationship between Customer events and competitive advantage
The objective was to establish whether customer events are associated with competitive
advantage among selected commercial banks. Descriptive statistics were analyzed and chi-
square tests were done to establish the relationships between the variables. The findings are
presented in figure 1 and table 2 below;
Figure 1: Customer events and competitive advantage
The findings in figure 1 indicated that majority 79.8% of the respondents to a very great
extent agreed that the customers of the company is quite knowledgeable about their
products/services, 12.4% agreed to this to a great extent, 2.6% agreed on this to a moderate
extent, 2.10% agreed to a little extent while 3% were in disagreement on this.
Additionally, on the statement that they do frequent roadshows in different destinations to
encourage customers invest in their banks, majority 80.3% of the respondents agreed on this
to a very great extent, 9.9% agreed on this to a great extent, 6.4% agreed on a moderate
extent, 1.3% agreed on a little extent, while 2.1% disagreed on this.
The customers of the company
is quite knowledgeable about their
products/Services
We do frequent
roadshows in different
destinations to encourage
customers invest in our
banks
We have several visits to companies to market our products and
services
The bank staffs are
prepared to be asked
questions of what is not being done
right
There are information desks in our banks which
enable customers
communicate well with our
team
We have weekly and
monthly exhibitions to sensitize our
customers
No Extent 3% 2.10% 1.30% 0.90% 1.70% 1.30%
Little extent 2.10% 1.30% 1.30% 1.30% 2.60% 0%
Moderate extent 2.60% 6.40% 0.00% 2.10% 2.60% 6.40%
Great Extent 12.40% 9.90% 26.60% 12.40% 12.90% 10.70%
Very Great Extent 79.80% 80.30% 70.80% 83.30% 80.30% 81.50%
12.40% 9.90%
26.60%
12.40% 12.90% 10.70%
79.80% 80.30%
70.80%
83.30% 80.30% 81.50%
0%
10%
20%
30%
40%
50%
60%
70%
80%
90%
Customer events and Competitive advantage

European Journal of Business, Economics and Accountancy Vol. 5, No. 6, 2017 ISSN 2056-6018
Progressive Academic Publishing, UK Page 85 www.idpublications.org
Similarly, 70.8% of the respondents agreed in a very great extent that they have several visits
to companies to market their products and services, 26.6% agreed in a great extent, 1.3%
agreed on this on a little extent and another 1.3% disagreed on this statement.
Further findings on that the bank staffs are prepared to be asked questions of what is not
being done right, showed that 83.3% believed this to a very great extent, 12.4% agreed on
this to a great extent, 2.1% agreed to a moderate extent, 1.3% agreed to a little extent, and
0.9% disagreed on this.
The findings also indicated that majority 80.3% of the respondents agreed to a very great
extent that there is information desks in their banks which enable customers communicate
well with their team, 12.9% agreed in a great extent, 2.6% moderately agreed on this, another
2.6% agreed this in a little extent and 1.7% of the respondents disagreed on this.
Finally, the results showed that majority 81.5% of the respondents agreed to this to a very
great extent, 10.7% to a great extent, 6.4% moderately agreed on this and 1.3% disagreed on
this.
These findings agree with those of Bolton (2008), the author studied, how the role of
satisfaction effect through organizations events on the duration of customer’s relationship in
the organization. His results revealed that the level of satisfaction evolves with time so
customers who have been longer time in a company, give value on the earlier experiences
with the company. They weigh the prior service quality more heavily and places less weight
on the new information. This means that they won’t defect so easily as the first conflict
arises. The findings indicated that organizations should give more attention to new customers
through organizational events, whom have no good experiences yet, because they are more
likely to defect if a conflict arises (Page, Pitt and Berthon 2006).
The Chi-square test at p ≤ 0.05 significance level illustrating statistically significant
relationship between variables are presented in Table 4.7 below;
Table 2: Chi-Square tests for customer events and competitive advantage
Chi-Square Tests
Value df Asymp. Sig. (2-
sided)
Pearson Chi-Square 1165.270a 108 .000
Likelihood Ratio 444.963 108 .000
Linear-by-Linear Association 195.316 1 .000
N of Valid Cases 233
a. 124 cells (95.4%) have expected count less than 5. The minimum expected count is .00.
From the results in Table 2, the P-value for the Pearson Chi-Square test for relationship
between customer events and competitive advantage is 0.000 at 5% level of significance,
showing a significant relationship between customer events and competitive advantage. The
strength of association was measured using Phi and Cramer’s V as indicated below;

European Journal of Business, Economics and Accountancy Vol. 5, No. 6, 2017 ISSN 2056-6018
Progressive Academic Publishing, UK Page 86 www.idpublications.org
Table 3: Symmetric Measures customer events and competitive advantage
Symmetric Measures
Value Approx. Sig.
Nominal by Nominal Phi 2.236 .000
Cramer's V .745 .000
N of Valid Cases 233
a. Not assuming the null hypothesis.
b. Using the asymptotic standard error assuming the null hypothesis.
From the table it is seen that the strength of association between the variables is very strong
of value 2.236 and 0.745.
The regression results in indicated that customers events does have a direct effect on the
competitive advantage of the organization with a beta coefficient of 0.707 and significance of
(p=0.000). The study rejected the hypothesis. These results indicate customer really gives an
organization a basis to enhance its competitive advantage. This could be attributed to the fact
that customer events benefits to the company such as creating a bond between them, creating
awareness of new products and enlightening them to invest in their banks.
SUMMARY AND CONCLUSIONS
On the relationship between customer events and competitive advantage, the findings also
indicated that to a great extent customer events are being utilized to gain their
competitiveness, customer information desks have been highlighted to enable customers
communicate well with the bank team members hence gaining its competitiveness. Chi-
square tests also indicated a significant relationship between customer events and competitive
advantage with the strength of association being very strong.
Customer events were not an exception in influencing the banks competitive advantage of the
banks, from the findings it was evident that through the customer events, they are able to
know about the existing products and services. Through the frequent road shows in different
destinations, awareness of existing and new products in the banks are made clear and
therefore the competitive advantage of the banks are enhanced.
REFERENCES
Anderson, E.W., and Gaurav, D.R. (2008), “Customer Satisfaction, Market and advertising
effectiveness”, Journal of Advertising Research, Vol. 44 No. 3, pp. 271-80.
Christopher L. and Lauren W (2002).Principles of service marketing and
management.Journal of Business Ethics, 71, 425-439.
Frow, S. and Payne, T. (2009), The Great Marketing Turnaround, Prentice-Hall, Englewood
Cliffs, NJ.
Gummesson, E. (2008), “Broadening and Specifying Relationship Marketing”. Asia
Australia. Marketing Journal, 2 (1), pp. 10-30
Kolter and Armstrong (2006).1mpact of ATM on Customer Satisfaction (A Comparative
Study of SBI, ICICI & HDFC bank). Business Intelligence Journal - August, 2(2),
276-87.
Matute-Vallejo G., Bravo R.D., and Pina N., (2010). Exploring customer switching
intentions through relationship marketing paradigm.International Journal of Bank
Marketing Vol. 30 No. 4, pp. 280-302, Emerald Group Publishing Limited.

European Journal of Business, Economics and Accountancy Vol. 5, No. 6, 2017 ISSN 2056-6018
Progressive Academic Publishing, UK Page 87 www.idpublications.org
Ndubisi, N. O. (2007). Factorial and Discriminant analysis of the underpinnings of
relationship marketing and customer satisfaction. International Journal of Bank
Marketing, vol. 23, No. 7, pp. 542-557.
Sin, A., & Jones, E. (2005). Customer relationship management: Finding value drivers.
Industrial marketing management, 37, 120–130.
Yudi, C. H. (2012) Services marketing, (3rd ed). Englewood Cliffs, N.J.: Prentice Hall.

European Journal of Business, Economics and Accountancy Vol. 5, No. 6, 2017 ISSN 2056-6018
Progressive Academic Publishing, UK Page 88 www.idpublications.org
ROLES OF COMMERCIAL BANKS IN THE GROWTH OF SMALL
AND MEDIUM ENTERPRISES - CASE OF ALBANIA
Arjona Spahiu
Agricultural University of Tirana
ALBANIA
Ana Kapaj
Agricultural University of Tirana
ALBANIA
ABSTRACT
SMEs play an essential role to the overall performance of an economy giving their
contribution in economic growth, employment, innovation and technology diffusion. In the
other hand commercial banks plays play an important role in the country's economic
development through promoting firms' development by influencing positively the mitigation
of information-related issues between the investor and the borrower by ensuring a more
efficient use of depositor funds and securing their own funds. The aim of this study is to give
a short view of the banking activity in Albania giving more focus on their role in SME
growth. A combination of quantifiable and qualitative research methods is carried out to test
the hypothesis of the study in order to have a complete and accurate result. Specifically, the
study uses surveys of SMEs (questioner’s field by the representatives of SMEs), interviews
with Bank’s managers and documentary analysis of Bank’s activity in Albania. The SMEs
chosen to fulfill the questionnaires are located in two cities of Albanian, respectively in
Tirana and Durres city. This study will be a reference for other studies focused in the role of
financial institutions role in SMEs growth in Albania and the examination of relationship
between financial institutions and SMEs growth.
Keywords: Role, Commercial Banks, SMEs growth, Albania.
INTRODUCTION
The bank plays the role of financial intermediaries in collecting savings and allocating them
to higher return investments. They provide financial assistance in meeting the different needs
of enterprises.
The bank's objective is the collection of free public funds in the form of deposits in order to
use them for granting loans. On the other hand, through different actions such as keeping
accounts, approving advances and loans, making transfers etc., gives the possibility to banks
to recognize the performance of various firms and businesses and to control and impacted on
them. Banks promote firms' development by positively influencing in the mitigation of
information problems between the investor and the borrower by ensuring a more efficient use
of the depositor’s funds (Allen and Gale 2008).
The importance of this study first relates to a better understanding of the role and functions of
banking financial institutions in Albania and enhances the ability to understand how banks
influence in the development of SMEs.
LITERATURE REVIEW
Commercial Bank’s Functions
The commercial bank is a financial institution that provides financial services, particularly
loans, deposits and payment services, and performs the most extensive financial services for

European Journal of Business, Economics and Accountancy Vol. 5, No. 6, 2017 ISSN 2056-6018
Progressive Academic Publishing, UK Page 89 www.idpublications.org
business companies. While in the concept of regulators of banking activity, the bank is an
institution whose current activity is lending and acceptance of deposits by the public (Salko
and Dhuci 2008).
Through the banking system of a country is realized (Zaho and Cani 2008):
1. Acceptance of cash deposits by individuals, companies, other legal entities, by the
government.
2. Mobilization of deposits on loans and increase of their value.
3. Mediation of payments as well as the execution of all payments and receipts arising and
deriving from transactions carried out for a certain period of time.
In summary, the functions of commercial banks can be considered:
Lending function
The liquidity function of payments
Risk management of interest rates and liquidity
Monitoring the firm's activity
The service function
Main Developments in the Albanian Banking System Over Years
Before year 1990, Albania had a one level banking system and fully centralized. It consisted
of the State Bank (the monetary authority and lending authority of the economy), the General
Directorate of Savings and Security Shares (serving as a public savings depositor and asset
provider) and the Agricultural Bank (provider of agricultural fund.)
After the fall of the communist system in the early 1990s, Albania entered into transitory
period, which was accompanied by a series of social and economic changes. Most of the
cooperatives and state-owned firms were privatized immediately by creating small family
businesses focused mainly on the commodity market. In 1992, the Law "On the Bank of
Albania" and "On the banking system in the Republic of Albania" was approved. This
change enabled the transition to the two tier system of the financial structure (the first level-
Bank of Albania, and the concentration of trading functions at the second level, which at the
moment of creation was composed by 3 Banks: Savings Bank, National Commercial Bank
and Agrarian Commercial Bank). By the end of 1996 five other banks were licensed.
After the pyramid crisis in 1997, which affected both the economic and social side of our
country, the financial system entered in another phase of its development. In addition to the
increased number of banks, the banking system has been associated with the privatization of
the National Commercial Bank, the Savings Bank, and other restructuring.
By the end of 2015 the number of commercial banks reached 16, operating through 500
branches / agencies (as showed in figure no. 1) located within the territory of the country,
while only one bank continues to have a branch outside the territory of the Republic of
Albania.

European Journal of Business, Economics and Accountancy Vol. 5, No. 6, 2017 ISSN 2056-6018
Progressive Academic Publishing, UK Page 90 www.idpublications.org
Figure 1. The number of branches/ agencies of banks over the years
Source : Bank of Albania
Banking Lending Activity in Albania
Over the years, lending to the system has had a greater orientation towards business but over
the past 3 years this tendency has been moderated, and the relationship between the two
groups - business and individuals - has a steady tendency.
The composition of the loan portfolio according to the entity and the respective currency
shows that about 60.2% of the loans granted to the business are in foreign currency , with the
largest share at 83.6% denominated in EUR, while in USD dollars it is about 16.4 % of the
foreign currency portfolio.
The table below shows the credit data by sector and purpose of use for the period 2013-2015.
By sectors, businesses provided the main contribution to the performance of credit over the 3
periods where Business Overdraft has the largest share of the total loan portfolio
Table 1. Lending by sector and purpose of use (value in billions ALL)
Description Dec’13 Weight Dec’14 Weight Dec’15 Weight
Total Loans 537.4 100% 549.1 100% 534.9 100%
Loans to Businesses: 394.7 73.40% 404.5 73.70% 388.8 72.70%
Overdraft 125.3 23.30% 126.7 23.10% 123.2 23.00%
Working capital 73.2 13.60% 75 13.70% 71.1 13.30%
Investments in equipment purchase 97.3 18.10% 94 17.10% 95 17.80%
Investments in real estate 99 18.40% 108.8 19.80% 99.5 18.60%
Loans to Individuals: 142.7 26.60% 144.6 26.30% 146.1 27.30%
Overdraft 8.2 1.50% 8.2 1.50% 8.4 1.60%
Consumption of non-durable goods 16.4 3.10% 17.3 3.10% 18.7 3.50%
Consumption of durable goods 9 1.70% 10.4 1.90% 11.7 2.20%
For real estate 102.9 19.20% 102.8 18.70% 101.7 19.00%
To operate the activity 6.1 1.10% 5.9 1.10% 5.6 1.10%
Source: Bank of Albania

European Journal of Business, Economics and Accountancy Vol. 5, No. 6, 2017 ISSN 2056-6018
Progressive Academic Publishing, UK Page 91 www.idpublications.org
For the period 2012-2015, long-term loans represent the main share in the total loan portfolio,
followed by short-term loans and finally medium-term loans (presented in the table no. 2)
Table 2. Credit outstanding by maturity term (in %)
Credit
maturity
December
2012
December
2013
Decemb
er 2014
Decemb
er 2015
Short-
term 33.2 34.0 33.7
33.9
Medium-
term 20.0 17.9 17.9
18.3
Long-
term 46.8 48.1 48.4
47.8
Source: Bank of Albania
METHODOLOGY
The study aims to highlight the role of Banks in SME’s development in Albania. To achieve
this general objective the below hypothesis is developed.
Hypothesis: “The growth of SME’s sales is affected by loans issued by Commercial Banks in
Albania”.
The necessary information for testing the hypothesis is based on the analysis of primary data
which are collected through questionnaires delivered to SME’s representatives. The
questionnaire developed in this research is conceived in two parts: The first part of the
questionnaire provides general information on SMEs activity and the second part provides
information on the role of banks in SME development.
The list of SMEs selected to fill out the questionnaires is provided mainly by banks selected
in this study which have financed SMEs with loans. The number of SMEs those
representatives have filled out the questionnaire is 55 and they are located in two cities of
Albania, in Tirana and Durres.
In order to assess the relationship between SME growth (sales growth) and financial
resources offered by banks, is used the linear regression model as depicted below:
Dependent Variable: Annual Sales of SMEs [Sl]
Independent variables: Lending [Le]
SLi=ß0 + ß1* (LEi)+ Ɛ
Where:
SL: The annual sales of businesses (SMEs) expressed in LEK currency, measured as
the average of the years included in the study. Sales are analyzed for years after bank loan is
received
LE: Loans issued by commercial banks denominated in LEK currency for the
respective firm from 2010 up to 2015.
ß0: the intercept of equation
ß1: the coefficient; the respective influence of any marginal change of the independent
variable in SMEs’s sale growth

European Journal of Business, Economics and Accountancy Vol. 5, No. 6, 2017 ISSN 2056-6018
Progressive Academic Publishing, UK Page 92 www.idpublications.org
i-firms taken in the analysis where i = 1,2,3, ...... 55
Ɛ: the error term
RESULTS
The results of the regression model used in this study are depicted in the tables below:
Table 1. Regression statistics
Regression Statistics
Multiple R 0.750372
R Square 0.563058
Adjusted R Square 0.554813
Standard Error 0.6777
Observations 55
Table 2. ANOVA
df SS MS F Significance F
Regression 1 31.36742 31.36742 68.29744 4.24E-11
Residual 53 24.34167 0.459277
Total 54 55.70909
Table 3. Regression coefficents
Factors Coefficients Standard Error t Stat P-value
Intercept 0.435417 0.218179 1.995685 0.051119
Lending 0.947917 0.114701 8.264226 4.24E-11
DISCUSSION
As can be noted in the tables above, the generated model results consistent and
important: F = 68.29744, p-value = 4.24E-11
The explanatory variable (lending) results to be significant (p-value = 4.24E-11). P-
value has resulted <5% which implies that there is at least 95% chance that the loan will
affect the growth of SME’s sale.
75% of the variation (R2 = 0.750372) of the dependent variable (increase of sale) is
explained by the explanatory variable (lending).
The relation between the two variables is positive (The coefficient showing the
relation between the two variables has resulted positive => ß1=0.947917)
CONCLUSIONS
The regression model used in this study showed a positive relationship between lending by
commercial banks lending by commercial banks, firms age, firm size, internationalization,
initial capital and growth of SME sales and SMEs sales, indicating that lending growth
affects the growth of SME sales.

European Journal of Business, Economics and Accountancy Vol. 5, No. 6, 2017 ISSN 2056-6018
Progressive Academic Publishing, UK Page 93 www.idpublications.org
Except of financial products, commercial banks in Albania ameliorate SMEs performance
and their daily activity through providing a variety of products and services such as deposit,
internet banking, domestic & foreign payment etc.
The result of the questioners with the SME’s representatives revealed that for 85% of SMEs
financial products provided by banks has influenced the development and growth of their
activity.
REFERENCES
Bank of Albania (2009), “Financial Development and Economic Growth: The Case of
Albania”
L .Zaho , Sh. Cani (2008) ,“Teknikë Bankare”
Drini Salco, Orfea Dhuci (2008) “Drejtim Bankar”
Bank of Albania (2015), “Annual Supervision Report”
Bank of Albania (2015), “Financial Stability Report”

European Journal of Business, Economics and Accountancy Vol. 5, No. 6, 2017 ISSN 2056-6018
Progressive Academic Publishing, UK Page 94 www.idpublications.org
POWER OUTAGES ON PERFORMANCE OF SELECTED
MANUFACTURING FIRMS ON THE GHANA STOCK EXCHANGE
Quarshie Dorcas1, Benjamin Agyeman
2, James Bonn
3
Ghana Revenue Authority1, Presbyterian University College, Ghana
2, Presbyterian University College, Ghana
3
P.O. Box 59, Abetifi-Kwahu, Tel: +2330245335091 Email: [email protected]
ABSTRACT
This paper aimed at Power Outages on Performance of Selected Manufacturing Firms on the
Ghana Stock Exchange. The paper measured the effect of power outage on the performance
of manufacturing firms in Ghana. The population used was all manufacturing companies on
the Ghana Stock Exchange for the period 2007-2013. The data was analysed quantitatively,
using descriptive statistics, T statistics, averages and standard deviations to make
conclusions. It was discovered that ROE (Return on Equity) in power outage and no-power
outage years, this difference is not significant and that power outage does not affect ROE of
manufacturing firms. Power outage has effect on asset management ratio or asset turnover
ratio of manufacturing firms. ROA (Return on Asset ratio) of manufacturing firms is higher
in no-power outage periods than power outage periods. The paper concluded that power
outages in the short run, do not explain much of the gap in productivity, and that
manufacturing firms in the long run may be affected by power outages.
Keywords: Performance, power, manufacturing companies, Ghana.
1. INTRODUCTION
Power is an essential commodity because every sphere of life is affected by it. Emerging
economies especially need constant availability of power since it is fundamental for national
development. Most of the operations carried out for example in Ghana depends on power.
Power is needed by the mining sector, service providers (sector) and the manufacturing
industry in order to carry out their operations. Industries, families, civil society, individuals
and the state as a whole will be affected as a result of unavailability of electricity (Adjei-
Mantey, 2013). A short or long-term loss of electric power to an area can be termed as power
outages (also called power failure, power cut or power blackout). There are many causes of
power failure in an electricity network, fault at power stations, damage of electric
transmission lines, substations or other parts of distribution system and overloading of
electric mains are some examples of such causes. Sites where public safety and the
environment are at risk are particularly critical to power outages. Manufacturing is being put
to the sword over the last seven (7) years due to the lack of conscious effort. Contribution of
the manufacturing industry in 2006 to Ghana’s GDP (Gross Domestic Product) was 10.2%, it
reduced in 2010 to 6.8% and reduced in 2011 to 6.7%. This reduction in GDP can be
attributed to unreliable power supply (www.ghanaweb.com).
Many firms are often not aware of the true costs and impact that outages have on their
operations because they are mostly not prepared for business disruption caused by power
blackouts (Bruch & Hunter, www.agcs.allianz.com). Energy (electricity) supply in Ghana has
not been reliable despite its importance to many industries and the household. Power usually
goes off often without prior notification from the Electricity Company of Ghana (ECG) to its
customers. The most affected industry by this frequent power outages is the manufacturing

European Journal of Business, Economics and Accountancy Vol. 5, No. 6, 2017 ISSN 2056-6018
Progressive Academic Publishing, UK Page 95 www.idpublications.org
industry. The manufacturing industry because of the persistent erratic power supply in the
fourth quarter of 2014 suffered a dipping growth of unprecedented negative 8% eroding
confidence in the business society. AGI’s (Association of Ghana Industries) president,
warned in a communiqué that Ghana risks losing its industrial base if government policies do
not quickly address the challenge of power outages in order to revive the sector because the
manufacturing sector continues to shrink (Laary, 2015). Hence this study looks at the effect
of power outages on performance of selected manufacturing firms on the Ghana Stock
Exchange. Most research on effect of power outages was conducted on medium and SMEs
like Asamoah & Doe (2014), Amponsah & Barimah (2012) and Cissokho1 & Seck (2013)
and many researchers estimated cost of power outage to firms by using data on backup
generators. This paper will fill the gap by providing adequate results by analyzing the effects
of electricity outages on performance of manufacturing sector in Ghana by quantifying the
magnitude of the problem. This is important because while policymakers and government are
well aware that shortages are a problem, quantifying the losses from this, empirically is less
established in the context of developing country like Ghana.
2. LITERATURE REVIEW
2.1 Measurement of Performance
There are two broad approaches (methods) used to measure performance, the accounting
approach, which makes use of financial ratios and econometric techniques. Accounting
methods which are traditionally based on the use of financial ratios have been employed for
assessing firm’s performance. Advances in management sciences have led to the
development of other methods such as non-parametric (DEA) and parametric Stochastic
Frontier Approach (SFA) (Berger & Humphrey, 1997). The idea of measuring performance
is to draw a line between firms that are performing well from those which are doing poorly
(Delen, Kuzey, & Uyar, 2013).
2.2 Analysis of Performance in Accounting
There are three techniques use in analyzing firm’s performance with respect to accounting,
which are horizontal, vertical and ratio analyses. Data for the financial statement analysis can
be found in organization’s statement of comprehensive income, statement of financial
position, and cash flow statement. These data are easily accessible through the investor
relation sections of all firms listed on the stock exchange (Schönbohm, 2013).
2.3 Energy use in Ghana
The main sources of power in Ghana consist of electricity, fossil fuels and biomass; locally,
energy production is mainly obtained from biomass sources, hydroelectric dams, thermal
electric plants and Sun (solar energy). In order to meet the country‘s power demand,
electricity, fossil fuels and crude oil are imported to support the primary indigenous power
production. This energy is supplied to the various non-economic and economic sectors of
Ghana, which is made up of the Industrial, Residential, Agricultural and Fisheries,
Commercial & Services, and Transport Sector. In 2004, it was estimated that solar accounted
for 0.1%, electricity accounted for 6%, fossil fuels accounted for 27% and biomass accounted
for 66.9% of total energy supply in Ghana; corresponding to a net total of 7.1 million TOE
(Tonnes of Oil Equivalent) (Energy Commission Ghana, 2006). For the past years Ghana has
been experiencing frequent power outage. 1n the 2013 World Bank Enterprise Survey on
African countries, including Ghana and Nigeria, it named the on-going rampant poor
electricity supply as one of the biggest barriers, hindering the growth of the countries'
economy, and preventing or discouraging many multinational investors. Unreliable power
supply has been the main potential contributor to the large productivity gap between

European Journal of Business, Economics and Accountancy Vol. 5, No. 6, 2017 ISSN 2056-6018
Progressive Academic Publishing, UK Page 96 www.idpublications.org
developed and developing countries. Insufficient and unsustainable power supply is a major
problem in Ghana today (Boasiako, 2014).
2.4 The Manufacturing Sector
The manufacturing industry, though not strong as it should be, continues to play a respectable
role in Ghana’s economy, contributing about 9% (0.09) to GDP (Gross Domestic Product).
Ghana’s most important manufacturing industries include aluminum smelting, agro-food
processing, oil refining and cement. Other sectors include the manufacturing of
pharmaceuticals, chemicals, paints, beverages, glass, plastics, textiles, and apparel, and the
processing of wood and metals goods. The manufacturing sector provides employment for an
estimated workforce of over 250,000 citizens. About 25,000 companies are registered. More
than 80% (0.80) of firms registered are small size enterprises with less than 50 workers, while
it is estimated that 55% (0.55) of all enterprises are located within the Greater Accra/Tema
Region. The manufacturing industry recorded a growth of 5% (0.05) in 2009 compared to 4%
(0.04) in 2008, which means there was an increment of 1% (0.01). Nevertheless, the
contribution of Ghana’s manufacturing sector to overall growth is still marginal. The
Ministry of Trade and Industry is the primary Government agency with the overall mandate
of formulating, developing, implementing, monitoring and evaluating trade and industry
policies in the country. The Ministry is also the advocates for the private sector within
government and is the major agency responsible for monitoring the implementation the
Government’s private sector development activities and programs (www.natcomreport.com).
The manufacturing sector primarily produces and provides services not only to the local
Ghanaian economy but also to the West Africa sub-region at large; and some semi-processed
products are exported internationally to raise capital (Apeaning, 2012). The reduction in
growth or efficiency of the manufacturing industry in Ghana can be attributed to the poor
electricity supply in the country. The manufacturing firms such as Accra and Kumasi
Breweries, Guinness Ghana Ltd, Ghacem Ltd, and many other companies which require 24
hour power supply, in recent times have been experiencing more than 12 hours and
sometimes 24hrs power failures intermittently in a week for the past 3 years (Boasiako,
2015).
Manufacturing firms because according to AEA statistics, the industrial sector is the largest
consumer of electricity in Ghana, and also electricity represents the largest form of energy
used in the industrial sector. Based on this one can conclude that the manufacturing industry
will be mostly affected by power outages.
2.5 Empirical Review
Analysis of the relationship between the energy sector and economic development though
scanty started since the middle of the 19th
century. The 1970s energy crisis however fueled
the interest of the relationship between the energy sector and economic development which
increased the study of energy costs as a whole (Jiang, Chen & Zhou, 2011). Energy or power
in the 21st century is still very important for economic activities, in that the energy resource
of a country determines the economic growth of that country (Velasquez & Pichler, 2010).
Electricity and business has a symbolic relationship (Velasquez & Pichler, 2010). The reason
being that, it is used for different purposes ranging from production, storage, powering of
equipment and display of product. The use of electricity consequently serves as input for
production and a critical resource needed to make products. Electricity is therefore an
essential commodity for all industries, including the manufacturing, service and distribution.
Enormous amount of electricity is used by many sectors like manufacturing and transport for

European Journal of Business, Economics and Accountancy Vol. 5, No. 6, 2017 ISSN 2056-6018
Progressive Academic Publishing, UK Page 97 www.idpublications.org
operation processes including storage and production. Electricity as a transformed unity in
this respect serves as a commodity (Haanes et al, 2011). Ohio, Connecticut, Michigan,
Vermont, Massachusetts, and New York all in the United States in August 14, 2003
experienced blackout that caused an estimated loss of $6.4 billion (Anderson & Geckil,
2003). Bental & Ravid (1982) researched on a simple method for evaluating the marginal
cost of unsupplied electricity and assumed the cost of power outage to organizations using
data on backup generators. It was the first study to indicate the cost of power outages to
organizations. It was also estimated that decision makers act rationally and hedge by
investing in backup generating plants in order to ensure themselves against part or total
damages that can result from power outage or electricity failure. It was also assumed in their
study that corporations are competitively risk neutral, and will equate at the margin, (the
expected cost of self-generation of a kWh to the expected benefit from that kWh). Marginal
cost of unsupplied electricity for Israel and the US was measured. The study incorporated risk
aversion phenomenon in computing cost of power outages and also differentiates between
absolute, unmitigated costs, and mitigated cost of power outages. Findings from the research
paper indicated that the cost of power outage varies proportionally with reliability (low power
outage time). US’s (United State) reliability is higher than that of Israel where reliability is
lower but power outage cost tends to be higher in the US. Beenstock (1991) stated that there
should be a refinement of the methodology proposed by Bental & Ravid (1982). Bental &
Ravid (1982) said customers would be prepared to invest in backup as service becomes less
reliable but would face a discontinuity (stop operating) at a point when risks associated with
additional loss of service appear to be unimportant.
Tambunan (2009) investigated on SME in Asian developing countries and found that power
among the many obstacles to development of SMEs was mentioned by 62% of the 180
respondents used for the studies as being the prime obstacle to the development of SMEs.
Deficiency accounted to 21%, sales limitation was 36%, deficiency was 21% and high
production capacity accounted for 25% in the same studies. Burlando (2010) wrote on the
impact of electricity on work and health: evidenced from a blackout in Zanzibar. Researcher
established that, the large reduction in household income among those employed in
organizations that required electricity for their operation was as a result of a month-long
power outage in Zanzibar a town in Tanzania. Production hours or work hours had to be
reduced for workers relying on electricity in order to perform their task by an average of 8%
per day during blackout period.
Amponsah & Braimah (2012) investigated the causes and effects of the frequent and
unannounced blackouts on the operations of MSI in Kumasi. A sample of 320 MSI from
three industrial clusters within Kumasi Metropolis were interviewed, seven institutions and
two groups of apprentices. The research showed that MSI require constant supplies of power
for their activities and that power plays a major role in MSI’s operations in Kumasi. The
study for example, identified that cold stores need 168 hours, grinding mills need 70 hours,
wood processing firms require 60 hours and printing presses require about 46.2 hours, of
constant supply of power per week, sachet water producing firms need 37.2 hours,
straightening and welding firms required 36 hours, spraying firms need 33, and dressmaking
firms require 32.4 hours constant supply of power per every week for their operations.
Meanwhile electricity supply in the country (Ghana) has lagged behind demand (less supply
than demand). Researchers also recorded a 5.3% reduction in the quantity of power
consumed by the MSI as against what they required for uninterrupted activities. Lack of
alternative source of power during blackout hours rendered about 44% of workers of the MSI
redundant (idle). They proposed that the ever-increasing consuming population is as a result

European Journal of Business, Economics and Accountancy Vol. 5, No. 6, 2017 ISSN 2056-6018
Progressive Academic Publishing, UK Page 98 www.idpublications.org
of supply deficit, which can be confirmed in an analysis by GridCo of the total installed
power capacity and that total power demand shown a supply deficit of about 9GWh.
Researchers argued that adequate and reliable power supply in Ghana is hold by the supply-
side. Writers are of the view that the government should invest in power subsector in order to
supply and generate the amount of power needed to address the interruptions in electricity
(power). This recommendation was made because researchers believe that one of the key
factors of ensuring sustained decrease in poverty in middle income economies like Ghana is
reliable electricity (power). Other recommendations made were Ghana’s wind resources
(which is confirmed by the coastline and the Ghana-Togo border with favorable wind
velocities of between 6-7 m/s) should be harnesses to supplement capacity of power; landfill
potential can be harnesses to augment electricity generation in Ghana; Ghanaians should
exploit the potential sources of electricity towards the diversification of the country’s power
generation mix; the daily waste of 1200 tonnes generated in Kumasi Metropolitan assembly
is a potential for generating between 30 and 52 MW of electricity to support national
electricity generation capacity; potential of mini and small hydro power sites which are
dispersed over 70 sites in Ghana (and capable of generating about 25 MW) could be explored
to support Ghana power supply; and the two million tons of wood residues present in the
country should also be harnesses for electricity generation. Asamoah, & Doe (2014)
researched on the Effect of Power Fluctuations on the Profitability and Competitiveness of
SMEs within the Accra Business, conclusions drawn from the studies was SMEs suffer from
often power fluctuations (those not announced and those announced) particularly those in
Accra. ROA (Return on Asset) and ROI (Return on Investment) are adversely affected as a
result of the power fluctuations, leading to profit loss. Storage, production and service
delivery are the main areas affected by power fluctuations. Increased cost in outsourced
repair services, increased cancelled orders due to delays, and expenditure on alternatives
sources of electricity are some examples of cost incurred by corporations due to power
failure. Asamoah & Doe are of the same view with Wang (2002) and other several scholars
that profitability of SMEs is severely affected by the frequent and intermitted power outages.
Allcott, Collard-Wexler, & O’Connell (2015) investigated on How Do Electricity Shortages
Affect Industry? Evidence from India, by pinpointing lack of reliable electricity supply in
India as a stark example of how poor infrastructure can affect economic development. The
study assumed effects of shortages on manufacturing using archival data on shortages,
instrumenting for shortages with supply shifts from newly constructed power plants and
hydro availability. The studies listed four major findings. Firstly Shortages affect productivity
much less than they affect sales because plants also decrease inputs in response to shortages,
this is because to researchers at least in the short run power failure alone do not account much
for the productivity gap between companies in developing versus developed states examined
by Chang-Tai & Klenow (2009), Banerjee & Duflo (2005) and Hall & Jones (1999).
Secondly there are substantial economies of scale in generator costs shortages, shortages
severely has effect on small plants because power shortages strongly affects plants without
generators (backups). Thirdly it was found that sales was decreased by 5.6% to 8.6% for the
average plant in the short run because they assumed that shortages are substantial drag on
Indian manufacturing average plant producer surplus which reduced by 9.5% of which 3.9%
is contributed to the capital cost of generator backups. Fourthly or lastly though some
potential solutions to India’s power outages problem may be politically infeasible, policies
can help.
3. Methodology
The population used was all twelve (12) manufacturing companies on the Ghana Stock
Exchange for the period 2007-2013. The data was analysed quantitatively, using descriptive

European Journal of Business, Economics and Accountancy Vol. 5, No. 6, 2017 ISSN 2056-6018
Progressive Academic Publishing, UK Page 99 www.idpublications.org
statistics, T statistics, averages and standard deviations to make conclusions. A sample of ten
(10) manufacturing firms representing 83.33% of the population was used. Selected
organizations were Benso Oil Planation, PZ Cousin, Ghana Cocoa Processing Limited,
Fanmilk Ghana Ltd, Unilever Ghana Ltd, Pioneer Kitchen Ware Company Ltd, Starwin
Products Limited (SPL), Ayrton Drug Manufacturing Limited, Aluworks Limited, and
African Champion Industries Limited.
4. Results and Discussion
The table and the figure below shows the effect of power outage on the performance of
selected manufacturing companies listed on the Ghana Stock Exchange.
Table 4.1: Profitability of manufacturing firms during power outage and no-power
outage periods
Profitability
Indicators Mn (P.Out) Mn (N-P.Out) Std D. (P.Out)
Std D. (N-
P.Out) TL (P.Out)
TL (N-
P.Out) P-Value Decision
O.P Margin 0.0665 0.0533 0.1426 0.1673 -0.0043 -0.0093 0.3736 reject
ROA -0.0269 0.0448 0.2825 0.1647 -0.016 -0.0114 0.1219 reject
ROE -0.491 -0.1517 2.9742 2.0391 0.0445 0.0314 0.3073 reject
Source: Secondary data, July 2017
Note: Mn=Mean; P.Out= Power Outage period; N-P.Out= No-Power Outage period;
Std D.= Standard Deviation; TL= Treandline; Sig=Significance Value; O.P. Margin=
Operating Profit Margin; ROA= Return on Asset; ROE= Return on Equity;
Significance level: P-Value < 10%
Company’s profit performance is measured using profitability ratios. Looking at the first
profitability ratio (operating profit margin), power outage period recorded a mean of 0.0665,
standard deviation of 0.1426, and a trendline of -0.0043. Trendline of -0.0043 means over the
years of power failure (outage) operating profit margin will reduce by 0.43%; while no-power
outage period recorded a mean of 0.0533, a standard deviation of 0.1673, and a trendline of -
0.0093. So, over the period of no-power outage operating profit margin will reduce by 0.93%.
Operating Profit Margin recorded a significance value of 0.3736. ROA during power outage
period noted a mean of -0.0269, a standard deviation of 0.2825 and a trendline of -0.016.
Which implies over the period of power outage ROA (Return-on-Assets) will experience a
reduction of 1.6%; whereas no-power outage period noted average of 0.0448, standard
deviation of 0.1647 and a trendline of -0.0114. So over the years of no-dumsor ROA will
decrease by 1.14%. 0.1219 is recorded significance value for ROA. With respect to ROE
(Return-on-Equity) mean for power outage period was -0.4910, standard deviation of 2.9742
and a trendline of 0.0445, which means over the period of power outage ROE will increase
by 4.45%; while ROE for no-power outage period recorded a mean of -0.1517, standard
deviation of 2.0391 and trendline of 0.0314. This implies no-power outage ROE over the
period will increase by 3.14%. ROE for manufacturing firms doted a significance value of
0.3073.

European Journal of Business, Economics and Accountancy Vol. 5, No. 6, 2017 ISSN 2056-6018
Progressive Academic Publishing, UK Page 100 www.idpublications.org
Figure 4.1: Profitability of manufacturing firms during dumsor and non-dumsor
periods
Figure 4.1 as well provides a pictorial view of the trends in the manufacturing industry
profitability in Ghana from 2007 to 2013 hiring three (3) different measures for
manufacturing industry profitability specifically: operating profit margin, return-on-asset and
return-on-equity. From the above plotted profitability graph, operating profit and return-on-
asset decreased in 2008 but that of return-on-equity improved in 2008. All three profitability
measures reduced in 2009, improved in 2010 with the exception of return-on-equity. From
the manufacturing sector profitability trends, it appears all profitability measures massively
improved in 2011 (no-power outage year). However, all three (3) profitability measures
drastically decreased in 2012 (power outage year). In 2013 Ghana’s manufacturing sector
recorded improvement in operating profit margin and return-on-equity but a reduction in
return-on-asset. This can be that during that period assets or machines were idle because of
the frequent power outage in 2012. With regards to the second objective question, power
outage periods has operation profit margin mean of 0.0132 higher than that of no-power
outage years, no-power outage period deviates from it operating profit margin more than that
of power outage years, and a significance value of 0.3736 higher than 0.1 means, it is not
significance and that power outage has no effect on operating profit margin of manufacturing
firms. ROA is high in no-power period than power outage period and that in terms of ROA
there is a reduction in power outage years, power outage periods deviates from its ROA
0.1178 more than how much no-power outage deviates from its ROA, and also a significance
values of 0.1219 is higher than the level of significance of 0.1 and that power outage has no
effect on ROA of manufacturing firms even though it has a high mean in no-power outage as
compared to power outage periods. Power outage years have a lesser ROE as compared to
that of no-power outage, but power outage periods deviates much from its standard deviation
as compared to no-power outage years. So in terms of return on equity manufacturing firms
during power outage periods do not perform. Significance value of 0.3073 indicates that even
though there is a difference with respect to ROE in power outage and no-power outage years,
this difference is not significant and that power outage does not affect ROE of manufacturing
firms.
-2
-1.5
-1
-0.5
0
0.5
2006 2007 2008 2009 2010 2011 2012 2013 2014
Trend Profitability Analysis
OPERATING PROFIT MARGIN ROA ROE

European Journal of Business, Economics and Accountancy Vol. 5, No. 6, 2017 ISSN 2056-6018
Progressive Academic Publishing, UK Page 101 www.idpublications.org
5. CONCLUSION
Energy resource of the country can determine economic growth and development, as such
power is essential for economic activities. Power as an input commodity for production is a
very important commodity. By critically examining the liquidity ratios for both periods.
Though the means for power outage periods are higher and indicates that firms are more
liquid in power outage years, and also significance value shown that power outage does not
affect liquidity. Researcher deduced that by looking at the standard deviations, power outage
years deviated much from its means, also the trendline or rate of change (reduction) in power
outage years are higher, so do agree with Allcott, Collard-Wexler & O’Connell (2015) that
power outages alone in the short run, do not explain much of the gap in productivity and
concludes that manufacturing firms in the long run can be affected by power outages. The
most striking result was that though manufacturers said power outage has affected
profitability, the research shown that it is not significant.
6. REFERENCES
Adjei-Mantey, K. (2013). Household’s Willingness to Pay for Improved Electricity Supply in
the Accra-Tema Metropolitan Areas. Retrieved April 3, 201, from
http://www.ugspace.ug.edu.gh
Allocott, H., Collard-Wexler, A., & O’Connell, S.D. (2015). How Do Electricity Shortages
Affect Indutry? Evidence from India.
Amponsah, O., & Braimah, I. (2012). Causes and Effect of Frequent and Unannounced
Electricity Blackouts on the Operations of Micro and Small Scale Industries in
Kumasi. Journal of Sustainable Development, 5(2).
Anderson, P. L., & Geckil, I. K. (2003). Northeast Blackout Likely to Reduce US Earnings
by $6.4 Billion. Anderson Economic Group Working Paper. Retrieved from
http://www.andersoneconomicgroup.com
Apeaning, W.R. (2012). Energy Efficiency and Management in Industries-A Case Study of
Ghana’s Largest Industrial Area.
Asamoah, E. S., & Doe, F. (2014). Effect of Power Fluctuation on the Profitability and
Competitiveness of SMEs: A Study of SMEs within the Accra Business.
Banerjee, A., & Duflo, E (2005). Growth Theory through the Lens of Development
Economics in Aghion, Philippe, and Steven Durlauf, Eds. Handbook of Economic
Growth.
Beenstock, M. (1991). Generators and Cost of Electricity Outages. Energy Economics, 13(4),
283-289
Bental, B., & Ravid, S. A. (1982). A SAimple Method for Evaluating the Marginal Cost of
Unsupplied Electricity. The Bell Journal of Economics, 13(1), 249-253.
Berger, A. N., & Humphrey (1997). Efficiency of Financial Institutions: International Survey
and Directions for Future Research. European Journal of Operational Research.
Boasiako, A P. (2008). Unforgettable Effect of Electricity Power Crisis (Dumsor) on our
National Economy retrieved April 3, 2015, from www.ghanaweb.com
Bruch, M, & Hanter, L (2013). Controlling Power Blackout Risk should not Just be Limited
to Having Emergency Back-up Generators. Retrieved March 10, 2015, from
www.agcs.allianzcom
Burlando, A. (2010). The Impact of Electricity on Work and Health: Evidence from a
Blackout in Zanzibar. Management Review, 52(2), 77-83
Chang-Tai, H., & Olken, B. (2014). The Missing Middle. The Journal of Economic
Perspectives, 18(3), 89-108.

European Journal of Business, Economics and Accountancy Vol. 5, No. 6, 2017 ISSN 2056-6018
Progressive Academic Publishing, UK Page 102 www.idpublications.org
Cissokho, L., & Seck, A. (2013). Electric Power Outages and the Productivity of Small and
Medium Enterprises in Senegal.
Delen, D., Kuzey, C., & Uyar, A. (2013). Measuring Firm Performance Using Financial
Ratios: A Decision Tree Approach. Elsevier Ltd. Publisher.
Haanes, K., Balagopal, B., Arthur, D., Kong, M. T., Velken, I., Kruschwitz, N., & Hopkins,
M. S. (2011). First Look: The Second Annual Sustainability and Innovation Survey.
MIT Loan.
Hall, R., & Jones, C. (1999). Why Do Some Countries Produce So Much More Output per
Worker than Others? The Quarterly Journal of Economics, 114(1), 83-116.
Jiang, M. M., Chen, B., & Zhou, S. Y. (2011). Embodied Energy Account of Chinese
Economy. Procedia Environmental Sciences, 5, 184-198.
Laary, D. (2015). Ghana’s Manufacturing Sector Registers Negative Growth. Retrieved
March 10, 2015 from www.ghanawebcom
Schönbohm, AA. (2013). Performance Measurement and Management with Financial Ratios.
The BASF SE Case Paper, (72), 50-51.
Tambunan, T. T. H. (2009). SME in Asia Developing Countries. London: Palgrave
Macmillian.
Velasquez, J. R. C., & Pichler, B. (2010). China’s Increasing Economy and the Impacts on its
Energy. Estudios Gerenciales, 26(117), 131-143.

EJBEA European Journal of Business, Economics and Accountancy (EJBEA) ISSN 2056-6018 is a peer-
reviewed research journal published by Progressive Academic Publishing, UK. For this journal we accept manuscripts in the following
areas:
Accounting and Finance, Micro and Macro Economics, Development Studies, Micro-Finance,
E-Business, E-Commerce, Entrepreneurship, Financial Management, Marketing, Business
Economics, Research & Development, International Development, Economic Issues of
Developing and Developed Countries, Policy Studies, Poverty Alleviation, NGOs and Poverty Alleviation, Banking and Finance, Innovations in Business, Investment, Public and Private Sector
Investment, Online Business and other areas related to Economics and Business.
Indexing: This journal is indexed with the following database: Google Scholar, ROAD Directory of Open Access Scholarly Resources, UK, Cabells Directories,
USA, EBSCOhost, Gale’s Academic Databases, Norwegian Social Science Data Services (NSD), Open J-Gate, PKP Open Archives
Harvester, ProQuest, Sherpa/Romeo, Ulrich’s Periodical Directory.
How to Submit Manuscripts:
Manuscripts typed on our article template can be submitted through our website. Alternatively, the manuscripts can be sent as an email
attachment to: [email protected]
Editor-in-Chief Progressive Academic Publishing Website: www.idpublications.org
Email: [email protected]

EJBEA Vol. 5 No. 6, 2017 European Journal of Business, Economics and Accountancy (EJBEA): Accepted
Papers
1. Ogungbade, O. I., Olweny, T. & Oluoch, O. (2017). Effect of firm size on innovation among manufacturing companies in Nigeria. European Journal of Business, Economics and Accountancy, 5 (6), 1-14.
2. Oyebisi, O. et al. (2017). Treasury management policy and improvement in revenue base in Nigeria. European Journal of Business, Economics and Accountancy, 5 (6), 15-20.
3. Tsouli, D. & Elabbadi, B. (2017). A meta-analysis of 20 years of studies on intellectual capital (1997-2017). European Journal of Business, Economics and Accountancy, 5 (6), 21-28.
5. Mark, S. M., Shukla, J. & Ndengo, M. (2017). Effect of financial market integration on foreign portfolio investment diversification in developing stock markets. European Journal of Business, Economics and Accountancy, 5 (6), 39-47.
6. Islam, M. S., Arafin, M. & Zohora, F. T. (2017). Factors affecting share price of cement industry: “a study on listed cement companies of DSE”. European Journal of Business, Economics and Accountancy, 5 (6), 48-66.
7. Shunu, A. H., Bii, P. & Ombaba, K. M. (2017). The effect of board size on firm financial performance of listed firms in Nairobi security exchange. European Journal of Business, Economics and Accountancy, 5 (6), 67-70.
8. Bardhi, R. & Kapaj, I. (2017). The contribution of geographical indications in sustainable rural development (evidence from Northern Albania). European Journal of Business, Economics and Accountancy, 5 (6), 71-79.
9. Wetosi, A. W., Geoffrey, K. & Kibet, Y. (2017). Relationship marketing strategies and competitive advantage in selected commercial banks in Uasin-Gishu county. European Journal of Business, Economics and Accountancy, 5 (6), 80-87.
10. Spahiu, A. & Kapaj, A. (2017). Roles of commercial banks in the growth of small and medium enterprises – case of Albania. European Journal of Business, Economics and Accountancy, 5 (6), 88-93.

11. Dorcas, Q., Agyeman, B. & Bonn, J. (2017). Power outages on performance of selected manufacturing firms on the Ghana stock exchange. European Journal of Business, Economics and Accountancy, 5 (6), 94-102.