Embed Size (px)
Citation preview
American-Eurasian J. Agric. & Environ. Sci., 11 (5): 736-757, 2011ISSN 1818-6769© IDOSI Publications, 2011
Corresponding Author: Saira Shabeer Khosa, Institute of Horticulture Sciences, University of Agriculture, Faisalabad, Pakistan.736
Effect of Foliar Application of Macro and Micro Nutrientson Growth and Flowering of Gerbera jamesonii L.
Saira Shabeer Khosa, Adnan Younis, Adnan Rayit, Shahina Yasmeen and Atif Riaz
Institute of Horticulture Sciences, University of Agriculture, Faisalabad, Pakistan
Abstract: Foliar fertilization provides nutrients to plants by mist in a straight line onto foliage and flora.These fertilizers provide important nutrients for plant development. Therefore foliar fertilization of macro andmicro nutrients subjective the vegetative growth and flowering superiority of gerbera. Current study wasplanned to observe the effect of foliar purpose of macro (NPK) and micro nutrients (Zn, B, Fe and Mn) ongerbera growth and flowering production. The fertilizer solution of macro nutrients containing 1g, 1.5g and 2gof nitrogen, potassium and phosphorus, respectively and micro power contain 5000±200, 4000±200 and5000±200mg/100ml solution of Zn, B, Fe and Mn. Different concentration of macro nutrients i.e. 12.5ml+987.5mlwater, 18.75ml+981.25ml water and 25ml+975ml water taken and sprayed fifteen days intervals on potted gerbera.Spray of micro power (solution of different micronutrients) was also being applied at constant rate of 5ml/1000ml solution of water. Plant height, number of branches per plant, length of branches per plant, number of leaveper plant, leaf area, stock length, days to first flower emergence, flower diameter and flower quality increasedwith increasing fertilization level and began to turn down when fertilization level exceed beyond the abovegiven levels of macro and micro nutrients. Foliar fertilization influenced the days to first flower emergenceas compared to control where no foliar spray of macro and micro nutrients was applied. It took 85.55 days inT3 treatment as compared to control i.e. 105.55 when macro nutrients spray applied and in case of micronutrients it took 81.88 days in flower emergence as compared to control i.e 100.88.
Key words: Foliar fertilizer Gerbera jamesonii Micro power Macronutrients
INTRODUCTION most excellent given earlier than planting as a basal
Gerbera (gerbera jamesonii) belongs to family, of delicately powdered dolomite limestone if pH alsoAsteraceae and has 40 species scattered from Africa to needs to be raised. Magnesium can also be added inMadagascar into tropical Asia and South America Tjia the appearance of water soluble magnesium sulphate,and Joiner [1] Gerbera is popular plant for the backyard also earlier than or following planting Singh [4].and their daisy-like bloom make ongoing cut flora. Pakistan’s share in the international trade of fresh cutThe leaves are elongated, slim and covered with hair flowers is miniscule due to low quality produce, which is(pubescent) underneath, up to 10 inch lengthy and 4 inch attributable to non-availability of technology andbroad. Tjia et al., [2]. Gerbera flora computes 4 to 7 inch formulations of nutrients and growth regulators Rehmantransversely and can be fair or tinted lenses of yellow, [5]. Gerbera are broadly and commonly used as cutcarroty, crimson or scarlet. The midpoint (eye) of the flowers for flowery array, interior decoration and gifts forflower can be green, brown, black or dark red. There are particular occasion, wedding ceremony bouquet. It isfive diverse flora forms primarily base on the rows of ranked as the 5th most commonly used cut flowerpetals and how they lie on top: solitary, twice or duplex, international after rose, carnation, chrysanthemum andcrested doubles, full crested doubles and quelled crested tulip and hence an important commodity Jacqueline [6].doubles Clay [3]. Application of 15 g N, 20 g P O5 and 20 The cut flowers have a extended vase-life, which fetches2
g K O / m yielded maximum number of flowers per plant finest market prices. The flowers are lasting and set the22
in poly house conditions. Phosphorus and Calcium are rigors of shipping worthily Choudhary and Prasad [7].
covering. Magnesium can be specified in the appearance
Am-Euras. J. Agric. & Environ. Sci., 11 (5): 736-757, 2011
737
The maximum number of flowers /plant and per sq. m. was T :NPK (1.5g/pot:18.75ml+981.25ml water) and T :NPKrecorded with superior floral characters when applied with (2g/pot:25ml+975ml water). The treatments of microhigher levels of N & P (10 N + 15 g P O / m ). Maximum nutrients with concentrations were T : control2 5
2
flower diameter and vase life were obtained with N & P (0mg/solution), T : Zn,B,Fe,Mn (5000±200mg/100ml),levels of 10 g N + 12. 5 P O g /m and 5 g N + 15 g P O T :Zn,B,Fe,Mn (4000±200mg/100ml), T :Zn,B,Fe,Mn2 5 2 5
2
/m respectively Pimple, et al. [8]. There are two types of (5000±200mg/100ml). Newly transplanted plants at equal2
technologies that are appropriate for foliar application. height were taken from nursery in 10 inches pots.The first is the use of electrostatic sprayers, which The earthen pots were used. These pots were filled withconvey a charge to the mist particles and cause them to standard growing media (silt + garden soil + leaf compost,stick more eagerly to plants. The second technology, 1: 1: 1) according to the layout of the experiment andknown as Sonic Bloom™, uses sound to boost the leaves transplanted next day in Floriculture area of Institute ofabsorption of nutrients George [9]. Foliar fertilization is Horticulture Sciences. The plants were sprayed withextensively used practice to accurate the nutritional aqueous solution of macro and micro nutrients withdeficiencies in plants caused by inappropriate deliver of interval of 15 days. First spray was done after 30 days ofnutrients to roots Silberbush[10]. The effect of foliar transplanting. First irrigation was given just afterapplication of zinc and molybdenum through foliar spray transplanting while subsequent irrigation was appliedat 0.2, 0.4 and 0.6% and 30, 60 and 90 ppm, respectively. when needed. Hoeing was done regularly to keep downZinc and molybdenum increasing levels resulted in the weeds and staking was done to support the plant andincreasing plant height, number of fruits, fruit diameter data was recorded on plant height (cm), number ofand fruit yield. However, rising levels resulted increasing branches per plant, length of branches per plant (cm),in development and height fruit yield Naruka et al. [11]. number of leaves, leaf area (cm), stock length (cm), daysThe advantages of foliar fertilizers were more noticeable to first flower emergence, flower diameter (cm) and flowerunder growing conditions restricting the incorporation of quality was determine the help of scale ranging from 1 tonutrients from the soil, as reported by (Verma et al.,[12]. 5 Very Poor, Poor, Satisfactory, Good, ExcellentWith the introduction of fertilizers (Macro and Micro respectively. The experiment was conceded according tonutrients), which are essential for a plant growth, it has Randomized Completely Block Design (RCBD). Therebecome possible to get the plants of better growth were eight treatments and each treatment was consisting(Jitendra et al., [13]. The application of foliar fertilizer is of 3 plants which were replicated thrice, making a totalthe quickest way to deliver nutrients to the tissues and population of 72 plants. The data regarding all parametersorgans of the crops. So, present study was planned to was investigated statistically by performing analysis ofexamine the appropriate doses of major macronutrients in variance techniques Steel et al., [14] and interpretedfoliar absorption and also to verify the effect of these according to Duncan’s Multiple Range (DMR) test at 5%elements along with the spray of micro power on plant probability level to compare the difference amongefficiency (vegetative growth, plant height, flower size treatment means.and yield) of gerbera.
MATERIALS AND METHODS
The present studywas carried out at Floriculture area application of macro nutrients (NPK) and micro nutrientsof Institute of Horticulture Sciences, University of (Zn,B,Fe,Mn) in relation to various growth characteristicsAgriculture Faisalabad during the session of 2009-2011 on of gerbera were carried in plants.decorative gerbera. Present study was planned to monitorthe effects of foliar application of macro and micro Effect of Foliar Application of Macro Nutrients (NPK) onnutrients on growth and flowering of gerbera jamesonii Plant Morphology of Gerbera:L. The NPK main source of macro nutrients and Zn,B,Fe Plant Height (cm): Data concerning this factor of studyand Mn were the main sources of micronutrients. was discussed for statistical analysis and the resultsThe macro and micro nutrients were applied in eight obtained are given in Table 4.1.1 (a) and a perusal of giventreatments with different concentrations. The treatments table indicated highly significant results. Results showedof macro nutrients with different concentrations were that plant which fertilized with macro nutrients solutionT : control (0 g/pot), T :NPK (1g/pot:12.5ml+987.ml water), represent the significant height as compared to remaining0 1
2 3
0
1
2 3
RESULTS AND DISCUSSION
The comprehensive study on the effect of foliar
To T1 T2 T3
Foliar Treatments
Plan
t hei
ght (
cm)
Am-Euras. J. Agric. & Environ. Sci., 11 (5): 736-757, 2011
738
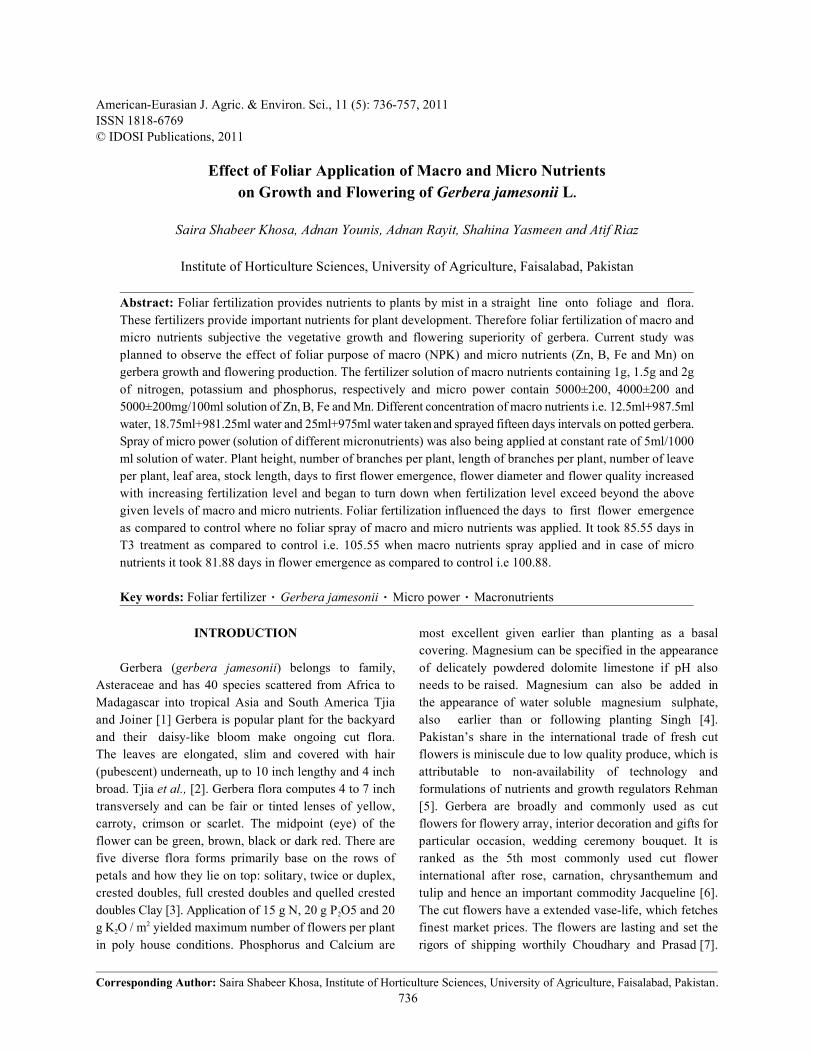
treatments. Maximum height of the plant was obtained, the requirement of plants as results decreasing in plantwhere 2g (25ml+275ml water) solution of macro nutrients height. The lowest plant height observed in controlwas used as a foliar spray in T and other different treatment. It reflects that fertilizers have great importance3
concentration of macro nutrients solution was also used to increase the plant height but at a certain levelin remaining treatments. The minimum height of the plant increasing fertilization of macro nutrients from requiredwas obtained in T where no foliar application of nutrients level has negative results. It showed that there is increaseo
was done. Spray of macro nutrients solution of NPK in plant height with boostup in nutritional level of macroincreases the plant height in T by (46.55 cm) as compared nutrients i.e. NPK up to certain level; this result is in line3
to control followed by T (37.55 cm), T (17.22 cm) and up with Scagel et al. [15]. Lowering the levels of macro2 1
T (15.55 cm), respectively. The graphical representation nutrients taking more time and give less production.o
on plant height was given in figure 4.1.1. From this figure Fertilization improves the gerbera growth andit is clear that all treatment levels are significantly differed development by providing essential macro nutrientsfrom one another. Highest plant growth was observed as (i.e. NPK). The results are in confirmatory with the resultsnutritional level increases from 0 to 2g. When level of of Baumgrarat [16], Roy et al. [17] that gerbera requirefoliar fertilizer increases from up to 4g which is more than balance nutrition at early stages of growth.
Table 4.1.1: Effect of Macro Nutrients on plant height (cm) of Gerbera (Gerbera jamesonii)(a) Analysis of variance (ANOVA) for plant height (cm)
Source of variation df SS MS F - value
Blocks 2 48.333 24.166Treatments 3 2102 700.666 71.454***Error 6 58.835 9.805
Total 11 2209.168
***= Highly Significant
(b) Comparison of mean values for plant height (cm)
Treatment Means Original Order Treatment Means Ranked Order
T 15.55 T 46.55o 3
T 17.22 T 37.551 2
T 37.55 T 17.222 1
T 46.55 T 15.553 0
Effect of macro nutrients (NPK) solution on height of plant in Gerbera. Vertical bars indicate S. E ± of means. To (control), T1 (1gm = 12.5ml + 987.5mlwater), T2 (1.5gm = 18.75ml + 981.25ml water), T3 (2g = 25ml + 975ml water).
Fig. 4.1.1: Effect of macro nutrients on plant height of Gerbera
0
1
2
3
4
5
6
7
8
To T1 T2 T3
Foliar treatments
Num
ber o
f bra
nche
s pe
r pla
nt
Am-Euras. J. Agric. & Environ. Sci., 11 (5): 736-757, 2011
739
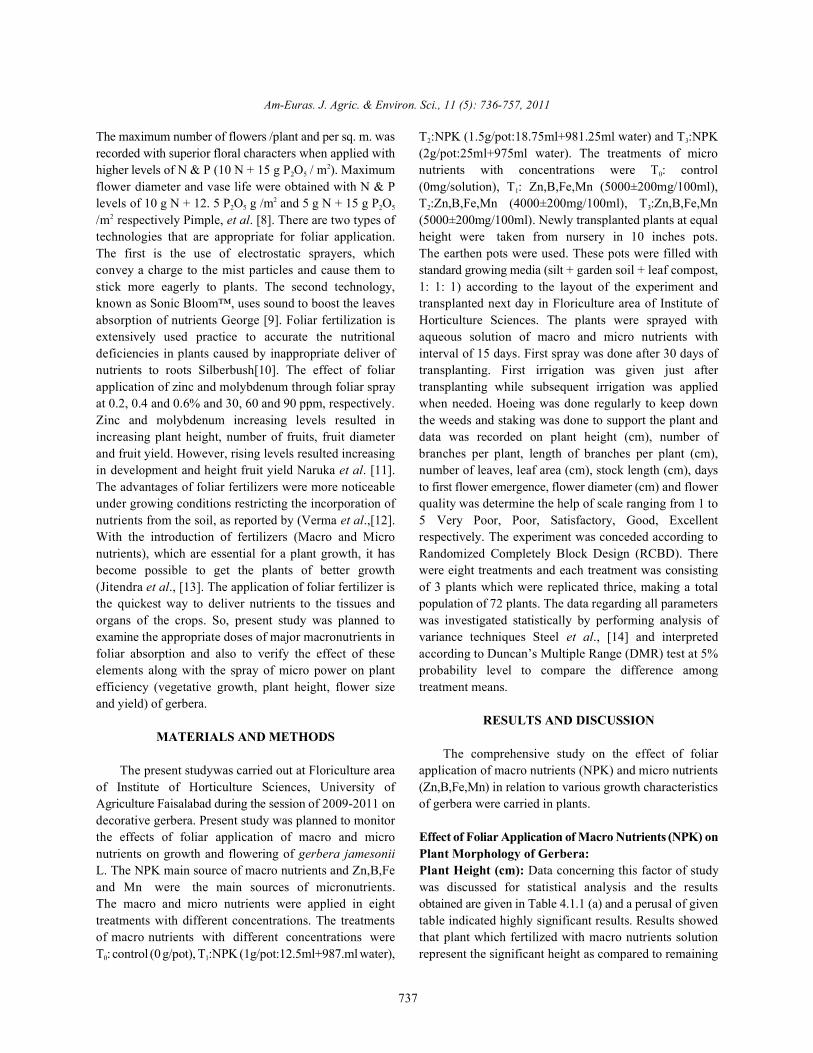
Number of Branches per Plant: The data related to macro nutrients (NPK) solution. The comparativenumber of branches per plant indicated that T i.e., 2g performance of treatment levels was made by3
(25ml+975ml water) showed maximum number of arranging their values in descending order and it isbranches per plant by the foliar spray of macro nutrients observed that maximum number of branches obtainedsolution containing NPK and T which received no foliar at 2g (i.e. 25ml+975ml water) of the fertilization level ofo
spray of macro nutrients solution of NPK indicated macro nutrients and lowest at T with no fertilization ofminimum number of branches per plant. Therefore foliar macro nutrient. Therefore maximum number of branchesspray of macro nutrients of NPK solution enhance the per plant with balanced fertilizer is required in the foliagenumber of branches in plant in T by (7.22cm), T (6.99cm), of plants. These observations are in line with finding of3 2
T (5.77cm) and T (4.66cm) respectively in descending Nahed [18], Dick and Wilson [19]. The results showed1 o
order as given in table 4.1.2 (b) and ANOVA table that lowering level of macro nutrients to 1g (T ) decreasesrepresent in Table 4.1.2 (a). The graphicaly shown in number of branches per plant but would not adverselyFigure 4.1.2. The given figure represents the highest affect gerbera growth and flowering production. Balanced value of T treatment and remaining treatments are concentration of macro nutrients (i.e.2g T ) significantly3
arranged in descending order respectively. Therefore, increases the number of branches per plant. Thereforeall treatment values are differed from one another. macro nutrients improve the gerbera growth and floweringData has reflected significant result for foliar spray of production.
o
1
3
Table 4.1.2: Effect of Macro Nutrients on no of branches per plant of Gerbera (Gerbera jamesonii)(a) Analysis of variance (ANOVA) for No of branches per plantSource of variation df SS MS F - valueBlocks 2 4.386 2.193Treatment 3 15..639 5.213 4.552*Error 8 6.872 1.145Total 11 26.897* = Significant
(b) Comparison of mean values for No of branches per plantTreatment Means Original Order Treatment Means Ranked OrderT 4.66 T 7.22o 3
T 5.77 T 6.991 2
T 6.99 T 5.772 1
T 7.22 T 4.663 o
Effect of macro nutrients (NPK) solution on no of branches per plant in Gerbera. Vertical bars indicate S. E ± of means. To (control), T1 (1gm = 12.5ml +987.5ml water), T2 (1.5gm = 18.75ml + 981.25ml water), T3 (2g = 25ml + 975ml water).
Fig. 4.1.2: Effect of macro nutrients on number of branches per plant of Gerbera
0
5
10
15
20
25
30
To T1 T2 T3
Foliar treatments
Leng
th o
f bra
nche
s pe
r pla
nt (c
m)
Am-Euras. J. Agric. & Environ. Sci., 11 (5): 736-757, 2011
740
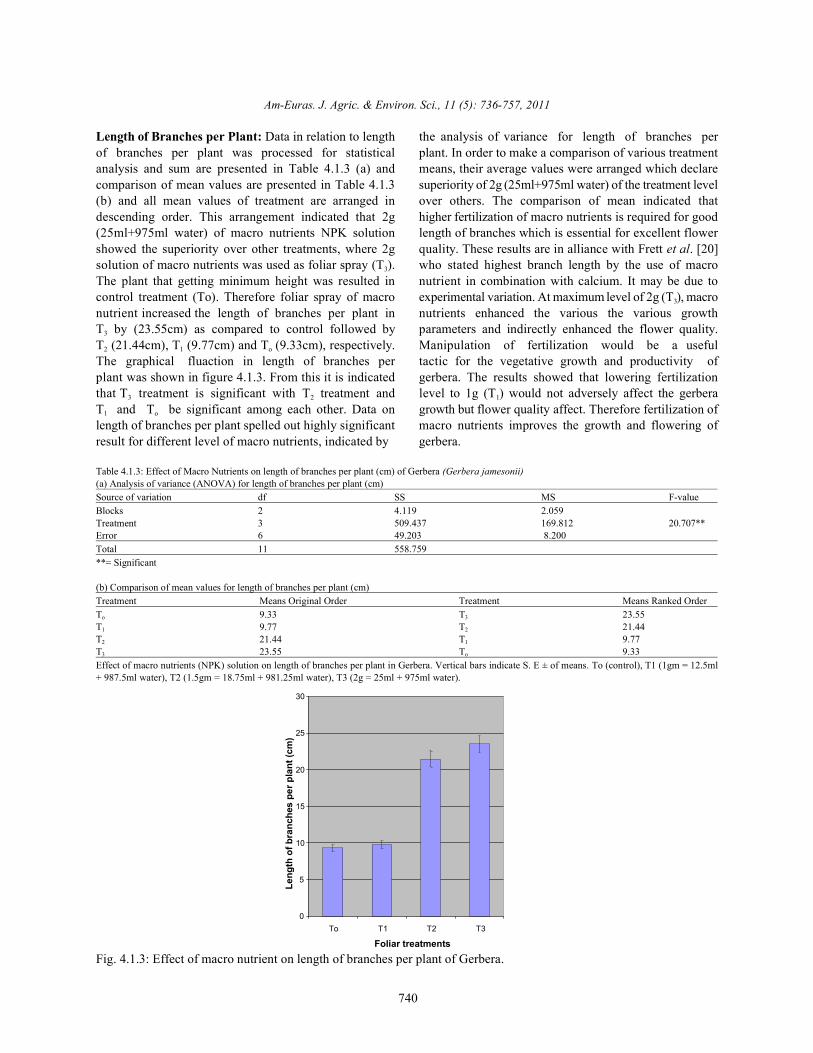
Length of Branches per Plant: Data in relation to length the analysis of variance for length of branches perof branches per plant was processed for statistical plant. In order to make a comparison of various treatmentanalysis and sum are presented in Table 4.1.3 (a) and means, their average values were arranged which declarecomparison of mean values are presented in Table 4.1.3 superiority of 2g (25ml+975ml water) of the treatment level(b) and all mean values of treatment are arranged in over others. The comparison of mean indicated thatdescending order. This arrangement indicated that 2g higher fertilization of macro nutrients is required for good(25ml+975ml water) of macro nutrients NPK solution length of branches which is essential for excellent flowershowed the superiority over other treatments, where 2g quality. These results are in alliance with Frett et al. [20]solution of macro nutrients was used as foliar spray (T ). who stated highest branch length by the use of macro3
The plant that getting minimum height was resulted in nutrient in combination with calcium. It may be due tocontrol treatment (To). Therefore foliar spray of macro experimental variation. At maximum level of 2g (T ), macronutrient increased the length of branches per plant in nutrients enhanced the various the various growthT by (23.55cm) as compared to control followed by parameters and indirectly enhanced the flower quality.3
T (21.44cm), T (9.77cm) and T (9.33cm), respectively. Manipulation of fertilization would be a useful2 1 o
The graphical fluaction in length of branches per tactic for the vegetative growth and productivity ofplant was shown in figure 4.1.3. From this it is indicated gerbera. The results showed that lowering fertilizationthat T treatment is significant with T treatment and level to 1g (T ) would not adversely affect the gerbera3 2
T and T be significant among each other. Data on growth but flower quality affect. Therefore fertilization of1 o
length of branches per plant spelled out highly significant macro nutrients improves the growth and flowering ofresult for different level of macro nutrients, indicated by gerbera.
3
1
Table 4.1.3: Effect of Macro Nutrients on length of branches per plant (cm) of Gerbera (Gerbera jamesonii)(a) Analysis of variance (ANOVA) for length of branches per plant (cm)Source of variation df SS MS F-valueBlocks 2 4.119 2.059Treatment 3 509.437 169.812 20.707**Error 6 49.203 8.200Total 11 558.759**= Significant
(b) Comparison of mean values for length of branches per plant (cm)Treatment Means Original Order Treatment Means Ranked OrderT 9.33 T 23.55o 3
T 9.77 T 21.441 2
T 21.44 T 9.772 1
T 23.55 T 9.333 o
Effect of macro nutrients (NPK) solution on length of branches per plant in Gerbera. Vertical bars indicate S. E ± of means. To (control), T1 (1gm = 12.5ml+ 987.5ml water), T2 (1.5gm = 18.75ml + 981.25ml water), T3 (2g = 25ml + 975ml water).
Fig. 4.1.3: Effect of macro nutrient on length of branches per plant of Gerbera.
0
1
2
3
4
5
6
7
8
To T1 T2 T3
Foliar treatments
Num
ber o
f lea
ves
per p
lant
Am-Euras. J. Agric. & Environ. Sci., 11 (5): 736-757, 2011
741
Number of Leaves per Plant: Data on number of leaves another as declare from results that maximum numberper plant was statistically analyzed and results obtained of leaves obtained at 2g (T ) treatment level andare presented in Table 4.1.4 (a) and mean values of all minimum number of leaves at 0g (T ) treatment level.treatment are arranged in descending order in Table 4.1.4 Higher foliar fertilization of macro nutrients from(b) and all treatments are differed from one another. recommended level results in less number of leaves perMaximum number of leaves per plant was obtained from plant. It is cleared from results that foliar fertilization ofplant where 2g (25ml+975ml water) solution of macro macro nutrients have significant role on number ofnutrients was used as foliar spray in T treatment plants leaves. Foliar fertilization level of macro nutrients3
and minimum no of leaves was resulted in plants where from 0 to 2g provides essential nutrients to plants thattap water was used as foliar spray in T . Application of obtained acceptable market quality. Greater number ofo
macro nutrients solution increases the number of leaves leaves may be due to number of branches. Since theper plant in T by (7.22cm) as compare to control followed height of plants is affected by certain level of macro3
by T (6.99cm), T (5.77cm) and T (4.66cm), respectively. nutrients, so number of leaves naturally present in2 1 o
The graphically representation on number of leaves per parallel situation. It indicates that if there is increase inplant in figure 4.1.4. From this it is indicated that foliar fertilizer concentration in leaves there is increase intreatment T and T are significant among each other and number of leaves. High dose of macro nutrients (NPK)3 2
T and T are significant among each other. Statistical resulted in maximum number of leaves which is in1 o
analysis for this factor of study has reflected significant confirmed by the finding of Javaid et al. [21], Qasim et al.results. The individual treatment levels differed from one [22] and Gohar et al. [23].
3
o
Table 4.1.4: Effect of Macro Nutrients on no of leaves per plant per plant of Gerbera (Gerbera jamesonii)(a) Analysis of variance (ANOVA) for no of leaves per plantSource of variation df SS MS F-valueBlocks 2 4.386 2.193Treatment 3 15..639 5.213 4.552*Error 6 6.872 1.145Total 11 26.897* = Significant
(b) Comparison of mean values for no of leaves per plantTreatment Means Original Order Treatment Means Ranked OrderT 4.66 T 7.22o 3
T 5.77 T 6.991 2
T 6.99 T 5.772 1
T 7.22 T 4.663 0
Effect of macro nutrients (NPK) solution on no of leaves per plant in Gerbera. Vertical bars indicate S. E ± of means. To (control), T1 (1gm = 12.5ml +987.5ml water), T2 (1.5gm = 18.75ml + 981.25ml water), T3 (2g = 25ml + 975ml water).
Fig. 4.1.4: Effect of macro nutrients on no of leaves per plant of Gerbera.
0
20
40
60
80
100
120
140
160
To T1 T2 T3
Foliar treatments
Leaf
are
a (c
m2)
Am-Euras. J. Agric. & Environ. Sci., 11 (5): 736-757, 2011
742
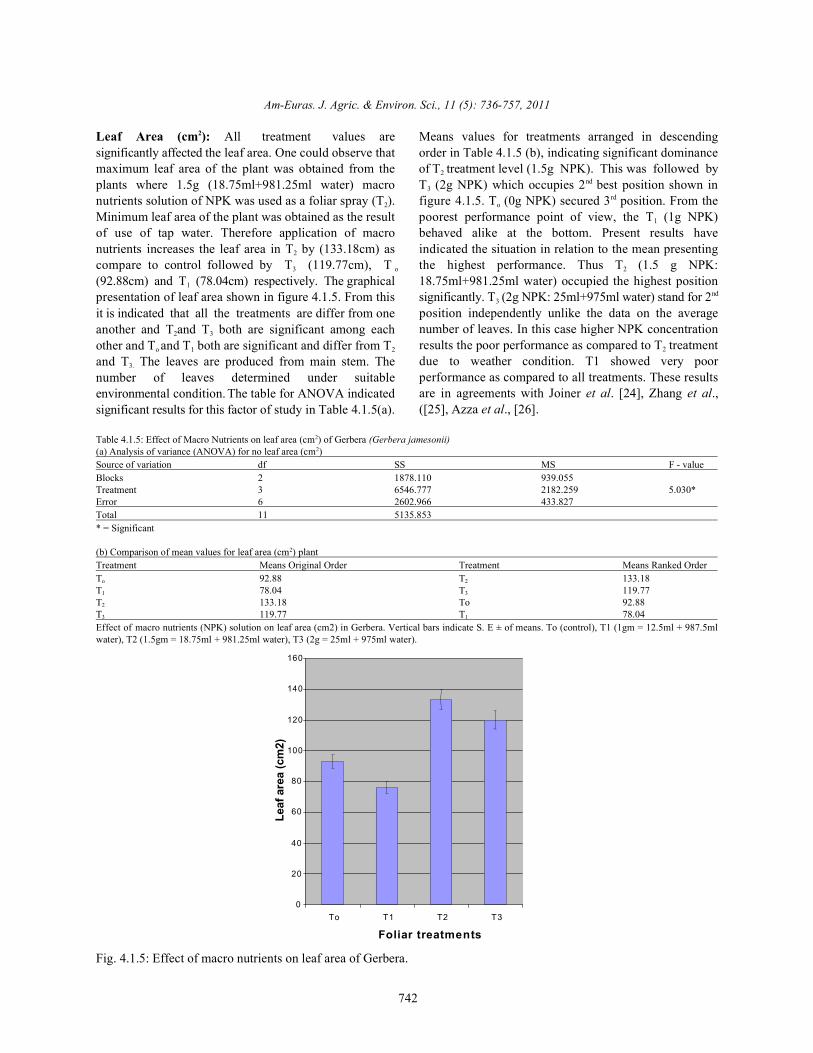
Leaf Area (cm ): All treatment values are Means values for treatments arranged in descending2
significantly affected the leaf area. One could observe that order in Table 4.1.5 (b), indicating significant dominancemaximum leaf area of the plant was obtained from the of T treatment level (1.5g NPK). This was followed byplants where 1.5g (18.75ml+981.25ml water) macro T (2g NPK) which occupies 2 best position shown innutrients solution of NPK was used as a foliar spray (T ). figure 4.1.5. T (0g NPK) secured 3 position. From the2
Minimum leaf area of the plant was obtained as the result poorest performance point of view, the T (1g NPK)of use of tap water. Therefore application of macro behaved alike at the bottom. Present results havenutrients increases the leaf area in T by (133.18cm) as indicated the situation in relation to the mean presenting2
compare to control followed by T (119.77cm), T the highest performance. Thus T (1.5 g NPK:3 o
(92.88cm) and T (78.04cm) respectively. The graphical 18.75ml+981.25ml water) occupied the highest position1
presentation of leaf area shown in figure 4.1.5. From this significantly. T (2g NPK: 25ml+975ml water) stand for 2it is indicated that all the treatments are differ from oneanother and T and T both are significant among each2 3
other and T and T both are significant and differ from To 1 2
and T The leaves are produced from main stem. The3.
number of leaves determined under suitableenvironmental condition. The table for ANOVA indicatedsignificant results for this factor of study in Table 4.1.5(a).
2
3nd
ord
1
2
3nd
position independently unlike the data on the averagenumber of leaves. In this case higher NPK concentrationresults the poor performance as compared to T treatment2
due to weather condition. T1 showed very poorperformance as compared to all treatments. These resultsare in agreements with Joiner et al. [24], Zhang et al.,([25], Azza et al., [26].
Table 4.1.5: Effect of Macro Nutrients on leaf area (cm ) of Gerbera (Gerbera jamesonii)2
(a) Analysis of variance (ANOVA) for no leaf area (cm )2
Source of variation df SS MS F - valueBlocks 2 1878.110 939.055Treatment 3 6546.777 2182.259 5.030*Error 6 2602.966 433.827Total 11 5135.853* = Significant
(b) Comparison of mean values for leaf area (cm ) plant2
Treatment Means Original Order Treatment Means Ranked OrderT 92.88 T 133.18o 2
T 78.04 T 119.771 3
T 133.18 To 92.882
T 119.77 T 78.043 1
Effect of macro nutrients (NPK) solution on leaf area (cm2) in Gerbera. Vertical bars indicate S. E ± of means. To (control), T1 (1gm = 12.5ml + 987.5mlwater), T2 (1.5gm = 18.75ml + 981.25ml water), T3 (2g = 25ml + 975ml water).
Fig. 4.1.5: Effect of macro nutrients on leaf area of Gerbera.
0
5
10
15
20
25
30
35
40
45
50
To T1 T2 T3
Foliar treatments
Stoc
k le
ngth
(cm
)
Am-Euras. J. Agric. & Environ. Sci., 11 (5): 736-757, 2011
743
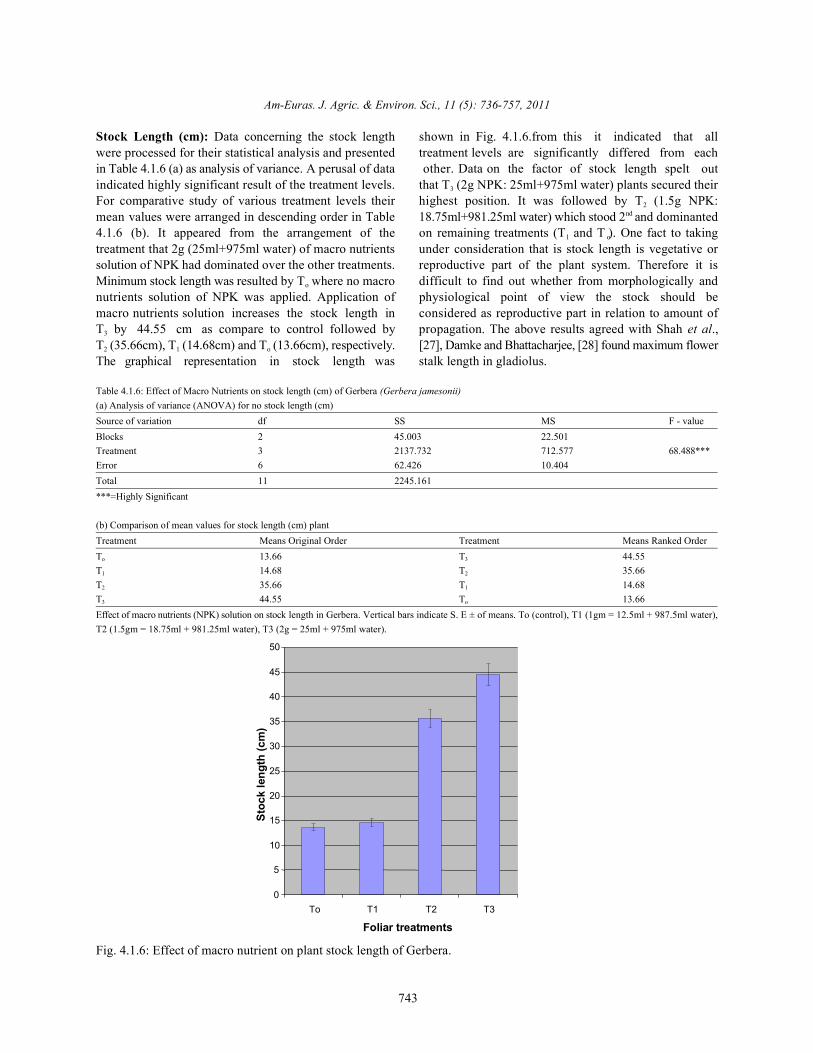
Stock Length (cm): Data concerning the stock length shown in Fig. 4.1.6.from this it indicated that allwere processed for their statistical analysis and presented treatment levels are significantly differed from eachin Table 4.1.6 (a) as analysis of variance. A perusal of data other. Data on the factor of stock length spelt outindicated highly significant result of the treatment levels. that T (2g NPK: 25ml+975ml water) plants secured theirFor comparative study of various treatment levels their highest position. It was followed by T (1.5g NPK:mean values were arranged in descending order in Table 18.75ml+981.25ml water) which stood 2 and dominanted4.1.6 (b). It appeared from the arrangement of the on remaining treatments (T and T ). One fact to takingtreatment that 2g (25ml+975ml water) of macro nutrients under consideration that is stock length is vegetative orsolution of NPK had dominated over the other treatments. reproductive part of the plant system. Therefore it isMinimum stock length was resulted by T where no macro difficult to find out whether from morphologically ando
nutrients solution of NPK was applied. Application of physiological point of view the stock should bemacro nutrients solution increases the stock length in considered as reproductive part in relation to amount ofT by 44.55 cm as compare to control followed by propagation. The above results agreed with Shah et al.,3
T (35.66cm), T (14.68cm) and T (13.66cm), respectively. [27], Damke and Bhattacharjee, [28] found maximum flower2 1 o
The graphical representation in stock length was stalk length in gladiolus.
3
2nd
1 o
Table 4.1.6: Effect of Macro Nutrients on stock length (cm) of Gerbera (Gerbera jamesonii)(a) Analysis of variance (ANOVA) for no stock length (cm)Source of variation df SS MS F - valueBlocks 2 45.003 22.501Treatment 3 2137.732 712.577 68.488***Error 6 62.426 10.404Total 11 2245.161***=Highly Significant
(b) Comparison of mean values for stock length (cm) plantTreatment Means Original Order Treatment Means Ranked OrderT 13.66 T 44.55o 3
T 14.68 T 35.661 2
T 35.66 T 14.682 1
T 44.55 T 13.663 o
Effect of macro nutrients (NPK) solution on stock length in Gerbera. Vertical bars indicate S. E ± of means. To (control), T1 (1gm = 12.5ml + 987.5ml water),T2 (1.5gm = 18.75ml + 981.25ml water), T3 (2g = 25ml + 975ml water).
Fig. 4.1.6: Effect of macro nutrient on plant stock length of Gerbera.
0
20
40
60
80
100
120
To T1 T2 T3
Foliar treatments
Day
s to
firs
t flo
wer
em
erge
nce
Am-Euras. J. Agric. & Environ. Sci., 11 (5): 736-757, 2011
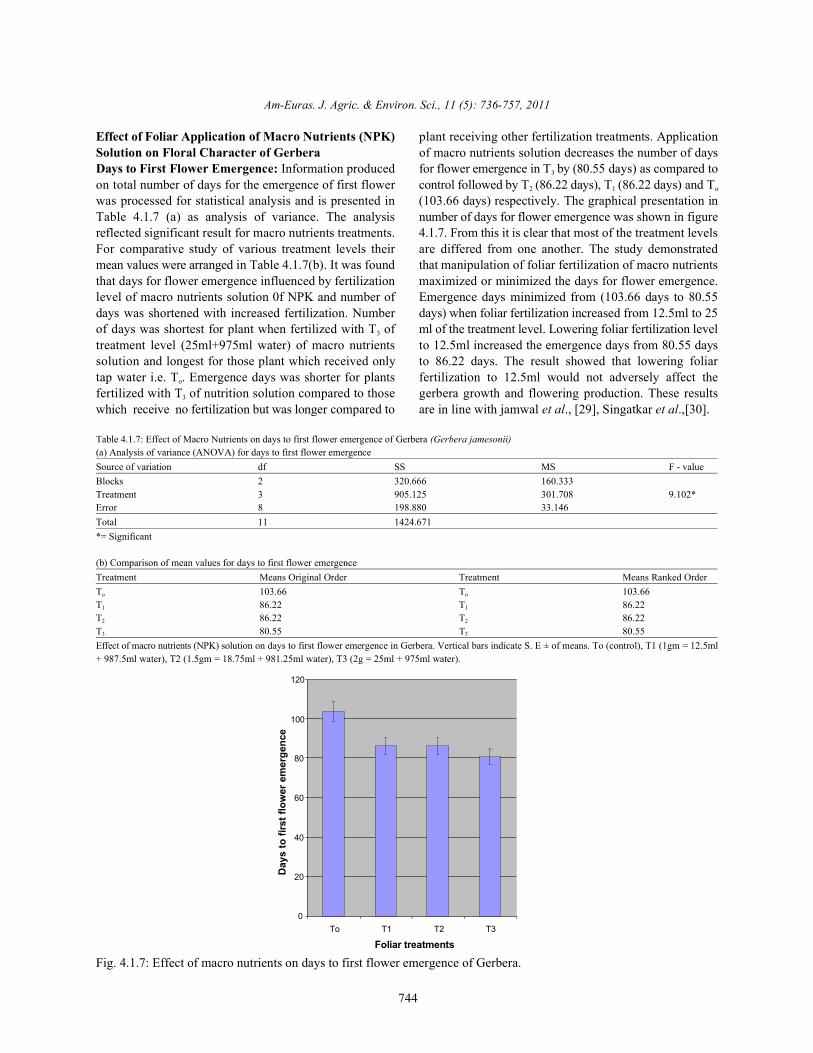
744
Effect of Foliar Application of Macro Nutrients (NPK) plant receiving other fertilization treatments. ApplicationSolution on Floral Character of Gerbera of macro nutrients solution decreases the number of daysDays to First Flower Emergence: Information produced for flower emergence in T by (80.55 days) as compared toon total number of days for the emergence of first flower control followed by T (86.22 days), T (86.22 days) and Twas processed for statistical analysis and is presented in (103.66 days) respectively. The graphical presentation inTable 4.1.7 (a) as analysis of variance. The analysis number of days for flower emergence was shown in figurereflected significant result for macro nutrients treatments. 4.1.7. From this it is clear that most of the treatment levelsFor comparative study of various treatment levels their are differed from one another. The study demonstratedmean values were arranged in Table 4.1.7(b). It was found that manipulation of foliar fertilization of macro nutrientsthat days for flower emergence influenced by fertilization maximized or minimized the days for flower emergence.level of macro nutrients solution 0f NPK and number of Emergence days minimized from (103.66 days to 80.55days was shortened with increased fertilization. Number days) when foliar fertilization increased from 12.5ml to 25of days was shortest for plant when fertilized with T of ml of the treatment level. Lowering foliar fertilization level3
treatment level (25ml+975ml water) of macro nutrients to 12.5ml increased the emergence days from 80.55 dayssolution and longest for those plant which received only to 86.22 days. The result showed that lowering foliartap water i.e. T . Emergence days was shorter for plants fertilization to 12.5ml would not adversely affect theo
fertilized with T of nutrition solution compared to those gerbera growth and flowering production. These results3
which receive no fertilization but was longer compared to are in line with jamwal et al., [29], Singatkar et al.,[30].
3
2 1 o
Table 4.1.7: Effect of Macro Nutrients on days to first flower emergence of Gerbera (Gerbera jamesonii)(a) Analysis of variance (ANOVA) for days to first flower emergenceSource of variation df SS MS F - valueBlocks 2 320.666 160.333Treatment 3 905.125 301.708 9.102*Error 8 198.880 33.146Total 11 1424.671*= Significant
(b) Comparison of mean values for days to first flower emergence Treatment Means Original Order Treatment Means Ranked OrderT 103.66 T 103.66o o
T 86.22 T 86.221 1
T 86.22 T 86.222 2
T 80.55 T 80.553 3
Effect of macro nutrients (NPK) solution on days to first flower emergence in Gerbera. Vertical bars indicate S. E ± of means. To (control), T1 (1gm = 12.5ml+ 987.5ml water), T2 (1.5gm = 18.75ml + 981.25ml water), T3 (2g = 25ml + 975ml water).
Fig. 4.1.7: Effect of macro nutrients on days to first flower emergence of Gerbera.
0
1
2
3
4
5
6
7
8
9
10
To T1 T2 T3
Foliar treatments
Flow
er d
iam
eter
(cm
)
Am-Euras. J. Agric. & Environ. Sci., 11 (5): 736-757, 2011
745
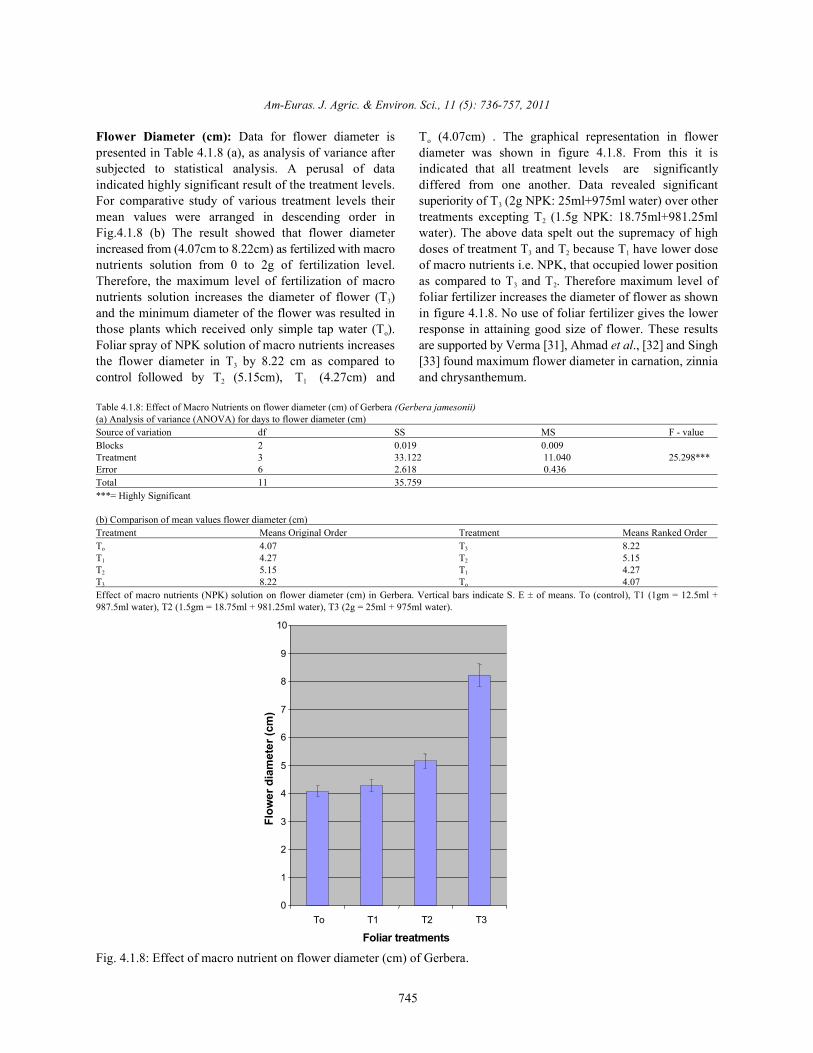
Flower Diameter (cm): Data for flower diameter is T (4.07cm) . The graphical representation in flowerpresented in Table 4.1.8 (a), as analysis of variance after diameter was shown in figure 4.1.8. From this it issubjected to statistical analysis. A perusal of data indicated that all treatment levels are significantlyindicated highly significant result of the treatment levels. differed from one another. Data revealed significantFor comparative study of various treatment levels their superiority of T (2g NPK: 25ml+975ml water) over othermean values were arranged in descending order in treatments excepting T (1.5g NPK: 18.75ml+981.25mlFig.4.1.8 (b) The result showed that flower diameter water). The above data spelt out the supremacy of highincreased from (4.07cm to 8.22cm) as fertilized with macro doses of treatment T and T because T have lower dosenutrients solution from 0 to 2g of fertilization level. of macro nutrients i.e. NPK, that occupied lower positionTherefore, the maximum level of fertilization of macro as compared to T and T . Therefore maximum level ofnutrients solution increases the diameter of flower (T ) foliar fertilizer increases the diameter of flower as shown3
and the minimum diameter of the flower was resulted in in figure 4.1.8. No use of foliar fertilizer gives the lowerthose plants which received only simple tap water (T ). response in attaining good size of flower. These resultso
Foliar spray of NPK solution of macro nutrients increases are supported by Verma [31], Ahmad et al., [32] and Singhthe flower diameter in T by 8.22 cm as compared to [33] found maximum flower diameter in carnation, zinnia3
control followed by T (5.15cm), T (4.27cm) and and chrysanthemum.2 1
o
3
2
3 2 1
3 2
Table 4.1.8: Effect of Macro Nutrients on flower diameter (cm) of Gerbera (Gerbera jamesonii)(a) Analysis of variance (ANOVA) for days to flower diameter (cm)Source of variation df SS MS F - valueBlocks 2 0.019 0.009Treatment 3 33.122 11.040 25.298***Error 6 2.618 0.436Total 11 35.759***= Highly Significant
(b) Comparison of mean values flower diameter (cm) Treatment Means Original Order Treatment Means Ranked OrderT 4.07 T 8.22o 3
T 4.27 T 5.151 2
T 5.15 T 4.272 1
T 8.22 T 4.073 o
Effect of macro nutrients (NPK) solution on flower diameter (cm) in Gerbera. Vertical bars indicate S. E ± of means. To (control), T1 (1gm = 12.5ml +987.5ml water), T2 (1.5gm = 18.75ml + 981.25ml water), T3 (2g = 25ml + 975ml water).
Fig. 4.1.8: Effect of macro nutrient on flower diameter (cm) of Gerbera.
0
1
2
3
4
5
6
To T1 T2 T3
Foliar treatments
Flow
er q
ualit
y
Am-Euras. J. Agric. & Environ. Sci., 11 (5): 736-757, 2011
746
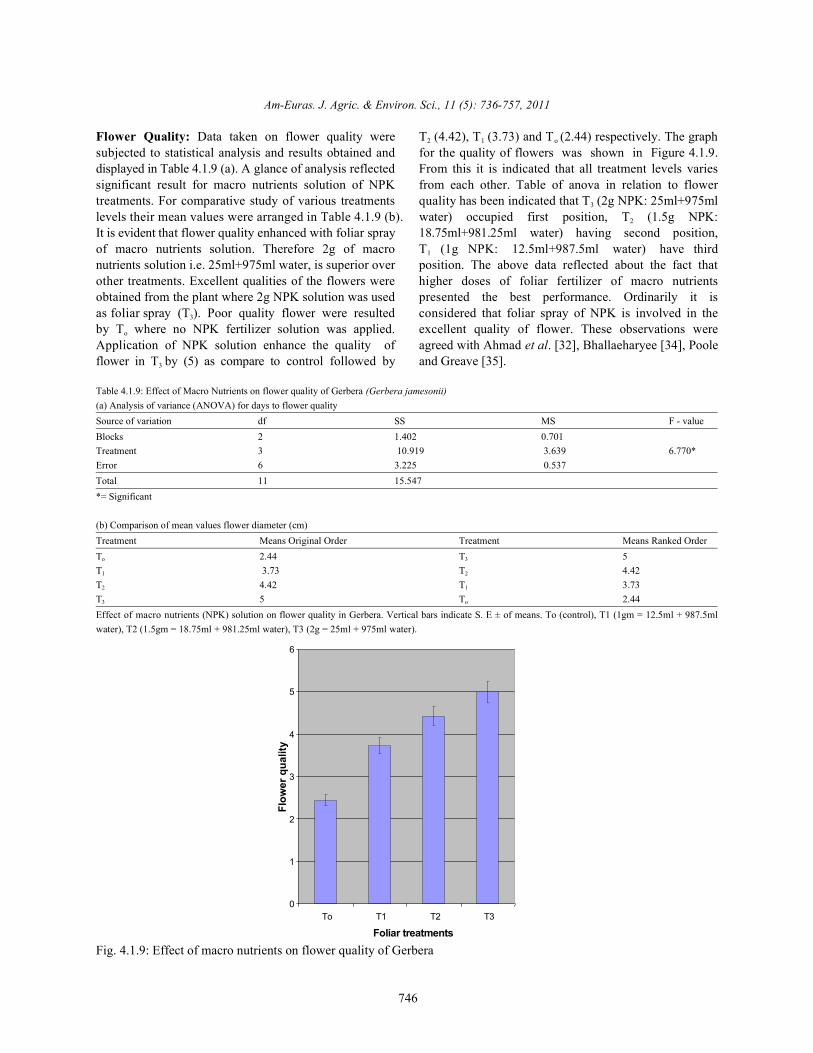
Flower Quality: Data taken on flower quality were T (4.42), T (3.73) and T (2.44) respectively. The graphsubjected to statistical analysis and results obtained and for the quality of flowers was shown in Figure 4.1.9.displayed in Table 4.1.9 (a). A glance of analysis reflected From this it is indicated that all treatment levels variessignificant result for macro nutrients solution of NPK from each other. Table of anova in relation to flowertreatments. For comparative study of various treatments quality has been indicated that T (2g NPK: 25ml+975mllevels their mean values were arranged in Table 4.1.9 (b). water) occupied first position, T (1.5g NPK:It is evident that flower quality enhanced with foliar spray 18.75ml+981.25ml water) having second position,of macro nutrients solution. Therefore 2g of macro T (1g NPK: 12.5ml+987.5ml water) have thirdnutrients solution i.e. 25ml+975ml water, is superior over position. The above data reflected about the fact thatother treatments. Excellent qualities of the flowers were higher doses of foliar fertilizer of macro nutrientsobtained from the plant where 2g NPK solution was used presented the best performance. Ordinarily it isas foliar spray (T ). Poor quality flower were resulted considered that foliar spray of NPK is involved in the3
by T where no NPK fertilizer solution was applied. excellent quality of flower. These observations wereo
Application of NPK solution enhance the quality of agreed with Ahmad et al. [32], Bhallaeharyee [34], Pooleflower in T by (5) as compare to control followed by and Greave [35].3
2 1 o
3
2
1
Table 4.1.9: Effect of Macro Nutrients on flower quality of Gerbera (Gerbera jamesonii)(a) Analysis of variance (ANOVA) for days to flower qualitySource of variation df SS MS F - valueBlocks 2 1.402 0.701Treatment 3 10.919 3.639 6.770*Error 6 3.225 0.537Total 11 15.547*= Significant
(b) Comparison of mean values flower diameter (cm) Treatment Means Original Order Treatment Means Ranked OrderT 2.44 T 5o 3
T 3.73 T 4.421 2
T 4.42 T 3.732 1
T 5 T 2.443 o
Effect of macro nutrients (NPK) solution on flower quality in Gerbera. Vertical bars indicate S. E ± of means. To (control), T1 (1gm = 12.5ml + 987.5mlwater), T2 (1.5gm = 18.75ml + 981.25ml water), T3 (2g = 25ml + 975ml water).
Fig. 4.1.9: Effect of macro nutrients on flower quality of Gerbera
0
5
10
15
20
25
30
35
40
45
50
To T1 T2 T3
Foliar treatments
Plan
t hei
ght (
cm)
Am-Euras. J. Agric. & Environ. Sci., 11 (5): 736-757, 2011
747
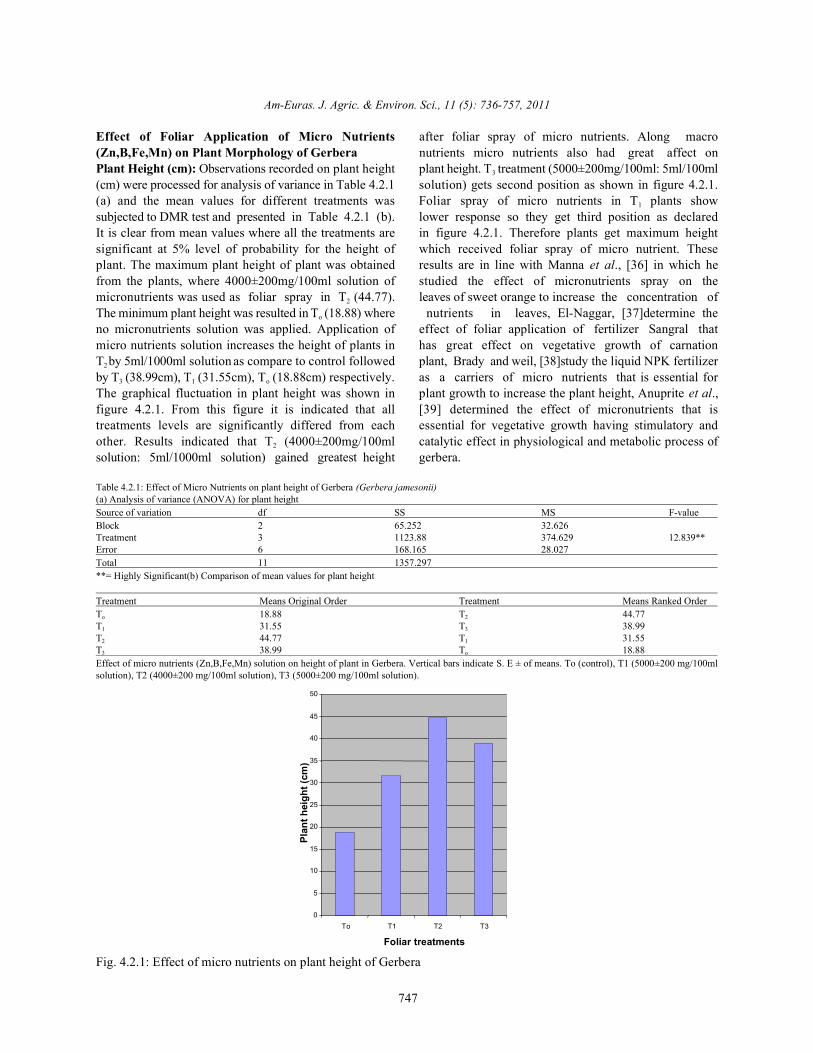
Effect of Foliar Application of Micro Nutrients after foliar spray of micro nutrients. Along macro(Zn,B,Fe,Mn) on Plant Morphology of Gerbera nutrients micro nutrients also had great affect onPlant Height (cm): Observations recorded on plant height plant height. T treatment (5000±200mg/100ml: 5ml/100ml(cm) were processed for analysis of variance in Table 4.2.1 solution) gets second position as shown in figure 4.2.1.(a) and the mean values for different treatments was Foliar spray of micro nutrients in T plants showsubjected to DMR test and presented in Table 4.2.1 (b). lower response so they get third position as declaredIt is clear from mean values where all the treatments are in figure 4.2.1. Therefore plants get maximum heightsignificant at 5% level of probability for the height of which received foliar spray of micro nutrient. Theseplant. The maximum plant height of plant was obtained results are in line with Manna et al., [36] in which hefrom the plants, where 4000±200mg/100ml solution of studied the effect of micronutrients spray on themicronutrients was used as foliar spray in T (44.77). leaves of sweet orange to increase the concentration of2
The minimum plant height was resulted in T (18.88) where nutrients in leaves, El-Naggar, [37]determine theo
no micronutrients solution was applied. Application of effect of foliar application of fertilizer Sangral thatmicro nutrients solution increases the height of plants in has great effect on vegetative growth of carnationT by 5ml/1000ml solution as compare to control followed plant, Brady and weil, [38]study the liquid NPK fertilizer2
by T (38.99cm), T (31.55cm), T (18.88cm) respectively. as a carriers of micro nutrients that is essential for3 1 o
The graphical fluctuation in plant height was shown in plant growth to increase the plant height, Anuprite et al.,figure 4.2.1. From this figure it is indicated that all [39] determined the effect of micronutrients that istreatments levels are significantly differed from each essential for vegetative growth having stimulatory andother. Results indicated that T (4000±200mg/100ml catalytic effect in physiological and metabolic process of2
solution: 5ml/1000ml solution) gained greatest height gerbera.
3
1
Table 4.2.1: Effect of Micro Nutrients on plant height of Gerbera (Gerbera jamesonii)(a) Analysis of variance (ANOVA) for plant heightSource of variation df SS MS F-valueBlock 2 65.252 32.626Treatment 3 1123.88 374.629 12.839**Error 6 168.165 28.027Total 11 1357.297**= Highly Significant(b) Comparison of mean values for plant height
Treatment Means Original Order Treatment Means Ranked OrderT 18.88 T 44.77o 2
T 31.55 T 38.991 3
T 44.77 T 31.552 1
T 38.99 T 18.883 o
Effect of micro nutrients (Zn,B,Fe,Mn) solution on height of plant in Gerbera. Vertical bars indicate S. E ± of means. To (control), T1 (5000±200 mg/100mlsolution), T2 (4000±200 mg/100ml solution), T3 (5000±200 mg/100ml solution).
Fig. 4.2.1: Effect of micro nutrients on plant height of Gerbera
0
1
2
3
4
5
6
7
8
9
To T1 T2 T3
Foliar treatments
Num
ber o
f bra
nche
s pe
r pla
nt
Am-Euras. J. Agric. & Environ. Sci., 11 (5): 736-757, 2011
748
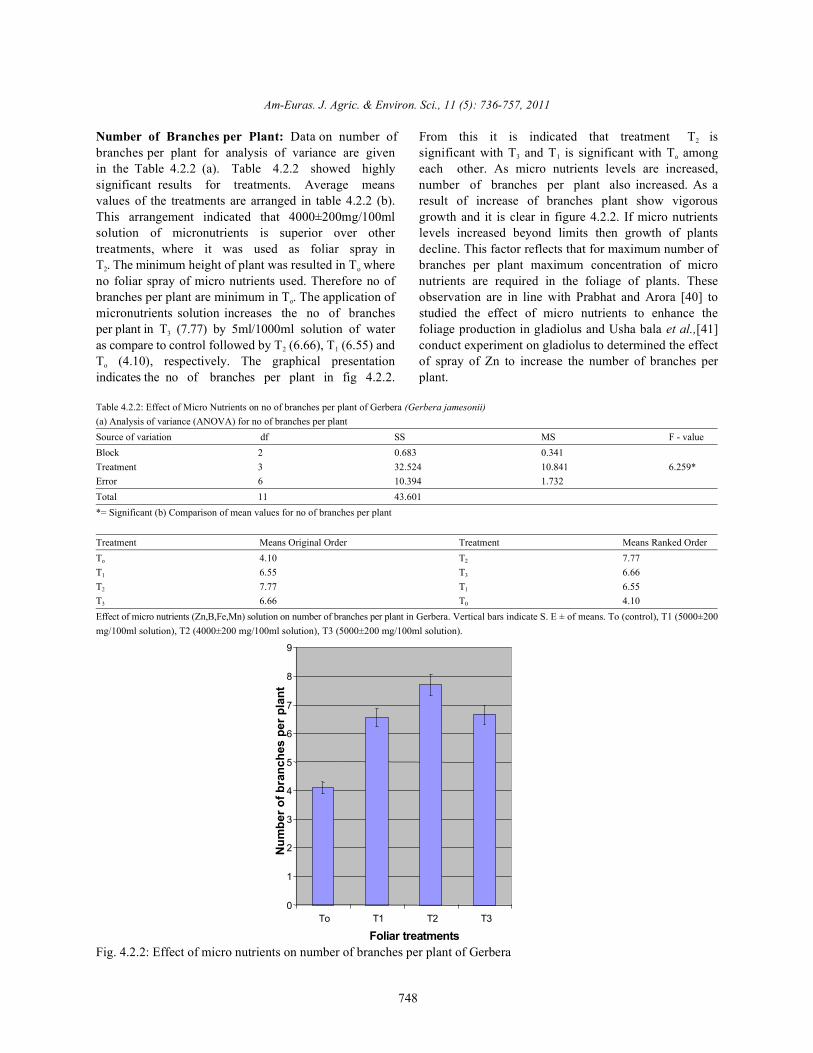
Number of Branches per Plant: Data on number of From this it is indicated that treatment T isbranches per plant for analysis of variance are given significant with T and T is significant with T amongin the Table 4.2.2 (a). Table 4.2.2 showed highly each other. As micro nutrients levels are increased,significant results for treatments. Average means number of branches per plant also increased. As avalues of the treatments are arranged in table 4.2.2 (b). result of increase of branches plant show vigorousThis arrangement indicated that 4000±200mg/100ml growth and it is clear in figure 4.2.2. If micro nutrientssolution of micronutrients is superior over other levels increased beyond limits then growth of plantstreatments, where it was used as foliar spray in decline. This factor reflects that for maximum number ofT . The minimum height of plant was resulted in T where branches per plant maximum concentration of micro2 o
no foliar spray of micro nutrients used. Therefore no of nutrients are required in the foliage of plants. Thesebranches per plant are minimum in T . The application of observation are in line with Prabhat and Arora [40] too
micronutrients solution increases the no of branches studied the effect of micro nutrients to enhance theper plant in T (7.77) by 5ml/1000ml solution of water foliage production in gladiolus and Usha bala et al.,[41]3
as compare to control followed by T (6.66), T (6.55) and conduct experiment on gladiolus to determined the effect2 1
T (4.10), respectively. The graphical presentation of spray of Zn to increase the number of branches pero
indicates the no of branches per plant in fig 4.2.2. plant.
2
3 1 o
Table 4.2.2: Effect of Micro Nutrients on no of branches per plant of Gerbera (Gerbera jamesonii)(a) Analysis of variance (ANOVA) for no of branches per plantSource of variation df SS MS F - valueBlock 2 0.683 0.341Treatment 3 32.524 10.841 6.259*Error 6 10.394 1.732Total 11 43.601*= Significant (b) Comparison of mean values for no of branches per plant
Treatment Means Original Order Treatment Means Ranked OrderT 4.10 T 7.77o 2
T 6.55 T 6.661 3
T 7.77 T 6.552 1
T 6.66 T 4.103 0
Effect of micro nutrients (Zn,B,Fe,Mn) solution on number of branches per plant in Gerbera. Vertical bars indicate S. E ± of means. To (control), T1 (5000±200mg/100ml solution), T2 (4000±200 mg/100ml solution), T3 (5000±200 mg/100ml solution).
Fig. 4.2.2: Effect of micro nutrients on number of branches per plant of Gerbera
0
5
10
15
20
25
30
35
40
To T1 T2 T3
Foliar treatments
Leng
th o
f bra
nche
s pe
r pla
nt (c
m)
Am-Euras. J. Agric. & Environ. Sci., 11 (5): 736-757, 2011
749
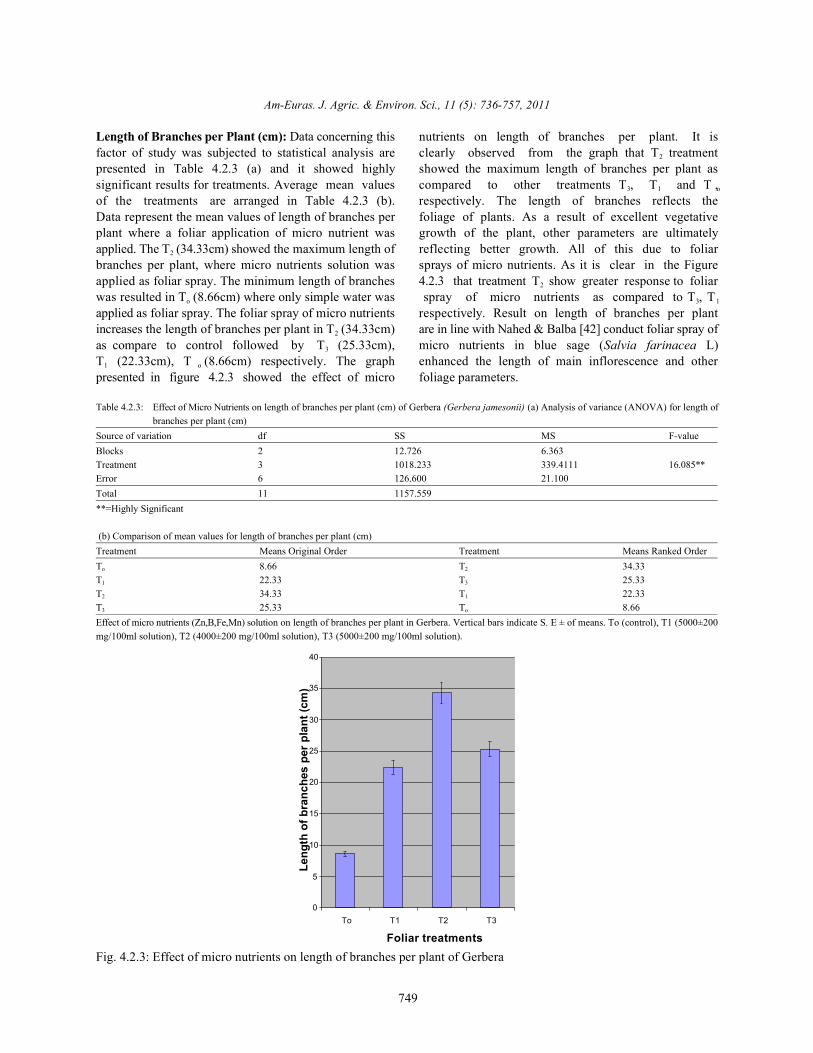
Length of Branches per Plant (cm): Data concerning this nutrients on length of branches per plant. It isfactor of study was subjected to statistical analysis are clearly observed from the graph that T treatmentpresented in Table 4.2.3 (a) and it showed highly showed the maximum length of branches per plant assignificant results for treatments. Average mean values compared to other treatments T , T and T ,of the treatments are arranged in Table 4.2.3 (b). respectively. The length of branches reflects theData represent the mean values of length of branches per foliage of plants. As a result of excellent vegetativeplant where a foliar application of micro nutrient was growth of the plant, other parameters are ultimatelyapplied. The T (34.33cm) showed the maximum length of reflecting better growth. All of this due to foliar2
branches per plant, where micro nutrients solution was sprays of micro nutrients. As it is clear in the Figureapplied as foliar spray. The minimum length of branches 4.2.3 that treatment T show greater response to foliarwas resulted in T (8.66cm) where only simple water was spray of micro nutrients as compared to T , To
applied as foliar spray. The foliar spray of micro nutrients respectively. Result on length of branches per plantincreases the length of branches per plant in T (34.33cm) are in line with Nahed & Balba [42] conduct foliar spray of2
as compare to control followed by T (25.33cm), micro nutrients in blue sage (Salvia farinacea L)3
T (22.33cm), T (8.66cm) respectively. The graph enhanced the length of main inflorescence and other1 o
presented in figure 4.2.3 showed the effect of micro foliage parameters.
2
3 1 o
2
3 1
Table 4.2.3: Effect of Micro Nutrients on length of branches per plant (cm) of Gerbera (Gerbera jamesonii) (a) Analysis of variance (ANOVA) for length ofbranches per plant (cm)
Source of variation df SS MS F-valueBlocks 2 12.726 6.363Treatment 3 1018.233 339.4111 16.085**Error 6 126.600 21.100Total 11 1157.559**=Highly Significant
(b) Comparison of mean values for length of branches per plant (cm)Treatment Means Original Order Treatment Means Ranked OrderT 8.66 T 34.33o 2
T 22.33 T 25.331 3
T 34.33 T 22.332 1
T 25.33 T 8.663 o
Effect of micro nutrients (Zn,B,Fe,Mn) solution on length of branches per plant in Gerbera. Vertical bars indicate S. E ± of means. To (control), T1 (5000±200mg/100ml solution), T2 (4000±200 mg/100ml solution), T3 (5000±200 mg/100ml solution).
Fig. 4.2.3: Effect of micro nutrients on length of branches per plant of Gerbera
0
1
2
3
4
5
6
7
8
9
To T1 T2 T3
Foliar treatments
Num
ber o
f lea
ves
per p
lant
Am-Euras. J. Agric. & Environ. Sci., 11 (5): 736-757, 2011
750
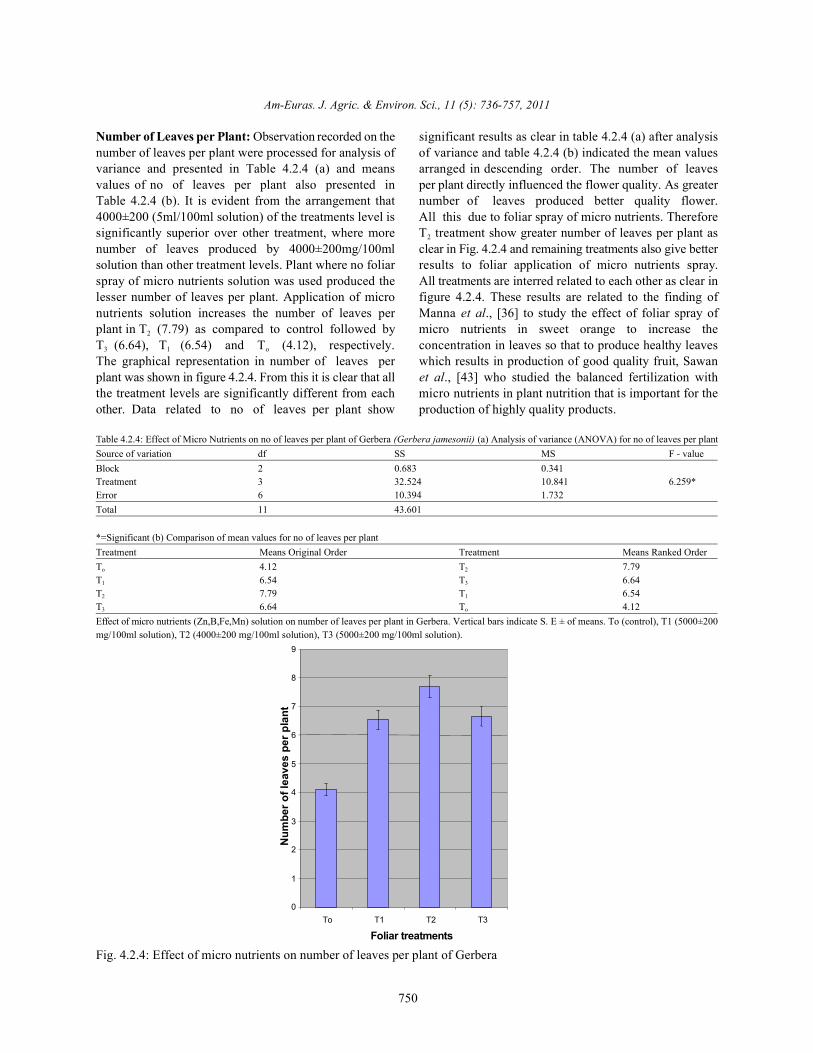
Number of Leaves per Plant: Observation recorded on the significant results as clear in table 4.2.4 (a) after analysisnumber of leaves per plant were processed for analysis of of variance and table 4.2.4 (b) indicated the mean valuesvariance and presented in Table 4.2.4 (a) and means arranged in descending order. The number of leavesvalues of no of leaves per plant also presented in per plant directly influenced the flower quality. As greaterTable 4.2.4 (b). It is evident from the arrangement that number of leaves produced better quality flower.4000±200 (5ml/100ml solution) of the treatments level is All this due to foliar spray of micro nutrients. Thereforesignificantly superior over other treatment, where more T treatment show greater number of leaves per plant asnumber of leaves produced by 4000±200mg/100ml clear in Fig. 4.2.4 and remaining treatments also give bettersolution than other treatment levels. Plant where no foliar results to foliar application of micro nutrients spray.spray of micro nutrients solution was used produced the All treatments are interred related to each other as clear inlesser number of leaves per plant. Application of micro figure 4.2.4. These results are related to the finding ofnutrients solution increases the number of leaves per Manna et al., [36] to study the effect of foliar spray ofplant in T (7.79) as compared to control followed by micro nutrients in sweet orange to increase the2
T (6.64), T (6.54) and T (4.12), respectively. concentration in leaves so that to produce healthy leaves3 1 o
The graphical representation in number of leaves per which results in production of good quality fruit, Sawanplant was shown in figure 4.2.4. From this it is clear that all et al., [43] who studied the balanced fertilization withthe treatment levels are significantly different from each micro nutrients in plant nutrition that is important for theother. Data related to no of leaves per plant show production of highly quality products.
2
Table 4.2.4: Effect of Micro Nutrients on no of leaves per plant of Gerbera (Gerbera jamesonii) (a) Analysis of variance (ANOVA) for no of leaves per plantSource of variation df SS MS F - valueBlock 2 0.683 0.341Treatment 3 32.524 10.841 6.259*Error 6 10.394 1.732Total 11 43.601
*=Significant (b) Comparison of mean values for no of leaves per plantTreatment Means Original Order Treatment Means Ranked OrderT 4.12 T 7.79o 2
T 6.54 T 6.641 3
T 7.79 T 6.542 1
T 6.64 T 4.123 o
Effect of micro nutrients (Zn,B,Fe,Mn) solution on number of leaves per plant in Gerbera. Vertical bars indicate S. E ± of means. To (control), T1 (5000±200mg/100ml solution), T2 (4000±200 mg/100ml solution), T3 (5000±200 mg/100ml solution).
Fig. 4.2.4: Effect of micro nutrients on number of leaves per plant of Gerbera
0
20
40
60
80
100
120
140
To T1 T2 T3
Foliar treatments
Leaf
are
a (c
m2)
Am-Euras. J. Agric. & Environ. Sci., 11 (5): 736-757, 2011
751
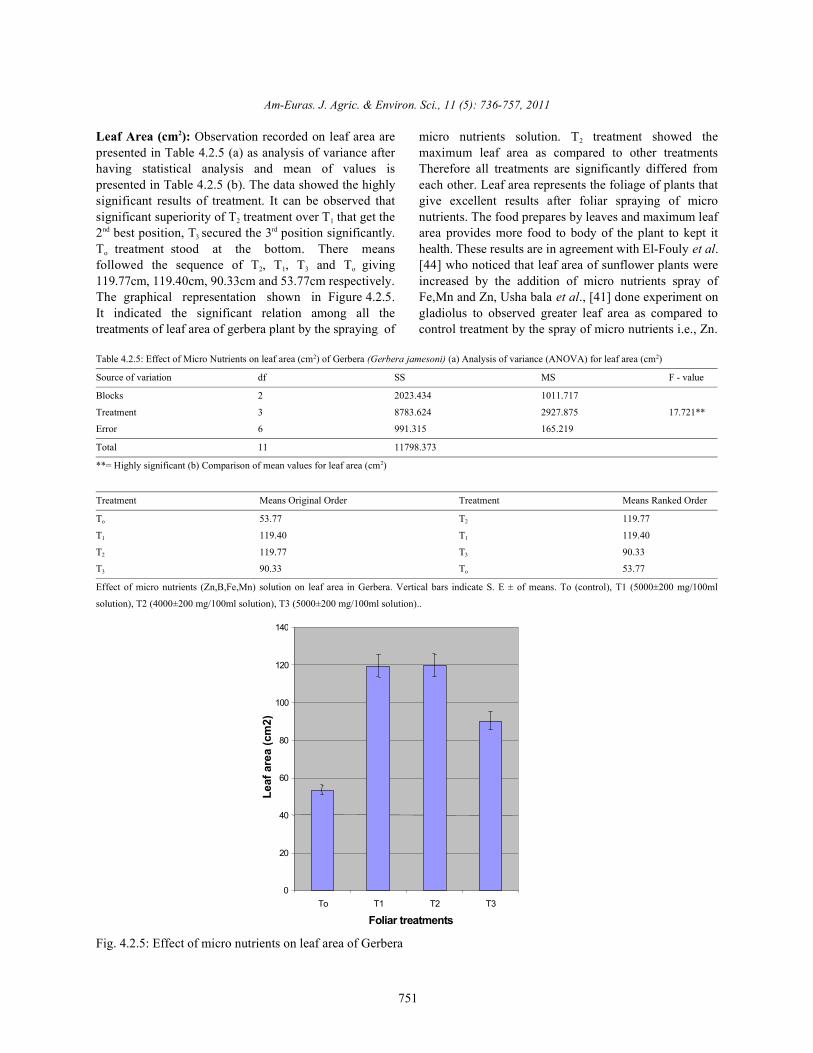
Leaf Area (cm ): Observation recorded on leaf area are micro nutrients solution. T treatment showed the2
presented in Table 4.2.5 (a) as analysis of variance after maximum leaf area as compared to other treatmentshaving statistical analysis and mean of values is Therefore all treatments are significantly differed frompresented in Table 4.2.5 (b). The data showed the highly each other. Leaf area represents the foliage of plants thatsignificant results of treatment. It can be observed that give excellent results after foliar spraying of microsignificant superiority of T treatment over T that get the nutrients. The food prepares by leaves and maximum leaf2 1
2 best position, T secured the 3 position significantly. area provides more food to body of the plant to kept itnd rd3
T treatment stood at the bottom. There means health. These results are in agreement with El-Fouly et al.o
followed the sequence of T , T , T and T giving [44] who noticed that leaf area of sunflower plants were2 1 3 o
119.77cm, 119.40cm, 90.33cm and 53.77cm respectively. increased by the addition of micro nutrients spray ofThe graphical representation shown in Figure 4.2.5. Fe,Mn and Zn, Usha bala et al., [41] done experiment onIt indicated the significant relation among all the gladiolus to observed greater leaf area as compared totreatments of leaf area of gerbera plant by the spraying of control treatment by the spray of micro nutrients i.e., Zn.
2
Table 4.2.5: Effect of Micro Nutrients on leaf area (cm ) of Gerbera (Gerbera jamesoni) (a) Analysis of variance (ANOVA) for leaf area (cm )2 2
Source of variation df SS MS F - value
Blocks 2 2023.434 1011.717
Treatment 3 8783.624 2927.875 17.721**
Error 6 991.315 165.219
Total 11 11798.373
**= Highly significant (b) Comparison of mean values for leaf area (cm )2
Treatment Means Original Order Treatment Means Ranked Order
T 53.77 T 119.77o 2
T 119.40 T 119.401 1
T 119.77 T 90.332 3
T 90.33 T 53.773 o
Effect of micro nutrients (Zn,B,Fe,Mn) solution on leaf area in Gerbera. Vertical bars indicate S. E ± of means. To (control), T1 (5000±200 mg/100ml
solution), T2 (4000±200 mg/100ml solution), T3 (5000±200 mg/100ml solution)..
Fig. 4.2.5: Effect of micro nutrients on leaf area of Gerbera
0
5
10
15
20
25
30
35
40
45
50
To T1 T2 T3
Foliar treatments
Stoc
k le
ngth
(cm
)
Am-Euras. J. Agric. & Environ. Sci., 11 (5): 736-757, 2011
752
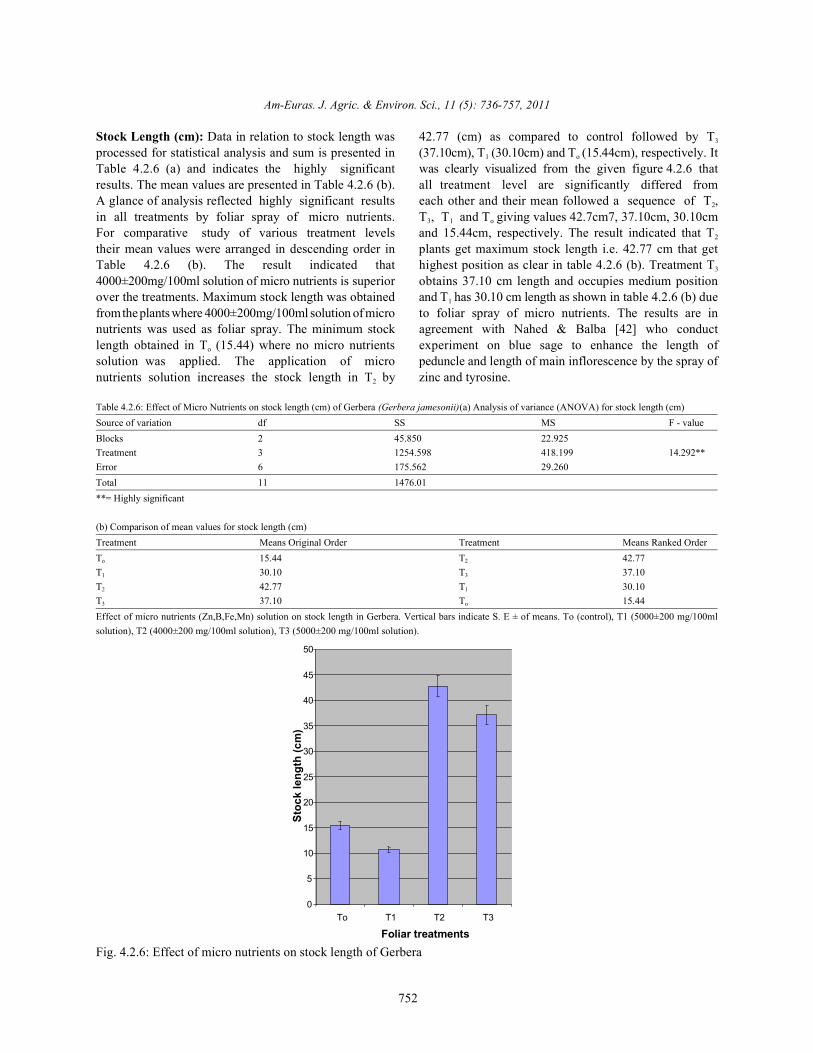
Stock Length (cm): Data in relation to stock length was 42.77 (cm) as compared to control followed by Tprocessed for statistical analysis and sum is presented in (37.10cm), T (30.10cm) and T (15.44cm), respectively. ItTable 4.2.6 (a) and indicates the highly significant was clearly visualized from the given figure 4.2.6 thatresults. The mean values are presented in Table 4.2.6 (b). all treatment level are significantly differed fromA glance of analysis reflected highly significant results each other and their mean followed a sequence of T ,in all treatments by foliar spray of micro nutrients. T , T and T giving values 42.7cm7, 37.10cm, 30.10cmFor comparative study of various treatment levels and 15.44cm, respectively. The result indicated that Ttheir mean values were arranged in descending order in plants get maximum stock length i.e. 42.77 cm that getTable 4.2.6 (b). The result indicated that highest position as clear in table 4.2.6 (b). Treatment T4000±200mg/100ml solution of micro nutrients is superior obtains 37.10 cm length and occupies medium positionover the treatments. Maximum stock length was obtained and T has 30.10 cm length as shown in table 4.2.6 (b) duefrom the plants where 4000±200mg/100ml solution of micro to foliar spray of micro nutrients. The results are innutrients was used as foliar spray. The minimum stock agreement with Nahed & Balba [42] who conductlength obtained in T (15.44) where no micro nutrients experiment on blue sage to enhance the length ofo
solution was applied. The application of micro peduncle and length of main inflorescence by the spray ofnutrients solution increases the stock length in T by zinc and tyrosine.2
3
1 o
2
3 1 o
2
3
1
Table 4.2.6: Effect of Micro Nutrients on stock length (cm) of Gerbera (Gerbera jamesonii)(a) Analysis of variance (ANOVA) for stock length (cm)Source of variation df SS MS F - valueBlocks 2 45.850 22.925Treatment 3 1254.598 418.199 14.292**Error 6 175.562 29.260Total 11 1476.01**= Highly significant
(b) Comparison of mean values for stock length (cm)Treatment Means Original Order Treatment Means Ranked OrderT 15.44 T 42.77o 2
T 30.10 T 37.101 3
T 42.77 T 30.102 1
T 37.10 T 15.443 o
Effect of micro nutrients (Zn,B,Fe,Mn) solution on stock length in Gerbera. Vertical bars indicate S. E ± of means. To (control), T1 (5000±200 mg/100mlsolution), T2 (4000±200 mg/100ml solution), T3 (5000±200 mg/100ml solution).
Fig. 4.2.6: Effect of micro nutrients on stock length of Gerbera
0
20
40
60
80
100
120
To T1 T2 T3
Foliar treatments
Day
s to
firs
t flo
wer
em
erge
nce
Am-Euras. J. Agric. & Environ. Sci., 11 (5): 736-757, 2011
753
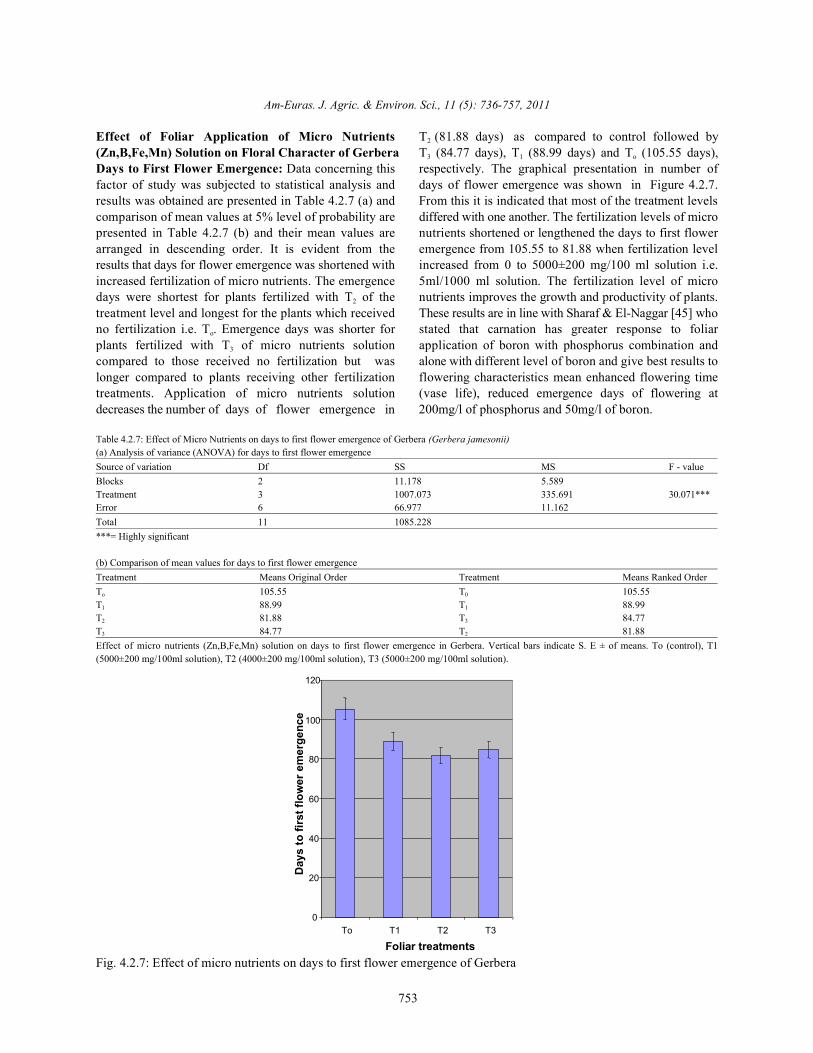
Effect of Foliar Application of Micro Nutrients T (81.88 days) as compared to control followed by(Zn,B,Fe,Mn) Solution on Floral Character of Gerbera T (84.77 days), T (88.99 days) and T (105.55 days),Days to First Flower Emergence: Data concerning this respectively. The graphical presentation in number offactor of study was subjected to statistical analysis and days of flower emergence was shown in Figure 4.2.7.results was obtained are presented in Table 4.2.7 (a) and From this it is indicated that most of the treatment levelscomparison of mean values at 5% level of probability are differed with one another. The fertilization levels of micropresented in Table 4.2.7 (b) and their mean values are nutrients shortened or lengthened the days to first flowerarranged in descending order. It is evident from the emergence from 105.55 to 81.88 when fertilization levelresults that days for flower emergence was shortened with increased from 0 to 5000±200 mg/100 ml solution i.e.increased fertilization of micro nutrients. The emergence 5ml/1000 ml solution. The fertilization level of microdays were shortest for plants fertilized with T of the nutrients improves the growth and productivity of plants.2
treatment level and longest for the plants which received These results are in line with Sharaf & El-Naggar [45] whono fertilization i.e. T . Emergence days was shorter for stated that carnation has greater response to foliaro
plants fertilized with T of micro nutrients solution application of boron with phosphorus combination and3
compared to those received no fertilization but was alone with different level of boron and give best results tolonger compared to plants receiving other fertilization flowering characteristics mean enhanced flowering timetreatments. Application of micro nutrients solution (vase life), reduced emergence days of flowering atdecreases the number of days of flower emergence in 200mg/l of phosphorus and 50mg/l of boron.
2
3 1 o
Table 4.2.7: Effect of Micro Nutrients on days to first flower emergence of Gerbera (Gerbera jamesonii)(a) Analysis of variance (ANOVA) for days to first flower emergenceSource of variation Df SS MS F - valueBlocks 2 11.178 5.589Treatment 3 1007.073 335.691 30.071***Error 6 66.977 11.162Total 11 1085.228***= Highly significant
(b) Comparison of mean values for days to first flower emergenceTreatment Means Original Order Treatment Means Ranked OrderT 105.55 T 105.55o 0
T 88.99 T 88.991 1
T 81.88 T 84.772 3
T 84.77 T 81.883 2
Effect of micro nutrients (Zn,B,Fe,Mn) solution on days to first flower emergence in Gerbera. Vertical bars indicate S. E ± of means. To (control), T1(5000±200 mg/100ml solution), T2 (4000±200 mg/100ml solution), T3 (5000±200 mg/100ml solution).
Fig. 4.2.7: Effect of micro nutrients on days to first flower emergence of Gerbera
0
1
2
3
4
5
6
7
8
9
To T1 T2 T3Foliar treatments
Flow
er d
iam
eter
(cm
)
Am-Euras. J. Agric. & Environ. Sci., 11 (5): 736-757, 2011
754
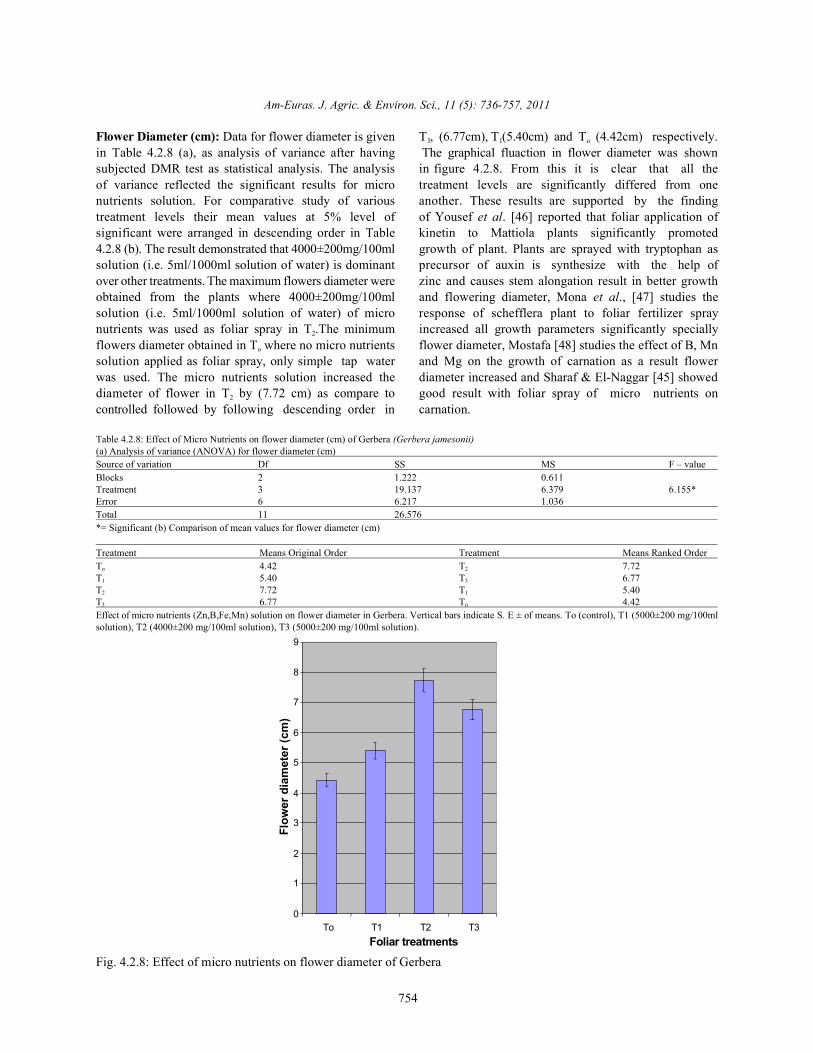
Flower Diameter (cm): Data for flower diameter is given T , (6.77cm), T (5.40cm) and T (4.42cm) respectively.in Table 4.2.8 (a), as analysis of variance after having The graphical fluaction in flower diameter was shownsubjected DMR test as statistical analysis. The analysis in figure 4.2.8. From this it is clear that all theof variance reflected the significant results for micro treatment levels are significantly differed from onenutrients solution. For comparative study of various another. These results are supported by the findingtreatment levels their mean values at 5% level of of Yousef et al. [46] reported that foliar application ofsignificant were arranged in descending order in Table kinetin to Mattiola plants significantly promoted4.2.8 (b). The result demonstrated that 4000±200mg/100ml growth of plant. Plants are sprayed with tryptophan assolution (i.e. 5ml/1000ml solution of water) is dominant precursor of auxin is synthesize with the help ofover other treatments. The maximum flowers diameter were zinc and causes stem alongation result in better growthobtained from the plants where 4000±200mg/100ml and flowering diameter, Mona et al., [47] studies thesolution (i.e. 5ml/1000ml solution of water) of micro response of schefflera plant to foliar fertilizer spraynutrients was used as foliar spray in T .The minimum increased all growth parameters significantly specially2
flowers diameter obtained in T where no micro nutrients flower diameter, Mostafa [48] studies the effect of B, Mno
solution applied as foliar spray, only simple tap water and Mg on the growth of carnation as a result flowerwas used. The micro nutrients solution increased the diameter increased and Sharaf & El-Naggar [45] showeddiameter of flower in T by (7.72 cm) as compare to good result with foliar spray of micro nutrients on2
controlled followed by following descending order in carnation.
3 1 o
Table 4.2.8: Effect of Micro Nutrients on flower diameter (cm) of Gerbera (Gerbera jamesonii)(a) Analysis of variance (ANOVA) for flower diameter (cm)Source of variation Df SS MS F – valueBlocks 2 1.222 0.611Treatment 3 19.137 6.379 6.155*Error 6 6.217 1.036Total 11 26.576*= Significant (b) Comparison of mean values for flower diameter (cm)
Treatment Means Original Order Treatment Means Ranked OrderT 4.42 T 7.72o 2
T 5.40 T 6.771 3
T 7.72 T 5.402 1
T 6.77 T 4.423 o
Effect of micro nutrients (Zn,B,Fe,Mn) solution on flower diameter in Gerbera. Vertical bars indicate S. E ± of means. To (control), T1 (5000±200 mg/100mlsolution), T2 (4000±200 mg/100ml solution), T3 (5000±200 mg/100ml solution).
Fig. 4.2.8: Effect of micro nutrients on flower diameter of Gerbera
0
1
2
3
4
5
6
To T1 T2 T3
Foliar treatments
Flow
er q
ualit
y
Am-Euras. J. Agric. & Environ. Sci., 11 (5): 736-757, 2011
755
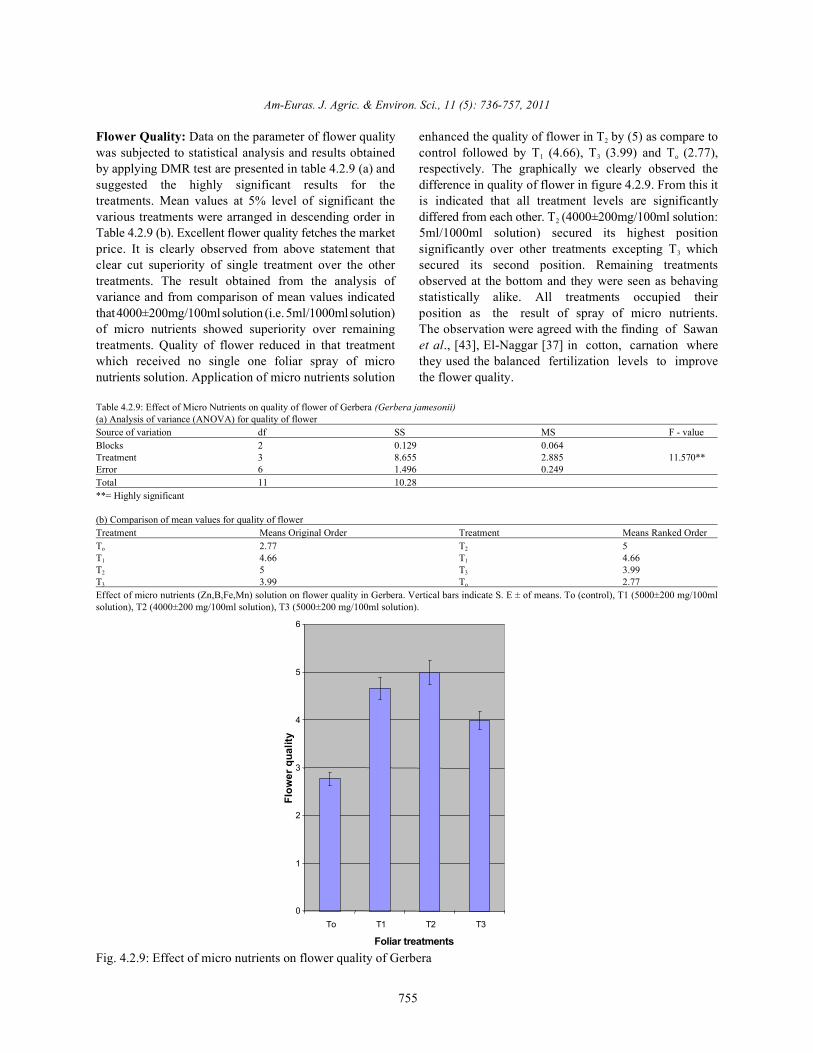
Flower Quality: Data on the parameter of flower quality enhanced the quality of flower in T by (5) as compare towas subjected to statistical analysis and results obtained control followed by T (4.66), T (3.99) and T (2.77),by applying DMR test are presented in table 4.2.9 (a) and respectively. The graphically we clearly observed thesuggested the highly significant results for the difference in quality of flower in figure 4.2.9. From this ittreatments. Mean values at 5% level of significant the is indicated that all treatment levels are significantlyvarious treatments were arranged in descending order in differed from each other. T (4000±200mg/100ml solution:Table 4.2.9 (b). Excellent flower quality fetches the market 5ml/1000ml solution) secured its highest positionprice. It is clearly observed from above statement that significantly over other treatments excepting T whichclear cut superiority of single treatment over the other secured its second position. Remaining treatmentstreatments. The result obtained from the analysis of observed at the bottom and they were seen as behavingvariance and from comparison of mean values indicated statistically alike. All treatments occupied theirthat4000±200mg/100ml solution (i.e. 5ml/1000ml solution) position as the result of spray of micro nutrients.of micro nutrients showed superiority over remaining The observation were agreed with the finding of Sawantreatments. Quality of flower reduced in that treatment et al., [43], El-Naggar [37] in cotton, carnation wherewhich received no single one foliar spray of micro they used the balanced fertilization levels to improvenutrients solution. Application of micro nutrients solution the flower quality.
2
1 3 o
2
3
Table 4.2.9: Effect of Micro Nutrients on quality of flower of Gerbera (Gerbera jamesonii)(a) Analysis of variance (ANOVA) for quality of flowerSource of variation df SS MS F - valueBlocks 2 0.129 0.064Treatment 3 8.655 2.885 11.570**Error 6 1.496 0.249Total 11 10.28**= Highly significant
(b) Comparison of mean values for quality of flowerTreatment Means Original Order Treatment Means Ranked OrderT 2.77 T 5o 2
T 4.66 T 4.661 1
T 5 T 3.992 3
T 3.99 T 2.773 o
Effect of micro nutrients (Zn,B,Fe,Mn) solution on flower quality in Gerbera. Vertical bars indicate S. E ± of means. To (control), T1 (5000±200 mg/100mlsolution), T2 (4000±200 mg/100ml solution), T3 (5000±200 mg/100ml solution).
Fig. 4.2.9: Effect of micro nutrients on flower quality of Gerbera
Am-Euras. J. Agric. & Environ. Sci., 11 (5): 736-757, 2011
756
REFERENCES 16. Baumgrarat, J.P., 1997. Every man’s flowers the
1. Tjia, B. and J.N. Joiner, 1984. Growing gerberas. 17. Roy, R.K., S.C. Sharma and A.N. Sharga, 1995. EffectGreenhouse Manager, 3(6): 67, 70, 73-75. of foliar nutrition on vegetative and floral characters
2. Tjia, B., R.J. Black and S. Park-Brown, 2008. Gerberas of gladiolus. J. Orn. Hort., 31: 41-44.for Florida. CIR527. Gainesville: University of Florida 18. Nahed, G., 2006. Stimulatory effect of NPK fertilizerInstitute of Food and Agricultural Sciences. and benzyladenine on the growth and chemicalhttp://edis.ifas.ufl.edu/mg034. constituents of Codiaeum variegatum L. plant. J.
3. Clay, H., 1983. Gerberas. Georgia Coop. Ext. Serv. Lft Agric & Environ. Sci., 2(6): 711-719.L 368. 19. Dick, L.W. and G.C. Wilson, 1996. A liquid feeding
4. Singh, A.K., 2006. Flower Crops Cultivation and technique for plant of Escallonia marantha. Hort.Management. New India Publishing Agency. Res., 17(2): 107-109.Pitampuram, New Delhi. 20. Frett, J.J., M.A. Dirr and A.M. Armitage, 1995.
5. Rehman, F., 2004. An article on Rose Cut Nitrogen and calcium nutrition of petunia x hybrida.Flowers published in Farming Outlook January- Oral. Sea. Scientia. Horti., 26(4): 351-359.March 2004. 21. Javaid, Q.A., N.A. Abbasi, I.A. Hafiz and A.L.
6. Jacqueline. 2010. Gerbera jamesonii (Barberton Mughal, 2005. Performance of zinnia (Zinnia elegans)Daisy), in an Explosion of Dazzling Colors. John & Dahlia flowered Crimson shade by application ofJacq’s Garden. June. NPK fertilizer. Int. J. of Agri. and Bio., 7(3): 474-476.
7. Choudhary, M.L. and K.V. Prasad, 2000. Protected 22. Qasim, M., A. Iftikhar and N. Azhar, 2003. Influencecultivation of ornamental crops – An insight. Ind. of various nitrogen level on growth and biomass ofHort., 45(1): 49-53. Jasminum sambac. Pak. Agri. Sci., 40(3-4).
8. Pimple, A.G., S.R. Dalal, D.R. Nandre, S.M. Ghawade 23. Gohar, A.K, S. Muhammad and Amanullah, 2007.and Swarupa Utgikar, 2006. Yield and quality of Response of Dhalia (Dhalia pinnata) to differentgerbera influenced by N & P levels under poly house levels of nitrogen alone and in combination withconditions. Internet J. agric. Sci., 2(2): 320-321. constant doses of phosphorus and potassium. Am.
9. George, K., 2003. Foliar fertilization. Appropriate Eurasian J. Sustain. Agric., 1(1): 25-31.Technology Transfer for Rular Areas. 24. Gohar, A.K., S. Muhammad and Amanullah, 2007.<www.attra.ncat.org > Response of Dhalia (Dhalia pinnata) to different
10. Silberbush, L.F., 2002. Response of maize to foliar vs. levels of nitrogen alone and in combination withsoil application of nitrogen-phosphorus-potassium constant doses of phosphorus and potassium. Am.fertilizers. J. Plant Nutrition., 25(11): 2333-2342. Eurasian J. Sustain. Agric., 1(1): 25-31.
11. Naruka, I.S., K.D. Gujar and G. Lal, 2000. Effect of 25. Zhang, D., R.E. Moran and L.B. Stack, 2004. Effect offoliar application of zinc and molybdenum on growth Phosphorus fertilization on growth and flowering andand yield of okra (Abelmoschus esculentus L. Scaevola aemula R. Br. ‘New wonder’. Hort. Sci.,Moench) cv. Pusa sawani. Haryana. J. Hort. Sci., 39(7): 1728-1731.29(3/4): 266-267. 26. Azza, A.M., A.A. Mazhar. and M.Z. SAHAR, 2005.
12. Verma. V.K., O.P. Sehgal and S.R. Shiman, 2000. Effect Influence of foliar application of potassium onof nitrogen and GA3 on carnation J. Orna. Hortic., growth and chemical composition of Bauhinia3(1): 64,3 ref. variegata seedling under different irrigation
13. Jitendra, K., M. Amin and P.V. Singh, 2003. Effect of intervals. J. Agric. Sci., 3(1): 23-31.Mn and Zn sprays on carnation. J. of Orna. Horti. 27. Shah, A., S.B. Lal and J.N. Seth, 1984. Effect ofNew Series. 6(1): 83-88. different levels of nitrogen and phosphorus on
14. Steel, R.G.D., J.H. Torrie and D.A. Dicky, 1997. growth, flowering and corm yield of gladiolus, cv.Principles and Procedures of Statistics.3 Ed. Vink’s Glory progressive Hort., 16(4/4): 305-307.rd
McGraw Hill Book Co. Inc., New York. 28. Damake, M.M. and S.K. Bhattacharjee, 2000.15. Scagel, B.I.G., C.F. Fuchigami. And R.P. Regan, 2007. Relationship between flower yield, flower character
difference in growth, nitrogen uptake and storage and weather parameters as influenced by NPKbetween two container-grown Rhododendron fertilization in Super Star roses. J. of Orn. Hort. Newcultivars. J. Environ. Hort., 25: 13-20. Series, 3(2): 83-86.
Dhalia bulbs for summer bloom. pp: 113-129.
Am-Euras. J. Agric. & Environ. Sci., 11 (5): 736-757, 2011
757
29. Jamwal, M., A.M. Parmar, R.L. Mishra and 40. Prabhat Kumar and J.S. Arora, 2000. Effect ofD.B. Singh, 2008. effect of foliar application of urea micronutrients on gladiolus. J. Orna. Hort., 3(2): 91-93.on floral growth of gladiolus cv. American beauty. 41. Usha Bala, T., R. Chadra Sekhar and Y.N. Reddy,Agricultura-Stiinta si practica. nr, 3-4: 67-68. 2006. Effect of pre-harvest sprays of zinc and planting
30. Singatkar, S.S., R.B. Sawant, S.A. Ranpise and time on flowering. Flower quality and Vase life ofK.N. Warhal, 1995. Effect of different levels of N, P Gladiolus cultivars. J. Res. Angrau., 34(3): 8-12.and K on growth and flower production of gallardia. 42. Nahed Abd El-Aziz, G. and L.K. Balbaa, 2007.J. Maharashtra. Agric. Univ., 20(3): 392-394. Influence of tyrosine and zinc on growth, flowering
31. Verma, V.K., 2003. Response of foliar application and chemical constituents of Salvia farinacea plants.of nitrogen and gibberelic acid on growth and J. Appl. Sci. Res., 3(11): 1479-1489.flowering of Dianthus caryothyllus L. Him. J. Agric. 43. Sawan, Z.M., S.A. Hafez and A.E. Basyony, 2001.Res., 29(1&2): 59-64. Effect of phosphorus fertilization and foliar
32. Ahmad, I., T. Ahmad, M.S. Zafar and A. Nadeem, application of chelated zinc and calcium on seed,2007. Response of an elite cultivar of Zinnia protein and oil yields and oil properties of cotton. J.(Zinnia elegans cv. Gian Dahlia flowered) to Agric. Sci., 136: 191-198.varying levels of nitrogenous fertilizer . Sarhad J. 44. El-Fouly, M.M., O.A. Nofal and Z.M. Mobarak, 2001.Agric., 23(2): 309-313. Effects of soil treatment with iron, manganese and
33. Singh, B., 2003. Foliar application of fertilizer mixtures zinc on growth and micronutrient uptake of sunflowerfor chrysanthemum. Sou. Ind. Hort., pp: 873-877. plants grown in high-pH soil. J. of Agro and Crop Sci.
34. Bhallaeharyee, S.K., 1985. The response of Jasminum 186(4): 245-251.grandiflorum to N, P O and K O fertilization. 45. Sharaf, A.I. and A.H. El-Naggar, 2003. Response2 5 2
Singapore J. of primary industries, 31(3): 102-111. of carnation plant to phosphorus and boron foliar35. Poole, R.T. and B.A. Greave, 1989. Nitrogen fertilization under greenhouse conditions. Alex. J.
Phosphorous and Potassium fertilization of Agric. Res., 48(1): 147-158.Anthurium andreanum Nitta and Kaumona. 46. Youssef, A.A., H. Mona Mahgoub and M. ImanTropical region of M.Sc. Hort. Sci., 13: 367-372. Talaat, 2004. Physiological and Biochemical and
36. Manna, M.S., J.S. Josan, G.S. Chohan and V.K. Vij, aspects of Matthola incana L. plants under the effect1985. Effect of foliar application of micronutriens of puterscine and kinetin treatments. Egypt J. Appl.on leaf composition, fruit yield and quality of Sci., 19(9B).sweet orange (Citrus sinensis L.). C.V. Blood red. 47. Mona, M.H., El-Quesni, M.E. Fatima andInd. J. Hort., 42: 45-49. M.M. Kandil, 2010. Response of vegetative growth
37. El-Naggar, A.H., 2009. Response of Dianthus and chemical constituents of Schefflera arboricola L.caryophyllus L. Plants to Foliar Nutrition. World J. plant to foliar application of inorganic fertilizer (growof Agric. Sci., 5(5): 622-630. more) and ammonium nitrate at Nubaria. Ozean. J. of
38. Brady, C. and R. Weil, 2000. Elements of the Nature Appl. Sci., 3(1): 177-184.and Properties of Soil. Upper saddle Rover, New 48. Mostafa, M.M., 1996. Effect of boron, manganeseJersy: Prentise-Hill. Inc. and magnesium fertilization on carnation plants.
39. Anuprita, H., S.R. Jadhav, R.D. Dalal and Rajeshwari Alexandria J. of Agric. Res., 41(3): 109-122.P. Deshmukh, 2005. Effect of micronutrients ongrowth and flower production of Gerbera under polyhouse conditions. Adv. Pl. Sci., 18(II): 755-758.