Embed Size (px)
Citation preview

Agricultural Economics Report No. 413 February 1999
Effect of Hard Red Spring WheatConsistency on Milling Value
Bruce L. Dahl William W. Wilson
Department of Agricultural Economics !! Agricultural Experiment Station North Dakota State University !! Fargo, ND 58105-5636
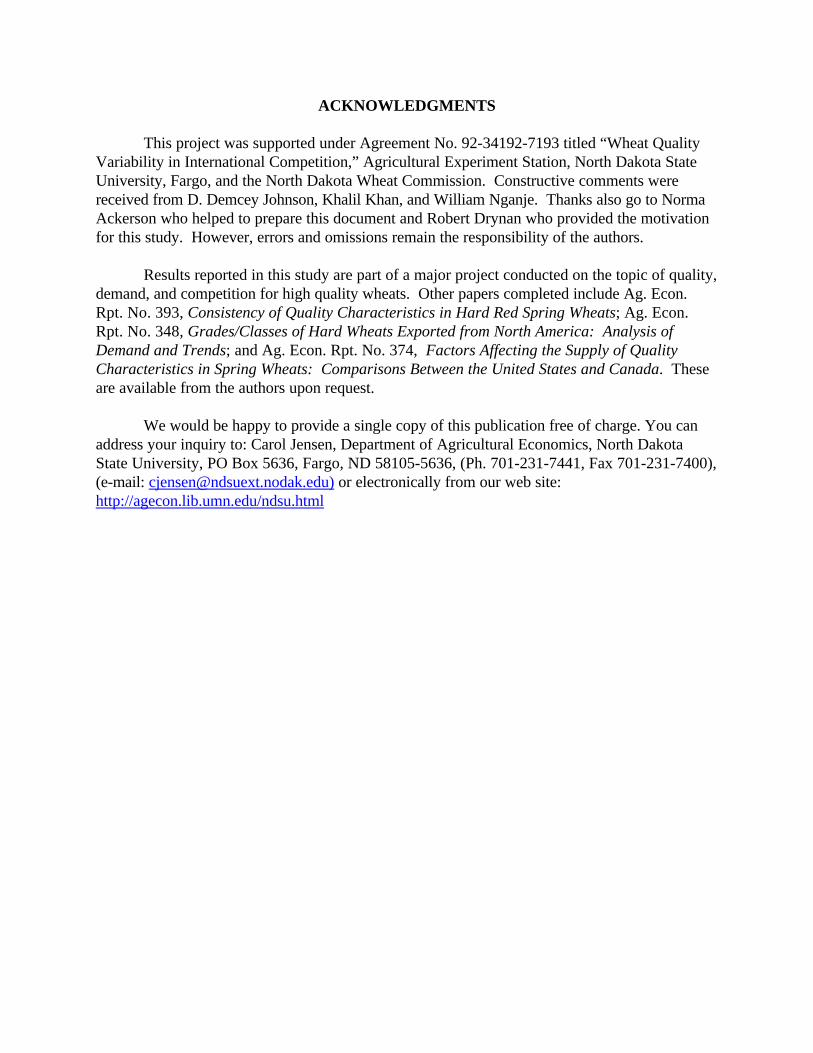
ACKNOWLEDGMENTS
This project was supported under Agreement No. 92-34192-7193 titled “Wheat QualityVariability in International Competition,” Agricultural Experiment Station, North Dakota StateUniversity, Fargo, and the North Dakota Wheat Commission. Constructive comments werereceived from D. Demcey Johnson, Khalil Khan, and William Nganje. Thanks also go to NormaAckerson who helped to prepare this document and Robert Drynan who provided the motivationfor this study. However, errors and omissions remain the responsibility of the authors.
Results reported in this study are part of a major project conducted on the topic of quality,demand, and competition for high quality wheats. Other papers completed include Ag. Econ.Rpt. No. 393, Consistency of Quality Characteristics in Hard Red Spring Wheats; Ag. Econ.Rpt. No. 348, Grades/Classes of Hard Wheats Exported from North America: Analysis ofDemand and Trends; and Ag. Econ. Rpt. No. 374, Factors Affecting the Supply of QualityCharacteristics in Spring Wheats: Comparisons Between the United States and Canada. Theseare available from the authors upon request.
We would be happy to provide a single copy of this publication free of charge. You canaddress your inquiry to: Carol Jensen, Department of Agricultural Economics, North DakotaState University, PO Box 5636, Fargo, ND 58105-5636, (Ph. 701-231-7441, Fax 701-231-7400),(e-mail: [email protected]) or electronically from our web site:http://agecon.lib.umn.edu/ndsu.html

i
TABLE OF CONTENTS
List of Tables . . . . . . . . . . . . . . . . . . . . . . . . . . . . . . . . . . . . . . . . . . . . . . . . . . . . . . . . . . . . . . . ii
List of Figures . . . . . . . . . . . . . . . . . . . . . . . . . . . . . . . . . . . . . . . . . . . . . . . . . . . . . . . . . . . . . iii
List of Appendix Tables . . . . . . . . . . . . . . . . . . . . . . . . . . . . . . . . . . . . . . . . . . . . . . . . . . . . . . vi
ABSTRACT . . . . . . . . . . . . . . . . . . . . . . . . . . . . . . . . . . . . . . . . . . . . . . . . . . . . . . . . . . . . . . vii
HIGHLIGHTS . . . . . . . . . . . . . . . . . . . . . . . . . . . . . . . . . . . . . . . . . . . . . . . . . . . . . . . . . . . viii
INTRODUCTION . . . . . . . . . . . . . . . . . . . . . . . . . . . . . . . . . . . . . . . . . . . . . . . . . . . . . . . . . . 1
BACKGROUND . . . . . . . . . . . . . . . . . . . . . . . . . . . . . . . . . . . . . . . . . . . . . . . . . . . . . . . . . . . . 1
MODEL DEVELOPMENT . . . . . . . . . . . . . . . . . . . . . . . . . . . . . . . . . . . . . . . . . . . . . . . . . . . 2Net Wheat Price . . . . . . . . . . . . . . . . . . . . . . . . . . . . . . . . . . . . . . . . . . . . . . . . . . . . . . . 6Millable Wheat Index . . . . . . . . . . . . . . . . . . . . . . . . . . . . . . . . . . . . . . . . . . . . . . . . . . . 7Value Added by Milling . . . . . . . . . . . . . . . . . . . . . . . . . . . . . . . . . . . . . . . . . . . . . . . . . 7Stochastic Analysis of Consistency . . . . . . . . . . . . . . . . . . . . . . . . . . . . . . . . . . . . . . . . . 9
DATA 9
RESULTS . . . . . . . . . . . . . . . . . . . . . . . . . . . . . . . . . . . . . . . . . . . . . . . . . . . . . . . . . . . . . . . . 15Base Case . . . . . . . . . . . . . . . . . . . . . . . . . . . . . . . . . . . . . . . . . . . . . . . . . . . . . . . . . . 15Sensitivity . . . . . . . . . . . . . . . . . . . . . . . . . . . . . . . . . . . . . . . . . . . . . . . . . . . . . . . . . . 17Sensitivity of Base Case Parameters . . . . . . . . . . . . . . . . . . . . . . . . . . . . . . . . . . . . . . . 20Limited Dockage Case . . . . . . . . . . . . . . . . . . . . . . . . . . . . . . . . . . . . . . . . . . . . . . . . . 24Comparison to HRW . . . . . . . . . . . . . . . . . . . . . . . . . . . . . . . . . . . . . . . . . . . . . . . . . . 25
CONCLUSIONS AND IMPLICATIONS . . . . . . . . . . . . . . . . . . . . . . . . . . . . . . . . . . . . . . . . 37
REFERENCES . . . . . . . . . . . . . . . . . . . . . . . . . . . . . . . . . . . . . . . . . . . . . . . . . . . . . . . . . . . . 39
ii
List of Tables
Table Page
1 Estimated Net Wheat Prices by Level of Foreign Material, Shrunken andBroken, Dockage, and Moisture (Base Price= $150/MT) . . . . . . . . . . . . . . . . . . . . . . . . 6
2 Value Added Estimation Example . . . . . . . . . . . . . . . . . . . . . . . . . . . . . . . . . . . . . . . . . 8
3 Correlation of Selected Quality Characteristics for HRS Export Shipments,by Grade, 1985-1997 . . . . . . . . . . . . . . . . . . . . . . . . . . . . . . . . . . . . . . . . . . . . . . . . . . 14
4 Prices and Milling Parameters for Base Case Simulations (United Arab Emirates) . . . . 14
5 Base Case Results for U.S. No. 1 and No. 2 OB HRS Exports . . . . . . . . . . . . . . . . . . . 17
6 Correlation of Selected Wheat Quality Characteristics and EstimatedValuations (Base Case) . . . . . . . . . . . . . . . . . . . . . . . . . . . . . . . . . . . . . . . . . . . . . . . . 18
7 Correlation of Selected Quality Characteristics for HRW Export Shipments,by Grade, 1985-1997 . . . . . . . . . . . . . . . . . . . . . . . . . . . . . . . . . . . . . . . . . . . . . . . . . . 28
8 Correlation of Input Distributions with Estimated Values for Millable WheatIndex Scores . . . . . . . . . . . . . . . . . . . . . . . . . . . . . . . . . . . . . . . . . . . . . . . . . . . . . . . . 28
9 Prices and Milling Parameters for Venezuela and Mexico . . . . . . . . . . . . . . . . . . . . . . . 35
iii
List of Figures
Figure Page
1 Average Moisture for Exports of HRS, by Grade, 1986/87 to 1996/97 . . . . . . . . . . . . . . 3
2 Between Shipment Variability of Moisture for Exports of HRS, by Grade,1986/87 to 1996/97 . . . . . . . . . . . . . . . . . . . . . . . . . . . . . . . . . . . . . . . . . . . . . . . . . . . . 3
3 Average Foreign Material for Exports of HRS, by Grade, 1985/86 to 1996/97 . . . . . . . . 4
4 Between Shipment Variability of Foreign Material for Exports of HRS,by Grade, 1985/86 to 1996/97 . . . . . . . . . . . . . . . . . . . . . . . . . . . . . . . . . . . . . . . . . . . . 4
5 Average Shrunken and Broken Kernels for Exports of HRS, by Grade,1985/86 to 1996/97 . . . . . . . . . . . . . . . . . . . . . . . . . . . . . . . . . . . . . . . . . . . . . . . . . . . . 5
6 Between Shipment Variability of Shrunken and Broken Kernels for Exportsof HRS, by Grade, 1985/86 to 1996/97 . . . . . . . . . . . . . . . . . . . . . . . . . . . . . . . . . . . . . 5
7 Dockage of No. 1 HRS: Comparison of Input Distribution and Logistic . . . . . . . . . . . . 10
8 Dockage of No. 2 OB HRS: Comparison of Input Distribution and Erlang . . . . . . . . . . 10
9 Moisture of No. 1 HRS: Comparison of Input Distribution and Triangular . . . . . . . . . . 11
10 Moisture of No. 2 OB HRS: Comparison of Input Distribution and Beta . . . . . . . . . . . 11
11 Shrunken and Broken Kernels of No. 1 HRS: Comparison of Input Distribution and Logistic . . . . . . . . . . . . . . . . . . . . . . . . . . . . . . . . . . . . . . . . . . . . . . . 12
12 Shrunken and Broken Kernels of No. 2 OB HRS: Comparison of InputDistribution and Weibull . . . . . . . . . . . . . . . . . . . . . . . . . . . . . . . . . . . . . . . . . . . . . . . . 12
13 Foreign Material of No. 1 HRS: Comparison of Input Distributionand Logistic . . . . . . . . . . . . . . . . . . . . . . . . . . . . . . . . . . . . . . . . . . . . . . . . . . . . . . . . . 13
14 Foreign Material of No. 2 OB HRS: Comparison of Input Distribution and Beta . . . . . . . . . . . . . . . . . . . . . . . . . . . . . . . . . . . . . . . . . . . . . . . . . . . . . . . . . . . 13
15 Distribution of Net Wheat Price for Exports of HRS, by Grade: Base Case . . . . . . . . . 18
16 Distribution of Value Added in Milling for Exports of HRS,by Grade: Base Case . . . . . . . . . . . . . . . . . . . . . . . . . . . . . . . . . . . . . . . . . . . . . . . . . . 19

iv
List of Figures continued
Figure Page
17 Distribution of Millable Wheat Index Scores for Exports of HRS, by Grade: Base Case . . . . . . . . . . . . . . . . . . . . . . . . . . . . . . . . . . . . . . . . . . . . . . . . . . 19
18 Sensitivity of Average Value Added in Milling to Changes in Price Spreads,Flour Extraction, and Product and By-Product Prices, No. 1 HRS . . . . . . . . . . . . . . . . 22
19 Sensitivity of Variability for Value Added in Milling to Changes in PriceSpreads, Flour Extraction, and Product and By-Product Prices, No. 1 HRS . . . . . . . . . 22
20 Sensitivity of Variability of Value Added in Milling for Changes in theStandard Deviations of the Distribution of Quality Characteristics, No. 1 HRS . . . . . . . 23
21 Sensitivity of Variability of Value Added in Milling for Changes in the StandardDeviations of the Distributions of Quality Characteristics, No. 2 OB HRS . . . . . . . . . . 23
22 Sensitivity of the Variability of Net Wheat Prices to Changes in the StandardDeviations of the Distributions of Wheat Characteristics, No. 1 and No. 2 OB HRS . . . . . . . . . . . . . . . . . . . . . . . . . . . . . . . . . . . . . . . . . . . . . . 24
23 Distribution of Net Wheat for Selected Dockage Levels of HRS, by Grade . . . . . . . . . 26
24 Distribution of Net Wheat Price for Selected Dockage Levels of HRS,by Grade . . . . . . . . . . . . . . . . . . . . . . . . . . . . . . . . . . . . . . . . . . . . . . . . . . . . . . . . . . . 26
25 Distribution of Millable Wheat Index Scores for Selected Dockage Levelsof HRS, by Grade . . . . . . . . . . . . . . . . . . . . . . . . . . . . . . . . . . . . . . . . . . . . . . . . . . . . 27
26 Distribution of Value Added In Milling for Selected Dockage Levels of HRS, by Grade . . . . . . . . . . . . . . . . . . . . . . . . . . . . . . . . . . . . . . . . . . . . . . . . . . . . 27
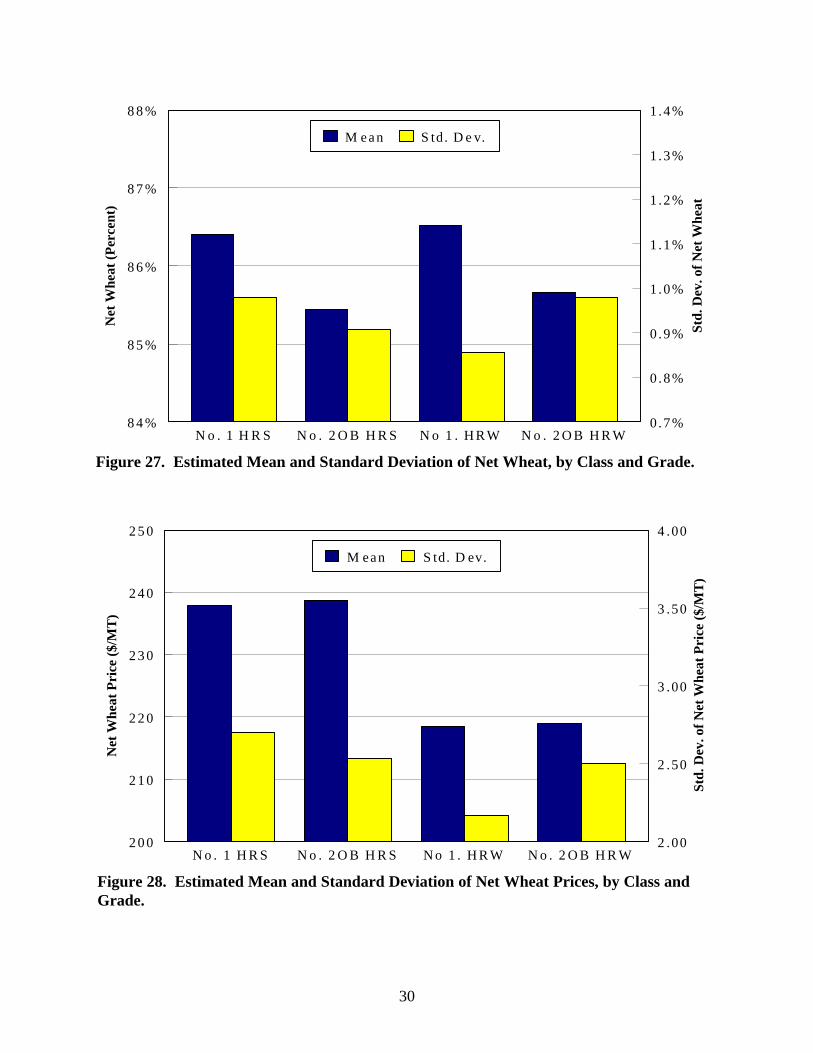
27 Estimated Mean and Standard Deviation of Net Wheat, by Class and Grade . . . . . . . . . 30
28 Estimated Mean and Standard Deviation of Net Wheat Prices, by Class andGrade . . . . . . . . . . . . . . . . . . . . . . . . . . . . . . . . . . . . . . . . . . . . . . . . . . . . . . . . . . . . . . 30
29 Estimated Mean and Standard Deviation of Millable Wheat Index Scores,by Class and Grade . . . . . . . . . . . . . . . . . . . . . . . . . . . . . . . . . . . . . . . . . . . . . . . . . . . 31
30 Estimated Mean and Standard Deviation of Value Added in Milling,by Class and Grade . . . . . . . . . . . . . . . . . . . . . . . . . . . . . . . . . . . . . . . . . . . . . . . . . . . 31
v
List of Figures continued
Figure Page
31 Comparison of the Distribution of Net Wheat for Korea and all HRSExports, by Grade . . . . . . . . . . . . . . . . . . . . . . . . . . . . . . . . . . . . . . . . . . . . . . . . . . . . 32
32 Comparison of the Distribution of Millable Wheat Index Scores for Koreaand All HRS Exports, by Grade . . . . . . . . . . . . . . . . . . . . . . . . . . . . . . . . . . . . . . . . . . 32
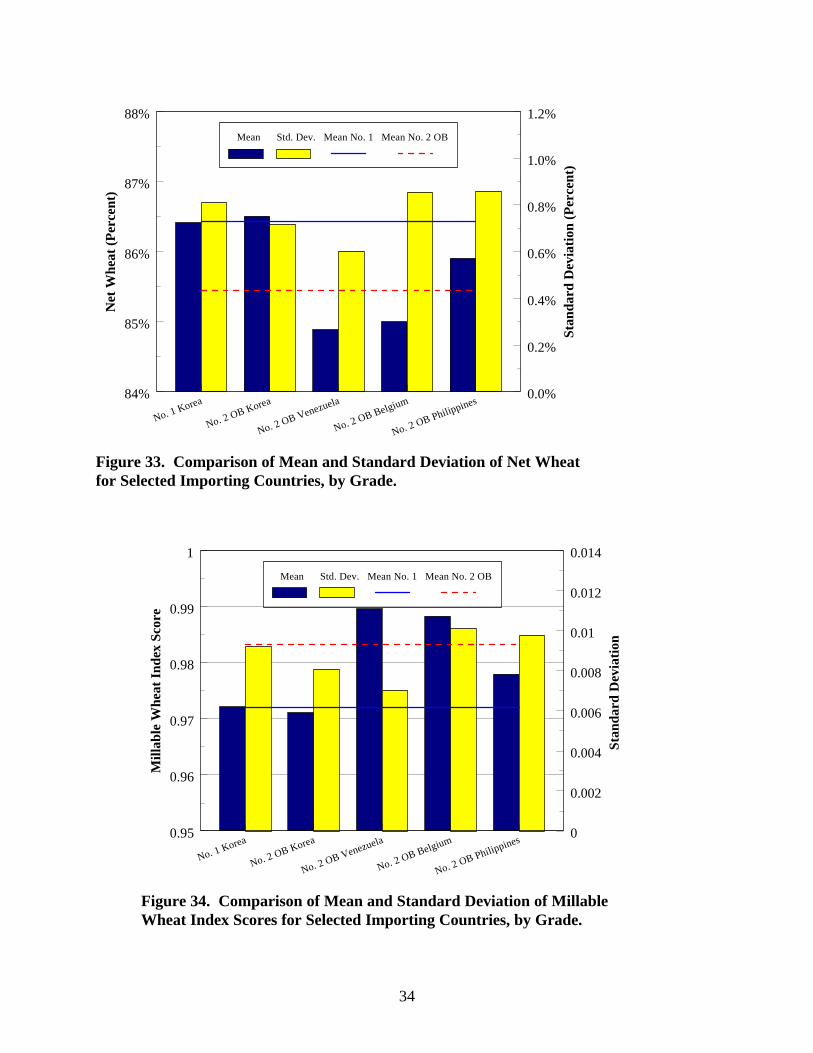
33 Comparison of Mean and Standard Deviation of Net Wheat for SelectedImporting Countries, by Grade . . . . . . . . . . . . . . . . . . . . . . . . . . . . . . . . . . . . . . . . . . . 34
34 Comparison of Mean and Standard Deviation of Millable Wheat IndexScores for Selected Importing Countries, by Grade . . . . . . . . . . . . . . . . . . . . . . . . . . . 34
35 Comparison of Value Added: Base Case and for Venezuela . . . . . . . . . . . . . . . . . . . . . 36
36 Comparison of Value Added: Base Case No. 2 OB HRW and for Mexico . . . . . . . . . . 36

vi
List of Appendix Tables
Table Page
1 Estimated Distribution Parameters and Test Statistics for SelectedCharacteristics of HRS No. 1 Export Shipments, 1985/86-1996/97 . . . . . . . . . . . . . . . 41
2 Estimated Distribution Parameters and Test Statistics for SelectedCharacteristics of HRS No. 2 OB Export Shipments, 1985/86-1996/97 . . . . . . . . . . . . 41
3 Estimated Distribution Parameters and Test Statistics for SelectedCharacteristics of HRW No. 1 Export Shipments, 1985/86-1996/97 . . . . . . . . . . . . . . . 42
4 Estimated Distribution Parameters and Test Statistics for SelectedCharacteristics of HRW No. 2 OB Export Shipments, 1985/86-1996/97 . . . . . . . . . . . 42
5 Estimated Distribution Parameters and Test Statistics for SelectedCharacteristics of HRS No. 1 Export Shipments to Korea, 1985/86-1996/97 . . . . . . . . . . . . . . . . . . . . . . . . . . . . . . . . . . . . . . . . . . . . . . . . . . . . . 43
6 Estimated Distribution Parameters and Test Statistics for SelectedCharacteristics of HRS No. 2 OB Export Shipments to Korea, 1985/86-1996/97 . . . . . . . . . . . . . . . . . . . . . . . . . . . . . . . . . . . . . . . . . . . . . . . . . . . . . 43
7 Estimated Distribution Parameters and Test Statistics for SelectedCharacteristics of HRS No. 2 OB Export Shipments to Venezuela, 1985/86-1996/97 . . . . . . . . . . . . . . . . . . . . . . . . . . . . . . . . . . . . . . . . . . . . . . . . . . . . . 44
8 Estimated Distribution Parameters and Test Statistics for SelectedCharacteristics of HRS No. 2 OB Export Shipments to Philippines, 1985/86-1996/97 . . . . . . . . . . . . . . . . . . . . . . . . . . . . . . . . . . . . . . . . . . . . . . . . . . . . . 44
9 Estimated Distribution Parameters and Test Statistics for SelectedCharacteristics of HRS No. 2 OB Export Shipments to Belgium, 1985/86-1996/97 . . . . . . . . . . . . . . . . . . . . . . . . . . . . . . . . . . . . . . . . . . . . . . . . . . . . . 45
10 Correlation of Selected Quality Characteristics for HRS ExportShipments to Korea, by Grade, 1985-1997 . . . . . . . . . . . . . . . . . . . . . . . . . . . . . . . . . . 45
11 Correlation of Selected Quality Characteristics for HRS ExportShipments to Selected Importing Countries, by Grade, 1985-1997 . . . . . . . . . . . . . . . . 46
vii
ABSTRACT
Increased concerns over the quality of wheat in domestic and export markets has focusedattention on the consistency of wheat quality. This study utilized three measures to examine theeffect of variability in characteristics on the milling value of wheat. Distributions and correlationsfor wheat quality characteristics were estimated from U.S. wheat export data from 1985-1997. Effects of variability of wheat characteristics on the value of wheat to the miller for each of thethree measures were estimated using a simulation model.
U.S. No. 1 exports of Hard Red Spring (HRS) had higher value to millers on each of thethree measures (net wheat, millable wheat index, and value added in milling) than did exports ofNo. 2 or better (OB). However, the value to millers of No. 1 HRS was more variable than forNo. 2 OB HRS, likely due to a larger negative correlation between the levels of moisture andshrunken and broken kernels in exports of No. 2 OB HRS than No. 1 HRS. Further, the value ofwheat to millers for each of the three measures varied substantially by importing country. Sensitivity analysis indicated that increases in the consistency of moisture would provide thegreatest reduction in the variability of value to millers, while increases in the consistency offoreign material, shrunken and broken kernels, and dockage had lesser impacts. This suggeststhat millers looking to increase the value of wheat lots used in milling may want to consideradding restrictions/incentives on moisture to limit the variability from lot to lot. However fordockage, shrunken and broken kernels, and foreign material, the focus should be on actual levelswithin lots rather than variability between lots.
Key Words: quality consistency, wheat, net wheat, millable wheat value index, milling value, HRS, HRW
viii
HIGHLIGHTS
Increased concerns over the quality of wheat in domestic and export markets has focusedattention on the consistency of wheat quality. This study utilized three measures to examine theeffect of variability in characteristics on the milling value of wheat. Distributions and correlationsfor wheat quality characteristics were estimated from U.S. wheat export data from 1985-1997. Effects of variability of wheat characteristics on the value of wheat to the miller for each of thethree measures were estimated using a simulation model.
Effects of the variability of wheat characteristics were simulated for the millable wheatindex, net wheat price, and the value added in milling. Estimated results for exports of Hard RedSpring (HRS) by grade indicated No. 1 HRS had about 1% more clean tempered wheat than didNo. 2 or Better (OB). This translated into a lower wheat index score for No. 1 (0.97) than No. 2OB (0.98) suggesting that the actual cost of milling No. 1 HRS was lower in relation to its pricethan was the cost of milling No. 2 OB. Results for the net wheat price were similar to those forthe millable wheat index. Differences in the amount of millable wheat overshadowed the pricespread in the base case between No. 1 and No. 2 OB so that millers would pay less for the actualnet wheat in No. 1 ($237.84) than in No. 2 OB ($238.78). Additionally, the results for the valueadded in milling also indicated a higher value for No. 1 HRS ($78.57) than for No. 2 OB (77.44). However, counter to what was expected, the variability of all three measures was higher for No. 1HRS than for No. 2 OB.
Results for No. 1 HRS for all three measures were highly correlated with the moisturecontent, while results for No. 2 OB were correlated with moisture and to a lesser degree, dockageand foreign material. This was borne out by sensitivity analysis conducted on the variability ofdistributions for each of the wheat quality characteristics for both No. 1 and No. 2 OB HRS. Thesensitivity analysis indicated that increases in the consistency of moisture would provide thegreatest reduction in the variability of value as measured by net wheat prices and the value addedin milling. Increases in the consistency of foreign material, shrunken and broken kernels, anddockage had lesser impacts on the variability of net wheat prices and the value added in milling. This suggests that millers looking to increase the value of wheat lots used in milling may want toconsider adding restrictions on moisture to limit the variability from lot to lot; however fordockage, shrunken and broken kernels, and foreign material, the focus should be on actual levelswithin lots rather than variability between lots.
Comparison of base case results for high (1.0%) and low (0.5%) dockage samples of HRSindicated that differences in net wheat, millable wheat index score, and value added in millingbetween grades were larger than differences between high and low dockage samples for a grade. Reduction of dockage for No. 1 HRS increased the average profit in milling by $0.77/MT.However, average net wheat prices for the high dockage No. 1 and the low dockage No. 2 OBwere similar.
Comparison across individual importing countries indicated that the amount of net wheatand millable wheat index scores varied by importer. Simulated net wheat for HRS exports toKorea was the highest of the countries examined and had similar variability across grades. Venezuela had the lowest net wheat of all the countries examined, but was also the most

ix
consistent. Belgium imports also had low net wheat and was also one of the most variable ofindividual importing countries examined.
Evaluation of value to millers for Hard Red Winter (HRW) by grade showed higher valuefor millers for No. 1 HRW than No. 2 OB. This is similar to the results for HRS; however,variability of net wheat prices, millable wheat index scores, and value added in milling were lowerfor No. 1 HRW than for No. 2 OB. This higher value and lower variability for No. 1 than No. 2OB in HRW is counter to the higher value and higher variability for No. 1 than No. 2 OB HRS. This may be due in part to differences in correlations between quality characteristics between thetwo classes. Specifically, in HRS, No. 1 had a smaller negative correlation between moisture andthe level of shrunken and broken kernels than did No. 2 OB, whereas in HRW, No. 1 had a largernegative correlation between moisture and shrunken and broken kernels than did No. 2 OB. Thisrelationship indicates the effect of higher (lower) levels of moisture are offset more often in lotsof No. 2 OB HRS and No. 1 HRW by lower (higher) levels of shrunken and broken kernels thanfor draws for the other grade within each class.
Variability of the value added in milling was compared for two importing countries, bothof which imported No. 2 OB wheats (HRS for Venezuela and HRW for Mexico). Of interest isthat even though Venezuela imported wheat that could be considered lower quality (in that it hadhigher levels of defects), the variability of the value added was lower for Venezuela than for thebase case for No. 2 OB HRS. In contrast, the variability of the value added for Mexico waslarger than for all exports of No. 2 OB HRW.
Variability in dockage, moisture, shrunken and broken kernels, and foreign material affectthe value of wheat to millers for each of the three measures examined. However, the extent ofthese impacts varies across importing countries. This study considered only the effects ofvariability in wheat characteristics on the milling value of wheat. This ignores the effects ofvariability in end-use quality factors on the quality of flour produced, which can be substantial.

* Research Scientist and Professor, respectively, in the Department of AgriculturalEconomics, North Dakota State University, Fargo.
Effect of Hard Red Spring Wheat Consistency on Milling Value
Bruce L. Dahl and William W. Wilson *
INTRODUCTION
Increasingly, the consistency of wheat exports has been identified as a concern by severalstudies in both domestic (Minnesota Association of Wheat Growers and Minnesota WheatResearch & Promotion Council) and export markets (Stevens and Rowan, U.S. Congress - OTA,Mercier, Grains Council of Australia). This concern has focused on the level and consistency ofwheat quality and end-use factors. The degree of variability of wheat quality characteristics hasbeen documented at different stages in the marketing chain (Dahl and Wilson, 1998). Qualityinconsistency of wheat characteristics affects both the miller and the end-user. Inconsistency inwheat characteristics affects the quantity and mix of flour and by-products that an end-userobtains from a given lot of wheat. Further, inconsistency in end-use quality characteristics canaffect both the miller and end-user by changing the quality of flour produced.
This study examines the effect of variability of wheat characteristics on the value of wheatto the miller. Different measures for valuation of wheat to the miller are applied and resultscontrasted across grades, classes, and for individual importers. Only the effects of variability inwheat characteristics on the quantity and mix of flour and by-products obtained from a lot ofwheat are examined. Effects of variability on end-use quality characteristics were beyond thescope of this study.
BACKGROUND
There have been numerous studies on grain quality in recent years. Most of these havefocused on hedonic types of analysis (deriving implicit values for characteristics) and factorsaffecting the quality level (Wilson (1989), Veeman, Wilson and Preszler (1993a, b), and Uri andHyberg). Other studies have analyzed the extent and effect of differentiation in the world wheattrade (Larue and Lapan, Veeman, Wilson and Gallagher, Wilson (1989, 1994), and Wilson andPreszler (1993a, b)). Models have been developed and applied to incorporate uncertainty inhedonic pricing in the animal science literature (St. Pierre and Harvey). Wilson and Preszler(1993 a, b), and Johnson et al. developed models which also incorporate uncertainty in qualitycharacteristics.
Several methods have been advanced for the valuation of wheat. These methods havebeen advanced as tools to control variability and increase milling and end-use quality by providingincentives to producers and grain handlers. Herrman and Baker, 1998 developed a doughprediction method. This method uses a composite dough score based on the amount of flourextraction and mixograph absorption in a lot of wheat. Thus, the score represents an indication ofthe amount of dough that could be obtained from a lot of wheat. Some discussions in the wheatmarketing industry have focused on the purchase of wheat on a net moisture basis. Flagg, 1998argued that rather than pricing on a dry moisture basis, wheat should be priced with moisture,

1 This is similar to valuation of corn on a dry moisture basis which has been advanced anumber of times in the early 1900's and again in 1982, Hill (1990, p. 284-285).
2
foreign material, shrunken and broken, and damaged kernels treated as dockage.1 Then theseitems should either 1) not be paid for or 2) be priced at the market value for feed wheat.
Dahl and Wilson found average dockage levels for exports of No. 1 HRS have beendeclining (from 0.91 percent in 1987/88 to a low of 0.44 percent in 1996/97). In contrast,dockage levels for exports of No. 2 OB HRS have generally been higher than those for No. 1. Average dockage levels for No. 2 OB HRS ranged from 0.70 percent to 0.85 percent from1988/89 to 1996/97. Variability of dockage levels between shipments of No. 1 and No. 2 OBHRS were largely similar from 1985/86 to 1996/97. Variability of dockage levels betweenshipments measured by standard deviations ranged from a high of 0.33 percent in 1993/94 to alow of 0.11 percent in 1988/89 for No. 1 HRS and from a high of 0.41 percent in 1985/86 to alow of 0.12 percent in 1990/91 for No. 2 OB HRS. Dahl and Wilson also found a decline invariability of dockage within shipments of No. 1 HRS. The average within-shipment range (highsublot - low sublot) of dockage declined from 0.51 percent in 1987/88 to 0.19 percent in 1996/97.
Dahl and Wilson also examined levels and variability of foreign material, shrunken andbroken kernels, and moisture. Only levels and variability of shrunken and broken were reported. Levels for all three factors were lower for No. 1 than No. 2 OB (Figures 1-4). Howevervariability between shipments of shrunken and broken kernels for No. 1 HRS has been increasingand is higher than variability of shipments of No. 2 OB. Variability of moisture levels for No. 1HRS exports have become increased in the 1990s and are higher than No. 2 OB HRS (Figures 1-2).
MODEL DEVELOPMENT
The value of wheat to the miller is affected by a number of factors beyond the base price. Dockage, foreign material, shrunken and broken kernels, and moisture content affect the value ofa lot of wheat to millers by increasing shipment costs, reducing the amount of millable materialpurchased, increasing the amount of by-products produced, etc. Drynan developed three methodsof calculating the value of wheat to millers that consider the effects of differences in these factors. His formulations include 1) buying on a “net wheat” price, 2) valuing wheat lots based on amillable wheat index, and 3) valuation of lots based on the net profit (value added) in milling. Thenext sections develop each of these alternate valuation formulations.

3
8 6 8 7 8 8 8 9 9 0 9 1 9 2 9 3 9 4 9 5 9 69
1 0
1 1
1 2
1 3
1 4
M a r k e t i n g Y e a r
Moi
stur
e (%
)H R S 1
H R S 2 O B
Figure 1. Average Moisture for Exports of HRS, by Grade, 1986/87 to 1996/97.
8 6 8 7 8 8 8 9 9 0 9 1 9 2 9 3 9 4 9 5 9 60
1
2
3
4
5
6
M a r k e t i n g Y e a r
Stan
dard
Dev
iati
on o
f M
oist
ure
H R S 1
H R S 2 O B
Figure 2. Between Shipment Variability of Moisture for Exports of HRS, by Grade,1986/87 to 1996/97.

4
8 5 8 6 8 7 8 8 8 9 9 0 9 1 9 2 9 3 9 4 9 5 9 60 .1
0 .15
0 .2
0 .25
0 .3
0 .35
0 .4
0 .45
M a r k e t i n g Y e a r
For
eign
Mat
eria
l (%
)
H R S 1
H R S 2 O B
Figure 3. Average Foreign Material for Exports of HRS, by Grade, 1985/86 to 1996/97.
8 5 8 6 8 7 8 8 8 9 9 0 9 1 9 2 9 3 9 4 9 5 9 60
0 .05
0 .1
0 .15
0 .2
0 .25
M a r k e t i n g Y e a r
Stan
dard
Dev
iati
on o
f F
orei
gn M
ater
ial
H R S 1
H R S 2 O B
Figure 4. Between Shipment Variability of Foreign Material for Exports of HRS, byGrade, 1985/86 to 1996/97.

5
8 5 8 6 8 7 8 8 8 9 9 0 9 1 9 2 9 3 9 4 9 5 9 61
1 .2
1 .4
1 .6
1 .8
2
M a r k e t i n g Y e a r
Shru
nken
and
Bro
ken
(%)
H R S 1
H R S 2 O B
Figure 5. Average Shrunken and Broken Kernels for Exports of HRS, by Grade, 1985/86to 1996/97.
8 5 8 6 8 7 8 8 8 9 9 0 9 1 9 2 9 3 9 4 9 5 9 60
0 .2
0 .4
0 .6
0 .8
1
M a r k e t i n g Y e a r
Stan
dard
Dev
iati
on-S
hrun
ken
and
Bro
ken
H R S 1
H R S 2 O B
Figure 6. Between Shipment Variability of Shrunken and Broken Kernels for Exports ofHRS, by Grade, 1985/86 to 1996/97.
6
Net Wheat Price
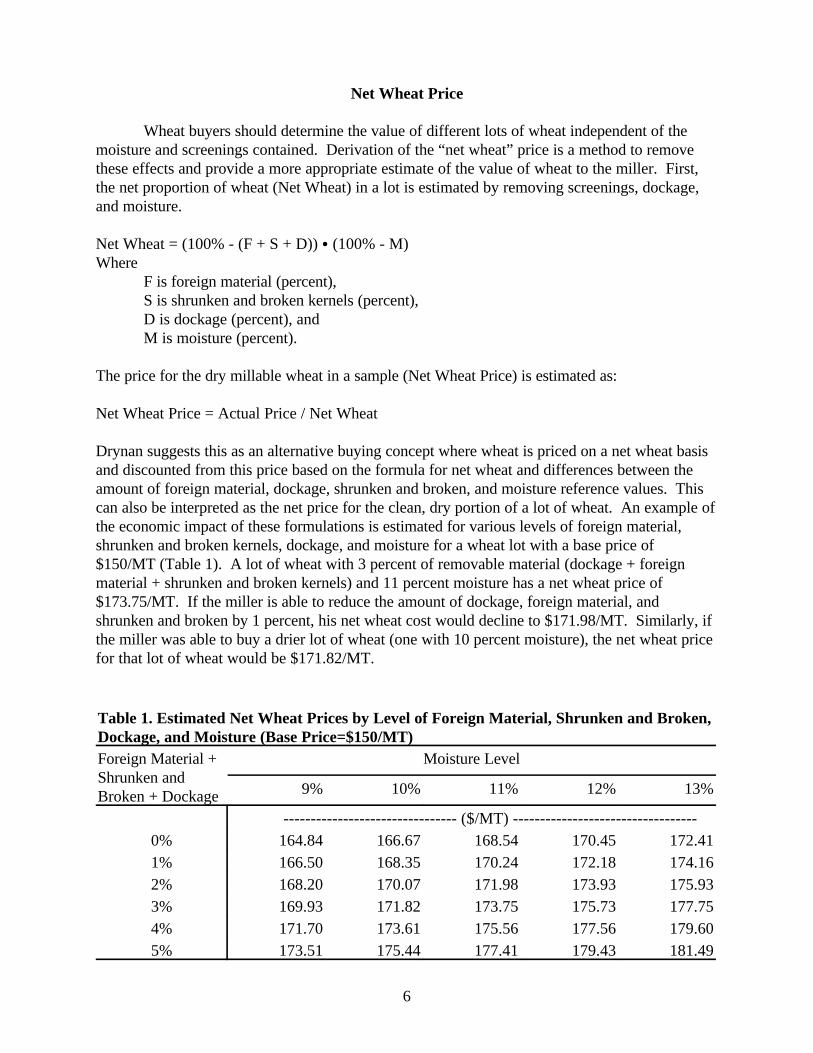
Wheat buyers should determine the value of different lots of wheat independent of themoisture and screenings contained. Derivation of the “net wheat” price is a method to removethese effects and provide a more appropriate estimate of the value of wheat to the miller. First,the net proportion of wheat (Net Wheat) in a lot is estimated by removing screenings, dockage,and moisture.
Net Wheat = (100% - (F + S + D)) C (100% - M)Where
F is foreign material (percent),S is shrunken and broken kernels (percent),D is dockage (percent), andM is moisture (percent).
The price for the dry millable wheat in a sample (Net Wheat Price) is estimated as:
Net Wheat Price = Actual Price / Net Wheat
Drynan suggests this as an alternative buying concept where wheat is priced on a net wheat basisand discounted from this price based on the formula for net wheat and differences between theamount of foreign material, dockage, shrunken and broken, and moisture reference values. Thiscan also be interpreted as the net price for the clean, dry portion of a lot of wheat. An example ofthe economic impact of these formulations is estimated for various levels of foreign material,shrunken and broken kernels, dockage, and moisture for a wheat lot with a base price of$150/MT (Table 1). A lot of wheat with 3 percent of removable material (dockage + foreignmaterial + shrunken and broken kernels) and 11 percent moisture has a net wheat price of$173.75/MT. If the miller is able to reduce the amount of dockage, foreign material, andshrunken and broken by 1 percent, his net wheat cost would decline to $171.98/MT. Similarly, ifthe miller was able to buy a drier lot of wheat (one with 10 percent moisture), the net wheat pricefor that lot of wheat would be $171.82/MT.
Table 1. Estimated Net Wheat Prices by Level of Foreign Material, Shrunken and Broken,Dockage, and Moisture (Base Price=$150/MT)Foreign Material +Shrunken andBroken + Dockage
Moisture Level
9% 10% 11% 12% 13%
-------------------------------- ($/MT) ---------------------------------- 0% 164.84 166.67 168.54 170.45 172.411% 166.50 168.35 170.24 172.18 174.162% 168.20 170.07 171.98 173.93 175.933% 169.93 171.82 173.75 175.73 177.754% 171.70 173.61 175.56 177.56 179.605% 173.51 175.44 177.41 179.43 181.49
7
AVA'TotalRevenue&WheatCost'(P1×Y1)%(P2×Y2)%(P3×Y3)%...(Pn×Yn)&WheatCost
Millable Wheat Index
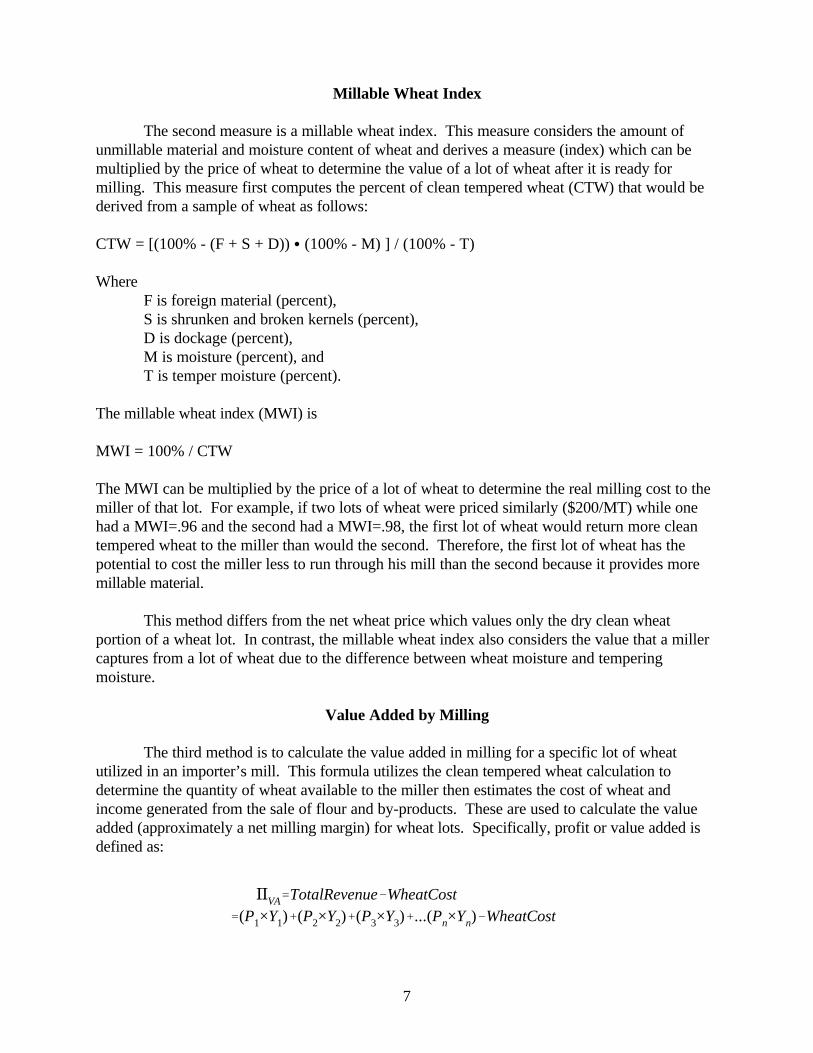
The second measure is a millable wheat index. This measure considers the amount ofunmillable material and moisture content of wheat and derives a measure (index) which can bemultiplied by the price of wheat to determine the value of a lot of wheat after it is ready formilling. This measure first computes the percent of clean tempered wheat (CTW) that would bederived from a sample of wheat as follows:
CTW = [(100% - (F + S + D)) C (100% - M) ] / (100% - T)
Where F is foreign material (percent),S is shrunken and broken kernels (percent),D is dockage (percent), M is moisture (percent), andT is temper moisture (percent).
The millable wheat index (MWI) is
MWI = 100% / CTW
The MWI can be multiplied by the price of a lot of wheat to determine the real milling cost to themiller of that lot. For example, if two lots of wheat were priced similarly ($200/MT) while onehad a MWI=.96 and the second had a MWI=.98, the first lot of wheat would return more cleantempered wheat to the miller than would the second. Therefore, the first lot of wheat has thepotential to cost the miller less to run through his mill than the second because it provides moremillable material.
This method differs from the net wheat price which values only the dry clean wheatportion of a wheat lot. In contrast, the millable wheat index also considers the value that a millercaptures from a lot of wheat due to the difference between wheat moisture and temperingmoisture.
Value Added by Milling
The third method is to calculate the value added in milling for a specific lot of wheatutilized in an importer’s mill. This formula utilizes the clean tempered wheat calculation todetermine the quantity of wheat available to the miller then estimates the cost of wheat andincome generated from the sale of flour and by-products. These are used to calculate the valueadded (approximately a net milling margin) for wheat lots. Specifically, profit or value added isdefined as:

8
Where P1, P2, P3, ... Pn are prices for flour segments and by-products and
Y1, Y2, Y3, ... Yn are quantities of flour segments and by-products produced.
An example of the application of this method is presented in Table 2 and described as follows:.A specific importer can purchase a lot of wheat (1 MT) for $204/MT. In this wheat lot, there is 3percent screenings (defined as dockage + foreign material + shrunken and broken). Thus, foreach ton purchased, the miller buys 970 KG of clean wheat and 30 KG of screenings. This wheatlot is 12 percent moisture and the importer tempers wheat to 16 percent moisture for milling. Therefore, the importer should obtain 1016.2 KG of millable wheat product from this wheat lot. Using the extraction rates specific to the importers mill and prices for saleable products, theimporter would be able to generate $281.55/MT for the products made from this wheat lot. Subtracting his cost for the wheat lot of $204/MT yields profit of $77.55/MT.
Table 2. Value Added Estimation Example
Wheat Purchased 1000 KG
Wheat Price $204/MT
Mill Screenings 3.0% 30 KG
Wheat Moisture 12%
Temper Moisture 16%
Millable Material 1016.19 KG
Milling Products Extraction Rate1 KGS Produced Price/KG Value
Flour 0.64 650.36 0.307 $199.66
First Clear 0.20 203.24 0.285 $57.92
By Product 0.14 142.27 0.140 $19.92
Screenings 30.00 0.135 $4.05
Total Revenue $281.55
Less Wheat Cost $204.00
Value Added $77.551 Extraction rates listed do not sum to 1.00 because flour extraction rates utilized assume an invisible loss of 2%.
9
Stochastic Analysis of Consistency
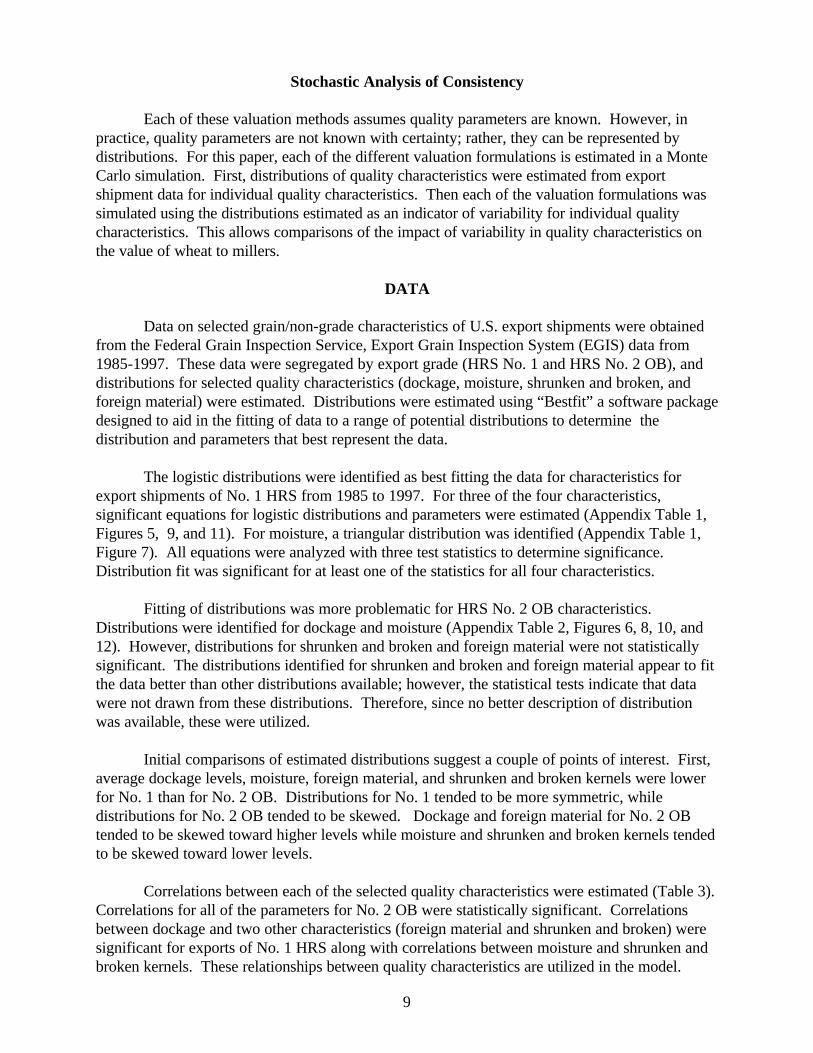
Each of these valuation methods assumes quality parameters are known. However, inpractice, quality parameters are not known with certainty; rather, they can be represented bydistributions. For this paper, each of the different valuation formulations is estimated in a MonteCarlo simulation. First, distributions of quality characteristics were estimated from exportshipment data for individual quality characteristics. Then each of the valuation formulations wassimulated using the distributions estimated as an indicator of variability for individual qualitycharacteristics. This allows comparisons of the impact of variability in quality characteristics onthe value of wheat to millers.
DATA
Data on selected grain/non-grade characteristics of U.S. export shipments were obtainedfrom the Federal Grain Inspection Service, Export Grain Inspection System (EGIS) data from1985-1997. These data were segregated by export grade (HRS No. 1 and HRS No. 2 OB), anddistributions for selected quality characteristics (dockage, moisture, shrunken and broken, andforeign material) were estimated. Distributions were estimated using “Bestfit” a software packagedesigned to aid in the fitting of data to a range of potential distributions to determine thedistribution and parameters that best represent the data.
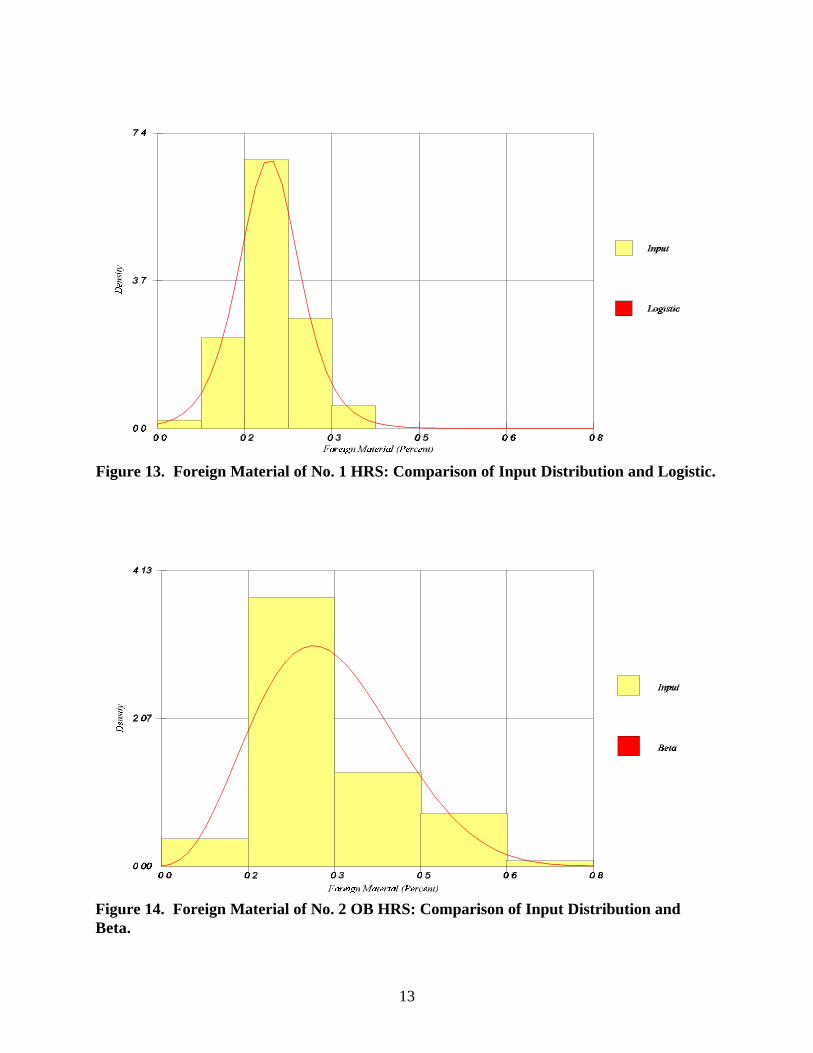
The logistic distributions were identified as best fitting the data for characteristics forexport shipments of No. 1 HRS from 1985 to 1997. For three of the four characteristics,significant equations for logistic distributions and parameters were estimated (Appendix Table 1,Figures 5, 9, and 11). For moisture, a triangular distribution was identified (Appendix Table 1,Figure 7). All equations were analyzed with three test statistics to determine significance. Distribution fit was significant for at least one of the statistics for all four characteristics.
Fitting of distributions was more problematic for HRS No. 2 OB characteristics. Distributions were identified for dockage and moisture (Appendix Table 2, Figures 6, 8, 10, and12). However, distributions for shrunken and broken and foreign material were not statisticallysignificant. The distributions identified for shrunken and broken and foreign material appear to fitthe data better than other distributions available; however, the statistical tests indicate that datawere not drawn from these distributions. Therefore, since no better description of distributionwas available, these were utilized.
Initial comparisons of estimated distributions suggest a couple of points of interest. First,average dockage levels, moisture, foreign material, and shrunken and broken kernels were lowerfor No. 1 than for No. 2 OB. Distributions for No. 1 tended to be more symmetric, whiledistributions for No. 2 OB tended to be skewed. Dockage and foreign material for No. 2 OBtended to be skewed toward higher levels while moisture and shrunken and broken kernels tendedto be skewed toward lower levels.
Correlations between each of the selected quality characteristics were estimated (Table 3). Correlations for all of the parameters for No. 2 OB were statistically significant. Correlationsbetween dockage and two other characteristics (foreign material and shrunken and broken) weresignificant for exports of No. 1 HRS along with correlations between moisture and shrunken andbroken kernels. These relationships between quality characteristics are utilized in the model.

10
Figure 7. Dockage of No. 1 HRS: Comparison of Input Distribution and Logistic.
Figure 8. Dockage of No. 2 OB HRS: Comparison of Input Distribution and Erlang.

11
0.0
0.3
0.6
0.0 2.9 5.8 8.7 11.6 14.5
Input
Triang
Moisture (Percent)
Figure 9. Moisture of No. 1 HRS: Comparison of Input Distribution and Triangular.
Figure 10. Moisture of No. 2 OB HRS: Comparison of Input Distribution and Beta.

12
Figure 11. Shrunken and Broken Kernels of No. 1 HRS: Comparison of Input Distributionand Logistic.
Figure 12. Shrunken and Broken Kernels of No. 2 OB HRS: Comparison of InputDistribution and Weibull.
13
Figure 13. Foreign Material of No. 1 HRS: Comparison of Input Distribution and Logistic.
Figure 14. Foreign Material of No. 2 OB HRS: Comparison of Input Distribution andBeta.

14
Table 3. Correlation of Selected Quality Characteristics for HRS Export Shipments, byGrade, 1985-1997
Dockage Moisture Shrunken andBroken
Foreign Material
HRS 1
Dockage 1 0.1222 0.1749* 0.177*
Moisture 1 -0.169* 0.1099
Shrunken andBroken
1 0.0742
Foreign Material 1
HRS 2 OB
Dockage 1 0.2067* 0.1823* 0.2266*
Moisture 1 -0.2869* 0.1911*
Shrunken andBroken
1 0.1603*
Foreign Material 1
* Significant p<.05
Table 4. Prices and Milling Parameters for Base Case Simulations (United ArabEmirates)
Item Price Millable Wheat Conversion
No. 1 HRS $205.47/MT
No. 2 OB HRS $204.00/MT
Flour $.307/KG 64 Percent
First Clear $.285/KG 20 Percent
By-Products $.14/KG 14 Percent
Invisible loss 2 Percent
Screenings $.135/KG
Source: Drynan (Spreadsheet)Spread No. 1 over No. 2 OB represents discounts from No. 1 prices of $0.02/bu for test weightand $0.02 for foreign material applied to grain that would meet specifications for No. 2.

2 Use of standard deviations and variances are not always preferred measures forcomparison of variation among groups. Laffont presents an example where this is so.
15
Prices for No. 2 OB wheat and all products along with conversion rates were taken fromDrynan (Table 4). Prices for No. 1 HRS were estimated by adding back in discounts that wouldbe applied on grade factors (test weight and foreign material) to lower a sample with No. 1specifications to a No. 2. Discounts were $0.02/bu for test weight and $0.02/bu for foreignmaterial.
RESULTS
Variability in quality characteristics affects the value of individual wheat lots to millers. Three alternative measures of valuation (Net Wheat Price, Millable Wheat Index, and ValueAdded in Milling) were used to analyze the effect of variability in quality characteristics on thevalue of wheat to millers. Simulations of these alternative valuation measures were developed in@Risk, a risk simulation software package, that allowed incorporation of distributions andcorrelations of data (e.g., wheat characteristics). The measures were iterated 1000 times forresults to converge within acceptable criteria (results from successive comparisons resulted instandard deviations for changes deviating by less than 5 percent for all output variables). A basecase was simulated for U.S. No. 1 and No. 2OB HRS using base case prices and millingparameters. Then sensitivities of parameters were examined including an alternative thatexamined fixed dockage levels, along with comparisons to distributions for individual importersand to imports of U.S. HRW wheat.
Base Case
Using the estimated distributions and correlations for No. 1 and No. 2 OB HRS, both thenet wheat in a lot and the net wheat value were estimated. The estimated average net wheat inexports of No. 1 was 86 percent compared to 85 percent in No. 2 OB (Table 5). Thus, buyers ofNo. 1 should obtain on average 1 percent more net wheat than buyers of No. 2 OB. The effect ofthe higher proportion of net wheat in HRS No.1 (more actual dry millable wheat materialavailable per MT), was larger than the spread in prices between No. 1 and No. 2 OB in the basecase. The net wheat price of No. 1 HRS averaged $237.84/MT compared to $238.78/MT forNo. 2 OB. Therefore, in this base case, No. 1 is of better quality (higher net wheat) and bettervalue (lower net wheat price) than No. 2 OB. This result is highly dependent on the size of theprice spread between No. 1 and No. 2 OB and in this case indicates that the price spread does notcapture all of the quality differences between the two grades. If quality differences were fullyrepresented in the price spread, the net wheat price for each grade should be equal.
Variability of net wheat measured by standard deviation was higher for No. 1 than for No.2 OB HRS, (1.2 percent and 0.9 percent, respectively). Simulated shipments of No. 1 had netwheat that ranged from 81.2 to 91.4 percent, while shipments of No. 2 OB ranged from a low of82.6 percent to a high of 88.8 percent net wheat. This translated into higher variability for netwheat prices for exports of No. 1.2 The standard deviation of net wheat prices for No. 1 was$2.70/MT compared to $2.50/MT for No. 2 OB HRS (Figure 13). The net wheat price to the

3 Figure 15 and subsequent figures are representations of the probability distributionfunction for results of each of the three value measures. These were utilized rather thancumulative distribution functions (cdf’s) because they provide a more obvious representation forthe means and variability of each grade, but are not the preferred representation for comparisonsof variability across grades.
16
miller for No. 1 ranged from a low of $229.06/MT to a high of $248.92/MT and from$231.43/MT to a high of $245.26/MT for No. 2 OB HRS. Much of the higher variability for No. 1 HRS may be due to limited significant correlations between characteristics and the smallernegative correlation between moisture and shrunken and broken kernels than for No. 2 OB HRS.
The effects of variability in wheat characteristics were evaluated by estimating MillableWheat Index (MWI) scores. Clean Tempered Wheat (CTW) averaged 103 percent for No. 1 and102 percent for No. 2 OB. This resulted in MWI scores that averaged .97 for No. 1 and .98 forNo. 2 OB HRS. Multiplying the mean MWI scores by base prices (i.e., Base Prices in Table 5)for No. 1 ($205.47/MT) and No. 2 OB HRS ($204.00/MT) resulted in an expected milling cost of$199.31 for No. 1 and 199.92 for No. 2 OB. The cost of milling No. 1 is lower than the cost ofNo. 2 OB in this case. This occurs mainly because the average sample of No. 1 has more CTWthan No. 2 OB and the effect of the difference in CTW is larger than the price spread between thetwo grades. As such, the end user obtains more millable product by purchasing No. 1 than No. 2OB and the cost of using No. 1 HRS in the milling operation is reduced relative to No. 2 OBHRS. Again, this indicates that No. 1 HRS is a better value than No. 2 OB. However, the valuesof CTW and MWI were more variable for No. 1 than for No. 2 OB HRS (Figure 14). MWIscores ranged from .92 to 1.03 for No. 1 and .95 to 1.02 for No. 2 OB. This converts to anexpected cost for milling that ranges from $189.03 to $211.63/MT for No. 1 and $193.80 to$208.08/MT for No. 2 OB HRS.
The third measure utilized was the value added in milling which accounts for differentproducts, by-products, and values of each. This measure was estimated using the simulatedvalues for milling characteristics and prices established. The average value added for No. 1 andNo. 2 OB HRS was $78.57/MT and $77.44/MT, respectively. Thus, millers would earn a greatermargin (value added) when milling No. 1 than No. 2 OB. However, the average differencebetween the value added for No. 1 and No. 2 OB is $1.13/MT which is lower than the $1.47/MTprice spread between No. 1 and No. 2 OB. Therefore, the higher price for No. 1 HRS is partiallyoffset by the higher proportion of millable material in No. 1 than in No. 2. In addition, like the netwheat and net wheat price measures, variability of the profit (value added) for No. 1 (standarddeviation = $2.98/MT) was higher than for No. 2 OB (standard deviation = $2.74/MT) (Figure15).3
17
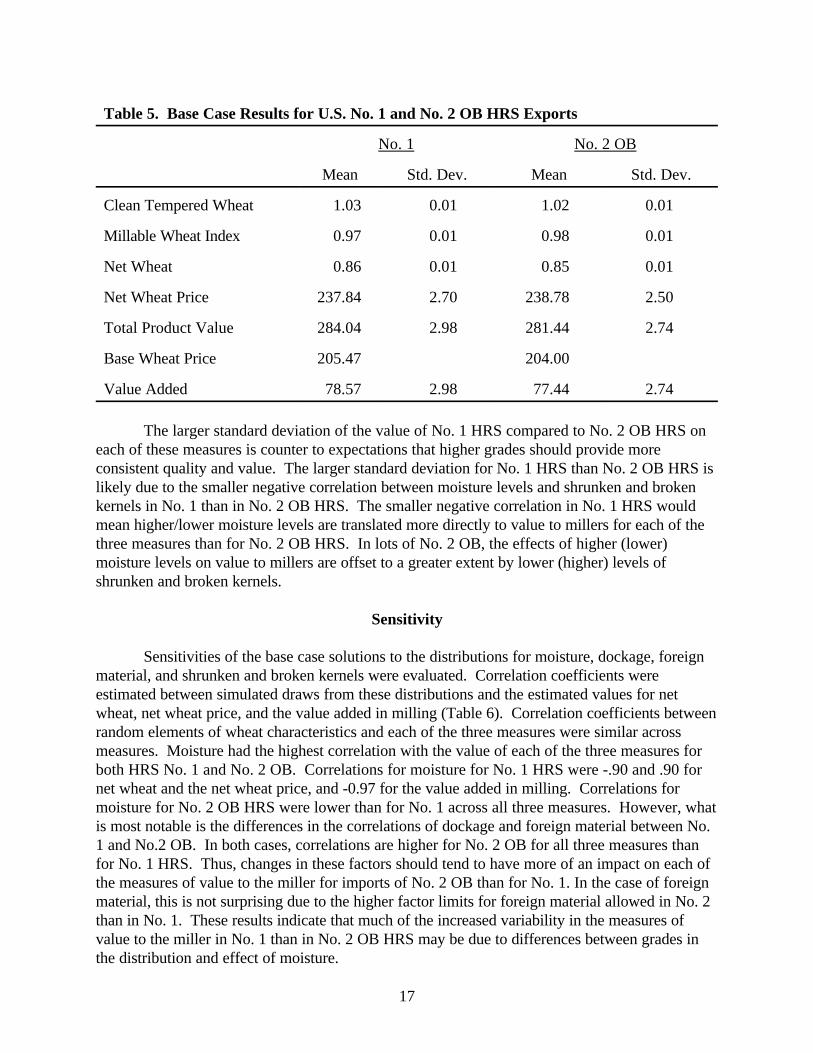
Table 5. Base Case Results for U.S. No. 1 and No. 2 OB HRS Exports
No. 1 No. 2 OB
Mean Std. Dev. Mean Std. Dev.
Clean Tempered Wheat 1.03 0.01 1.02 0.01
Millable Wheat Index 0.97 0.01 0.98 0.01
Net Wheat 0.86 0.01 0.85 0.01
Net Wheat Price 237.84 2.70 238.78 2.50
Total Product Value 284.04 2.98 281.44 2.74
Base Wheat Price 205.47 204.00
Value Added 78.57 2.98 77.44 2.74
The larger standard deviation of the value of No. 1 HRS compared to No. 2 OB HRS oneach of these measures is counter to expectations that higher grades should provide moreconsistent quality and value. The larger standard deviation for No. 1 HRS than No. 2 OB HRS islikely due to the smaller negative correlation between moisture levels and shrunken and brokenkernels in No. 1 than in No. 2 OB HRS. The smaller negative correlation in No. 1 HRS wouldmean higher/lower moisture levels are translated more directly to value to millers for each of thethree measures than for No. 2 OB HRS. In lots of No. 2 OB, the effects of higher (lower)moisture levels on value to millers are offset to a greater extent by lower (higher) levels ofshrunken and broken kernels.
Sensitivity
Sensitivities of the base case solutions to the distributions for moisture, dockage, foreignmaterial, and shrunken and broken kernels were evaluated. Correlation coefficients wereestimated between simulated draws from these distributions and the estimated values for netwheat, net wheat price, and the value added in milling (Table 6). Correlation coefficients betweenrandom elements of wheat characteristics and each of the three measures were similar acrossmeasures. Moisture had the highest correlation with the value of each of the three measures forboth HRS No. 1 and No. 2 OB. Correlations for moisture for No. 1 HRS were -.90 and .90 fornet wheat and the net wheat price, and -0.97 for the value added in milling. Correlations formoisture for No. 2 OB HRS were lower than for No. 1 across all three measures. However, whatis most notable is the differences in the correlations of dockage and foreign material between No.1 and No.2 OB. In both cases, correlations are higher for No. 2 OB for all three measures thanfor No. 1 HRS. Thus, changes in these factors should tend to have more of an impact on each ofthe measures of value to the miller for imports of No. 2 OB than for No. 1. In the case of foreignmaterial, this is not surprising due to the higher factor limits for foreign material allowed in No. 2than in No. 1. These results indicate that much of the increased variability in the measures ofvalue to the miller in No. 1 than in No. 2 OB HRS may be due to differences between grades inthe distribution and effect of moisture.

18
2 3 0 2 3 2 2 3 4 2 3 6 2 3 8 2 4 0 2 4 2 2 4 40 %
1 0 %
2 0 %
3 0 %
4 0 %
5 0 %
6 0 %
N et W heat Pr ice ($ /M T )
Pro
babi
lity
N o . 1
N o . 2 O B
Figure 15. Distribution of Net Wheat Price for Exports of HRS, by Grade: Base Case.
Table 6. Correlation of Selected Wheat Quality Characteristics and EstimatedValuations (Base Case)
Dockage Moisture Shrunken andBroken
Foreign Material
Millable Wheat Index
No. 1 0.19 0.87 0.30 0.08
No. 2 OB 0.42 0.87 0.18 0.39
Net Wheat
No. 1 -0.19 -0.87 -0.30 -0.08
No. 2 OB -0.42 -0.87 -0.18 -0.39
Net Wheat Price
No. 1 0.19 0.87 0.30 0.08
No. 2 OB 0.42 0.87 0.18 0.39
Value Added
No. 1 -0.09 -0.96 -0.10 -0.04
No. 2 OB -0.32 -0.96 -0.01 -0.31

19
7 0 7 2 7 4 7 6 7 8 8 0 8 2 8 4 8 60 %
1 0 %
2 0 %
3 0 %
4 0 %
5 0 %
6 0 %
V a l u e A d d e d i n M il l ing ($/M T )
Pro
babi
lity
N o . 1
N o . 2 O B
Figure 16. Distribution of Value Added in Milling for Exports of HRS, by Grade: BaseCase.
0 .94 0 .95 0 .96 0 .97 0 .98 0 .99 1 1 .010 %
1 0 %
2 0 %
3 0 %
4 0 %
5 0 %
6 0 %
M illable W h e a t I n d e x S c o r e
Pro
babi
lity
N o . 1
N o . 2 O B
Figure 17. Distribution of Millable Wheat Index Scores for Exports of HRS, by Grade:Base Case.

20
Sensitivity of Base Case Parameters
The sensitivity of the base case solutions to changes in price spreads, flour extractionrates, prices for flour and by-products, and the degree of variability of wheat characteristics wasexamined. Analysis focused on the average value and standard deviation of the value added inmilling for No. 1 HRS. Base case parameters were increased/decreased on a percentage basis andsimulations conducted. Changes in flour extraction rates were assumed to increase/decrease thepercent of by-product obtained in milling.
The change in the price spread between No. 1 and No. 2 OB HRS had limited impact onthe average value and had no effect on the variability of the value added in milling. Changes inprice spreads for No. 1 are directly translated into one for one tradeoffs with the value added inmilling. Because of this direct relationship, there is no effect on the variability of the value addedin milling.
The average value added in milling was most sensitive to changes in the flour price. A 20percent decrease in the price of flour reduced the value added in milling from $78.57/MT to$26.42/MT (a 66 percent decline) (Figure 18). Changing the price of flour also impacted thevariability of the value added in milling. Decreasing the price of flour products by 20 percentreduced the variability of the value added in milling from a standard deviation of $2.98/MT to$2.41/MT (Figure 19).
Changing the price of by-products had a lesser impact on the value added in milling. Adecline of 20 percent in the price of by-products decreased the average value added in millingfrom $78.57/MT to $73.91/MT. Similarly, changes in the price of by-products had a lesserimpact on the variability of the value added in milling. Decreasing the price of by-products by 20percent decreased the variability of the value added in milling from $2.98/MT to $2.96/MT.
Changes in the rate of flour extraction also had a limited impact on the value added inmilling. A decline of 10 percent in the rate of flour extraction (assumed that reduced extractionincreased by-product generation) reduced the average value added in milling from $78.57/MT to$64.59/MT. Decreasing the rate of flour extraction also decreased the variability of the valueadded in milling. The standard deviation of the value added in milling decreased from $2.98/MTto $2.82/MT with a 10 percent decline in the rate of flour extraction.
Decreasing or increasing the consistency of wheat characteristics was also examined byvarying the size of standard deviations for quality characteristics. Standard deviations wereincreased/decreased on a percentage basis from base case values. Variability of the value added inmilling was shown to be most sensitive to reductions/increases in the consistency of moisture inNo. 1 HRS (Figure 20). Increasing the consistency of lots so that the standard deviation ofmoisture between lots declined by 20 percent, reduced the variability of the value added in millingfrom $2.98/MT to $2.41/MT. This reduction in variability is similar to the impact of changes inproduct prices. Changes in variability of the other wheat characteristic distributions had limitedimpact on the variability of the value added in milling. A 20 percent reduction in the variability ofcharacteristics would decrease the variability in the value added in milling by $0.015/MT forshrunken and broken kernels, by $0.01/MT for dockage, and had a negligible impact from
21
changes in the variability of foreign material. Similar impacts occur for HRS No. 2 OB (Figure21). The variability of the value added in milling for No. 2 OB HRS is most affected byincreasing/decreasing the consistency of moisture levels. The consistency of the other wheatcharacteristics (dockage, foreign material, and shrunken and broken kernels) had limited impacton the variability of the value added in milling.
These results suggest that millers looking to reduce the variability of net profit frommilling should consider restrictions that would reduce the variability of moisture levels in wheatlots. However, in this study, increases in the consistency of levels for dockage, foreign material,and shrunken and broken kernels between lots would provide limited reductions in the variabilityof net profit.
The variability of net wheat price was also examined to determine the sensitivity tochanges in the consistency of each of the wheat characteristics. Increasing the consistency(lowering the standard deviation) of moisture in both No. 1 and No. 2 OB HRS has the greatestimpact on reducing the variability of net wheat prices for millers. Reducing the standard deviationof moisture by 20 percent reduced the variability of net wheat prices from a standard deviation of$2.70/MT to $2.27/MT for No. 1 and $2.51/MT to $2.12/MT for No. 2 OB HRS. However,increasing consistency for the other wheat quality factors had limited impacts on the variability ofnet wheat prices. Reducing the variability of each of the other quality factors by 20 percentreduced the variability of net wheat prices for No. 1 HRS by $0.01, $0.07, and $0.03/MT and No.2 OB HRS by $0.03, $0.02, and $0.04/MT for foreign material, shrunken and broken kernels, anddockage, respectively. This suggests that if millers want to reduce the variability in the value ofwheat purchased, they should consider adding contract specifications to reduce the variability inmoisture levels.

22
7 0 % 8 0 % 9 0 % 1 0 0 % 110% 1 2 0 % 1 3 0 %2 0
4 0
6 0
8 0
1 0 0
1 2 0
1 4 0
Percent o f Base Case Values
Val
ue A
dded
($/
MT
)Pr ice Spread
N o . 1 o v e r N o . 2 O B
Product Pr ice
By-Product Pr ice
Flour Extrac t ion
Figure 18. Sensitivity of Average Value Added in Milling to Changes in Price Spreads,Flour Extraction, and Product and By-Product Prices, No. 1 HRS.
7 0 % 8 0 % 9 0 % 1 0 0 % 110% 1 2 0 % 1 3 0 %2 .2
2 .4
2 .6
2 .8
3
3 .2
3 .4
3 .6
3 .8
Percent o f Base Case Values
Stan
dard
Dev
iati
on o
f V
alue
Add
ed (
$/M
T)
Pr ice SpreadN o . 1 o v e r N o . 2 O B
Product Pr ice
By-Produc t Pr ice
Flour Extrac t ion
Figure 19. Sensitivity of Variability for Value Added in Milling to Changes in PriceSpreads, Flour Extraction, and Product and By-Product Prices, No. 1 HRS.

23
7 0 % 8 0 % 9 0 % 1 0 0 % 110% 1 2 0 % 1 3 0 %2 .2
2 .4
2 .6
2 .8
3
3 .2
3 .4
3 .6
3 .8
Standard Deviat ion for Character i s t ic Dis tr ibut ion (Percent o f Base Case Value)
Stan
dard
Dev
iati
on o
f V
alue
Add
ed (
$/M
T)
M oisture
F M
S & B
D o c k a g e
Figure 20. Sensitivity of Variability of Value Added in Milling for Changes in theStandard Deviations of the Distribution of Quality Characteristics, No. 1 HRS.
7 0 % 8 0 % 9 0 % 1 0 0 % 1 1 0 % 1 2 0 % 1 3 0 %2 .2
2 .4
2 .6
2 .8
3
3 .2
3 .4
3 .6
3 .8
S t a n d a r d D e v i a t i o n f o r C h a r a c t e r i s t i c D i s t r i b u t i o n ( P e r c e n t o f B a s e C a s e V a l u e )
Stan
dard
Dev
iati
on o
f V
alue
Add
ed (
$/M
T)
M o i s t u r e
F M
S & B
D o c k a g e
Figure 21. Sensitivity of Variability of Value Added in Milling for Changes in theStandard Deviations of the Distributions of Quality Characteristics, No. 2 OB HRS.

24
7 0 % 8 0 % 9 0 % 1 0 0 % 110% 1 2 0 % 1 3 0 %2
2 .2
2 .4
2 .6
2 .8
3
3 .2
3 .4
S t a n d a r d D e v i a t i o n f o r C h a r a c t e r i s t i c D i s t r i b u t i o n ( P e r c e n t o f B a s e C a s e V a l u e )
Stan
dard
Dev
iati
on o
f N
et W
heat
Pri
ce (
$/M
T)
N o . 1 M o ist
N o . 1 F M
N o . 1 S & B
N o . 1 D o c k
N o . 2 o b M o i s t
N o . 2 o b F M
N o . 2 o b S & B
N o . 2 o b D o c k
Figure 22. Sensitivity of the Variability of Net Wheat Prices to Changes in the StandardDeviations of the Distributions of Wheat Characteristics, No. 1 and No. 2 OB HRS.
Limited Dockage Case
Many importers specify limitations/incentives on dockage content allowable in importshipments. To examine the effect of controlling dockage levels on the value to the miller, the basecase model was simulated with specific dockage levels. Simulations were run for HRS by gradeassuming dockage levels of 0.5 and 1.0 percent. The former is lower than the expected value ofdockage in the base case for No. 1 HRS of 0.69 percent, and the latter is higher than expectedvalue of dockage for No. 2 OB of 0.79 percent.
Estimated net wheat for both dockage levels were higher for No. 1 HRS than for No. 2OB and reflect the 0.5 percent difference in dockage levels (high dockage level had 0.5 percentless net wheat than did low dockage level). The difference in net wheat between grades was largeenough that the high dockage No. 1 still had more net wheat than did the low dockage No. 2 OB(Figure 21). The result for net wheat prices was similar distributions of net wheat prices for thehigh dockage (1.0 percent) No.1 and low dockage (0.5 percent) No. 2 OB (Figure 22). Differences between dockage levels and grades for both net wheat and net wheat prices were notstatistically different. However, 70 percent of the simulated net wheat values for the low dockageNo. 1 HRS exceeded 86 percent net wheat. This compared to 55 percent of simulated net wheatvalues for No. 1 HRS (1.0 percent) dockage, 35 percent for No. 2 OB (0.5 percent) dockage, and20 percent for No. 2 OB (1.0 percent) dockage exceeding 86 percent net wheat.
Evaluation of simulated millable wheat index scores and value added in milling suggeststhe same phenomena as for net wheat. Both high and low dockage No. 1 had lower millable

25
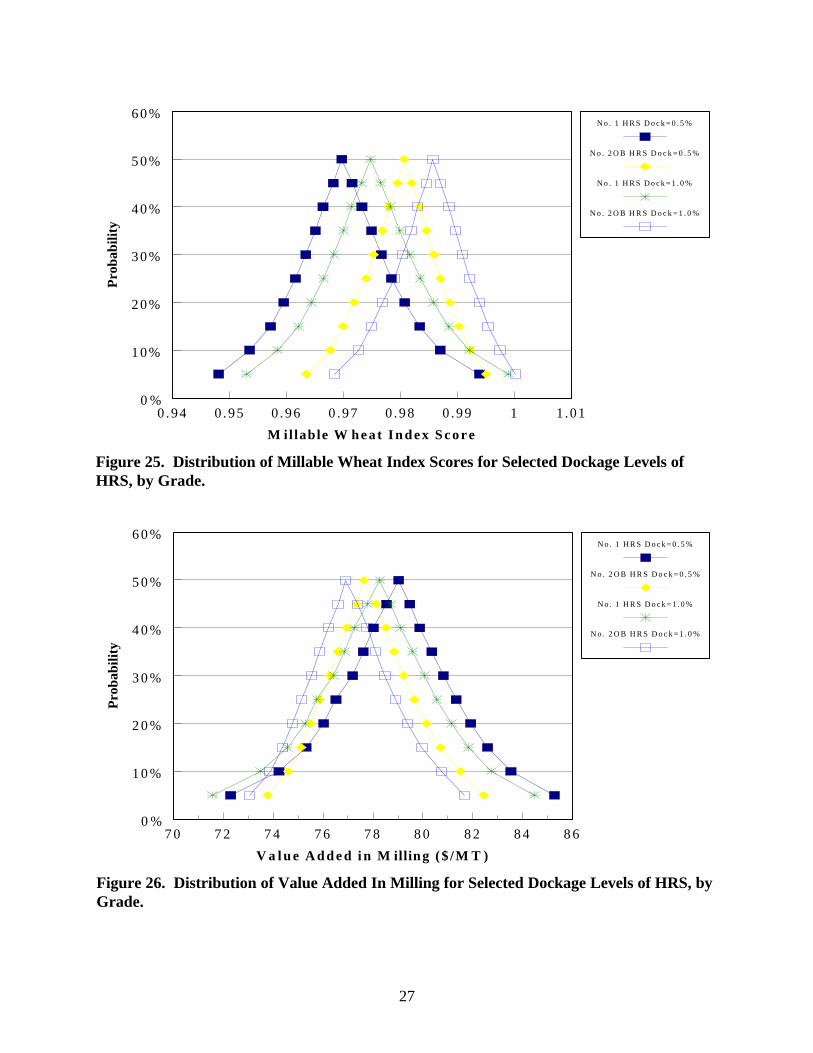
wheat index scores than did No. 2 OB (Figure 23). Therefore, No. 1 HRS would have lower costin processing in relation to its price because it contains more millable product than does No. 2 OBHRS. Similarly, the value added in milling was higher for both dockage levels for No. 1 HRSthan for No. 2 OB (Figure 24). No. 1 HRS had an average value added in milling of $78.98 for0.5 percent dockage and $78.21 for 1.0 percent dockage. Thus, decreasing dockage from 1.0percent to 0.5 percent in this case increased milling profit by an average of $0.77 per MT ofwheat.
Comparison to HRW
The variability of the value of HRW exports was examined to evaluate the effects of thedistribution of wheat quality characteristics on the value of wheat to millers. Parameters forselected distributions and correlations were estimated for exports of HRW No. 1 and No. 2 OB(Appendix Tables 3-4 and Table 8) from 1985/86 to 1996/97. HRW prices were collected for thesame date as for HRS (Sept 12, 1997). Associated costs (ocean freight and shipping from port tomill) and flour milling prices and conversion rates were assumed to be the same as those for HRS. Price spreads for HRW between grades were again assumed to be represented by discountsapplied to grade factors that would reduce a sample of No. 1 to a No. 2 as was assumed for HRS. Estimated prices were $188.98/MT for No. 1 and $187.51/MT for No. 2 OB HRW 12 percentprotein.
The three measures were simulated for comparison of the effects of variability of qualitycharacteristics on the value of exports of HRW to millers. Direct comparisons with HRS for thevalue added in milling were not made due to differences in the quality and prices for productsproduced from the two wheat classes.
The variability of net wheat and net wheat prices was simulated using characteristics ofU.S. HRW exports by grade (Figures 25-26). It was expected that grade No. 1 would have netwheat that was higher and less variable than No. 2 OB due to the lower limits allowed on gradefactors (foreign material, shrunken and broken, etc.). No. 1 HRW did have higher net wheat andlower variability than did No. 2 OB HRW. This is in contrast to HRS, where No. 1 had a highernet wheat value, but was more variable than No. 2 OB HRS. Relationships of net wheat pricesacross grades for HRW were similar to those for net wheat. No. 1 HRW had a lower net wheatprice and was less variable than No. 2 OB HRW.
Estimated values for the millable wheat index were lower for No. 1 HRW than No. 2 OB(0.971 versus 0.981, respectively) (Figure 27). This indicates a higher value to millers in relationto the lots cost for No.1 than for No. 2 OB. Variability of millable wheat index scores were alsolower for No. 1 than for No. 2 OB HRW (.0096 versus .0112, respectively). Again, this suggeststhat the value of No. 1 HRW to a miller is higher and more consistent than No. 2 OB.

26
8 3 % 8 4 % 8 5 % 8 6 % 8 7 % 8 8 % 8 9 %0 %
1 0 %
2 0 %
3 0 %
4 0 %
5 0 %
6 0 %
N e t W heat (% )
Pro
babi
lity
N o . 1 H R S D o c k = 0 . 5 %
N o . 2 O B H R S D o c k = 0 . 5 %
N o . 1 H R S D o c k = 1 . 0 %
N o . 2 O B H R S D o c k = 1 . 0 %
Figure 23. Distribution of Net Wheat for Selected Dockage Levels of HRS, by Grade.
2 3 0 2 3 2 2 3 4 2 3 6 2 3 8 2 4 0 2 4 2 2 4 4 2 4 60 %
1 0 %
2 0 %
3 0 %
4 0 %
5 0 %
6 0 %
N e t W h eat Pr ice ($ /M T )
Pro
babi
lity
N o . 1 H R S D o c k = 0 . 5 %
N o . 2 O B H R S D o c k = 0 . 5 %
N o . 1 H R S D o c k = 1 . 0 %
N o . 2 O B H R S D o c k = 1 . 0 %
Figure 24. Distribution of Net Wheat Price for Selected Dockage Levels of HRS, by Grade.
27
0 .94 0 .95 0 .96 0 .97 0 .98 0 .99 1 1 .010 %
1 0 %
2 0 %
3 0 %
4 0 %
5 0 %
6 0 %
M illable W h e a t I n d e x S c o r e
Pro
babi
lity
N o . 1 H R S D o c k = 0 . 5 %
N o . 2 O B H R S D o c k = 0 . 5 %
N o . 1 H R S D o c k = 1 . 0 %
N o . 2 O B H R S D o c k = 1 . 0 %
Figure 25. Distribution of Millable Wheat Index Scores for Selected Dockage Levels ofHRS, by Grade.
7 0 7 2 7 4 7 6 7 8 8 0 8 2 8 4 8 60 %
1 0 %
2 0 %
3 0 %
4 0 %
5 0 %
6 0 %
V a l u e A d d e d i n M illing ($ /M T )
Pro
babi
lity
N o . 1 H R S D o c k = 0 . 5 %
N o . 2 O B H R S D o c k = 0 . 5 %
N o . 1 H R S D o c k = 1 . 0 %
N o . 2 O B H R S D o c k = 1 . 0 %
Figure 26. Distribution of Value Added In Milling for Selected Dockage Levels of HRS, byGrade.
28
Table 7. Correlation of Selected Quality Characteristics for HRW Export Shipments, byGrade, 1985-1997
Dockage Moisture Shrunken andBroken
Foreign Material
HRW 1
Dockage 1 -0.0732 0.0643 0.1548
Moisture 1 -0.4010* 0.0097
Shrunken andBroken
1 -0.154
Foreign Material 1
HRW 2 OB
Dockage 1 0.1168* 0.2287* 0.1293*
Moisture 1 -0.0668* 0.1517*
Shrunken andBroken
1 0.1809*
Foreign Material 1
* Significant p<.05
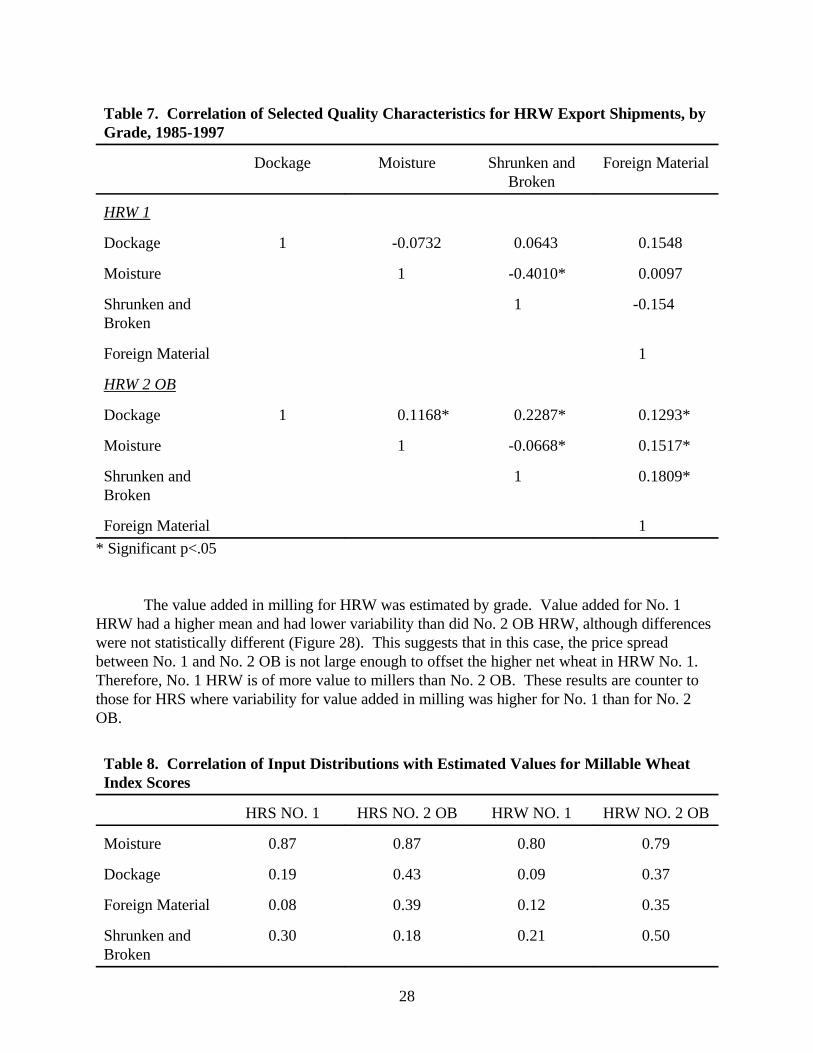
The value added in milling for HRW was estimated by grade. Value added for No. 1HRW had a higher mean and had lower variability than did No. 2 OB HRW, although differenceswere not statistically different (Figure 28). This suggests that in this case, the price spreadbetween No. 1 and No. 2 OB is not large enough to offset the higher net wheat in HRW No. 1. Therefore, No. 1 HRW is of more value to millers than No. 2 OB. These results are counter tothose for HRS where variability for value added in milling was higher for No. 1 than for No. 2OB.
Table 8. Correlation of Input Distributions with Estimated Values for Millable WheatIndex Scores
HRS NO. 1 HRS NO. 2 OB HRW NO. 1 HRW NO. 2 OB
Moisture 0.87 0.87 0.80 0.79
Dockage 0.19 0.43 0.09 0.37
Foreign Material 0.08 0.39 0.12 0.35
Shrunken andBroken
0.30 0.18 0.21 0.50
29
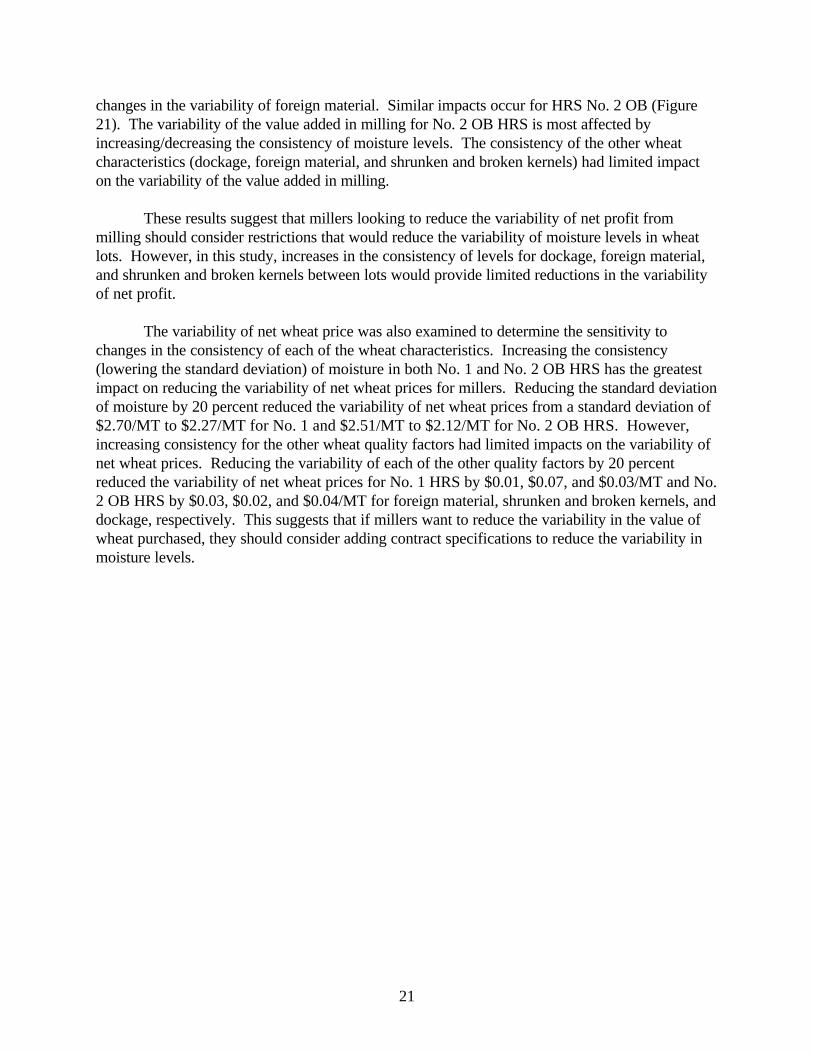
Correlations of wheat quality characteristics were estimated with simulated millable wheatindex scores (Table 9). Correlations were generally higher for HRS than for HRW except forforeign material in No. 1 HRS and shrunken and broken kernels in No. 2 OB HRS. Correlationswere also higher for moisture in No. 1's than in No. 2 OB while correlations for the othercharacteristics were generally higher for No. 2 OB than for No. 1. These results are notsurprising, especially for foreign material and shrunken and broken kernels which are both gradingfactors and allowed in higher levels in No. 2 OB than in No. 1. What is notable is the largercorrelation of shrunken and broken kernel values for No. 1 HRS compared to No. 2 OB HRS.
Different importing countries have different wheat needs (grades/qualities desired) andspecify different levels of characteristics when importing. Dahl and Wilson documented thatvariability of quality characteristics varies across individual importing countries. This suggeststhat the effects of variability of wheat characteristics on the value of wheat to millers should varyby importer. To examine these effects, wheat characteristics for exports of HRS to individualimporters were examined for each of the three measures where data were available. Distributionsof characteristics and correlations were estimated for No. 1 for Korea, and for No. 2 OB forKorea, Venezuela, Belgium, and the Philippines (Appendix Tables 5-11). Results for the threemeasures for each importer were compared with results based on distributions for all exports.
Results were first compared for net wheat and MWI scores for Korea. Simulated netwheat values for exports of HRS to Korea for both grades are very similar. This suggests thatbuying specifications for Korea are similar across grades purchased. However, the distributionfor net wheat for exports of No. 1 and No. 2 OB to Korea were closer to those for exports of No.1 to all importers but were less variable. This suggests that Korea is controlling the consistencyof wheat imports as opposed to most importers and this is most notable for imports of No. 2 OBHRS. This result is also exhibited in the comparison of the distributions of the millable wheatindex scores for Korea and all exports. Korean imports of both grades have distributions withmean levels similar to exports of No. 1 HRS to all importers and are lower in variability thanexports of either grade to all importers.
30
N o . 1 H R S N o . 2 O B H R S N o 1 . H R W N o . 2 O B H R W8 4 %
8 5 %
8 6 %
8 7 %
8 8 %
0.7%
0.8%
0.9%
1.0%
1.1%
1.2%
1.3%
1.4%N
et W
heat
(P
erce
nt)
Std.
Dev
. of
Net
Whe
at
M e a n S td. D e v.
Figure 27. Estimated Mean and Standard Deviation of Net Wheat, by Class and Grade.
N o . 1 H R S N o . 2 O B H R S N o 1 . H R W N o . 2 O B H R W2 0 0
2 1 0
2 2 0
2 3 0
2 4 0
2 5 0
2 .00
2 .50
3 .00
3 .50
4 .00
Net
Whe
at P
rice
($/
MT
)
Std.
Dev
. of
Net
Whe
at P
rice
($/
MT
)
M ean S td. D ev.
Figure 28. Estimated Mean and Standard Deviation of Net Wheat Prices, by Class andGrade.

31
N o . 1 H R S N o . 2 O B H R S N o 1 . H R W N o . 2 O B H R W0.96
0 .97
0 .98
0 .99
1
0 . 0 0 7
0 . 0 0 8
0 . 0 0 9
0 .01
0 .011
0 . 0 1 2
0 . 0 1 3
0 . 0 1 4M
illab
le W
heat
Ind
ex S
core
Std.
Dev
. of
Mill
able
Whe
at I
ndex
Sco
re
M e a n S td. D ev.
Figure 29. Estimated Mean and Standard Deviation of Millable Wheat Index Scores, byClass and Grade.
N o . 1 H R S N o . 2 O B H R S N o 1 . H R W N o . 2 O B H R W6 0
7 0
8 0
9 0
1 0 0
110
1 2 0
2 .00
2 .50
3 .00
3 .50
4 .00
Val
ue A
dded
($/
MT
)
Std.
Dev
. of
Val
ue A
dded
($/
MT
)
M ean S td. Dev.
Figure 30. Estimated Mean and Standard Deviation of Value Added in Milling, by Classand Grade.
Comparison of Characteristics for Individual Importers

32
8 3 % 8 4 % 8 5 % 8 6 % 8 7 % 8 8 % 8 9 %0 %
1 0 %
2 0 %
3 0 %
4 0 %
5 0 %
6 0 %
N e t W heat (% )
Pro
babi
lity
N o . 1 K o r e a
N o . 2 O B K o r e a
No . 1 A l l
N o . 2 O B A l l
Figure 31. Comparison of the Distribution of Net Wheat for Korea and All HRS Exports,by Grade.
0 .94 0 .95 0 .96 0 .97 0 .98 0 .99 1 1 .010 %
1 0 %
2 0 %
3 0 %
4 0 %
5 0 %
6 0 %
M illable W h e a t I n d e x S c o r e
Pro
babi
lity
N o . 1 K o r e a
N o . 2 O B K o r e a
N o . 1 A l l
N o . 2 O B A ll
Figure 32. Comparison of the Distribution of Millable Wheat Index Scores for Korea andAll HRS Exports, by Grade.

33
Simulated net wheat scores and millable wheat index scores were compared for Belgium,the Philippines, Venezuela, Korea, and all export shipments. Mean values and standard deviationsfor the amount of net wheat in exports indicated a high degree of variability across exportingcountries (Figure 33). For example, Korean imports of No. 2 OB HRS had average net wheatactually higher than for all exports of No. 1 and for Korean imports of No. 1 HRS. However,Venezuela had the lowest average net wheat but also the lowest variability in net wheat of any ofthe countries examined. Net wheat for imports of No. 2 OB HRS to Belgium and the Philippinesformed a middle ground with Belgium having lower net wheat than the Philippines. Bothcountries’ net wheat was more variable than net wheat for Korea or Venezuela. Results formillable wheat index scores reflect the same relationships, except the standard deviation ofmillable wheat index scores was higher for Belgium than for the Philippines (Figure 34).
These results show some significant contrasts. Venezuela imports wheat that is of theleast quality (lowest net wheat); however, is also the least variable. Meanwhile, Belgium, whichalso imports wheat with low net wheat and the Philippines, which imports high net wheat, havethe least consistency among the countries examined for the net wheat and MWI measures. Further, all individual importers examined had lower variability than for all exports.
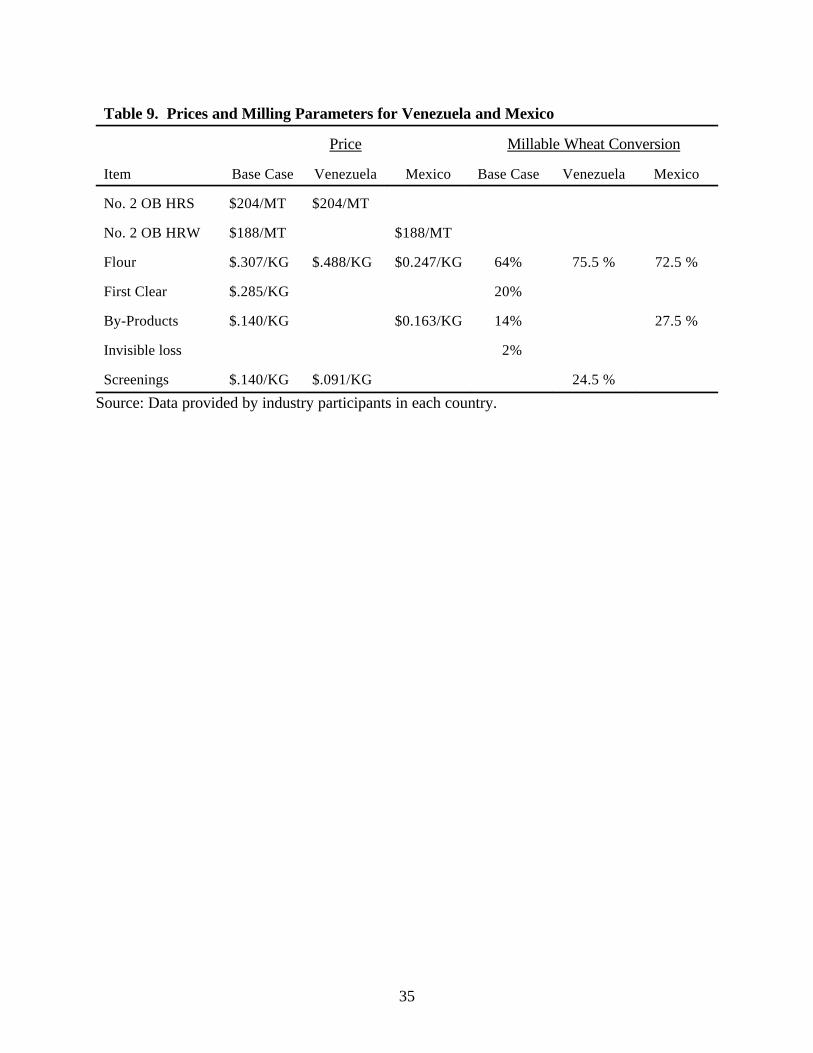
In addition to net wheat and the MWI, the value added in milling (net profit) wasexamined for two importers, Venezuela for No. 2 OB HRS and Mexico for No. 2 OB HRW. Prices for products and by-products and extraction rates are shown in Table 10. The value addedwas compared using the wheat cost in the base case. This does not represent changes intransportation costs and import tariffs, etc., for each importing country; however, it should revealthe effect on variability of the value added. Prices for flour products were higher and prices forscreenings were lower in Venezuela than in the base case (all No. 2 OB HRS exports). Inaddition, flour extraction rates for all flour products were lower than in the base case for HRS. Alternatively, flour prices were lower and by-product prices higher for Mexico than in the basecase for No. 2 OB HRW.
The average net margin for Venezuela was significantly higher than for the base case forHRS ($193.02/MT versus $77.44/MT in the base case). In addition, variability measured by thestandard deviation was lower in Venezuela than in the base case ($2.56/MT versus $2.74/MT)(Figure 35). Just the opposite occurred in Mexico where the average value added was lower thanfor the base case for No. 2 OB HRW ($99.23/MT versus $42.81/MT) and the variability of thevalue added increased from a standard deviation of $2.76/MT for the base case for No. 2 OBHRW to $2.80/MT for Mexico (Figure 36).
34
No. 1 Korea
No. 2 OB Korea
No. 2 OB Venezuela
No. 2 OB Belgium
No. 2 OB Philippines84%
85%
86%
87%
88%
0.0%
0.2%
0.4%
0.6%
0.8%
1.0%
1.2%N
et W
heat
(P
erce
nt)
Stan
dard
Dev
iati
on (
Per
cent
)
Mean Std. Dev. Mean No. 1 Mean No. 2 OB
Figure 33. Comparison of Mean and Standard Deviation of Net Wheatfor Selected Importing Countries, by Grade.
No. 1 Korea
No. 2 OB Korea
No. 2 OB Venezuela
No. 2 OB Belgium
No. 2 OB Philippines0.95
0.96
0.97
0.98
0.99
1
0
0.002
0.004
0.006
0.008
0.01
0.012
0.014
Mill
able
Whe
at I
ndex
Sco
re
Stan
dard
Dev
iati
on
Mean Std. Dev. Mean No. 1 Mean No. 2 OB
Figure 34. Comparison of Mean and Standard Deviation of MillableWheat Index Scores for Selected Importing Countries, by Grade.
35
Table 9. Prices and Milling Parameters for Venezuela and Mexico
Price Millable Wheat Conversion
Item Base Case Venezuela Mexico Base Case Venezuela Mexico
No. 2 OB HRS $204/MT $204/MT
No. 2 OB HRW $188/MT $188/MT
Flour $.307/KG $.488/KG $0.247/KG 64% 75.5 % 72.5 %
First Clear $.285/KG 20%
By-Products $.140/KG $0.163/KG 14% 27.5 %
Invisible loss 2%
Screenings $.140/KG $.091/KG 24.5 %
Source: Data provided by industry participants in each country.

36
B a s e C a s e Venezuela0
5 0
1 0 0
1 5 0
2 0 0
2
2.2
2 .4
2 .6
2 .8
3V
alue
Add
ed (
$/M
T)
Stan
dard
Dev
iati
on (
$/M
T)
Value A d d e d : M ean Value Added : S td . Dev .
Figure 35. Comparison of Value Added: Base Case and for Venezuela.
B a s e C a s e M e x i c o N o . 2 O B H R W0
2 0
4 0
6 0
8 0
1 0 0
2
2.2
2 .4
2 .6
2 .8
3
Val
ue A
dded
($/
MT
)
Stan
dard
Dev
iati
on (
$/M
T)
V a l u e A d d e d : M e a n V a l u e A d d e d : S t d . D e v .
Figure 36. Comparison of Value Added: Base Case No. 2 OB HRW and for Mexico
37
CONCLUSIONS AND IMPLICATIONS
Increased concerns over the quality of wheat in domestic and export markets has focusedattention on the consistency of wheat quality. This study utilized three measures to examine theeffect of variability in characteristics on the milling value of wheat. Distributions and correlationsfor wheat quality characteristics were estimated from U.S. wheat export data from 1985-1997. Effects of variability of wheat characteristics on the value of wheat to the miller for each of thethree measures were estimated using a simulation model.
Effects of the variability of wheat characteristics were estimated for a millable wheatindex, net wheat price, and the value added in milling. Estimated results for exports of HRS bygrade indicated No. 1 HRS had about 1 percent more clean tempered wheat than did No. 2 OB. This translates into a lower wheat index score for No. 1 (0.97) than No. 2 OB (0.98) suggestingthat the actual cost of milling No. 1 HRS was lower in relation to its price than was the cost ofmilling No. 2 OB. Results for the net wheat price were similar to those for the millable wheatindex. Differences in the amount of millable wheat overshadowed the price spread in the basecase between No. 1 and No. 2 OB so that millers would pay less for the actual net wheat in No. 1($237.84) than in No. 2 OB ($238.78). Additionally, the results for the value added in millingalso indicated a higher value for No. 1 HRS ($78.57) than for No. 2 OB (77.44). However, thevariability of all three measures was higher for No. 1 HRS than for No. 2 OB.
Results for No. 1 HRS for all three measures were highly correlated with the moisturecontent, while results for No. 2 OB were correlated with moisture and to a lesser degree, dockageand foreign material. This was borne out by sensitivity analysis conducted on the variability ofdistributions for each of the wheat quality characteristics for both No. 1 and No. 2 OB HRS. Thesensitivity analysis indicated that increases in the consistency of moisture would provide thegreatest reduction in the variability of value as measured by net wheat prices and the value addedin milling. Increases in the consistency of foreign material, shrunken and broken kernels, anddockage had less impact on the variability of net wheat prices and the value added in milling. Thissuggests that millers looking to increase the value of wheat lots used in milling may want toconsider adding restrictions/incentives on moisture to limit the variability from lot to lot; however,for dockage, shrunken and broken kernels, and foreign material, the focus most likely should bemore on actual levels within lots rather than variability between lots.
Comparison of base case results for high (1.0 percent) and low (0.5 percent) dockagesamples of HRS indicated that differences in net wheat, millable wheat index score, and valueadded in milling between grades were larger than differences between high and low dockagesamples for a grade. Reduction of dockage for No. 1 HRS increased the average profit in millingby $0.77/MT. However, average net wheat prices for the high dockage No. 1 and the lowdockage No. 2 OB were similar.
Comparison across individual importing countries indicated that the amount of net wheatand millable wheat index scores varied by importer. Simulated net wheat for HRS exports toKorea was the highest of the countries examined and had similar variability across grades. Venezuela had the lowest net wheat of all the countries examined and was also the most
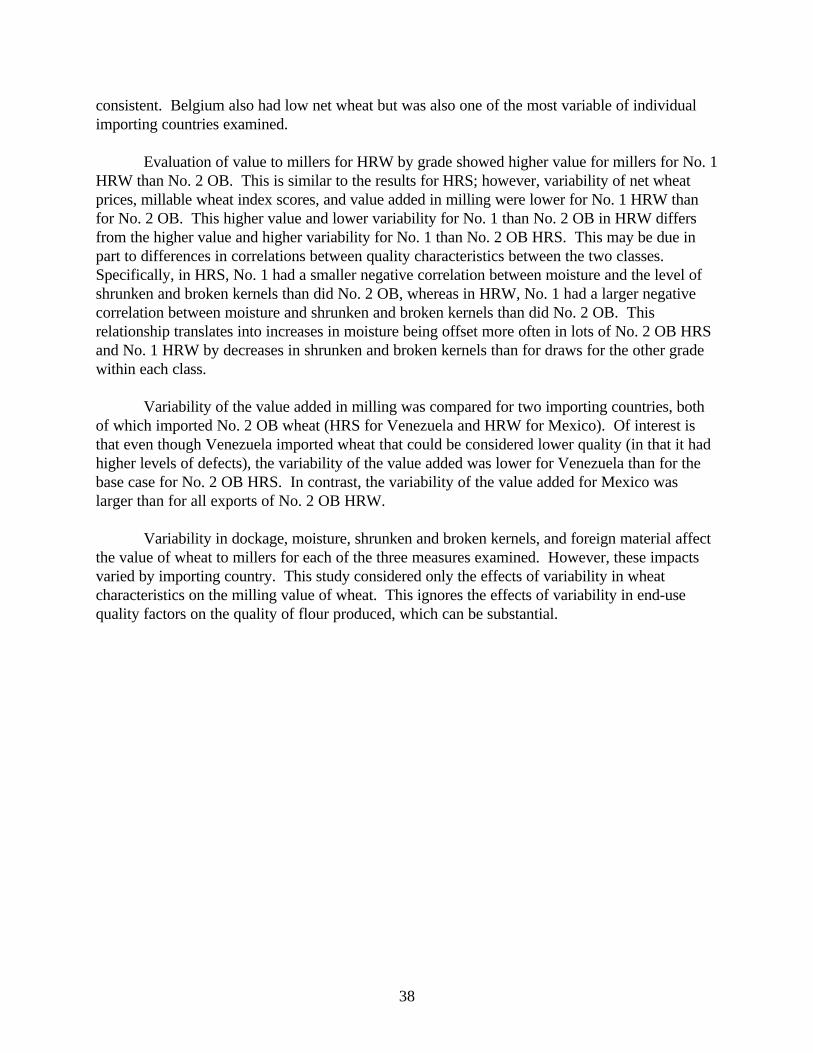
38
consistent. Belgium also had low net wheat but was also one of the most variable of individualimporting countries examined.
Evaluation of value to millers for HRW by grade showed higher value for millers for No. 1HRW than No. 2 OB. This is similar to the results for HRS; however, variability of net wheatprices, millable wheat index scores, and value added in milling were lower for No. 1 HRW thanfor No. 2 OB. This higher value and lower variability for No. 1 than No. 2 OB in HRW differsfrom the higher value and higher variability for No. 1 than No. 2 OB HRS. This may be due inpart to differences in correlations between quality characteristics between the two classes. Specifically, in HRS, No. 1 had a smaller negative correlation between moisture and the level ofshrunken and broken kernels than did No. 2 OB, whereas in HRW, No. 1 had a larger negativecorrelation between moisture and shrunken and broken kernels than did No. 2 OB. Thisrelationship translates into increases in moisture being offset more often in lots of No. 2 OB HRSand No. 1 HRW by decreases in shrunken and broken kernels than for draws for the other gradewithin each class.
Variability of the value added in milling was compared for two importing countries, bothof which imported No. 2 OB wheat (HRS for Venezuela and HRW for Mexico). Of interest isthat even though Venezuela imported wheat that could be considered lower quality (in that it hadhigher levels of defects), the variability of the value added was lower for Venezuela than for thebase case for No. 2 OB HRS. In contrast, the variability of the value added for Mexico waslarger than for all exports of No. 2 OB HRW.
Variability in dockage, moisture, shrunken and broken kernels, and foreign material affectthe value of wheat to millers for each of the three measures examined. However, these impactsvaried by importing country. This study considered only the effects of variability in wheatcharacteristics on the milling value of wheat. This ignores the effects of variability in end-usequality factors on the quality of flour produced, which can be substantial.

39
REFERENCES
Dahl, Bruce L., and William W. Wilson. 1998. Consistency of Quality Characteristics in HardRed Spring Wheats. Ag. Econ. Rpt. # 393, Department of Agricultural Economics, NorthDakota State University, Fargo, May.
Drynan, Robert. 1996. Economic Elements of Quality in Wheat Buying. Wheat MarketingCenter, Inc., Portland, OR.
Drynan, Robert. 1998. Wheat Quality in the Twenty-first Century. Wheat Marketing Center,Inc., Portland, OR.
Flagg, Tony. 1998. “A Flour Miller’s Perspective on Grain Moisture.” Paper presented at theInaugural National Wheat Industry Forum, Jan. 14-15, San Diego, CA.
Grains Council of Australia. 1995. Milling Wheat Project: Consultants Report.
Hill, Lowell D. 1990. Grain Grades and Standards: Historical Issues Shaping the Future. University of Illinois Press, Urbana.
Herrman, Tim, and Scott Baker. 1998. “Dough Prediction method of Pricing Wheat.” Paperpresented at the Inaugural National Wheat Industry Forum, Jan. 14-15, San Diego, CA.
Johnson, D. Demcey, William W. Wilson, and Matthew Diersen. 1995. Quality Uncertainty andGrain Merchandising Risk: Vomitoxin in Spring Wheat. Ag. Econ. Rpt. #333,Department of Agricultural Economics, North Dakota State University, Fargo, August.
Larue, B., and H.E. Lapan. 1992. “Market Structure, Quality, and World Wheat Market.” Canadian Journal of Agricultural Economics. July, Vol. 40(2):311-328.
Laffont, Jean-Jacques. 1989. The Economics of Uncertainty and Information. MIT Press,Cambridge Massachusetts, pp. 25-28.
Minnesota Association of Wheat Growers and Minnesota Wheat Research & Promotion Council. 1994. Identifying and Defining Key Quality Criteria for Spring Wheat Flour in theDomestic Market. Submitted by Ag-Nomics Research, Red Lake Falls, MN. September.
Mercier, S. 1993. The Role of Quality in Wheat Import Decision Making. Ag. Econ. Rpt. # 670,USDA, Commodity Economics Division, Economic Research Service, Washington, DC,December.
Palisade Corporation. 1997. BestFit User’s Guide. Palisade Corporation, Newfield, NY.
Palisade Corporation. 1996. Guide to Using @Risk. Palisade Corporation, Newfield, NY.

40
St. Pierre, N.R., and W.R. Harvey. 1986. “Incorporation of Uncertainty in Composition of Feedsinto Least-Cost Ration Models. 1. Chance Constrained Programming.” Journal of DairyScience. December, 69:3051-3062.
Stevens, Dennis G., and Frank T. Rowan. 1996. Procurement Systems of International Buyersand Changing Marketing Systems and Policies of International Competitors. ResearchProgram, Western Grain Marketing Panel. The Exchange Consulting Group, Winnipeg,Manitoba, May 3.
U.S. Congress Office of Technology Assessment. 1989. Grain Quality in International Trade:A Comparison of Major U.S. Competitors. F-402, Office of Technology Assessment,Washington, DC.
U.S. Department of Agriculture. 1997. Export Grain Inspection System (EGIS) Wheat Data. USDA-GIPSA, Washington, DC.
U.S. Wheat Associates. 1996. “Summary: Prioritization of Wheat Quality CompetitivenessIssues II.” Paper presented at USW Marketing Plan Conferences, Singapore, Cascais,Portugal, April-May.
Uri, Noel D., and Bengt Hyberg. 1996. “The Market Valuation of Wheat Quality Characteristics.” Journal of Economic Studies 23(3) pp. 44-63.
Veeman, M. 1987. "Hedonic Price Function for Wheat in the World Market: Implications forCanadian Wheat Export Strategy." Canadian Journal of Agricultural Economics.November, 35(4):535-52.
Wilson, W. 1989. "Differentiation and Implicit Prices in Export Wheat Markets," WesternJournal of Agricultural Economics 14:67-77.
Wilson, W. 1994. "Demand for Wheat Classes by Pacific Rim Countries," Journal ofAgricultural and Resource Economics, July.
Wilson, W., and P. Gallagher. 1990. "Quality Differences and Price Responsiveness of WheatClass Demands." Western Journal of Agricultural Economics December, Vol. 15(2):254-264.
Wilson, W., and T. Preszler. 1993a. "Quality and Price Competition in the International WheatMarket: A Case Study of the UK Wheat Import Market." Agribusiness: AnInternational Journal 9(4):377-389.
Wilson, W., and T. Preszler. 1993b. "End-Use Performance Uncertainty and Competition inInternational Wheat." American Journal of Agricultural Economics 74(3):556-563.

41
Appendix Table 1. Estimated Distribution Parameters and Test Statistics for SelectedCharacteristics of HRS No. 1 Export Shipments, 1985/86-1996/97
Dockage Moisture Shrunken andBroken
Foreign Material
DistributionType
Logistic Triangular Logistic Logistic
Parameter 1 0.69 9.5 1.45 0.2
Parameter 2 0.1 11.07 0.27 0.04
Parameter 3 14.02
Chi-Square 5.21* 13.45* 41.96Rejected
1.39*
Kolmogorov-Smirnov
0.07* 0.09* 0.12Rejected
0.27Rejected
Anderson-Darling
0.81* 1.43 2.81* 16.49Rejected
Appendix Table 2. Estimated Distribution Parameters and Test Statistics for SelectedCharacteristics of HRS No. 2 OB Export Shipments, 1985/86-1996/97
Dockage Moisture Shrunken andBroken
Foreign Material
DistributionType
Erlang Beta Weibull Beta
Parameter 1 17 5.36 4.83 4.31
Parameter 2 0.05 3.23 1.72 8.8
Chi-Square 309.8Rejected
535.34Rejected
176.1Rejected
168.1Rejected
Kolmogorov-Smirnov
0.04Rejected
0.05Rejected
0.07Rejected
0.17Rejected
Anderson-Darling
3.58* 3.49* 6.71Rejected
39.94Rejected
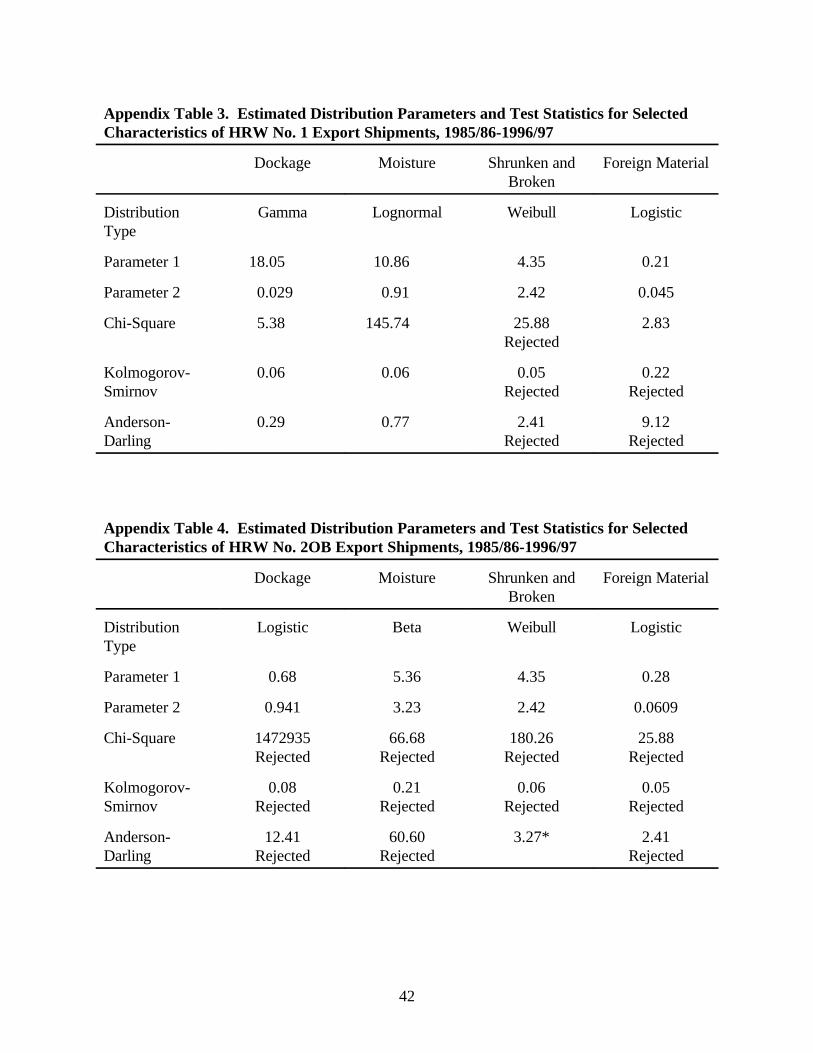
42
Appendix Table 3. Estimated Distribution Parameters and Test Statistics for SelectedCharacteristics of HRW No. 1 Export Shipments, 1985/86-1996/97
Dockage Moisture Shrunken andBroken
Foreign Material
DistributionType
Gamma Lognormal Weibull Logistic
Parameter 1 18.05 10.86 4.35 0.21
Parameter 2 0.029 0.91 2.42 0.045
Chi-Square 5.38 145.74 25.88Rejected
2.83
Kolmogorov-Smirnov
0.06 0.06 0.05Rejected
0.22Rejected
Anderson-Darling
0.29 0.77 2.41Rejected
9.12Rejected
Appendix Table 4. Estimated Distribution Parameters and Test Statistics for SelectedCharacteristics of HRW No. 2OB Export Shipments, 1985/86-1996/97
Dockage Moisture Shrunken andBroken
Foreign Material
DistributionType
Logistic Beta Weibull Logistic
Parameter 1 0.68 5.36 4.35 0.28
Parameter 2 0.941 3.23 2.42 0.0609
Chi-Square 1472935Rejected
66.68Rejected
180.26Rejected
25.88Rejected
Kolmogorov-Smirnov
0.08Rejected
0.21Rejected
0.06Rejected
0.05Rejected
Anderson-Darling
12.41Rejected
60.60Rejected
3.27* 2.41Rejected

43
Appendix Table 5. Estimated Distribution Parameters and Test Statistics for SelectedCharacteristics of HRS No. 1 Export Shipments to Korea, 1985/86-1996/97
Dockage Moisture Shrunken andBroken
Foreign Material
Distribution Logistic Extreme Value Weibull Logistic
Mean 0.69 11.38 1.60 0.20
Std. Dev. 0.19 0.95 0.36 0.08
Parameter 1 0.69 10.95 5.07 0.2
Parameter 2 0.1 0.74 1.74 0.04
Chi-Square 4.03 7.04 5.00
0.51
Kolmogorov-Smirnov
0.07 0.09* 0.13Rejected
0.24Rejected
Anderson-Darling
0.43 0.6 0.82* 5.95Rejected
Appendix Table 6. Estimated Distribution Parameters and Test Statistics for SelectedCharacteristics of HRS No. 2OB Export Shipments to Korea, 1985/86-1996/97
Dockage Moisture Shrunken andBroken
Foreign Material
Distribution Log Normal Logistic Log Normal Pearson 5
Mean 0.75 11.29 1.53 0.20
Std. Dev. 0.18 0.61 0.34 0.13
Parameter 1 0.75 11.29 1.53 4.38
Parameter 2 0.18 0.34 0.34 0.68
Chi-Square 3.82 2.76 8.67 4.69
Kolmogorov-Smirnov
0.06 0.09 0.09 0.47Rejected
Anderson-Darling
0.21 0.62 0.83 16.45Rejected

44
Appendix Table 7. Estimated Distribution Parameters and Test Statistics for SelectedCharacteristics of HRS No. 2 OB Export Shipments to Venezuela, 1985/86-1996/97
Dockage Moisture Shrunken andBroken
Foreign Material
Distribution Normal Beta Normal Lognorm2
Mean 0.81 12.72 1.57 0.36
Std. Dev. 0.20 0.53 0.43 0.14
Parameter 1 0.81 1.74 1.57 -1.1
Parameter 2 0.2 1.27* 2.15 +11.48
0.43 0.37
Chi-Square 4.436 0.273 2.44 6.271
Kolmogorov-Smirnov
0.083* 0.066* 0.094* 0.189Rejected
Anderson-Darling
0.822* 0.416* 1.101Rejected
3.529*
Appendix Table 8. Estimated Distribution Parameters and Test Statistics for SelectedCharacteristics of HRS No. 2 OB Export Shipments to Philippines, 1985/86-1996/97
Dockage Moisture Shrunken andBroken
Foreign Material
Distribution Erlang Lognormal Erlang Lognormal
Mean 0.78 11.79 1.55 0.29
Std. Dev. 0.18 0.82 0.35 0.13
Parameter 1 19.0 11.79 19.0 0.29
Parameter 2 0.0408 0.82 0.0814 0.13
Chi-Square 13.848 18.626Rejected
125.889Rejected
5.422
Kolmogorov-Smirnov
0.045* 0.056* 0.091* 0.362Rejected
Anderson-Darling
0.192* 0.695* 1.069* 18.654Rejected
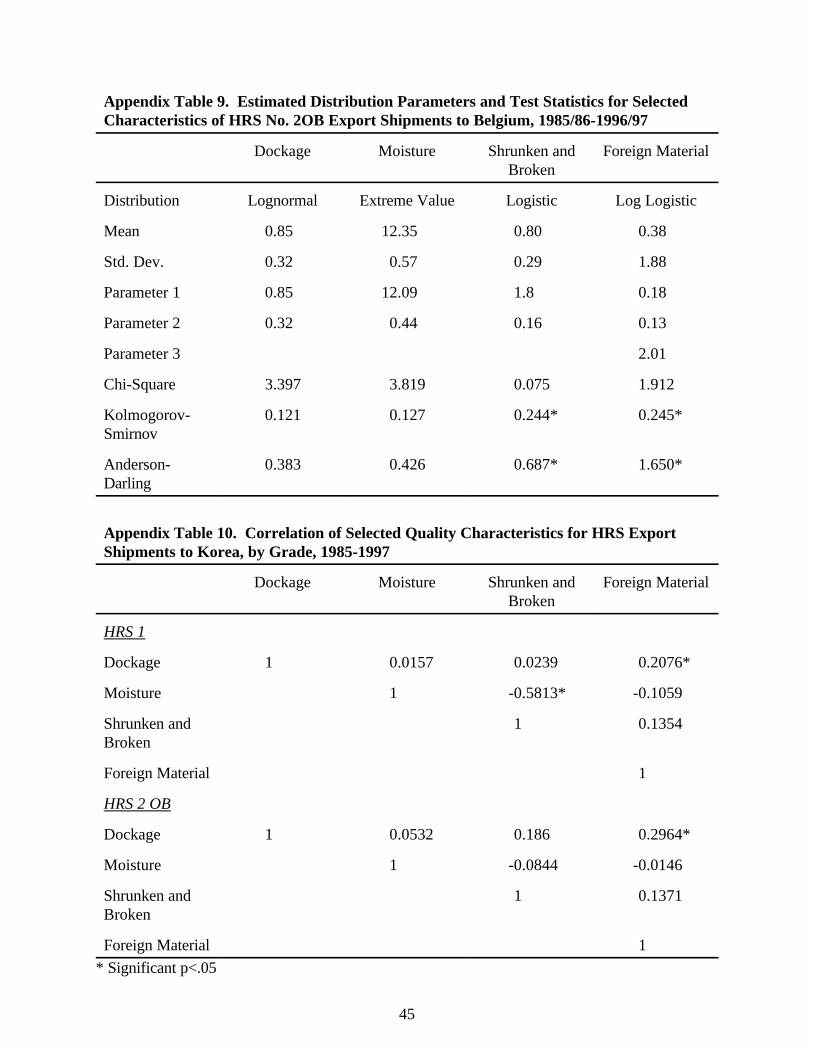
45
Appendix Table 9. Estimated Distribution Parameters and Test Statistics for SelectedCharacteristics of HRS No. 2OB Export Shipments to Belgium, 1985/86-1996/97
Dockage Moisture Shrunken andBroken
Foreign Material
Distribution Lognormal Extreme Value Logistic Log Logistic
Mean 0.85 12.35 0.80 0.38
Std. Dev. 0.32 0.57 0.29 1.88
Parameter 1 0.85 12.09 1.8 0.18
Parameter 2 0.32 0.44 0.16 0.13
Parameter 3 2.01
Chi-Square 3.397 3.819 0.075 1.912
Kolmogorov-Smirnov
0.121 0.127 0.244* 0.245*
Anderson-Darling
0.383 0.426 0.687* 1.650*
Appendix Table 10. Correlation of Selected Quality Characteristics for HRS ExportShipments to Korea, by Grade, 1985-1997
Dockage Moisture Shrunken andBroken
Foreign Material
HRS 1
Dockage 1 0.0157 0.0239 0.2076*
Moisture 1 -0.5813* -0.1059
Shrunken andBroken
1 0.1354
Foreign Material 1
HRS 2 OB
Dockage 1 0.0532 0.186 0.2964*
Moisture 1 -0.0844 -0.0146
Shrunken andBroken
1 0.1371
Foreign Material 1
* Significant p<.05
46
Appendix Table 11. Correlation of Selected Quality Characteristics for HRS ExportShipments to Selected Importing Countries, by Grade, 1985-1997
Dockage Moisture Shrunken andBroken
Foreign Material
Venezuela: HRS 2 OB
Dockage 1 -0.0963* 0.4270* 0.1137*
Moisture 1 -0.5564* 0.6351*
Shrunken andBroken
1 0.0815*
Foreign Material 1
Belgium: HRS 2 OB
Dockage 1 0.3284 0.3874* 0.5701*
Moisture 1 -0.3415 0.4470*
Shrunken andBroken
1 0.0892
Foreign Material 1
Philippines: HRS 2 OB
Dockage 1 0.1869* 0.0497 0.2495*
Moisture 1 -0.3009* 0.2513*
Shrunken andBroken
1 0.0316
Foreign Material 1
* Significant p<.05