Embed Size (px)
Citation preview
Louisiana State UniversityLSU Digital Commons
LSU Doctoral Dissertations Graduate School
2007
Effect of hole configurations on film cooling fromcylindrical inclined holes for the application to gasturbine bladesYiping LuLouisiana State University and Agricultural and Mechanical College, [email protected]
Follow this and additional works at: https://digitalcommons.lsu.edu/gradschool_dissertations
Part of the Engineering Science and Materials Commons
This Dissertation is brought to you for free and open access by the Graduate School at LSU Digital Commons. It has been accepted for inclusion inLSU Doctoral Dissertations by an authorized graduate school editor of LSU Digital Commons. For more information, please [email protected].
Recommended CitationLu, Yiping, "Effect of hole configurations on film cooling from cylindrical inclined holes for the application to gas turbine blades"(2007). LSU Doctoral Dissertations. 344.https://digitalcommons.lsu.edu/gradschool_dissertations/344

EFFECT OF HOLE CONFIGURATIONS ON FILM COOLING FROM CYLINDRICAL INCLINED HOLES FOR THE
APPLICATION TO GAS TURBINE BLADES
A Dissertation
Submitted to the Graduate Faculty of the
Louisiana State University and Agricultural and Mechanical College
in partial fulfillment of the requirements for the degree of
Doctor of Philosophy
in
The Interdepartmental Program in Engineering Science
by
Yiping Lu B.S., Mechanical Eng., East China Shipbuilding Institute, 1999 M.S. Mechanical Eng., East China Shipbuilding Institute, 2002
December 2007

ii
ACKNOWLEDGEMENTS
The gentle guidance and patience of Dr. Srinath V. Ekkad was more than what I would
have expected to find in an advisor. His continuing guidance and support throughout this
research project is greatly appreciated. I will always be indebted to him. I cannot leave
unmentioned the support of the remaining members of my committee, Dr.Keith Gonthier, Dr.
Yitsak Ram, Dr. Mark Davidson, and Dr. Dana Brown; without their support, this journey
would not have been completed. I also must thank all of my lab mates, both past and present.
Special thanks go out to Hasan Nasir, Eric Esposito, Alok Dhungel, Yap Sheng Goh, and
David Faureaux for their help and valuable suggestions on many occasions. Without their
help, it would have been difficult to finish many of my tasks. Their advice and help are
greatly appreciated. I also want to thank the staff at Louisiana State University for their
kindness and help during my study. Last and certainly not least, I have to thank my parents
for their unconditional support and encouragement. They played a crucial part throughout my
educational journey. I own them too much.
iii
TABLE OF CONTENTS
ACKNOWLEDGEMENTS ................................................................................................... ii
LIST OF TABLES ...................................................................................................................v
LIST OF FIGURES ............................................................................................................... vi
NOMENCLATURE.................................................................................................................x
ABSTRACT........................................................................................................................... xii
CHAPTER 1 INTRODUCTION ............................................................................................1 1.1 Turbine Film Cooling ................................................................................................1 1.2 Research Objectives...................................................................................................8 1.3 Literature Survey.......................................................................................................8
CHAPTER 2 EXPERIMENTAL APPARATUS ................................................................18 2.1 Compressor and Coolant Supply............................................................................18 2.2 Inlet Flow Characterization ....................................................................................19 2.3 Description of Temperature Measurements..........................................................19 2.4 Experimental Test Rig I ..........................................................................................20 2.5 Experimental Test Rig II.........................................................................................22 2.6 Film Cooling Configurations ..................................................................................24
2.6.1 Baseline...........................................................................................................25 2.6.2 Crescent and Converging Slot ........................................................................25 2.6.3 Trench Film Cooling.......................................................................................27 2.6.4 Cratered Film Cooling ....................................................................................28 2.6.5 Shaped Diffuser Film Cooling ........................................................................29
CHAPTER 3 EXPERIMENTAL METHODOLOGY .......................................................31 3.1 Transient Heat Transfer Theory ............................................................................31 3.2 Simplified Method Using Duhamel’s Superposition.............................................35 3.3 Regression Analysis Method ...................................................................................38 3.4 Infrared Thermography Technology .....................................................................40 3.5 Uncertainty Analysis................................................................................................44
CHAPTER 4 NUMERICAL STUDIES...............................................................................47 4.1 Geometry and Grid Details .....................................................................................47 4.2 Turbulence Model ....................................................................................................49
4.2.1 Boussinesq Approach vs. Reynolds Stress Transport Models........................50 4.2.2 The Standard ε−k Equations........................................................................52 4.2.3 The Reynolds Stress Transport Equations ......................................................53
4.3 Boundary Conditions...............................................................................................54 4.3.1 Solid Wall Boundaries ....................................................................................54 4.3.2 Inlet and Outlet Boundaries ............................................................................54

iv
4.4 Numerical Solution Procedure................................................................................55
CHAPTER 5 RESULTS........................................................................................................57 5.1 Results for Crescent and Converging Slot.............................................................57 5.2 Results for Trench and Shaped Diffuser Hole ......................................................64 5.3 Results for Cratered Cylindrical Inclined Hole ....................................................78 5.4 Numerical Results ....................................................................................................88
CHAPTER 6 SUMMARY...................................................................................................100
REFERENCES.....................................................................................................................102
VITA......................................................................................................................................109

v
LIST OF TABLES
Table 1 Trench film hole and flow geometry ..................................................................27
vi
LIST OF FIGURES
Fig 1.1 Components of gas turbine engine [1]...................................................................1
Fig 1.2 Development of Turbine Inlet Temperature [2] ....................................................2
Fig 1.3 Cooling concepts of a modern multi-pass turbine blade [3]..................................3
Fig 1.4 A typical cooled airfoil [4] ....................................................................................4
Fig 1.5 Working principle of film cooling [5] ...................................................................5
Fig 1.6 Compound Hole Configuration [6]........................................................................6
Fig 1.7 Configuration of multihole film cooling [7]..........................................................7
Fig 1.8 Velocity vectors on a plane between hole inlet and exit [35]..............................15
Fig 1.9 Computed velocity vectors inside a film hole [35]..............................................15
Fig 2.1 Atlas Copco GR 110 two-stage compressor........................................................18
Fig 2.2 Pneumatic valve...................................................................................................19
Fig 2.3 Schematic of the experimental test rig I ..............................................................20
Fig 2.4 Schematic of the experimental test rig II.............................................................22
Fig 2.5 Mesh Heater.........................................................................................................23
Fig 2.6 Thermal Response of Mesh Heater .....................................................................24
Fig 2.7 Test plate with cylindrical holes inclined at (a) °30 and (b) °35 ......................25
Fig 2.8 Solid model for (a) crescent and (b) converging slot ..........................................26
Fig 2.9 Geometries for (a) crescent and (b) converging slot ...........................................26

vii
Fig 2.10 Trench film hole configuration..........................................................................27
Fig 2.11 Trench cases with different hole configuration studied.....................................28
Fig 2.12 Cratered film hole configuration .......................................................................28
Fig 2.13 Cratered cases with different hole configuration studied ..................................29
Fig 2.14 Shaped diffuser film hole configuration............................................................30
Fig 2.15 Side view section from blade surface for shaped diffuser hole.........................30
Fig 3.1 Flow over a flat plate ...........................................................................................31
Fig 3.2 Semi-infinite solid assumption [57] ....................................................................33
Fig 3.3 Film cooling over a flat plate...............................................................................34
Fig 3.4 Discretized temperature response........................................................................36
Fig 3.5 Curve Fit of Raw Data from a Single Pixel.........................................................40
Fig 3.6 A schematic representation of the general thermographic measurement situation [64]...........................................................................................................................42
Fig 4.1 Schematic of overall extent of computation domain and coordinates system.....47
Fig 4.2 Computational Grid for Baseline Round Hole Case ...........................................48
Fig 4.3 Hole Intersection Grid Close-Up.........................................................................49
Fig 4.4 Grid independence check.....................................................................................56
Fig 5.1 Detailed film effectiveness distributions for baseline, crescent and converging slot at different blowing ratios .................................................................................58
Fig 5.2 Detailed heat transfer coefficient ratio distributions for baseline, crescent and converging slot cases at different blowing ratios.....................................................60
Fig 5.3 Effect of hole geometry on spanwise averaged film effectiveness distributions

viii
for baseline, crescent and converging slot at each blowing ratio ............................61
Fig 5.4 Effect of hole geometry on spanwise averaged heat transfer coefficient distributions for baseline, crescent and converging slot at each blowing ratio .......63
Fig 5.5 Effect of blowing ratio on overall area-averaged film effectiveness and heat transfer coefficient for baseline, crescent and converging slot................................64
Fig 5.6 Effect of blowing ratio on overall area-averaged heat flux ratio for baseline, crescent and converging slot....................................................................................64
Fig 5.7 Detailed film effectiveness distributions for baseline, trench and shaped hole cases at different blowing ratios ..............................................................................67
Fig 5.8 Detailed heat transfer coefficient ratio distributions for baseline, trench and shaped hole cases at different blowing ratios ..........................................................70
Fig 5.9 Effect of hole configuration on spanwise averaged film effectiveness distributions for baseline, trench and shaped hole cases at each blowing ratio .......73
Fig 5.10 Effect of hole configuration on spanwise averaged heat transfer coefficient ratio distributions for baseline, trench and shaped hole at each blowing ratio ................75
Fig 5.11 Effect of blowing ratio on overall area-averaged ..............................................77
Fig 5.12 Effect of blowing ratio on overall area-averaged heat flux ratio for baseline, trench and shaped hole cases ...................................................................................77
Fig 5.13 Detailed film effectiveness distributions for baseline, three cratered hole cases, one trench case and shaped hole at different blowing ratios ...................................79
Fig 5.14 Detailed heat transfer coefficient ratio distributions for baseline, three cratered hole cases, one trench case and shaped hole at different blowing ratios ………….82
Fig 5.15 Effect of hole configuration on spanwise averaged film effectiveness distributions for baseline, crater, trench and shaped hole at each blowing ratio .....84
Fig 5.16 Effect of hole configuration on spanwise averaged heat transfer coefficient ratio for baseline, crater, trench and shaped hole at each blowing ratio ..........................86
Fig 5.17 Effect of blowing ratio on overall area-averaged (a) film effectiveness, and (b) heat transfer coefficient ratios for baseline, three crater cases, one trench case and shaped hole...............................................................................................................87
Fig 5.18 Effect of blowing ratio on Overall heat flux ratio for baseline, three crater cases,
ix
one trench case and shaped hole ..............................................................................88
Fig 5.19 Secondary flow vectors colored by temperature, x/D=3, baseline ....................89
Fig 5.20 Secondary flow vectors colored by temperature, x/D=3, trench case 1 ............89
Fig 5.21 Secondary flow vectors colored by temperature, x/D=3, crater case 7 .............90
Fig 5.22 Computed non-dimensional temperature contours of the film temperature and mixing downstream of the holes ..............................................................................90
Fig 5.23 Secondary flow vectors at x/D=1, x/D=3 and x/D=7 for three geometries....92
Fig 5.24 Flow contours colored by z-vorticity, x/D=3 ....................................................93
Fig 5.25: Stagnation temperature at x/D=3, (a) baseline; (b) trench and (c) crater .........94
Fig 5.26 Mainstream-jet interactions for (a) baseline, (b) Trench Case 1 and (c) Crater Case 7.......................................................................................................................96
Fig 5.27 Film effectiveness distributions for simulation and experiment of (a) baseline, (b) Trench Case 1 and (c) Crater Case 7..................................................................97
Fig 5.28 Comparison of spanwise averaged film effectiveness.......................................98

x
NOMENCLATURE
pc specific heat
D film hole diameter
DR density ratios
hD hydraulic diameter
h heat transfer coefficient with film injection
0h heat transfer coefficient without holes
I momentum flux ratio or turbulent intensity
k thermal conductivity of test surface or turbulent kinetic energy
M blowing ratio, ρcUc / ρmUm
q ′′ heat flux with film injection
0q ′′ heat flux without film injection
Re free stream Reynolds number
t the time when the IR image was taken after the test was initiated.
T temperature
Tatm atmospheric temperature
cT coolant temperature
fT film temperature
iT initial temperature
mT mainstream temperature
wT prescribed wall temperature
uT free stream turbulence
Uc coolant velocity

xi
Um mainstream velocity
x streamwise distance along the test plate
y coordinate normal to surface
t∆ time step
Greek Symbols
η film effectiveness,
φ overall cooling effectiveness
µ viscosity of air
ε turbulent kinetic energy dissipation rate
ijτ specific Reynolds stress tensor
τj time step for Duhamel’s superposition theorem
Τmj temperature step for Duhamel’s superposition theorem

xii
ABSTRACT
Film cooling is one of the cooling systems investigated for the application to gas turbine
blades. Gas turbines use film cooling in addition to turbulated internal cooling to protect the
blades outer surface from hot gases. The present study concentrates on the experimental and
numerical investigation of film cooling performance for a row of cylindrical holes in a
modern turbine blade. The adiabatic film effectiveness and the heat transfer coefficient are
determined experimentally on a flat plate downstream of a row of inclined different
geometries hole exit by using a single test transient IR thermography technique. The focus of
this investigation is to investigate advanced cooling hole geometries on film cooling heat
transfer and cooling effectiveness over flat and turbine airfoil surfaces.
Four test designs, crescent and converging slot, trench and cratered hole exits, are tested.
Variations of these configurations are tested under two different test rigs. Results show that
both the crescent and slot exits reduce the jet momentum at exit and also provide significantly
higher film effectiveness with some increases in heat transfer coefficients. The trench where
in the jets come in and spread evenly into a slot before exiting. An optimum trench depth
exists at 0.75D as shallower and deeper trenches show worse performance. The cratered holes
increase film effectiveness over the baseline case by about 50%. However, they do not
provide significant lateral spreading as seen for trenched holes.
Meanwhile, film cooling predictions are used to understand the mechanisms of the jets
that exit these trenched holes and crater holes. The present work employs RSM (Reynolds
stress transport model) for simulation of turbulent flows in film cooling and the simulation
was run using FLUENT computer code. Comparisons are made with experimental data for
the film effectiveness distributions. Results show that the film cooling jet exiting the trenched

xiii
hole is more two-dimensional than the typical cylindrical holes and crater holes. Detailed
flow structure visualization shows that the trench design counteracts the detrimental vorticity
of the round hole flow, allowing it to remain attached to the surface.

1
CHAPTER 1 INTRODUCTION
1.1 Turbine Film Cooling
Gas turbines are used for aircraft propulsion and in land-based power generation or
industrial applications. In the 1930s, the development of high performance piston engines for
aircraft propulsion had reached its peak, with further performance increases being unlikely.
New technologies had to be developed in order to achieve the desired higher flight velocities,
higher thrust to weight ratios and reduced engine sizes. In the following years, two new
aircraft propulsion systems were developed and brought into service in military aircraft,
namely the rocket and the gas turbine engines.
The main three components of a gas turbine engine are compressor, combustor and
turbine as shown in Fig 1.1. The compressor compresses the incoming air to high pressure,
the combustor burns the fuel and produces high pressure, high temperature high velocity gas
and the turbine extracts the energy from the gas.
Fig 1.1 Components of gas turbine engine [1]

2
The continuous improvement in the performance of air-breathing propulsion systems
necessitates a continuous increase in the turbine inlet temperatures. This, coupled with the
demands of reduced size of the combustors, has put a significant burden on turbine
technology. Since the inlet temperatures of present generation gas turbines are much higher
than the melting temperatures of the available alloys used to make the turbine blades, cooling
of the blades is a critical issue in turbine technology. The development of turbine inlet
temperatures is shown in Fig 1.2. Improvements in blade materials have allowed an increase
of melting point around 200° and use of turbine cooling has allowed an increase of
approximately another 250°, which allow turbine inlet gas temperature above the melting
points of the materials used.
Fig 1.2 Development of Turbine Inlet Temperature [2]

3
Various internal and external cooling techniques are employed to bring down the
temperature of the blade material below its melting point. As shown in Fig 1.3 in internal
cooling, relatively cold air is bypassed from the compressor and passed through the hollow
passages inside the turbine blade. In external cooling, the bypassed air is exited out through
small holes at discrete locations of the turbine blade. This relatively cold air creates a
protective blanket that saves the turbine blade from the harsh environment. This type of
cooling is called film cooling.
Fig 1.3 Cooling concepts of a modern multi-pass turbine blade [3]
Turbine airfoil surfaces, shrouds, blade tips, and endwalls are all cooled using
discrete-hole film cooling. A typical cooled airfoil is shown in Fig 1.4. The figure shows the
various locations where coolant is injected into mainstream from inside the airfoil through
discrete holes. Film cooling protects the airfoil surface directly, compared to internal cooling

4
techniques that remove heat from the inside surface. Film cooling also removes heat from the
blade surface through the film hole by internal convection. The thermal protection is expected
to provide reduced heat load to the airfoil surface. Designers need to know the net heat load
into the component surface when film is injected. Due to the complex nature of discrete hole
injection, there is a need to know the local wall temperature under the film and the gas-side
heat transfer coefficient with film injection. Both these components are required to estimate
reduced heat load to the surface.
Fig 1.4 A typical cooled airfoil [4]
Film cooling, wherein cooler air from the compressor is injected near the blade surface
(through holes or slots) to provide a layer of cool fluid between the hot gases and the blade
surface, has been an effective approach for this purpose. The working principle of film
cooling is sketched in Fig 1.5 for injection of the coolant from a slot and from a row of holes.
The ejected cool air forms an insulating layer between the hot main flow and the surface to be
cooled, reducing thereby the heat transfer to the surface. The cooling effectiveness is high

5
close to the ejection and decreases progressively in downstream direction due to the mixing
of cooling film and hot main flow. The ejection from a slot is, therefore, more efficient than
the ejection from a row of holes, because the mixing process is less intensive for the closed
film ejected from a slot. But the high thermal stresses encountered on gas turbine blades and
vanes do not allow the use of long slots. The modern film cooled turbine blades, therefore,
are provided with rows of holes or rows of small slots.
Fig 1.5 Working principle of film cooling [5]
Flat surface models can be used to study the effects of individual parameters with relative
ease and are less expensive. Early studies have proved that the results obtained on simple
flat-surface models can be applied to real engine design with slight corrections. The effects of
geometrical parameters (hole geometry, shape, size, spacing) and flow parameters
(coolant-to-mainstream mass flux, temperature ratio, mainstream Reynolds number, velocity,
etc.) have been studied on flat surface. Also, the effects of pressure gradient and curved
surface have also been studied. Some studies have focused only on the heat transfer
coefficient enhancement and others have presented only film effectiveness results.
Heat transfer coefficient downstream of the film injection is enhanced due to increased
6
turbulence produced by mixing if the coolant jets with the mainstream boundary layer. This
increased turbulence locally enhances the heat transfer coefficients. The effect of the coolant
jet decreases downstream of injection as the jet structure dissipates and the mainstream
dominates the coolant film completely. The high heat transfer coefficient in the near injection
region is due to the three-dimensional nature of the jet, and far downstream (x/D>15), the jet
structure is completely absent and is two-dimensional in nature. The heat transfer coefficient
ratio decreases with increasing axial distance from the injection hole. About 15-hole
diameters downstream of injection, the film cooling effect disappears. The heat transfer
coefficient ratio is almost equal to unity.
There is a large body of existing literature on film cooling efficiency with the effect of
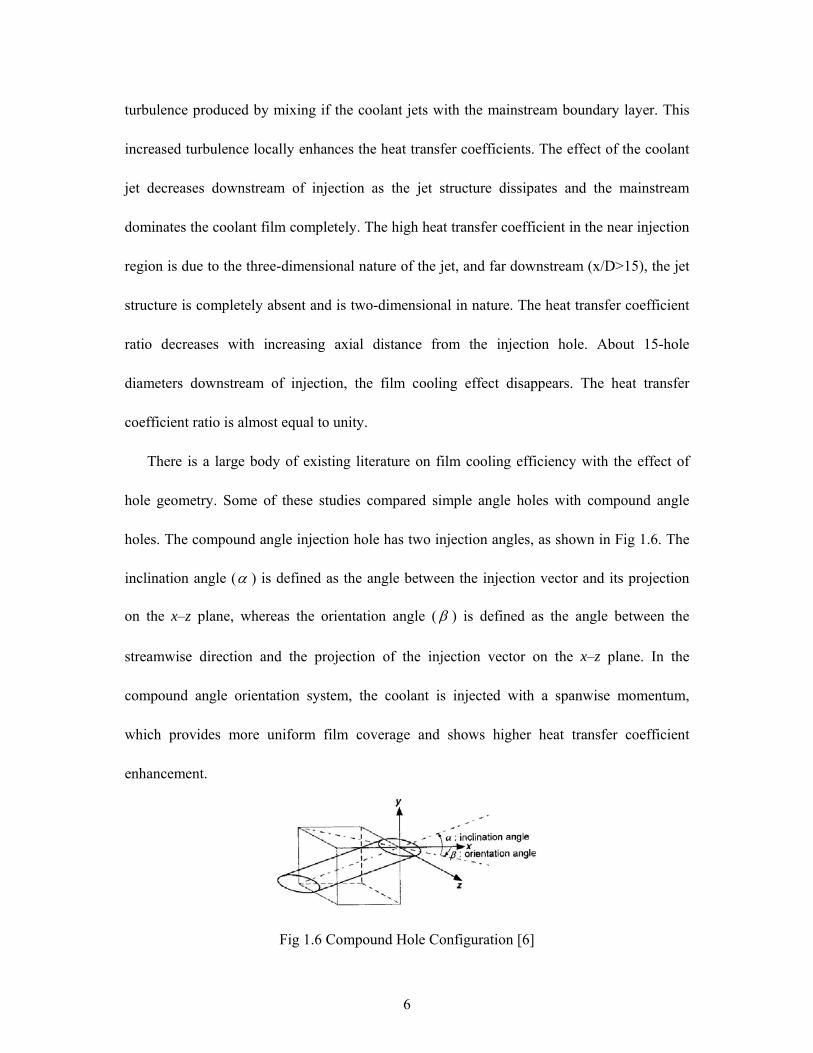
hole geometry. Some of these studies compared simple angle holes with compound angle
holes. The compound angle injection hole has two injection angles, as shown in Fig 1.6. The
inclination angle (α ) is defined as the angle between the injection vector and its projection
on the x–z plane, whereas the orientation angle ( β ) is defined as the angle between the
streamwise direction and the projection of the injection vector on the x–z plane. In the
compound angle orientation system, the coolant is injected with a spanwise momentum,
which provides more uniform film coverage and shows higher heat transfer coefficient
enhancement.
Fig 1.6 Compound Hole Configuration [6]

7
There are some researches about the multihole film cooling. The configuration of
multihole film cooling is illustrated in Fig 1.7: a large number of holes are drilled on the
combustor liner wall, normal or inclined to the wall surface, arranged in a specific pattern.
This cooling scheme functions through three processes. First, when the coolant flows through
the annular passage, heat is absorbed by the coolant from the hot wall by convection. Second,
the coolant passes through the small holes, leading to the so-called internal heat convection to
further cool the wall. Third, when the coolant is discharged from the holes, it forms a cooling
film. The second process accounts for the higher level of overall cooling effectiveness of this
cooling scheme than a conventional slot film cooling scheme. The second cooling process
contributes to the same degree provided the same hole diameter and inclination angle as well
as the same number of holes per unit area (hole opening density). Therefore, the potential to
further enhance cooling lies in the third process as different hole patterns could lead to
different adiabatic film cooling effectiveness (η ).
Fig 1.7 Configuration of multihole film cooling [7]

8
The design practice in the heat transfer community for film cooling has been mostly
empirical in nature, relying heavily on a large experimental database. However, there are
many parameters and factors that need to be considered. In general, it is important to
optimize the amount of coolant for airfoil film cooling under engine operating conditions. It
is also important to determine the effects of free-stream turbulence and unsteady wakes on
the airfoil film-cooling performance. The turbine-cooling system designers need to know
where the heat is transferred from the hot mainstream to the airfoil in order to design better
film-cooling patterns for airfoils. These film-hole patterns (i.e., film-hole location,
distribution, angle and shape) affect film cooling performance.
1.2 Research Objectives
The motivation behind this study is to develop and test innovative film cooling hole
geometries on film cooling heat transfer and cooling effectiveness over flat and turbine airfoil
surfaces. The basic aim of these proposed geometries is to alter the mainstream to directly
contact the test surface. Experiments will be conducted to study the effect of hole embedded
in transverse slots and hole exit area. Several variations of geometry will be investigated to
assist in future design changes. Also, the numerical prediction using FLUENT was performed
to determine the jet mainstream interactions to better understand the interaction between the
ejected coolant and the second flow and also the surface film effectiveness distributions.
1.3 Literature Survey
Flat surface film cooling has been known and subjected to research for a long time.
Goldstein et al. [8] described the effectiveness characteristics with lateral injection. The
effectiveness following single hole of the inclination angle of 15 and 35 deg were

9
investigated. They reported that the effect of lateral injection is to widen the temperature field
and decrease the peak effectiveness for the blowing ratio of 0.5. For the higher blowing ratios,
however, the lateral injection increases both the width of the temperature field and the peak
film cooling effectiveness. It is only recently that the compound angle injection has received
attention again. Mehendale and Han [9] studied the influence of high mainstream turbulence
on leading edge film cooling effectiveness and heat transfer coefficient. The orientation angle
was 90 deg and the results indicated that the film effectiveness decreases with increasing
blowing ratio, but the opposite was true for the heat transfer coefficient.
Honami et al. [10] described the behavior of the injected jet over a flat surface with 90
deg orientation angle holes. They measured streamwise mean velocity, boundary layer
temperature fields, and effectiveness distributions using liquid crystal. Their results show that
90 deg orientation angle injection forms an asymmetric structure with a large-scale vortex
motion on one side caused by the interaction with the mainstream. In addition, they
concluded that the asymmetry is promoted with increased mass flux ratio, resulting in low
film cooling effectiveness.
Schmidt et al. [11] measured the film cooling effectiveness using a single row of inclined
holes, which injected high-density, cryogenically cooled air. They reported that 60 deg
orientation angle injection at a high momentum flux ratio results in higher effectiveness
values than streamwise-directed holes. The forward expansion hole with compound angle
orientation showed significantly improved effectiveness.
Ekkad et al. [12] provided effectiveness results for two different density ratios. The
adopted orientation angles were 0, 45, and 90 deg. Using the transient liquid crystal technique,

10
they reported that compound angle injection produces higher film effectiveness than simple
angle injection for both density ratios. They concluded that the highest effectiveness was
obtained at a mass flux ratio of 1.0 for compound angle injection.
Ammari et al. [13] also presented the effect of density ratio on heat transfer coefficient
contours downstream of a film hole inclined °35 along the streamwise direction for two
different coolant-to-mainstream density ratios of 1.0 and 1.52 for a coolant blowing ratio of
M=1.46. Differences of 10% occurred when coolant densities were changed. It was observed
that lower-density injectant provides higher heat transfer coefficient at the same blowing ratio
due to higher momentum.
Bons et al.[14] studied the effect of high stream turbulence on film cooling effectiveness.
At high free stream turbulence, heat transfer coefficients with film cooling are not as
significantly as the film effectiveness. Film injection by itself produces high heat transfer
coefficient enhancement due to high turbulent mixing between jet mainstream.
Several investigators have studied the slot film cooling. Blair [15] investigated the slot
film cooling at the entry of a vane cascade endwall. Chyu [16] et al. provided film
effectiveness measurements downstream of 2-D slots modeled as gasp leakages, both aligned
and misaligned. Bunker [17] investigated film effectiveness for geometries wherein the
coolant from discrete holes enters a slot before mixing with the mainstream. Basically, the
angled holes are entrenched in a shallow trench. The holes embedded in the trench provided
higher film effectiveness distributions than the ones on the plane surface. However, Bunker
[17] provided only film effectiveness distributions and also the hole had a compound angle
(radial injection) in the lateral direction. Bunker [17] based their study on an earlier study by
11
Wang et al. [18]. Lu et al.[19] studied the effect of trench exit area and edge shape on film
cooling performance using an IR thermography method. Their results showed that the film
cooling holes provide higher film effectiveness when embedded in a trench. However, in
some geometries when the trench began at the upstream edge of the hole, the film
effectiveness diminished. The heat transfer coefficient enhancement due to the embedding
was not significantly higher compared to the typical unembedded cylindrical hole. The
overall heat flux ratio comparing film cooling with embedded holes to unembedded holes
shows that the full trench and downstream trench spacing after the hole exit produce the
highest heat flux reduction.
There are some studies in literature that deal with compound angle hole injection. Ligrani
et al. [20-21] studied the effects of compound angle injection for a single row and two
staggered rows of holes. Ligrani et al. [20-21] provided the first data relating to compound
angle hole injection. They indicated that compound angle injection significantly improved
film-cooling protection compared to the simple angle hole keeping all other parameters
constant. Ligrani et al. also provided temperature profiles of the jet exiting and mixing with
the mainstream. Sen et al. [22] and Schmidt et al. [23] compared simple angle injection to
compound angle injection and shaped hole injection. They also provided both heat transfer
coefficient and film effectiveness results. However, all the above studies provided very sparse
data on the heat transfer surface. Ekkad et al. [12, 24] provided detailed surface heat transfer
measurements using liquid crystal technique. However, they did not present any flow
measurements. It is clear that a comprehensive study on compound angle hole injection is
severely lacking in published literature. There is surely a need for a study that will provide a

12
more comprehensive database to understand compound angle hole film cooling.
Foster and Lampard [25] presented laterally averaged film effectiveness results over a flat
plat with °35 , °55 and °90 streamwise angles for long injection tubes spaced 3-diameters
apart. They used foreign gas injection to simulate a density ratio of 2.0. They however
measured only the film cooling effectiveness at blowing ratios of M=0.5 and 1.4. They also
did not measure the heat transfer coefficient distributions.
Kohli and Bogard [26] presented adiabatic effectiveness, thermal field, and velocity field
measurements for large streamwise angle injection over a flat surface. They compared the
results for °− 3555 injection for M=0.5 and 1.0 at a coolant-to-mainstream density ratio of
1.6 and low free-stream turbulence of 0.2%. They indicated that larger streamwise injection
angles provide 10% lower film effectiveness than shallow angles at low
coolant-to-mainstream momentum heat flux ratios. However, large angle injection provides
much lower effectiveness (30% less) than shallow angles at higher momentum flux ratios.
Kohli and Bogard [26] also provided thermal field distributions and indicated that °55 holes
have considerably greater diffusion of cooling jets near the holes compared to °35 holes.
Similarly, shaped holes have also been a focus of recent research. Makki and Jakubowski
[27] used forward-expanded holes and studied its effects on heat transfer. Sen et al. [22] and
Schmidt et al. [23] compared simple angle holes and compound angle holes to shaped holes.
They found that the shaped hole with forward expansion provided significantly larger lateral
film coverage than both the simple and compound angle holes. Gritsch et al. [28-29]
presented both discharge coefficients and film cooling effectiveness for three hole geometries.
They compared simple angle cylindrical holes, fan shaped holes and laidback fan shaped

13
holes. From their results, they indicated that laidback fan shaped holes provide higher
laterally averaged film cooling effectiveness due to increased laterally spreading of jets.
Shaping of holes has infinite possibilities. The above studies have just focused on a few
configurations that are fundamental to hole shaping. There are innumerable combinations for
hole shapes to finally optimize film hole geometry. In present study the author propose to
introduce two new hole shapes, which are both lateral and forward expanded and also attempt
a combination of both.
There have been several other studies in the recent years on flared holes. Sen et al. [22]
and Gritsch et al. [28-29] both studied some typical flared holes. These holes produced higher
film coverage on the surface but are limited in use due to difficulty in fabrication. Flaring of
hole increases coverage area on surface. Dittmar et al. [30] presented an assessment of
various film hole configurations in a simulated turbine surface experiment. They indicated
that shaped holes with compound angle produce the best effective cooling compared to the
other geometries. Sargison et al. [31] presented a converging slot-hole geometry similar to
the present study and compared it with typical cylindrical holes and flared holes. Since, in the
real engine, the presence of a slot violates mechanical integrity, the converging hole-to-slot
geometry presents unique advantages. The hole exit is a slot but the inlets are individual holes.
This produces almost similar results as the slot configurations. However, Sargison et al. [31]
provided only visualization results and no surface heat transfer data for the proposed
geometry.
Waye and Bogard [32] studied the presence of trenched holes on the suction side of a
vane. The narrow trench configuration provided the best adiabatic effectiveness performance.
14
In fact, the increasing adiabatic effectiveness levels with increasing blowing ratio indicated
that the trench suppressed coolant jet separation. This result is consistent with Bunker [17]
and Lu et al [19].
Fric and Campbell [33] investigated a so-called cratered film hole in which the circular
hole exits into a shallow right circular surface cup or depression. This was the first study on
this concept. They indicated that flow actually impinges on the edge of this depression
causing it to deflect and fill the depression prior to issuing onto the external surface. They
also indicated that flat plate tests showed about a 50% improved effectiveness over round
holes at M=1 and a greater increase as blowing ratio increases. Effectiveness improvement of
100% and more was observed at M=5. A suggested application in [33] is the full coverage
film cooling of combustor liners. However, they did not study the crater geometry and did not
provide any understanding on the heat transfer coefficient enhancement associated with it.
Hole supply geometry typically indicates how the coolant enters the film hole and what
happens to the coolant within the film hole. Burd et al. [34] made flow measurement son a
flat surface with different hole lengths feeding the film coolant. Leylek and Zerkle [35]
indicated that short holes are subjected to a “jetting” effect.
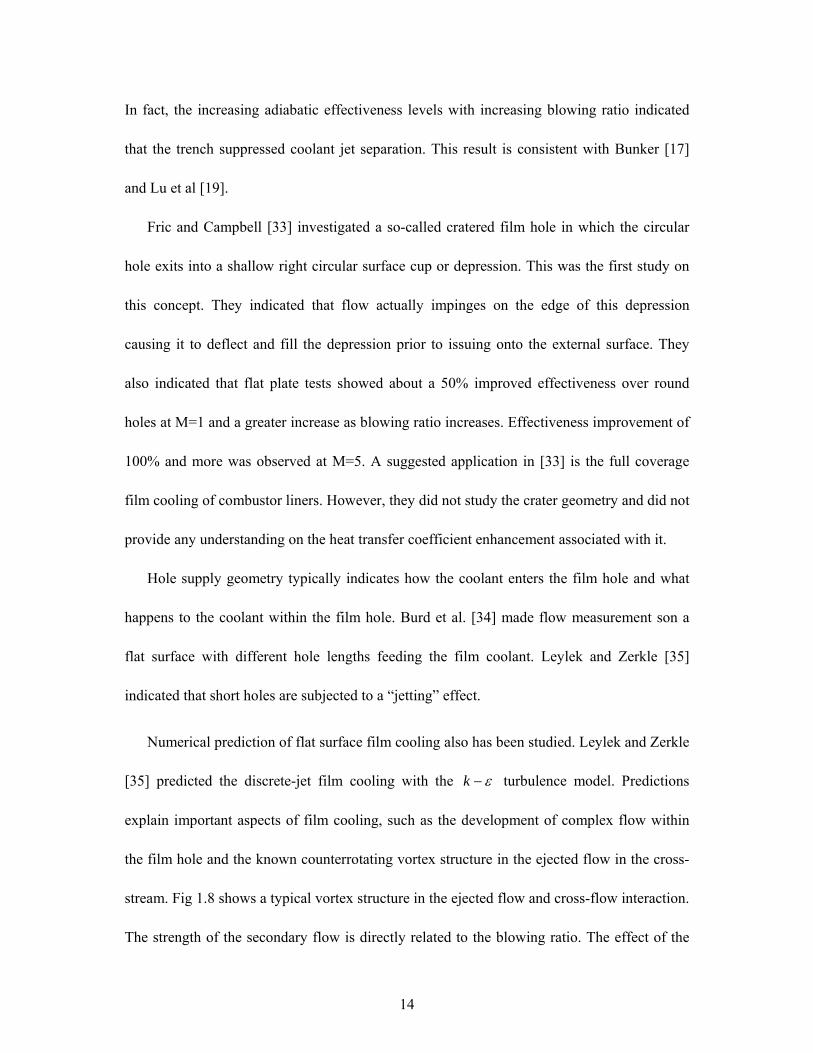
Numerical prediction of flat surface film cooling also has been studied. Leylek and Zerkle
[35] predicted the discrete-jet film cooling with the ε−k turbulence model. Predictions
explain important aspects of film cooling, such as the development of complex flow within
the film hole and the known counterrotating vortex structure in the ejected flow in the cross-
stream. Fig 1.8 shows a typical vortex structure in the ejected flow and cross-flow interaction.
The strength of the secondary flow is directly related to the blowing ratio. The effect of the
15
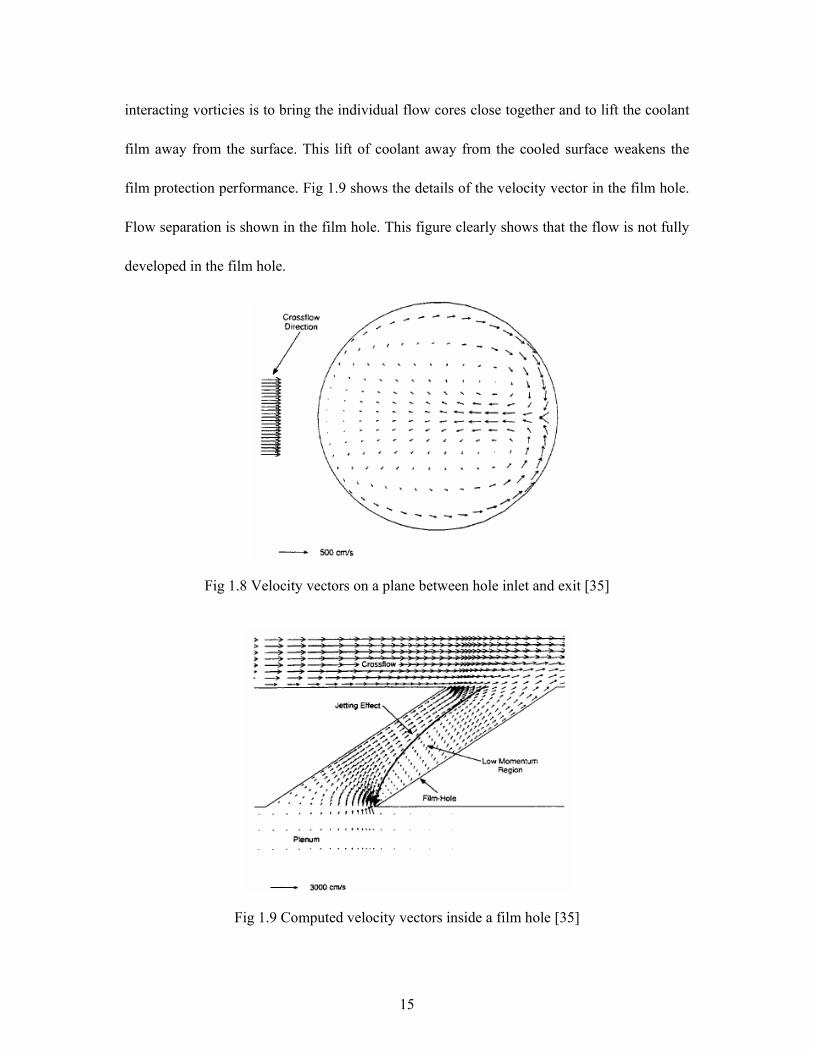
interacting vorticies is to bring the individual flow cores close together and to lift the coolant
film away from the surface. This lift of coolant away from the cooled surface weakens the
film protection performance. Fig 1.9 shows the details of the velocity vector in the film hole.
Flow separation is shown in the film hole. This figure clearly shows that the flow is not fully
developed in the film hole.
Fig 1.8 Velocity vectors on a plane between hole inlet and exit [35]
Fig 1.9 Computed velocity vectors inside a film hole [35]

16
Walters and Leylek [36] and Brittinghan and Leylek [37] did a detailed analysis of
film-cooling flow physics. They used the RAMPANT software package from Fluent, Inc. A
second-order discretization scheme was used with standard ε−k model with wall functions.
It is noted that the downstream behavior is highly sensitive to the near-field interaction that
serves to locate the coolant at some given position away from the wall.
Neelakantan and Crawford [38] predicted film-cooling effectiveness due to streamwise
and compound angle injection on a flat surface. They found that a one-equation turbulence
model performs better than a two-equation turbulence model in their film cooling predictions
with the TEXSTAN code. They found that the entrainment fraction correlates well with the
momentum flux ratio. For any given geometry, the entrainment fractions for a greater hole
spacing are seen to be greater. This indicates that the model correctly captures the increasing
dilution of the film coolant with increased hole spacing. They showed that drag coefficients
are parallel to each other for different hole spacings for the inline round hole. But a similar
pattern could not be seen in compound-angle holes. This can be explained by the fact that the
one-equation turbulence model does not capture the additional mixing resulting from the
compound angles.
Berhe and Patanka [39] did a study of discrete-hole film cooling using a standard ε−k
model. They compares the prediction of turbulence intensity with experimental observation.
Among other predictions, Bohn et al. [40] and Fougeres et al. [41] reported three-dimensional
conjugate flow and heat-transfer analysis of a film-clloed guide vane. Fukuyama et al. [42]
predicted vane surface film-cooling effectiveness. Hyams and Leylek [43] predicted details of
film cooling physics. Mcgovern and Leylek [44] did a film-cooling analysis with compound

17
angle injection. Giebert et al. [45] predicted film cooling from holes with expanded exits.
Lin et al. [46] computed the leading edge film cooling with injection through rows of
compound angle holes. They used a low-Reynolds number ω−k turbulence model in a
cell-centered finite volume code called CFL3D. He et al. [47] computed film cooling at the
leading edge region. Irmisch [48] simulated film-cooling aerodynamics with unstructured
mesh. In a series of publications Garg and Gaugler [49-53] predicted different aspects of film
cooling. Martin and Thole [54] did a benchmark prediction on leading edge film cooling, and
Walters et al. [55] predicted jet in cross-flow.

18
CHAPTER 2 EXPERIMENTAL APPARATUS
2.1 Compressor and Coolant Supply
An Atlas Copco GR110 compressor equipped with a Pneumatech Inc. air dryer is used as
the source of coolant air supply in the present study. The compressor supplies air to a large
tank capable of holding 7.57- 3m high pressure air. After exiting the compressor, the
pressurized air is sent to a desiccant dryer system to remove any moisture in the air. Fig 2.1
shows the Atlas Copco GR 110 compressor.
Fig 2.1 Atlas Copco GR 110 two-stage compressor
After exiting the dryer, compressed air is stored in the big tank which is filled up with
compressed air first and then the tank is emptied during a short duration. This storage tank
reduces the line pressure fluctuations at the test rig from periodic cycling of the compressor.
19
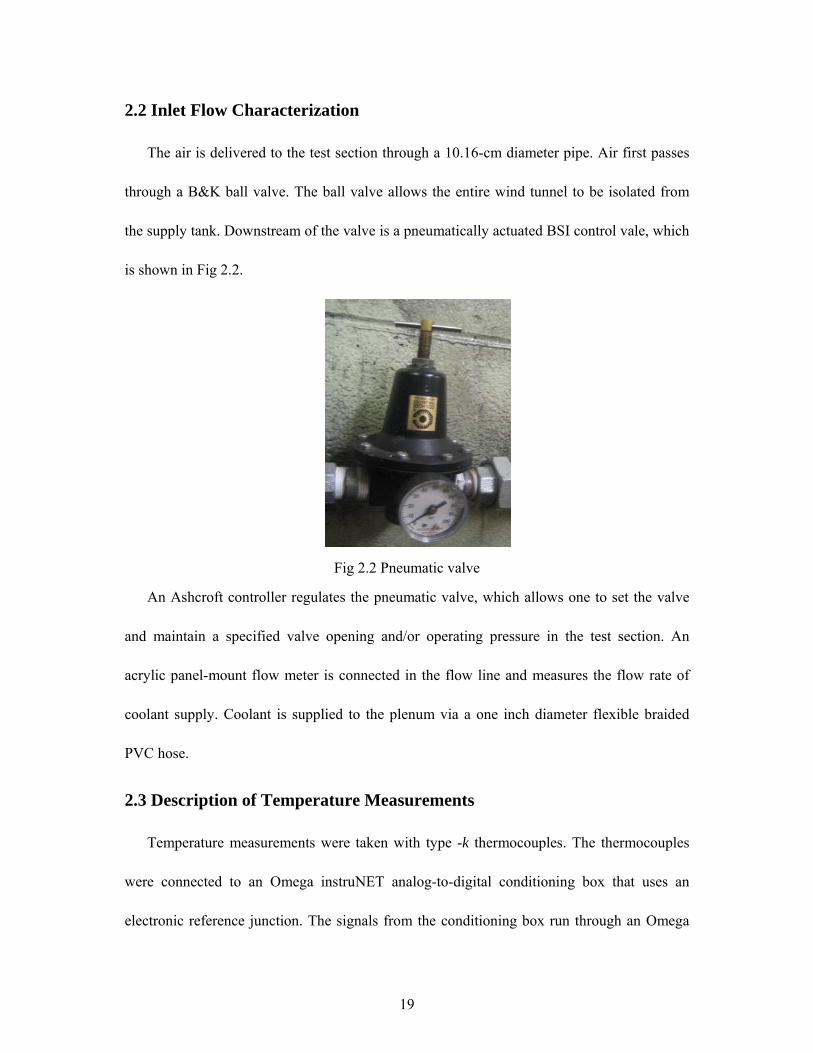
2.2 Inlet Flow Characterization
The air is delivered to the test section through a 10.16-cm diameter pipe. Air first passes
through a B&K ball valve. The ball valve allows the entire wind tunnel to be isolated from
the supply tank. Downstream of the valve is a pneumatically actuated BSI control vale, which
is shown in Fig 2.2.
Fig 2.2 Pneumatic valve
An Ashcroft controller regulates the pneumatic valve, which allows one to set the valve
and maintain a specified valve opening and/or operating pressure in the test section. An
acrylic panel-mount flow meter is connected in the flow line and measures the flow rate of
coolant supply. Coolant is supplied to the plenum via a one inch diameter flexible braided
PVC hose.
2.3 Description of Temperature Measurements
Temperature measurements were taken with type -k thermocouples. The thermocouples
were connected to an Omega instruNET analog-to-digital conditioning box that uses an
electronic reference junction. The signals from the conditioning box run through an Omega

20
instruNET PCI interface to a Pentium II computer running InstruNET software to
simultaneously record up to 8 thermocouples. 40 gage type –k thermocouples were used to
measure air temperatures and read surface temperatures of the test surface.
2.4 Experimental Test Rig I
Fig 2.3 shows the comprehensive view of the experimental test rig I. The test setup
consists of a blower connected to a 12 kW heater that heats the air to a free-stream
temperature of C°58 . The air is then routed through a section with baffles to ensure adequate
mixing of the hot air to obtain a uniform temperature across the cross-section. The presence
of the baffles is inadvertently contributed to the high free-stream turbulence in the
mainstream. The thermocouple was traversed across the test section to check for uniformity
of the inlet thermal field.
Fig 2.3 Schematic of the experimental test rig I

21
The air is then passed through a 2-D 4:1 converging nozzle. In order to allow the air to
heat up to the desired temperature, the air exiting the nozzle is initially routed out away from
the test section by using a by-pass gate. The temperature of the air is continuously monitored
at the exit of the gate and when the desired temperature is reached, the gate is fully opened.
The hot air is effectively sealed such that no air leaks into the test section and affects the
initial temperature condition of the test surface. The open gate allows the flow into a test
section made of Plexiglass and has a cross-section of 30-cm width and 9-cm height. The
components upstream of the test section are covered with insulation to minimize the heating
time. The bottom plate of the test section is made of 2.22-cm thick plexiglass. This plate has a
replaceable section about 25.4 cm downstream of the test section inlet. This replaceable
section can be interchanged to change the hole geometry. A trip is placed at the entrance to
the test section to produce a fully turbulent boundary layer over the test plate. The film holes
are located 30.5 cm downstream of the trip. The coolant air is provided from a separate
compressed air supply and is metered for the flow measurement. Air is then passed through a
heater to heat up the air.
Prior to the experiment, the coolant air is routed away from the test section using a
three-way diverter valve. When the valve is flipped, the coolant enters a plenum below the
test plate and is then ejected through the film cooling holes into the test section.
Thermocouples are mounted upstream of the hole row to measure the mainstream
temperature and inside one of the holes to measure the coolant exit temperature. The coolant
temperature is measured inside only one hole because pre-testing showed that all film holes
had the same flow rate and temperature conditions.

22
2.5 Experimental Test Rig II
Fig 2.4 Schematic of the experimental test rig II
Fig 2.4 shows the layout of the test rig used in trench and cratered film cooling. The test
rig was designed to provide improved heater response by reducing the thermal capacitance of
the heater. A fast response mesh heater was placed at the exit of the nozzle.
The mesh heater concept developed by Gillepsie et al. [56] has the capability of providing
an instantaneous temperature step to the mainstream air. The mesh used to build the heater
was 304 Stainless Steel woven wire mesh with a 20 micron wire diameter. The free area of
the mesh was 33.6% which helped in reducing the free stream turbulence before the test
section. Fig 2.5 shows the layout of the mesh heater. The low electrical resistance of the
dense wire mesh necessitated the use of a low voltage, high amperage power source. Power
was supplied to the heater using a Miller Dialarc 250 AC/DC welding machine. It was found
that when the heater was turned on, the steady state of temperature of the mesh was achieved
immediately. The test section is made of ABS material and has a cross-section of the same
size as test rig I. The top plate of the test section is made of 3-cm thick ABS.

23
Fig 2.5 Mesh Heater
Fig 2.6 shows the thermal response of the mesh heater measured with a 40 gage type –k
thermocouple. And we can see that when the heater was turned on, the steady state of
temperature of the mesh was achieved immediately and it proves that the response of the
heater agrees with a theoretical estimation of the response based on the capacitance of the
wires.
The infrared thermography system used in this study is a FLIR ThermaCAM SC 500. The
camera offers a high quality, non-intrusive method for obtaining thermal data through a
commercially available software package for data analysis. The camera has a range of
C°− 40 to C°500 . The ThermaCAM 500 utilizes uncooled microbolometer longwave
detectors to sense IR radiation. This makes them ideal for general thermal measurement
applications. The SC 500 system features real time 14-bit digital output, a 320 × 240 pixel
detector, precision temperature measurement, internal data storage, and outstanding thermal
sensitivity. The camera has following specifications: the field of view and minimum focus

24
distance are °24 × °18 and 0.5m respectively, the spectral range is 7.5 to 13 µm and
accuracy is +/- 2% or 2 °C
Fig 2.6 Thermal Response of Mesh Heater
. The test surface is viewed through a stretched polyurethane sheet. The sheet is thin
enough to cause very little effect on IR transmissivity. The system calibration is conducted
using a thermocouple placed on the black painted test surface to act as the benchmark. This
thermocouple is used to estimate the emissivity of the test surface. The emissivity of the
black painted test when viewed without the window is 0.96. The calibrated transmissivity for
the polyurethane sheet was 0.75.
2.6 Film Cooling Configurations
A total of fourteen test geometries, three and four blowing ratios each for test rig I and II,
were tested. Data was collected on the middle of two holes in the streamwise direction.

25
2.6.1 Baseline
There are two baseline test plates with different hole inclined angle used in this study.
The figure shows the test plate with °30 and °35 inclined angle respectively.
(a) (b)
Fig 2.7 Test plate with cylindrical holes inclined at (a) °30 and (b) °35
Fig 2.7 shows the baseline test plate with cylindrical hole geometry used in test rig I and
II. There are six holes of 1.27-cm diameter in each row inclined at (a) °30 and (b) °35
along the flow direction. The hole spacing between adjacent holes is 3-hole diameters for all
the holes.
2.6.2 Crescent and Converging Slot
Fig 2.8 shows the solid model for the test plate with (a) crescent and (b) converging slot
exit hole geometry. The film hole is inclined at °35 angle and there is 3-hole diameters hole
spacing for all holes.
Fig 2.9(a) shows the crescent shaped exit. The air enters through a cylindrical hole of
diameter 1.27-cm and exits through a crescent shaped that increases area of flow by a ratio of
2.1:1 compared to the inlet. The crescent shape reduces the possibility of hot gas ingestion on

26
the upstream side of the hole due to the front curvature. Fig 2.9(b) shows the converging slot
exit. The air enters through a cylindrical hole of diameter 1.27-cm and exits through a 2-D
slot that stretched across except for a small region between the slots. The
coolant-to-mainstream blowing ratios are based on the hole inlet area which is the same for
all the cases studied.
(a) (b)
Fig 2.8 Solid model for (a) crescent and (b) converging slot
(a) (b)
Fig 2.9 Geometries for (a) crescent and (b) converging slot

27
2.6.3 Trench Film Cooling
Fig 2.10 shows the solid model for trench film test plate which tests under test rig II. The
hole is inclined at °30 along the flow direction and the hole spacing between adjacent holes
is 3-hole diameter for all cases.
Table 1 lists the film hole geometry parameters and Fig 2.11 shows the trench film case.
Fig 2.10 Trench film hole configuration
Table 1 Trench film hole and flow geometry
Width Depth
Case 1 2D 0.5D Case 2 3D 0.5D Case 3 2D 0.75D Case 4 3D 0.75D Case 5 2D 1.0D Case 6 3D 1.0D

28
Fig 2.11 Trench cases with different hole configuration studied
2.6.4 Cratered Film Cooling
Fig 2.12 shows the cratered case we studied here. All the crater holes have the same
crater depth of 0.5 hole diameter.
Fig 2.12 Cratered film hole configuration
The layout of this configuration with the labeled geometrical parameters is pictured in
Fig 2.13(a-c). Case 7 is denoted as the cratered case where the hole is offset in the crater such
that the crater and hole upstream edge match. There is a crater region downstream of the hole

29
which is one hole diameter long. The width of the crater is 2-hole diameters wide.
Case 8 is the concentric geometry where the hole and the crater center are matched. The
crater is all around the hole exit.
Case 9 is when the crater is truly circular and both the upstream and downstream edges
of the holes and craters match. There is crater area only around the sides of the hole.
The baseline and three crater geometries are clearly indicative of some of the masking
strategies for the TBC coated surfaces.
Case 7 Case 8 Case 9
Fig 2.13 Cratered cases with different hole configuration studied
2.6.5 Shaped Diffuser Film Cooling
The final geometry tested was shaped diffuser film hole. This design offers high exit
area for coolant jet therefore reducing the hole exit velocity. Fig 2.14 shows the shaped hole
configuration.
For the shaped diffuser hole, the hole inclination angle is set as 30 degree and the length
of the cylindrical inlet portion l is twice the diameter of the hole. The hole compound angle is
set as 15 degree.
Fig 2.15 gives a side view section from blade surface of the configuration.

30
Fig 2.14 Shaped diffuser film hole configuration
Fig 2.15 Side view section from blade surface for shaped diffuser hole

31
CHAPTER 3 EXPERIMENTAL METHODOLOGY
The main goals of this study are to determine the heat transfer coefficients and film
effectiveness under different hole geometries. The chapter will present the heat transfer
model, the boundary conditions and assumptions behind the model.
3.1 Transient Heat Transfer Theory
Consider the transient flow over a flat plate as shown in Fig 3.1. In this case, the test plate
is initially at a uniform temperature, iT , and the convective boundary condition is suddenly
applied on the plate at time, t >0. Now, if we assume that heat is conducted only in
x-direction and perform an energy balance on the plate, we get
Fig 3.1 Flow over a flat plate
The 1-D transient conduction equation
tT
xT
∂∂
=∂
∂α1
2
2 (1)
The boundary conditions (BC) is
At x = 0, [ ]),0(| 0 tTThxTk mx −=
∂∂
− =
The initial condition (IC) is
At t = 0, T = iT

32
Equation (1) is a second order partial differential equation; therefore one more BC is required
to solve the equation.
The variables used in the above equations are as follows:
wT = The prescribed wall temperature
iT = Initial temperature of the test surface
mT = Mainstream temperature
k = Thermal conductivity of test surface
α = Thermal diffusivity of test surface
t = Time when the IR image was taken after the test was initiated.
h = Heat transfer coefficient
The main approximation often applied to analyze transient conduction shown in Fig 3.1 is the
semi-infinite approximation. Semi-infinite solids can be visualized as very thick walls with
one side exposed to some fluid. The other side, since the wall is very thick, remains
unaffected by the fluid temperature. This is illustrated in Fig 3.2. The semi-infinite solid
assumption can also be applied to any situation where the thermal wave applied to one end
does not reach the other end during the time frame of interest or test duration.
The semi-infinite solid assumptions give an additional BC, which is expressed as: at x =
∝, iTT = for all t
The semi-infinite solid assumptions are valid for our case for two reasons. The test
duration is small, usually less than 40 seconds. Secondly, the test surface is made of Plexiglas
or ABS that has low thermal conductivity, low thermal diffusivity and low lateral conduction.
Combinations of the above facts make sure that heat is conducted only in the x-direction and

33
it does not reach the bottom of the test surface.
Fig 3.2 Semi-infinite solid assumption [57]
Solving Equation (1) with the prescribed initial and boundary conditions, we can obtain
the non-dimensional temperature at the convective boundary surface [58]:
⎥⎥⎦
⎤
⎢⎢⎣
⎡⎟⎟⎠
⎞⎜⎜⎝
⎛⎥⎦
⎤⎢⎣
⎡⎟⎟⎠
⎞⎜⎜⎝
⎛−=
−−
ktherfc
kth
TTTT
im
iw αα2
2
exp1 (2)
For infrared (IR) technique, wT is the wall temperature that we measure with IR camera.
The initial temperature ( iT ) of the test surface and the mainstream temperature ( mT ) can be
measured before and during test respectively. The properties of test surface such as thermal
conductivity ( k ) and thermal diffusivity (α ) are also known. For infrared technique, t is the
time when the IR image was taken after the test was initiated. So, basically, except heat
transfer coefficient ( h ), all the variables in the above equation are either known or measured.
Unlike the heat transfer coefficient measurement for flow over a flat surface, film cooling

34
over a surface is a three-temperature problem (Fig 3.3). The three temperatures involved are
the mainstream temperature ( mT ), the coolant temperature ( cT ) and the wall temperature ( wT ).
In film-cooling situations, the mainstream temperature in Equation (2) must be replaced by a
film temperature ( fT ), which is a mixed temperature between the mainstream and coolant
temperatures. The film temperature depends on the local mixing between the two streams. In
this case, the heat flux into the surface is
( )wfff TThq −=′′
In the event, the surface is adiabatic, then the film temperature will be equal to the
adiabatic wall temperature. There are two unknowns in the above equation, the heat transfer
coefficient ( fh ) and film temperature ( fT ).
Fig 3.3 Film cooling over a flat plate
To find the unknown fT in terms of known quantities mT and cT , a
non-dimensional temperature is defined as the film-cooling effectiveness (η).
mC
mf
TTTT
−
−=η
Or mcmmcf TTTTTT )1()( ηηη −+=+−= (3)
Note that the highest and lowest value of the film-cooling effectiveness can be 1 and 0
respectively. When the film temperature ( fT ) is same as the mainstream temperature ( mT ),
film-cooling effectiveness (η) equals the value of 0 and when the film temperature ( fT ) is

35
same as the coolant temperature ( cT ), film-cooling effectiveness (η) equals the value of 1.
Replacing Tm in Equation (2) by fT from Equation (3), the following equation in terms
of two unknowns, h and η is obtained.
( )[ ]imciw TTTk
therfck
thTT −−+×⎥⎥⎦
⎤
⎢⎢⎣
⎡⎟⎟⎠
⎞⎜⎜⎝
⎛⎟⎟⎠
⎞⎜⎜⎝
⎛−=− ηηαα 1exp1 2
2 (4)
The above equation assumes a step change in mainstream temperature, which is not true
in the transient experiment. There are two methods presented here to represent the response
of the changing mainstream temperature. In the first part of the study a simplified method
applying the Duhamel’s superposition theorem was used. In an effort to increase accuracy, a
more detailed approach involving the regression analysis of an overconstrained system of
equations was developed for trench and crater case.
3.2 Simplified Method Using Duhamel’s Superposition
A single temperature method was used in the study on the crescent and converging slot
hole exit. In the actual experiment the heater response was not adequate fast to assume a step
change in mainstream gas temperature. The heater’s internal capacitance caused the
temperature rise to follow somewhat of an exponential response. This response was captured
by a thermocouple located at the entrance to the test section. Fig 3.4 shows a typical
temperature response and the discretization of the data.
With this discretized data, the mainstream temperature rise is simulated as a superposed
set of elemental steps using the Duhamel’s superposition theorem. Metzger and Larson [59]
showed that the wall temperature response can be represented as
( )∑=
∆−=−N
jmjiw TtUTT
1
τ (5)

36
Fig 3.4 Discretized temperature response
where
( ) ( ) ( )⎥⎦⎤
⎢⎣⎡ −⎥
⎦
⎤⎢⎣
⎡−−=− jjj t
kherfct
khtU τατατ 2
2
exp1 (6)
The superposition is imposed by measuring the mainstream temperature (Tm) variation with
time (τ) during the transient test. The step changes are then input into the Equation (4) to
obtain the unknown heat transfer coefficient and film effectiveness.
To obtain both the heat transfer coefficient (h) and film-cooling effectiveness (η), it is
necessary to obtain two equations with two unknowns (h and η) and solve for h and η.
Vedula and Metzger [60] presented a method wherein two times can be obtained from a
single transient test at every location. If during the transient, the test surface indicates one
surface temperature (Tw1) at time, t1 and another surface temperature (Tw2) at time, t2.
Basically, two events are measured at every point leading to the solution of both h and fT
from the simultaneous solution of the two equations:

37
⎟⎟⎠
⎞⎜⎜⎝
⎛⎟⎟⎠
⎞⎜⎜⎝
⎛−=
−−
⎟⎟⎠
⎞⎜⎜⎝
⎛⎟⎟⎠
⎞⎜⎜⎝
⎛−=
−−
kth
erfck
thTTTT
kth
erfck
thTTTT
if
iw
if
iw
22
22
2
12
12
1
exp1
exp1
αα
αα
(7)
Ekkad et al. [61] and Du et al. [62] used a transient cooling technique to eliminate the use of
superposition integration for the mainstream and coolant temperatures but they still needed
two different tests to obtain both heat transfer coefficient and film effectiveness at every point
on the surface
In the present study, a transient infrared thermography technique described by Ekkad [63]
will be used to obtain both heat transfer coefficient and film effectiveness from a single test.
In this test, two images with surface temperature distributions are captured at two different
times during the transient test. The two temperatures at two different instants are used in the
two equations (Equation 7) shown above to calculate both heat transfer coefficient and film
temperature. The Equation 4 accounts for the exponential rise in mainstream gas temperature
and was used to compute film effectiveness and heat transfer coefficients for crescent and
converging slot cases.
A new term called net heat flux ratio is used to measure the combined effect of film
effectiveness and heat transfer coefficient. Net heat flux ratio is the ratio of heat flux to the
surface with film injection to the heat flux without film injection. If the value is greater than
1.0, then the presence of film cooling is detrimental. If the value is less than 1.0 that means
surface is being benefited by film cooling. Net heat flux ratio is expressed as
⎟⎟⎠
⎞⎜⎜⎝
⎛−=
′′′′
φη1
00 hh

38
Where,
h = heat transfer coefficient with film injection
h0= heat transfer coefficient without holes
η = film cooling effectiveness
φ=overall cooling effectiveness, )()( cmcf TTTT −−
q ′′ = heat flux with film injection
0q ′′ = heat flux without film holes
The termφ ranges between 0.5 and 0.7 for typical blade cooling systems. In this study, a
typical value of 0.6 is chosen.
Another term called blowing ratio, M is used to measure amount of coolant being injected
in comparison to mainstream flow. It is defined as the ratio of the mass flux of the coolant to
the mass flux of the mainstream or M =mm
cc
UU
ρρ
where,
ρ = density
and U = Velocity
The subscript c stands for coolant and m for mainstream. The higher the blowing ratio,
the more is the coolant mass flux and blowing ratio, M=0 represents no injection case.
3.3 Regression Analysis Method
The trench and cratered hole cases used a slightly different technique to further reduce
experimental error. The methodology used previously relies on the summation of small
temperature and time steps associated with the transient nature of the mainstream temperature

39
rise. Although this method is commonly accepted, the uncertainty of the thermocouple
reading of the mainstream temperature can lead to overall uncertainty in the experiment of
around 8%. In an effort to reduce this uncertainty, the mesh heater was designed to provide a
true step change in mainstream temperature at the start of a test. Due to the extremely fast
response of the heater, the Duhamel’s superposition method previously used to account for
slow heater responses was not needed for this part. The true step change in mainstream
temperature allows the use of the original solution to the transient heating of the wall,
Equation 4. This decreases uncertainty by eliminating the reliance on recorded thermal
response of the heaters.
For the transient experiment considered in this part, the parameters to be determined are
h and η . The determination of h and η is done using a one-dimensional non-linear
least-square regression. It is possible to obtain for any position on the test surface the time
IRt at which a specific temperature IRT appears during a transient experiment as:
IRttw ThTIR
==
),( η (8)
The values of IRT for one specific transient experiment vary locally on the surface as
they depend on the heat transfer coefficient h and film cooling effectiveness η . For each
experiment i , Equation (8) can be written as :
0),( =−= IRittw ThT
IRiη Ni ,.....1=∀ (9)
For 2≥N , the optimal solution for the two unknows parameters which fits best these N
equations is then given by the minimum of the following error function:
0),(]),([1
2 ≥=−∑=
=ηη heThT
N
iIRittw
IRi (10)
Plug Equation (4) into the above equation and the conduction equation was solved for all

40
points of data for each pixel. This resulted in a residual error for each time-temperature data
pair. The residual error was minimized in a least squares sense solving for the heat transfer
coefficient and film effectiveness that best fit all data.
The regression method reduces the random IR camera read errors and also relaxes the
dependence on the initial temperature of the test surface on the results. Fig 3.5 shows a
typical time-temperature response of a single pixel and the best curve fit solution of the data.
Fig 3.5 Curve Fit of Raw Data from a Single Pixel
3.4 Infrared Thermography Technology
We know that the objects at a temperature above zero can emit thermal radiation in all
wavelengths into space. Thermal radiation is defined as electromagnetic radiation that the
energy is emitted by an object due to the object’s temperature.
Thermography is the use of an infrared imaging and measurement camera to "see" and
"measure" thermal energy emitted from an object. Thermal, or infrared radiation, is
electromagnetic radiation that is not visible because its wavelength is longer than that of

41
visible light. Unlike visible light, in the infrared world, everything with a temperature above
zero emits heat. It is observed that the higher the object's temperature, the greater the IR
radiation emitted. Infrared allows us to see what our eyes cannot. Infrared thermography
cameras produce images of invisible infrared or "heat" radiation and provide precise
non-contact temperature measurement capabilities
When viewing an object, the camera receives radiation not only from the object itself, but
also collects radiation from the surroundings reflected via the object surface. Both these
radiation contributions become attenuated to some extent by the atmosphere in the
measurement path. Also, radiation contribution comes from the atmosphere itself. The Fig 3.6
represents the description of the measurement situation in real conditions. What has been
neglected could for instance be sun light scattering in the atmosphere or stray radiation from
intense radiation sources outside the field of view. Fortunately, in most cases they are small
enough to be neglected.
Assume that the received radiation power W from a blackbody at source temperature Ts
generates a camera output signal Us which is proportional to the power input (power linear
camera). We can write the following equation:
Us= C×W (Ts) or Us = CWs
where C is constant. Should the source be a graybody with emittance ε , the received
radiation would beε Ws.

42
Fig 3.6 A schematic representation of the general thermographic measurement situation [64]
From Fig 3.6, we are now ready to write the three collected radiation power terms:
Emission from the object = ε τ Wobj, where ε is the emittance of the object and τ is
the transmittance of the atmosphere. The object temperature is Tobj.
Reflected emission from the ambient source = (1- ε ) τ Wref, where (1- ε ) is the
reflectance of the object. The ambient sources have the temperature Tref. It is assumed that the
temperature Tref is the same for all emitting surfaces within the half sphere seen from a point
on the object surface. This is a necessary simplification in order to derive a workable formula.
Also, we have assumed that the emittance for the surroundings is equal to 1. This is correct in
accordance with Kirchoff’s law: All radiation impinging on the surrounding surfaces will be
absorbed by the same surfaces.
Emission from the atmosphere = (1-τ )τ Watm, where (1-τ ) is the emittance of the
atmosphere. The temperature of the atmosphere is Tatm.

43
The total received radiation power can be written as [64]
Wtot = ε τ Wobj + (1-ε )τ Wref + (1-τ )τ Watm
We multiply each term by the constant C of equation 1 and replace the CW products by the
corresponding U according to the same equation and get the following equation
Utot = ε τ Uobj + (1-ε )τ Urefl + (1-τ )τ Uatm
Solving the above equation for Uobj
Uobj = ετ1 Utot -
εε−1 Urefl -
εττ−1 Uatm
This is the general measurement formula used in the Infrared (IR) camera used for the
measurement.
To measure temperature accurately, it is necessary to compensate for the effects of a
number of different radiation sources. This is done on-line automatically by the camera. The
following object parameters must, however, be supplied for the camera:
The object emissivity, ε
The relative humidity
Transmittance of the atmosphere, τ atm
Object distance
The effective temperature of the object surrounding, or the reflected ambient
temperature Tref
The temperature of the atmosphere Tatm
Among all the parameters: the relative humidity and object distance are easy to measure.
The two temperatures are less of a problem provided the surroundings does not contain large
and intense radiation sources. If the atmosphere is air (like in our case), then we can safely

44
assume the transmittance of atmosphere as 1.
The test surface was painted with flat black paint first to increase the emissivity of the
test surface. When the paint dried, the test plate was heated up for one and a half hours so that
the Plexiglas or ABS reaches the steady state temperature. During the heating, the surface
temperature was checked every fifteen minutes. Then a reference point was selected and its
temperature was measured using a thermocouple. Until the temperature measured by the
camera agrees with the thermocouple reading, this is the emissivity value of the reference
object. However, the temperature of the reference object must not be too close to the ambient
temperature for this to work. During the emissivity calculation, polyethylene sheet window
was not used. So, the transmissivity value used was 1.
3.5 Uncertainty Analysis
In order to determine the accuracy of this study, an error analysis is preformed using the
methodology of Kline and McClintock [65]. First a conservative error estimate of the
measured quantities was done. Then the relative uncertainties in measured quantities were
calculated. Finally, the average uncertainties of the results were calculated by taking the
square root of the summation of the square of all the relative uncertainties.
Heat transfer coefficient for flow over flat surface was calculated using the following
equation
⎥⎥⎦
⎤
⎢⎢⎣
⎡⎟⎟⎠
⎞⎜⎜⎝
⎛
⎥⎥⎦
⎤
⎢⎢⎣
⎡⎟⎟⎠
⎞⎜⎜⎝
⎛−=
−−
ktherfc
kth
TTTT
im
iw αα2
2exp1
Or h = f (Tw, Ti, Tm, α, k, t)
Error estimates of each variable are as follows

45
wT∆ = 0.5 oC
iT∆ = 0.5oC
mT∆ = 0.5 oC
t∆ = 0.125 seconds
Here, α and k are tabulated values. As a custom, three percent relative uncertainty is
assumed for both variables. The relative uncertainties of the rest of the four variables are
UTw = ww TT∆
UTi = ii TT∆
UTm = ww TT∆
Ut = tt∆
Uα = Uk = 0.03
The root mean square uncertainty in calculating heat transfer coefficient over flat plate, h is
Uh UT w( )2 UT i( )2+ UT m( )2
+ Ut( )2+ Uα( )2
+ Uk( )2+
In calculating heat transfer coefficient for film cooling case, relative uncertainty related to
coolant temperature will also be added.
cT∆ = 0.5 oC
UTc = cc TT∆
So, the root mean square uncertainty in calculating heat transfer coefficient for film
cooling case is
2)(2)(2)(2)(2)(2)(2)( kUUtUcUTmUTiUTwUThfilmU ++++++= α
Film effectiveness was calculated using the following equation
2,2,
2,2,
2,2,
2,
)(1
mc
mi
mc
iw
TTTT
hFTTTT
−
−+
−
−=η

46
The root mean square uncertainty in calculating film effectiveness, η is
2)(2)(2)(2)(2)(2)(2)(2)( kUUtUcUTmUTiUTwUThUU +++++++= αη
The averaged film effectiveness and heat transfer coefficient were calculated for the
experiments. The test rig I, using Duhamel’s superposition, showed that the uncertainty in h
was about 5.6% and for the effectiveness was about 8%. When the regression analysis
technique was applied to test rig II, the overall uncertainty dropped to for h about 3.9% and
effectiveness 4.5%

47
CHAPTER 4 NUMERICAL STUDIES
Supporting three-dimensional steady CFD studies are performed to gain a deeper insight
into the flow field that is responsible for the observed coolant jet interaction with the
mainstream. FLUENT is used to simulate film cooling for the trench and crater geometries
and compared to baseline cylindrical holes.
4.1 Geometry and Grid Details
Fig 4.1 shows a schematic of the computational domain. All dimensions are measured in
a Cartesian coordinate system with its origin placed at the upstream edge of the film hole on
the top surface of the test plate and its x , y and z axes aligned with the streamwise,
lateral and vertical direction as seen in Fig 4.1. Overall extent of the computation domain in
the lateral, vertical and streamwise directions was 24.25D, 15.875D and 80D, respectively.
Fig 4.1 Schematic of overall extent of computation domain and coordinates system

48
Multi-block structured computational grids were produced using Gambit software for
three geometries: the baseline case with a single row of round holes at an angle of 30 degrees
to the flat plate surface and a pitch-to-hole diameter ratio of 3.0, the trench case with width of
2-hole diameters and depth of 0.5-hole diameters, and the cratered case where the hole is
offset in the crater such that the crater and hole upstream edge match. The computational
domain and grid are shown in Fig 4.2 and Fig 4.3. Fig 4.3 highlights the grid quality near the
hole intersection region for the trench case. All grids extended from the centerline plane of
the main hole to the plane midway between two adjacent main holes. Symmetry boundary
conditions were applied on both of these planes. This was done since the present study
performed with a steady CFD analysis in which no flow can cross these planes because of
symmetry.
Fig 4.2 Computational Grid for Baseline Round Hole Case

49
Fig 4.3 Hole Intersection Grid Close-Up
4.2 Turbulence Model
The governing equations to be solved are the incompressible continuity, momentum, and
energy equations and the transport equations for the turbulent kinetic energy, and dissipation
added through the turbulence models. The fluid properties are assumed constant, which is a
reasonable assumption compared to the corresponding experiments.
0=∂∂
i
i
xU
(11)
)2(1)( ''jiij
jij
iji uuSxx
PxUU
tU
−∂∂
+∂∂
−=∂
∂+
∂∂
νρ
(12)
)Pr
()( '
jpjjj
j uTcxT
xxTU
tT ′−
∂∂
∂∂
=∂
∂+
∂∂ ν (13)
where ''jiij uu−=τ is known as the specific Reynolds stress tensor and '' jp uTc represents
the specific turbulent heat flux. Both of these two terms need to be modeled.
It is an unfortunate fact that no single turbulence model is universally accepted as being
superior for all industrial problems. The choice of turbulence model will depend on
considerations such as the physics encompassed in the flow, the established practice for a
specific class of problem, the level of accuracy required, the available computational
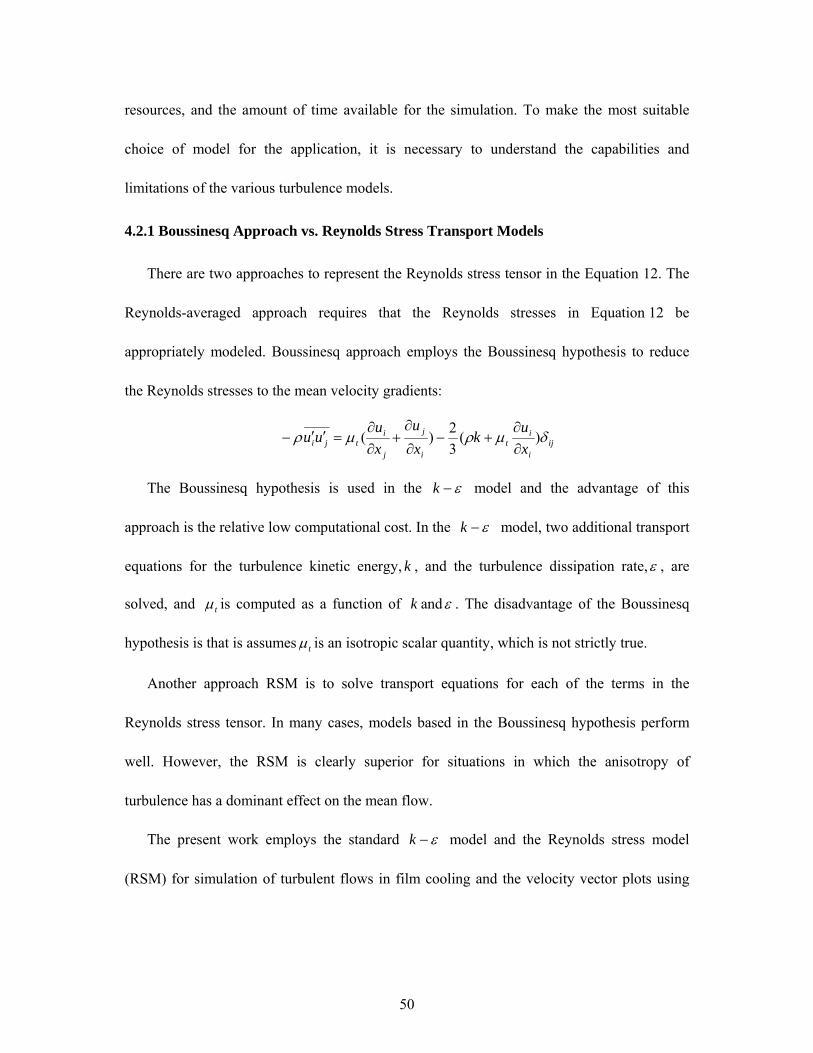
50
resources, and the amount of time available for the simulation. To make the most suitable
choice of model for the application, it is necessary to understand the capabilities and
limitations of the various turbulence models.
4.2.1 Boussinesq Approach vs. Reynolds Stress Transport Models
There are two approaches to represent the Reynolds stress tensor in the Equation 12. The
Reynolds-averaged approach requires that the Reynolds stresses in Equation 12 be
appropriately modeled. Boussinesq approach employs the Boussinesq hypothesis to reduce
the Reynolds stresses to the mean velocity gradients:
iji
it
i
j
j
itji x
uk
xu
xu
uu δµρµρ )(32)(
∂∂
+−∂
∂+
∂∂
=′′−
The Boussinesq hypothesis is used in the ε−k model and the advantage of this
approach is the relative low computational cost. In the ε−k model, two additional transport
equations for the turbulence kinetic energy, k , and the turbulence dissipation rate,ε , are
solved, and tµ is computed as a function of k andε . The disadvantage of the Boussinesq
hypothesis is that is assumes tµ is an isotropic scalar quantity, which is not strictly true.
Another approach RSM is to solve transport equations for each of the terms in the
Reynolds stress tensor. In many cases, models based in the Boussinesq hypothesis perform
well. However, the RSM is clearly superior for situations in which the anisotropy of
turbulence has a dominant effect on the mean flow.
The present work employs the standard ε−k model and the Reynolds stress model
(RSM) for simulation of turbulent flows in film cooling and the velocity vector plots using

51
two different models were compared. All the simulations were run using FLUENT computer
code.
The standard ε−k model is economy, and reasonable accuracy for a wide range of
turbulent flows and it is widely used in industrial flow and heat transfer simulation. It is a
semi-empirical model, and the derivation of the model equations relies on phenomenological
considerations and empiricism.
The RSM model can handle three-dimensional separated flows where most of the eddy
viscosity models would be insufficient. There have been a few studies that have used RSM
model for predicting internal channel flows, both rotating and stationary [66-67]. Few studies
have used RSM for film cooling.
Abandoning the isotropic eddy-viscosity assumptions, the RSM closes the
Reynolds-averaged Navier-Stokes equations by solving transport equations for Reynolds
stresses, together with an equation for the dissipation rate. This means that five additional
transport equations are required in 2D flows and seven additional transport equations must be
solved in 3D.
Since the RSM accounts for the effects of streamline curvature, swirl, rotation and rapid
changes in strain rate in a more rigorous manner than one-equation and two-equation models,
it has greater potential to give accurate predictions for complex flows. However, the fidelity
of RSM predictions is still limited by the closure assumptions employed to model various
terms in the exact transport equations for the Reynolds stresses. The modeling of the
pressure-strain and dissipation-rate terms is particularly challenging, and often considered to
be responsible for compromising the accuracy of RSM predictions.

52
Compared with the ε−k model, the RSM requires additional memory and CPU time due
to the increased number of the transport equations for Reynolds stresses. Similarly, the RSM
may take more iterations to converge than the ε−k model due to the strong coupling
between the Reynolds stresses and the mean flow.
The different Reynolds stress model involves calculation of the individual Reynolds
stresses, ''jiuu , using differential transport equations. The individual Reynolds stresses are
then used to obtain closure of the Reynolds-averaged momentum equation (Equation 12).
The exact form of the Reynolds stress transport equations may be derived by taking
moments of the exact momentum equation. This is a process wherein the exact momentum
equations are multiplied by a fluctuating property, the product then being Reynolds-averaged.
Unfortunately, several of the terms in the exact equation are unknown and modeling
assumptions are required in order to close the equations.
In the following sections, the standard ε−k model and the Reynolds stress transport
equations are presented together with the modeling assumptions required to obtain closure.
4.2.2 The Standard ε−k Equations
The standard ε−k model [68] is a semi-empirical model based on model transport
equations for the turbulent kinetic energy ( k ) and its dissipation rate (ε ). Assumed that the
flow is fully turbulent and the effects of molecular viscosity are negligible, the turbulence
kinetic energy k and its rate of dissipationε are obtained from the following equations [69]:
( ) kMbkjk
t
ji
i
SYGGxk
xku
xk
t+−−++
⎥⎥⎦
⎤
⎢⎢⎣
⎡
∂∂
⎟⎟⎠
⎞⎜⎜⎝
⎛+
∂∂
=∂∂
+∂∂ ρε
σµ
µρρ )(
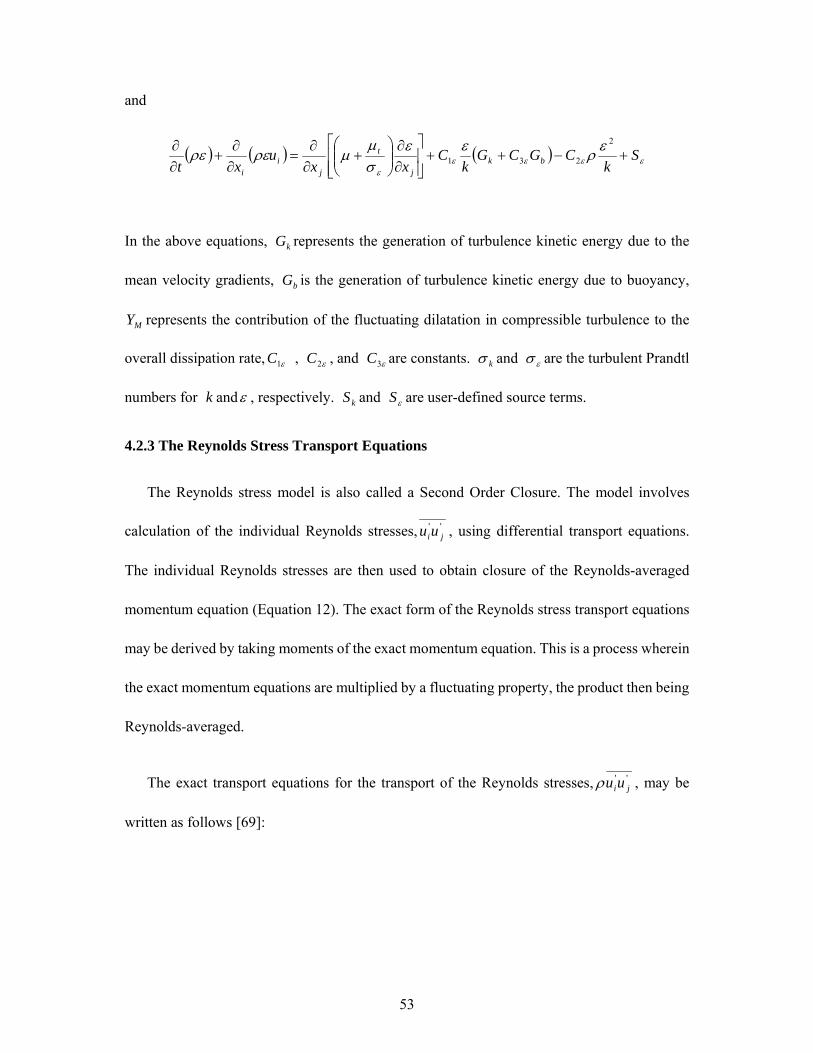
53
and
( ) ( ) ( ) εεεεε
ερεεσµ
µρερε Sk
CGCGk
Cxx
uxt bk
j
t
ji
i
+−++⎥⎥⎦
⎤
⎢⎢⎣
⎡
∂∂
⎟⎟⎠
⎞⎜⎜⎝
⎛+
∂∂
=∂∂
+∂∂ 2
231
In the above equations, kG represents the generation of turbulence kinetic energy due to the
mean velocity gradients, bG is the generation of turbulence kinetic energy due to buoyancy,
MY represents the contribution of the fluctuating dilatation in compressible turbulence to the
overall dissipation rate, ε1C , ε2C , and ε3C are constants. kσ and εσ are the turbulent Prandtl
numbers for k andε , respectively. kS and εS are user-defined source terms.
4.2.3 The Reynolds Stress Transport Equations
The Reynolds stress model is also called a Second Order Closure. The model involves
calculation of the individual Reynolds stresses, ''jiuu , using differential transport equations.
The individual Reynolds stresses are then used to obtain closure of the Reynolds-averaged
momentum equation (Equation 12). The exact form of the Reynolds stress transport equations
may be derived by taking moments of the exact momentum equation. This is a process wherein
the exact momentum equations are multiplied by a fluctuating property, the product then being
Reynolds-averaged.
The exact transport equations for the transport of the Reynolds stresses, ''jiuuρ , may be
written as follows [69]:
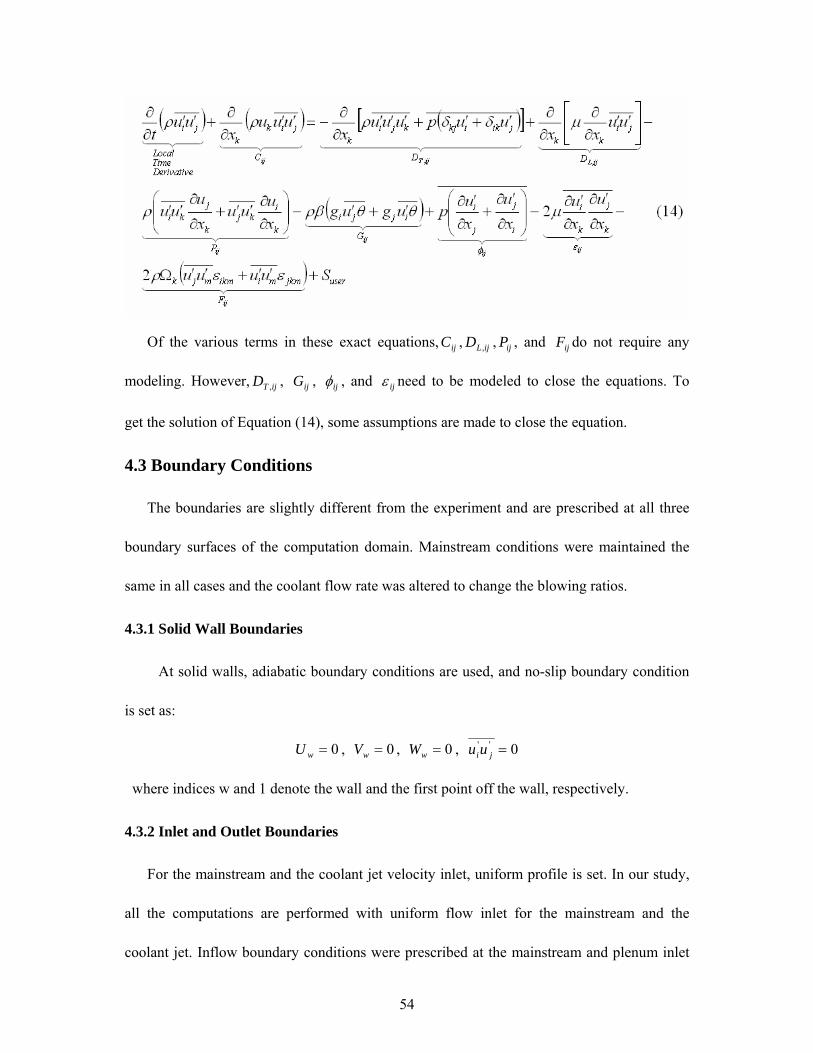
54
Of the various terms in these exact equations, ijC , ijLD , , ijP , and ijF do not require any
modeling. However, ijTD , , ijG , ijφ , and ijε need to be modeled to close the equations. To
get the solution of Equation (14), some assumptions are made to close the equation.
4.3 Boundary Conditions
The boundaries are slightly different from the experiment and are prescribed at all three
boundary surfaces of the computation domain. Mainstream conditions were maintained the
same in all cases and the coolant flow rate was altered to change the blowing ratios.
4.3.1 Solid Wall Boundaries
At solid walls, adiabatic boundary conditions are used, and no-slip boundary condition
is set as:
0=wU , 0=wV , 0=wW , 0'' =jiuu
where indices w and 1 denote the wall and the first point off the wall, respectively.
4.3.2 Inlet and Outlet Boundaries
For the mainstream and the coolant jet velocity inlet, uniform profile is set. In our study,
all the computations are performed with uniform flow inlet for the mainstream and the
coolant jet. Inflow boundary conditions were prescribed at the mainstream and plenum inlet

55
planes. Standard total temperature value and inlet velocity were used at the mainstream inlet
with flow normal to the inlet plane. The mainstream inlet is 23 hole diameters upstream of
the main hole leading edge. The plenum inlet mass flow rate was adjusted to produce the
blowing ratio desired. The plenum inlet total temperature was set to 0.95 times the
mainstream inlet total temperature. The 0.95 value was used to provide a temperature
difference between the coolant and mainstream for film effectiveness calculation while
staying relatively close to a density ratio of 1.0.
The inlet boundary conditions for the turbulent quantities are difficult to prescribe. In this
study, a turbulence intensity of 2 percent and a turbulence length scale of 1 hole diameter
were specified at the mainstream inlet, and a turbulence intensity of 1 percent and a
turbulence length scale of 1 hole diameter were specified at the plenum inlet.
The exit static pressure was set to 0.97 times the mainstream inlet total pressure at the exit
plane 57 hole diameters downstream of the main hole leading edge. This produced a Mach
number of less than 0.3 in most of the flow domain.
4.4 Numerical Solution Procedure
For the numerical investigation the commercial CFD software FLUENT is applied.
FLUENT is based on an unstructured solver using a finite volume approach for the solution
of the Reynolds averaged Navier-Stokes (RANS) equations. A structured computational grid
was developed using the Gambit grid generator with approximately 1.3 million computational
cells for each case. The +y values at the wall-adjacent cells were on the order of 1.0. Each
solution on the fine grid required approximately 2500 CPU hours to attain a converged
solution. All the cases presented here converged to residual levels of the order of 510− and to
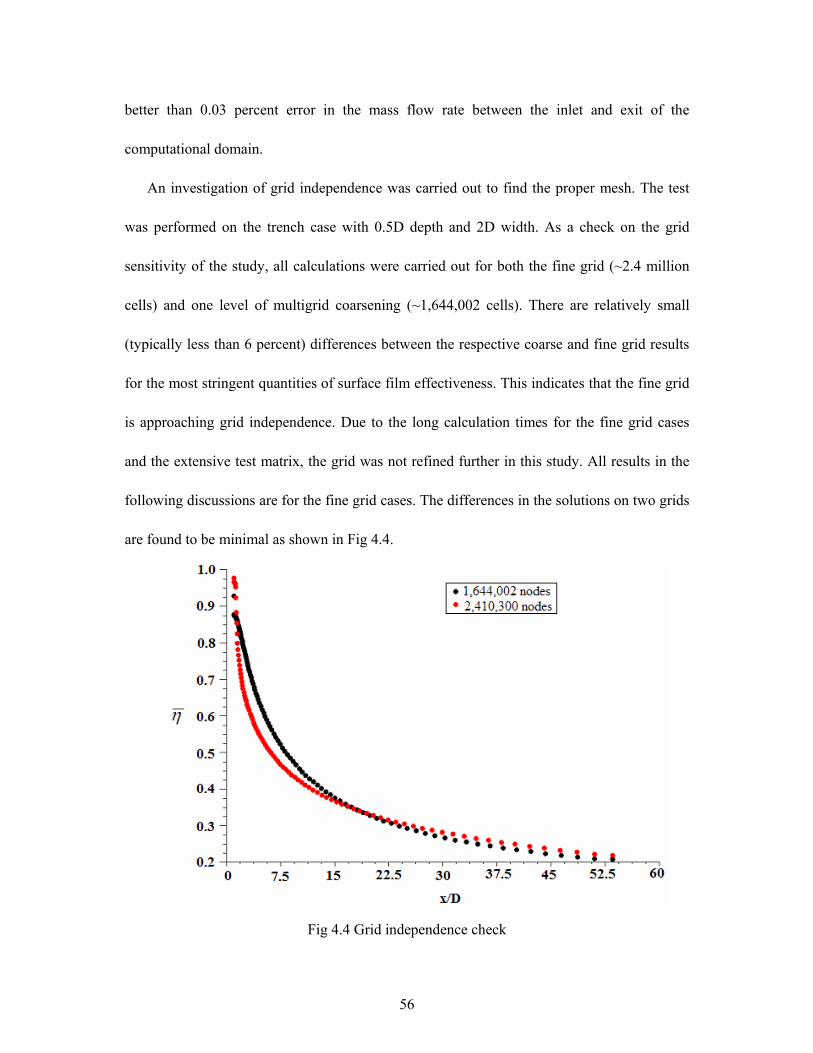
56
better than 0.03 percent error in the mass flow rate between the inlet and exit of the
computational domain.
An investigation of grid independence was carried out to find the proper mesh. The test
was performed on the trench case with 0.5D depth and 2D width. As a check on the grid
sensitivity of the study, all calculations were carried out for both the fine grid (~2.4 million
cells) and one level of multigrid coarsening (~1,644,002 cells). There are relatively small
(typically less than 6 percent) differences between the respective coarse and fine grid results
for the most stringent quantities of surface film effectiveness. This indicates that the fine grid
is approaching grid independence. Due to the long calculation times for the fine grid cases
and the extensive test matrix, the grid was not refined further in this study. All results in the
following discussions are for the fine grid cases. The differences in the solutions on two grids
are found to be minimal as shown in Fig 4.4.
Fig 4.4 Grid independence check

57
CHAPTER 5 RESULTS
The results obtained from the baseline geometry were used as a reference for all other
configurations.
5.1 Results for Crescent and Converging Slot
The measured mainstream velocity and free-stream turbulence using a calibrated single
hot wire probe are 9.0 m/s and 6%, respectively. The mainstream Reynolds number ( dRe )
based on film hole diameter is 7150. The boundary layer profile measured downstream of the
trip is close to the fully turbulent flow profile ( th7/1 law). The momentum thickness
Reynolds number ( θRe ) just upstream of the hole is 511 and the corresponding boundary
layer thickness is 9.87 mm. Three blowing ratios, M=0.5, 1.0 and 1.5, are tested for the
°35 baseline, crescent and converging slot cases. The coolant to mainstream density ratio for
the present test is close to 1.1. However, the engine density ratios are closer to 2.0. Previous
studies have shown that the momentum flux ratio (I) includes the effect of density ratio (DR)
and the film cooling results can be correlated to momentum flux ratios ( DRMI /2= ).
Results are for only the two/three middle holes.
Fig 5.1 presents the effect of blowing ratio on detailed film effectiveness for the baseline,
crescent and converging slot. For the baseline, the jet streaks are clearly visible with the
highest effectiveness occurring at M=0.5 near the hole exits. At higher blowing ratios, there
is a jet lift-off resulting in lower coverage. However, the higher blowing ratios show more
spreading downstream resulting in higher effectiveness downstream.
From effectiveness distributions for the crescent exit, it is clear that the coolant is even at
the exit plane with effectiveness higher than 0.8. Downstream of injection, the film appears to

58
spread laterally and stay closer to the surface due to reduced coolant exit velocity with
increased exit area. This causes a more even, laterally spreading film that produces
significantly higher effectiveness than for Baseline. Effectiveness increases with increase in
blowing ratio unlike that for Baseline.
M=0.5 M=1.0 M=1.5
Baseline
Crescent
Converging Slot
Fig 5.1 Detailed film effectiveness distributions for baseline, crescent and converging slot at different blowing ratios

59
For converging slot, film effectiveness distribution is uniform in the spanwise direction
and clearly well spread across the length of the slot. The effectiveness at low blowing ratio
appears to dissipate immediately downstream of the slot. At higher blowing ratios, the effect
of slot cooling is significant and comparable to the crescent exit. It appears that the slot exit
momentum at low blowing ratios maybe relatively low compared to the mainstream resulting
in reducing coverage.
Fig 5.2 presents the effect of blowing ratio on heat transfer coefficient ( 2/ mW ) for
baseline, crescent and converging slot. Results show that heat transfer coefficient increases
with increased blowing ratios for these three cases. Increased blowing ratio indicates higher
velocity jets mixing with the mainstream resulting in increased local turbulence generation
leading to higher heat transfer coefficient. For the cylindrical hole, the higher heat transfer
coefficient downstream is characterized by the streaks along the holes indicating the counter
rotating vortex pair [70]. The heat transfer coefficients increase significantly at each blowing
ratio for the other two cases. With larger coolant exit area, there is more regional mixing
resulting in higher turbulence generation downstream of injection for both crescent and
converging slot cases. The levels of heat transfer coefficient for crescent and converging slot
are a factor of 3 larger than for the baseline.
This is primarily intuitive to point out that the film coverage enhances mixing resulting in
higher heat transfer coefficient. Clearly, the crescent shape exit produces more mixing region
downstream compared to the slot exit.
Fig 5.3 compares the spanwise average film effectiveness distributions for the three cases
at each blowing ratio. The average results are plotted against normalized streamwise distance
downstream of the film hole. At a low blowing ratio of M=0.5, the crescent case provides the

60
highest effectiveness clearly. The cylindrical hole exit (Baseline) clearly provides the lowest
effectiveness.
M=0.5 M=1.0 M=1.5
Baseline
Crescent
Converging Slot
Fig 5.2 Detailed heat transfer coefficient ratio distributions for baseline, crescent and converging slot cases at different blowing ratios
Both the crescent and converging slot cases show rapid decaying with increasing distance
from the hole. As blowing ratio increases to M=1.0, the crescent and converging slot provide

61
comparable film effectiveness values but the downstream decay is not as rapid as for M=0.5.
Also, the cylindrical hole shows increased effectiveness just downstream but the levels of
cooling effectiveness are not as significant as the other two cases. For a high blowing ratio of
M=1.5, again, the crescent outperforms the other two cases.
Fig 5.3 Effect of hole geometry on spanwise averaged film effectiveness distributions for
baseline, crescent and converging slot at each blowing ratio
It appears that both crescent and converging slot may have an optimum high for M=1.0
and then decreased effectiveness is seen for higher blowing ratios. It appears that the coolant
exits the crescent and slot and spreads into the lager area with reduced momentum and
produces a low momentum two-dimensional film providing better effectiveness at higher
blowing ratios.

62
Fig 5.4 compares the spanwise averaged heat transfer coefficient ratio ( 0/ hh ) for the
three cases at each blowing ratio. The local heat transfer coefficient with film cooling (h) is
normalized by the heat transfer coefficient without holes on a flat surface ( 0h ).
At a low blowing ratio of M=0.5, the heat transfer coefficients are highest for the crescent
with high heat transfer coefficient ratios around 5 near the hole exit and decaying rapidly
downstream. It appears that the jet-mainstream interaction induced turbulence is similar for
all geometries resulting in heat transfer enhancement but the levels of jet-mainstream
interaction are different.
At M=1.0, the converging slot shows a peak just downstream of the slot exit but decays
rapidly. The crescent and converging slot show similar levels after x/D>2.
For M=1.5, the crescent produce the highest heat transfer enhancement immediately
downstream of the hole with baseline and converging slot also showing enhancement of 2.5+
at x/D=1. It appears that the flow coming out of the crescent exit produce more interaction
mostly in the spanwise direction due to a more two-dimensional nature of the jets resulting in
an overall higher average enhancement in heat transfer coefficient. Also, it is important to
note that the cases where the heat transfer enhancement is highest produces the highest
effectiveness due to increased jet spreading and overall coverage.
Fig 5.5 presents the effect of blowing ratio on the overall area-averaged film effectiveness
and heat transfer coefficient for the three cases. The crescent and converging slot show much
higher overall effectiveness than baseline. Baseline shows highest effectiveness at M=0.5.
This may be inconsistent with other studies but in the near hole region (x/D<10), this may be
true due to better effectiveness for M=0.5. The crescent and converging slot also show

63
significant heat transfer enhancement compared to baseline as expected.
Fig 5.4 Effect of hole geometry on spanwise averaged heat transfer coefficient distributions
for baseline, crescent and converging slot at each blowing ratio
Fig 5.6 presents the effect of blowing ratio on overall area-averaged heat flux ratio
( 0qq ′′′′ ) for all these three cases. Clearly, the crescent and converging slot provide
significantly reduced heat flux to the surface at all the tested blowing ratios. The baseline
shows almost no overall effect of jet in the near hole region. The interesting effect is the
better cooling is achieved at higher blowing ratios with the two new configurations. It
appears that both the geometries can perform better at higher blowing ratios than the M=1.5
tested in this study.

64
Fig 5.5 Effect of blowing ratio on overall area-averaged film effectiveness and heat transfer
coefficient for baseline, crescent and converging slot
Fig 5.6 Effect of blowing ratio on overall area-averaged heat flux ratio for baseline, crescent
and converging slot
5.2 Results for Trench and Shaped Diffuser Hole
In this part, the measured mainstream velocity and free-stream turbulence intensity using
a calibrated single hot wire probe are 13.8 m/s and 2%, respectively. The mainstream
Reynolds number ( dRe ) based on film hole diameter is 11000. The boundary layer profile
measured downstream of the trip is close to the fully turbulent flow profile ( th7/1 law). Four
different blowing ratios between 0.5 and 2.0 are tested for all the cases tested. The
coolant-to-mainstream ratio for the entire study was 1.07.

65
Fig 5.7 presents the effect of blowing ratio on detailed film effectiveness distributions for
all the trench and shaped hole cases. For baseline case, the jet streaks are clearly visible with
the highest effectiveness occurring at M=0.5 near the hole exits. At higher blowing ratios,
there is a jet lift-off resulting in lower coverage.
For Case 1, the coolant enters a shallow (0.5D) and narrow trench (2D) before mixing
with the mainstream. It appears that the coolant exiting the holes develop sideways and fill
the trench before exiting as a more two dimensional film. The spanwise mixing in the trench
is clearly evident with higher effectiveness between the jets inside the trench. As blowing
ratio increase, the effectiveness increases inside the slot and outside, and the coverage
distance is also enhanced. For Case 2, the coolant enters a shallow (0.5D) and wide trench
(3D). The lateral spreading into the slot is clearly missing for this wider trench. The jet
streaks along the hole are evident similar to the cylindrical hole except at the trench edge
where the flow hits the edge and shows a sudden increase in effectiveness outside the trench.
Also, the effectiveness increases with increasing blowing ratio unlike the standard baseline
case where jet lift-off caused lower effectiveness at higher blowing ratios.
For Case 3, the coolant enters s medium (0.75D) and a narrow (2D) trench. The coolant
again appears to spread into the trench after exiting the hole similar to Case 1. A two
dimensional film appears to exit the trench. The lateral spreading is higher for Case 3
compared to Case 1. The deeper trench enables in reducing the three dimensional structure
exiting the holes more efficiently. With increasing blowing ratio, the film effectiveness
increases specially in the downstream coverage and not much in the peak effectiveness. For
Case 4, the coolant enters a medium (0.75D) and a wider (3D) trench. The deeper trench

66
improves the lateral mixing for the wider trench compared to Case 2 with a shallow depth.
The jets appear to mix laterally inside the trench and exit more two-dimensional in this case.
The local peak effectiveness is higher for this case than case 3 with the narrow trench.
For Case 5, the coolant enters a deep (1D) and a narrow (2D) trench. The coolant exits the
holes and mixes freely inside the 2-D trench and forms a sheet before exiting the trench and
interacting with the mainstream. The deeper slot is increasing the effectiveness inside the
trench but seems to perform very poorly downstream of the trench. The coolant may pick up
heat inside the trench due to some interaction with the mainstream inside the trench as the
mainstream can enter the trench along the outer sides of the trench. The trapped coolant
eventually exits but with very little effectiveness downstream. Also, the cooling effectiveness
decreases with higher blowing ratio unlike Case 1-4.
For Case 6, the coolant enters a deep (1D) and a wider (3D) trench. The trends are similar
to that for Case 5. The coolant however mixes less inside the trench compared to Case 5 due
to increased trench area. The coolant exiting the holes also does not hit the trench sidewall as
in Case 5. The blowing ratio effect is increase effectiveness inside the trench but decrease
downstream with increasing blowing ratio.
For the shaped diffuser hole exit, the wide exit reduces the upward momentum of the jets
and keeps the coolant closer to the surface. The lateral flaring enhances the lateral coverage
of the coolant producing higher effectiveness overall. The shaped hole exit is typically
created by employing a counter drill that stamps the footprint at the exit by removing material
from the cylindrical hole exit

67
(a) M=0.5 (b) M=1.0 (c) M=1.5 (d) M=2.0
Baseline
Case 1
Case 2
Fig 5.7 Detailed film effectiveness distributions for baseline, trench and shaped hole cases at
different blowing ratios (Fig cont.)

68
(a) M=0.5 (b) M=1.0 (c) M=1.5 (d) M=2.0
Case 3
Case 4
Case 5 (Fig 5.7 cont.)

69
(a) M=0.5 (b) M=1.0 (c) M=1.5 (d) M=2.0
Case 6
Shaped hole
Fig 5.8 presents the effect of blowing ratio on detailed heat transfer coefficient (h)
distributions for the baseline, trench and shaped hole cases. Nearly all the trenched holes
appear to enhance the heat transfer coefficient compared to the baseline case. It appears that
there is significantly more interaction between the mainstream and jet primarily in the slot
exit region resulting in higher turbulence production and subsequently higher heat transfer
coefficient. This may be because of the creation of a new mixed boundary layer at the slot
edge.
The effect appears to extend in the downstream region of the slot for all the Cases 1-6.
However, Case 3 provides the higher enhancement than all the other cases. With larger

70
coolant exit area, there is more regional mixing resulting in higher heat transfer coefficient
for shaped hole case. The narrow trench for any depth creates a stronger trip to the boundary
layer than the wider trench because the coolant is pushed back by the upstream by the
upstream edge back into the slot for the narrow trench. That does not occur for wider trench
where the coolant blows directly into the trench and mixes with the mainstream.
M=0.5 M=1.0 M=1.5 M=2.0
Baseline
(a) M=0.5 (b) M=1.0 (c) M=1.5 (d) M=2.0
Case 1
Fig 5.8 Detailed heat transfer coefficient ratio distributions for baseline, trench and shaped
hole cases at different blowing ratios (Fig cont.)

71
(a) M=0.5 (b) M=1.0 (c) M=1.5 (d) M=2.0
Case 2
Case 3
Case 4
(Fig 5.8 cont.)

72
(a) M=0.5 (b) M=1.0 (c) M=1.5 (d) M=2.0
Case 5
Case 6
Shaped hole
Fig 5.9 presents the effect of hole geometry on spanwise averaged film effectiveness for
each blowing ratio. The averaged results are plotted against the normalized streamwise
distance indicated from downstream edge of the film hole. Results are presented from the
downstream edge of the cylindrical holes for the baseline and trench cases and beyond the

73
actual exit of the shaped hole. This is done to avoid the issues associated with the data
collected during the experiment inside the film holes and trenches. At a low blowing ratio of
M=0.5, shaped diffuser hole provides the highest effectiveness clearly but the downstream
decay is also rapid. All the trench cases except Case 3 show higher film effectiveness than
baseline. For M=1.0, shaped hole still provided higher effectiveness than all the cases.
However, Case 4 shows higher performance than other trench cases. The baseline is the
lowest among all the cases. Case 4 has a medium depth (0.75D) and wider trench (3D). For
M=1.5, shaped hole is the highest among all cases. Case 3-4 are higher than other trench case
indicating an optimum depth of 0.75D. All other cases are lower than these two cases. For
M=2.0, there is a larger spread among the cases. Shaped hole is not as significantly higher
than the trench cases, with Case 1, 3 and 4 showing comparable film effectiveness.
(a) M=0.5
(b) M=1.0
Fig 5.9 Effect of hole configuration on spanwise averaged film effectiveness distributions for
baseline, trench and shaped hole cases at each blowing ratio (Fig cont.)

74
(c) M=1.5
(d) M=2.0
(Fig 5.9 cont.)
Cases 5 and 6 are lowest trench cases indicating that a deeper trench may not be a
solution. The thickness of the TBC layer should not be too thin (0.5D) and not too thick
(1.0D) to obtain the best cooling effectiveness. Klinger and Hennecke [71] provided a
correlation for adiabatic film effectiveness for normal slot injection with blowing ratio below
2. However, their equation is valid only for x/s >20, where s is the trench width. In the
present study, most of the measured region is inside x/s < 20.
Fig 5.10 presents the effect of the hole geometry on spanwise averaged heat transfer
coefficient ratio ( 0/ hh ) for each blowing ratio. At M=0.5, heat transfer coefficient ratios are
similar for all trench cases and baseline except for shaped hole which shows a bump
immediately downstream of injection.
As blowing ratio increases to M=1.0, the differences between the cases are enhanced. At
M=1.5, all the trench cases show higher heat transfer coefficient ratio than the baseline. The

75
shaped hole is at a similar level to the trench cases.
At M=2.0, the trends are similar to that for M=1.5. It appears that the film exiting the
trenches creates a new boundary and enhances heat transfer coefficients immediately
downstream of the trench. Further downstream, the effect of trench width and depth is
negligible unlike that for the film effectiveness results where medium depth trenches
provided the best results.
(a) M=0.5
(b) M=1.0
(c) M=1.5
Fig 5.10 Effect of hole configuration on spanwise averaged heat transfer coefficient ratio distributions for baseline, trench and shaped hole at each blowing ratio (Fig cont.)

76
(d) M=2.0
(Fig 5.10 cont.)
Fig 5.11 presents the effect of blowing ratio on the overall area-averaged film
effectiveness and heat transfer coefficient for baseline, trench and shaped hole cases. As seen
clearly from the plot, shaped diffuser hole shows much higher overall area-averaged film
effectiveness than the other cases.
For Case 3 and 4, it shows higher overall effectiveness within the trench cases. The
shaped hole shows the highest heat transfer coefficient and the baseline is the lowest.
Importantly, the effect of blowing ratio on most of the trench cases is minimal. This was
reported by Bunker [17] and Lu et al. [19]. The baseline shows a decrease with increase in
blowing ratio and the shaped hole peaks at M=1.5. Overall averaged heat transfer coefficient
ratios show an increase with blowing ratio for all geometries. This is expected as the higher
coolant flow interacts with the mainstream more and produces local turbulence and thus
enhances heat transfer coefficient.
Shaped hole and Case 1 show the highest heat transfer coefficient ratios. Baseline shows
the lowest enhancement ratios because least interactions of jets with mainstream in the lateral
direction.

77
(a)
(b)
Fig 5.11 Effect of blowing ratio on overall area-averaged (a) film effectiveness, and (b) heat transfer coefficient ratios for baseline, trench and shaped
hole
Fig 5.12 presents the effect of blowing ratio on overall area-averaged heat flux ratio
( 0qq ′′′′ ) for all these cases. It is clear from the plot that most cases at M=1.0 provide low heat
flux ratios except for Case 5. It appears that Case 4 provides better protection at all blowing
ratios and as does shaped diffuser hole except at higher blowing ratio of 2.0. Case 5 seems to
show the worst performance.
Fig 5.12 Effect of blowing ratio on overall area-averaged heat flux ratio for baseline, trench
and shaped hole cases

78
5.3 Results for Cratered Cylindrical Inclined Hole
Three different crater geometries are studied and compared to a baseline flush cylindrical
hole, a trench hole and a typical diffuser shaped hole. The experimental work is carried out
under the same flow condition described in Section 5.2.
Fig 5.13 presents the effect of blowing ratio on detailed film effectiveness distributions
for baseline, three cratered hole cases, one trench case and shaped hole.
For Case 7, the effectiveness is higher than baseline for all blowing ratios. This may be
due to the reduced exit momentum of the jets when they interact with the mainstream. The
jets exit the cylindrical holes and expand into the crater resulting in the lower momentum jets.
As blowing ratio increases, the jet steak expands more laterally and reduced effectiveness is
seen downstream. The lateral spreading is due to the accumulation of the coolant.
For Case 8, the effectiveness is higher than for baseline. However, there is limited
spreading in the lateral direction as seen for Case 7. There is a lot more cooling effectiveness
downstream compared to Case 7. Effectiveness decreases with increasing blowing ratio.
For Case 9, the jets show improved effectiveness over baseline and Cases 7-8. There is
more lateral spreading than for Case 8 and the jets appear to provide coverage farther
downstream than the Cases 7-8. This may be due to the circular shape of the crater, where the
jet streak is maintained because of the streamwise length of the hole and the additional area in
the lateral direction.
The trench case (Case 4) is shown for comparison. The trench shows a two-dimensional
behavior unlike the cratered holes. The trenched hole also shows an increase in film
effectiveness for higher blowing ratios.

79
The diffuser shaped hole is far superior in performance than all the other cases due to the
significantly reduce momentum of the jets and the coolant hugging the surface even at high
blowing ratios. However, the shaped hole is not a good comparison for the crater holes as the
shaped hole may be cratered in real applications and that should be considered for
comparisons.
(a) M=0.5 (b) M=1.0 (c) M=1.5 (d) M=2.0
Baseline
Case 7
Fig 5.13 Detailed film effectiveness distributions for baseline, three cratered hole cases, one
trench case and shaped hole at different blowing ratios (Fig cont.)
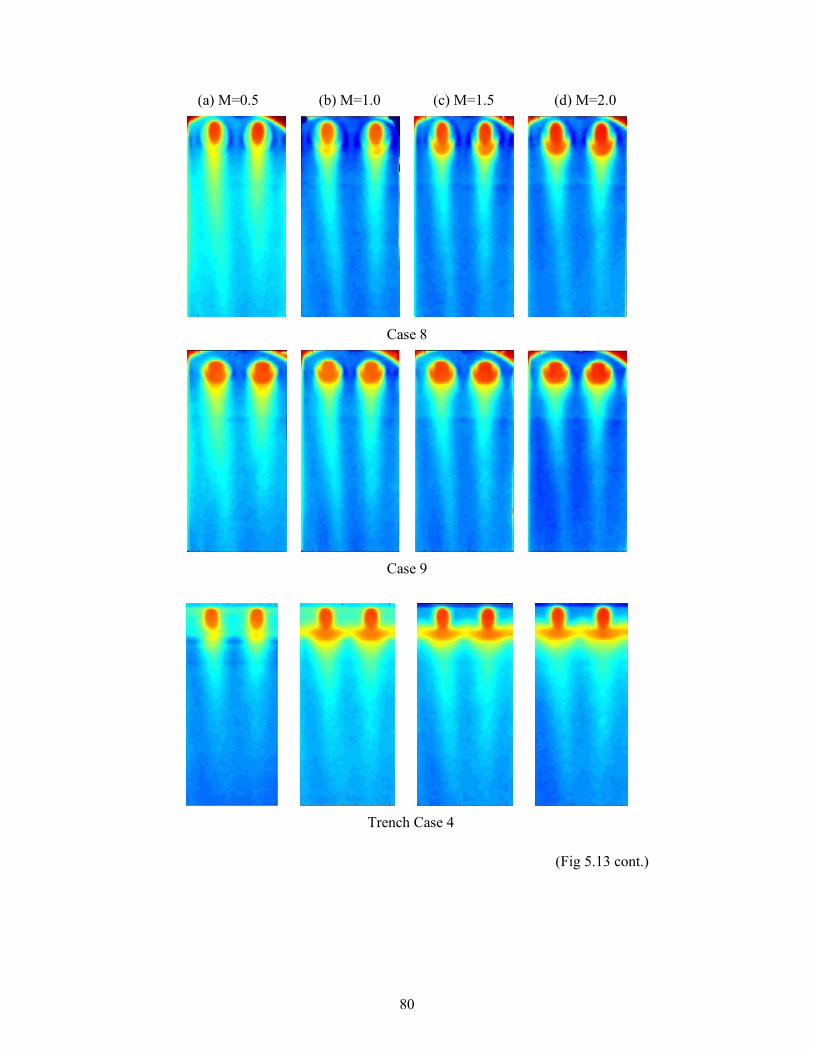
80
(a) M=0.5 (b) M=1.0 (c) M=1.5 (d) M=2.0
Case 8
Case 9
Trench Case 4
(Fig 5.13 cont.)
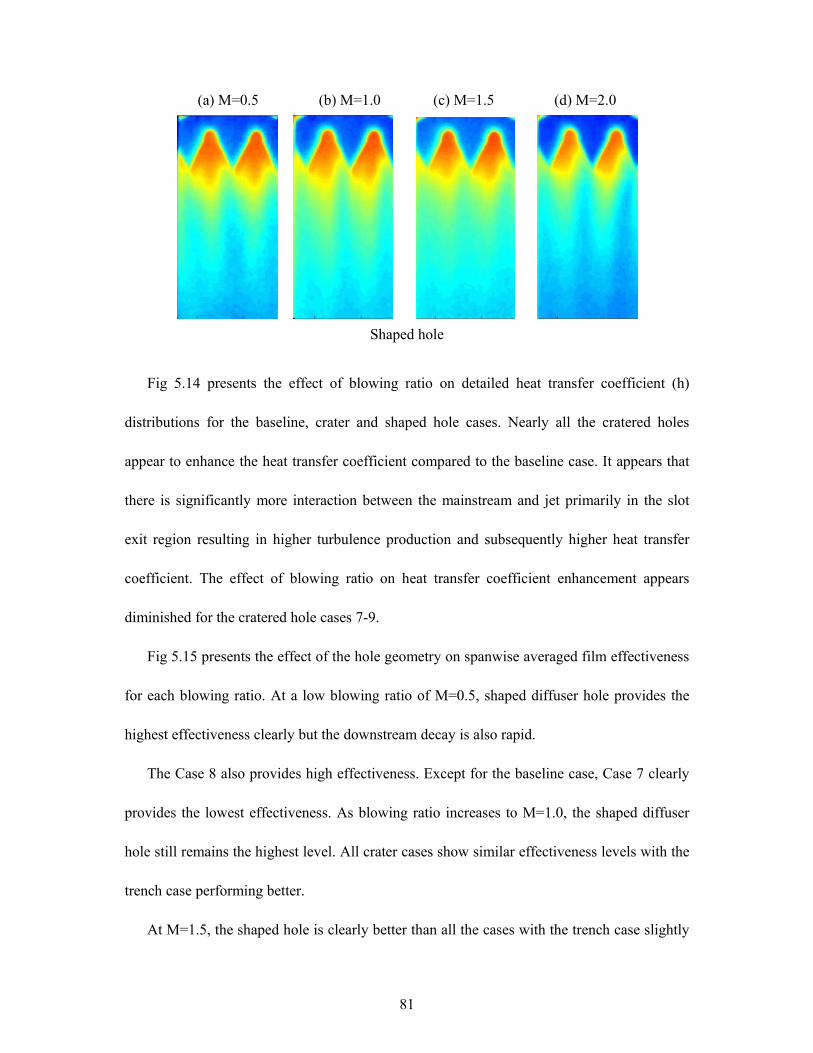
81
(a) M=0.5 (b) M=1.0 (c) M=1.5 (d) M=2.0
Shaped hole
Fig 5.14 presents the effect of blowing ratio on detailed heat transfer coefficient (h)
distributions for the baseline, crater and shaped hole cases. Nearly all the cratered holes
appear to enhance the heat transfer coefficient compared to the baseline case. It appears that
there is significantly more interaction between the mainstream and jet primarily in the slot
exit region resulting in higher turbulence production and subsequently higher heat transfer
coefficient. The effect of blowing ratio on heat transfer coefficient enhancement appears
diminished for the cratered hole cases 7-9.
Fig 5.15 presents the effect of the hole geometry on spanwise averaged film effectiveness
for each blowing ratio. At a low blowing ratio of M=0.5, shaped diffuser hole provides the
highest effectiveness clearly but the downstream decay is also rapid.
The Case 8 also provides high effectiveness. Except for the baseline case, Case 7 clearly
provides the lowest effectiveness. As blowing ratio increases to M=1.0, the shaped diffuser
hole still remains the highest level. All crater cases show similar effectiveness levels with the
trench case performing better.
At M=1.5, the shaped hole is clearly better than all the cases with the trench case slightly

82
above Cases 8 and 9. Case 1 is lowest among all the crater cases. All the crater cases are still
significantly higher than the baseline case.
For a high blowing ratio of M=2, Case 8 outperforms all the other cratered hole cases. It
appears that shaped hole and trench case are providing better coverage.
(a) M=0.5 (b) M=1.0 (c) M=1.5 (d) M=2.0
Baseline
Case 7
Fig 5.14 Detailed heat transfer coefficient ratio distributions for baseline, three cratered hole
cases, one trench case and shaped hole at different blowing ratios (Fig cont.)

83
(a) M=0.5 (b) M=1.0 (c) M=1.5 (d) M=2.0
Case 8
Case 9
Trench Case 4
(Fig 5.14 cont.)
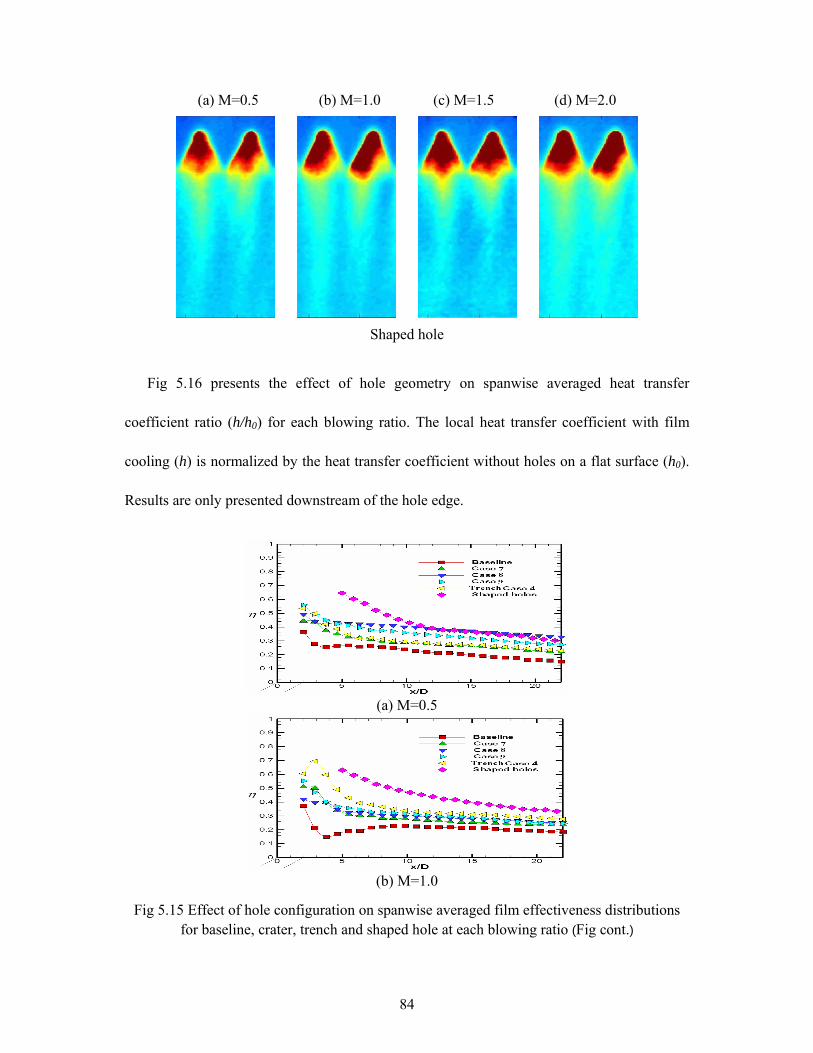
84
(a) M=0.5 (b) M=1.0 (c) M=1.5 (d) M=2.0
Shaped hole
Fig 5.16 presents the effect of hole geometry on spanwise averaged heat transfer
coefficient ratio (h/h0) for each blowing ratio. The local heat transfer coefficient with film
cooling (h) is normalized by the heat transfer coefficient without holes on a flat surface (h0).
Results are only presented downstream of the hole edge.
(a) M=0.5
(b) M=1.0
Fig 5.15 Effect of hole configuration on spanwise averaged film effectiveness distributions for baseline, crater, trench and shaped hole at each blowing ratio (Fig cont.)

85
(c) M=1.5
(d) M=2.0
(Fig 5.15 cont.)
At a low blowing ratio of M=0.5, the heat transfer coefficients are similar for all cases
with Case 7 and baseline slightly lower. The shaped hole shows higher heat transfer
coefficient ratios immediately downstream of exit but decreases rapidly downstream.
At M=1.0, all three cratered hole cases produce similar higher heat transfer coefficient
enhancement due to increases local interactions between mainstream and jets, but still lower
than the trench Case 4 and shaped hole case.
For M=1.5, shaped hole produces the highest heat transfer coefficient enhancement with
baseline case producing the lowest enhancement. The crater holes and the trenched hole
produce similar levels of enhancement. At M=2.0, the trends are similar to M=1.5. The crater
geometry seems to have very little effect on heat transfer coefficient enhancement which may
indicate that all geometries generate similar levels of turbulence due to jet-mainstream
mixing.

86
(a) M=0.5
(b) M=1.0
(c) M=1.5
(d) M=2.0
Fig 5.16 Effect of hole configuration on spanwise averaged heat transfer coefficient ratio for
baseline, crater, trench and shaped hole at each blowing ratio
Fig 5.17 shows the effect of blowing ratio on overall area-averaged (a) film effectiveness,
and (b) heat transfer coefficient ratios for all cases. As seen clearly from the plot, shaped

87
diffuser hole shows much higher overall area-averaged effectiveness than the other cases.
The trench case (Case 4) also shows slightly higher effectiveness compared to the crater cases
at higher blowing ratios. There is a slight decrease in film effectiveness with increasing
blowing ratio for all cratered hole cases. The heat transfer coefficient ratios show minimal
effect of blowing ratio for all the cases. The shaped hole shows the highest heat transfer
coefficient and the baseline is the lowest.
(a)
(b)
Fig 5.17 Effect of blowing ratio on overall area-averaged (a) film effectiveness, and (b) heat transfer coefficient ratios for baseline, three crater cases, one trench case and shaped hole
Fig 5.18 presents the effect of blowing ratio on overall area-averaged heat flux ratio
( 0qq ′′′′ ) for all these cases. Baseline and Case 9 seem to show the worst performance. All
cratered holes show heat flux ratio close to 1.0 for M=1.5 and higher blowing ratios. It
appears cratered holes may perform better at lower blowing ratios but are clearly not effective
at higher blowing ratios.

88
Fig 5.18 Effect of blowing ratio on Overall heat flux ratio for baseline, three crater cases, one
trench case and shaped hole
5.4 Numerical Results
Computed velocity vector on the centerline plane of the film hole is presented in Fig 5.19
for flat plate case at a blowing ratio of M=1.0 for RSM and ε−k model. The vectors are
presented at x/D=3 showing the clearly defined counter rotating vortex pair as shown by
Leylek and Zerkle [35].
For RSM, the mainstream is clearly entrained under the vortex pair and pushing the jet
away from the surface. The vectors colors indicate the flow temperature with the jet core at
lower temperature. At this short distance from injection, the jet-mainstream mixing is
relatively low.
Compared to the RSM result, the ε−k model cannot capture the counter rotating vortex
pair very well. And the velocity in the core shows much higher than the RSM.
Fig 5.20 shows the velocity vector for the trenched hole case by using different models.
The vortex pair obtained from RSM is still very evident but the jet strength in terms of local
velocity is lower. Overall, the vortex pair appears to be squished together with little
entrainment of the mainstream under the jet vortex pair. This means that the vortex pair has
not lifted off the surface as seen for baseline resulting in the mainstream filling the region
between the coolant jet and wall. Also interesting is to see the additional vortices generated

89
along the edges of the hole-to-hole centerline. The vortices are opposite to the main vortex
pair and appear to be a weaker pair. This may be because the jets spread to the trench and
create secondary vortices as they come out and interact with the mainstream. The ε−k
model cannot capture the vortex pair very well and also the additional vortex pair is not
shown.
(a) RSM (b) ε−k
Fig 5.19 Secondary flow vectors colored by temperature, x/D=3, baseline
(a) RSM (b) ε−k
Fig 5.20 Secondary flow vectors colored by temperature, x/D=3, trench case 1

90
(a) RSM (b) ε−k
Fig 5.21 Secondary flow vectors colored by temperature, x/D=3, crater case 7
Fig 5.21 shows the velocity vectors for the crater hole case by two models. It is
interesting to note the jet is entrained with the mainstream and the coolant jet has been lifted
off from the surface. This may indicate rapid dissipation of the film downstream and this was
confirmed by Fig 5.22.
Fig 5.22 Computed non-dimensional temperature contours of the film temperature and mixing downstream of the holes
91
Due to the ε−k model cannot capture the complex flow characteristics very well, the
CFD results presented in the following sections were obtained from the RSM.
Fig 5.22 shows centerline non-dimensional temperature (θ) contours for the three typical
cases at M=1, respectively, to demonstrate the effect of hole depth and crater shape on jet
trajectory.
It is seen that the baseline case shows the jet lift-off from the surface resulting with little
coolant attached to the surface a bit downstream of the hole exit. The cooling air is away
from the surface with mainstream entrainment under. This causes lower film effectiveness on
the wall. The trenched holes seems to perform better than the baseline for M=1.0. The coolant
from the cylindrical holes enter a 2-D slot before they exit and make contact with the
mainstream. Due to the presence of this 2-D slot, the coolant tends to fill the slot and
provides a more two-dimensional film that spreads laterally compared to the baseline case.
As the depth of the slot is increased, the coolant appears to provide a more two-dimensional
jet with less and less lift-off. This hugging of the coolant with the surface results in higher
cooling effectiveness of the trenched holes. The trenching of the holes due to TBC coating
may not necessarily be a negative due to the significantly improved coolant trajectories. One
other aspect of the trenching has to be enhancement of heat transfer coefficient because of
injection. Lu et al. [72] also presented heat transfer coefficients clearly showing that the
trenched holes do produce higher heat transfer coefficients than the baseline. However, the
enhancement in coolant film effectiveness was far higher than the heat transfer coefficient
enhancements. Compared to the baseline case, the crater hole actually show higher lift-off
and also show very little far reaching effects of the jet downstream.

92
(a) Baseline
(b) Trench Case 1
(c) Crater Case 7
Fig 5.23 Secondary flow vectors at x/D=1, x/D=3 and x/D=7 for three geometries

93
Fig 5.23 shows the secondary flow vectors colored by the static temperature at three
different streamwise locations for baseline, trench case 1 and crater case 7. It is clear that
with increasing the downstream distance, the vortices is such that it lifts the jets off from the
surface and less coolant come under the jet core which results in higher temperature along the
surface and leads to lower film effectiveness with increasing the distance downstream of the
hole injection. This explains the film cooling non-dimensional temperature distributions
shown in Fig 5.22.
Fig 5.24 Flow contours colored by z-vorticity, x/D=3
Fig 5.24 presents the vorticity strength due to the vortex formation after coolant ejection
for both cases. It is clear that the vortices are moving away from the surface for the baseline
case. Also the vortex stretching is away from the wall resulting in reduced coolant protection
near the wall. Two weaker vortices are seen on either side of the main vortex pair due to the
entrained mainstream flow.

94
(a) Baseline
(b) Trench Case 1
(c) Crater Case 7
Fig 5.25: Stagnation temperature at x/D=3, (a) baseline; (b) trench and (c) crater
For the trench case, the vortex strength is stretched along the spanwise direction showing
more active protection of the coolant along the wall with little mainstream entrainment under
the jet vortices. The side vortices are also stronger indicating the presence of more coolant
ejected out of the trench in between the hole locations. It is evident for the crater hole case

95
that vortices stretching is moving away from the wall and the coolant protection on the
surface decreases. Fig 5.24 confirms the findings from the velocity vector plots shown in Fig
5.19 to Fig 5.21.
Fig 5.25 presents the cross-plane temperature distributions at x/D=3 just downstream of
injection for three geometries. The bean shaped structure of the vortices for the baseline is
clearly seen with the coolant inside the bean shaped structure. Little cross-mixing is seen
outside the bounds of the vortices. This is consistent with previous published studies. With
the trench, the temperature does not see a strong two vortex structure but a more clear jet core
close to the wall. There is also spanwise mixing along the wall indicative of the cooler
temperatures along the span. This is clearly a major improvement than the baseline where
even at the jet location, we see entrainment of mainstream below the vortices resulting in
higher temperatures. For the crater, it seems that the temperature does not show strong vortex
structure and the jet core is lifted from the wall. This is reflected in the surface film
effectiveness distributions.
Fig 5.26 presents the pathlines of the coolant and mainstream imposed on velocity
contours for baseline, Case 1 and Case 7. Baseline shows the jet exits uniformly out of the
hole and interacts with the mainstream. The jet displaces the mainstream and this
displacement depends on the momentum of the jet with respect to the mainstream.
For the trench case (Case 1), the jet exits the cylindrical hole and slows down as it enters
the trench due to area increase and exits out of the trench at a much lower velocity than for
the baseline case. The exit velocity for Case 1 is about 30% lower than for the baseline case
indicating that the jet will have a lower momentum and thus will tend to stay closer to the

96
surface or “hug” the surface better. Also, the downstream edge of the jet interacts with the
trench edge and pushes coolant towards the upstream side resulting in a larger displacement
of the mainstream from the surface. There is however a small recirculation zone on the
upstream edge of the trench.
(a) Baseline
(b) Trench Case 1
(c) Crater Case 7
Fig 5.26 Mainstream-jet interactions for (a) baseline, (b) Trench Case 1 and (c) Crater Case 7

97
For the offset cratered hole (Case 7), the jets appear to be slightly slower exiting the
crater but largely unaffected except at the downstream edge. A large recirculation zone is
seen upstream of the hole exit inside the crater. This region may also entrain some hot
mainstream gases and may be detrimental to the blade metal surface. Overall, the computed
flow characteristics help in describing the detailed surface behavior obtained from the
experiments.
(a) Baseline (b) Trench Case 1 (c) Crater Case 7
Fig 5.27 Film effectiveness distributions for simulation and experiment of (a) baseline, (b) Trench Case 1 and (c) Crater Case 7
Fig 5.27 presents the local film effectiveness contours comparing the computations with
the experimental data of Lu et al. [72-73]. The results show similar levels but significantly
different local trends. For the baseline, the experimental data shows a pinch region at x/d=2
and spreading of coolant further downstream whereas the computational results do not show
that. The computations show very little spreading of the film effectiveness away from the
middle region. This has been pointed out as the bane of the turbulence models as they tend to

98
smear out the local variations. However, the levels beyond x/D=2 seems to be similar for
both experiments and computations. For the trench case, the experimental results show more
lateral spreading inside the trench before the coolant is ejected. The computations do not
show the spreading and also show longer effect of the jets. The computations do show lot
more lateral coverage for trenches than the baseline. Again, the levels are similar for both
experiments and computations. For the crater case, the experimental results also show more
lateral coolant spreading downstream of the holes than the baseline case. And the CFD results
show a lot more lateral coverage than the baseline.
Fig 5.28 Comparison of spanwise averaged film effectiveness
Fig 5.28 presents the comparison of spanwise averaged film effectiveness (η) for
baseline, trench and crater geometries comparing experiments with computations. It can be
seen that computational predictions for these cases are much higher than for the experimental

99
data, although the benefit of the trench and crater design is shown. The levels of increase
shown from baseline to trench, crater case is similar for both experiments and CFD. It has
always been indicated by previous film cooling prediction studies that the CFD results cannot
predict the spreading of jets accurately and overpredict centerline effectiveness. The spanwise
averaged results show similarities as the cross-stream direction is averaged and washes out
the local discrepancies between the predictions and experiments. It is interesting that the
baseline experimental and CFD results almost match beyond x/D=6. The trench case does not
show the excellent matching at any location. The CFD result is consistently 10% higher than
the experimental result beyond x/D=2. However, the crater case experiment and CFD results
match almost on top of each other. It is observed that the difficulty in predicting film
effectiveness values is not unexpected and the steady RANS codes have difficulty predicting
film effectiveness due to the inability to capture the additional mixing due to the strong
mainstream/jet interaction.

100
CHAPTER 6 SUMMARY
1. A detailed study on two new film hole configurations has been presented. Different
hole exit strategies were studied with crescent and converging slot exit geometry.
Both heat transfer and film effectiveness were measured using a transient infrared
thermography technique. It appears both the crescent and slot exits reduce the jet
momentum at the exit and also spreads the jets and provides two-dimensional jet
coverage compared to the three-dimensional nature of individual jets from typical
cylindrical holes.
2. Film cooling for cratered holes also has been explored. The cratered holes increase
film effectiveness over the baseline case by about 50%. However, they do not
provide significant lateral spreading as seen for trench holes. Overall, the cratered
holes do not perform as well as the trenched holes but clearly show significant
improvement at low blowing ratios over baseline. This is the first study that focused
on cratered holes and provided a better understanding of the film behavior for these
types of holes. The effect of crater depth may have an impact as the present study
only investigated a shallow crater of 0.5D depth.
3. Attempts to understand coolant behavior from trench and crater holes was undertaken
in this study. The commercial CFD code Fluent with RSM turbulence model was
employed to run the computations. The results are compared with experimental
results obtained by Lu et al. [72-73]. The results show the vertical structure of the jets
after ejection from the holes is significantly different for the trenched and crater holes
compared to the baseline. The coolant, in effect, stays closer to the surface and does

101
not allow main entrainment and also spreads laterally. The film effectiveness
distributions show stronger coverage for the trenched and crater holes. However, this
study provides more detail into the trenched and crater holes behavior and also shows
that the RSM model provides better comparisons with experimental results for
averaged data. Local distributions still show significant variations between the
experimental and CFD results.
102
REFERENCES 1. http://www.andrew.cmu.edu/ 2. Friedrichs, S. “Endwall Film-Cooling in Axial Flow Turbines” Cambridge University
Dissertation, 1997
3. Han, J.C., Park, J.S., and Lie, C.K., 1984. “Heat Transfer and Pressure Drop in Blade Cooling Channels with Turbulence Promoters.” Texas A&M University (prepared for NASA CR-3837)
4. Hay, N. and Lampard, D., 1996, “Discharge Coefficient of Turbine Cooling Holes: A
Review.” ASME paper 96-GT-492 5. Goldstein, R.J., 1971. “Film Cooling” In Advancement in Heat Transfer. Academic Press,
New York, Vol.7, pp321-379 6. Lin, Y.Z., Song, B., 2006, “Measured Film Cooling Effectiveness of Three Multihole
Patterns”, Journal of Heat Transfer, Vol. 128, pp.192-197 7. Jung, I.S., Lee, J.S., 2000, “Effects of Orientation Angles on Film Cooling Over a Flat
Plate: Boundary Layer Temperature Distributions and Adiabatic Film Cooling Effectiveness”, Journal of Turbomachinery, Vol.122, pp. 153-160
8. Goldstein, R. J., Eckert, E. R. G., Eriksen, V. L., and Ramsey, J. W., 1970, “Film Cooling
Following Injection Through Inclined Circular Tubes,” Israel Journal of Technology, Vol. 8, No. 1–2, pp. 145–154.
9. Mehendale, A.B., Han, J.C. and Ou, S., “Influence of High Mainstream Turbulence on
Leading Edge Heat Transfer,” ASME Journal of Heat Transfer, Vol. 113, November 1991, pp. 843-850.
10. Honami, S., Shizawa, T., and Uchiyama, A., 1994, “Behavior of the Laterally Injected Jet
in Film Cooling: Measurements of Surface Temperature and Velocity/ Temperature Field Within the Jet,” ASME Journal of Turbomachinery, Vol. 116, pp. 106–112.
11. Schmidt, D. L., Sen, B., 1996, “Film Cooling With Compound Angle Holes: Adiabatic
Effectiveness,” ASME Journal of Turbomachinery, Vol.118, pp. 807–813. 12. Ekkad, S. V., Zapata, D., and Han, J. C., 1997, “Film Effectiveness Over a Flat Surface
With Air and CO2 Injection Through Compound Angle Holes Using a Transient Liquid Crystal Image Method,” ASME Journal of Turbomachinery, Vol.119, pp. 587–593.

103
13. Ammari,H.D., Hay, N., and Lampard, D., 1990 “The Effect of Density Ratio on the Heat Transfer Coefficient from a Film Cooled Flat Plate.” ASME Journal of Turbomachinery, Vol. 112, pp444-450.
14. Bons, J.P., MacArthur, C.D., and Rivir, R.B., 1996, “The Effect of High Free-Stream
Turbulence on Film Cooling Effectiveness.” ASME Journal of Turbomachinery, Vol.118, pp.814-825.
15. Blair, M. F., 1974, “An Experimental Study of Heat Transfer and Film Cooling on
Large-Scale Turbine Endwalls,” ASME Journal of Heat Transfer, Vol. 96, pp. 524-529. 16. Chyu, M. K., Hsing, Y.C., and Bunker, R.S., 1998, “Measurements of Heat Transfer
Characteristics of Gap Leakage Around a Misaligned Component Interface,” ASME Paper 98-GT-132.
17. Bunker, R.S., 2002, “Film Cooling Effectiveness due to Discrete Holes within a
Transverse Surface Slot,” ASME Paper GT2002-30178. 18. Wang, T., Chintalapati, S., Bunker, R.S., and Lee, C. P., 2000, “Jet Mixing in a Slot,”
Experimental Thermal and Fluid Science, Vol. 22, pp. 1-17. 19. Lu, Y., Nasir, H., and Ekkad, S.V., 2005, “Film Cooling from a Row of Holes Embedded
in Transverse Slots,” ASME Paper IGTI2005-68598. 20. Ligrani, P. M., Wigle, J. M., Ciriello, S., and Jackson, S.W., “Film-Cooling From Holes
with Compound Angle Orientations: Part 1-Results Downstream of Two Staggered Rows of Holes with 3d Spanwise Spacing,” ASME Journal of Heat Transfer, Vol. 116, No. 2, 1994, pp. 341-352.
21. Ligrani, P. M., Wigle, J. M., and Jackson, S.W., “Film-Cooling From Holes with
Compound Angle Orientations: Part 2-Results Downstream of a Single Row of Holes with 6d Spanwise Spacing,” ASME Journal of Heat Transfer, Vol. 116, No. 2, 1994, pp. 353-362.
22. Sen, B., Schmidt, D.L., and Bogard, D. G., “Film Cooling with Compound Angle Holes: Heat Transfer,” ASME Journal of Turbomachinery, Vol.118, No. 4, 1996, pp. 801-807.
23. Schmidt, D. L., Sen, B., and Bogard, D. G., “Film Cooling with Compound Angle Holes:
Adiabatic Effectiveness,” ASME Journal of Turbomachinery, Vol. 118, No. 4, 1996, pp. 807-813.
24. Ekkad, S. V., and Zapata, D., “Heat Transfer Coefficients Over a Flat Surface with Air
and CO2 Injection Through Compound Angle Holes Using a Transient Liquid Crystal Image Method,” ASME Journal of Turbomachinery Vol. 119, No. 3, 1997, pp. 580-586.

104
25. Foster, N.W., Lampard, D., “The Flow and Film Cooling Effectiveness Following Injection Through a Row of Holes”, ASME Journal of Eng. Power 102 (1980) pp. 584-588
26. Kohli, A., Bogard, D., “Adiabatic Effectiveness Thermal fields and Velocity Fields for
Film Cooling with Large Angle Injection”, ASME Journal of Turbomachinery, 119(1997) pp.352-358.
27. Makki, Y., and Jakubowski, G., 1986, “An Experimental Study of Film Cooling From
Diffused Trapezoidal Shaped Holes,” AIAA Paper 86-1326. 28. Gritsch, M., Schulz, A., and Wittig, S., “Heat Transfer Coefficient Measurements of Film
Cooling Holes with Expanded Slots,” American Society of Mechanical Engineers, ASME Paper 98-GT-28, June 1998.
29. Gritsch, M., Schulz, A., and Wittig, S., “Adiabatic Wall Effectiveness Measurements of
Film Cooling Holes with Expanded Exits,” ASME Journal of Turbomachinery, Vol.120, No. 3, 1998, pp. 549-556.
30. Dittmar, J., Schulz, A., and Wittig, S., 2002, “Assessment of Various Film Cooling
Configurations Including Shaped and Compound Angle Holes Based on Large Scale Experiments,” ASME GT-2002-30176.
31. Sargison, J. E., Guo, S. M., Oldfield, M. L.G., Lock, G. D., and Rawlinson, A. J., 2002,
“Flow Visualization of a Converging Slot-Hole Film Cooling Geometry,” ASME Paper GT 2002-30177.
32. Waye, S.K., and Bogard, D.G., 2006, “High Resolution Film Cooling Effectiveness
Measurements of Axial Holes Embedded in a Transverse Trench with Various Trench Configurations,” ASME Paper GT2006-90226.
33. Fric, T.F., and Campbell, R.P., 2002, “Method for Improving the Cooling Effectiveness
of a Gaseous Coolant Stream which Flows Through a Substrate and Related Articles of Manufacture,” US Patent No.6,383,602.
34. Burd, S.W., and Simon, T.W., 1997, “The Influence of Coolant Supply Geometry on Film
coolant Exit Flow and Surface Adiabatic Effectiveness.” ASME Paper 97-GT-25. 35. Leylek, J.H., and Zerkle, R.D., 1994. “Discrete-jet Film Cooling: A Comparison of
Computational Results with Experiments.” ASME Journal of Turbomachinery, Vol. 116, pp358-368.
36. Walters, D.B., and Leylek, J.H., 1997. “A Detailed Analysis of Film-Cooling Physics Part
I: Streamwise Injection with Cylindrical Holes.” ASME International Gas Turbine &

105
Aeroengine Congress & Exhibition, Orlando, Fla., June 2-5, ASME Paper 97-GT-269. 37. Brittingham, R.A. and Leylek, J.H., 1997. “A Detailed Analysis of Film-Cooling Physics
Part IV: Compound Angle Injection with Shaped Holes.” ASME International Gas Turbine & Aeroengine Congress & Exhibition, Orlando, Fla., June 2-5, ASME Paper 97-GT-272.
38. Neelakantan, S., and Crawford, M.E., 1995. “Prediction of Film Cooling Effectiveness
and Heat Transfer Due to Streamwise and Compound Angle injection on Flat Surface.” International Gas Turbine & Aeroengine Congress & Exposition, Houston, Tex., June 5-8, ASME Paper 95-GT-151
39. Berhe,M.K., and Patanka, S.V., 1997, “Computation of Discrete-Hole Film Cooling;
AHydrodynamics Study,” ASME International Gas Turbine and Aeroengine Congress & Exhibition, June 1997, Orlando, Fla., ASME Paper 97-GT-80.
40. Bohn, D.E., Becker, V.J., and Kusterer, K.A., 1997, “3-D Conjugate Flow and Heat
Transfer Calculations of a Film-Cooled Turbine Guide Vane at Different Operation Conditions,” ASME International Gas Turbine and Aeroengine Congress & Exhibition, June 1997, Orlando, Fla. ASME Paper 97-GT-23.
41. Fougeres, J.M., and Heider, R., 1994, “Three-Dimensional Navior-Stokes Prediction of
Heat Transfer with Film Cooling,” International Gas Turbine and Aeroengine Congress & Exhibition, June 1994, The Hague, Netherlands. ASME Paper 94-GT-14.
42. Fukuyama, Y., Otomo, F., Sato, M., Kobayashi, Y., and Matsuzaki, H., 1995, “Prediction
of Vane Surface Film Cooling Effectiveness Using Compressible Navier-Stokes Procedure and k-F Turbulence Model with Wall Function,” International Gas Turbine and Aeroengine Congress & Exhibition, June 1995, Houston, Tex. ASME Paper 95-GT-25.
43. Hyams, D.G., Leylek, J.H., 1997 “A Detailed Analysis of Film Cooling Physics. Part III;
Streamwise Injection with Shaped Holes,” International Gas Turbine and Aeroengine Congress & Exhibition, June 1997, Orlando, Fla. ASME Paper 97-GT-271.
44. Mcgovern, K.T., Leylek, J.H., 1997 “Film Cooling from Holes with Expanded Exits; A
Comparison of Computational Results with Experiments,” International Gas Turbine and Aeroengine Congress & Exhibition, June 1997, Orlando, Fla. ASME Paper 97-GT-270.
45. Giebert, D., Gritsch, M., Schulz, A. and Wittig, S., 1997 “A Detailed Analysis of Film
Cooling Physics. Part III; Streamwise Injection with Shaped Holes,” International Gas Turbine and Aeroengine Congress & Exhibition, June 1997, Orlando, Fla. ASME Paper 97-GT-163

106
46. Lin, Y.L., Stephens, M.A., and Shih, T.I., 1997 “Computation of Leading-Edge Film Cooling with Injection through Rows of Compound Angle Holes,” International Gas Turbine and Aeroengine Congress & Exhibition, June 1997, Orlando, Fla. ASME Paper 97-GT-298.
47. He, P., Salcudean, M., and Gartshore, I.S.,1995, “Computations of Film Cooling for the
Leading Edge Region of a Turbine Blade Model,” International Gas Turbine and Aeroengine Congress & Exhibition, June 1994, Houston, Tex. ASME Paper 95-GT-20.
48. Irmisch, S., 1995, “Simulation of Film-Cooling Aerodynamics with a 2D Nvier-Stokes
Solver Using Unstructured Meshes,” International Gas Turbine and Aeroengine Congress & Exhibition, June 1995, Houston, Tex. ASME Paper 95-GT-24.
49. Garg, V.K., Gaugler, R.E., 1993, “Heat Transfer in Film Cooled Turbine Blades,”
International Gas Turbine and Aeroengine Congress & Exhibition, May 1993, Cincinnati, Ohio. ASME Paper 93-GT-81.
50. Garg, V.K., Gaugler, R.E., 1994, “Prediction of Film Cooling on Gas Turbine Airfoils,”
International Gas Turbine and Aeroengine Congress & Exhibition, June 1994, The Hague, Netherlands. ASME Paper 94-GT-16.
51. Garg, V.K., Gaugler, R.E., 1996, “Leading Edge Film Cooling Effects on Turbine Blade
Heat Transfer,” Numerical Heat Transfer, Part A, Vol. 30, pp.165-187. ASME Paper 95-GT-275
52. Garg, V.K., Gaugler, R.E., 1997a, “Effect of Coolant Temperature and Mass Flow on
Film Cooling of Turbine Blades ,” International Journal of Heat and Mass Transfer, Vol. 40, No. 2, pp.435-444, ASME Paper 95-WA/HT-1.
53. Garg, V.K., Gaugler, R.E., 1997b, “Effect of Velocity and Temperature Distribution at
the Hole Exit on Film Cooling of Turbine Blades,” International Journal of Turbomachinery, Vol. 119, pp.343-349.
54. Martin, C.A., and Thole, K.A., 1997 “A CFD Benchmark Study; Leading Edge Film
Cooling with Compound Angle Injection,” International Gas Turbine and Aeroengine Congress & Exhibition, June 1997, Orlando, Fla. ASME Paper 97-GT-297.
55. Walters, D.B., Mcgovern, K.T., Butkiewicz, J.J, and Laylek, J.H., 1995 “A Systematic
Computational Methodology Applied to Jet-In-Crossflow. Part 2; Unstructured/Adaptive Grid Approach,” ASME International Mechanical Engineering Congress & Exhibition, Nov 1997, San Francisco, Calif. ASME Paper 97-WA/HT-2.
56. Gillespie, D.R.H., Wang, Z., Ireland, P.T., and Kohler, S.L., 1996, “Full Surface Local
Heat Transfer Coefficient Measurements in a model of an Integrally Cast Impingement

107
Cooling Geometry,” Proc. Of the International Gas Turbine and Aeroengine Congress & Exhibition, June 1996, Birmingham, UK.
57. http://www.tufts.edu/as/tampl/en43/lecture_notes/ch4.html 58. Incropera, F. P. and DeWitt, D. P. Introduction to Heat Transfer, New York: John Wiley
& Sons, 2002. 59. Metzger, D. E., and Larson, D. E., 1986, “Use of Melting Point Surface Coatings or Local
Convective Heat Transfer Measurements in Rectangular Channel Flows with 90-Deg. Turns,” ASME Journal of Heat Transfer, Vol. 108, pp. 48-54.
60. Vedula, R. P., and Metzger, D. E., 1991, “A Method for the Simultaneous Determination
of Local Effectiveness and Heat Transfer Distributions in a Three Temperature Convective Situations,” ASME Ppaer 91-GT-345.
61. Ekkad, S.V., Du, H., and Han, J. C., 1998, “Detailed Film Cooling Measurements on a
Cylindrical Leading Edge Model: Effect of Free-stream Turbulence and Density Ratio,” ASME Journal of Turbomachinery, Vol. 120, pp. 779-807.
62. Du, H. Han, J. C., and Ekkad, S.V., 1998, “Effect of Unsteady Wake on Detailed Heat
Transfer Coefficient and Film Effectiveness Distributions for a Gas Turbine Blade,” ASME Journal of Turbomachinery, Vol. 120, pp. 808-817.
63. Ekkad, S. V., Ou, S. and Rivir, R. V.” A Transient Infrared Thermography Method for
Simultaneous Film Cooling Effectiveness and Heat Transfer Coefficient Measurements from a Single test,” GT2004-54236, Proceedings of ASME Turbo Expo 2004, Vienna, Austria
64. FLIR Systems, Incorporated. (2003). ThermaCAM TM Researcher, Professional Edition,
Version 2.7[User’s Manual]. North Billerica, MA.
65. Kline, S.J. and McClintock, F.A., 1953, “Describing Uncertainties in Single Sample Experiments,” Mechanical Engineering, Vol. 75, pp. 3-8.
66. Jang, Y.-J., Chen, H.-C, and Han, J.C., 2000, “Flow and Heat Transfer in a Rotating
Square Channel with °45 Angled Ribs by Reynolds Stress Turbulence Model,” ASME Paper No.2000-GT-0229.
67. Al-Qahtani, M., Jang, Y.-J., Chen, H.-C., and Han, J.-C., 2002,” Prediction of Flow and
Heat Transfer in Rotating Two-Pass Rectangular Channels with 45-deg Rib Turbulators,” ASME Journal of Turbomachinery, Vol. 124, pp. 242-250.

108
68. B. E. Lauder and D.B. Spalding, Lectures in Mathematics Models of Turbulence, Academic Press, London, England, 1972
69. FLUENT-UNS V.6.0. http://www.fluent.com/software 70. Goldstein, R.J., and Taylor, J.R., 1982, “Mass Transfer in the Neighborhood of Jets
Entering a Crossflow,” ASME Journal of Heat Transfer, Vol.104, pp715-721. 71. Klinger, H., and Hennecke, D.K., 1993, “The Effect of Mainstream Flow Angle on Flame
Tube Film Cooling,” AGARD Conference Proceedings CP-527, Heat Transfer and Cooling in Gas Turbines.
72. Lu, Y., Dhungel, A., Ekkad, S.V., and Bunker, R.S. 2007, “Effect of Trench Width and
Depth on Film Cooling from Cylindrical Holes Embedded in Trenches,” ASME Paper GT2007-27388, also to appear in ASME Journal of Turbomachinery.
73. Lu, Y., Dhungel, A., Ekkad, S.V., and Bunker, R.S. 2007, “Film Cooling Measurements
for Cratered Cylindrical Inclined Holes,” ASME Paper GT2007-27386

109
VITA
Yiping Lu is a doctoral candidate in the program of engineering science of Louisiana State
University since 2003. She received her bachelor’s degree and maser’s degree from East China
Shipbuilding Institute, both in mechanical engineering, in 1999 and 2002 respectively. Ms.Lu
worked on two-phase combustion in the burner with two-pass swirler before joining Louisiana
State University. Her current research interests focus on the gas turbine film cooling and heat
transfer measurement, especially using IR thermography. Ms. Lu published several papers on
the effect of hole configuration on the gas turbine flat surface film cooling and leading-edge
film cooling. She also had some publications on the area of numerical detection of low
emission combustor and stress singularity.