Embed Size (px)
Citation preview

South African Journal of Animal Science 2020, 50 (No. 4)
URL: http://www.sasas.co.za ISSN 0375-1589 (print), ISSN 2221-4062 (online) Publisher: South African Society for Animal Science http://dx.doi.org/10.4314/sajas.v50i4.6
Effect of including canola meal in diets of slaughter ostriches (Struthio camelus var. domesticus)
T.S. Brand1,2,#, J. van der Merwe2 & L.C. Hoffman2,3
1Directorate: Animal Sciences, Department of Agriculture, Western Cape Government, Private Bag X1, Elsenburg, 7607,
South Africa; 2Department of Animal Sciences, University of Stellenbosch, Private Bag X1, Matieland, 7602, South Africa;
3Centre for Nutrition and Food Sciences, Queensland Alliance for Agriculture and Food Innovation, University of
Queensland, Australia
(Submitted 5 April 2019; Accepted 29 June 2019; First published online 8 September 2020)
Copyright resides with the authors in terms of the Creative Commons Attribution 4.0 South African Licence.
See: http://creativecommons.org/licenses/by/4.0/za Conditions of use: The user may copy, distribute, transmit and adapt the work, but must recognise the authors and the South African
Journal of Animal Science.
______________________________________________________________________________________
Abstract Canola meal (CM) is a locally produced protein source that may be less expensive than soybean meal
(SBM). This study evaluated the effects of replacing 0%, 25%, 50%, 75%, and 100% SBM with CM in diets for slaughter ostriches. The CM was added at the expense of SBM and other concentrates, with minor changes in other ingredients. Birds (n = 15 per treatment) were reared from 77 to 337 days old on the trial diets, which were supplied ad libitum for starter, grower, and finisher phases. Bodyweights and feed intake were measured during these phases. No differences (P >0.05) were found between treatments for live weight at the end of each phase, dry matter intake (DMI), average daily gain (ADG) and feed conversion ratio (FCR) over all the growth phases. Although no differences were observed in live weight at the end of each phase, the birds reared on the diet with 50% CM were heaviest at slaughter, and birds reared with 100% CM were lightest (P <0.05). Differences (P <0.05) between diets were observed for the weight at slaughter, weights of the liver and thyroid glands and the pH of the cold carcass. However, no differences (P >0.05) were observed between diets for fat pad weight, dressing percentage, and weights of thighs and Muscularis gastrocnemius. The results indicate that CM could replace SBM in the diets of slaughter ostriches without affecting production traits and slaughter yields. ______________________________________________________________________________________ Keywords: alternative protein, average daily gain, canola, dry matter intake, feed conversion ratio, growth, ostrich nutrition, production #Corresponding author: [email protected]
Introduction Nutrition is the most important and greatest expense in any livestock industry (Brand & Jordaan,
2011), and cannot be neglected, because it has a direct influence on the growth and production of the animals. The only feasible approach to reducing feeding costs is to identify alternative local raw materials that can be incorporated in the diets of ostriches. Research into the influence of these alternative raw materials on production characteristics is essential to ensure profitability.
Protein makes up a large component of ostrich feed, and thus represents a large portion of the feeding costs (Carstens, 2013; Dalle Zotte et al., 2013). The price of protein sources is increasing as protein becomes more and more scarce owing to a rapid rise in the human population (Brand et al., 2000a; Brand et al., 2004a). Currently, SBM is the main protein source in animal feeds in South Africa (Dalle Zotte et al., 2013; Snyman, 2016). The current demand for soybean in the country is higher than production, therefore large quantities are imported, which leads to increased feed prices (Sihlobo & Kapuya, 2016; AFMA, 2017). Although protein is expensive and scarce, there is little information about the nutritive values of alternative sources for ostrich diets (Brand et al., 2000a) and the effects they might have on production. It is thus important to quantify the nutritive value of alternative protein sources by formulating diets that fit the needs of ostriches without compromising production.
South Africa produces a large quantity of canola, especially in the Western Cape. Canola is used predominantly to produce vegetable oil. Canola meal (CM) is the by-product after the extraction of oil from

538 Brand et al., 2020. S. Afr. J. Anim. Sci. vol. 50
the seeds (Zheng et al., 2017). It has a protein content of approximately 36% and is potentially useful as a protein source in animal feed (Newkirk, 2009). However, anti-nutritional factors, including glucosinolates, in feed that contains CM influence DMI when it is provided to birds in a free choice feeding system over a limited period (Brand et al., 2018; Niemann, 2018; Van der Merwe, 2019). Therefore, the current study was conducted to evaluate the replacement of SBM with CM in the diets of slaughter ostriches.
Materials and Methods Ethical clearance for the current study was obtained from Elsenburg Departmental Ethics Committee
(DECRA R14/108). During the trial, all birds were monitored every day to ensure their wellbeing. The Code of Conduct for the Commercial Production of Ostriches (2011) of the South African Ostrich Business Chamber for rearing, handling, vaccinating and transporting was followed throughout the trial.
The 230 South African Black ostriches that were used in this trial were hatched in November 2016 at Oudtshoorn Research Farm. The trial ran until November 2017, when the remaining 197 ostriches were slaughtered. Post-mortem evaluations were conducted by an experienced veterinarian on dead ostrich chicks to determine the cause of death and to establish whether mortalities were related to nutrition. If nutrition had been identified as the cause of death, the trial would have been terminated immediately.
After hatching, the chicks were stratified by weight and divided into five groups, which represented the treatments, with equal numbers of chicks and an average chick weight of 0.894 ± 0.007 kg. These groups were sub-divided into three sub-groups, resulting in fifteen small groups (± 15 chicks per group, with the male to female ratio being equal among the treatments). Thus, there were three replicates per dietary treatment. Each of the fifteen groups was allocated to a similar camp of 10 x 5 m with adequate shelter and indoor housing (5 x 3 m). All groups received the same pre-starter diet (Table 1) up to 76 days old. Water and feed were provided ad libitum at all times. At 84 days old, all chicks were vaccinated against Newcastle disease.
Five experimental diets were formulated for each of the phases according to the model developed by Gous and Brand (2008) using Mixit
® 2+ feed formulation software, namely starter (Table 2), grower (Table
3), and finisher (Table 4). All diets were formulated to be isonutritious in terms of energy and essential amino acids, that is, lysine, and total sulphur-containing amino acids threonine, tryptophan, and arginine. Each diet had a different inclusion level of CM, which replaced soybean meal in the increments of 0%, 25%, 50%, 75% and 100%. In an attempt to keep the diets isonutritious, changes in the grain components of the diets were inevitable.
The trial feeds were milled and pelleted on Oudtshoorn Research Farm. Approximately one kilogram was sampled from each batch of feed and sent for laboratory analysis to ensure uniform nutrient composition between the batches. The methods of the Association of Official Analytical Chemists (AOAC, 2012) were followed to determine dry matter (method 934.01), crude protein (method 990.03), crude fibre (Goering & Van Soest, 1970), detergent fibre, and neutral detergent fibre (Van Soest et al., 1991). The guidelines of Agri Laboratory Association of South Africa (AgriLASA, 1998) were followed to determine the calcium and phosphorous values (method 6.1.1).
The glucosinolate concentration of the dry CM was determined by liquid chromatography-mass spectrometry (LC-MS). The samples were prepared by extracting 1 g of the CM with 25 mL of 50% MeOH/1% formic acid with vortexing and ultrasonification. After extraction, the sample was centrifuged and the clear supernatant was transferred to glass vials for analysis by LC-MS (Taylor, M.J.C., pers. comm., Central Analytic Facilities, Stellenbosch University, Stellenbosch, 7600, South Africa, October 2018). The glucosinolate contents of each of the trial diets are presented in Table 5.

Brand et al., 2020. S. Afr. J. Anim. Sci. vol. 50 539
Table 1 Ingredient and chemical composition of pre-starter diet fed to ostrich chicks at 0 - 76 days old (as-fed basis)
Ingredients Amount (kg/ton)
Maize (yellow grain) 504.36
Lucerne meal, 17% crude protein
100.87
Soybean meal, 44% crude protein
172.82
Fish meal 75.65
Canola meal, 34% crude protein
50.44
Canola oil 50.44
Limestone, ground 24.31
Monocalcium phosphate
4.01
Sodium chloride
10.09
Vitamin and mineral premix1
5.04
Lysine-HCl 1.97
Nutrients (as formulated)
Dry matter (g/kg) 907.40
Metabolizable energy ostrich (MJ/kg feed)2 14.36
Crude protein (g/kg) 205.68
Crude fibre (g/kg) 54.31
Crude fat (g/kg) 78.46
Calcium (g/kg) 15.18
Phosphorous (g/kg) 6.03
1 Vitamin A: 15 000 000 IU, Vitamin D3: 4 000 000 IU, Vitamin E: 60 000 mg, Vitamin K3: 3 000 mg, Vitamin B1: 5000 mg,
Vitamin B2: 10 000 mg. Vitamin B6: 8 000 mg, Vitamin B12: 100 mg, Niacin: 100 000 mg, Pantothenic acid: 15 000 mg, Folic acid: 3 000 mg, Biotin: 300 mg, Choline: 800 000 mg, Magnesium: 50 000 mg, Manganese: 120 000 mg, Iron: 30 000 mg, Zinc: 120 000 mg, Copper: 8 000 mg, Cobalt: 300 mg, Iodine: 2 000 mg, Selenium: 300 mg, Antioxidant: 125 000 mg; incorporated into the ration at 2.5 kg per ton. 2 ME ostrich = 6.35 + 0.645 × ME poultry (Gous & Brand, 2008); ME: metabolizable energy
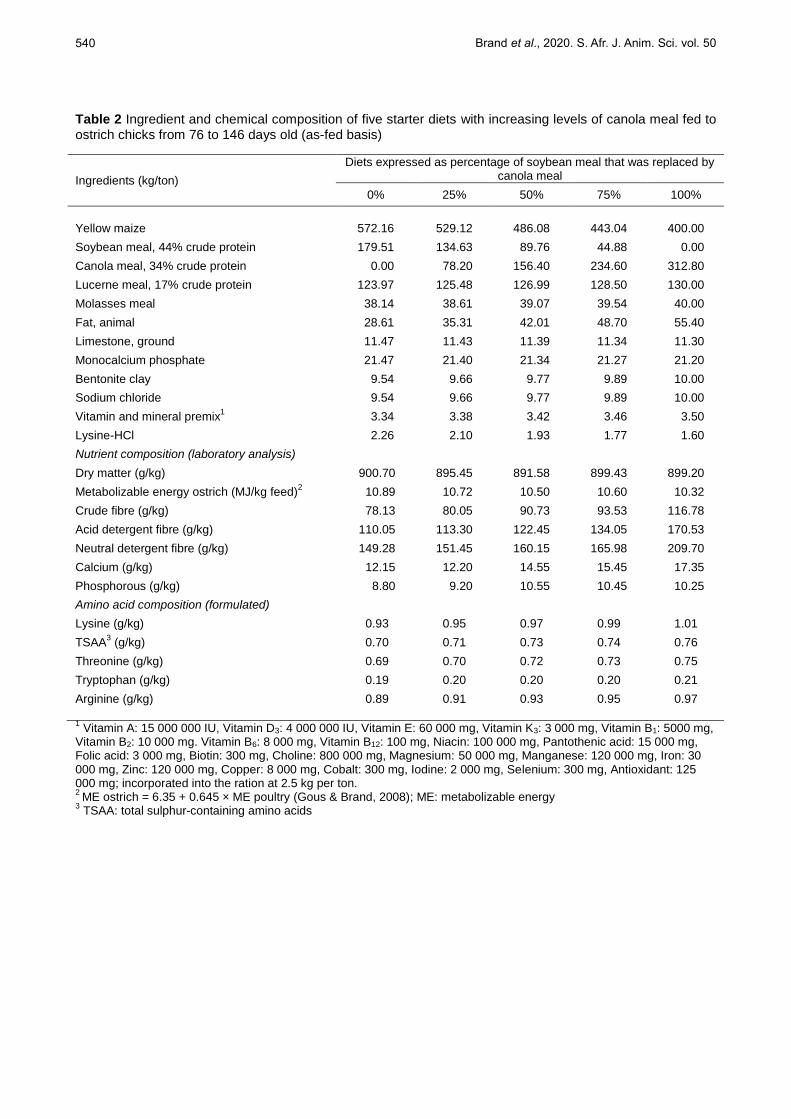
540 Brand et al., 2020. S. Afr. J. Anim. Sci. vol. 50
Table 2 Ingredient and chemical composition of five starter diets with increasing levels of canola meal fed to ostrich chicks from 76 to 146 days old (as-fed basis)
Ingredients (kg/ton)
Diets expressed as percentage of soybean meal that was replaced by canola meal
0% 25% 50% 75% 100%
Yellow maize 572.16 529.12 486.08 443.04 400.00
Soybean meal, 44% crude protein
179.51 134.63 89.76 44.88 0.00
Canola meal, 34% crude protein
0.00 78.20 156.40 234.60 312.80
Lucerne meal, 17% crude protein
123.97 125.48 126.99 128.50 130.00
Molasses meal 38.14 38.61 39.07 39.54 40.00
Fat, animal 28.61 35.31 42.01 48.70 55.40
Limestone, ground 11.47 11.43 11.39 11.34 11.30
Monocalcium phosphate 21.47 21.40 21.34 21.27 21.20
Bentonite clay 9.54 9.66 9.77 9.89 10.00
Sodium chloride
9.54 9.66 9.77 9.89 10.00
Vitamin and mineral premix1
3.34 3.38 3.42 3.46 3.50
Lysine-HCl 2.26 2.10 1.93 1.77 1.60
Nutrient composition (laboratory analysis)
Dry matter (g/kg) 900.70 895.45 891.58 899.43 899.20
Metabolizable energy ostrich (MJ/kg feed)2 10.89 10.72 10.50 10.60 10.32
Crude fibre (g/kg) 78.13 80.05 90.73 93.53 116.78
Acid detergent fibre (g/kg) 110.05 113.30 122.45 134.05 170.53
Neutral detergent fibre (g/kg) 149.28 151.45 160.15 165.98 209.70
Calcium (g/kg) 12.15 12.20 14.55 15.45 17.35
Phosphorous (g/kg) 8.80 9.20 10.55 10.45 10.25
Amino acid composition (formulated)
Lysine (g/kg) 0.93 0.95 0.97 0.99 1.01
TSAA3 (g/kg) 0.70 0.71 0.73 0.74 0.76
Threonine (g/kg) 0.69 0.70 0.72 0.73 0.75
Tryptophan (g/kg) 0.19 0.20 0.20 0.20 0.21
Arginine (g/kg) 0.89 0.91 0.93 0.95 0.97
1 Vitamin A: 15 000 000 IU, Vitamin D3: 4 000 000 IU, Vitamin E: 60 000 mg, Vitamin K3: 3 000 mg, Vitamin B1: 5000 mg,
Vitamin B2: 10 000 mg. Vitamin B6: 8 000 mg, Vitamin B12: 100 mg, Niacin: 100 000 mg, Pantothenic acid: 15 000 mg, Folic acid: 3 000 mg, Biotin: 300 mg, Choline: 800 000 mg, Magnesium: 50 000 mg, Manganese: 120 000 mg, Iron: 30 000 mg, Zinc: 120 000 mg, Copper: 8 000 mg, Cobalt: 300 mg, Iodine: 2 000 mg, Selenium: 300 mg, Antioxidant: 125 000 mg; incorporated into the ration at 2.5 kg per ton. 2
ME ostrich = 6.35 + 0.645 × ME poultry (Gous & Brand, 2008); ME: metabolizable energy 3 TSAA: total sulphur-containing amino acids
Brand et al., 2020. S. Afr. J. Anim. Sci. vol. 50 541
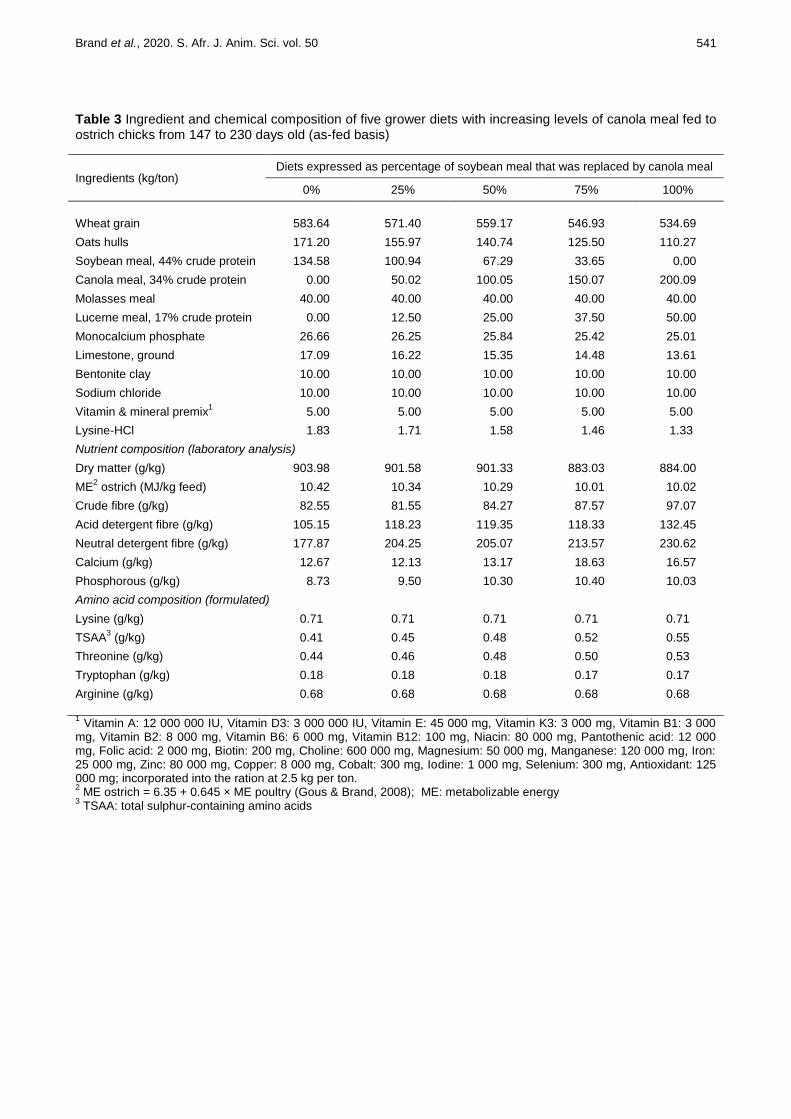
Table 3 Ingredient and chemical composition of five grower diets with increasing levels of canola meal fed to ostrich chicks from 147 to 230 days old (as-fed basis)
Ingredients (kg/ton) Diets expressed as percentage of soybean meal that was replaced by canola meal
0% 25% 50% 75% 100%
Wheat grain 583.64 571.40 559.17 546.93 534.69
Oats hulls 171.20 155.97 140.74 125.50 110.27
Soybean meal, 44% crude protein
134.58 100.94 67.29 33.65 0.00
Canola meal, 34% crude protein
0.00 50.02 100.05 150.07 200.09
Molasses meal 40.00 40.00 40.00 40.00 40.00
Lucerne meal, 17% crude protein
0.00 12.50 25.00 37.50 50.00
Monocalcium phosphate
26.66 26.25 25.84 25.42 25.01
Limestone, ground 17.09 16.22 15.35 14.48 13.61
Bentonite clay 10.00 10.00 10.00 10.00 10.00
Sodium chloride
10.00 10.00 10.00 10.00 10.00
Vitamin & mineral premix1
5.00 5.00 5.00 5.00 5.00
Lysine-HCl 1.83 1.71 1.58 1.46 1.33
Nutrient composition (laboratory analysis)
Dry matter (g/kg) 903.98 901.58 901.33 883.03 884.00
ME2 ostrich (MJ/kg feed) 10.42 10.34 10.29 10.01 10.02
Crude fibre (g/kg) 82.55 81.55 84.27 87.57 97.07
Acid detergent fibre (g/kg) 105.15 118.23 119.35 118.33 132.45
Neutral detergent fibre (g/kg) 177.87 204.25 205.07 213.57 230.62
Calcium (g/kg) 12.67 12.13 13.17 18.63 16.57
Phosphorous (g/kg) 8.73 9.50 10.30 10.40 10.03
Amino acid composition (formulated)
Lysine (g/kg) 0.71 0.71 0.71 0.71 0.71
TSAA3 (g/kg) 0.41 0.45 0.48 0.52 0.55
Threonine (g/kg) 0.44 0.46 0.48 0.50 0.53
Tryptophan (g/kg) 0.18 0.18 0.18 0.17 0.17
Arginine (g/kg) 0.68 0.68 0.68 0.68 0.68
1 Vitamin A: 12 000 000 IU, Vitamin D3: 3 000 000 IU, Vitamin E: 45 000 mg, Vitamin K3: 3 000 mg, Vitamin B1: 3 000
mg, Vitamin B2: 8 000 mg, Vitamin B6: 6 000 mg, Vitamin B12: 100 mg, Niacin: 80 000 mg, Pantothenic acid: 12 000 mg, Folic acid: 2 000 mg, Biotin: 200 mg, Choline: 600 000 mg, Magnesium: 50 000 mg, Manganese: 120 000 mg, Iron: 25 000 mg, Zinc: 80 000 mg, Copper: 8 000 mg, Cobalt: 300 mg, Iodine: 1 000 mg, Selenium: 300 mg, Antioxidant: 125 000 mg; incorporated into the ration at 2.5 kg per ton. 2 ME ostrich = 6.35 + 0.645 × ME poultry (Gous & Brand, 2008); ME: metabolizable energy
3 TSAA: total sulphur-containing amino acids

542 Brand et al., 2020. S. Afr. J. Anim. Sci. vol. 50
Table 4 Ingredient and chemical composition of five finisher diets with increasing levels of canola meal fed to ostrich chicks from 231 to 337 days old (as-fed basis)
Ingredients (kg/ton)
Diets expressed as percentage of soybean meal that was replaced by canola meal
0% 25% 50% 75% 100%
Wheat grain 463.82 447.44 431.07 414.69 398.31
Oats hulls 322.98 314.51 306.04 297.56 289.09
Soybean meal, 44% crude protein
104.86 78.65 52.43 26.22 0.00
Canola meal, 34% crude protein
0.00 49.84 99.69 149.53 199.37
Molasses meal 40.00 39.97 39.94 39.90 39.87
Lucerne meal, 17% crude protein
0.00 2.49 4.99 7.48 9.97
Monocalcium phosphate 27.04 26.63 26.21 25.80 25.38
Limestone, ground 16.80 16.25 15.69 15.14 14.58
Bentonite clay 10.00 9.99 9.99 9.98 9.97
Sodium chloride
10.00 9.99 9.99 9.98 9.97
Vitamin and mineral premix1
3.50 3.50 3.50 3.49 3.49
Lysine-HCl 1.01 0.76 0.51 0.25 0.00
Nutrient composition (laboratory analysis)
Dry matter (g/kg) 892.92 901.97 916.90 916.50 915.57
ME2 ostrich (MJ/kg feed) 10.08 10.35 10.40 10.31 10.35
Crude fibre (g/kg) 98.47 104.52 112.78 119.52 125.50
Acid detergent fibre (g/kg) 129.27 136.88 153.92 162.87 178.30
Neutral detergent fibre (g/kg) 240.82 251.82 262.67 281.15 288.32
Calcium (g/kg) 14.57 13.07 13.30 13.47 13.50
Phosphorous (g/kg) 9.13 9.63 10.10 10.13 9.93
Amino acid composition (formulated)
Lysine (g/kg) 0.55 0.55 0.55 0.55 0.55
TSAA3 (g/kg) 0.35 0.39 0.43 0.47 0.50
Threonine (g/kg) 0.37 0.40 0.42 0.45 0.48
Tryptophan (g/kg) 0.16 0.16 0.16 0.16 0.16
Arginine (g/kg) 0.56 0.58 0.59 0.61 0.62
1 Vitamin A: 8 000 000 IU, Vitamin D3: 2 000 000 IU, Vitamin E: 40 000 mg, Vitamin K3: 2 000 mg, Vitamin B1: 2 000
mg, Vitamin B2: 5 000 mg, Vitamin B6: 4 000 mg, Vitamin B12: 50 mg, Niacin: 60 000 mg, Pantothenic acid: 12 000 mg, Folic acid: 1 500 mg, Biotin: 100 mg, Choline: 300 000 mg, Magnesium: 50 000 mg, Manganese: 100 000 mg, Iron: 40 000 mg, Zinc: 100 000 mg, Copper: 10 000 mg, Cobalt: 500 mg, Iodine: 2000 mg, Selenium: 300 mg, Antioxidant: 125 000 mg; incorporated into the ration at 2.5 kg per ton. 2 ME ostrich = 6.35 + 0.645 × ME poultry (Gous & Brand, 2008) ME: metabolizable energy
3 TSAA: total sulphur-containing amino acids

Brand et al., 2020. S. Afr. J. Anim. Sci. vol. 50 543
Table 5 Glucosinolate content (as-is basis) of treatment diets in which soybean meal was gradually replaced by canola meal
Glucosinolate compound (µmol/g feed) Percentage of soybean meal that was replaced by canola
0% 25% 50% 75% 100%
Starter diet (CM inclusion levels) 0% 7.8% 15.6% 23.5% 31.2%
Progoitrin 0.00 0.11 0.21 0.32 0.43
Sinigrin 0.00 0.00 0.01 0.01 0.01
Glucobrassicin 0.00 0.03 0.06 0.09 0.12
Gluconapin 0.00 0.09 0.18 0.27 0.36
4-hydroxyglucobrassicin 0.00 0.28 0.55 0.83 1.11
Epiprogoitrin 0.00 0.19 0.37 0.56 0.74
Gluconapoleiferin 0.00 0.01 0.02 0.03 0.04
Glucobrassicanapin 0.00 0.10 0.20 0.31 0.41
Gluconasturtin 0.00 0.01 0.02 0.03 0.04
Total (µmol/g) 0.00 0.81 1.63 2.44 3.26
Grower diet (CM inclusion levels) 0% 5% 10% 15% 20%
Progoitrin 0.00 0.07 0.14 0.20 0.27
Sinigrin 0.00 0.00 0.00 0.01 0.01
Glucobrassicin 0.00 0.02 0.04 0.06 0.07
Gluconapin 0.00 0.06 0.11 0.17 0.23
4-hydroxyglucobrassicin 0.00 0.18 0.35 0.53 0.71
Epiprogoitrin 0.00 0.12 0.24 0.36 0.48
Gluconapoleiferin 0.00 0.01 0.01 0.02 0.03
Glucobrassicanapin 0.00 0.07 0.13 0.20 0.26
Gluconasturtin 0.00 0.01 0.01 0.02 0.03
Total (µmol/g) 0.00 0.52 1.04 1.56 2.08
Finisher diet (CM inclusion levels) 0% 5% 10% 15% 20%
Progoitrin 0.00 0.07 0.14 0.20 0.27
Sinigrin 0.00 0.00 0.00 0.01 0.01
Glucobrassicin 0.00 0.02 0.04 0.06 0.07
Gluconapin 0.00 0.06 0.11 0.17 0.23
4-hydroxyglucobrassicin 0.00 0.18 0.35 0.53 0.71
Epiprogoitrin 0.00 0.12 0.24 0.36 0.47
Gluconapoleiferin 0.00 0.01 0.01 0.02 0.03
Glucobrassicanapin 0.00 0.07 0.13 0.20 0.26
Gluconasturtin 0.00 0.01 0.01 0.02 0.03
Total (µmol/g) 0.00 0.52 1.04 1.56 2.08
CM: canola meal
With the onset of the starter phase, the chicks were moved to fifteen larger pens (25 x 6 m) at 77 days
old. At this point, the trial began, and the birds received their starter diets (Table 2). During the starter phase, the birds, feed, and orts were weighed each week to determine growth and feed intake. The chicks entered the grower phase at 147 days old and were given the grower trial diets (Table 3). During this phase, the groups were moved to larger camps (40 x 30 m) to allow for growth and reduce the risk of skin damage. Owing to the risk of injuries to the birds and the handlers, each bird and the orts were weighed every three weeks. The finisher diets (Table 4) were fed from 231 days old until slaughter. Before the ostriches were slaughtered at 337 days old, the fifteen experimental groups were sorted into the five treatment groups and

544 Brand et al., 2020. S. Afr. J. Anim. Sci. vol. 50
relocated to five large quarantine camps for 27 days as obligated by European Union (EU) meat quality standards (DAFF, 2017). During quarantine, the birds were treated for possible external parasites, and blood samples were collected to test for avian influenza (AI). The birds tested negative for AI and could thus be taken to the abattoir for slaughter. One day prior to slaughter, the birds were moved according to protocol to Klein Karoo International Abattoir, where they were kept in lairage. They received no feed but had ad libitum access to fresh water.
Procedures for slaughter were similar to those described in Hoffman (2012). The birds were stunned electrically and exsanguinated and the weights of the dead birds were recorded. This bled weight was taken as the slaughter weight. After the birds had been exsanguinated, the feathers were plucked by hand and placed in marked bags. The carcasses were then skinned. Each skin was marked and sent for tanning to Klein Karoo International Tannery. After evisceration, the abdominal fat (fat pad) was removed and weighed. The weights of the liver and thyroid glands were recorded to determine whether the diets (specifically their glucosinolate content) had influenced the development and function of these organs. The carcasses were then chilled overnight in a cold room at 0 - 2 °C. The cold carcass weight was obtained the next morning (± 24 hours post-mortem) before deboning. These weights were used to calculate the dressing percentage by dividing the cold carcass weight by the bled-out weight, multiplied by 100. The pH of the Muscularis gastrocnemius was measured prior to deboning. The right thigh of each bird was weighed to obtain the contribution of the thighs to the whole carcass. It was assumed that the weight of the right thigh would be the same as that of the left thigh.
SAS enterprise guide (version 9.4, SAS Institute Inc., Cary, North Carolina, USA) was used to analyse the production and slaughter data statistically. The general linear model procedure was used to test for significant differences between the treatments at P ≤0.05 level. Detailed treatment differences were investigated with Fisher’s least significant difference t-test. In the analyses, camps were considered the experimental units and thus were the random replicates of the dietary treatments. The production traits of the birds were analysed in each of the phases and over the entire production period. The end weight of the previous feeding phase was taken as a covariate, starting weight, for the traits that were analysed in the next phase. Regression models were fitted to the data to describe the trends shown for each production trait in response to the level of CM in the diet. The growth curves for ostriches on each of the trial diets were developed by applying the nonlinear Gompertz function:
Where: W represents the weight of the ostrich at time, t represents the asymptotic mature weight, b sets the displacement along the age-axis, c sets the growth rate, and e is Euler’s number (2.71828...). A one-way analysis of variance (ANOVA) was used to test for differences in the parameter estimates
between the treatments.
Results The overall mortality rate of ostriches in this trial was 14.8%. Most of these mortalities (11.3%)
occurred during the starter phase. Post-mortem analyses indicated that the main cause of deaths in this phase was prolapses owing to the ingestion of sticks and gravel. The mortalities in the grower phase (2.5%) were also caused by gravel in the stomach and leg injuries. In the finisher phase, a mortality rate of 1% was observed as a result of ostriches injuring themselves in the fencing. The mortalities occurred across treatments, so it was determined that they were not the result of the treatments. Mortality rates were well below the industry norm of 40% (Brand, 2016).
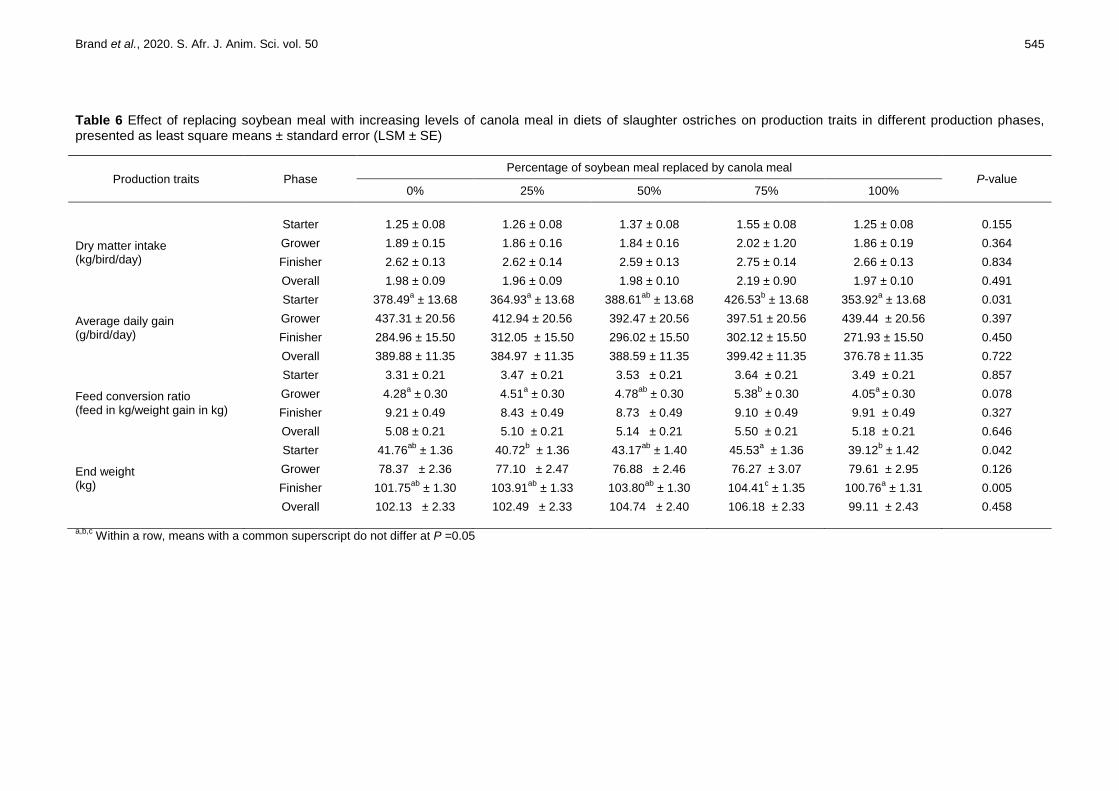
The production traits of ostriches that were reared on diets in which CM replaced SBM incrementally as the primary source of protein are given in Table 6. The starting weight of each phase was used as a covariate to adjust statistically for any differences between treatments in the initial weight for each phase. The average starting weights of the birds on the starter, grower and finisher diets were 4.53 kg, 42.06 kg and 77.65 kg, respectively. Dry matter intake (DMI) did not vary between the diets in each of the feeding phases or over the entire rearing period (P >0.05). The DMI averages during the starter, grower and finisher phases were 1.34, 1.89 and 2.65 kg/bird/day, respectively, with the overall average DMI being 2.02 kg/bird/day. Differences were observed for the ADG of ostriches in the starter phase, with birds on the 75% CM diet (0.43 kg/bird/day) exhibiting higher growth rates (P =0.031) than birds on the 0% (0.38 kg/bird/day), 25% (0.36
Brand et al., 2020. S. Afr. J. Anim. Sci. vol. 50 545
Table 6 Effect of replacing soybean meal with increasing levels of canola meal in diets of slaughter ostriches on production traits in different production phases, presented as least square means ± standard error (LSM ± SE)
Production traits Phase Percentage of soybean meal replaced by canola meal
P-value 0% 25% 50% 75% 100%
Dry matter intake (kg/bird/day)
Starter 1.25 ± 0.08 1.26 ± 0.08 1.37 ± 0.08 1.55 ± 0.08 1.25 ± 0.08 0.155
Grower 1.89 ± 0.15 1.86 ± 0.16 1.84 ± 0.16 2.02 ± 1.20 1.86 ± 0.19 0.364
Finisher 2.62 ± 0.13 2.62 ± 0.14 2.59 ± 0.13 2.75 ± 0.14 2.66 ± 0.13 0.834
Overall 1.98 ± 0.09 1.96 ± 0.09 1.98 ± 0.10 2.19 ± 0.90 1.97 ± 0.10 0.491
Average daily gain (g/bird/day)
Starter 378.49a ± 13.68 364.93
a ± 13.68 388.61
ab ± 13.68 426.53
b ± 13.68 353.92
a ± 13.68 0.031
Grower 437.31 ± 20.56 412.94 ± 20.56 392.47 ± 20.56 397.51 ± 20.56 439.44 ± 20.56 0.397
Finisher 284.96 ± 15.50 312.05 ± 15.50 296.02 ± 15.50 302.12 ± 15.50 271.93 ± 15.50 0.450
Overall 389.88 ± 11.35 384.97 ± 11.35 388.59 ± 11.35 399.42 ± 11.35 376.78 ± 11.35 0.722
Feed conversion ratio (feed in kg/weight gain in kg)
Starter 3.31 ± 0.21 3.47 ± 0.21 3.53 ± 0.21 3.64 ± 0.21 3.49 ± 0.21 0.857
Grower 4.28a ± 0.30 4.51
a ± 0.30 4.78
ab ± 0.30 5.38
b ± 0.30 4.05
a ± 0.30
0.078
Finisher 9.21 ± 0.49 8.43 ± 0.49 8.73 ± 0.49 9.10 ± 0.49 9.91 ± 0.49 0.327
Overall 5.08 ± 0.21 5.10 ± 0.21 5.14 ± 0.21 5.50 ± 0.21 5.18 ± 0.21 0.646
End weight (kg)
Starter 41.76ab
± 1.36 40.72b ± 1.36 43.17
ab ± 1.40 45.53
a ± 1.36 39.12
b ± 1.42 0.042
Grower 78.37 ± 2.36 77.10 ± 2.47 76.88 ± 2.46 76.27 ± 3.07 79.61 ± 2.95 0.126
Finisher 101.75ab
± 1.30 103.91ab
± 1.33 103.80ab
± 1.30 104.41c ± 1.35 100.76
a ± 1.31 0.005
Overall 102.13 ± 2.33 102.49 ± 2.33 104.74 ± 2.40 106.18 ± 2.33 99.11 ± 2.43 0.458
a,b,c
Within a row, means with a common superscript do not differ at P =0.05

546 Brand et al., 2020. S. Afr. J. Anim. Sci. vol. 50
kg/bird/day) and 100% CM (0.35 kg/bird/day) diets, which did not differ (P >0.05). The ADG in the other phases did not differ between the diets, with average ADG for the grower phase being 0.41 ± 0.02 kg/bird/day. For the finisher phase it was 0.29 ± 0.02 kg/bird/day.
The feed conversion ratio of grower ostriches (5.38 ± 0.30) was highest for the diet with 15% CM and 33.7% SBM (75% replacement diet). It did not differ from the diet with 10% CM inclusion (50% replacement of SBM) (4.78 ± 0.30), but differed from the diets that had CM inclusion levels of 0% (4.28 ± 0.30), 25% (4.51 ± 0.30), and 100% (4.05 ± 0.30).
Differences in end weights were observed during the starter and finisher phases. The starter phase had the highest end weight in birds that were reared on the 75% CM diet (45.53 ± 1.36 kg for the starter phase and 104.41 ± 1.35 kg for the finisher phase) and the lowest end weight in birds that received the diet with 100% CM inclusion (39.12 ± 1.42 kg for the starter phase and 100.76 ± 1.31 kg for the finisher phase). The average end weight for the grower phase was 77.65 ± 2.66 kg.
To describe possible trends with increasing levels of CM replacing SBM in the diets of ostriches, the production traits were analysed by fitting the most appropriate regression models to the data during the three growth phases (Table 7).
Table 7 Regression models fitted to data of production traits of slaughter ostriches describing trends
because of change in canola meal inclusion in the diets in each production phase and the overall period (x = canola meal as percentage of total protein source in the diet)
Production traits (y) Phase Equation R2
P value
Dry matter intake (g/bird/day)
Starter 0.4997 NS1
Grower y = 0.0004x + 1.8756 0.2400 NS1
Finisher y = 0.0008x + 2.6068 0.0299 NS1
Average daily gain (g/bird/day)
Starter 0.5951 0.016
Grower 0.0020 NS1
Finisher y = -0.0001x + 0.3006 0.0385 NS1
Feed conversion ratio (feed in g/weight gain in g)
Starter y = 0.0022x + 3.3788 0.0572 NS1
Grower 0.5053 0.045
Finisher y = 0.0083x + 8.6642 0.1182 NS1
End weight (kg)
Starter 0.5984 0.042
Grower 0.3559 NS1
Finisher 0.7866 NS1
1 Not significant (P >0.05)
For dry matter intake, the P values of the models in each feeding phase were non-significant, with low
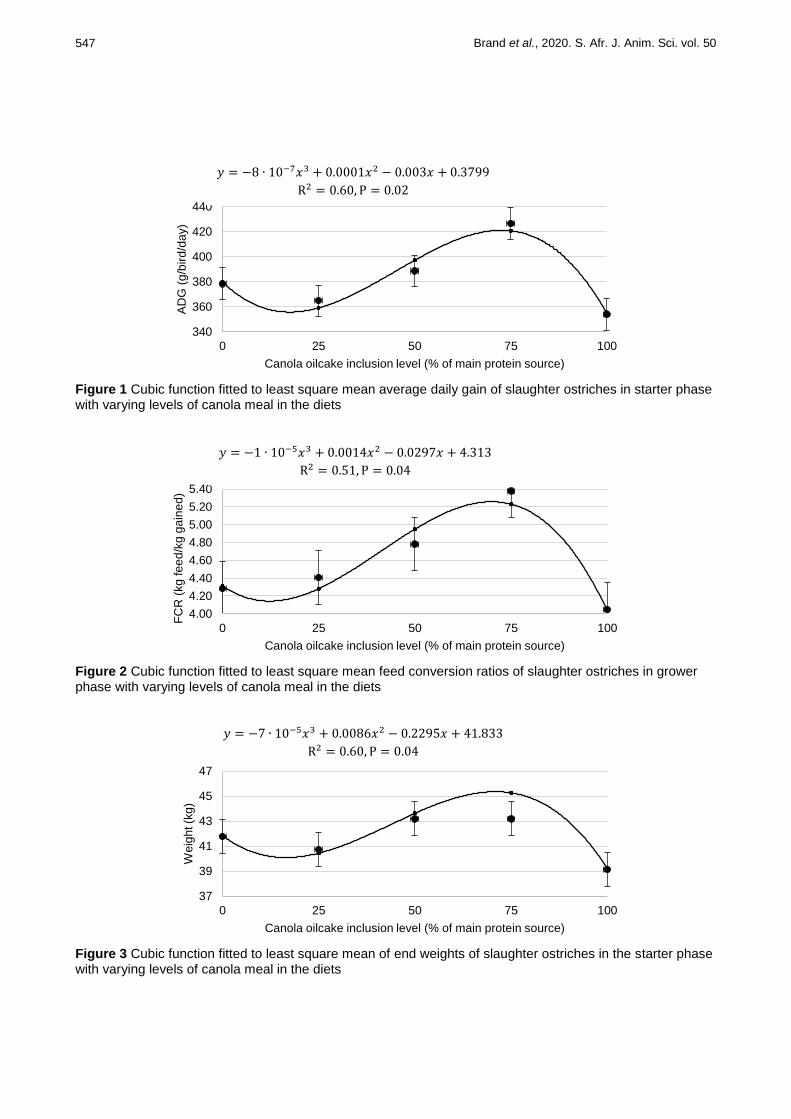
R2 values being obtained (<0.50) (Table 7). Figure 1 depicts a cubic regression fitted between the ADG and
the CM inclusion level during the starter phase, describing 59.5% of the variation among the data (P =0.016). The trend shows a slight decrease in ADG as the CM inclusion level increased from 0% to 7.8%. With the rise in CM levels, the ADG increased to reach the highest ADG for the diet with 23.5% CM inclusion. This diet differs from all the others, except that with 15.6% CM inclusion. There is a sharp decrease in ADG from the 23.5% CM diet to the 31.3% CM diet, where the ADG was lowest at 0.35 ± 0.01 kg/bird/day. Figure 2 shows that a similar cubic regression trend (R
2 = 50.5%) could be drawn between FCR and the inclusion
level of CM in the grower phase (P =0.045). As the CM level increased from 0% to 5%, there was a slight decrease in FCR, after which FCR increased until it reached its peak at 15% CM inclusion. Again, the FCR of this diet differed from all the other diets, except those in which 50% CM replaced SBM. A sharp decrease in FCR was observed when the CM level increased from 75% to its maximum of 100%. The weights of each diet at the end of the starter phase fitted a similar cubic regression (Figure 3), which described 59.8% of the variation in the data (P =0.042). Similar to the regression of these figures, the trend decreased slightly with the increase of CM from 0% to 7.8%, after which the weights increased to reach their maximum at the 23.5% CM inclusion. There was a sharp decrease in end weight when the CM inclusion level increased from 23.5% to 31.3%.
547 Brand et al., 2020. S. Afr. J. Anim. Sci. vol. 50
Figure 1 Cubic function fitted to least square mean average daily gain of slaughter ostriches in starter phase with varying levels of canola meal in the diets
Figure 2 Cubic function fitted to least square mean feed conversion ratios of slaughter ostriches in grower phase with varying levels of canola meal in the diets
Figure 3 Cubic function fitted to least square mean of end weights of slaughter ostriches in the starter phase with varying levels of canola meal in the diets
340
360
380
400
420
440
0 25 50 75 100
AD
G (
g/b
ird
/da
y)
Canola oilcake inclusion level (% of main protein source)
4.00
4.20
4.40
4.60
4.80
5.00
5.20
5.40
0 25 50 75 100
FC
R (
kg
fe
ed
/kg
ga
ine
d)
Canola oilcake inclusion level (% of main protein source)
37
39
41
43
45
47
0 25 50 75 100
Weig
ht (k
g)
Canola oilcake inclusion level (% of main protein source)
𝑦 𝑥 𝑥 𝑥
R , P
𝑦 𝑥 𝑥 𝑥
R , P
𝑦 𝑥 𝑥 𝑥
R , P

548 Brand et al., 2020. S. Afr. J. Anim. Sci. vol. 50
The sigmoidal Gompertz growth curves from hatching to slaughter, as presented in Figure 4, explain 94% of the variation in the growth data (Table 8). No differences (P ≥0.05) were observed between diets among the parameters.
Figure 4 Gompertz growth curves fitted to mean bodyweights (kg) of slaughter ostriches that consumed diets with varying levels of canola meal over the growth period from 0 to 337 days old Table 8 Estimates of parameters of the Gompertz growth curve (± SE) of slaughter ostriches fed diets with varying levels of canola meal replacing soybean meal as the primary source of protein
Parameter Diets expressed as percentage canola meal in the experimental diets
0% 25% 50% 75% 100% P-value
a 119.32 ± 3.60 125.21 ± 3.60 121.89 ± 3.60 119.97 ± 3.60 116.30 ± 3.60 0.531
b 0.01 ± 0.0007 0.01 ± 0.0007 0.01 ± 0.0007 0.01 ± 0.0007 0.01 ± 0.0007 0.605
c 145.79 ± 4.39 155.23 ± 4.39 146.60 ± 4.39 141.01 ± 4.39 147.23 ± 4.39 0.313
R2
0.936 0.940 0.951 0.938 0.944 -
a = mature weight (kg) b = maturing rate (growth coefficient) c = age at maximum growth (days)
Differences (P <0.05) were observed in slaughter weights, with the heaviest birds being reared on the
50% CM (93.60 ± 2.00) diet and the lightest birds on the diet with 100% (83.38 ± 2.00) CM. No differences (P >0.05) between diets were observed for the weight of the abdominal fat pad, warm and cold carcass weights, dressing percentage, and weights of the right thigh and Muscularis gastrocnemius.
The smallest liver weight (1.26 ± 0.04 kg) was observed for the 100% CM diet and the heaviest for the 25% diet (1.61 ± 0.04 kg). The liver weights for the rest of the diets did not differ. The lightest thyroid gland weight was measured in the diet with 75% CM replacement (36.48 ± 2.92 g), which did not differ from that with 100% CM inclusion (39.05 ± 2.92 g), but differed from the rest of the diets (0%: 44.86 ± 2.92 g, 25%: 58.57 ± 2.92 g, and 50%: 49.50 ± 2.92 g) (Table 9).
0
20
40
60
80
100
0 50 100 150 200 250 300
Bir
d M
ass (
kg
)
Age (Days)
0 25 50 75 100

Brand et al., 2020. S. Afr. J. Anim. Sci. vol. 50 549
Table 9 Least squares means (± SE) for carcass traits of ostriches fed diets in which increasing amounts of canola meal replaced soybean meal when they were slaughtered at 337 days old
Trait Diets expressed as percentage canola meal (CM) replacing soybean meal in the experimental diets
P-value 0% 25% 50% 75% 100%
Slaughter weight1 (kg) 91.30
a ± 2.00 90.36
a ± 2.00 93.60
a ± 2.00 89.01
ab ± 2.00 83.38
b ± 2.00 0.045
Abdominal fat pad weight (kg) 5.36 ± 0.37 5.66 ± 0.37 5.88 ± 0.37 4.88 ± 0.37 4.40 ± 0.37 0.101
Liver weight (kg) 1.40b ± 0.04 1.61
a ± 0.04 1.42
b ± 0.04 1.34
bc ± 0.04 1.26
c ± 0.04 0.0007
Thyroid gland weight (g) 44.86bc
± 2.92 58.57a ± 2.92 49.20
b ± 2.92 36.48
c ± 2.92 39.05
c ± 2.92 0.0024
Warm carcass weight3 (kg) 45.51 ± 1.14 45.97 ± 1.14 46.43 ± 1.14 45.27 ± 1.14 42.27 ± 1.14 0.161
Cold carcass weight (kg) 44.60 ± 1.11 44.82 ± 1.11 45.39 ± 1.11 44.30 ± 1.11 41.31 ± 1.11 0.156
Dressing percentage (%) 51.80 ± 0.39 51.99 ± 0.39 51.43 ± 0.39 52.47 ± 0.39 52.53 ± 0.39 0.309
Right thigh weight (kg) 16.51 ± 0.41 16.59 ± 0.41 16.76 ± 0.41 16.39 ± 0.41 15.24 ± 0.41 0.137
Muscularis gastrocnemius weight (kg) 1.14 ± 0.03 1.16 ± 0.03 1.14 ± 0.03 1.12 ± 0.03 1.03 ± 0.03 0.069
Muscularis gastrocnemius contribution to right thigh weight (%)
6.88 ± 0.08 6.96 ± 0.08 6.75 ± 0.08 6.82 ± 0.08 6.76 ± 0.08 0.342
Cold carcass pH 5.72a ± 0.03 5.57
b ± 0.03 5.62
b ± 0.03 5.61
b ± 0.03 5.65
ab ± 0.03 0.028
a,b,c
Within a row, means with a common superscript do not differ at P =0.05 1 Bled out weight, feathers and skin still attached
3 Bled out weight, feathers removed, but skin still attached, just before evisceration

550 Brand et al., 2020. S. Afr. J. Anim. Sci. vol. 50
Discussion Ostrich rearing is one of the smallest and youngest commercial agricultural animal industries in South
Africa. Therefore knowledge of ostrich nutrition is limited. Alternative dietary ingredients need to be investigated to determine their influence on growth and production. The biggest challenge that livestock producers face lies in reducing expenses to maximize profit margins (Al-Harthi & Attia, 2016; Al-Harthi et al., 2018). This is also the reason for identifying and investigating alternative raw materials that can be used in livestock diets. Although SBM is currently the most common source of protein in feeding ostriches, CM is high in protein and currently costs less per ton. Canola meal is also available locally, whereas large
quantities of SBM need to be imported (De Kock & Agenbag, 2009; DAFF, 2016b; Nega & Woldes, 2018).
One concern in using CM as raw material in animal feeds is its glucosinolate content. Glucosinolates are anti-nutrients that cause feed to be unpalatable. These anti-nutrients are concentrated in CM after the extraction of oil from the seeds (Zeb, 1998). In the current study, the highest glucosinolate concentration was found in the starter diet when the SBM was replaced completely with CM. However, this had no clear effect, because no differences were detected in DMI and no significant trends were observed. Growth rate and end weight of the birds in the starter phase that received the 100% replacement diet were lower than those that were recorded for the other treatments. However, these values did not differ from those of the 0% replacement diet. This suggests that the levels of anti-nutrients in the 100% replacement diet are below the critical level that would affect the feed intake and production of the ostriches negatively. The results obtained in a previous study in which SBM was replaced with full-fat canola showed that the diet with the highest glucosinolate content (2.156 µmol/g) did not influence the DMI, ADG, FCR, or end weight of the ostriches (Niemann et al., 2018). In the current study, an even higher level of glucosinolates (3.26 µmol/g of feed in the 100% CM diet) did not affect DMI either. Quinsac et al. (1994) found that a higher glucosinolate content of15.8 µmol/g, that is, a level 4.8 times the highest level in the current study, did not have a detrimental effect on the feed intake of broilers.
Studies based on ostrich nutrition have revealed that, like all other animals, ostriches eat according to their nutritional requirements, especially the energy content of the feed (Bozinovic & Del Rio, 1996; Niknafs & Roura, 2018). All diets in this study were formulated to have similar energy levels so that the dietary intake of the birds was not influenced.
Most of the differences in production traits occurred in the starter phase. Birds that received the diet with 75% CM had the highest ADG and end weights, and the ostriches that received the diet with 100% CM had the lowest ADG and end weights. Although no significant differences were observed in the DMI between the diets, the higher ADG of the 75% CM replacement diet was probably because of the higher DMI of this diet.
The starter phase could be considered an adaptation phase. The chicks were used to the pre-starter diet, which contained only a small amount (5%) of CM, which was too small to affect the taste of the feed. Thus, during the starter phase the birds adapted to diets containing less SBM and more CM, which tasted different from the pre-starter diet.
In the grower phase, differences were observed between diets in FCR, but not in DMI or ADG. Likewise, the performances of the birds in the finisher phase were similar across diets. Thus, the birds that were subjected to the treatments adapted to their diets despite the inclusion levels of CM. Minimal differences between traits were observed in the overall performance levels. Nonetheless, the diet with 75% CM showed the highest DMI, ADG, FCR and end weights. The Gompertz growth curve showed that the birds in all groups grew according to similar sigmoidal patterns, with no differences in the model parameters being observed. It was previously reported that feed with a glucosinolate concentration above 8.0 µmol/g of feed would result in growth depression in broilers (Tripathi & Mishra, 2007). In the current study, the 100% CM diet of the starter phase had the highest glucosinolate concentration of 3.26 µmol/g of feed. Thus, the current ration with 100% CM is well below the threshold that produced an effect in chickens. The critical threshold for glucosinolate concentration in diets for ostriches has not yet been reached. Therefore, the CM inclusion levels in the diets in the present study were below that threshold.
The inclusion of CM in the diets had little effect on the slaughter yields and traits of ostriches. Because slaughter traits are influenced directly by the production traits, these slight differences were expected. The birds on the control diet were heaviest at slaughter. The birds that received the diet with 100% CM were lightest, and had the lowest ADG and end weight. The various carcass yields (dressing percentage, thigh and Muscularis gastrocnemius weights) did not differ between the diets.
The 25% CM diet produced the highest weights of liver and thyroid. Ibrahim and Hill (1980), Butler et al. (1982), Opalka et al. (2001), and Maroufyan and Kermanshahi (2006) indicated that chickens and pigs that were reared on canola meal and rapeseed meal with high levels of glucosinolates showed enlargement of the liver and thyroid. However, Roth-Maier et al. (2004) noted that various levels of canola meal in the diets of pigs had no influence on the weight of the thyroid.

Brand et al., 2020. S. Afr. J. Anim. Sci. vol. 50 551
Conclusion Canola meal can be used as a replacement for SBM in the diets of ostriches. Overall, CM inclusion
levels that are lower than 20% in the starter, grower and finisher diets of ostriches are not expected to affect production negatively. However, further research is warranted to evaluate the influence of CM inclusion in the diets on the quality of end products of the slaughter ostriches.
Acknowledgements
Acknowledgements are made to the Western Cape Department of Agriculture for use of the facilities on Oudtshoorn Research Farm and to their personnel for their aid. In addition, the Western Cape Agricultural Research Trust and the Protein Research Foundation are thanked for the joint funding of the study. Finally, Klein Karoo International abattoir in Oudtshoorn in thanked for their willingness to accommodate the needs of the authors during the slaughter process and subsequent data collection.
Authors’ Contributions
TSB contributed to concept and design; JVDM was involved in data collection and analysis and drafting the paper; LCH provided critical revision and final approval of the version to be published
Conflict of Interest Declaration
The authors certify that they have no affiliations with or involvement in any organization or entity with any financial interest, or non-financial interest in the subject matter or materials discussed in this article. References
AFMA, 2017. Animal Feed Manufacturers Association: Chairman’s Report 2016/2017. AFMA’s 70th Annual General Meeting, Limpopo, South Africa.
AgriLASA, 1998. Method 6.1.1: dry ashing In: D. Palic (ed). Handbook of feeds and plant analysis.. Hatfield, Pretoria, South Africa.
Al-Harthi, A.A. & Attia, Y.A., 2016. Effect of citric acid on the nutritive value of olive cake in broiler diets. Europ. Poult. Sci. 80, 1-14.
Al-Harthi, M.A., Attia, Y.A., Al-Sagan, A.A. & Elgandy, M.F., 2018. Nutrients profile, protein quality and energy value of whole Prosopis pods meal as a feedstuff for poultry feeding. Ital. J Anim. Sci. 18, 30-38.
AOAC, 2012. Official methods of analysis. In: G.W. Latimer, Jr. (ed). 19th edition. Association of Official Analytical Chemists, Inc.. Arlington, Virginia, USA.
Bozinovic, F. & Del Rio, C.M., 1996. Animals eat what they should not: Why do they reject our foraging models? Rev. Chil. Hist. Nat. 69, 15-20.
Brand, T.S., 2016. Ostrich nutrition guidelines. In: P. Jorgensen. (ed). Ostrich manual. Western Cape Department of Agriculture, Oudtshoorn, South Africa. pp. 13-23.
Brand, T.S. & Jordaan, J.W., 2011. The contribution of the South African ostrich industry to the national economy. Appl. Anim. Husb. Rural Dev. 4, 1-7.
Brand, T.S., Brandt, D.A. & Cruywagen, C.W., 2004. Chemical composition, true metabolisable energy content and amino acid availability of grain legumes for poultry. S. Afr. J. Anim. Sci. 34, 116-122.
Brand. T.S., Engelbrecht, J.A., Van der Merwe, J. & Hoffman, L.C., 2018. Feed preference of grower ostriches consuming diets differing in Lupinus angustifolius inclusion levels. S. Afr. J. Anim. Sci. 48, 170-185.
Brand, T.S., De Brabander, L., Van Schalkwyk, S.J., Pfister, B. & Hayes, J.P., 2000a. The true metabolisable energy content of canola oilcake meal and full-fat canola seed for ostriches (Struthio camelus). Br. Poult. Sci. 41, 201-203.
Butler, E.J., Pearson, A.W. & Fenwick, G.R., 1982. Problems which limit the use of rapeseed meal as a protein source in poultry diets. J. Sci. Food Agric. 33, 866-875.
Carstens, P.D., 2013. Studies to develop a mathematical optimisation model to describe the effect of nutrition on the growth of ostriches (Struthio camelus var. domesticus). M.Sc. (Agric) thesis, Stellenbosch University, South
Africa. Code of Conduct for the Commercial Production of Ostriches, 2011. South African Ostrich Business Chamber,
Oudtshoorn, South Africa, DAFF, 2016. A profile of the South African canola market chain value.
https://www.nda.agric.za/doaDev/sideMenu/Marketing/Annual%20Publications/Commodity%20Profiles/field%20crops/Canola%20Market%20Value%20Chain%20Profile%202016.pdf
DAFF, 2017. A profile of the South African ostrich market value chain. https://www.nda.agric.za/doaDev/sideMenu/Marketing/Annual%20Publications/Commodity%20Profiles/Ostrich%20Market%20Value%20Chain%20Profile%202017.pdf. pp. 1-35
Dalle Zotte, A., Brand, T.S., Hoffman, L.C., Schoon, K., Cullere, M., & Swart, R., 2013. Effect of cottonseed oilcake inclusion on ostrich growth performance and meat chemical composition. Meat Sci. 93, 194-200.
De Kock, J. & Agenbag, G.A., 2009. Overview: Canola in South Africa. Protein Research Foundation pamphlet, pp. 1-9. Goering, H.K. & Van Soest, P.J., 1970. Forage fibre analyses (apparatus, reagents, procedures, and some applications).
In: Agriculture Handbook No. 379. US Department of Agriculture, Washington. Gous, R.M. & Brand, T.S., 2008. Simulation models used for determining food intake and growth of ostriches: an

552 Brand et al., 2020. S. Afr. J. Anim. Sci. vol. 50
overview. Aust. J. Exp. Agric. 48, 1266-1269. Hoffman, L.C., 2012. Advances in the electrical stunning and bleeding of ostriches. Anim. Welf. 21, 9-13. Ibrahim, I.K. & Hill, R., 1980. The effects of rapeseed meals from brassica napus varieties and the variety tower on the
production and health of laying fowl. Br. Poult. Sci. 21, 422-430. Maroufyan, E. & Kermanshahi, H., 2006. Effect of different levels of rapeseed meal supplemented with calcium iodate on
performance, some carcass traits, and thyroid hormones of broiler chickens. Int. J. Poult. Sci. 5, 1073-1078. NAMC, 2010. The South African Ostrich Value Chain: Opportunities for black participation and development of a
programme to link farmers to markets. https://www.namc.co.za/wp-content/uploads/2017/09/Ostrich-Value-Chain-Report.pdf
Nega, T. & Woldes, Y. 2018. Review on nutritional limitations and opportunities of using rapeseed meal and other rape seed by-products in animal feeding. J. Nutr. Heal. Food Eng. 8, 43-48.
Newkirk, R., 2009. Canola meal: Feed industry guide. 4th ed. Canadian International Grains Institute, Winnipeg, Manitoba.
Niemann, G.J., Brand, T.S. & Hoffman, L.C., 2018. Production and slaughter performance of ostriches fed full-fat canola seed. S. Afr. J. Anim. Sci. 48, 779-997.
Niknafs, S. & Roura, E., 2018. Nutrient sensing, taste and feed intake in avian species. Nutr. Res. Rev. 31, 256-266. Opalka, M., Dusza, L., Koziorowski, M., Staszkiewicz, J., Lipiñski, K. & Tywoñczuk, J., 2001. Effect of long-term feeding
with graded levels of low glucosinolate rapeseed meal on endocrine status of gilts and their piglets. Livest. Prod. Sci. 69, 233-243.
Quinsac, A., Lessire, M., Krouti, M., Ribaillier, D., Coïc, J. P., Fauduet, H. & Rollin, P., 1994. Improvement in the nutritive value of high and low glucosinolate rapeseed meal by aqueous extraction. Anim. Feed Sci. Technol. 48, 265-272.
Roth-Maier, D.A., Böhmer, B.M. & Roth, F. X., 2004. Effects of feeding canola meal and sweet lupin (L. luteus, L. angustifolius) in amino acid balanced diets on growth performance and carcass characteristics of growing-finishing pigs. Anim. Res. 53, 21-34.
Sihlobo, W. & Kapuya, T., 2016. South Africa’s soybean industry: A brief overview. Grain SA, 72-75. Smit, D.J.v.Z., 1964. Volstruisboerdery in die Klein-Karoo. Department of Agricultural Technical Services, Bulletin No
358,V en R Drukkers, Pretoria, South Africa. pp. 2-12 (in Afrikaans). Snyman, N., 2016. A new approach to handeling anti-nutritional factors: Soya bean meal as principal source of protein.
In: AFMA Matrix, Plaas, Centurion, Pretoria. pp. 30-31. Tripathi M.K. & Mishra A.S., 2007. Glucosinolates in animal nutrition: A review. Anim. Feed Sci. Tech. 132, 1-27. Van der Merwe, J., 2019. The evaluation of locally produced canola oilcake meal as an alternative protein source in the
diets of slaughter ostriches (Struthio camelus var. domesticus). M.Sc. (Agric) thesis, Stellenbosch University,
South Africa. Van Soest, P.J., Robertson, J.B. & Lewis, B.A., 1991. Methods for dietary fiber, neutral detergent fiber, and nonstarch
polysaccharides in relation to animal nutrition. J. Dairy Sci. 74, 3583-3597. Zeb, A., 1998. Possibilities and limitations of feeding rapeseed meal to broiler chicks. PhD dissertation, Georg August
University of Göttingen, Germany. Zheng, C., Zhang, M., Yang, M., Zhou, Q., Li, W. & Liu, C., 2017. Microwave pre-treatment improved antioxidant
activities of Brassica seeds, cold-pressed oil and cake. Oil Crop Sci. 2, 237-243.