Embed Size (px)
Citation preview
Ea
Ra
b
a
ARRAA
KIVVEHB
1
gionsptRcrtm
PT
0d
Vaccine 28 (2010) 7267–7272
Contents lists available at ScienceDirect
Vaccine
journa l homepage: www.e lsev ier .com/ locate /vacc ine
ffect of influenza vaccination on hospitalizations in persons aged 50 yearsnd older
oger Baxtera,∗, G. Thomas Rayb, Bruce H. Firemana
Kaiser Permanente Vaccine Study Center, Oakland, CA, United StatesDivision of Research, Kaiser Permanente Northern California, Oakland, CA, United States
r t i c l e i n f o
rticle history:eceived 21 July 2010eceived in revised form 13 August 2010ccepted 24 August 2010vailable online 9 September 2010
eywords:nfluenzaaccineaccinationffectivenessospitalizationias
a b s t r a c t
Objective: To estimate influenza vaccine effectiveness (VE) in preventing hospitalizations in persons over50 years of age.Design: We performed a retrospective, population based study, using a “difference-in-differences”approach to determine the association between hospitalization and prior vaccination. We examined thisassociation when influenza was not circulating and compared it to the association found when influenzawas circulating. VE was estimated from the difference in the association between hospitalization andprior vaccination, inside vs. outside influenza seasons.Setting: Kaiser Permanente in Northern California.Patients: Health plan members aged 50 years and older during the September 1997 to August 2008 studyperiod, when there were about 68,000 pneumonia hospitalizations in 10 million person-years.Results: Vaccination was associated with lower risk of hospitalization for pneumonia and influenza,
even before flu season, presumably due to unmeasured confounders. When influenza arrived thehospitalization-vaccination association strengthened, yielding an adjusted VE estimate of 12.4% (95%CI: 1.6–22.0) in persons aged 50–64, and 8.5% (95% CI: 3.3–13.5) in those aged 65 years and older. Therewas no significant effect on hospitalizations for ischemic heart disease (IHD), congestive heart failure(CHF), cerebrovascular disease (CVD), or trauma.Conclusions: Influenza vaccination has a modest but significant effect on prevention of hospitalization forin pe
pneumonia and influenza. Introduction
In recent years, several studies have found that people whoet flu shots experience unexpectedly low mortality even whennfluenza is not circulating [1–5], indicating that many priorbservational studies may have exaggerated vaccine effective-ess. Because the vaccine has been recommended in the elderlyince the 1960s, it has been considered unethical to performlacebo-controlled trials (RCTs), so estimates of vaccine effec-iveness have relied on retrospective, observational studies [6].ecent meta-analyses [7,8] of these studies estimated that, among
ommunity-dwelling persons aged 65 and older, vaccinationeduced pneumonia and influenza hospitalizations by 27–33%,hough one of these reviews suggested that the quality of the dataade the results uninterpretable [8]. One of the few studies focused
∗ Corresponding author at: Kaiser Permanente Vaccine Study Center, 1 Kaiserlaza, Ordway Bldg., 16th floor, Oakland, CA 94612, United States.el.: +1 510 267 7529; fax: +1 510 267 7524.
E-mail address: [email protected] (R. Baxter).
264-410X/$ – see front matter © 2010 Elsevier Ltd. All rights reserved.oi:10.1016/j.vaccine.2010.08.088
rsons 50 years of age and older.© 2010 Elsevier Ltd. All rights reserved.
on persons 50–64 years old, estimated that vaccination reducedinfluenza-related hospitalizations by 36% and 90% among personswith and without high-risk conditions, respectively [9]. However,there is substantial evidence that bias accounts for much of what isperceived as vaccine effectiveness, especially for preventing death,and possibly for hospitalization, in observational studies. Adjust-ment for the differences between the vaccinated and unvaccinatedis challenging, because these two groups differ in ways that aredifficult to measure [1,4,8,10–13].
Vaccination should have little or no effect during periods wheninfluenza virus is not circulating. Differences seen between vac-cinated persons and unvaccinated persons during such periodsindicate bias. This suggests methods of circumventing the prob-lems associated with selection bias and unmeasured confounders.Instead of modeling the difference in outcomes among vacci-nated and unvaccinated persons during the influenza season (when
the virus is circulating), one can model the difference betweenthe apparent effectiveness of the vaccine when influenza iscirculating compared to when it is not circulating (the “difference-in-differences”). In a prior analysis, we demonstrated that theeffects of selection bias with respect to mortality were not con-
7268 R. Baxter et al. / Vaccine 28 (2010) 7267–7272
Table 1Influenza season start and stop dates by year. Kaiser Permanente Northern California, influenza years 1997–2007.
Influenza year Influenza season used for primary analysis(base-case)
Alternative “short” influenza season usedfor sensitivity analysisa
Alternative “long” influenza season usedfor sensitivity analysisb
Start date Stop date Days in season Start date Stop date Days in season Start date Stop date Days in season
1997 12/28/1997 1/25/1998 28 12/28/1997 1/25/1998 28 12/7/1997 2/22/1998 771998 1/3/1999 2/21/1999 49 1/3/1999 2/7/1999 35 1/3/1999 3/14/1999 701999 12/12/1999 1/16/2000 35 12/12/1999 1/16/2000 35 11/21/1999 1/23/2000 632000 12/17/2000 2/4/2001 49 12/17/2000 2/4/2001 49 11/19/2000 2/18/2001 912001 1/20/2002 3/10/2002 49 1/27/2002 3/3/2002 35 12/16/2001 4/14/2002 1192002 2/16/2003 4/6/2003 49 2/23/2003 3/30/2003 35 1/19/2003 4/27/2003 982003 11/9/2003 1/18/2004 70 11/16/2003 12/21/2003 35 11/2/2003 1/1/2004 602004 12/26/2004 2/27/2005 63 1/2/2005 2/27/2005 56 12/12/2004 4/10/2005 1192005 11/27/2005 2/19/2006 84 12/11/2005 1/8/2006 28 11/27/2005 5/28/2006 1822006 12/24/2006 3/25/2007 91 1/21/2007 3/4/2007 42 12/10/2006 4/29/2007 140
3
saacmrfica
bLHttWv
2
2
pmyaadbr
2
Kotd
rppeif4
2007 12/23/2007 4/20/2008 119 1/13/2008
a Alternative algorithm for defining season adapted from Izurieta et al. [25].b Alternative algorithm for defining season adapted from Jackson et al. [1].
tant over the season, but were higher near the time of vaccinationnd were reduced as time from vaccination got longer [3,5]. Using“difference-in-differences” approach that explicitly modeled the
ontinuous change in bias over the course of the season, we esti-ated vaccine effectiveness in a way that reduced bias without
equiring identification and measurement of the type of con-ounders (such as frailty and functional status) that have beendentified in the literature [10]. We found evidence that the vac-ine, although less effective than previously estimated, is beneficialt preventing death from all causes [3].
Hospitalization, particularly from pneumonia and influenza, haseen considered a marker of influenza activity and burden [14–17].owering this burden is one of the goals of influenza vaccination.ere, we apply the difference-in-differences method to determine
he effectiveness of influenza vaccination at preventing hospitaliza-ion from pneumonia and influenza, in people over the age of 50.
e also investigate how different ways of defining when influenzairus is circulating affects measures of vaccine effectiveness.
. Methods
.1. Setting
Kaiser Permanente in Northern California (KPNC) provides com-rehensive medical services to a membership which grew from 2.6illion to 3.2 million during the study period: the 11 influenza
ears from September 1, 1997 through August 31, 2008. Eachutumn there is a campaign to deliver flu shots conveniently andt no cost to Kaiser Permanente members. Members are ethnicallyiverse and similar to the population of California in terms of age,ut somewhat under-representative of the poor [18,19]. The cur-ent study included all members of KPNC 50 years of age or older.
.2. Data
Age, sex and health plan membership were ascertained fromPNC administrative databases. Vaccination information wasbtained from KPNC’s Immunization Tracking System, and hospi-alization information was obtained from KPNC clinical and claimsatabases.
The primary focus of this study was to examine the effect ofeceiving influenza vaccination on inpatient hospitalizations forneumonia and influenza (ICD9-CDs 480–487, as have been used in
rior studies [1,20–24]) Consistent with Jackson et al. [1], we alsoxamined the effect of influenza vaccination on hospitalizations forschemic heart disease (IHD, ICD9-CD 410–414), congestive heartailure (CHF, ICD9-CD 428), cerebrovascular disease (CVD, ICD9-CD31–437), and trauma (ICD9-CD 800–904 and 910–959). Trauma/9/2008 56 12/2/2007 5/11/2008 161
was included as a “control” condition because we would not expectthe influenza vaccine to have any effect on hospitalizations for thiscondition. The primary diagnosis code was used for identifying hos-pitalizations to increase specificity and exclude hospital-acquiredinfections.
2.3. Influenza season
Influenza season was defined using yearly influenza test resultsfor the KPNC population. Consistent with our prior study onthe effectiveness of influenza vaccine on mortality [3], the localinfluenza season was defined by one of the authors (R.B.) who,throughout the study period, monitored all laboratory tests donewithin KPNC and identified the beginning and end of each flu seasonbased on the number of influenza tests and the number of positivetests in each week. In sensitivity analyses we tested two alterna-tive definitions of influenza season using algorithms adapted fromthe literature. The first alternative algorithm, adapted from Jack-son et al. [1], defined the onset and end of influenza season by thefirst and last occurrence of at least two consecutive weeks with twoor more influenza isolates reported. Due to a change in the type oftest used, and a concurrent substantial increase in testing, the num-ber of required positive isolates was increased to five for influenzaseasons after 2005. The second alternative algorithm used was the“extended influenza virus circulation” period algorithm developedby Izurieta et al. [25], where influenza season was defined as anyperiod of two or more consecutive weeks in which each weekaccounted for at least 5% of the season’s total number of influenzavirus isolates. All such study weeks were combined and togetherwere defined as the influenza flu season. The first of the above alter-native algorithms tended to produce longer influenza seasons thanour primary definition, and the second tended to produce shorterseasons (Table 1).
2.4. Data analysis
We examined our population for a difference between two dif-ferences: (1) the difference in the odds of prior vaccination betweenhospitalized and non-hospitalized patients that was observed ondays when influenza virus was circulating and (2) the differencein the odds of prior vaccination between hospitalized and non-hospitalized patients that we would have expected on the samecalendar dates if influenza virus were not circulating.
Vaccine effectiveness (VE) was estimated using case-centeredlogistic regression, described in more detail in a previous pub-lication [3]. As demonstrated in the appendix to the previouspublication [3], this approach is equivalent to the traditional strati-fied Cox model, but is much more computationally efficient because
R. Baxter et al. / Vaccine 28 (2010) 7267–7272 7269
Table 2Characteristics of study population. Kaiser Permanente Northern California, influenza years 1997–2007.a
Age group, years Gender Person-years in study population (N = 10,147,495) Pneumonia and influenza hospitalizationsb
Number of person, years % with influenza vaccination incurrent year
Number of hospitalizations % with influenza vaccination priorto hospitalization
50–64 Female 3,218,551 30% 6699 38%Male 2,920,566 24% 6445 36%
65+ Female 2,230,305 64% 26,956 53%
pitaliza lizati
tr
pyosbfsposotS
iptcilpwaesottdtramwefetew
aPTiobygw
Male 1,788,075 66%
a Influenza year defined as September 1 to August 31.b Hospitalizations with primary ICD9-CM diagnosis 480–487. Less than 1% of hos
ll influenza years in the analysis. Predictive model, however, included only hospita
he relevant data are summarized into a relatively small number ofecords.
Prior to conducting the regression analysis, we defined 377,598otential strata (risk sets): 2 gender groups times 47 age groups (1ear age groups from 50 to 95, and all ages over 95 combined intone group) times 4017 days covering 11 influenza years. For eachtratum, we calculated the proportion of members vaccinated on, orefore, that day and stored this information in a look-up table. Then,or each hospitalization of interest, we looked up the patient’s age-ex group on the admit date of the hospitalization and obtained theerson’s expected odds of vaccination. These odds summarize whatur expectations would be in the absence of any vaccine effects orelection effects. For example, given a man who was hospitalizedn November 1, 2002, at age 82 years, our expectation came fromhe proportion of all men his age who were vaccinated betweeneptember 1 and November 1, 2002.
The regression model contained one record for each hospital-zation of interest. The dependent variable was the hospitalizederson’s vaccination status – i.e. whether or not the person receivedhat year’s influenza vaccine prior to the hospitalization. It wasompared with the expected odds of vaccination for the hospital-zed person, which came from the appropriate risk strata in theook-up table described above, and which was comprised of peo-le who were similar to the hospitalized person on the day theyere hospitalized. The expected odds were included in the model
s an offset, which in effect is a denominator variable. With thexpected odds as a denominator variable on the right side (as an off-et term) and the observed odds indicated by the vaccination statusn the left side, the model could be used to focus on the observed-o-expected ratio, which is an odds ratio. We added polynomialerms for number of days since September 1st, days squared andays cubed in order to account for changing selection effects overime. We added indicators of sex, age group, and influenza year toefine our adjustment for the trajectory of the odds ratio. Then wedded the indicator of influenza season in order to estimate howuch of a difference it made in the odds ratio. This difference ishat we sought; it amounted to a difference of differences. It was
xponentiated, yielding a ratio of odds ratios, and then subtractedrom 1 and multiplied by 100 to obtain the VE estimate. In the mod-ls, we restricted analyses to the hospitalizations occurring duringhe period November to May, the months when influenza virus wasver considered to be circulating. In sensitivity analyses, the modelas re-run using the two alternative definitions of influenza season.
Finally, we estimated the average amount of excess (influenza-ttributable) hospitalizations during influenza season by fitting aoisson regression model to data on the 377,598 person-day strata.he count of hospitalizations was regressed on an influenza seasonndicator and covariates, with the person-time at risk included as an
ffset term. The covariates included number of days since Septem-er 1, days squared, days cubed, an indicator for each influenzaear, an indicator for each calendar month, and indicators for ageroup (in 5-year age groups up to 95 years of age) and sex. Becausee wanted to estimate the number of hospitalizations that would27,712 57%
ations were coded as 487, “influenza”. Counts include hospitalizations throughoutons occurring between November and May of each influenza year.
be caused by influenza virus in the absence of vaccination, we firstused actual vaccine coverage and estimated VE to adjust the origi-nal count of hospitalizations upward before using those counts inthe Poisson model.
3. Results
During the 11 influenza years studied, there were 68,000pneumonia and influenza hospitalizations in over 10 millionperson-years (Table 2). Across all years, vaccination coverage aver-aged about 65% for persons 65 years of age and older, and 24–30%for persons 50 to <65 years of age. Using our base-case definition,the local influenza seasons (when influenza virus was assumed tobe circulating) began as early as November 9th (2003) and con-tinued as late as April 20th (2007, Table 1). Influenza seasonstended to get longer over the course of the study, with the aver-age season being 62 days long. The alternative algorithms we usedfor defining influenza season resulting in average season lengthsof 39 and 107 days for the “short” and “long” seasons, respec-tively.
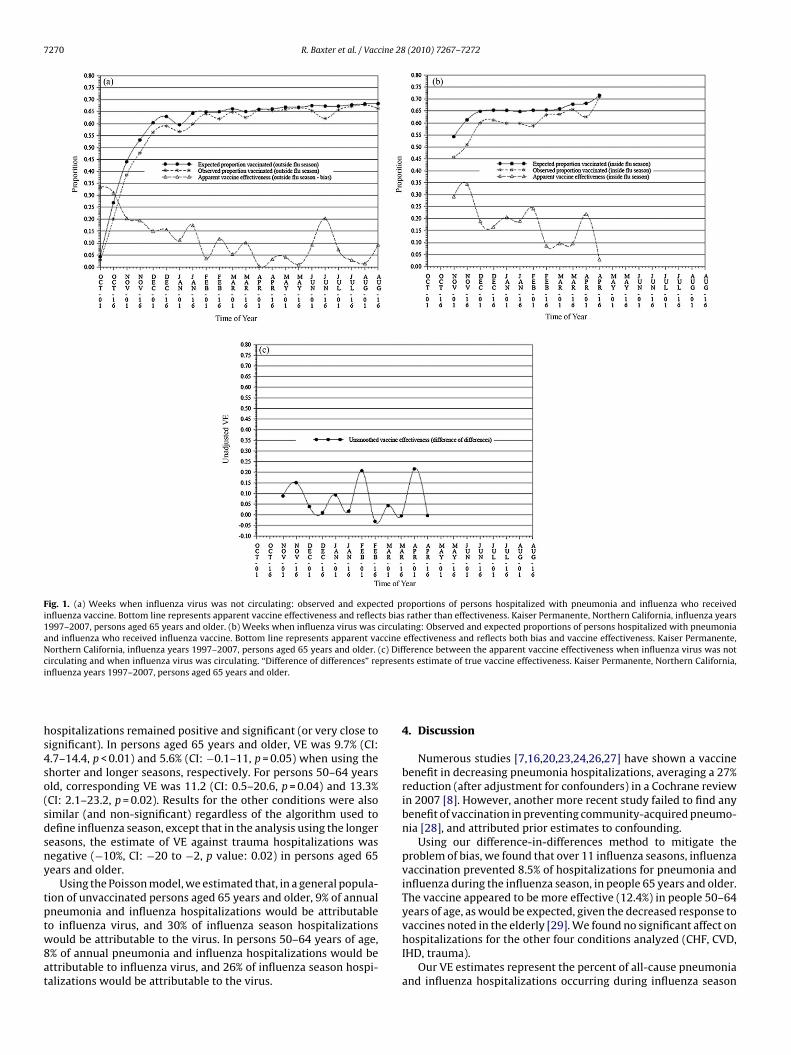
The vaccination-hospitalization association for persons 65 yearsand older throughout the influenza year is shown in Fig. 1a.The asterisks show the proportion of hospitalized patients whowere vaccinated by week of hospitalization, omitting the hospi-talizations that occurred when the influenza virus was circulating.The proportion of hospitalized persons who were vaccinated wasalways lower than expected, where the proportion expected camefrom the vaccine coverage in the hospitalized person’s age-sexgroup on the day of hospitalization (as described above). Thedescending line in Fig. 1a traces the apparent VE for each weekand is derived from the corresponding observed and expected pro-portions shown in the other 2 lines. Because this estimate comesentirely from periods when influenza virus was not circulating,this line reflects bias, not true VE. Fig. 1b shows the same trajec-tory during periods when influenza was circulating. The bottomline in this figure reflects both bias and VE. Fig. 1c subtracts theapparent VE (bias) outside of influenza season from the appar-ent VE inside influenza season. This trajectory illustrates trueVE.
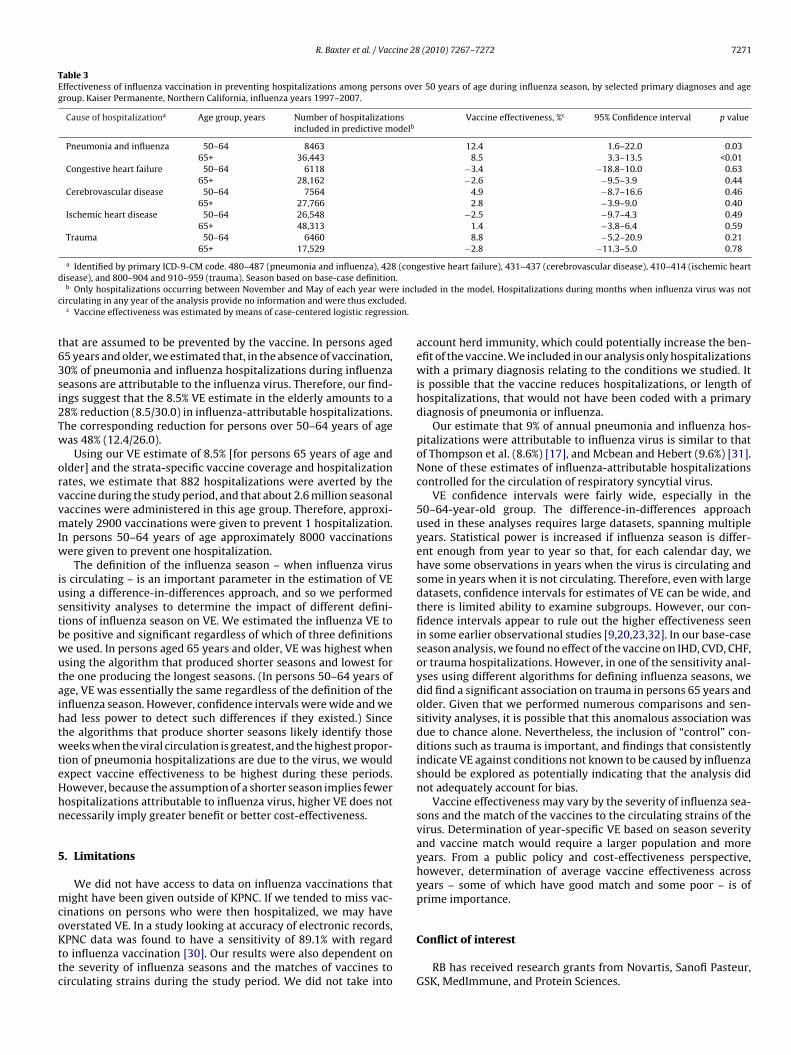
Table 3 summarizes the estimates of vaccine effectiveness forhospitalizations using the case-centered, difference-in-differencesapproach. Over the 11-year period, we estimated that, during theinfluenza season, influenza vaccination prevented 8.5% of hospital-izations for pneumonia and influenza in persons 65 and older, and12.4% in those 50–64 years of age. We found no effect on hospi-talizations for CHF, CVD, ISD or trauma. Because most pneumoniaand influenza hospitalizations (70%) in older persons were for per-sons aged 75 years and older, we ran separate analyses for persons
65–74 years of age, and 75 years of age and older. VE among per-sons 65–74 years of age, and 75 years of age and older, was 16% (CI:7–24%), and 5% (CI: −1% to 11%), respectively.In sensitivity analyses using algorithms that defined a shorterand a longer influenza season, VE against pneumonia and influenza
7270 R. Baxter et al. / Vaccine 28 (2010) 7267–7272
Fig. 1. (a) Weeks when influenza virus was not circulating: observed and expected proportions of persons hospitalized with pneumonia and influenza who receivedinfluenza vaccine. Bottom line represents apparent vaccine effectiveness and reflects bias rather than effectiveness. Kaiser Permanente, Northern California, influenza years1997–2007, persons aged 65 years and older. (b) Weeks when influenza virus was circulating: Observed and expected proportions of persons hospitalized with pneumoniaand influenza who received influenza vaccine. Bottom line represents apparent vaccine effectiveness and reflects both bias and vaccine effectiveness. Kaiser Permanente,Northern California, influenza years 1997–2007, persons aged 65 years and older. (c) Difference between the apparent vaccine effectiveness when influenza virus was notc presei
hs4so(sdsny
tptw8at
irculating and when influenza virus was circulating. “Difference of differences” renfluenza years 1997–2007, persons aged 65 years and older.
ospitalizations remained positive and significant (or very close toignificant). In persons aged 65 years and older, VE was 9.7% (CI:.7–14.4, p < 0.01) and 5.6% (CI: −0.1–11, p = 0.05) when using thehorter and longer seasons, respectively. For persons 50–64 yearsld, corresponding VE was 11.2 (CI: 0.5–20.6, p = 0.04) and 13.3%CI: 2.1–23.2, p = 0.02). Results for the other conditions were alsoimilar (and non-significant) regardless of the algorithm used toefine influenza season, except that in the analysis using the longereasons, the estimate of VE against trauma hospitalizations wasegative (−10%, CI: −20 to −2, p value: 0.02) in persons aged 65ears and older.
Using the Poisson model, we estimated that, in a general popula-ion of unvaccinated persons aged 65 years and older, 9% of annualneumonia and influenza hospitalizations would be attributable
o influenza virus, and 30% of influenza season hospitalizationsould be attributable to the virus. In persons 50–64 years of age,% of annual pneumonia and influenza hospitalizations would bettributable to influenza virus, and 26% of influenza season hospi-alizations would be attributable to the virus.
nts estimate of true vaccine effectiveness. Kaiser Permanente, Northern California,
4. Discussion
Numerous studies [7,16,20,23,24,26,27] have shown a vaccinebenefit in decreasing pneumonia hospitalizations, averaging a 27%reduction (after adjustment for confounders) in a Cochrane reviewin 2007 [8]. However, another more recent study failed to find anybenefit of vaccination in preventing community-acquired pneumo-nia [28], and attributed prior estimates to confounding.
Using our difference-in-differences method to mitigate theproblem of bias, we found that over 11 influenza seasons, influenzavaccination prevented 8.5% of hospitalizations for pneumonia andinfluenza during the influenza season, in people 65 years and older.The vaccine appeared to be more effective (12.4%) in people 50–64years of age, as would be expected, given the decreased response to
vaccines noted in the elderly [29]. We found no significant affect onhospitalizations for the other four conditions analyzed (CHF, CVD,IHD, trauma).Our VE estimates represent the percent of all-cause pneumoniaand influenza hospitalizations occurring during influenza season
R. Baxter et al. / Vaccine 28 (2010) 7267–7272 7271
Table 3Effectiveness of influenza vaccination in preventing hospitalizations among persons over 50 years of age during influenza season, by selected primary diagnoses and agegroup. Kaiser Permanente, Northern California, influenza years 1997–2007.
Cause of hospitalizationa Age group, years Number of hospitalizationsincluded in predictive modelb
Vaccine effectiveness, %c 95% Confidence interval p value
Pneumonia and influenza 50–64 8463 12.4 1.6–22.0 0.0365+ 36,443 8.5 3.3–13.5 <0.01
Congestive heart failure 50–64 6118 −3.4 −18.8–10.0 0.6365+ 28,162 −2.6 −9.5–3.9 0.44
Cerebrovascular disease 50–64 7564 4.9 −8.7–16.6 0.4665+ 27,766 2.8 −3.9–9.0 0.40
Ischemic heart disease 50–64 26,548 −2.5 −9.7–4.3 0.4965+ 48,313 1.4 −3.8–6.4 0.59
Trauma 50–64 6460 8.8 −5.2–20.9 0.2165+ 17,529 −2.8 −11.3–5.0 0.78
a Identified by primary ICD-9-CM code. 480–487 (pneumonia and influenza), 428 (congestive heart failure), 431–437 (cerebrovascular disease), 410–414 (ischemic heartd .
e inclc ed.
ion.
t63si2Tw
orvvmIw
iustbwutaihtwteHhn
5
mcoKttc
isease), and 800–904 and 910–959 (trauma). Season based on base-case definitionb Only hospitalizations occurring between November and May of each year wer
irculating in any year of the analysis provide no information and were thus excludc Vaccine effectiveness was estimated by means of case-centered logistic regress
hat are assumed to be prevented by the vaccine. In persons aged5 years and older, we estimated that, in the absence of vaccination,0% of pneumonia and influenza hospitalizations during influenzaeasons are attributable to the influenza virus. Therefore, our find-ngs suggest that the 8.5% VE estimate in the elderly amounts to a8% reduction (8.5/30.0) in influenza-attributable hospitalizations.he corresponding reduction for persons over 50–64 years of ageas 48% (12.4/26.0).
Using our VE estimate of 8.5% [for persons 65 years of age andlder] and the strata-specific vaccine coverage and hospitalizationates, we estimate that 882 hospitalizations were averted by theaccine during the study period, and that about 2.6 million seasonalaccines were administered in this age group. Therefore, approxi-ately 2900 vaccinations were given to prevent 1 hospitalization.
n persons 50–64 years of age approximately 8000 vaccinationsere given to prevent one hospitalization.
The definition of the influenza season – when influenza viruss circulating – is an important parameter in the estimation of VEsing a difference-in-differences approach, and so we performedensitivity analyses to determine the impact of different defini-ions of influenza season on VE. We estimated the influenza VE toe positive and significant regardless of which of three definitionse used. In persons aged 65 years and older, VE was highest whensing the algorithm that produced shorter seasons and lowest forhe one producing the longest seasons. (In persons 50–64 years ofge, VE was essentially the same regardless of the definition of thenfluenza season. However, confidence intervals were wide and wead less power to detect such differences if they existed.) Sincehe algorithms that produce shorter seasons likely identify thoseeeks when the viral circulation is greatest, and the highest propor-
ion of pneumonia hospitalizations are due to the virus, we wouldxpect vaccine effectiveness to be highest during these periods.owever, because the assumption of a shorter season implies fewerospitalizations attributable to influenza virus, higher VE does notecessarily imply greater benefit or better cost-effectiveness.
. Limitations
We did not have access to data on influenza vaccinations thatight have been given outside of KPNC. If we tended to miss vac-
inations on persons who were then hospitalized, we may have
verstated VE. In a study looking at accuracy of electronic records,PNC data was found to have a sensitivity of 89.1% with regardo influenza vaccination [30]. Our results were also dependent onhe severity of influenza seasons and the matches of vaccines toirculating strains during the study period. We did not take into
uded in the model. Hospitalizations during months when influenza virus was not
account herd immunity, which could potentially increase the ben-efit of the vaccine. We included in our analysis only hospitalizationswith a primary diagnosis relating to the conditions we studied. Itis possible that the vaccine reduces hospitalizations, or length ofhospitalizations, that would not have been coded with a primarydiagnosis of pneumonia or influenza.
Our estimate that 9% of annual pneumonia and influenza hos-pitalizations were attributable to influenza virus is similar to thatof Thompson et al. (8.6%) [17], and Mcbean and Hebert (9.6%) [31].None of these estimates of influenza-attributable hospitalizationscontrolled for the circulation of respiratory syncytial virus.
VE confidence intervals were fairly wide, especially in the50–64-year-old group. The difference-in-differences approachused in these analyses requires large datasets, spanning multipleyears. Statistical power is increased if influenza season is differ-ent enough from year to year so that, for each calendar day, wehave some observations in years when the virus is circulating andsome in years when it is not circulating. Therefore, even with largedatasets, confidence intervals for estimates of VE can be wide, andthere is limited ability to examine subgroups. However, our con-fidence intervals appear to rule out the higher effectiveness seenin some earlier observational studies [9,20,23,32]. In our base-caseseason analysis, we found no effect of the vaccine on IHD, CVD, CHF,or trauma hospitalizations. However, in one of the sensitivity anal-yses using different algorithms for defining influenza seasons, wedid find a significant association on trauma in persons 65 years andolder. Given that we performed numerous comparisons and sen-sitivity analyses, it is possible that this anomalous association wasdue to chance alone. Nevertheless, the inclusion of “control” con-ditions such as trauma is important, and findings that consistentlyindicate VE against conditions not known to be caused by influenzashould be explored as potentially indicating that the analysis didnot adequately account for bias.
Vaccine effectiveness may vary by the severity of influenza sea-sons and the match of the vaccines to the circulating strains of thevirus. Determination of year-specific VE based on season severityand vaccine match would require a larger population and moreyears. From a public policy and cost-effectiveness perspective,however, determination of average vaccine effectiveness acrossyears – some of which have good match and some poor – is ofprime importance.
Conflict of interest
RB has received research grants from Novartis, Sanofi Pasteur,GSK, MedImmune, and Protein Sciences.
7 cine 28
A
g
R
[
[
[
[
[
[
[
[
[
[
[
[
[
[
[
[
[
[
[
[
[
272 R. Baxter et al. / Vac
GTR and BF have no conflicts of interest.
cknowledgements
We would like to thank Janelle Lee, for helping with data pro-ramming, and Ned Lewis for his contributions to the methodology.
eferences
[1] Jackson LA, Jackson ML, Nelson JC, Neuzil KM, Weiss NS. Evidence of biasin estimates of influenza vaccine effectiveness in seniors. Int J Epidemiol2006;35(2):337–44.
[2] Armstrong BG, Mangtani P, Fletcher A, Kovats S, McMichael A, PattendenS, et al. Effect of influenza vaccination on excess deaths occurring duringperiods of high circulation of influenza: cohort study in elderly people. BMJ2004;329(7467):660.
[3] Fireman B, Lee J, Lewis N, Bembom O, van der LM, Baxter R. Influenza vacci-nation and mortality: differentiating vaccine effects from bias. Am J Epidemiol2009;170(5):650–6.
[4] Eurich DT, Marrie TJ, Johnstone J, Majumdar SR. Mortality reductionwith influenza vaccine in patients with pneumonia outside “flu” season:pleiotropic benefits or residual confounding? Am J Respir Crit Care Med2008;178(5):527–33.
[5] Baxter R, Lee J, Fireman B. Evidence of bias in studies of influenza vaccineeffectiveness in elderly patients. J Infect Dis 2010;201(2):186–9.
[6] Fiore AE, Shay DK, Broder K, Iskander JK, Uyeki TM, Mootrey G, et al. Preven-tion and control of seasonal influenza with vaccines: recommendations of theAdvisory Committee on Immunization Practices (ACIP), 2009. MMWR RecommRep 2009;58(RR-8):1–52.
[7] Vu T, Farish S, Jenkins M, Kelly H. A meta-analysis of effectiveness of influenzavaccine in persons aged 65 years and over living in the community. Vaccine2002;20(13–14):1831–6.
[8] Jefferson T, Di Pietrantonj C, Al Ansary LA, Ferroni E, Thorning S, Thomas RE.Vaccines for preventing influenza in the elderly. Cochrane Database Syst Rev2010;2:CD004876.
[9] Herrera GA, Iwane MK, Cortese M, Brown C, Gershman K, Shupe A, et al.Influenza vaccine effectiveness among 50–64-year-old persons during a sea-son of poor antigenic match between vaccine and circulating influenza virusstrains: Colorado, United States, 2003–2004. Vaccine 2007;25(1):154–60.
10] Jackson LA, Nelson JC, Benson P, Neuzil KM, Reid RJ, Psaty BM, et al. Functionalstatus is a confounder of the association of influenza vaccine and risk of allcause mortality in seniors. Int J Epidemiol 2006;35(2):345–52.
11] Jefferson T. Influenza vaccination: policy versus evidence. BMJ2006;333(7574):912–5.
12] Nelson JC, Jackson ML, Weiss NS, Jackson LA. New strategies are needed toimprove the accuracy of influenza vaccine effectiveness estimates amongseniors. J Clin Epidemiol 2009;62(7):687–94.
13] Simonsen L, Viboud C, Taylor RJ, Miller MA, Jackson L. Influenza vacci-nation and mortality benefits: new insights, new opportunities. Vaccine2009;27(45):6300–4.
14] Foster DA, Talsma A, Furumoto-Dawson A, Ohmit SE, Margulies JR, Arden NH, etal. Influenza vaccine effectiveness in preventing hospitalization for pneumoniain the elderly. Am J Epidemiol 1992;136(3):296–307.
[
[
(2010) 7267–7272
15] Barker WH, Mullooly JP. Influenza vaccination of elderly persons. Reduc-tion in pneumonia and influenza hospitalizations and deaths. JAMA1980;244(22):2547–9.
16] Nichol KL. Influenza vaccination in the elderly: impact on hospitalisation andmortality. Drugs Aging 2005;22(6):495–515.
17] Thompson WW, Shay DK, Weintraub E, Brammer L, Bridges CB, CoxNJ, et al. Influenza-associated hospitalizations in the United States. JAMA2004;292(11):1333–40.
18] Krieger N. Overcoming the absence of socioeconomic data in medical records:validation and application of a census-based methodology. Am J Public Health1992;82:703–10.
19] Selby JV, Smith DH, Johnson ES, Raebel MA, Friedman GD, McFarland BH.Pharmacoepidemiology. In: Strom BL, editor. Kaiser Permanente Medical CareProgram. fourth ed. New York: Wiley; 2005. p. 241–59.
20] Nichol KL, Nordin JD, Nelson DB, Mullooly JP, Hak E. Effectiveness ofinfluenza vaccine in the community-dwelling elderly. N Engl J Med2007;357(14):1373–81.
21] Spaude KA, Abrutyn E, Kirchner C, Kim A, Daley J, Fisman DN. Influenza vaccina-tion and risk of mortality among adults hospitalized with community-acquiredpneumonia. Arch Intern Med 2007;167(1):53–9.
22] Hak E, Nordin J, Wei F, Mullooly J, Poblete S, Strikas R, et al. Influence ofhigh-risk medical conditions on the effectiveness of influenza vaccinationamong elderly members of 3 large managed-care organizations. Clin Infect Dis2002;35(4):370–7.
23] Nordin J, Mullooly J, Poblete S, Strikas R, Petrucci R, Wei F, et al. Influenza vaccineeffectiveness in preventing hospitalizations and deaths in persons 65 years orolder in Minnesota, New York, and Oregon: data from 3 health plans. J InfectDis 2001;184(6):665–70.
24] Nichol KL, Baken L, Nelson A. Relation between influenza vaccination and out-patient visits, hospitalization, and mortality in elderly persons with chroniclung disease. Ann Intern Med 1999;130(5):397–403.
25] Izurieta HS, Thompson WW, Kramarz P, Shay DK, Davis RL, DeStefano F, et al.Influenza and the rates of hospitalization for respiratory disease among infantsand young children. N Engl J Med 2000;342(4):232–9.
26] Nichol KL, Nordin J, Mullooly J, Lask R, Fillbrandt K, Iwane M. Influenza vacci-nation and reduction in hospitalizations for cardiac disease and stroke amongthe elderly. N Engl J Med 2003;348(14):1322–32.
27] Nichol KL. Clinical effectiveness and cost-effectiveness of influenza vaccinationamong healthy working adults. Vaccine 1999;17(Suppl. 1):S67–73.
28] Jackson ML, Nelson JC, Weiss NS, Neuzil KM, Barlow W, Jackson LA. Influenzavaccination and risk of community-acquired pneumonia in immunocompe-tent elderly people: a population-based, nested case–control study. Lancet2008;372(9636):398–405.
29] Grubeck-Loebenstein B, Della BS, Iorio AM, Michel JP, Pawelec G, Solana R.Immunosenescence and vaccine failure in the elderly. Aging Clin Exp Res2009;21(3):201–9.
30] Greene SK, Shi P, Dutta-Linn MM, Shoup JA, Hinrichsen VL, Ray P, et al. Accuracyof data on influenza vaccination status at four Vaccine Safety Datalink sites. AmJ Prev Med 2009;37(6):552–5.
31] McBean AM, Hebert PL. New estimates of influenza-related pneumonia andinfluenza hospitalizations among the elderly. Int J Infect Dis 2004;8(4):227–35.
32] Nichol KL, Wuorenma J, Von Sternberg T. Benefits of influenza vaccina-tion for low-, intermediate-, and high-risk senior citizens. Arch Intern Med1998;158(16):1769–76.