Embed Size (px)
Citation preview

Effect of Insulin on the Distribution and Disposition of Glucose in ManEleuterio Ferrannini, J. Douglas Smith, Claudio Cobelli, Gianna Toffolo, Alessandro Pilo, and Ralph A. DeFronzoSecond Medical Clinic and Institute of Clinical Physiology ofthe Consiglio Nazionale delle Ricerche, University ofPisa, Pisa, Italy;Department ofElectrical Engineering, University ofPadova, Padova, Italy; and Department ofMedicine, Yale University School ofMedicine, New Haven, Connecticut 06510
Abstract
Understanding the influence of insulin on glucose turnover isthe key to interpreting a great number of metabolic situations.Little is known, however, about insulin's effect on the distri-bution and exchange of glucose in body pools. We developeda physiological compartmental model to describe the kineticsof plasma glucose in normal man in the basal state and understeady-state conditions of euglycemic hyperinsulinemia.
A bolus of 13-3Hjglucose was rapidly injected into a periph-eral vein in six healthy volunteers, and the time-course ofplasma radioactivity was monitored at very short time intervalsfor 150 min. A 1-mU/min kg insulin clamp was then started,thereby raising plasma insulin levels to a high physiologicalplateau (-100 MU/ml). After 90 min of stable euglycemichyperinsulinemia, a second bolus of [3-3H glucose was given,and plasma radioactivity was again sampled frequently for 90min more while the clamp was continued.
Three exponential components were clearly identified inthe plasma disappearance curves of tracer glucose of eachsubject studied, both before and after insulin. Based on stringentstatistical criteria, the data in the basal state were fitted to athree-compartment model. The compartment of initial distri-bution was identical to the plasma pool (40±3 mg/kg); theother two compartments had similar size (91±12 and 96±9mg/kg), but the former was in rapid exchange with plasma (atan average rate of 1.09±0.15 min-'), whereas the latter ex-changed 10 times more slowly (0.12±0.01 min-'). The basalrate of glucose turnover averaged 2.15±0.12 mg/min kg, andthe total distribution volume of glucose in the postabsorptivestate was 26±1% of body weight. In view of current physiologicalinformation, it was assumed that the more rapidly exchangingpool represented the insulin-independent tissues of the body,while the slowly exchanging pool was assimilated to theinsulin-dependent tissues. Insulin-independent glucose uptakewas estimated (from published data) at 75% of basal glucoseuptake, and was constrained not to change with euglycemichyperinsulinemia. When the kinetic data obtained during insulinadministration were fitted to this model, neither the size northe exchange rates of the plasma or the rapid pool wereappreciably changed. In contrast, the slow pool was markedlyexpanded (from 96±9 to 190±30 mg/kg, P < 0.02) at the sametime as total glucose disposal rose fourfold above basal (to
Address correspondence to Dr. Ferrannini, C.N.R. Institute of ClinicalPhysiology, Via Savi, 8, 56100 Pisa, Italy.
Receivedfor publication 7 March 1984 and in revisedform 6 March1985.
7.96+0.85 mg/min kg, P < 0.001). Furthermore, a significantdirect correlation was found to exist between the change insize of the slow pool and the insulin-stimulated rate of totalglucose turnover (r = 0.92, P < 0.01).
We conclude that hyperinsulinemia, independent of hyper-glycemia, markedly increases the exchangeable mass of glucosein the body, presumably reflecting the accumulation of free,intracellular glucose in insulin-dependent tissues.
Introduction
Information concerning the rate of glucose turnover is impor-tant in a number of physiological and clinical circumstances.Glucose tracers are therefore used yet more frequently tomeasure the rate of glucose appearance in the peripheralcirculation and its rate of removal from the plasma simulta-neously. Insulin has profound effects on endogenous glucoserelease and glucose uptake by sensitive tissues. Little is known,however, about the influence of insulin on the distributionvolume of body glucose and on the rate of glucose exchangebetween its various compartments. In vitro studies have shownthat insulin enhances the transport of glucose (and othermetabolizable sugars) across the cell membrane of muscle cellsmore than it stimulates the subsequent steps of intracellularglucose disposal. This results in the buildup of free glucose inthe cytoplasm (1). Whether this phenomenon occurs in theintact organism to any physiologically meaningful extent isnot known. The in vivo estimation of pool sizes from tracerdata is dependent upon the assumption of a kinetic model forthe substance (2). Many models for the glucose system havebeen proposed in the past (3-12). Models should evolve,however, as new physiological information is gained and newtechniques become available. Glucose disposition by varioustissues in vivo has been extensively investigated in recent years(13-17). Furthermore, two important methodological devel-opments have greatly advanced our knowledge of glucosemetabolism in vivo: first, the glucose clamp technique (18)has made it possible to interrupt the feedback loop betweenglucose and insulin; second, glucose tracers that do not undergolarge recycling (e.g., [3H]glucose) have been introduced(19-22).
The aim of this study, therefore, was to develop a minimum-assumption, physiological model of glucose kinetics to be useddirectly to test the effect of insulin, independent of changes inplasma glucose concentration, on body glucose distribution.We performed paired studies in normal subjects using[3-3H]glucose as the tracer, in the basal state and underconditions closely approximating a steady state of euglycemichyperinsulinemia (glucose clamp technique). Stringent math-ematical criteria and recent physiological data were used toselect a compartmental glucose model. The results indicatethat insulin leads to the accumulation of free intracellularglucose in man.
Modeling of Glucose Kinetics 357
J. Clin. Invest.© The American Society for Clinical Investigation, Inc.0021-9738/85/07/0357/08 $ 1.00Volume 76, July 1985, 357-364

Methods
Subjects. Six healthy, young volunteers (one woman and five men)participated in the study. Their mean age was 23±2 yr (mean±SEM);their mean height was 176±5 cm, and their mean body weight, 72±6kg, corresponding to 1.87±0.10 square meters of body surface area
and to an obesity index of 1.06±0.04 (Metropolitan Life InsuranceCo. Tables, Chicago, 1959). The subjects had negative family historiesfor diabetes mellitus; they had had no recent change in body weight,and no intercurrent illness, and presented no symptoms or signs ofliver or kidney disease. They were instructed to consume a weight-maintaining diet containing at least 200 g carbohydrate per d for 3 dbefore the study. No subjects were taking any medication. The purpose,
nature, and potential risks of the study were explained to all subjects,and written consent was obtained from them before their participation.The protocol was reviewed and approved by the Committee on HumanInvestigation at Yale University School of Medicine, New Haven, CT.
Experimental protocolAll subjects were studied in the postabsorptive state at 8 a.m. after a
12-14 h overnight fast. A polyethylene catheter was inserted into an
antecubital vein for the infusion of glucose and insulin. Anothercatheter was inserted retrograde into a wrist vein for blood sampling.The hand was kept in a heated chamber at 70'C to allow arterializationof the venous blood (18).
At time zero, a first dose of [3-3H]glucose (New England Nuclear,Boston, MA) was rapidly injected (over 10-15 s) as a single bolus intoanother antecubital vein, and blood samples for tracer glucose deter-mination were drawn from the arterialized venous line at 0.5 min,then every I min until 15 min, then at 17, 19, 21, 23, 25, 28, 31, 34,37, and 40 min, and then every 10 min until 150 min. At this time, a
1-mU/min kg euglycemic insulin clamp (18) was begun, and continuedfor 180 min. At time 240 min (90 min into the clamp), a second doseof [3-3H]glucose was again injected as a pulse via an antecubital vein,and arterialized blood was sampled at the same time intervals as afterthe first pulse of tracer for a total of 90 min (Fig. 1). Glucose kineticswere thus evaluated once in the fasting state, and a second time duringsteady-state euglycemic hyperinsulinemia. Since glucose clearance rateis slower in the fasting state than during insulin administration, thedisappearance of the first bolus of tracer from plasma was followed fora longer time (150 min vs. 90 min). For the same reason, a largerdose of tracer was given with the second than with the first bolus(94±2 vs. 68±3 gCi).
Analytical proceduresPlasma glucose was measured by the glucose oxidase method (on a
Glucose Analyzer, Beckman Instruments, Inc., Fullerton, CA), andplasma insulin was determined by radioimmunoassay. Plasma[3H]glucose radioactivity was measured in duplicate on the supernatantsof barium hydroxide-zinc sulphate precipitates (Somogyi's method) ofplasma samples after evaporation to dryness to eliminate 3H20. Todetermine the doses of the tracer accurately, three separate 1:100dilutions of each injectate were run through the Somogyi procedure,and counted together with the plasma samples. The dose was thenobtained as the product of the tracer concentration of the injectate by
1stTRACER BOLUS
1st sampling interval
2ndTRACER BOLUS
2nd sampling inter, ral
]3 Insulin12 Infusiono (mU/min kg)
-Glucose Clamp
the amount of injectate, which was determined by weight (9.6±0.2and 13.4±0.3 g, on the average, for the first and the second bolus,respectively).
Data analysisKinetic data description and measurement error. One-, two-, and three-exponential functions were fitted to the data of the two experiments.The errors inherent in the plasma labeled glucose measurements (whichwere done in duplicate) were assumed to be uncorrelated, and to havea Gaussian distribution of zero mean and an experimentally determinedstandard deviation. Representative figures for the coefficients of variationof the data were 2.3% at 8,000 cpm/ml and 6% at 500 cpm/ml. Anonlinear least squares estimation technique was used to estimate theexponential parameters (23). The accuracy of parameter estimates wasevaluated from the inverse of Fisher information matrix (24). Candidateanalytical descriptions were compared on the basis of criteria such asresidual errors, accuracy ofparameter estimates, and Akaike InformationCriterion (24). The three-exponential model proved to be superiorunder both basal and insulin-stimulated conditions (see reference 25for details). In brief, the time-course of plasma radioactivity (y(t), cpm/ml) is described analytically as a sum of three exponentials:
y(t) = Ale-', + A2e-021 + A3e-3', (1)where Al, A2, and A3 are the intercepts (cpm/ml) and a,, a2, and a3are the slopes (min') of the three exponential components.
From eq. 1, the initial distribution volume of glucose, VI (ml/kg),is calculated as follows:
doseAl + A2 + A3 (2)
The plasma clearance rate of glucose, PCR' (ml/min kg), is obtainedfrom the following formula:
PCR =dose
A, A2 A3a, a2 ai3
(3)
Modeling strategy. Two linear modeling approaches were used toestimate the kinetic parameters of glucose distribution and disposition,namely the so-called noncompartmental and the compartmental ap-proach (24). Only the salient features of the latter will be presentedhere. A more detailed description of the mathematical and computa-tional aspects of the analysis can be found in (25).
Compartmental modeling requires the assumption of a specificmodel structure, its numerical identification, and subsequent validation(24, 26). Various linear compartmental models of glucose kineticswere examined. In particular, the two-compartment model structuresproposed by Radziuk et al. (27) and by Atkins (28) were evaluatedfirst, but were incompatible with our kinetic data (eq. 1). Three-compartment models fitted the tracer data best, and several possibleconfigurations were explicitly evaluated (25). In the configurationeventually chosen (Fig. 2), endogenous glucose enters the systemthrough the sampling compartment (compartment 1), and egressesboth from a rapidly exchanging (compartment 2) and from a slowlyexchanging compartment (compartment 3), the two loss paths (ko2 andk03) being associated with insulin-independent and insulin-dependentglucose disposal, respectively. To reach unique identifiability of modelparameters from experimental data, a constraint was imposed on theglucose loss from compartment 2 (see reference 25 and the appendixfor details). Namely, this loss was assumed to equal a known amount(-75%) of the total glucose disposal rate in the fasting state, and itsabsolute value (1.6±0.1 mg/min kg) was not allowed to change afterinsulin administration. The rationale for this choice is discussed later.
The unknown parameters (transfer rate constants, kij, and initial
1. Abbreviations used in this paper: MRTI, mean total residence time;PCR, plasma clearance rate; VD, steady-state plasma-equivalent distri-bution volume of glucose.
358 Ferrannini et al.
-30 0 30 60 90 120 150 180 210 240 270 300 330
TIME (min)
Figure 1. Experimental protocol.
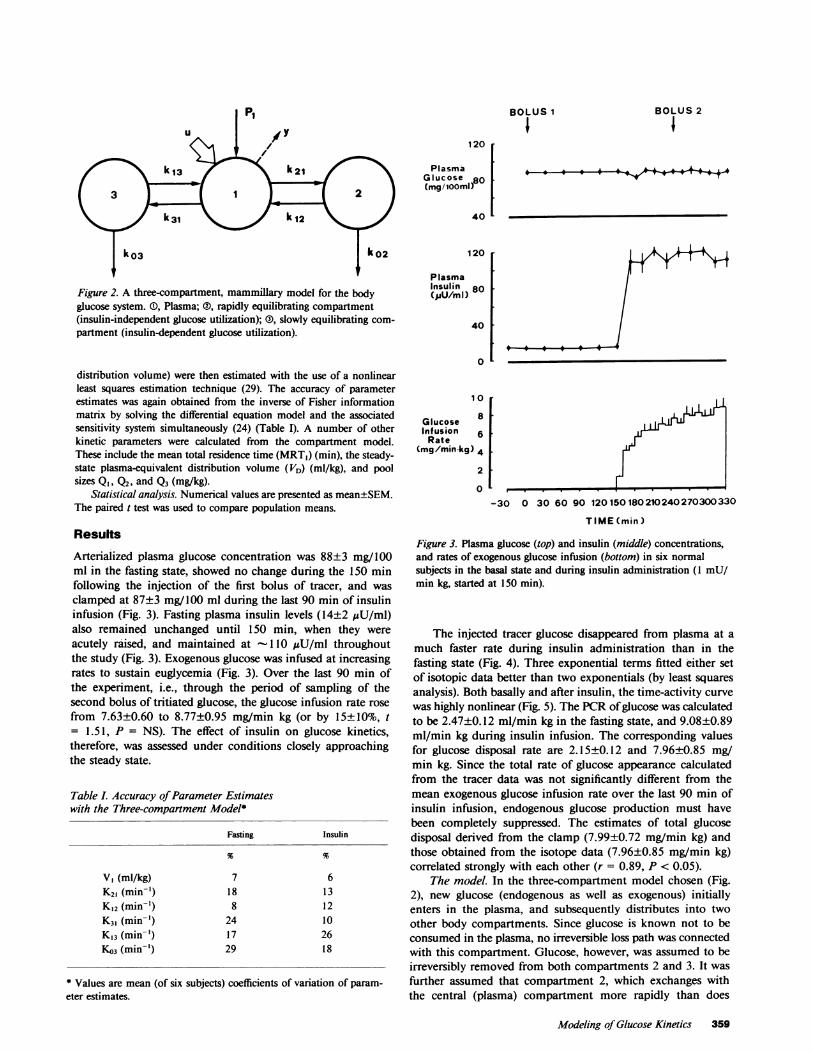
Piu y
Figure 2. A three-compartment, mammillary model for the bodyglucose system. (), Plasma; ®, rapidly equilibrating compartment(insulin-independent glucose utilization); (D), slowly equilibrating com-partment (insulin-dependent glucose utilization).
distribution volume) were then estimated with the use of a nonlinearleast squares estimation technique (29). The accuracy of parameterestimates was again obtained from the inverse of Fisher informationmatrix by solving the differential equation model and the associatedsensitivity system simultaneously (24) (Table I). A number of otherkinetic parameters were calculated from the compartment model.These include the mean total residence time (MRT,) (min), the steady-state plasma-equivalent distribution volume (VD) (ml/kg), and poolsizes Q1, Q2, and Q3 (mg/kg).
Statistical analysis. Numerical values are presented as mean±SEM.The paired t test was used to compare population means.
Results
Arterialized plasma glucose concentration was 88±3 mg/100ml in the fasting state, showed no change during the 150 minfollowing the injection of the first bolus of tracer, and wasclamped at 87±3 mg/100 ml during the last 90 min of insulininfusion (Fig. 3). Fasting plasma insulin levels (14±2 MU/ml)also remained unchanged until 150 min, when they wereacutely raised, and maintained at -110IU/ml throughoutthe study (Fig. 3). Exogenous glucose was infused at increasingrates to sustain euglycemia (Fig. 3). Over the last 90 min ofthe experiment, i.e., through the period of sampling of thesecond bolus of tritiated glucose, the glucose infusion rate rosefrom 7.63±0.60 to 8.77±0.95 mg/min kg (or by 15±10%, t= 1.51, P = NS). The effect of insulin on glucose kinetics,therefore, was assessed under conditions closely approachingthe steady state.
Table L Accuracy ofParameter Estimateswith the Three-compartment Model*
Fasting Insulin
V1 (ml/kg) 7 6K21 (min-') 18 13K,2 (min-') 8 12K3, (min-') 24 10K,3 (min-') 17 26K03 (min-') 29 18
* Values are mean (of six subjects) coefficients of variation of param-eter estimates.
BOLUS 1 BOLUS 2
120
Plasma'Glucose 80o(mg/i0iOm)
40
120
PlasmaInsulin 80(pUU/mI)
40 1
0
1 0
Glucose 8Infusion 6
Rate
(mg/min kg) 4
2
0
-30 0 30 60 90 120150180210240270300330
TIME(min)
Figure 3. Plasma glucose (top) and insulin (middle) concentrations,and rates of exogenous glucose infusion (bottom) in six normalsubjects in the basal state and during insulin administration (1 mU/min kg, started at 150 min).
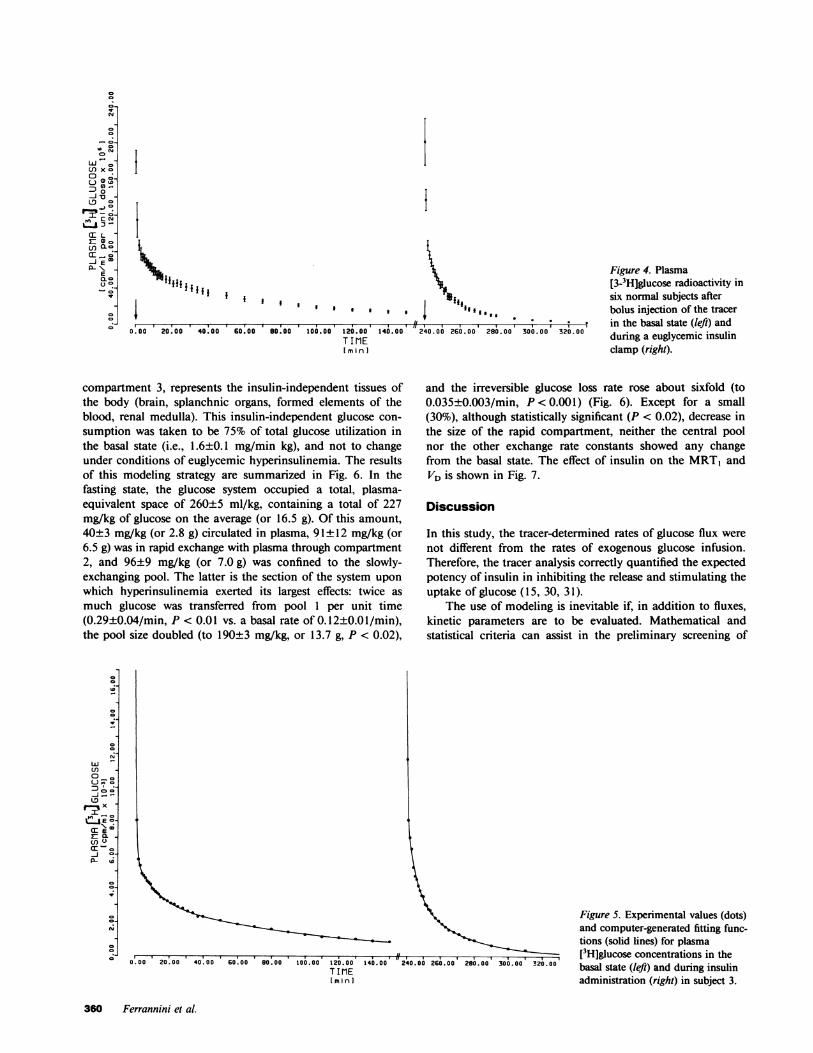
The injected tracer glucose disappeared from plasma at amuch faster rate during insulin administration than in thefasting state (Fig. 4). Three exponential terms fitted either setof isotopic data better than two exponentials (by least squaresanalysis). Both basally and after insulin, the time-activity curvewas highly nonlinear (Fig. 5). The PCR ofglucose was calculatedto be 2.47±0.12 ml/min kg in the fasting state, and 9.08±0.89ml/min kg during insulin infusion. The corresponding valuesfor glucose disposal rate are 2.15±0.12 and 7.96±0.85 mg/min kg. Since the total rate of glucose appearance calculatedfrom the tracer data was not significantly different from themean exogenous glucose infusion rate over the last 90 min ofinsulin infusion, endogenous glucose production must havebeen completely suppressed. The estimates of total glucosedisposal derived from the clamp (7.99±0.72 mg/min kg) andthose obtained from the isotope data (7.96±0.85 mg/min kg)correlated strongly with each other (r = 0.89, P < 0.05).
The model. In the three-compartment model chosen (Fig.2), new glucose (endogenous as well as exogenous) initiallyenters in the plasma, and subsequently distributes into twoother body compartments. Since glucose is known not to beconsumed in the plasma, no irreversible loss path was connectedwith this compartment. Glucose, however, was assumed to beirreversibly removed from both compartments 2 and 3. It wasfurther assumed that compartment 2, which exchanges withthe central (plasma) compartment more rapidly than does
Modeling of Glucose Kinetics 359
I
0.00 0 I.00 .0.00 20.00 40.00
I 0I
60.00 80.00 100.00 120.00 1400.00TIMIE[m in I
/1. I.. . a . . . .12240.00 260.00' 200.00' 300.00 320.00
Figure 4. Plasma[3-3H]glucose radioactivity insix normal subjects afterbolus injection of the tracerin the basal state (left) andduring a euglycemic insulinclamp (right).
compartment 3, represents the insulin-independent tissues ofthe body (brain, splanchnic organs, formed elements of theblood, renal medulla). This insulin-independent glucose con-sumption was taken to be 75% of total glucose utilization inthe basal state (i.e., 1.6±0.1 mg/min kg), and not to changeunder conditions of euglycemic hyperinsulinemia. The resultsof this modeling strategy are summarized in Fig. 6. In thefasting state, the glucose system occupied a total, plasma-equivalent space of 260±5 ml/kg, containing a total of 227mg/kg of glucose on the average (or 16.5 g). Of this amount,40±3 mg/kg (or 2.8 g) circulated in plasma, 91±12 mg/kg (or6.5 g) was in rapid exchange with plasma through compartment2, and 96±9 mg/kg (or 7.0 g) was confined to the slowly-exchanging pool. The latter is the section of the system uponwhich hyperinsulinemia exerted its largest effects: twice asmuch glucose was transferred from pool 1 per unit time(0.29±0.04/min, P < 0.01 vs. a basal rate of 0.12±0.0 1/min),the pool size doubled (to 190±3 mg/kg, or 13.7 g, P < 0.02),
0lJ0-
rx
20
--
w
en
n o_UI
en-
0-
P- to
42
IV
-0
and the irreversible glucose loss rate rose about sixfold (to0.035±0.003/min, P < 0.001) (Fig. 6). Except for a small(30%), although statistically significant (P < 0.02), decrease inthe size of the rapid compartment, neither the central poolnor the other exchange rate constants showed any changefrom the basal state. The effect of insulin on the MRTI andVD is shown in Fig. 7.
Discussion
In this study, the tracer-determined rates of glucose flux werenot different from the rates of exogenous glucose infusion.Therefore, the tracer analysis correctly quantified the expectedpotency of insulin in inhibiting the release and stimulating theuptake of glucose (15, 30, 31).
The use of modeling is inevitable if, in addition to fluxes,kinetic parameters are to be evaluated. Mathematical andstatistical criteria can assist in the preliminary screening of
Figure 5. Experimental values (dots)and computer-generated fitting func-tions (solid lines) for plasma[3H]glucose concentrations in thebasal state (left) and during insulinadministration (right) in subject 3.
360 Ferrannini et al.
Co
o0-
Ir
._
10
en x o0
0 C_CD
0.0L0
X CYs
T- L-
JEm_LC
Uso
CD
CTj
g ***************~~~~~~~~~~~~ .#***. I*0.00 20.00 40.00 60.00 80.00 100.00 t20.00 140.00 240..00 26.00 280.00 300.00 320.00
TIME[minI
II

ENDOGENOUS GLUCOSEPRODUCTION
TRACER*\
FASTING |969 40±3 91±12mglkg Z mgikg m glkg
0.12 t0.01 0.46t00
0.006!0.003 SAMPLING 0.019 0.003
ENDOGENOUS GLUCOSEIPRODUCTION
COLD GLUCOSE INFUSIONTRACER' (7.99t0.72 mg/min ka)
\.t\1OOO 10
y.0
INSULIN (10+230 |40t 4 61t5I mglkg mgikg mg/kg
0.0350.003 SAMPLING 0.02 7±0.002
Figure 6. The three-compartment glucose model with the meanpopulation values for masses and exchange constants in the basalstate (top) and during steady-state euglycemic hyperinsulinemia (bot-tom). Rate constants are in units per minute; mean±SEM, n = 6.
possible models. The ultimate selection, however, must restupon the physiological compatibility and significance of themodel. Our rather extensive trial of compartment models (25)showed that (a) if sampled frequently enough, tracer glucosedata can be satisfactorily incorporated into detailed physiologicalmodels; (b) the use of only two compartments neglects theinformation carried by the initial downslope of the plasmatracer disappearance curve; (c) of three compartments, the first(central) one is, by size, identifiable as the plasma volumequite closely; (d) in addition to the central compartment, twoother pools, a rapidly exchanging one and a slowly exchangingone, are evident in all the cases. Note that the noncompart-
BASAL INSULIN
120 r
MeanResidenceTime(min)
80 1
40 1
0
mental analysis, although theoretically compatible with thedata (1, 32), is largely inadequate to describe glucose kinetics.In fact, the assumptions inherent in the noncompartmentalapproach, i.e., that glucose is directly utilized in the plasma oris removed by tissues that exchange so rapidly with plasmathat they are kinetically indistinguishable from it, do not holdtrue.
In the resting, postabsorptive state, the brain, the splanchnicorgans, and the kidneys collectively receive over 2/3 of cardiacoutput, whereas skeletal and cardiac muscle account for <20%of cardiac output (Table II). Per unit of tissue weight, bloodflow to muscle and fat (-4 ml/min per 100 g of tissue) ismuch less than to the brain (-60 ml/min 100 g) or thesplanchnic organs (- 100 ml/min 100 g) or the heart (100 ml/min 100 g) (33). Since the velocity of glucose transfer acrosscapillary membranes is about 25 times greater than the linearblood flow in the vessel (33), the amount of glucose reachingthe interstitia of the various tissues is only limited by thecapillary surface area, i.e., by the blood flow per unit of tissueweight. Thus, the brain is exposed to about 15 times moreglucose than the muscle per unit time. Glucose is readily takenup into cells of the cerebral, splanchnic, and renal tissues byfacilitated diffusion; erythrocytes quickly equilibrate with plasmaglucose (34). Therefore, it seems possible to assimilate thesehighly vascularized structures with a glucose kinetic compart-ment in rapid exchange with plasma. The cumulative glucosedisposal by these tissues in the basal state can be estimated at1.5-1.7 mg/min kg (Table II and Fig. 6). Insulin does notstimulate glucose uptake by the splanchnic organs (15), eryth-rocytes (34), or the renal medulla (35). The effect of thehormone on brain glucose uptake is still somewhat controversial(36-39), but the weight of the evidence seems to favor theconcept that cerebral glucose utilization is insulin-independent.Consequently, the rapid compartment can be further identifiedas an insulin-independent pool. Under conditions of constantglycemia, any effect of hyperinsulinemia must then be exertedon the slow compartment. In other words, any model havingonly central (plasma) loss paths (e.g., the noncompartmentalmodel) is insufficient to account for known patterns of plasmaglucose disposition. On the other hand, a three-compartmentmodel featuring insulin-independent and insulin-dependentglucose losses is compatible with tracer kinetic data and
Table II. Summary ofBlood Flow and Glucose Uptake Rates byIntact Organs ofHuman in the Basal, Postabsorptive State*
Glucose GlucoseBlood flow Blood flow uptake uptake
mil/min kg % ofcardiacoutput
mg/min kg % oftotal
Brain (46)Splanchnic organs (15)Kidneys (35)Muscle (47, 48)Heart (49)Erythrocytes (34)Other
Total
12 15 1.221 26 0.516 20 <0.113 16 0.32 3 0.09- - 0.0616 20 <0.01
80 100 2.2 100
Figure 7. Mean residence time and total distribution volume ofglucose in six normal subjects in the basal and insulinized state. Datacalculated according to the model in Fig. 6.
* The numbers in parenthesis indicate the source reference. Rates are per kilo-
gram of body weight. Average, rounded-off values are given.
Modeling of Glucose Kinetics 361
TotalDistributionVolume(ml/kg)
400
300 vos0 51
200-
1 00
01
5523<11443
<1

incorporates current notions on the circulatory dynamics andmodes of glucose disposition in the various tissues of the body.
Insel et al. (12) also developed a kinetic model for glucosehaving three compartments with a parallel connection. Likeus, these authors featured two modes of glucose loss, oneinsulin-independent (or of zero order), the other insulin-dependent. Our results, however, differ from those of the studyof Insel et al. in several respects. First, their rates of glucoseproduction in the fasting state averaged 1.7 mg/min kg, andwere incompletely suppressed (70%) during a 1-mU/min kgeuglycemic insulin clamp. We and others (15, 30, 31, 40), onthe contrary, find higher values for basal endogenous glucoserelease (2.0-2.4 mg/min kg), and complete inhibition byinsulin levels comparable to those achieved in that study. Thisdiscrepancy could be explained by their using ['4C]glucose asthe tracer. Although a correction for recycling of tracer glucosewas applied, the choice of the isotope remains a potentialsource of difference. Second, their data were inadequate todefine the initial space of distribution of glucose, which thereforehad to be assumed. In the present experiments, we sampledthe early time period very frequently, the first blood samplebeing obtained 30 s after the beginning of tracer injection.This design, coupled with precise determination of plasmaglucose radioactivity, made it possible to identify the initialdistribution volume of glucose in every subject quite confidently,both before and after insulin administration. Third, the valuesfor VD in the basal state obtained in this and many otherstudies (3, 4, 9, 40) are higher (25% vs. 20% of body wt) thanthose reported by Insel et al., regardless of the computationalmethod. Finally, in Insel's study (as in ours) it was anticipatedthat insulin would control glucose transport from the slowlyexchanging, insulin-independent glucose compartment; how-ever, in subjects displaying a large insulin effect, the tracerdata were incompatible with a rapid enough supply of glucoseto this compartment. Our slow pool exchanged with plasmasignificantly more rapidly than Insel's slow pool already in thebasal state (0.12±0.01 vs. 0.07±0.02 min-') and in no casedid it restrain glucose arrival to this compartment duringinsulin infusion.
Having thus determined a likely structure for the glucosesystem (Fig. 6), the major finding of this study was the effectof insulin on overall glucose kinetics. In addition to theexpected stimulation of total glucose uptake, insulin adminis-tration brought about a significant increase in the size of thetotal distribution volume of glucose, which was confined to itsslowly-exchanging, insulin-sensitive section. On theoreticalgrounds, this finding has three potential explanations. (a) Thephysical space of glucose distribution is truly expanded, andglucose is contained in this pool at the same concentration asin plasma. This event is, however, highly unlikely, because itwould entail an actual weight gain of 5 kg in a 70-kg man, orthe transfer of five liters of fluid from the intracellular to theextracellular compartment. Quite to the contrary, during aeuglycemic insulin clamp the water balance is only slightlypositive (DeFronzo et al., unpublished observations), andsodium and potassium are driven into the cells (42). (b) Thesize of the slowly-exchanging compartment is unchanged butglucose is here contained at twice the concentration of plasmaglucose. Although this possibility cannot be ruled out, it isdifficult to envision how a concentration gradient between theinterstitium of muscle and the plasma would be created andmaintained in the absence of changes in blood flow, venous
return, or lymphatic drainage. (c) The intracellular spacebecomes accessible to glucose, and part of the intracellularwater exchanges with extracellular glucose. Insulin has longbeen known to increase the volume of distribution of severalhexoses and pentoses in the body water by accelerating theirtransfer into cells (1). Intracellular free glucose concentrationsare normally close to zero and glucose transport is rate-limitingfor glucose utilization. Insulin enhances glucose transport intodiaphragm, heart, and skeletal muscle, but not into brain, inthe rat (43) and the dog (44) without altering the volume ofthe extracellular water. When glucose transport is stimulatedstrongly, phosphorylation becomes the rate-limiting step inglucose metabolism, and free glucose builds up in the cell (45).This free glucose can flow back out of cells, thereby contributingto what is measured as the exchangeable glucose pool inkinetic experiments. Several lines of evidence support thisinterpretation. Direct measurements of leg glucose uptakeduring a 1-mU/min kg insulin clamp have made it possible tocalculate that 85% of the infused glucose is taken up by muscle(15). In the present analysis, glucose loss from the slowcompartment amounted to 83% of total glucose loss duringinsulin administration. In addition, only the slow glucose poolwas expanded in the insulinized state, whereas the size of therapid pool was not much affected, as would be predicted forinsulin-insensitive glucose pathways. Finally, a strong correla-tion was found between glucose removal and the increase ofthe slow pool itself (r = 0.92, P < 0.01, Fig. 8), suggesting thatthis effect of insulin on glucose distribution is rate-dependent,and may become detectable only at high (>6 mg/min kg) ratesof glucose disposal. Note that, if the insulin-mediated glucoseuptake is assumed to move from the rapid compartmentinstead of the slow pool, insulin still enhances glucose removal10-fold, but fails to affect the pool size (77±10 vs. 86±8 mg/kg, data not shown).
In summary, when both kinetic and physiologic informationis used, it is possible to develop a minimum-assumptioncompartmental model for the glucose system. When testedunder controlled conditions of hyperinsulinemia, the modelindicates significant changes in the size of the insulin-sensitivepool, probably due to the accumulation of free glucose in theintracellular water of muscle tissue. There are important
250
0-1
E
azwz
4Iu
200
1 50
100
50
0
/8/
/5/
100~~~~~~~~~~~~
/5
n1)6 8 10 12 14
PCR
(mI/min.kg)Figure 8. Relationship between the change in the slow pool size (3 inFig. 6) from the basal to the insulinized state and total glucosedisposal. y = -170 + 29x; r = 0.92; P < 0.01.
362 Ferrannini et al.

implications of this analysis. First, turnover calculations in thenonsteady state cannot be based simply on the assumptionthat the glucose system is invariant with respect to size andexchange rates (41). More experimentation is needed to establishthe kinetic behavior of the glucose system under conditionsencountered in normal and disease states. For instance, theeffect of hyperglycemia on glucose kinetics should be studied,together with its implications for the diabetic state. Secondly,glucose disappearance from plasma should not be invariablythought of as glucose utilization. Our analysis suggests that, athigh rates of transport, some of the glucose removed from thecirculation may not be immediately metabolized, but may besequestered as such within the cells to be utilized at latertimes. By taking the current average figures, it can be calculatedthat roughly 90 mg/kg of glucose accumulated in the slowpool between the two measurements of the VD of glucose;from this it follows that 14% of the exogenous glucose requiredto maintain euglycemia is not to be accounted for by eitherglycogen deposition or glucose breakdown, and should beexcluded from energy balance calculations.
Appendix
The identifiability analysis yields for the model and tracer experimentof Fig. 2 the following transfer function (24):
H11(s) = 03S + #2 + 0 (1s3 + a3S2 + a2S + a'
where #I, fl2, fl3, a,, a2, and a3 are known constants.Six equations are therefore available to solve for the six transfer
rate parameters kj and the initial distribution volume V1. Theseequations (24, p. 136) show that the model is not identifiable. Thefollowing parameter combinations, however, are uniquely identifiableonce compartments 2 and 3 have been chosen as the fast and slowpool, respectively:
VIn= 1/X3 (2)
-(k21 + k3) = -a3 + /36/0 = kI1 (3)
fi2/03 - (fj2/#32 - 401f3-(kO2 + k 2)=-2$3,2 = k (4)
-02/#3 + r(02/3Y) -40-(ko3 + k,3) = A~a3 :2 = k33 (5)
k22(k1I + k33) - a2k22 - (6)
k22 - k33
= -k3(k11 + k22) + a2k33 + a, (k22 - 3
The six equations 2-7 are independent in the seven unknownparameters. To reach unique identifiability of the parameters anotherindependent equation must be considered. Here an a priori constraintwas imposed on the glucose loss from compartment 2 (insulin-independent utilization), which was assumed to be known:
kO2Q2 = U2, (8)
where Q2 is glucose mass in compartment 2 and U'2 is a given con-stant.
As Q2 from tracee steady-state equations is given by
Q2 = _Q= VI * C, (9,-k22 -k22
where Q, is glucose mass in compartment 1 and c is steady-stateplasma glucose concentration, the constraint provides
k21k02 VI = U2/C= U2, (10)
where U2 is a constant.Unique identifiability of kj and VI is now reached from eq.'s 2-7
and 10.Eq. 2 provides VI.From eq. 6 and 10 k21 is provided:
U2 YVIk=-- '
and thus from eq. 6,
k12 = y/k2l.Now from eq. 4 ko2 is provided:
k02 = -k22- k12.
Parameter k3i is determined from eq. 3:
(1 1)
(12)
(13)
(14)ki3-= -kil - k21,
and thus from eq. 7 we have:
k,3= 6/k31-
Finally, from eq. 5 we have:
ko3 -k33- k13.
(15)
(16)
Acknowledgments
We are indebted to Daniela Banti for typing the manuscript.This work was supported in part by National Institutes of Health
grants AM-20495, AM-24092, and RR-125, by Public Health ServiceInternational Research Fellowship 1-F05-TW02716-01, and by a grantfrom the Italian Ministry of Public Education.
References
1. Park, C. R., L. H. Johnson, J. H. Wright, Jr., and H. Batsel.1957. Effect of insulin on transport of several hexoses and pentosesinto cells of muscle and brain. Am. J. Physiol. 191:13-18.
2. Distefano, J. J., III. 1982. Noncompartmental vs. compartmentalanalysis: some bases for choice. Am. J. Physiol. 243:Rl-6.
3. de Bodo, R. C., R. Steele, N. Altszuler, A. Dunn, and J. S.Bishop. 1963. On the hormonal regulation of carbohydrate metabolism.Studies with C14 glucose. Recent Prog. Horm. Res. 19:445-482.
4. Searle, G. C., G. E. Mortimore, R. E. Buckley, and W. A. Reilly.1959. Plasma glucose turnover in humans as studied with C14 glucose.Influence of insulin and tolbutamide. Diabetes. 8:163-173.
5. Hetenyi, G. J., G. A. Wrenshall, and C. H. Best. 1961. Rates ofproduction, utilization, accumulation and apparent distribution spacesof glucose. Diabetes. 10:304-31 1.
6. Atkins, G. L. 1971. Investigation of some theoretical modelsrelating the concentration of glucose and insulin in plasma. J. Theor.Biol. 32:471-494.
7. Norwich, K. H. 1969. Mathematical models of the kinetics ofglucose and insulin in plasma. Bull. Math. Biophys. 31:105-121.
8. Segal, S., M. Berman, and A. Blair. 1961. The metabolism ofC'4-labeled glucose in man and an estimation of the extent of glucosemetabolism by the hexose monophosphate pathway. J. Clin. Invest.40:1263-1279.
9. Gatewood, L. C., E. Ackerman, J. W. Rosevear, and G. D.Molnar. 1970. Modelling blood glucose dynamics. Behav. Sci. 15:72-87.
10. Baker, N., R. A. Shipley, R. E. Clark, and G. E. Incefy. 1959.C'4 studies in carbohydrate metabolism: glucose pool size and rate ofturnover in the normal rat. Am. J. Physiol. 196:245-252.
11. Kronfeld, D. S., C. F. Ramberg, Jr., and D. M. Shames. 1971.
Modeling ofGlucose Kinetics 363

Multicompartmental analysis of glucose kinetics in normal and hypo-glycemic cows. Am. J. Physiol. 220:886-893.
12. Insel, P. A., J. E. Liljenquist, J. D. Tobin, R. S. Sherwin, P.Watkins, R. Andres, and M. Berman. 1975. Insulin control of glucosemetabolism in man. J. Clin. Invest. 55:1057-1066.
13. Bjorntorp, P., and L. Sjostrom. 1978. Carbohydrate storage inman. Speculations and some quantitative considerations. Metabolism.27(Suppl. 2): 1853-1863.
14. DeFronzo, R. A., E. Ferrannini, R. Hendler, J. Wahren, andP. Felig. 1978. Influence of hyperinsulinemia, hyperglycemia, androute of glucose administration on splanchnic glucose exchange. Proc.Nall. Acad. Sci. USA. 75:5173-5177.
15. DeFronzo, R. A., E. Jacot, E. Jequier, E. Maeder, J. Wahren,and J. P. Felber. 1981. The effect of insulin on the disposal ofintravenous glucose. Results from indirect calorimetry and hepatic andfemoral venous catheterization. Diabetes. 30:1000-1007.
16. DeFronzo, R. A., E. Ferrannini, R. Hendler, P. Felig, and J.Wahren. 1983. Regulation of splanchnic and peripheral glucose uptakeby insulin and hyperglycemia in man. Diabetes. 32:35-45.
17. Radziuk, J., and R. Inculet. 1983. The effects of ingested andintravenous glucose on forearm uptake of glucose and glucogenicsubstrate in normal man. Diabetes. 32:977-981.
18. DeFronzo, R. A., J. D. Tobin, and R. Andres. 1979. Glucoseclamp technique: a method for quantifying insulin secretion andresistance. Am. J. Physiol. 237:E214-E223.
19. Katz, J., and A. Dunn. 1967. Glucose-2-T as a tracer forglucose metabolism. Biochemistry. 6:1-5.
20. Katz, J., A. Dunn, M. Chenoweth, and S. Golden. 1974. (a)Determination of synthesis, recycling and body mass of glucose in ratsand rabbits in vivo with 3H- and C'4-labelled glucose. Biochem. J. 142:171-183.
21. Issekutz, B., Jr., M. Allen, and I. Borkow. 1972. Estimation ofglucose turnover in the dog with glucose-2-T and glucose-U-14C. Am.J. Physiol. 222:710-712.
22. Issekutz, T. B., B. Issekutz, Jr., and D. Elahi. 1974. Estimationof hepatic glucose output in non-steady state. The simultaneous use of2-3H-glucose and "4C-glucose in the dog. Can. J. Physiol. Pharmacol.52:215-224.
23. Harwell Subroutine Library, VC04A. 1972. Her Majesty'sStationery Office, London.
24. Carson, E. R., C. Cobelli, and L. Finkelstein. 1983. Mathematicalmodeling of metabolic and endocrine systems. Model Formulation,Identification and Validation. John Wiley, New York.
25. Cobelli, C., G. Toffolo, and E. Ferrannini. 1984. A model ofglucose kinetics and their control by insulin. Compartmental andnoncompartmental approaches. Math. Biosci. 72:291-316.
26. Rescigno, A., and E. Gurpide. 1973. Estimation of averagetimes of residence, recycle and interconversion of blood-borne com-pounds using tracer methods. J. Clin. Endocrinol. Metab. 36:263-276.
27. Radziuk, J., K. H. Norwich, and M. Vranic. 1978. Experimentalvalidation of measurements of glucose turnover in non-steady state.Am. J. Physiol. 234:E84-E93.
28. Atkins, G. L. 1980. A new technique for maintaining andmonitoring conscious, stress-free rabbits in a steady state: its use inthe determination of glucose kinetics. Q. J. Exp. Physiol. Cogn. Med.Sci. 65:63-75.
29. Fletcher, R. 1971. A modified Marquardt subroutine fornonlinear least squares. In Atomic Research Establishment. Report RAERE-R 6799. Her Majesty's Stationery Office, London.
30. Kolterman, 0. G., J. Insel, M. Saekow, and J. M. Olefsky.1980. Mechanisms of insulin resistance in human obesity. Evidencefor receptor and postreceptor defects. J. Clin. Invest. 65:1272-1284.
31. Rizza, R. A., L. J. Mandarino, and J. E. Gerich. 1981. Dose-response characteristics for effects of insulin on production and utili-zation of glucose in man. Am. J. Physiol. 240:E630-E639.
32. Cobelli, C., and G. Toffolo. 1984. Compartmental vs. noncom-partmental modeling for two accessible pools. Am. J. Physiol. 247:R488-R496.
33. Guyton, A. C. 1971. Textbook of Medical Physiology. W. B.Saunders Company, Philadelphia, PA. Fourth ed. 359-378.
34. Murphy, J. R. 1960. Erythrocyte metabolism. The equilibrationof glucose-C'4 between serum and erythrocytes. J. Lab. Clin. Med. 55:281-302.
35. Lee, J. B., V. K. Vance, and G. F. Cahill. 1962. Metabolismof C'4-labeled substrates by rabbit kidney cortex and medulla. Am. J.Physiol. 203:27-36.
36. Reinmuth, 0. M., P. Scheinberg, and B. Bourne. 1965. Totalcerebral blood flow and metabolism. Arch. Neurol. 12:49-66.
37. Scheinberg, P. 1965. Observations on cerebral carbohydratemetabolism in man. Ann. Intern. Med. 62:367-371.
38. Owen, 0. E., A. P. Morgan, H. G. Kemp, J. M. Sullivan,M. G. Herrera, and G. F. Cahill. 1967. Brain metabolism duringfasting. J. Clin. Invest. 46:1589-1595.
39. Ahlborg, G., and J. Wahren. 1972. Brain substrate utilizationduring prolonged exercise. Scand. J. Clin. Lab. Invest. 29:397-402.
40. Tserng, K., and S. C. Kalhan. 1983. Estimation of glucosecarbon recycling and glucose turnover with U-'3C-glucose. Am. J.Physiol. 245:E476-E482.
41. Cobelli, C., A. Ruggeri, G. Toffolo, A. Avogaro, and R.Nosadini. 1983. Is the "pool-fraction" paradigm a valid model forassessment of in vivo turnover in non-steady state? Am. J. Physiol.245:R624-R632.
42. DeFronzo, R. A., C. R. Cooke, R. Andres, G. R. Faloona, andP. J. Davis. 1975. The effect of insulin on renal handling of sodium,potassium, calcium, and phosphate in man. J. Clin. Invest. 55:845-855.
43. Park, C. R., and L. H. Johnson. 1975. Effect of insulin ontransport of glucose and galactose into cells of rat muscle and brain.Am. J. Physiol. 182:17-26.
44. Levine, R., M. S. Goldstein, B. Huddlestun, and S. Klein.1950. Action of insulin on the "permeability" of cells to free hexoses,as studied by its effects on the distribution of galactose. Am. J. Physiol.163:70-81.
45. Park, C. R., D. Reinwein, M. J. Henderson, E. Cadenas, andH. E. Morgan. 1959. The action of insulin on the transport of glucosethrough the cell membrane. Am. J. Med. 26:674-684.
46. Scheinberg, P., and E. A. Stead, Jr. 1949. The cerebral bloodflow in male subjects as measured by the nitrous oxide technique.Normal values for blood flow, oxygen utilization, glucose utilization,and peripheral resistance, with observations on the effect of tilting andanxiety. J. Clin. Invest. 28:1163-1171.
47. Andres, R., G. Cader, and K. L. Zierler. 1956. The quantitativelyminor role of carbohydrate in oxidative metabolism by skeletal musclein intact man in the basal state. Measurements of oxygen and glucoseuptake and carbon dioxide and lactate production in the forearm.J. Clin. Invest. 35:671-682.
48. Rabinowitz, D., and K. L. Zierler. 1962. Forearm metabolismin obesity and its response to intra-arterial insulin. Characterization ofinsulin resistance and evidence for adaptive hyperinsulinemia. J. Clin.Invest. 41:2173-2181.
49. Neely, J. R., and H. E. Morgan. 1974. Relationship betweencarbohydrate and lipid metabolism and energy balance of heart muscle.Ann. Rev. Physiol. 36:413-440.
364 Ferrannini et al.