Embed Size (px)
Citation preview

94:1541-1553, 2005. First published Mar 23, 2005; doi:10.1152/jn.01177.2004 JNJenny C. A. Read and Bruce G. Cumming Pulfrich Effect Neurons: Relationship to Stereoacuity and the Effect of Interocular Delay on Disparity-Selective V1
You might find this additional information useful...
59 articles, 17 of which you can access free at: This article cites http://jn.physiology.org/cgi/content/full/94/2/1541#BIBL
including high-resolution figures, can be found at: Updated information and services http://jn.physiology.org/cgi/content/full/94/2/1541
can be found at: Journal of Neurophysiologyabout Additional material and information http://www.the-aps.org/publications/jn
This information is current as of May 24, 2006 .
http://www.the-aps.org/.American Physiological Society. ISSN: 0022-3077, ESSN: 1522-1598. Visit our website at (monthly) by the American Physiological Society, 9650 Rockville Pike, Bethesda MD 20814-3991. Copyright © 2005 by the
publishes original articles on the function of the nervous system. It is published 12 times a yearJournal of Neurophysiology
on May 24, 2006
jn.physiology.orgD
ownloaded from

Effect of Interocular Delay on Disparity-Selective V1 Neurons: Relationshipto Stereoacuity and the Pulfrich Effect
Jenny C. A. Read and Bruce G. CummingLaboratory of Sensorimotor Research, National Eye Institute, National Institutes of Health, Bethesda, Maryland
Submitted 15 November 2004; accepted in final form 15 March 2005
Read, Jenny C. A. and Bruce G. Cumming. Effect of interoculardelay on disparity-selective V1 neurons: relationship to stereoacuityand the Pulfrich effect. J Neurophysiol 94: 1541–1553, 2005. Firstpublished March 23, 2005; doi:10.1152/jn.01177.2004. The temporalproperties of disparity-sensitive neurons place important temporalconstraints on stereo matching. We examined these constraints bymeasuring the responses of disparity-selective neurons in striatecortex of awake behaving monkeys to random-dot stereograms thatcontained interocular delays. Disparity selectivity was gradually abol-ished by increasing interocular delay (when the delay exceeds theintegration time, the inputs from the 2 eyes become uncorrelated). Theamplitude of the disparity-selective response was a Gaussian functionof interocular delay, with a mean of 16 ms (�5 ms, SD). Psycho-physical measures of stereoacuity, in both monkey and human ob-servers, showed a closely similar dependency on time, suggesting thattemporal integration in V1 neurons is what determines psychophysicalmatching constraints over time. There was a slight but consistentasymmetry in the neuronal responses, as if the optimum stimulus isone in which the right stimulus leads by about 4 ms. Because allrecordings were made in the left hemisphere, this probably reflectsnasotemporal differences in conduction times; psychophysical dataare compatible with this interpretation. In only a few neurons (5/72),interocular delay caused a change in the preferred disparity. Suchtilted disparity/delay profiles have been invoked previously to explaindepth perception in the stroboscopic version of the Pulfrich effect (andother variants). However, the great majority of the neurons did notshow tilted disparity/delay profiles. This suggests that either theactivity of these neurons is ignored when viewing Pulfrich stimuli, orthat current theories relating neuronal properties to perception in thePulfrich effect need to be reevaluated.
I N T R O D U C T I O N
In computing depth from binocular disparity, it is firstnecessary to deduce which image feature in one eye corre-sponds to a given feature in the other eye. Most studies of thisproblem have focused on spatial properties of the image(Hayashi et al. 2004; Marr and Poggio 1979; Pollard et al.1985; Qian 1994; Read 2002; Tsai and Victor 2003). However,when the visual scene is changing, temporal information canprovide important constraints (Burr and Ross 1979; Chen et al.2001; Julesz and White 1969; Qian and Andersen 1997; Ross1974). The images of a stationary object should appear simul-taneously in both eyes. Moving objects can give rise to iden-tical images appearing with an interocular delay, a principlethat forms the basis of classical explanations for the Pulfricheffect (Julesz and White 1969; Pulfrich 1922). However, howthese temporal constraints are implemented in the brain re-mains unclear. In this study, we aimed to relate temporal
aspects of stereo psychophysics to the properties of disparity-selective neurons in primary visual cortex.
Psychophysical studies using interocular delay suggest that thestereo system integrates information over a period of about 50 ms(Julesz and White 1969; Lee 1970; Morgan 1979; Ross andHogben 1975, 1974). It is currently unclear how this relates toneuronal properties. One problem is that the psychophysicalstudies have generally not expressed their results in terms of aquantitative neuronal model (e.g., if neurons had a Gaussiantemporal integration kernel, it is unclear what SD would beimplied by the psychophysics). Physiological studies have eithernot quantified binocular integration time at all or not provided apopulation mean. Finally, there is considerable variation betweencells and across species (Anzai et al. 2001; Gardner et al. 1985;Pack et al. 2003; Pettigrew et al. 1968). For all these reasons, it iscurrently difficult to assess the extent to which neuronal responsesaccount for psychophysical behavior.
A second point of interest concerns the underlying mecha-nisms of temporal integration. In standard models of V1neurons, such as the energy model (Ohzawa et al. 1990), thebinocular integration time, derived from the response to cyclo-pean stimuli with an interocular delay, follows straightfor-wardly from the monocular integration time calculated fromthe response to monocular contrast stimuli (Chen et al. 2001).It is not clear whether this relationship holds in real neurons.
Finally, much work on the temporal aspects of stereopsis hasbeen stimulated by the observation that viewing a movingobject with interocular delay causes it to appear in depth (thePulfrich effect). Modern explanations of this illusion invokedisparity detectors in which interocular delays cause changes inthe preferred disparity (Anzai et al. 2001; Carney et al. 1989;Morgan and Castet 1995; Morgan and Fahle 2000; Morgan andTyler 1995; Pack et al. 2003; Qian 1997; Qian and Andersen1997). Such neurons are common in cat area 17/18 (Anzai et al.2001) and monkey MT (Pack et al. 2003), but appear to be lesscommon in monkey V1 (Pack et al. 2003). However, thesignificance of these neurons remains unclear, for severalreasons. First, the studies measured receptive fields with areverse-correlation technique, using one-dimensional dichopticnoise (Anzai et al. 2001) or bar stimuli (Pack et al. 2003). Thisdepends on the assumption that the cells are linear in space andtime; the effect of delay on disparity tuning has not been testeddirectly. Second, because the stimuli were oriented parallel tothe neuron’s preferred orientation, cells tuned to horizontalorientations were probed with vertical disparity. The likelyeffect on depth perception of shifts in preferred vertical dis-
Address for reprint requests and other correspondence: J.C.A. Read, 49/2A50Convent Drive, Bethesda, MD 20892-4435 (E-mail: [email protected]).
The costs of publication of this article were defrayed in part by the paymentof page charges. The article must therefore be hereby marked “advertisement”in accordance with 18 U.S.C. Section 1734 solely to indicate this fact.
J Neurophysiol 94: 1541–1553, 2005.First published March 23, 2005; doi:10.1152/jn.01177.2004.
1541www.jn.org
on May 24, 2006
jn.physiology.orgD
ownloaded from

parity is unclear. Third, for those cells where interocular delaydoes cause shifts in preferred disparity, it is unclear how thisrelates to motion sensitivity. In standard linear models, such asthe binocular energy model (Ohzawa et al. 1990), neuronswhose preferred disparity changes with interocular delay musthave tilted receptive fields, i.e., they must encode direction ofmotion as well as disparity (Chen et al. 2001; Qian andAndersen 1997). For this reason such cells are commonlyreferred to as joint disparity/motion sensors. The studies byAnzai, Pack, and colleagues did not quantify whether thedelay-induced shifts in preferred disparity in V1 could bepredicted from direction selectivity, so it is unclear whethertheir results are compatible with standard models. If they are,then the finding that delay-induced shifts in preferred disparityare more common in cat A17/18 and monkey MT than inmonkey V1 may simply reflect the well-documented fact thatdirection-selective cells are less common in monkey striatecortex (Casanova et al. 1992; DeValois et al. 1982; Gizzi et al.1990; Hamilton et al. 1989; Hawken et al. 1988).
Thus the current data permit a very simple interpretation:that joint encoding of disparity and motion is found only withdirection selectivity. If correct, this would raise an interestingpuzzle about the role of disparity-selective neurons in V1 thatare not direction selective. Modern theories of the Pulfricheffect use only joint motion/disparity sensors, ignoring dispar-ity-selective cells that are nondirectional. The implication isthat these cells do not contribute to depth perception, despitethe disparity signal they carry. Before this puzzle can beaddressed, it is first necessary to substantiate this simpleinterpretation of the physiological data.
To explore all these issues, we examined the interaction be-tween temporal delay and disparity tuning in neurons’ responsesto random-dot stereograms. We aimed to answer 3 main ques-tions. 1) What is the temporal window over which neuronsintegrate binocular information? 2) Does this explain the temporalintegration observed psychophysically? 3) Does interocular delayshift tuning for horizontal disparity, and is this as expected fromdirection selectivity? Importantly, we compared neuronal proper-ties with psychophysical results in the same animals. This enablesus to explore both whether the results can be explained mecha-nistically with simple models and also whether they are compat-ible with psychophysical performance. In this way, physiologicalrecording helps bridge the gap between our understanding of earlyvisual mechanisms and perceptual experience.
M E T H O D S
Recording
STIMULI Two adult male macaque monkeys were implanted undergeneral anesthesia with scleral search coils in both eyes, a head-restraining post, and a recording chamber placed over the operculumof V1. Glass-coated platinum–iridium electrodes (FHC) were placedtransdurally each day. All protocols were approved by the InstituteAnimal Care and Use Committee and complied with Public HealthService policy on the humane care and use of laboratory animals.
Stimuli were generated on a Silicon Graphics Octane workstationand presented on 2 Eizo Flexscan F980 monitors (mean luminance41.1 cd/m2, contrast 99%, frame rate 72 Hz) viewed by a Wheatstonestereoscope. At the viewing distance used (89 cm) each pixel in the1,280 � 1,024 display subtended 1.1 min arc, and antialiasing wasused to render with subpixel accuracy. The monkeys initiated a
stimulus presentation by maintaining fixation on a binocularly pre-sented spot to within �1°. They were required to maintain fixation for2.1 s to earn a fluid reward. During each such trial, 4 stimuli werepresented, each lasting 420 ms, separated by 100 ms.
In the experiments probing disparity tuning, the stimuli wererandom-dot stereograms composed of black and white dots in equalproportions (dot size 0.1° square), presented against a gray back-ground. The dot density was sufficient to cover 50% of the graybackground but, because the dots were allowed to overlap oneanother, the total coverage was somewhat �50%. A central disparateregion was presented within a larger surround, to remove monocularclues to disparity. The stimulus size was almost always 3 � 3° for thecentral disparate region and 4.5 � 4.5° for the surround; for a fewcells, these values were altered slightly to optimize the cell’s response.On each new video frame, a new pattern of random dots waspresented. A single 420-ms stimulus therefore contained a sequence of30 different random-dot patterns. Interocular delay was manipulatedby shifting the sequence of dot patterns shown in one eye. Thus ifframes 0–29 were shown to the left eye while frames 1–30 wereshown to the right eye, this is described as an interocular delay of oneframe (positive delays indicate that the right eye is shown any one dotpattern first). The first few frames of such a sequence are shown inFig. 1. Note that on the first frame of such a sequence, the right eyewas shown frame 1, whereas the left eye was shown a dot pattern thatwas never presented to the right eye. This ensured that the stimulusonset and offset did not change with interocular delay.
Drifting grating stimuli were used to measure the cell’s directionselectivity. The orientation and spatial frequency were varied to findthe optimum grating stimulus, and then the cell’s direction selectivitywas assessed by recording responses to this grating as it drifted ineither direction. The grating stimuli were usually 3 � 3°, although fornearly half of cells this had to be reduced to maintain responsiveness.The stimulus was always kept larger than 1 � 1°, to minimize thedisruption caused by small fixational eye movements.
Data analysis
The variance of neuronal spike counts is typically proportional tothe mean spike count (Dean 1981). To avoid having to correct for thechanging variance, we performed all our analysis on the square root ofneuronal firing rates. (Because the stimulus duration was the same forall stimuli, this is equivalent to using spike counts.) The variance ofthe transformed firing rates is roughly independent of the mean,greatly simplifying the analysis (Prince et al. 2002). We write ri(�, �)
FIG. 1. Random-dot stereograms with an interocular delay. This shows thesequence of randomly generated images presented to each eye, for an inter-ocular delay of �1 frame (14 ms). On each frame, the random-dot patternviewed by the left eye is the same as that viewed by the right eye on theprevious frame (the pattern is also shifted horizontally to introduce disparity).For clarity, the images used in this sketch have just a few very large dots; thestimuli used in the experiments had many more smaller dots (see METHODS).
1542 J.C.A. READ AND B. G. CUMMING
J Neurophysiol • VOL 94 • AUGUST 2005 • www.jn.org
on May 24, 2006
jn.physiology.orgD
ownloaded from
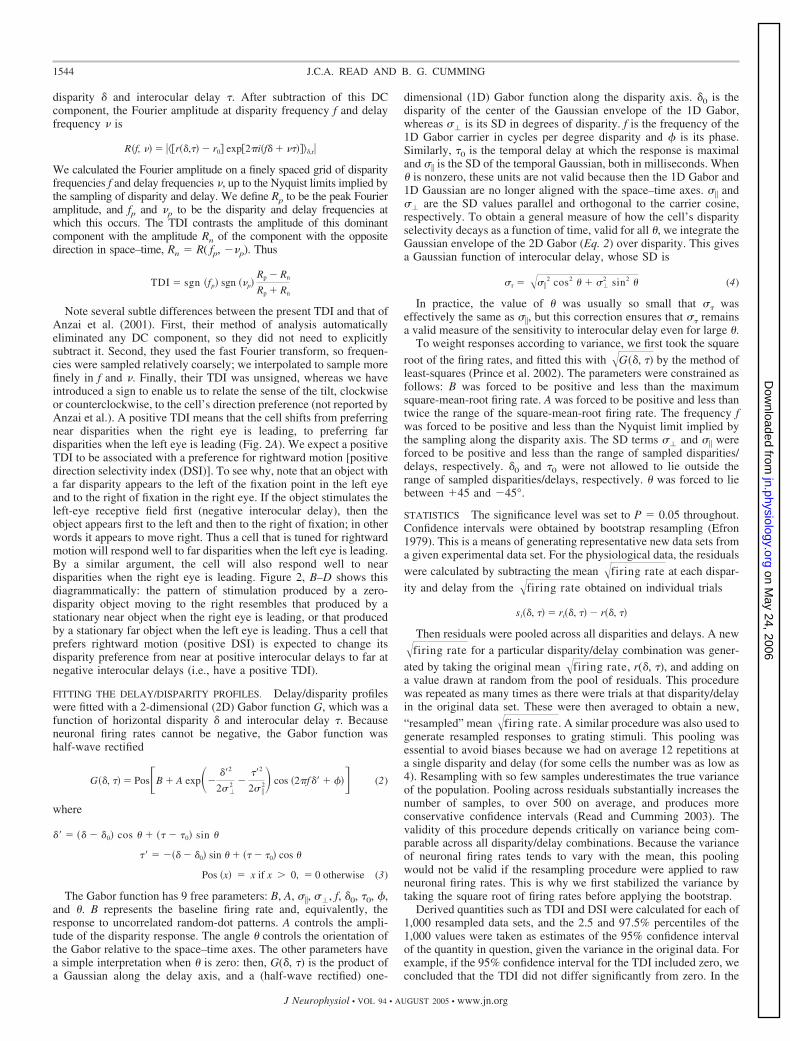
for the �firing rate obtained on the ith trial with disparity � andinterocular delay �, and r(�, �) for the mean value of �firing rateaveraged across all trials with this disparity/delay combination.
DISPARITY DISCRIMINATION INDEX The strength of disparity tuningfor zero interocular delay was determined with the disparity discrim-ination index (DDI; Prince et al. 2002)
DDI �rmax � rmin
rmax � rmin � 2RMSerror
(1)
where r represents the mean value of �firing rate as a function ofdisparity at zero interocular delay, rmax is the mean �firing rate atthe preferred disparity, and rmin is the mean �firing rate at the nulldisparity. RMSerror is the square root of the residual variance aroundthe means across the whole tuning curve. This is a contrast measurein which the range of the response is compared with the range plus itsvariability. Prince et al. (2002) showed in some detail that the use of�firing rate ensures that the index is not distorted by changes inmean firing rate; without this, cells with smaller mean firing rateswould appear more disparity-selective.
DIRECTION SELECTIVITY INDEX The strength of direction tuningwas measured with a direction selectivity index (DSI) defined analo-gously to the DDI
�DSI� �rpref � rnull
rpref � rnull � 2RMSerror
where rpref and rnull represent the mean value of �firing rate in thepreferred and null directions, respectively, for the binocular gratingstimulus. RMSerror is the square root of the residual variance aroundthe means across both conditions. The DSI was assigned a positivesign if the direction closest to rightward was preferred and negative ifthe direction closest to leftward was preferred.
TILT DIRECTION INDEX. Disparity tuning curves were obtained forseveral different values of interocular delay. In this way, the cell’sresponse can be plotted as a delay/disparity profile. This is a cell’sfiring rate as a function both of disparity and of interocular delay (see
Fig. 3 for examples). To quantify changes in the cell’s preferreddisparity as a function of interocular delay, we use the tilt directionindex (TDI) introduced by Anzai et al. (2001). The TDI is obtainedfrom the Fourier transform of the delay/disparity profile. First wecompute the DC component
r0 � �r��,����,�
where the angle bracket with subscript �,� indicates averaging over alldisparities � and delays �, and r(�, �) is the mean �firing rate at
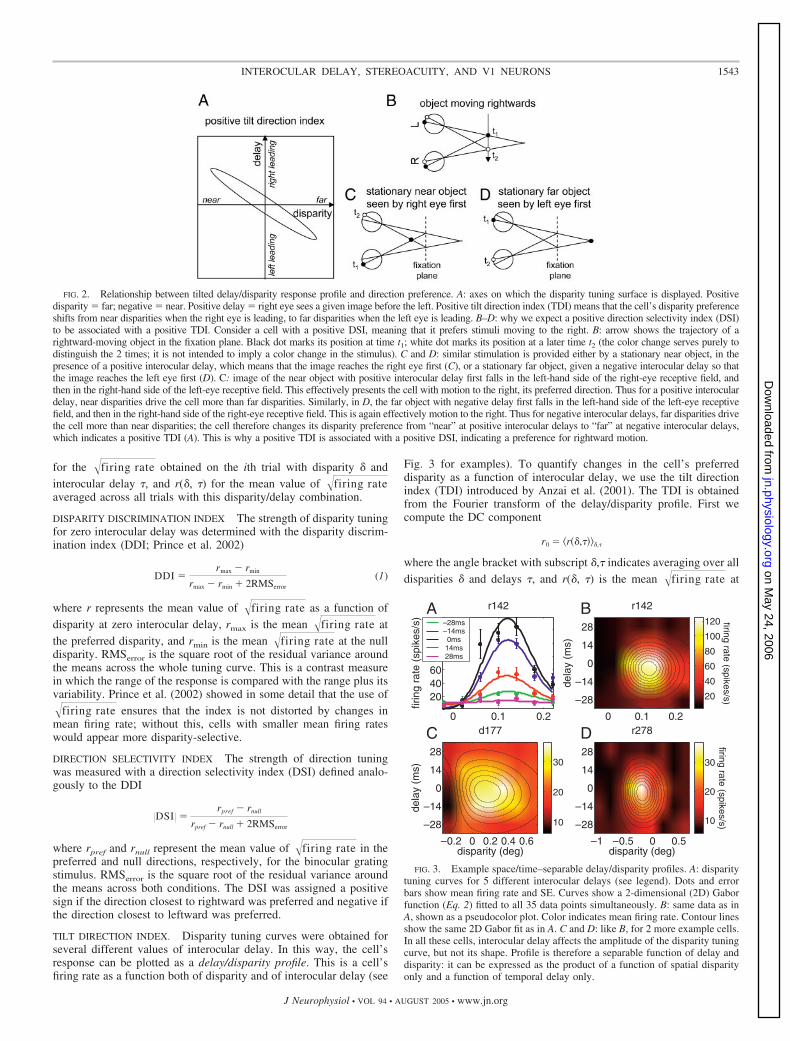
FIG. 2. Relationship between tilted delay/disparity response profile and direction preference. A: axes on which the disparity tuning surface is displayed. Positivedisparity far; negative near. Positive delay right eye sees a given image before the left. Positive tilt direction index (TDI) means that the cell’s disparity preferenceshifts from near disparities when the right eye is leading, to far disparities when the left eye is leading. B–D: why we expect a positive direction selectivity index (DSI)to be associated with a positive TDI. Consider a cell with a positive DSI, meaning that it prefers stimuli moving to the right. B: arrow shows the trajectory of arightward-moving object in the fixation plane. Black dot marks its position at time t1; white dot marks its position at a later time t2 (the color change serves purely todistinguish the 2 times; it is not intended to imply a color change in the stimulus). C and D: similar stimulation is provided either by a stationary near object, in thepresence of a positive interocular delay, which means that the image reaches the right eye first (C), or a stationary far object, given a negative interocular delay so thatthe image reaches the left eye first (D). C: image of the near object with positive interocular delay first falls in the left-hand side of the right-eye receptive field, andthen in the right-hand side of the left-eye receptive field. This effectively presents the cell with motion to the right, its preferred direction. Thus for a positive interoculardelay, near disparities drive the cell more than far disparities. Similarly, in D, the far object with negative delay first falls in the left-hand side of the left-eye receptivefield, and then in the right-hand side of the right-eye receptive field. This is again effectively motion to the right. Thus for negative interocular delays, far disparities drivethe cell more than near disparities; the cell therefore changes its disparity preference from “near” at positive interocular delays to “far” at negative interocular delays,which indicates a positive TDI (A). This is why a positive TDI is associated with a positive DSI, indicating a preference for rightward motion.
FIG. 3. Example space/time–separable delay/disparity profiles. A: disparitytuning curves for 5 different interocular delays (see legend). Dots and errorbars show mean firing rate and SE. Curves show a 2-dimensional (2D) Gaborfunction (Eq. 2) fitted to all 35 data points simultaneously. B: same data as inA, shown as a pseudocolor plot. Color indicates mean firing rate. Contour linesshow the same 2D Gabor fit as in A. C and D: like B, for 2 more example cells.In all these cells, interocular delay affects the amplitude of the disparity tuningcurve, but not its shape. Profile is therefore a separable function of delay anddisparity: it can be expressed as the product of a function of spatial disparityonly and a function of temporal delay only.
1543INTEROCULAR DELAY, STEREOACUITY, AND V1 NEURONS
J Neurophysiol • VOL 94 • AUGUST 2005 • www.jn.org
on May 24, 2006
jn.physiology.orgD
ownloaded from
disparity � and interocular delay �. After subtraction of this DCcomponent, the Fourier amplitude at disparity frequency f and delayfrequency � is
R�f, �� � ��r��,�� � r0� exp2�i�f� � ������,r�
We calculated the Fourier amplitude on a finely spaced grid of disparityfrequencies f and delay frequencies �, up to the Nyquist limits implied bythe sampling of disparity and delay. We define Rp to be the peak Fourieramplitude, and fp and �p to be the disparity and delay frequencies atwhich this occurs. The TDI contrasts the amplitude of this dominantcomponent with the amplitude Rn of the component with the oppositedirection in space–time, Rn R( fp, ��p). Thus
TDI � sgn �fp� sgn ��p�Rp � Rn
Rp � Rn
Note several subtle differences between the present TDI and that ofAnzai et al. (2001). First, their method of analysis automaticallyeliminated any DC component, so they did not need to explicitlysubtract it. Second, they used the fast Fourier transform, so frequen-cies were sampled relatively coarsely; we interpolated to sample morefinely in f and �. Finally, their TDI was unsigned, whereas we haveintroduced a sign to enable us to relate the sense of the tilt, clockwiseor counterclockwise, to the cell’s direction preference (not reported byAnzai et al.). A positive TDI means that the cell shifts from preferringnear disparities when the right eye is leading, to preferring fardisparities when the left eye is leading (Fig. 2A). We expect a positiveTDI to be associated with a preference for rightward motion [positivedirection selectivity index (DSI)]. To see why, note that an object witha far disparity appears to the left of the fixation point in the left eyeand to the right of fixation in the right eye. If the object stimulates theleft-eye receptive field first (negative interocular delay), then theobject appears first to the left and then to the right of fixation; in otherwords it appears to move right. Thus a cell that is tuned for rightwardmotion will respond well to far disparities when the left eye is leading.By a similar argument, the cell will also respond well to neardisparities when the right eye is leading. Figure 2, B–D shows thisdiagrammatically: the pattern of stimulation produced by a zero-disparity object moving to the right resembles that produced by astationary near object when the right eye is leading, or that producedby a stationary far object when the left eye is leading. Thus a cell thatprefers rightward motion (positive DSI) is expected to change itsdisparity preference from near at positive interocular delays to far atnegative interocular delays (i.e., have a positive TDI).
FITTING THE DELAY/DISPARITY PROFILES. Delay/disparity profileswere fitted with a 2-dimensional (2D) Gabor function G, which was afunction of horizontal disparity � and interocular delay �. Becauseneuronal firing rates cannot be negative, the Gabor function washalf-wave rectified
G��, �� � Pos�B � A exp��� 2
2� �2 �
� 2
2� �2� cos �2�f� � �� (2)
where
� � �� � �0� cos � �� � �0� sin
� � ��� � �0� sin � �� � �0� cos
Pos �x� � x if x � 0, � 0 otherwise (3)
The Gabor function has 9 free parameters: B, A, ��, ��, f, �0, �0, ,and . B represents the baseline firing rate and, equivalently, theresponse to uncorrelated random-dot patterns. A controls the ampli-tude of the disparity response. The angle controls the orientation ofthe Gabor relative to the space–time axes. The other parameters havea simple interpretation when is zero: then, G(�, �) is the product ofa Gaussian along the delay axis, and a (half-wave rectified) one-
dimensional (1D) Gabor function along the disparity axis. �0 is thedisparity of the center of the Gaussian envelope of the 1D Gabor,whereas �� is its SD in degrees of disparity. f is the frequency of the1D Gabor carrier in cycles per degree disparity and is its phase.Similarly, �0 is the temporal delay at which the response is maximaland �� is the SD of the temporal Gaussian, both in milliseconds. When is nonzero, these units are not valid because then the 1D Gabor and1D Gaussian are no longer aligned with the space–time axes. �� and�� are the SD values parallel and orthogonal to the carrier cosine,respectively. To obtain a general measure of how the cell’s disparityselectivity decays as a function of time, valid for all , we integrate theGaussian envelope of the 2D Gabor (Eq. 2) over disparity. This givesa Gaussian function of interocular delay, whose SD is
�r � ���2 cos2 � ��
2 sin2 (4)
In practice, the value of was usually so small that �� waseffectively the same as ��, but this correction ensures that �� remainsa valid measure of the sensitivity to interocular delay even for large .
To weight responses according to variance, we first took the squareroot of the firing rates, and fitted this with �G(�, �) by the method ofleast-squares (Prince et al. 2002). The parameters were constrained asfollows: B was forced to be positive and less than the maximumsquare-mean-root firing rate. A was forced to be positive and less thantwice the range of the square-mean-root firing rate. The frequency fwas forced to be positive and less than the Nyquist limit implied bythe sampling along the disparity axis. The SD terms �� and �� wereforced to be positive and less than the range of sampled disparities/delays, respectively. �0 and �0 were not allowed to lie outside therange of sampled disparities/delays, respectively. was forced to liebetween �45 and �45°.
STATISTICS The significance level was set to P 0.05 throughout.Confidence intervals were obtained by bootstrap resampling (Efron1979). This is a means of generating representative new data sets froma given experimental data set. For the physiological data, the residualswere calculated by subtracting the mean �firing rate at each dispar-ity and delay from the �firing rate obtained on individual trials
si��, �� � ri��, �� � r��, ��
Then residuals were pooled across all disparities and delays. A new�firing rate for a particular disparity/delay combination was gener-ated by taking the original mean �firing rate, r(�, �), and adding ona value drawn at random from the pool of residuals. This procedurewas repeated as many times as there were trials at that disparity/delayin the original data set. These were then averaged to obtain a new,“resampled” mean �firing rate. A similar procedure was also used togenerate resampled responses to grating stimuli. This pooling wasessential to avoid biases because we had on average 12 repetitions ata single disparity and delay (for some cells the number was as low as4). Resampling with so few samples underestimates the true varianceof the population. Pooling across residuals substantially increases thenumber of samples, to over 500 on average, and produces moreconservative confidence intervals (Read and Cumming 2003). Thevalidity of this procedure depends critically on variance being com-parable across all disparity/delay combinations. Because the varianceof neuronal firing rates tends to vary with the mean, this poolingwould not be valid if the resampling procedure were applied to rawneuronal firing rates. This is why we first stabilized the variance bytaking the square root of firing rates before applying the bootstrap.
Derived quantities such as TDI and DSI were calculated for each of1,000 resampled data sets, and the 2.5 and 97.5% percentiles of the1,000 values were taken as estimates of the 95% confidence intervalof the quantity in question, given the variance in the original data. Forexample, if the 95% confidence interval for the TDI included zero, weconcluded that the TDI did not differ significantly from zero. In the
1544 J.C.A. READ AND B. G. CUMMING
J Neurophysiol • VOL 94 • AUGUST 2005 • www.jn.org
on May 24, 2006
jn.physiology.orgD
ownloaded from
figures, error bars for these derived quantities show the 68% confi-dence intervals, again obtained by resampling. This is equivalent toshowing �1 SE for a normally distributed quantity.
Psychophysics
The stimuli were the same dynamic random-dot stereograms asused in the physiology experiments, containing both disparity andinterocular delay. They were presented at the mean of the locationsused for recording, 1.65° below the horizontal meridian and 5.33°either to the right or left of the vertical meridian. Monkeys viewed thestereogram for 2 s, and then made a forced-choice judgment as towhether the disparate region appeared in front of or behind thesurround. Monkeys indicated their choices by making a saccade asdescribed in Prince et al. (2000), and received a water reward for acorrect judgment. The definition of correct referred to the spatialdisparity of the stimulus. Adding interocular delay to the dynamicrandom-dot patterns would be expected to introduce an additionalpercept of a swirling cloud rotating in depth (Ross 1974; Tyler 1974,1977). However, this cloud should be symmetric about the depthdefined by the spatial disparity, so should not bias subjects’ reports.Because of previous measurements of their stereoacuity, before thisstudy began, the monkeys were already fully trained on the front/backdiscrimination task for dynamic random-dot stereograms with zerointerocular delay. Nevertheless, we still spent several months makingsure their performance had asymptoted for stereograms with aninterocular delay. Initially, delays of opposite signs but the samemagnitude were randomly interleaved during a given block of pre-sentations. However, because one sign of delay was often easier thanthe other, this led to an exaggeration of the difference between delays:We found that, when the harder delay was presented separately, themonkeys were capable of better performance than they had shownwhen both were interleaved. The data presented in this paper weretherefore gathered in blocks where only one delay was presented. Thedisparity for each presentation was picked at random from a set of 8disparities; the interocular delay and the location of the stimulus (leftor right) were kept constant within each block.
Human subjects used the same stimuli as the monkeys, offset 5° toright or left of fixation. Because eye position was not monitored in thehuman subjects, we used short presentations, lasting 200 ms, andpresented stimuli randomly on the left or right, to keep fixationcentered. Delays of opposite sign but the same magnitude were alsorandomly interleaved within a block.
For each interocular delay, we obtained psychometric curves givingthe proportion of correct judgments P as a function of disparity (seeFig. 10). These were fitted with cumulative Gaussians by the methodof maximum likelihood. The disparity threshold for that interoculardelay was defined to be the SD of the fitted cumulative Gaussian.Confidence intervals on the thresholds were generated by resamplingfrom a binomial distribution. Simply resampling the subject’s re-sponses is unsatisfactory for such binary data. For example, if thesubject judges “behind” 10 times on 10 presentations, then resamplingwill always yield a “behind” judgment for that disparity. Yet the 95%confidence interval for the true probability P of a “behind” judgmentincludes P as low as 0.7. Thus simply resampling the subject’sjudgments would underestimate the variability. We dealt with this bypicking a new random P on each resampling run, from a probabilitydensity function reflecting the uncertainty in the value of P. If thesubject made m “behind” judgments out of n presentations of astimulus, then P was picked from the distribution proportional toPm(1 � P)n�m. Using Bayes’ rule, it can be shown that this distribu-tion specifies the likelihood that the true probability was P, given thatthere were m “behind” judgments in n presentations. The distributionpeaks at the observed proportion m/n and its width decreases with thenumber of repetitions n.
Sign conventions
Several of the quantities that we discuss in this paper have arbitrarysign conventions. For convenience, we here group these together forreference. Disparity: negative values mean crossed (near) relative tothe fixation point, positive mean uncrossed (far). Interocular delay:positive values mean that the right eye sees a given image before theleft eye, and negative values vice versa (cf. Fig. 2A). Orientation ofdrifting grating stimuli: 0° means the bars are horizontal and movingdown; 90° means the bars are vertical and moving to the left, and soon around the clock. Tilt direction index (TDI): a positive TDI meansthat the cell’s disparity preference shifts from near disparities whenthe right eye is leading, to far disparities when the left eye is leading.Direction selectivity index (DSI): a positive DSI means that the cellresponds more to stimuli moving to the right than to the left.
R E S U L T S
Delay/disparity profiles
We recorded from 72 disparity-selective cells, 28 in monkey Dand 44 in monkey R. Disparity-selective cells were defined asthose in which disparity had a significant effect (P � 0.05,ANOVA), and whose disparity discrimination index (DDI, Eq. 1)was �0.3 for stimuli with no interocular delay. Cells that passedthis test were probed with random-dot stereograms with �7disparities and 5 interocular delays, and �4 trials at each dispar-ity/delay combination. Each of these 72 data sets therefore con-tains �140 stimulus presentations, and the majority contain manymore (mean over the 72 cells 593). Figure 3A shows exampleresults for one cell, r142. The dots show mean firing rate atdifferent disparities; error bars show the SE. The curves show the2D Gabor function fitted to all data together. Black shows thestandard disparity tuning curve, obtained with random-dot stereo-grams with no interocular delay. The colors show disparity tuningcurves obtained for different interocular delays, as indicated in thelegend. The disparity tuning curves have roughly the same shape,independent of interocular delay. However, their amplitude de-creases as the magnitude of interocular delay increases. Forinterocular delays of 28 ms, the disparity tuning is essentiallyabolished. In Fig. 3B, the same data are displayed as a delay/disparity profile. Now, the vertical axis shows interocular delay;firing rate is represented as color, as indicated in the color bar. TheGabor is now shown with contour lines. Figure 2A shows how tointerpret the signs of disparity and delay.
SPACE/TIME-SEPARABILITY. We found that the cells fell into 2broad groups. The larger group behaved like the example justconsidered. Interocular delay reduced the amplitude of disparitytuning curves, but did not substantially change their shape. Figure3, C and D shows data from 2 more cells of this type. However,in a few cells, interocular delay systematically shifted the pre-ferred disparity. Two examples of this type are shown in Fig. 4. Inboth these cells, the peak response shifts from far (positive)disparities when the left eye is leading the right (negative delays)to near (negative) disparities when the right eye leads the left(positive delays). In the color plot, this shift shows up as adiagonal structure. For this second group of cells, the delay/disparity profile is tilted relative to the space–time axes; it isspace/time-inseparable. In contrast, the cells in Fig. 3, wherepreferred disparity is independent of interocular delay, show nosuch tilt: the delay/disparity profile is space/time-separable.
We quantified the amount of tilt using the tilt directionalindex introduced by Anzai et al. (2001). Although the absolute
1545INTEROCULAR DELAY, STEREOACUITY, AND V1 NEURONS
J Neurophysiol • VOL 94 • AUGUST 2005 • www.jn.org
on May 24, 2006
jn.physiology.orgD
ownloaded from
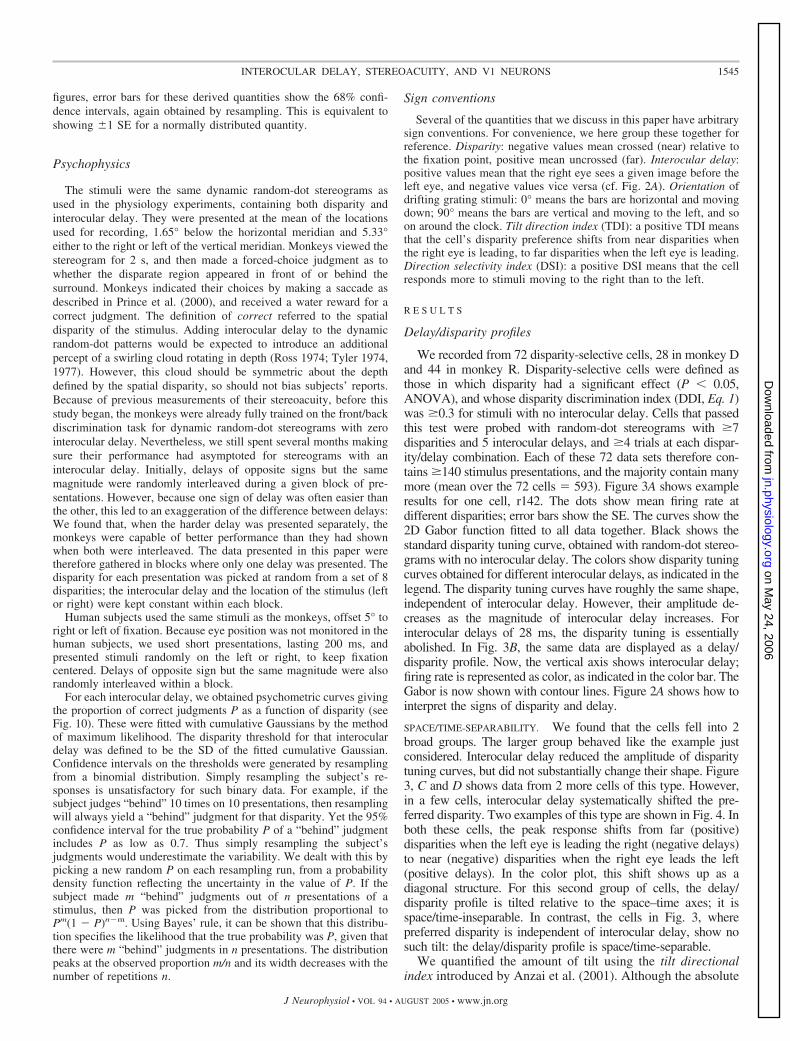
value of this index can range from 0 to 1, the distribution washighly skewed to small values. The mean magnitude of the TDIwas 0.094 (SD 0.17, SE 0.020, n 72) and the medianwas just 0.022. The TDI was significantly different from zeroin only 5/72 cells (including both the examples shown in Fig.4, r148 and r499). Thus the cells shown in Fig. 3 are muchmore typical of the population than those shown in Fig. 4.Space/time-separable profiles are far more common in monkeyV1 than the inseparable, tilted profiles.
The advantage of Anzai et al.’s TDI as a measure of tilt isthat it is model independent. For the 58/72 cells where thefitted Gabor explained more than 60% of the variance, the fitparameter provided an alternative measure of tilt (see Eq. 3).In 9/58 cells, is significantly different from zero, indicatingthat the delay/disparity profile is tilted relative to the space–time axes. This includes all 5 cells classed as tilted by the TDI;however, there are another 4 cells that have significant nonzero but not significant TDI. These are cells where differs onlyslightly from zero, although the data are sufficiently reliablethat essentially the same is found on every resampling run.Two examples are d177 (Fig. 3C) and d294 (Fig. 6C); in bothof these was significantly different from zero even thoughthe TDI was not, and very little tilt is apparent on inspectingthe delay/disparity profile. We felt therefore that Anzai’s TDIwas more appropriate for classifying cells as space/time-separable or -inseparable, and we use this measure in the restof the paper. Note that whichever measure is chosen, the
overwhelming majority of cells are classified as nontilted,space/time-separable.
SIMPLE AND COMPLEX CELLS. The classification of cells intosimple and complex by means of their response to driftinggratings (ratio of fundamental to DC; Movshon et al. 1978a)presents problems in the awake monkey due to eye movements.We recently developed a classification using the response tocounterphase-modulating stimuli to extract a complexity index(Cumming, unpublished observations). This information wasavailable for 67/72 cells. Of the 67 cells, 52 (78%) were classedas complex and 15 as simple. There did not seem to be anydifference between the space/time-separability of the simple andcomplex types. All 5 cells with significantly tilted profiles wereclassed as complex, compared with 47/67 cells where the tiltdirection index was not significantly different from zero (70%)(NS, Fisher’s exact test), nor was there a significant correlationbetween complexity index and the magnitude of the tilt (r 0.16,n 67, P 0.20). This is not surprising; standard models suchas the energy model do not lead us to expect any difference inseparability between simple and complex cells.
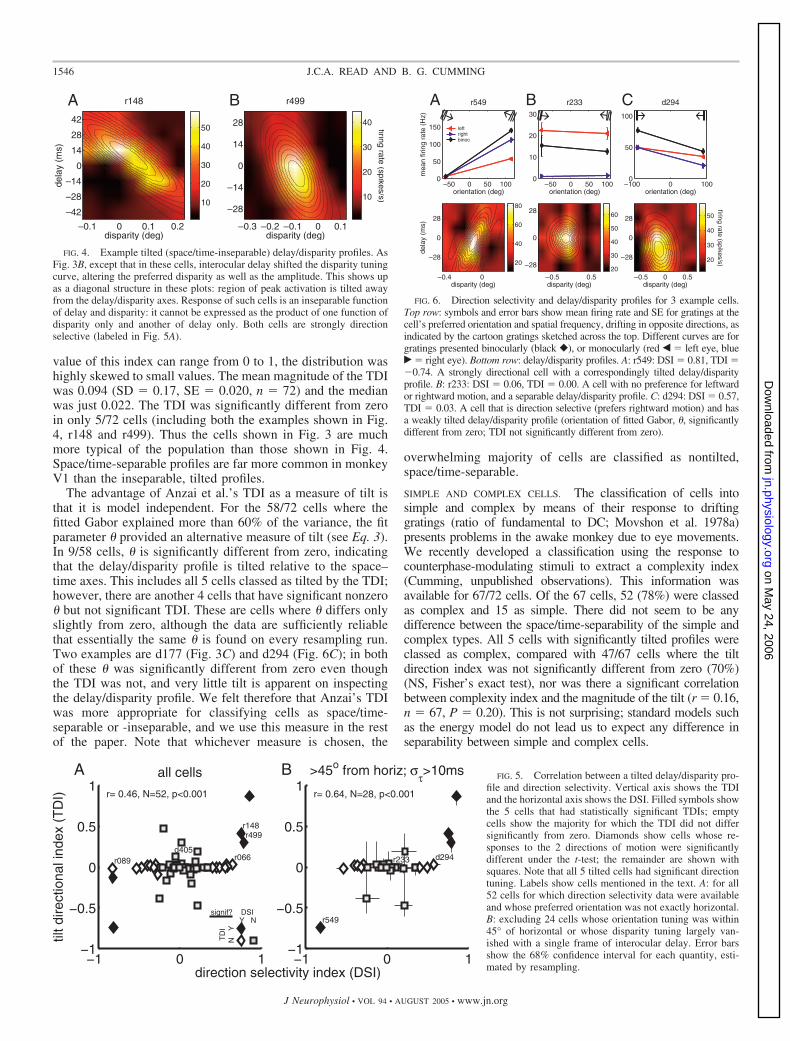
FIG. 5. Correlation between a tilted delay/disparity pro-file and direction selectivity. Vertical axis shows the TDIand the horizontal axis shows the DSI. Filled symbols showthe 5 cells that had statistically significant TDIs; emptycells show the majority for which the TDI did not differsignificantly from zero. Diamonds show cells whose re-sponses to the 2 directions of motion were significantlydifferent under the t-test; the remainder are shown withsquares. Note that all 5 tilted cells had significant directiontuning. Labels show cells mentioned in the text. A: for all52 cells for which direction selectivity data were availableand whose preferred orientation was not exactly horizontal.B: excluding 24 cells whose orientation tuning was within45° of horizontal or whose disparity tuning largely van-ished with a single frame of interocular delay. Error barsshow the 68% confidence interval for each quantity, esti-mated by resampling.
FIG. 4. Example tilted (space/time-inseparable) delay/disparity profiles. AsFig. 3B, except that in these cells, interocular delay shifted the disparity tuningcurve, altering the preferred disparity as well as the amplitude. This shows upas a diagonal structure in these plots: region of peak activation is tilted awayfrom the delay/disparity axes. Response of such cells is an inseparable functionof delay and disparity: it cannot be expressed as the product of one function ofdisparity only and another of delay only. Both cells are strongly directionselective (labeled in Fig. 5A).
FIG. 6. Direction selectivity and delay/disparity profiles for 3 example cells.Top row: symbols and error bars show mean firing rate and SE for gratings at thecell’s preferred orientation and spatial frequency, drifting in opposite directions, asindicated by the cartoon gratings sketched across the top. Different curves are forgratings presented binocularly (black �), or monocularly (red Š left eye, blue‹ right eye). Bottom row: delay/disparity profiles. A: r549: DSI 0.81, TDI �0.74. A strongly directional cell with a correspondingly tilted delay/disparityprofile. B: r233: DSI 0.06, TDI 0.00. A cell with no preference for leftwardor rightward motion, and a separable delay/disparity profile. C: d294: DSI 0.57,TDI 0.03. A cell that is direction selective (prefers rightward motion) and hasa weakly tilted delay/disparity profile (orientation of fitted Gabor, , significantlydifferent from zero; TDI not significantly different from zero).
1546 J.C.A. READ AND B. G. CUMMING
J Neurophysiol • VOL 94 • AUGUST 2005 • www.jn.org
on May 24, 2006
jn.physiology.orgD
ownloaded from

DIRECTION SELECTIVITY. For 55/72 cells, direction selectivitywas measured with drifting gratings, presented binocularly andmonocularly in both eyes. Because the orientation tuningmeasured in each eye was generally similar (cf. Bridge andCumming 2001), gratings were presented at the same, optimalorientation in each of the 3 cases, and the response wascompared for opposite directions of drift. The direction selec-tivity index (DSI) obtained with a monocular grating in thedominant eye was generally similar to that obtained with agrating presented binocularly (correlation coefficient r 0.661, n 55, P � 10�6). In what follows, the DSI refers tothe results with either a binocular grating or a monoculargrating in the dominant eye, whichever gave the strongestresponse at the preferred direction. Cells were classified as“direction selective” if the response to the 2 directions ofmotion was significantly different (P � 0.05) under the t-test:22/55 (40%) cells were direction-selective with the optimalgrating stimulus. This proportion is large compared with pre-viously published estimates in V1 (35% in Schiller et al. 1976;27% in DeValois et al. 1982; 27% in Orban et al. 1986; 28%in Hawken et al. 1988). This reflects a conscious selection bias.Because we were interested in the relationship between tilt anddirection selectivity, toward the end of the study we would runthe disparity/delay experiment whenever we encountered adirection-selective cell. Thus direction-selective cells weremore likely to be included in this study.
RELATIONSHIP BETWEEN DIRECTION SELECTIVITY AND SPACE/TIME-
INSEPARABILITY. In the energy model and other models with aninitially linear stage, tilted delay/disparity profiles must arise fromtilted (space/time-inseparable) receptive fields (Anzai et al. 2001;Morgan and Fahle 2000; Qian and Andersen 1997). These tiltedreceptive fields would in turn make the cell sensitive to thedirection of motion (Adelson and Bergen 1985); it would jointly
encode motion and disparity. The preferred direction (leftward orrightward) can be predicted from the direction of the shift thatinterocular delay causes in preferred disparity. We investigatedwhether this expectation was borne out in our data by looking fora correlation between the DSI and the TDI.
With the sign convention we have chosen (Fig. 2), linearmodels predict that the signed TDI should be positively cor-related with the signed DSI. If delaying the left eye’s imageshifts the cell’s disparity tuning toward nearer disparities (pos-itive TDI), then the cell is expected to prefer rightward-movingstimuli (positive DSI). As noted in METHODS, this is because theimage of a near object falls to the left of fixation in the right eyeand to the right of fixation in the left eye. If its image in the lefteye is artificially delayed (positive interocular delay), then it isseen first to the left of fixation, then to the right (i.e., it appears
FIG. 7. Scatterplot of tolerance of intero-cular delay vs. the optimal delay. Verticalaxis shows ��, representing the temporalextent of the fitted Gabor function, and thusa cell’s tolerance to interocular delay. Hori-zontal axis shows �p, the interocular delay atwhich the fitted Gabor has its maximumdeparture from zero. Distribution of �p isshifted away from zero toward negative de-lays (right eye’s sequence is delayed relativeto the left). Marginal distributions are shownalong the side. Arrow and flanking dashedlines show mean and SD (��: 15.5 � 5.1 ms;�p: �4.1 � 5.4 ms).
FIG. 8. Nasotemporal asymmetry. Objects in the right visual hemifield falltemporally on the left retina and nasally on the right. Retinal images are closerto the optic disk (OD) in the right eye, so the signal from the right eye arrivesat the brain before that from the left.
1547INTEROCULAR DELAY, STEREOACUITY, AND V1 NEURONS
J Neurophysiol • VOL 94 • AUGUST 2005 • www.jn.org
on May 24, 2006
jn.physiology.orgD
ownloaded from
to move to the right). Similarly, a far object with the sameinterocular delay will be seen as moving to the left. If thereceptive field is tuned to rightward motion, this means that thenear object will elicit larger responses, i.e., the positive intero-cular delay has shifted the cell’s disparity tuning toward neardisparities. This is defined as a positive TDI (Fig. 2A).
Figure 5 shows that this expected correlation is borne out.Figure 5A shows the correlation between DSI and TDI for allcells whose direction preference was assessed, apart from 3cells whose orientation preference was exactly horizontal.These 3 were tested only with gratings drifting up or down, soit was not possible to assess whether they preferred leftward orrightward motion and no sign could be assigned to the DSI.None of the 3 showed a significant TDI. For the remaining 52cells, TDI and DSI are significantly correlated (r 0.46, n 52, P � 0.001): cells with tilted delay/disparity profiles are, asexpected, more likely to be direction selective. The filledsymbols indicate the 5 cells with a statistically significant TDI;the 2 examples shown in Fig. 4, r148 and r499, are labeled. Thediamonds indicate cells with a significant DSI. All 5 tilted cellsare extremely direction-selective.
The correlation in Fig. 5A is weakened by other cells that arealso direction selective but not tilted. Two examples are r089 andr066, labeled in Fig. 5A. These cells do not in fact provideconvincing evidence against the simple linear models that requirea correlation between DSI and TDI. Both r089 and r066 were sosensitive to interocular delay that their disparity tuning was es-sentially abolished by a delay of just one frame (see data for r066in Fig. 9B). It is possible, therefore that they might have revealeda tilted response if it had been possible to probe them with shorterdelays. A different problem affects some other cells, such asruf144. This cell’s preferred orientation was about 15° from thehorizontal, so it was tested with gratings drifting in near-vertical
directions and found to be selective for upward versus downwardmotion. Thus according to standard linear models its receptivefield should be inseparable on (y, t) axes, predicting that we wouldhave found a tilted profile if we had measured the cell’s responseas a function of delay and vertical disparity. However, because wedid not measure direction selectivity for horizontal motion, itremains possible that the cell’s receptive field is separable on (x,t) axes, in which case the lack of a tilted profile for delay andhorizontal disparity is unsurprising.
To avoid both problems, we reanalyzed the correlationbetween TDI and DSI excluding 21 cells whose preferredorientation was within 45° of horizontal, meaning that therelevant direction tuning was not measured, and a further 3cells that were so sensitive to interocular delay that tilt couldnot reliably be assessed (�� � 10 ms, Eq. 4, meaning that aninterocular delay of one 14-ms frame reduced the amplitude ofdisparity tuning to �40% of its peak amplitude). Figure 5Bshows the correlation between DSI and TDI after excludingboth sets of cells; the error bars show the 68% confidenceinterval estimated by resampling. The correlation is now evenstronger (r 0.64, n 28, P � 0.001), and there are no cellsthat obviously violate the expected relationship. Three exam-ples, labeled in Fig. 5B, are shown in Fig. 6. r549 (Fig. 6A) isstrongly direction selective and has, as predicted, a tilted(inseparable) delay/disparity tuning surface. r233 (Fig. 6B) is acell that responds equally to leftward/rightward motion andhas, as predicted, a separable delay/disparity tuning surface.d294 is the closest we come to an exception to the prediction.It is direction selective but not significantly tilted. However,weak tilt is visible in the surface (the orientation of the fittedGabor, in Eq. 3, is significantly different from zero) and thesign of the tilt is consistent with the sign of the directionselectivity (TDI and DSI are both positive). Thus across thepopulation, more pronounced tilt measured with horizontaldisparity is associated with more pronounced left/right direc-tion tuning and the sign of the tilt is as expected from thedirection tuning. This suggests that standard linear models areessentially accurate in predicting an association between space/time-inseparable disparity profiles and direction selectivity.
OPTIMAL INTEROCULAR DELAY. In the delay/disparity profilesshown in Fig. 3, even though they are space/time-separable, itis noticeable that delays of opposite sign do not have the sameeffect on the cell’s response. For example, in r142 (Fig. 3A),when the right eye’s image sequence is delayed 14 ms relativeto the left (blue curve), the amplitude of the disparity tuningcurve is reduced to only about 80% of its zero-delay value.When the left eye is delayed 14 ms relative to the right (red),however, the amplitude is halved. Similar asymmetries arevisible for the other cells shown in Fig. 3. The natural conclu-sion is that, had we been able to apply interocular delays inmuch smaller increments, we would have seen the responsepeak at a small but nonzero delay. We can estimate this optimalinterocular delay from the fitted Gabor; the asymmetries visibleat our coarse sampling have the effect of shifting the maximumamplitude of the fit away from zero interocular delay.
We define �p to be the interocular delay at which the fitted delayattains its maximum departure from baseline, within the range ofdisparities/delays actually sampled. Because this estimate of op-timal interocular delay relies on the fit, we restricted our analysisto the 58/72 cells for which the fitted function explained more than
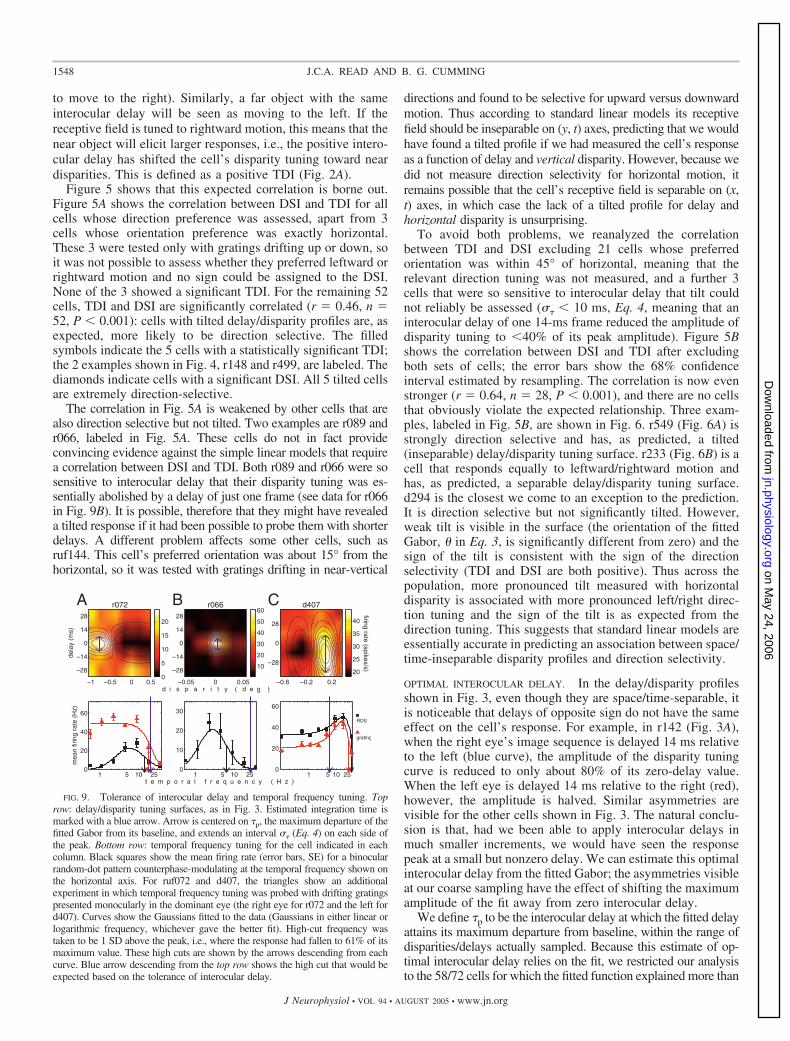
FIG. 9. Tolerance of interocular delay and temporal frequency tuning. Toprow: delay/disparity tuning surfaces, as in Fig. 3. Estimated integration time ismarked with a blue arrow. Arrow is centered on �p, the maximum departure of thefitted Gabor from its baseline, and extends an interval �� (Eq. 4) on each side ofthe peak. Bottom row: temporal frequency tuning for the cell indicated in eachcolumn. Black squares show the mean firing rate (error bars, SE) for a binocularrandom-dot pattern counterphase-modulating at the temporal frequency shown onthe horizontal axis. For ruf072 and d407, the triangles show an additionalexperiment in which temporal frequency tuning was probed with drifting gratingspresented monocularly in the dominant eye (the right eye for r072 and the left ford407). Curves show the Gaussians fitted to the data (Gaussians in either linear orlogarithmic frequency, whichever gave the better fit). High-cut frequency wastaken to be 1 SD above the peak, i.e., where the response had fallen to 61% of itsmaximum value. These high cuts are shown by the arrows descending from eachcurve. Blue arrow descending from the top row shows the high cut that would beexpected based on the tolerance of interocular delay.
1548 J.C.A. READ AND B. G. CUMMING
J Neurophysiol • VOL 94 • AUGUST 2005 • www.jn.org
on May 24, 2006
jn.physiology.orgD
ownloaded from

60% of the variance, although the results were essentially thesame when all 72 cells were included. The distribution of �p forthese 58 cells is shown in the red histogram at the top of Fig. 7.The distribution is clearly shifted toward negative delays, in whichthe right eye’s image sequence is delayed relative to the left. Themean is �4.1 ms (�5.4 ms SD), marked in Fig. 7 with a verticalarrow and flanking broken lines. The distribution is clearly shiftedwell to the left of the black vertical line marking zero, and we canconfidently reject the null hypothesis that the population mean isactually zero (P � 10�7, t-test). Most cells in our study respondbest when there is a small interocular delay between the eyes, suchthat a given image is presented first in the left eye.
This asymmetry between left and right probably represents anasotemporal difference. Because we were recording from theleft hemisphere in both animals, the stimuli were all presentedin the right visual field, i.e., projecting to nasal retina in theright eye and temporal retina in the left. Thus the retinal imagesfell closer to the optic disk in the right eye than in the left (Fig.8). Although the distances are small, fibers in the retina areunmyelinated, so conduction velocity is slow: about 60 cm/s at5° eccentricity (Sutter and Bearse 1999). This introduces alatency difference of a few milliseconds (Auerbach et al. 1961;Hood et al. 2000; Lee 1970; Sutter and Bearse 1999). If thistime lag is not corrected for in the brain, but binocular neuronssimply tend to respond best to changes occurring at the sametime in inputs from both eyes, then this could explain theasymmetry in the neuronal data. Delaying the right eye’s imagesequence by a few milliseconds means that correspondingimages from the 2 eyes reach the cortex at the same time. Theoptimal interocular delay in our neuronal data, around 4 ms, iscommensurate with estimates of retinal conduction latency inhumans (5 ms; Hood et al. 2000; Lee 1970).
TOLERANCE OF INTEROCULAR DELAY. As the interocular delaymoves further away from the optimal value for each cell, theamplitude of the disparity tuning curve decreases. To quantifythe rate of this fall-off for both tilted and nontilted cells, weintegrated the Gaussian envelope of the 2D Gabor fits overdisparity and measured the SD of the resulting Gaussian, ��
(Eq. 4). (In fact, as explained in METHODS, this correction for tiltwas negligible: for all but one cell the corrected value �� waswithin 0.2 ms of the uncorrected value ��.)
For the 58/72 cells for which the Gabor fit explained morethan 60% of the variance, the distribution of �� is shown in theblue histogram in Fig. 7. The mean value was 15.5 ms (�5.1ms SD); again, this is shown with a horizontal arrow anddashed lines in Fig. 7. Space/time-inseparable delay/disparityprofiles tended to extend longer temporally: ���� 22.5 ms
(�6.7 ms SD) for the 5/58 cells with a significant TDI, and14.9 � 4.5 ms for the 53/58 cells that were not significantlytilted. The 2 groups had significantly different values of ��
(P � 10�3, 2-sample t-test). Note that the larger temporalextent of the tilted profiles may partly reflect a selection effect:if neurons respond strongly over a wider range of delays, tilt ismore readily detected. However, even when we restricted theanalysis to the 50/58 cells for which �� � 10 ms (samecriterion as applied to Fig. 5B), there was still a significantcorrelation between TDI and �� (r 0.51, n 50, P �0.0002). We conclude that most V1 cells can detect disparitiesbetween correspondences that are separated in time by 15ms, although a minority can detect disparities beyond 20 ms.
Comparison with temporal frequency tuning
The tolerance to interocular delay in random-dot stereo-grams implies a temporal integration time �� of around 15 ms.This would be expected to impose an upper limit on the cell’sability to respond to modulations of contrast at high temporalfrequency. We looked to see whether this was reflected in thehigh-cut fhi of the contrast temporal frequency tuning curve,where the response falls to 61% of the maximum. The energymodel predicts that fhi 1/(2���). To our surprise, no suchcorrelation was apparent. We experimented with several dif-ferent ways of measuring temporal frequency tuning. We useddrifting gratings at the cell’s optimal spatial frequency andorientation, counterphase-modulating gratings at the cell’s op-timal spatial frequency and orientation, and counterphase-modulating random-dot patterns. These could be presentedeither monocularly or binocularly, and with presentations todifferent eyes either in blocks or interleaved. In cells whereseveral measures were used, the high-cuts obtained by thedifferent methods were generally correlated, but with consid-erable scatter. There was no correlation between fhi and 1/��. Ingeneral, cells responded to higher temporal frequencies thanwould be predicted from their tolerance of relatively longinterocular delays. The mean value of 1/(2���) was 12 Hz; themean contrast high-cut was around 20 Hz.
Three examples are shown in Fig. 9. The top row showsdelay/disparity profiles, with the integration time �� indicatedwith a blue arrow. The bottom row shows temporal frequencytuning for each cell. This was assessed for every cell with acounterphase-modulating binocular random-dot pattern(squares), and for 2 cells also with a drifting monocular grating(triangles). The curves show the fits made to the data. Thehigh-frequency cutoff derived from each fit is marked with an
FIG. 10. Psychometric functions for monkey D, showingperformance on a front/behind discrimination task for differentinterocular delays. Symbols show the mean proportion of “be-hind” responses, from �100 (usually �300) judgments perdisparity. Error bars show the 68% confidence intervals for theprobability in a simple binomial distribution. Curves show thecumulative Gaussian fitted to the data by maximum likelihood.Filled circles/solid line interocular delay of �14 ms (left eyesees a given image first); empty squares/dotted line 14 ms(right eye sees a given image first). Stimuli were presented at5.33° from the midline in the left (A) or right (B) hemifield.
1549INTEROCULAR DELAY, STEREOACUITY, AND V1 NEURONS
J Neurophysiol • VOL 94 • AUGUST 2005 • www.jn.org
on May 24, 2006
jn.physiology.orgD
ownloaded from

arrow. The high-cut predicted from the delay/disparity profile,fhi 1/(2���), is indicated with the blue arrow descendingfrom the top row. The first column shows a rare cell whosehigh-cut temporal frequency is as predicted from its delay/disparity profile. Its temporal integration time ��, estimatedfrom the fitted Gabor, was 7.7 ms, implying a high-cut ofaround 21 Hz. This is roughly what was obtained both withbinocular counterphase-modulating random-dot patterns andwith monocular drifting gratings (although the low-pass char-acteristics were very different with these 2 stimuli). r066 (Fig.9B) is one of the few cells whose high-cut temporal frequencywas lower than predicted from its delay/disparity profile. It washighly sensitive to interocular delay, its disparity tuning beingcompletely abolished by interocular delays of just 14 ms,suggesting a short temporal integration time of perhaps 4 ms.It would thus be expected to continue responding to counter-phase modulation of a random-dot stereogram up to frequen-cies �20 Hz, but in fact it gave its maximum response tomodulations at just 2 Hz, and its response had fallen to 61% ofthis maximum by 6 Hz. D407 (Fig. 9C) shows one of themajority of cells whose high-cut temporal frequency washigher than predicted from its delay/disparity profile. It re-sponded to disparity over a very wide range of interoculardelays (fitted �� 27 ms), suggesting a high-cut of just 6 Hz. Infact, it carried on increasing its firing as the temporal frequencyrose to 18 Hz, both for counterphase-modulating random-dotpatterns and for drifting gratings.
This failure to find the correlation predicted by simplemodels suggests that, as indicated by previous studies in the cat(Dean et al. 1982; Reid et al. 1991, 1992; Tolhurst et al. 1980),V1 neurons contain temporal nonlinearities. These enable thecells to respond to high-frequency contrast modulation, whilenevertheless tolerating relatively long interocular delays whencomparing inputs from the 2 eyes.
Psychophysics
We looked to see whether these temporal properties of V1cells’ disparity tuning were reflected in perceptual perfor-mance. We obtained horizontal disparity thresholds for ran-dom-dot stereograms at various interocular delays, and in boththe left and right visual hemifields. Figure 10 shows examplepsychometric functions for monkey D. The curves are cumu-lative Gaussians fitted to the data. The SD of this cumulativeGaussian was taken to be the disparity threshold for this delay,i.e., the change in disparity needed to lift performance from
chance to 84% correct. The magnitude of the interocular delayis 14 ms. The 4 curves show results for stimuli presented in leftand right visual hemifields, and for both positive and negativedelays. In both hemifields, the threshold depends on the sign ofdelay, with opposite signs in opposite hemifields giving thebest performance. When stimuli are presented in the lefthemifield, the threshold is lowest (stereoacuity highest) whenthe left eye sees a given image after the right (positive intero-cular delay). When stimuli are presented in the right hemifield,the reverse is true. This is exactly what one would expect basedon the interocular latency difference attributed to retinal con-duction. Suppose that binocular neurons are most sensitive todisparity, and stereoacuity is thus highest, when signals fromboth eyes simultaneously reach the cortex. When the stimulusis in the left visual hemifield, the image in the left eye fallscloser to the optic disk. A small delay applied to the image inthe left eye gives the image in the right eye a chance to “catchup,” so the 2 signals simultaneously reach the cortex. Stereoa-cuity is thus actually improved by a small positive interoculardelay. The optimal delay is the difference in the times taken bythe signals in the 2 retinae to reach the optic disk.
Figure 11 summarizes many similar psychometric functionsfor monkeys D and R, and for 2 human observers, BC and HN.The symbols show sensitivity (1/threshold) as a function ofinterocular delay. Results for the left visual hemifield areshown with red symbols and those for the right hemifield withblue. The 68% confidence interval for each threshold wasestimated by resampling and is marked with an error bar. Thecurves show a Gaussian fitted to these data by the method ofmaximum likelihood. We know that the sensitivity must fall tozero as the interocular delay rises indefinitely, so the baselineof the Gaussian was set to zero. The fitting was performed inlogarithmic coordinates (i.e., log-Gaussian was fitted to log-sensitivity) because the error bars increase as a function ofsensitivity (and are nearly constant for log-sensitivity).
OPTIMAL INTEROCULAR DELAY. The peak of the Gaussian is ourestimate of the optimal interocular delay: the delay that wouldresult in the greatest stereoacuity for stimuli presented in thathemifield. This is marked with a vertical arrow for each fit. For theright hemifield, we can compare these psychophysical results withthe neuronal data. From the psychophysics, the optimal interocu-lar delay for stimuli in the right hemifield was �5.7 ms for D and�6.1 ms for R. From the physiology, the optimal interocular delaywas �4.1 ms (mean for 58 neurons from both monkeys; �5.4 msSD, 0.7 ms SE). These numbers are in good agreement.
FIG. 11. Stereoacuity as a function of interocular delay. Triangles show stereoacuity as a function of delay (red Š for stimuli presented in the left visualhemifield, blue ‹ for stimuli in the right hemifield). Threshold is shown here on the right vertical axis and the sensitivity, shown on the left axis, is the reciprocalof the threshold. Curves show the Gaussian functions fitted to these data (the free parameters were the amplitude, SD, and peak position). Vertical arrows showthe peak of each fitted Gaussian, which is an estimate of the interocular delay at which stereoacuity is optimal. Width of each arrow shaft shows the 68%confidence interval for the peak. For the monkey subjects D and R, the black curve shows a Gaussian with the same amplitude as the blue dotted curve, but whosepeak position and SD were taken from the mean neuronal data (i.e., peak at �4.1 ms and SD of 15.5 ms). Neuronal data were taken with stimuli in the righthemifield, and they agree well with psychophysical performance in that hemifield.
1550 J.C.A. READ AND B. G. CUMMING
J Neurophysiol • VOL 94 • AUGUST 2005 • www.jn.org
on May 24, 2006
jn.physiology.orgD
ownloaded from

The monkey observers, in particular, display a bias: theiroptimal delays are negative for both hemifields. The origin ofthis bias is unclear. Some humans do have a noticeable latencydifference between their eyes (Harker and O’Neal 1967). In thecase of our monkeys, the bias may be related to their longhistory of attending to and making psychophysical judgmentsabout stimuli in the right hemifield. However, whatever thereason for the bias, we note that in every case the optimal delayis a few milliseconds more negative for stimuli presented in theright hemifield. This difference was significant for 3 of thesubjects individually (P � 0.05, by bootstrap resampling; theexception being D); in Fig. 11 the width of each vertical lineindicates the 68% confidence interval for the optimal delay.Although not definitive, this is nevertheless in the same direc-tion as expected from retinal conduction delays. Thus it ispossible that the small difference in optimal interocular delayfor the 2 hemifields represents a perceptual consequence ofconduction delays in the retina.
TOLERANCE OF INTEROCULAR DELAY. The observer’s toleranceof interocular delay is obtained from the rate at which the sensi-tivity to disparity falls off as the interocular delay moves awayfrom the optimal value. This is given by the temporal SD of theGaussian fits shown in Fig. 11. As is apparent from the figure, theSD was slightly narrower for the human observers (mean overboth subjects and hemifields, 11.4 ms) than for the monkeys (15.1ms). Once again, we can compare the psychophysical and neuro-nal results. The SD for psychophysical stimuli in the right hemi-field is 14.7 ms for monkey D and 15.9 ms for monkey R; thiscompares with a neuronal estimate of 15.5 ms (mean over 58neurons in both monkeys; �5.1 ms SD, 0.7 ms SE). This isvisualized in Fig. 11 by the black and blue curves, representingneuronal and psychophysical results respectively for stimuli in theright hemifield. The black curves are Gaussians whose SD (15.5ms) and peak (at �4.1 ms) were taken from the neuronal data, andwhose amplitude was set to match the peak performance in thathemifield. Clearly, the decline in psychophysical performance asa function of interocular delay mirrors the decline in neuronalsensitivity. This agreement suggests that the limits on perceptualperformance in this task are set by the temporal properties ofdisparity-sensitive neurons in V1.
D I S C U S S I O N
We measured responses of disparity-selective V1 neurons asa function of interocular delay in random-dot stereograms. Theresulting disparity/delay profiles revealed 3 major findings.First, disparity selectivity is diminished by interocular delays,suggesting a binocular integration time of about 15 ms. Sec-ond, this is closely similar to the effect of interocular delay onpsychophysical performance. Third, the preferred disparity formost neurons did not change as a function of interocular delay,suggesting that they do not jointly encode disparity and motionin the way that has been postulated to explain the Pulfricheffect (Anzai et al. 2001; Carney et al. 1989; Morgan andCastet 1995; Morgan and Fahle 2000; Morgan and Tyler 1995;Pack et al. 2003; Qian 1997; Qian and Andersen 1997).
Binocular integration time and tuning to interocular delay
Previous experimental and theoretical studies have raised thepossibility that tuning to a range of interocular delays may
exist. In agreement with Anzai et al. (2001) and Pack et al.(2003), we found that stimuli with no interocular delay almostalways elicited stronger responses than stimuli delayed by oneor more frames. However, the attenuation produced by delaywas not symmetric: stimuli in which the right eye experiencedthe delay generally elicited stronger responses than those inwhich the left eye did. This suggested that, if we had been ableto apply delays smaller than our 14-ms frame, the optimaldelay might not have been exactly zero. Our fitting proceduressuggested that, on average, the maximum response would havebeen obtained if the right eye had experienced a delay of 4–5ms. Because all stimuli were presented in the right hemifield,this may reflect conduction delays in the retina (Fig. 8). Imagesin the right hemifield fall closer to the optic disk in the right eyethan in the left. Because these fibers are unmyelinated, this issufficient to introduce a relative lag of about 5 ms. If corticalneurons respond best when inputs from the 2 eyes arrivesimultaneously, the optimum stimulus would be presented tothe left eye before the right eye. Thus our results do notindicate a specialized encoding of interocular delay. Rather, itappears that, in general, cells simply fire most strongly wheninputs from the 2 eyes are coincident. Intriguingly, this sug-gests that the cortical encoding has failed to adapt to theseconsistent interocular delays. Although this explanation isadequate to explain the data, data from 2 hemispheres of oneanimal are required to render it compelling.
As interocular delay increased, disparity tuning in each cell wasgradually abolished. This is explained by the fact that, when thedelay exceeds the period over which these neurons integrateinformation, the signals become uncorrelated. The time constantwith which disparity tuning decays with delay gives us an esti-mate of the binocular integration time. The mean value was about15 ms. This is in reasonable agreement with recent data from themonkey (Pack et al. 2003; although see Perez et al. 1999), butconsiderably shorter than previous estimates in the cat (Anzai etal. 2001; Gardner et al. 1985; Pettigrew et al. 1968). This differ-ence between the cat and monkey probably reflects more sluggishtemporal integration early in the cat’s visual processing, since asimilar difference is evident in tuning for contrast temporal fre-quency (DeAngelis et al. 1993; Hawken et al. 1996; Movshon etal. 1978b). The neuronal integration times seen in the monkeyclosely matched the psychophysical integration time we found inboth monkey and human observers, suggesting that the temporalconstraints used in stereo matching are implemented by theseearly stages of processing.
To explore the underlying mechanism, we compared thiswith the monocular integration time inferred from responses tostimuli of varying temporal frequency. The 2 measures ofintegration time were poorly correlated. In general, cells re-sponded to higher temporal frequencies than would be pre-dicted from their observed binocular integration times, al-though discrepancies were observed in both directions. Thesediscrepancies seem to require a more complex model than alinear kernel followed by a static nonlinearity. The solutionmay be a nonlinearity in temporal processing, similar to thatdocumented by several studies in the cat (Dean et al. 1982;Reid et al. 1991, 1992; Tolhurst et al. 1980). Alternatively thediscrepancies could reflect temporal filtering that is somehowapplied only to binocular responses (Julesz and White 1969).
Either way, the effect is to allow V1 neurons to modulate theirresponse quickly when the monocular stimulus changes, while
1551INTEROCULAR DELAY, STEREOACUITY, AND V1 NEURONS
J Neurophysiol • VOL 94 • AUGUST 2005 • www.jn.org
on May 24, 2006
jn.physiology.orgD
ownloaded from
nevertheless integrating signals from the 2 eyes over relativelylong periods (about 15 ms). Functionally, it is unclear why thislong integration of binocular information should be beneficial.One possibility is that it is related to the nearly 5-ms latencydifference between the eyes in normal viewing, noted above. Ifcortical neurons are unable to compensate for this latency differ-ence, but always respond best to simultaneous inputs from the 2eyes, then the binocular integration time of 15 ms ensures a gooddisparity response when the delay is 5 ms. Thus it may be thatconduction delays in the retina place a lower limit on the binocularintegration times of cortical neurons.
Joint encoding of motion and depth
In most cases, interocular delay reduced the amplitude of thedisparity tuning curve without altering its shape. Preferred dispar-ity did not usually change as a function of interocular delay,indicated by low values of the tilt direction index (TDI) (Anzai etal. 2001). The median value of the TDI was only 0.02 and themean was 0.09. This is fairly similar to the mean of 0.17 reportedby Pack et al. (2003) in macaque V1, but much lower than theresults of Anzai et al. in cat area 17/18 (mean 0.44). Tilteddelay/disparity profiles imply space/time-inseparable receptivefields. Cells with tilted profiles are therefore expected to be tunedto the direction of motion as well as to disparity (DeAngelis et al.1995; Qian and Andersen 1997). This expectation was borne outin our data. Thus the lack of tilted profiles in macaque V1 (Packet al. 2003; this study) compared with cat A17/18 (Anzai et al.2001) is probably at least partly explained by the relative scarcityof direction selectivity in monkey V1 relative to cat A17/18(Casanova et al. 1992; DeValois et al. 1982; Gizzi et al. 1990;Hawken et al. 1988).
Thus our results are compatible with the existing physiologicalliterature: it appears that joint encoding of motion and depth isseen only in direction-selective neurons. This simple statementsummarizes our data, that of Anzai et al. and that of Pack et al. forboth V1 and MT, and agrees with the model of Qian andAndersen (1997). However, it represents a challenge to existingexplanations of the Pulfrich effect (Anzai et al. 2001; Carney et al.1989; Morgan and Castet 1995; Morgan and Fahle 2000; Morganand Tyler 1995; Pack et al. 2003; Qian 1997; Qian and Andersen1997) that rely exclusively on cells jointly encoding both motionand disparity. Our results were obtained with a version of thedynamic-noise-with-delay stimulus (Ross 1976, 1974; Tyler1977, 1974), widely regarded as the most compelling evidence forjoint encoding (Morgan and Fahle 2000; Morgan and Tyler 1995;Morgan and Ward 1980). The absence of joint-encoding re-sponses in single neurons, in response to the very stimulus that ledto their theoretical adoption, highlights the need to reevaluatetheories of the Pulfrich effect. It is now clear that most disparity-selective cells in monkey V1 do not jointly encode motion anddisparity. Thus the joint-encoding model implies that the percep-tion of depth caused by Pulfrich-like stimuli is supported only bythe small minority of cells with tilted delay/disparity profiles.Although not impossible—for example, the brain area that is theneural correlate of depth perception may receive projectionspreferentially from direction-selective V1 neurons, perhaps viaMT (Movshon and Newsome 1996; Pack et al. 2003)—this wouldmean that the majority of disparity-selective neurons in V1,although encoding substantial information about the binocular
disparity of the stimulus, make no contribution to stereo depthperception.
Before drawing such a surprising conclusion, note that thereare (at least) 2 schemes under which the nontilted disparity-selective neurons in V1 do contribute to depth perception.First, it may be that the outputs of V1 neurons with nontiltedprofiles are combined in extrastriate cortex with outputs fromother neurons, so as to produce tilted profiles from whichperception is derived. Second, it is possible that joint motion/disparity sensors are not solely responsible for depth percep-tion in Pulfrich-like stimuli. Although in recent years there hasbeen an emphasis on explanations that invoke joint encoding(Anzai et al. 2001; Morgan and Castet 1995; Morgan and Fahle2000; Morgan and Tyler 1995; Qian 1997; Qian and Andersen1997), earlier theories explained depth perception in terms ofspatial disparities physically present in the stimulus (Morgan1979; Tyler 1977, 1974). These earlier theories have beendiscarded after the success of simulations based on the jointencoding of disparity and motion in model neurons (Qian andAndersen 1997). However, the possible role of nontilted dis-parity/delay profiles in explaining Pulfrich-like phenomena hasnot been explored in explicit models. Thus disparity-relatedsignals in V1 may not need to undergo any transformation toexplain depth perception in the Pulfrich effect. In this view, thedisparity information contained in the activity of V1 neuronswith nontilted disparity/delay profiles would contribute todepth perception. We stress that we are here discussing onlythe depth percept. Obviously, because such cells are generallynot direction selective, they would not contribute to the per-ception of motion. Direction-selective cells, characterized bytilted disparity/delay profiles, must be crucial for perceivingstimulus motion in the Pulfrich effect.
A thought experiment helps distinguish these hypotheses.Imagine a lesion that destroyed all joint motion/disparity sen-sors everywhere in the brain. If the illusory depth in thestroboscopic Pulfrich effect stems solely from joint motion/disparity encoding, then clearly this lesion will abolish theperception of depth. If, on the other hand, the sensation ofdepth in this stimulus arises partially from the activity of puredisparity sensors, then an animal with this lesion might still beable to discriminate depth in the stroboscopic Pulfrich stimu-lus—even though the lesion would be expected to abolish theapparent motion usually associated with the depth. Needless tosay, this lesion will be unfeasible for the foreseeable future. Amore practical approach may be to investigate models based onan initially separate encoding of disparity and motion, and thentest quantitative psychophysical predictions. A key element ofsuch models is the use of appropriate binocular integrationtimes for the neuronal elements, made possible by the datapresented here. Together, physiology, psychophysics, andcomputational modeling may then finally yield a definitiveunderstanding of the Pulfrich effect.
A C K N O W L E D G M E N T S
Thanks to M. Szarowicz and C. Hillman for excellent animal care.
G R A N T S
This work was supported by the National Eye Institute.
R E F E R E N C E S
Adelson EH and Bergen JR. Spatiotemporal energy models for the percep-tion of motion. J Opt Soc Am A Opt Image Sci Vis 2: 284–299, 1985.
1552 J.C.A. READ AND B. G. CUMMING
J Neurophysiol • VOL 94 • AUGUST 2005 • www.jn.org
on May 24, 2006
jn.physiology.orgD
ownloaded from
Anzai A, Ohzawa I, and Freeman RD. Joint-encoding of motion and depthby visual cortical neurons: neural basis of the Pulfrich effect. Nat Neurosci4: 513–518, 2001.
Auerbach E, Beller AJ, Henkes HE, and Goldhaber G. Electric potentialsof retina and cortex of cats evoked by monocular and binocular photicstimulation. Vision Res 1: 166–170, 1961.
Bridge H and Cumming BG. Responses of macaque V1 neurons to binocularorientation differences. J Neurosci 21: 7293–7302, 2001.
Burr DC and Ross J. How does binocular delay give information aboutdepth? Vision Res 19: 523–532, 1979.
Carney T, Paradiso MA, and Freeman RD. A physiological correlate of thePulfrich effect in cortical neurons of the cat. Vision Res 29: 155–165, 1989.
Casanova C, Nordmann JP, Ohzawa I, and Freeman RD. Directionselectivity of cells in the cat’s striate cortex: differences between bar andgrating stimuli. Vis Neurosci 9: 505–513, 1992.
Chen Y, Wang Y, and Qian N. Modeling V1 disparity tuning to time-varyingstimuli. J Neurophysiol 86: 143–155, 2001.
Dean AF. The variability of discharge of simple cells in the cat striate cortex.Exp Brain Res 44: 437–440, 1981.
Dean AF, Tolhurst DJ, and Walker NS. Non-linear temporal summation bysimple cells in cat striate cortex demonstrated by failure of superposition.Exp Brain Res 45: 456–458, 1982.
DeAngelis GC, Ohzawa I, and Freeman RD. Spatiotemporal organization ofsimple-cell receptive fields in the cat’s striate cortex. II. Linearity oftemporal and spatial summation. J Neurophysiol 69: 1118–1135, 1993.
DeAngelis GC, Ohzawa I, and Freeman RD. Receptive-field dynamics in thecentral visual pathways. Trends Neurosci 18: 451–458, 1995.
DeValois R, Yund EW, and Hepler N. The orientation and directionselectivity of cells in macaque visual cortex. Vision Res 22: 531–544, 1982.
Efron B. Bootstrap methods: another look at the jackknife. Ann Stat 7: 1–26,1979.
Gardner JC, Douglas RM, and Cynader MS. A time-based stereoscopicdepth mechanism in the visual cortex. Brain Res 328: 154–157, 1985.
Gizzi MS, Katz E, Schumer RA, and Movshon JA. Selectivity for orienta-tion and direction of motion of single neurons in cat striate and extrastriatevisual cortex. J Neurophysiol 63: 1529–1543, 1990.
Hamilton DB, Albrecht DG, and Geisler WS. Visual cortical receptive fieldsin monkey and cat: spatial and temporal phase transfer function. Vision Res29: 1285–1308, 1989.
Harker GS and O’Neal OL. Some observations and measurements of thePulfrich phenomenon. Percept Psychophys 2: 423–426, 1967.
Hawken MJ, Parker AJ, and Lund JS. Laminar organization and contrastsensitivity of direction-selective cells in the striate cortex of the Old Worldmonkey. J Neurosci 8: 3541–3548, 1988.
Hawken MJ, Shapley RM, and Grosof DH. Temporal-frequency selectivityin monkey visual cortex. Vis Neurosci 13: 477–492, 1996.
Hayashi R, Maeda T, Shimojo S, and Tachi S. An integrative model ofbinocular vision: a stereo model utilizing interocularly unpaired pointsproduces both depth and binocular rivalry. Vision Res 44: 2367–2380, 2004.
Hood DC, Zhang X, Greenstein VC, Kangovi S, Odel JG, Liebmann JM,and Ritch R. An interocular comparison of the multifocal VEP: a possibletechnique for detecting local damage to the optic nerve. Invest OphthalmolVis Sci 41: 1580–1587, 2000.
Julesz B and White B. Short term visual memory and the Pulfrich phenom-enon. Nature 222: 639–641, 1969.
Lee DN. Spatio-temporal integration in binocular-kinetic space perception.Vision Res 10: 65–78, 1970.
Marr D and Poggio T. A computational theory of human stereo vision. ProcR Soc Lond B Biol Sci 204: 301–328, 1979.
Morgan MJ. Perception of continuity in stroboscopic motion: a temporalfrequency analysis. Vision Res 19: 491–500, 1979.
Morgan MJ and Castet E. Stereoscopic depth perception at high velocities.Nature 378: 380–383, 1995.
Morgan MJ and Fahle M. Motion-stereo mechanisms sensitive to inter-ocular phase. Vision Res 40: 1667–1675, 2000.
Morgan MJ and Tyler CW. Mechanisms for dynamic stereomotion respondselectively to horizontal velocity components. Proc R Soc Lond B Biol Sci262: 371–376, 1995.
Morgan MJ and Ward R. Interocular delay produces depth in subjectivelymoving noise patterns. Q J Exp Psychol 32: 387–395, 1980.
Movshon J, Thompson I, and Tolhurst DJ. Spatial summation in thereceptive fields of simple cells in the cat’s striate cortex. J Physiol 283:53–77, 1978a.
Movshon JA and Newsome W. Visual response properties of striate corticalneurons projecting to area MT in macaque monkeys. J Neurosci 16:7733–7741, 1996.
Movshon JA, Thompson ID, and Tolhurst DJ. Spatial and temporal contrastsensitivity of neurones in areas 17 and 18 of the cat’s visual cortex. J Physiol283: 101–120, 1978b.
Ohzawa I, DeAngelis GC, and Freeman RD. Stereoscopic depth discrimi-nation in the visual cortex: neurons ideally suited as disparity detectors.Science 249: 1037–1041, 1990.
Orban GA, Kennedy H, and Bullier J. Velocity sensitivity and directionselectivity of neurons in areas V1 and V2 of the monkey: influence ofeccentricity. J Neurophysiol 56: 462–480, 1986.
Pack CC, Born RT, and Livingstone MS. Two-dimensional substructure ofstereo and motion interactions in macaque visual cortex. Neuron 37: 525–535, 2003.
Perez R, Gonzalez F, Justo MS, and Ulibarrena C. Interocular temporaldelay sensitivity in the visual cortex of the awake monkey. Eur J Neurosci11: 2593–2595, 1999.
Pettigrew JD, Nikara T, and Bishop PO. Binocular interaction on singleunits in cat striate cortex: simultaneous stimulation by single moving slitwith receptive fields in correspondence. Exp Brain Res 6: 391–410, 1968.
Pollard SB, Mayhew JE, and Frisby JP. PMF: a stereo correspondencealgorithm using a disparity gradient limit. Perception 14: 449–470, 1985.
Prince SJ, Pointon AD, Cumming BG, and Parker AJ. The precision ofsingle neuron responses in cortical area V1 during stereoscopic depthjudgments. J Neurosci 20: 3387–3400, 2000.
Prince SJ, Pointon AD, Cumming BG, and Parker AJ. Quantitative anal-ysis of the responses of V1 neurons to horizontal disparity in dynamicrandom-dot stereograms. J Neurophysiol 87: 191–208, 2002.
Pulfrich C. Die Stereoscopie im Dienste der isochromen und heterochromenPhotometrie. Naturwissenschaft 10: 553–564, 1922.
Qian N. Computing stereo disparity and motion with known binocular cellproperties. Neural Comput 6: 390–404, 1994.
Qian N. Binocular disparity and the perception of depth. Neuron 18: 359–368,1997.
Qian N and Andersen RA. A physiological model for motion-stereo integra-tion and a unified explanation of Pulfrich-like phenomena. Vision Res 37:1683–1698, 1997.
Read JCA. A Bayesian approach to the stereo correspondence problem.Neural Comput 14: 1371–1392, 2002.
Read JCA and Cumming BG. Testing quantitative models of binoculardisparity selectivity in primary visual cortex. J Neurophysiol 90: 2795–2817, 2003.
Reid RC, Soodak RE, and Shapley RM. Directional selectivity and spatio-temporal structure of receptive fields of simple cells in cat striate cortex.J Neurophysiol 66: 505–529, 1991.
Reid RC, Victor JD, and Shapley RM. Broadband temporal stimuli decreasethe integration time of neurons in cat striate cortex. Vis Neurosci 9: 39–45,1992.
Ross J. Stereopsis by binocular delay. Nature 248: 363–364, 1974.Ross J. The resources of binocular perception. Sci Am 234: 80–86, 1976.Ross J and Hogben JH. Short-term memory in stereopsis. Vision Res 14:
1195–1201, 1974.Ross J and Hogben JH. Letter: the Pulfrich effect and short-term memory in
stereopsis. Vision Res 15: 1289–1290, 1975.Schiller PH, Finlay BL, and Volman SF. Quantitative studies of single-cell
properties in monkey striate cortex. I. Spatiotemporal organization ofreceptive fields. J Neurophysiol 39: 1288–1319, 1976.
Sutter EE and Bearse MA Jr. The optic nerve head component of the humanERG. Vision Res 39: 419–436, 1999.
Tolhurst DJ, Walker NS, Thompson ID, and Dean AF. Non-linearities oftemporal summation in neurones in area 17 of the cat. Exp Brain Res 38:431–435, 1980.
Tsai JJ and Victor JD. Reading a population code: a multi-scale neural modelfor representing binocular disparity. Vision Res 43: 445–466, 2003.
Tyler CW. Stereopsis in dynamic visual noise. Nature 250: 781–782, 1974.Tyler CW. Stereomovement from interocular delay in dynamic visual noise:
a random spatial disparity hypothesis. Am J Optom Physiol Opt 54: 374–386, 1977.
1553INTEROCULAR DELAY, STEREOACUITY, AND V1 NEURONS
J Neurophysiol • VOL 94 • AUGUST 2005 • www.jn.org
on May 24, 2006
jn.physiology.orgD
ownloaded from