Embed Size (px)
Citation preview
The International Journal of Engineering and Science (IJES)
|| Volume || 7 || Issue || 4 Ver. I || Pages || PP 08-19 || 2018 ||
ISSN (e): 2319 – 1813 ISSN (p): 23-19 – 1805
DOI:10.9790/1813-0704010819 www.theijes.com Page 8
EFFECT OF LITHOLOGY BARRIERS AND COMPOSITE LAYERING ON
FRACTURE HEIGHT IN UNCONVENTIONAL RESERVOIRS
1abdunaser O. Susi, 2paul L. Sims, 3shranya Sharma, 4khalid A. Elwegaa, 5mahmoud A. Mahrous, 6lloyd R. Heinze, 7mohamed. Y. Soliman
1,2,3, 4Department of Petroleum Engineering, Texas Tech University, USA, 5 Department of Geosciences, Texas Tech University, USA
6Bob L. Herd Department of Petroleum Engineering, Texas Tech University, USA, 7Department Chair, Petroleum Engineering, University of Houston, USA
Corresponding author: Abdunaser O. Susi
--------------------------------------------------------ABSTRACT---------------------------------------------------------------
Before designing and creating a hydraulic fracture, it is important to understand the parameters that determine
the fracture geometry and whether the fracture extends beyond the pay zone. By fixing other mechanical
parameters (i.e. Stress, Young’s modulus, Poisson’s ratio, and Fracture toughness), this study investigates how
the lithology barriers and, more importantly, the Composite Layering Effect (CLE) of the pay zone affect the
fracture geometry. Additionally, the effect of permeability on fractur geometry at several CLE values examined
using three different scenarios (no permeability, low permeability, and high permeability). This study used
FracPro software to investigate the effect of lithology barriers and composite layering on the fracture geometry.
Several simulation cases were run with different CLEs (1, 10, 20, and 100), and the height/length ratio of the
fracture was estimated. A generalized equation was developed that calculates the CLE from the height/length
ratio of the fracture in the required range at the payzone. This equation was able to reliably assess containment,
showing that it can be used in the fracture treatment of high-risk zones, such as those with water-bearing layers
and/or oil-water or oil-gas contact.
Keywords: hydraulic fracture, fracture geometry, Composite Layering Effect, height/length ratio.
-----------------------------------------------------------------------------------------------------------------------------------------
Date of Submission: 24-03-2018 Date of acceptance: 08-04-2018
-----------------------------------------------------------------------------------------------------------------------------------------
I. INTRODUCTION
Hydraulic fracturing is a technology that has been in practice since the late 1940s to improve
production from reservoirs. Hydraulic fractures are manufactured flow paths by which hydrocarbons are
efficiently extracted from low-permeability rocks. The fracture is constructed by a planned injection of high-
pressure fluid that encounters a sufficient volume of rock to result in economic production. When designing a
hydraulic fracture project, many parameters must be considered to get a successful hydraulic fracturing job.
Composite Layering Effect (CLE) plays a major role in the fracture geometry and design process and it is
essential to understand the CLE effect because it controls and affects the fracture height across the layers.
1.1 Composite layering effect mechanism
L. Weijers, et al., (2005) explained the Composite Layering Effect (CLE) mechanism during hydraulic
fracturing. CLE reflects the resistance of the fracture growth through layer interfaces. As a fracture tip grows
through layer interfaces, some of these interfaces may become partially debonded and the fracture may start
growing again at a local weakness offset from the original path. The consequence of composite layering is loss
of leverage along the fracture height, resulting in a significant decrease in the vertical growth rate. The model
impact of this parameter in the model is that the fracture height is exchanged for fracture half-length. Figure 1
depicts the CLE effect on fracture height growth. Determination of this value of CLE helps in the model
calibration and matching net pressures where additional height confinement is required other than the
conventional mechanisms such as stress contrast, modulus contrast, fracture toughness, and permeability.

Effect Of Lithology Barriers And Composite Layering On Fracture Height In
DOI:10.9790/1813-0704010819 www.theijes.com Page 9
Figure 1: an example of composite layering and width decoupling (Neil, S. 2015).
1.2 Fracture growth in complex media
Many researchers were investigating the fracture growth especially in layered formations (Daneshy, A.
A.1978) presented theoretical and experimental developments work involving propagation of hydraulic fractures
in layered formations. He did fracturing experiments with layered samples show that with strong bonding
between rocks it was difficult to contain a fracture in a formation totally. He concluded that the primary factor in
fracturing of layered formations is the strength of the interface. Weak interfaces between the layers are likely to
stop fracture propagation, regardless of the relative properties of formations. Strongly bonded interfaces
eventually will allow fracture extension through them. (Gordon D. Anderson et al.1981) performed small-scale
laboratory experiments to study the growth of hydraulically driven fractures near an unbonded interface in rocks.
Their objective was to evaluate under which conditions the hydraulic fractures would cross the interface. They
used Nugget sandstone from Utah (3 to 6% porosity) and Indiana limestone (12 to 15% porosity). The results
demonstrated that cracks, which intersect the interface from the side opposite the approaching hydraulic fracture,
can impede fracture growth across the interface. (C.A. Wright et al. 1999) presented examples of measuring
hydraulic fracture growth in different environments; they discussed the implications of the observed fracture
growth, for example, factors or mechanisms that control hydraulic fracture growth. They concluded that
increased fracture height confinement may result from complicated layer interface effects that are not effectively
handled by fracture modeling efforts. (Jennifer L. Miskimins, et al. 2003) presented the results of hydraulic
fracture modeling in a hydrocarbon reservoir consisting of laminated sand and shale sequences in Mesaverde
reservoir using hydraulic fracture software (GOHFER). In this study, thin beds are considered to be less than 6
inches in thickness. The results of their study strongly indicate that the sand and shale limitations present act as a
hydraulic fracture height containment mechanism. The contrast in rock mechanical property values between the
sand and shale intervals reduce the fracturing energy available for fracture propagation.
Because fracturing materials (fluids, proppant, chemicals), and pumping hydraulic horsepower are
expensive, the industry has been motivated since the inception of fracturing to understand and control fracture
growth. Many research were conducted to study the fracture growth in the complex media and the influence of
some parameters on fracture growth were investigated too. (Kevin Fisher et al. 2011) presented that hydraulic
fracture growth is influenced by a multiplicity of factors that are common in any reservoir. They concluded that
in situ stress distribution, interfaces, natural fractures, composite layering and other heterogeneities significantly
affect the fracture growth. (X. Garcia et al. 2013) presented a numerical model which incorporates the physics of
fracture growth. The approach is based on the discrete element method (DEM) and accounts for the physics of
fracture growth from basic principles. They used this approach to study the influence of toughness contrast on
the propagation mode of a fracture through an interface separating two formations. Four main propagation
modes were observed for Mode I fractures: straight crossing across the interface between layers, arrest at the
interface, propagation across the interface but with a T-shaped fracture and reinitiating the fracture with an
offset. (Han Li, et al. 2016) utilized a recently developed Finite Element-Discrete Element Method (FEDEM)
code to simulate the complex fracture propagation in shale formations. They studied hydraulic fracture height
predictions in laminated shale formations. The simulation results show that in typical mechanical anisotropic

Effect Of Lithology Barriers And Composite Layering On Fracture Height In
DOI:10.9790/1813-0704010819 www.theijes.com Page 10
formation (laminated formation), fracture height is always smaller than the fracture height in mechanical
isotropic formation, and the fracture tends to propagate (at least temporarily) along the bedding plane interfaces.
II. METHODOLOGY
2.1. Composite Layering Effect Analysis
In this study, layered formation was built to investigate the effect of composite layering. There were ten
layers and the target pay zone was sandstone with the height of 89 ft. Figure 2 shows all mechanical properties
of the layers where all these properties above and below the pay zone were maintained constant. Several
simulation cases were run according to the following assumptions:
1. Estimated height to length ratios were varied from 0.1 to 1 for a given CLE payzone value.
2. Regenerate the data for a different payzone CLE value. We chose 1, 10, 20 and 100.
3. Additionally, the effect of permeability was studied for three scenarios; no permeability,
low permeability, and high permeability.
Figure 2: layers and input parameters (FracPro software)
Table 1 illustrates the parameters of treatment design have applied as a real data to be used in FracPro
software
Table 1: Design Treatment Schedule
Stage # Stage Type Elapsed
Time
min:sec
Fluid
Type
Clean
Volume
(gal)
Prop Conc
(ppg)
Stage
Prop.
(klbs)
Slurry
Rate
(bpm)
Proppant
Type
Wellbore Fluid KCL_3 7165
1 Water injection 20:14 WG1812CP 8500 0.00 0.0 10.00
2 Shut-in 25:14 SHUT-IN 0 0.00 0.0 0.00
3 Minifrac 34:09 WG1812CP 15000 0.00 0.0 40.00
4 Shut-in 64:09 SHUT-IN 0 0.00 0.0 0.00
5 Main frac pad 87:58 SIR27CP 40000 0.00 0.0 40.00
6 Main frac slurry 94:21 SIR27CP 10000 2.00 20.0 40.00 CarboProp 20/40
7 Main frac slurry 101:35 SIR27CP 11000 3.00 33.0 40.00 CarboProp 20/40
8 Main frac slurry 110:26 SIR27CP 13000 4.00 52.0 40.00 CarboProp 20/40
9 Main frac slurry 120:15 SIR27CP 14000 5.00 70.0 40.00 CarboProp 20/40
10 Main frac slurry 126:45 SIR27CP 9000 6.00 54.0 40.00 CarboProp 20/40
11 Main frac slurry 128:59 SIR27CP 3000 7.00 21.0 40.00 CarboProp 20/40
12 Main frac flush 133:12 WG1822CP 7100 0.00 0.0 40.00
13 Shut-in 138:12 SHUT-IN 0 0.00 0.0 0.00

Effect Of Lithology Barriers And Composite Layering On Fracture Height In
DOI:10.9790/1813-0704010819 www.theijes.com Page 11
Table 2 shows dept of all layers including the target pay zone and mechanical properties of these layers
Table 2: Layer Parameters
Layer # Top of zone
TVD, (ft)
Top of zone
MD, (ft)
Stress
(psi)
Stress
Gradient
(psi/ft)
Young's
modulus
(psi)
Poisson's
ratio
Lakoff
Coefficient
(ft/min½)
Pore Fluid
Perm., (mD)
33 11357.0 11357.0 11478 1.010 2.31e+06 0.310 0.000e+00 0.000e+00
34 11368.0 11368.0 10074 0.886 3.89e+06 0.240 0.000e+00 0.000e+00
35 11376.0 11376.0 11686 1.026 1.75e+06 0.290 0.000e+00 0.000e+00
36 11399.0 11399.0 11686 1.025 1.75e+06 0.290 0.000e+00 0.000e+00
37 11405.0 11405.0 11686 1.025 1.75e+06 0.290 0.000e+00 0.000e+00
38 11407.0 11407.0 11686 1.024 1.75e+06 0.290 0.000e+00 0.000e+00
39 11409.0 11409.0 11686 1.023 1.75e+06 0.290 0.000e+00 0.000e+00
40 11428.0 11428.0 10177 0.887 3.32e+06 0.250 2.178e-03 2.100e-02
41 11517.0 11517.0 11686 1.014 1.75e+06 0.290 0.000e+00 0.000e+00
42 11527.0 11527.0 11686 1.014 1.75e+06 0.290 0.000e+00 0.000e+00
43 11528.0 11528.0 11686 1.013 1.75e+06 0.290 0.000e+00 0.000e+00
44 11538.0 11538.0 11686 1.012 1.75e+06 0.290 0.000e+00 0.000e+00
45 11552.0 11552.0 11975 1.036 2.42e+06 0.310 0.000e+00 0.000e+00
46 11565.0 11565.0 10712 0.926 3.78e+06 0.260 0.000e+00 0.000e+00
2.2. Estimate height length ratio in layer
The first part of this study focused on developing a generalized equation to determine a CLE value for a
given layer based on the desired estimated height/length ratio or height confinement in the layer. We discovered
the height/length ratio in the layer, as predicted by the software, depends on the reference CLE assigned to the
payzone. This equation enables fracture optimization prior to fracture design. Figure 3 shows a Cartesian plot of
the estimated height/length ratio in each layer vs. the composite layering effect value that was assigned to the
layer. Four curves were generated based on different pay zone CLE value 1, 10, 20 and 100. Interesting all the
curve fits has the same power index of ~ -0.434.
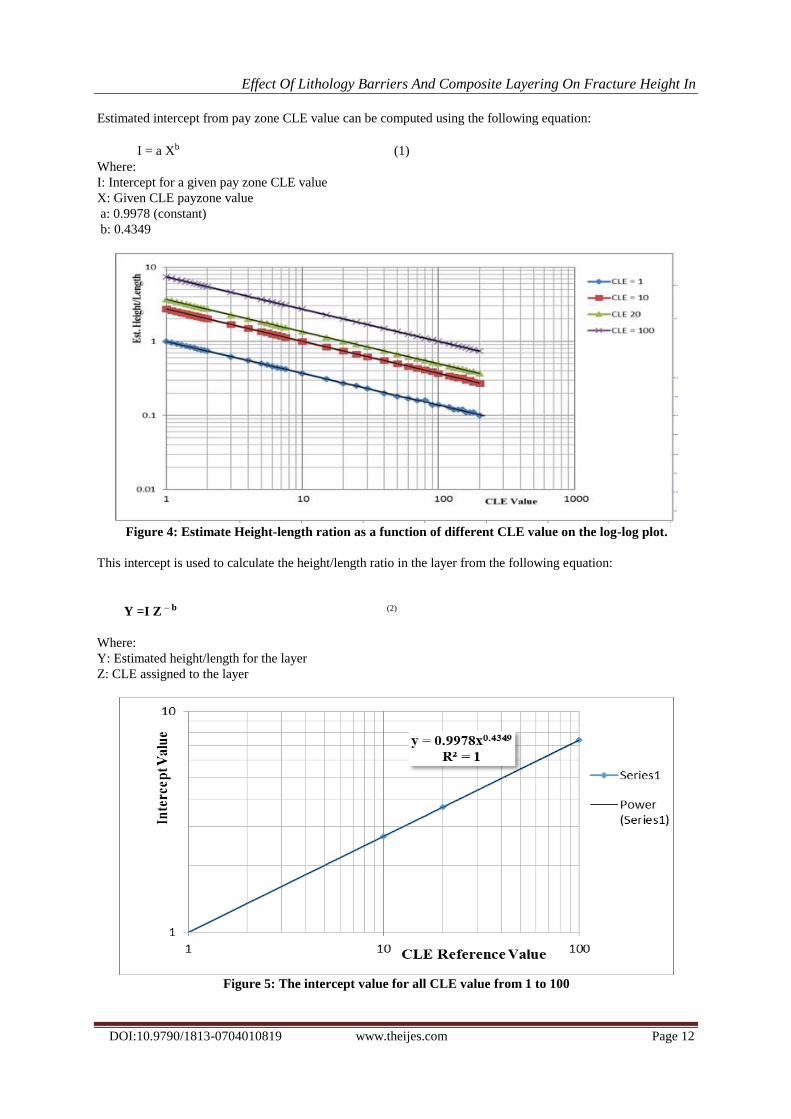
The same plot was regenerated on a log-log scale. Figure 4 have the same slope, but different
intercepts. These intercept values were estimated by plotting them vs. their respective pay zone CLE values
forming a linear trend as shown in figure 5. The results allowed us to use a generalized model in estimating the
height/length ratios in each layer based on CLE assigned to the pay zone and the layer.
Figure 3: Estimate Height-length ration as function of different CLE value.
Effect Of Lithology Barriers And Composite Layering On Fracture Height In
DOI:10.9790/1813-0704010819 www.theijes.com Page 12
Estimated intercept from pay zone CLE value can be computed using the following equation:
I = a Xb (1)
Where:
I: Intercept for a given pay zone CLE value
X: Given CLE payzone value
a: 0.9978 (constant)
b: 0.4349
Figure 4: Estimate Height-length ration as a function of different CLE value on the log-log plot.
This intercept is used to calculate the height/length ratio in the layer from the following equation:
Y =I Z – b (2)
Where:
Y: Estimated height/length for the layer
Z: CLE assigned to the layer
Figure 5: The intercept value for all CLE value from 1 to 100
Effect Of Lithology Barriers And Composite Layering On Fracture Height In
DOI:10.9790/1813-0704010819 www.theijes.com Page 13
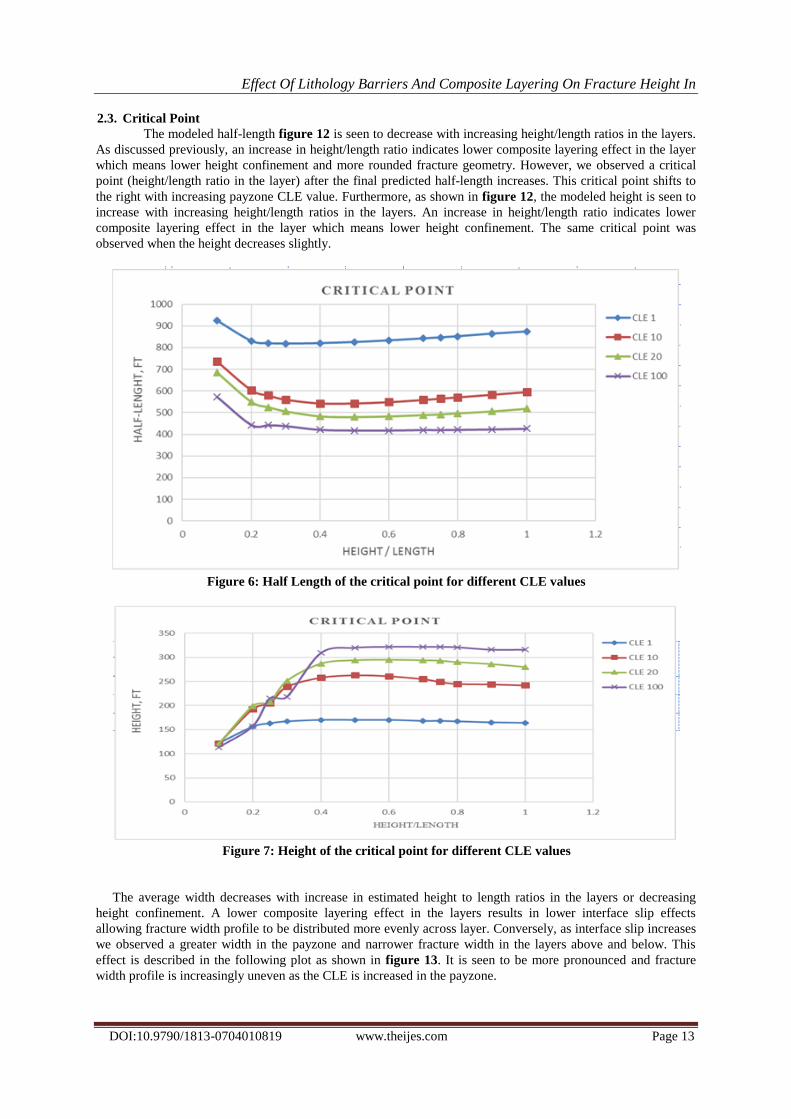
2.3. Critical Point
The modeled half-length figure 12 is seen to decrease with increasing height/length ratios in the layers.
As discussed previously, an increase in height/length ratio indicates lower composite layering effect in the layer
which means lower height confinement and more rounded fracture geometry. However, we observed a critical
point (height/length ratio in the layer) after the final predicted half-length increases. This critical point shifts to
the right with increasing payzone CLE value. Furthermore, as shown in figure 12, the modeled height is seen to
increase with increasing height/length ratios in the layers. An increase in height/length ratio indicates lower
composite layering effect in the layer which means lower height confinement. The same critical point was
observed when the height decreases slightly.
Figure 6: Half Length of the critical point for different CLE values
Figure 7: Height of the critical point for different CLE values
The average width decreases with increase in estimated height to length ratios in the layers or decreasing
height confinement. A lower composite layering effect in the layers results in lower interface slip effects
allowing fracture width profile to be distributed more evenly across layer. Conversely, as interface slip increases
we observed a greater width in the payzone and narrower fracture width in the layers above and below. This
effect is described in the following plot as shown in figure 13. It is seen to be more pronounced and fracture
width profile is increasingly uneven as the CLE is increased in the payzone.

Effect Of Lithology Barriers And Composite Layering On Fracture Height In
DOI:10.9790/1813-0704010819 www.theijes.com Page 14
Figure 8: Average width of the critical point for different CLE values.
2.4. Effect of permeability
The same graphs were analyzed for the effect of permeability and the compare between CLE value of 1
and 100 in the payzone.
Lower fracture half-length was observed in a high permeability formation as shown in figures 9 and 10
. Also, the rate of decrease in fracture half-length with increase in height/length ratios for high permeability
formation was greater. This phenomenon is attributed to the high leak off fluid pressure as well as the lower
fracture fluid pressure in high permeability formation. Furthermore, Low and no permeability cases showed
similar results, which might be due to low magnitude of low permeability parameters that was chosen.
Moreover, a comparison was made between high and low payzone CLE. The results show that,
increasing pay zone CLE values caused a reduction in the fracture half-length scales. Whereas, in low CLE in
payzone, the average variation in the fracture width exhibited lower values compared to payzone with high CLE
Figures 11 and 12. The effect of permeability were observed with high leak-off in high permeability zone,
which resulted in lower fracture width. This effect was observed in the payzone that exhibit high CLE, only after
the effects of height confinement was reduced to height/length ratios of 0.6.
Figures 13 and 14 shows an increase in fracture height with payzone CLE . Moreover, when we have a
low CLE values , we will have a lower chance to have interface slip effect. This resulte indicated that higher
payzone CLE causes higher chance for a unconfinment fracture design. Furthermore, the low permeability will
help the study to design fracture geometry in a better desirable range of fracture high in a payzone.
Figure 9: Half Length comparison for different permeability zone (payzone CLE = 1)

Effect Of Lithology Barriers And Composite Layering On Fracture Height In
DOI:10.9790/1813-0704010819 www.theijes.com Page 15
Figure 10: Half Length comparison for different permeability zone (payzone CLE = 100)
Figure 21: Avg. Width comparison for different permeability zone (payzone CLE = 1)
Figure 3: Avg. width comparison for different permeability zone (payzone CLE = 100)

Effect Of Lithology Barriers And Composite Layering On Fracture Height In
DOI:10.9790/1813-0704010819 www.theijes.com Page 16
Figure 13: Fracture height comparison for different permeability zone (left - payzone CLE = 1)
Figure 14: Fracture Height comparison for different permeability zone (payzone CLE = 100)
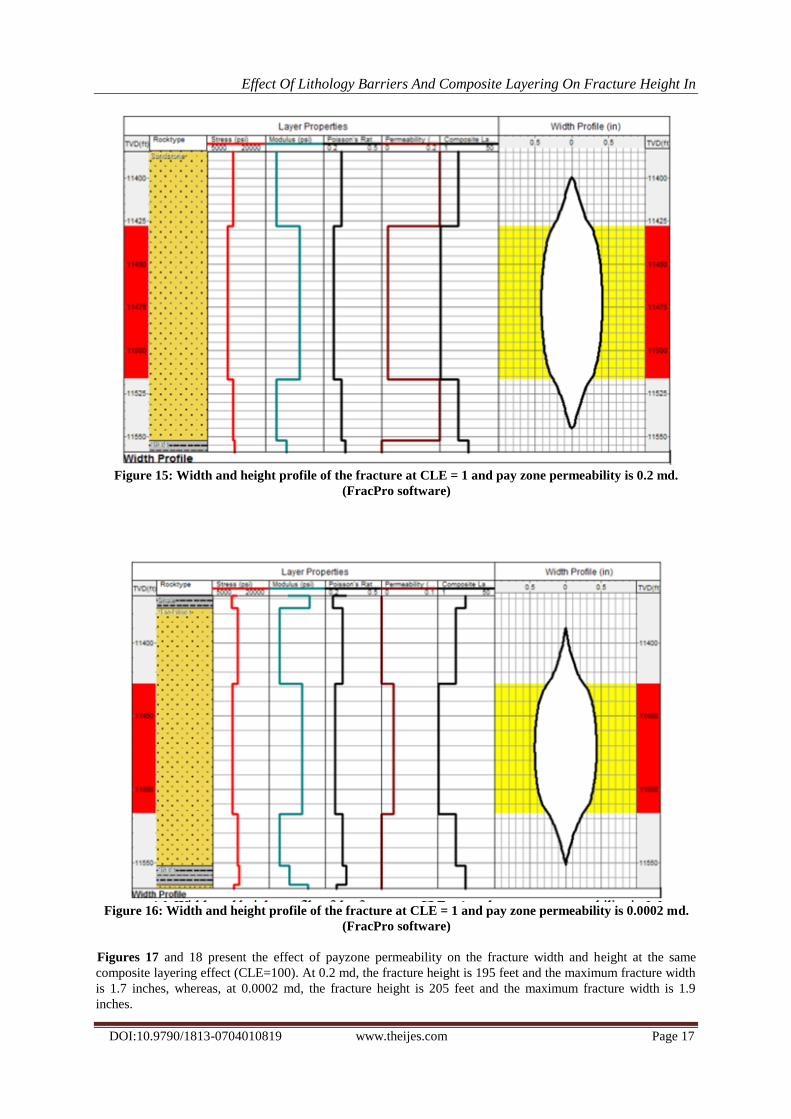
Figures 15 and 16 present the effect of pay zone permeability on the fracture width and height at the
same composite layering effect (CLE =1). At 0.2 md, the fracture height is 145 feet which expanded out of the
pay zone boundaries, and the maximum fracture width is 0.8 inches, whereas at 0.0002 md, the fracture height is
160 feet, and the maximum fracture width is 0.9 inches.
Effect Of Lithology Barriers And Composite Layering On Fracture Height In
DOI:10.9790/1813-0704010819 www.theijes.com Page 17
Figure 15: Width and height profile of the fracture at CLE = 1 and pay zone permeability is 0.2 md.
(FracPro software)
Figure 16: Width and height profile of the fracture at CLE = 1 and pay zone permeability is 0.0002 md.
(FracPro software)
Figures 17 and 18 present the effect of payzone permeability on the fracture width and height at the same
composite layering effect (CLE=100). At 0.2 md, the fracture height is 195 feet and the maximum fracture width
is 1.7 inches, whereas, at 0.0002 md, the fracture height is 205 feet and the maximum fracture width is 1.9
inches.

Effect Of Lithology Barriers And Composite Layering On Fracture Height In
DOI:10.9790/1813-0704010819 www.theijes.com Page 18
Figure 17: Width and height profile of the fracture at CLE = 100 and pay zone permeability is 0.2 md.
(FracPro software)
Figure 18: Width and height profile of the fracture at CLE = 100 and pay zone permeability is 0.0002 md.
(FracPro software)

Effect Of Lithology Barriers And Composite Layering On Fracture Height In
DOI:10.9790/1813-0704010819 www.theijes.com Page 19
III. CONCLUSION
FracPro software was utilized to analyze the composite layering effect (CLE) on the fracture height and
width with different permeability values. Based on the study presented in this paper there are three parameters
change for different payzone CLE at a specific point which is the critical point with permeability effect as
following:
- At the Half-Length dimension; the results showed that the critical point is high and this point decreases
as CLE is increased, also the critical point shifted to the right with increasing CLE. As well the permeability has
an obvious effect here where it decreases with decreasing CLE, also decreasing CLE tends to have more of
confined fracture, whereas at the low permeability formation tends to be confined fracture.
- At the Height dimension; the critical point increases with increasing CLE, and lower CLE provides
a chance to have confined fracture. Low permeability gives a higher chance to have unconfined fracture.
- At the Average-Width dimension the critical point decreases with increasing CLE, and lower CLE
gives a chance to have lower interface slip effect. The permeability increases with increasing CLE, and high
CLE chances to have a higher chance unconfined fracture, whereas the low permeability tends to have confined
fracture.
- Further work is needed, especially mineralogical and chemical composition investigation as well as
X- ray computed tomography study, to corroborate the conclusion obtained from the equation presented herein.
REFERENCES [1]. Daneshy, A. A., Hydraulic Fracture Propagation in Layered Formations. Society of Petroleum Engineers Journal, vol. 18, Issue 01,
February 1978.
[2]. Gordon D. Anderson, Lawrence Livermore Natl., Effects of Friction on Hydraulic Fracture Growth Near Unbounded
Interfaces in Rocks. Society of Petroleum Engineers Journal, vol. 21. Issue 01, February 1981.
[3]. C.A. Wright et al, Understanding Hydraulic Fracture Growth: Tricky but Not Hopeless, SPE Conference Paper-56724, Houston,
Texas, U.S.A., Oct. 3-6, 1999.
[4]. Jennifer L. Miskimins, Modeling of Hydraulic Fracture Height Containment in Laminated Sand and Shale sequences, SPE paper-
80935, SPE Production and Operations Symposium held in Oklahoma City, Oklahoma, U.S.A. 22-25 March 2003.
[5]. Kevin Fisher et al., Hydraulic Fracture-Height Growth: Real Data, SPE Conference Paper-145949, Denver, Colorado, USA, 30
October–2 November 2011.
[6]. X. Garcia et al., Revisiting Vertical Hydraulic Fracture Propagation Through Layered Formations – A Numerical Evaluation,
ARMA Conference Paper 203–2013, San Francisco, CA, USA, 23-26 June 2013.
[7]. Han Li, et al., Hydraulic Fracture Height Predictions in Laminated Shale Formations Using Finite Element Discrete Element
Method, SPE Hydraulic Fracture Technology Conference Paper-179129, held in The Woodlands, Texas, U.S.A., 9-11 February
2016.
[8]. L. Weijers, et al, Developing Calibrated Fracture Growth Models for Various Formations and Regions across the United States,
SPE paper- 96080, SPE Annual Technical Conference and Exhibition held in Dallas, Texas, U.S.A., 9-12 October 2005.
[9]. Neil, S. (2015). Hydraulic fracturing. Halliburton. Retrieved on November 25, 2015, from
http://www.halliburton.com/public/projects/pubsdata/Hydraulic_Fracturing/fracturing_101.html