Embed Size (px)
Citation preview
1
Effect of Joint Auditor Pair Composition on Conservatism:
Evidence from Impairment Tests
Gerald Lobo
University of Houston, [email protected]
Luc Paugam*
ESSEC Business School, [email protected]
Dana Zhang
University of Houston, [email protected]
Jean-François Casta
Université Paris-Dauphine, [email protected]
This version: September 10, 2013
We gratefully acknowledge the helpful comments of Pierre Astolfi, Sean Dennis, Thomas
Jeanjean, Christian Kuiate, Henri Philippe, and workshop participants at University of
Houston, ESSEC, the 2013 AAA Annual Meeting, the 2013 AAA Auditing Mid-year
Meeting, , and the 1st French Workshop in Audit. Gerald Lobo is a Professor at The
University of Houston – Bauer College of Business. Luc Paugam is a member of the
Accounting and Management Control Department at ESSEC Business School. Dana Zhang is
a PhD candidate at The University of Houston – Bauer College of Business. Jean-François
Casta is a member of Dauphine Recherche en Management (DRM), CNRS Unit, UMR 7088.
*Corresponding author
1
Effect of Joint Auditor Pair Composition on Conservatism:
Evidence from Impairment Tests
ABSTRACT: Using a sample of firms from France, where the law requires use of two
auditors, we examine the effect of auditor pair composition on overall measures of
unconditional and conditional conservatism, as well as on a specific measure of conditional
conservatism, i.e., impairment loss. We document that Big 4–non-Big 4 auditor pairs are more
unconditionally and conditionally conservative, more likely to book impairments when
operating performance is low, and likely to make more transparent impairment-related
disclosures than Big 4–Big 4 auditor pairs. We argue that higher conservatism is mainly
driven by higher auditor independence for the Big 4–non-Big 4 auditor pair, because unequal
risk sharing in the Big 4–non-Big 4 auditor pair motivates the Big 4 auditor to maintain a high
level of independence and enforce conservative accounting. Our results inform investors and
firms in mandatory or voluntary joint audit regimes and regulators who are considering
requiring joint audit to improve audit quality.
Keywords:
Joint Audit, Audit Quality, Auditor Independence, Conservatism, Impairment Testing
JEL Classifications: K22, G18, M42, M48, C72
2
1. Introduction
The recent financial crisis has led regulators and others to question whether audit firms lack
“the requisite independence, expertise and incentives to construct the promised ‘true’ and
‘fair’ account of corporate affairs” (Sikka 2009, p. 868). As a result, regulatory authorities
around the world have proposed solutions aimed at improving audit firms’ ability to detect
and prevent corporate bankruptcies, frauds and failures. The European Commission, in its
Green Paper released in 2010, proposed the use of joint audits to improve audit quality and
reduce audit market concentration. Similar initiatives have been proposed by regulatory
authorities in the UK, India and China.
In this study, we examine the implications of auditor pair composition in a joint audit
for audit quality. Joint audit refers to an audit in which two independent auditors audit the
financial statements with shared audit effort, sign a single auditor’s report, and bear joint
liability in case of an audit failure (Ratzinger-Sakel, Audousset-Coulier, Kettunen, and Lesage
2012, p. 9). Joint audit is not double audit; rather, the two auditors work together on audit
planning and allocate audit work and audit fees accordingly. They review each other’s work
and issue a single audit opinion. Joint audit has been implemented in several countries either
on a mandatory or voluntary basis. In France, joint audit is mandatory for all companies
preparing consolidated financial statements. Joint audit was mandatory in Denmark and South
Africa, but now is voluntary. Joint audit is mandatory for a subgroup of firms in some
countries. For example, India requires joint audit for state-owned enterprises and Saudi
Arabia and Algeria mandate joint audit for banks.1
Although mandatory joint audit is not as prevalent around the world, it remains of
considerable interest to both researchers and policy makers. At issue is whether joint audit can
improve audit quality? DeAngelo (1981) defines audit quality as the market-assessed joint
probability that a given auditor will both discover a breach in an accounting system and report
the breach. In other words, audit quality is a function of the auditor’s ability to detect material
misstatements (auditor competence) and the auditor’s willingness to report discovered
material misstatements (auditor independence). Joint audit could positively affect both
components of audit quality.
1 Sweden and Canada required joint audit for banks but rescinded the requirement in 2006 and 1991,
respectively.
3
Holding independence constant, a joint audit could increase the probability of detecting
material misstatements because having another auditor review the work could increase the
probability of detecting the problem. Advocates of joint audit also argue that joint audit
benefits from complementarities of expertise and geographical coverage between the two
auditors, and enhances dialogue leading to better solutions for problems in which judgment
needs to be exercised (Mazars 2010).
Holding competence constant, joint audit could induce a higher level of auditor
independence for the following reasons. First, it weakens the economic bonding between the
auditor and the client because of fee sharing between the auditors (Mazars 2010; Zerni,
Haapamäki, Järvinen, and Niemi 2012). Second, it reduces the risk of auditor manipulation by
management because it might be more difficult for management to manipulate two auditors
instead of one. As long as the benefits of taking corrective action exceed the costs for any one
auditor, the problem will be reported and corrected (Zerni et al. 2012, p. 4). Third, it preserves
knowledge resulting from staggered auditor appointments. Joint auditors usually rotate at
different times, which will likely increase auditor independence while ensuring continuity by
preserving the auditors’ knowledge of the auditee (Carcello and Nagy 2004).
However, a joint audit may also negatively affect audit quality. First, a joint audit
potentially entails high organization and coordination costs, which may lead to free riding by
one or both members of the audit team. Second, inappropriate cooperation during the audit
could lead to insufficient information exchange between the two auditors and in fine to lower
audit quality (Neveling 2007). Third, as noted by Deng, Tong, Simunic, and Ye (2012), joint
audit may result in internal opinion shopping by the client.
The empirical evidence on the effect of joint audit on audit quality confirms the mixed
theoretical predictions. In 2004, when Denmark switched from a mandatory to a voluntary
joint audit regime, only 24 percent of publicly traded firms in Denmark retained the joint
audit structure, revealing a market preference for a single audit (Thinggaard and Kiertzner
2008). However, in the context of voluntary joint audits in Sweden, Zerni et al. (2012) find
evidence that joint audit is associated with higher audit quality. In addition to comparing audit
quality between joint audit and single audit, researchers also examine the effect of auditor pair
composition on audit quality; however, the results are conflicting. For example, Francis,
Richard, and Vanstraelen (2009) report that firms with two Big 4 auditors in France, where
joint audit is mandatory, have smaller income-increasing abnormal accruals, whereas
Marmousez (2009) documents that firms with two Big 4 auditors are less conservative in
4
reporting bad news. These conflicting results suggest that, in addition to the audit regime
itself, the composition of the auditor pair in a joint audit may differentially affect audit
quality.
Based on the preceding discussion, two important questions that can inform the debate
on the implications of joint audit for audit quality are as follows: (1) Is audit quality higher
with one or two auditors? (2) If a firm chooses two auditors, does audit quality depend on the
mix of auditors selected (i.e., whether the firm uses two Big 4 auditors or one Big 4 and one
non-Big 4 auditor, of two non-Big 4 auditors)? To answer the first question, we need to either
compare joint audit firms and single audit firms in a voluntary joint audit regime or compare
joint audit firms in a mandatory joint audit regime with single audit firms in a mandatory
single audit regime. The first setting suffers from a severe self-selection problem.2 In the
second setting, it is difficult to effectively control for country level differences in economic,
regulatory and institutional factors other than joint audit that may affect audit quality. In
addition to research design difficulties, preliminary evidence on the impact of different
auditor pairs on audit quality indicates that the overall effect of joint audit on audit quality
may vary depending on the proportion of each auditor pair type (i.e., Big 4–Big 4, Big 4–non-
Big 4, non-Big 4–non-Big 4) in the sample. As a result, understanding the implications
auditor pair composition for the effect of joint audit on audit quality can potentially explain
the mixed empirical results of studies that compare joint audit and single audit. Since the two
exploratory studies on the second question yield contradictory results, there is much room for
study in this area. Thus, we focus on the second question in this paper.
Understanding the effect of auditor pair type on audit quality is also important to
regulators, investors and firms. First, it would be informative to policy makers to know
whether a particular auditor pair type results in superior audit quality. Second, one important
reason for the European Union favoring joint audits is that it is a way to reduce audit market
concentration by allowing non-Big 4 firms to pair with Big 4 firms and thus to play a larger
role in the audit market. However, it is unclear whether the benefit of such diversification on
market concentration would be lost if audit quality is lower for the pair of one Big 4 and one
non-Big 4 auditors. Our study provides empirical evidence on the effect of different auditor
2 In the case of voluntary joint audit, self-selection increases the probability of finding higher audit quality for
firms that chose two auditors versus for firms that chose only one auditor (Zerni et al. 2012). Although we also
face a self-selection problem in the case of auditor pair choice, we show in a sensitivity test that self-selection
works against finding our hypothesized results. In fact, we find stronger results after controlling for self-
selection.
5
pairs on audit quality. Third, whether different auditor pairs provide differential audit quality
is relevant to firms and investors in both a mandatory and a voluntary joint audit regime.
When firms’ audit committees decide which auditor pairs to hire or when investors evaluate
company’s audit quality, the impact of auditor pair type should be an important consideration.
We investigate this question in France, where the regulatory setting presents a unique
opportunity for assessing the effectiveness of different auditor pairs, as publicly listed
companies preparing consolidated financial statements have been required to be audited by (at
least) two unrelated auditors since 1966. In the French audit market, we observe a variety of
auditor pairs including Big 4–Big 4, Big 4–non-Big 4, and non-Big 4–non-Big 4. Audit
quality may differ across auditor pairs because the interactions between different auditors are
likely to alter both the competence and the independence dimensions of audit quality.
On the one hand, auditor competence could be higher for the pair of two Big 4 auditors
because Big 4 auditors are generally believed to possess more experience and expertise. On
the other hand, auditor independence could be higher for the pair of one Big 4 and one non-
Big 4 auditors due to unequal risk sharing. The Big 4 auditor in such a pair bears a
disproportionate share of the reputation and litigation costs, and thus has stronger incentives
to maintain higher audit quality. By contrast, because the reputation and litigation costs are
equally shared between them, a Big 4 auditor in a Big 4–Big 4 pair may have relatively
weaker incentives to maintain higher audit quality. As a result, although the Big 4–non-Big 4
pair may have lower auditor competence, it may have higher auditor independence than the
Big 4–Big 4 auditor pair. Thus, the overall effect of auditor pair composition on audit quality
is unclear and remains an empirical question.
Auditors, through their monitoring role, influence the outcome of financial reporting by
firms. Better monitoring translates into higher audit quality and higher financial reporting
quality, which can be measured by the extent of earnings management, likelihood of
bankruptcy or restatements, and degree of conservatism in financial reporting. In this study,
we first assess the implications of auditor pair composition for audit quality using general
measures of unconditional and conditional conservatism, and then supplement these analyses
with a procedure-specific measure of conservatism, namely impairment tests. Conservatism is
considered a key qualitative attribute of financial reporting (Watts 2003; Francis, LaFond,
Olsson, and Schipper 2004; Francis, Olsson, and Schipper 2006; Ball, Robin, and Sadka
2008; Dechow, Ge, and Schrand 2010; Kothari, Ramanna, and Skinner 2010).
6
Under both international accounting standards and US GAAP, impairment tests are
crucial to guarantee timely loss recognition (Kim, Lee, and Yoon 2013; Amiraslani, Latridis,
and Pope 2013 ), as impairment tests ensure that assets are not carried at more than their
economic value (also referred to as ‘recoverable value’ (IAS 36 § 1). International Financial
Reporting Standards, applicable in France since 2005, require that an impairment loss be
recognized whenever the recoverable amount is below the carrying amount (IAS 36 § 59).
The implementation of impairment tests usually relies on valuation models, requires
“significant judgment” from managers (Petersen and Plenborg 2010, p. 420), and is prone to
manipulation by managers because it relies on unverifiable fair value estimates (Hayn and
Hughes 2006; Ramanna 2008; Bens, Heltzer, and Segal 2011; Li and Sloan 2011; Ramanna
and Watts 2012). Disclosures of the subjective valuation assumptions used in impairment
tests also vary widely (ESMA 2013; Amiraslani et al. 2013 ). Consequently, the role of
auditors in maintaining objectivity and transparency of impairment tests and taking corrective
action to ensure that firms recognize economic impairments when they occur is more
pronounced.
Focusing on the relation between auditor pair composition and impairment of goodwill
and other intangible assets with indefinite useful life3 has several advantages over studying
the corresponding relations between more general measures of unconditional and conditional
conservatism. First, general unconditional and conditional conservatism measures such as
market-to-book ratio and the Basu (1997) asymmetric timeliness measure are affected by
many factors that are difficult to properly control. Focusing on a specific account can
potentially offer sharper and more powerful tests of the effect of auditor pair composition.
Second, impairment tests play a key role in ensuring timely loss recognition and hence
conservatism. Examining the impairment accounts allows us to observe the underlying
mechanism through which auditor pairs affect conservatism. Third, the impairment account is
more prone to manipulation due to the subjectivity associated with estimating fair values.
Several professional reports and the press recently signaled a lack of objectivity of
impairment tests for goodwill.4 If auditor pair composition has an effect on accounting
quality, this effect should be most noticeable in an account such as impairment where the
3 Since goodwill represents the bulk of intangibles with indefinite useful life, for brevity we use ‘goodwill’ for
‘goodwill and other intangibles with indefinite useful life’. 4 See (1) Ernst & Young (2010) ‘Meeting today’s financial challenges – Impairment reporting: Improving
stakeholder confidence’; (2) Houlihan Lokey (2013) ‘The European Goodwill Impairment Study 2012-2013’;
and (3) Tata Steel – Goodwill Hunting, May 14th
, 2013 on the website of The Economist. Available at:
http://www.economist.com/news/business/21578082-what-corus-write-reveals-goodwill-hunting
7
auditor’s role in monitoring management behavior is important. Fourth, the impairment
account is usually economically significant because it is related to a public firm’s largest
individual asset for which a “fair value” estimate is required, i.e., goodwill.5 Fifth,
transparency of impairment-related disclosures allows us to infer the effects of auditor
independence. Since the disclosure requirements are clearly delineated in accounting
standards, whether or not to require such disclosures will, to a large degree, depend on auditor
independence.
We conduct our empirical analysis on a sample consisting of all non-financial French
firms included in the SBF 120 index (the 120 largest market cap firms listed on the Paris
Bourse) over the period 2006 to 2009. We document the following results. First, firms audited
by a Big 4–non-Big 4 auditor pair exhibit a higher degree of unconditional conservatism,
proxied by (growth-adjusted) market-to-book ratio. Second, firms audited by a Big 4–non-Big
4 auditor pair exhibit a higher degree of conditional conservatism, proxied by the Basu (1997)
measure. Third, firms audited by a Big 4–non-Big 4 auditor pair are more likely to impair
assets when performance is low. Fourth, firms audited by a Big 4–non-Big 4 auditor pair have
more transparent impairment-related disclosures when performance is poor. Overall, our
results indicate higher levels of conservatism for firms audited by a Big 4–non-Big 4 auditor
pair than for firms audited by a Big 4–Big 4 auditor pair. These results are consistent with
better audit quality for the Big 4–non-Big 4 auditor pair. They also indirectly suggest that
auditor independence plays a more prominent role than auditor competence in explaining the
observed difference in level of conservatism across different auditor pairs.
We make several contributions to the literature. First, we provide evidence that deepens
our understanding of the consequences of the joint audit requirement for audit quality. We
challenge the common belief that two Big 4 auditors necessarily improve financial statement
quality. Our findings are relevant to the debate on audit reforms being considered by policy
makers around the world in their efforts to improve audit quality. Our study is also relevant
for countries where joint audits are voluntary (Algeria, Denmark, South-Africa, Sweden),
mandatory for specific sectors such as the financial sector (Algeria, Saudi Arabia), state-
owned enterprises (India), or mandatory for all sectors (Congo, France, Kuwait, Lebanon,
Morocco, the Ivory Coast, and Tunisia).6 Second, we demonstrate that interactions between
joint auditors have important implications for audit quality. Specifically, risk sharing between
5 From 2006 to 2009, goodwill represents on average 27% of total assets of the 120 French largest listed firms
(SBF 120) comprising our sample and all firms had carrying goodwill on their balance sheet. 6 See Ratzinger-Sakel et al. (2012).
8
joint auditors can have a significant impact on auditor independence and hence on audit
quality. Third, by focusing on a specific account, impairment, we are able to shed light on the
underlying mechanisms through which auditor pair types affect financial reporting quality.
Fourth, using the transparency test for impairment-related disclosures, we attempt to separate
the effect of auditor independence from that of auditor competence and show that Big 4–non-
Big 4 auditor pairs are more independent than Big 4–Big 4 auditor pairs.
The remainder of this paper is organized as follows. We provide a description of the
audit market in France in section 2, review the related literature in section 3, and develop the
hypotheses in section 4. We describe the sample selection and research design in section 5,
report our results in section 6, discuss self-selection issues in section 7, and conclude the
study in section 8.
2. The audit market in France
Since 1966, public firms in France are required to be audited by (at least) two distinct auditors
that share the audit process. Although threatened by the European regulation introducing
consolidated financial reporting in 1984, this joint audit requirement was reiterated by the
2003 French Financial Security Law that followed the Enron scandal.7 Auditors have a six-
year mandate and face (for mandates of listed firms) a compulsory (partner) rotation after
each mandate if the same audit firm is retained. Joint auditors are appointed by shareholders
through a resolution at the general meeting. There is no legal requirement for both auditors to
be appointed at the same time, i.e., audit firms may be subject to tender at different times
(staggered appointments) or at the same time (simultaneous appointments). French Financial
Security Law also requires that each joint auditor verifies the work undertaken by the other
auditor, leading to the joint audit report. Therefore, the joint audit is not a double audit where
each auditor duplicates its counterpart’s work. Instead, joint auditors must sign a single audit
report, i.e., agree on the same report independently, and are legally jointly liable for the issued
audit opinion. However, as indicated earlier, the actual liability may be different from the
legal rule as regulators are likely to differentially treat large and small audit firms.
Joint auditors share the workload and associated fees in conducting the audit process
according to quantitative criteria (e.g., number of estimated hours) and qualitative criteria
7 French Financial Security Law (2003). ‘Loi No 2003-706 du 1 août 2003 de sécurité financière, version
consolidée au 1er
avril 2006’, available at http://www.legifrance.gouv.fr. Francis et al. (2009, p. 38) also provides
specifics of the audit market in France.
9
(e.g., expertise required, geographical network of firms). The planning of the audit is
generally done by the two auditors and covers three phases: (1) the audit of consolidated
subsidiaries, (2) the audit of parent company’s accounts, (3) the audit of consolidation process
and of published financial information. The division of work between joint auditors is
different for these three phases. It is generally divided based on business, product or
geographical location for the audit of consolidated subsidiaries. The division of work for the
audit of the parent company is generally based on audit cycles (e.g., production/inventory
management, purchases/payables, or tax, IT and human resources for corporate functions).
Lastly, the division of audit work for the consolidation process and published financial
information is based either by topic (e.g., deferred taxes, finance lease entries, statement of
changes in equity, goodwill impairment tests), by business, or by geographical zones. This
last phase may be mainly performed by only one auditor (Mazars 2010).
According to the applicable French auditing standard (NEP 100), the workload (and
fees) should be split between the two auditors on a balanced basis. The objective is to split
fees so that auditors receive between 40% and 60% of audit fees. In practice, small auditors
sharing a joint audit mandate with a Big 4 auditor often receive a much smaller fraction of
fees, suggesting that they do not complete a critical part of the audit, and most likely bear
lower risks than Big 4 auditors. Such unequal sharing of audit fees led the French oversight
board of auditors to express some concerns in 2012.8 Furthermore, impairment tests for
goodwill require a relatively higher level of expertise in valuation that Big 4 auditors, relying
on larger ‘transaction services’ teams, are likely to be able to draw on.
Joint audit is being considered by the European Commission as an option to restore
confidence in the financial statements of companies after the 2008 financial crisis, and also as
a way to decrease audit market concentration. As Michel Barnier, Internal Market and
Services Commissioner, explains “[The European Commission]’s proposals9 address the
current weaknesses in the EU audit market, by eliminating conflicts of interest, ensuring
independence and robust supervision, and by facilitating more diversity in what is an overly
concentrated market, especially at the top-end.” One of the European Commission’s main
arguments favoring joint audit is that it will facilitate the emergence of new ‘Big’ audit firms,
in particular by promoting Big 4–non-Big 4 auditor pairs.
8 In February 2012, the oversight board of the legal audit in France (the “Haut Conseil du Commissariat aux
Comptes” also called “H3C”) published a report criticizing this unequal sharing of work between joint auditors.
The H3C urged audit firms to share the audit work equally. See http://www.h3c.org/textes/Avis%202012-01.pdf 9 (European Commission 2011a, 2011b)
10
France has the lowest audit market concentration among G8 countries, with Big 4
auditors earning only 61% of total market revenues in 2007 compared to 91% for the other G8
countries.10
One consequence of the joint audit rule is that, even if the Big 4 dominate the
audit market, smaller audit firms also play a significant role in the audit market. Indeed, 55%
of our sample that spans the 2006-2009 period and represents the 120 largest non-financial
firms by market cap, were audited by at least one non-Big 4 auditor.11
Non-Big 4 auditors can
be classified into two sub-groups: (1) Tier-one non-Big 4 auditors, which have considerable
revenues, more than one listed-firm client, and belong to an international network, e.g.,
Mazars, Grant Thornton and BDO, and (2) Tier-two non-Big 4 auditors, which have
considerably smaller revenues, usually only one listed firm client, and are mainly local French
auditors, e.g., AEG Finance, Cofirec, Dauge & Associés, Didier Kling & Associés. There are
relatively few joint auditor pairs comprised only of Tier-one and/or Tier-two non-Big 4
auditors.
3. Overview of related literature
Research attempting to model the joint audit is scarce. An exception is Deng et al. (2012),
who develop a model that compares three regimes -- a Single Big-Firm Auditor (regime B),
Two Big-Firm Auditors (regime BB), and One Big-Firm Auditor paired with one Small-Firm
Auditor (regime BS) -- to assess the effect of joint audit on audit fees, audit evidence
precision, and auditor independence. Their results indicate that audit evidence precision is the
same for regimes B and BB, but lower for regime BS, as the small audit firm free rides on the
big firm. In addition, joint audit lowers auditor independence for both regimes BB and BS.
Although buying off two auditors is more expensive under joint audit, joint audits provide
companies with an opportunity to internally shop for a favorable audit opinion from the two
auditors and thus lead to a higher level of ex post earnings management. In terms of audit
fees, the BB regime would result in lower audit fees than the B regime because of the
convexity of the resource cost function (i.e., one audit firm doing all the work under a
completion time constraint may experience a higher cost than if the work was split between
two firms). The audit fee for the BS regime would be lower than under the B regime only if
the big firm and the small firm have similar technological efficiency or if the big firm bears a
sufficiently large proportion of misstatement cost. In general, the results indicate that, in
10
http://www.gti.org/Press-room/Press-archive/2007/G8-audit-concentration.asp 11
See the descriptive statistics in Table 2, Panel B.
11
contrast to the common view, joint audit does not necessarily improve auditor competence or
independence due to free-riding and internal opinion shopping. Audit fees are also not
necessarily higher when compared to single audit.
Empirical evidence comparing the performance of joint audit and single audit also is
limited, with most studies examining the effect of voluntary joint audit. For example, Zerni et
al. (2012) study the impact of voluntary joint audit on audit quality in Sweden. While
controlling for differences in characteristics between firms voluntarily choosing joint audits
and other firms, the authors demonstrate that joint audits improve audit quality. Using a
sample of approximately 900 firm-year observations, Zerni et al. (2012) show that firms using
joint audit have higher conservatism as measured by the asymmetric timeliness coefficient,
lower income-increasing abnormal accruals, higher credit ratings, and lower perceived risk of
bankruptcy. However, audit fees are significantly higher for joint audit firms. Our study
differs from Zerni et al. (2012) in terms of both research objective and context. We focus on
the consequences of auditor pair composition on audit quality in a mandatory joint audit
context.
Lesage, Ratzinger-Sakel, and Kettunen (2011) test the impact of joint audit on both
audit cost and audit quality in Denmark (2005-2009), which rescinded the mandatory joint
audit requirement in 2005. They find that firms continuing to use joint audit after the 2005
regulation change have significantly higher audit fees compared with firms voluntarily
choosing to use a single auditor, but no difference in total fees. In addition, audit quality,
proxied by abnormal accruals, is not significantly different for the joint and single audit firms.
André, Broye, Pong, and Schatt (2013) examine the impact of mandatory joint audit on
both audit costs and audit quality across different countries. They compare audit fees paid by
French listed firms under the mandatory joint audit regime to audit fees paid by Italian and
British firms under the single audit regime. Their findings indicate higher audit fees in France
after controlling for auditor, client and engagement attributes. Using abnormal accruals, they
do not find significantly higher audit quality under the joint audit regime.
The mixed empirical evidence above suggests that the general effect of joint audit on
audit quality remains unclear. In an effort to better understand the implications of joint audit
for audit quality, a few papers study the effect of auditor pair composition on audit quality.
For example, Francis et al. (2009) analyze the consequences of France’s joint audit
requirement on earnings quality for a sample of 261 firm-year observations and find that firms
12
with two Big 4 auditors exhibit the lowest income-increasing abnormal accruals, followed by
firms with a Big 4 auditor paired with a non-Big 4 auditor, and firms with two non-Big 4
auditors. Francis et al. (2009) conclude that a pecking order exists with regard to earnings
quality and auditor-pair choice.
By contrast, Chihi and Mhirsi (2013), also using abnormal accruals to measure audit
quality, do not find evidence supporting Francis et al.’s pecking order explanation. Using a
sample of 891 observations from France, they report that the pair of one Big 4 and one non-
Big 4 auditor is associated with lower signed abnormal accruals compared with the pair of
two Big 4 auditors. Their study also examines the effect of staggered vs. simultaneous auditor
appointments on abnormal accruals and concludes that staggered (partner) tenures are
associated with lower abnormal accruals.
Marmousez (2009) examines the effect of auditor pair type on audit quality, using the
Basu’s (1997) measure of conservatism. She studies conservatism because it is a desirable
feature of accounting that helps auditors avoid litigation cost and reputation loss. Based on a
sample of 177 firms in 2003, Marmousez (2009) finds that firms audited by Big 4–Big 4
auditor pairs do not exhibit conditional conservatism whereas firms audited by Big 4–non-Big
4 auditor pairs do. According to Marmousez (2009), the rationale for these results is that
interactions between Big 4 auditors are less efficient and reduce incentives to provide an
adequate effort for Big 4 pairs. Our study adds to this exploratory work in three ways. First,
by using a longer time-period, we test the effect of auditor pair composition on unconditional
conservatism and timely impairment loss recognition in addition to conditional conservatism,
and find consistent results. Second, by analyzing the effect of auditor pair type on auditor
competence and independence, we attempt to provide a stronger theoretical reason for the
results. We argue that due to unequal risk sharing, the Big 4–non-Big 4 auditor pair has higher
independence, which manifests in higher client conservatism compared with the Big 4–Big 4
pair. Third, using self-constructed transparency measures for impairment-related disclosures,
we attempt to test the auditor independence argument.
We complement prior research by focusing on accounting procedures that are essential
to achieve conservatism but likely to be manipulated by managers, i.e., impairment tests.
Impairments of assets are typically perceived as a negative asset pricing signal by market
participants (Fields, Lys, and Vincent 2001), which provides a strong incentive for firms to
avoid booking or delaying their recognition. There are also other incentives for managers to
avoid or delay impairment recognition, including debt and compensation contracts (Watts and
13
Zimmerman 1986) and management reputation (Francis, Hanna, and Vincent 1996). These
incentives, along with the increased flexibility afforded managers by recent accounting
standards (i.e., IAS 36 (IASB 2004) internationally and FAS 142 (FASB 2001) in the US)
explain Li and Sloan (2011) and Ramanna and Watts (2012) findings of a high degree of
manipulation by managers of asset impairments. Hayn and Hughes (2006) document a time
lag of three to four years between the deterioration in the performance of the acquired
business that gave rise to goodwill and the actual recognition of goodwill impairment. Kim et
al. (2013), controlling for an increase in conservatism that is not attributable to new goodwill
accounting under FAS 142, find that accounting earnings for firms with purchased goodwill
become less conservative after the adoption of FAS 142. Petersen and Plenborg (2010), using
a survey on 58 firms listed on the Copenhagen Stock Exchange, identify numerous areas of
non-compliance with IAS 36 “Impairment of assets” for these firms and show that “practice
varies considerably among firms” (p. 421). The authors also stress that “IAS 36 is a standard
that involves substantial judgment” (p. 420). The European Securities and Market Authority
(ESMA) also recently expressed concern about insufficient impairment recognition and
disclosures by major listed European companies during the financial crisis, stating that
“Although the major disclosures related to goodwill impairment testing were generally
included, in many cases these were of a boiler plate nature and not entity-specific”(ESMA
2013, p. 3). The financial and sovereign debt crisis experienced by European firms since the
summer of 2007 offers an excellent setting for examining impairment tests, since economic
impairments were frequent over the period. External auditors play a key role in maintaining
the objectivity and fairness of impairment tests, particularly with regard to their accuracy and
transparency (Petersen and Plenborg 2010, p. 419).
4. Hypotheses
Our objective is to examine how the types of auditors in the pair affect audit quality. Since the
characteristics of the auditors in the pair dictate their incentives, cost-benefit analysis and
ultimate actions, we need to analyze the effects of auditor type to understand the audit quality
implications of joint audit. A considerable amount of the audit literature distinguishes
between Big 4 and non-Big 4 auditors for at least the following two reasons. First, auditor size
is viewed as a proxy for audit quality because lower economic reliance on any single client
makes larger audit firms less likely to behave opportunistically to retain the client (DeAngelo
1981). Second, larger firms may have greater reputations to protect (Dopuch and Simunic
14
1980). The empirical audit literature supports this notion and Big 4 auditors generally score
higher on various audit quality proxies than non-Big 4 auditors (Palmrose 1988; Becker,
Defond, Jiambalvo, and Subramanyam 1998; Khurana and Raman 2004; Behn, Jong-Hag,
and Kang 2008). However, whether pairing two Big 4 auditors together would result in better
audit quality than pairing one Big 4 with one non-Big 4 auditor is unclear.
From the competence perspective, if we consider Big 4 auditors as more competent, the
pair of two Big 4 auditors will possess higher overall competence than the pair of one Big 4
and one non-Big 4 auditor. Moreover, Deng et al. (2012) show that the small auditor is likely
to free ride on the big auditor when its level of technological competence is significantly
lower. Thus, if the non-Big 4 auditor shirks, the competence level of the Big 4–non-Big 4
auditor pair will be further reduced. However, one may argue that the competence of a single
Big 4 auditor is already sufficient to ensure the requisite level of audit quality and thus the
difference in competence between the two types of auditor pairs may not manifest in different
quality. If this is the case, whether there is a difference in audit quality will instead depend on
auditor independence.
Auditor independence determines whether a discovered breach will be reported or
corrected. We argue that due to unequal risk sharing, the pair of one Big 4 and one non-Big 4
auditors can deliver higher auditor independence than the pair of two Big 4 auditors. The risk
here mainly refers to the potential litigation cost and reputation loss when outsiders other than
the auditor discover or report the inappropriate financial reporting. For the pair of two Big 4
auditors, the costs will be approximately equally shared by the two auditors because each has
deep pockets and a strong reputation to protect. As a result, the two Big 4 auditors may over-
rely on each other and neither will report the breach in the end, leading to the typical
prisoner’s dilemma result. For the Big 4–non-Big 4 auditor pair, however, the Big 4 auditor
bears most, if not all, of the litigation and reputation costs. In a noteworthy legal case in 2007,
the French securities regulator (AMF)12
found evidence of misstatements in the financials of
the company, Marionnaud, for the period 2002-2004. Marionnaud was audited by a Big 4–
non-Big 4 pair consisting of KPMG and Cofirec. However, the AMF held KPMG responsible
for the misstatements, claiming that the small auditor “had neither the resources nor the
ability” to detect the irregularities in its cross review.13
The disproportionately high risk borne
12
The AMF (‘Autorité des marchés financiers’ – ‘Financial Market Authority’) is the French equivalent of the
SEC. 13
In a decision dated July 5, 2007 by the AMF, KPMG and the partner responsible for the Marionnaud account
for KPMG were respectively sentenced to pay €100,000 and €40,000 of financial penalties. Cofirec and its
15
by a Big 4 auditor when paired with a small auditor creates stronger incentives for the Big 4
auditor to enforce appropriate financial reporting.
The above arguments and anecdotal evidence suggest that the pair of two Big 4 auditors
may exhibit higher auditor competence but lower auditor independence than the pair of Big
4–non-Big 4 auditors. As a result, the effect on audit quality will depend on whether auditor
competence or auditor independence dominates. Empirical evidence on the effect of auditor
pair type on audit quality is limited and the results are inconsistent. For example, Francis et al.
(2009) find that the pair of two Big 4 auditors is associated with the lowest level of income-
increasing abnormal accruals, whereas Chihi and Mhirsi (2013) find that the pair of one Big 4
and one non-Big 4 auditor is associated with lower signed abnormal accruals compared with
the pair of two Big 4 auditors. Additionally, Marmousez (2009) reports that financial
statements audited by one Big 4 and one non-Big 4 auditor are more conditionally
conservative than those audited by two Big 4 auditors. Given the uncertain theoretical
prediction and contradictory empirical results, we state hypothesis 1 in null form as follows:
H1: Audit quality is not significantly different across auditor pair types.
We first proxy audit quality by using general measures of conservatism, including
growth-adjusted market-to-book ratio for unconditional conservatism and the Basu
asymmetric timeliness measure for conditional conservatism. Additionally, we examine the
effect of auditor pair type on a specific account, impairment of goodwill and other intangible
assets with indefinite useful life. Under IFRS, purchased goodwill is not amortized but tested
for impairment at least annually. Because it is difficult to accurately assess the value of
goodwill separately, the impairment test relies on a subjective valuation of groups of assets to
which goodwill has been allocated. The valuation of these groups of assets (recoverable
value) is then compared to the carrying amount of goodwill in the balance sheet. The
valuation involves discounting future cash flows that are forecasted based on current cash
flow and valuation assumptions (e.g., growth, profitability, risk). If current performance is
low management will have to use unrealistic valuation assumptions (e.g., higher growth rate
than can be expected given the business environment, lower discount rate given the risk) to
avoid impairing goodwill.14
We focus on the impairment account because it is significant and
more prone to manipulation by managers. The independence of external auditors is important
partner were cleared by the AMF and were not required to pay anything. KPMG may have been required to pay
additional civil penalties. 14
See ESMA (2013) for a discussion of unrealistic valuation assumptions.
16
to maintain the objectivity and fairness of impairment tests (Petersen and Plenborg 2010, p.
419). As a result, if auditor pairs have any effect on audit quality, this effect should be most
pronounced in an account such as impairment.
For the impairment test, we first examine the timeliness of impairment loss recognition.
According to IAS 36, Impairment of Assets, goodwill and intangible assets with indefinite life
should be tested annually for impairment. To test for impairment, goodwill must be allocated
to each (or groups of) cash generating unit(s) based on the lowest level within the firm at
which the goodwill is monitored for internal management purposes. The recoverable amount
of the unit to which goodwill is allocated should be compared with the carrying amount of
that unit. If the carrying amount exceeds the recoverable amount, an impairment loss must be
recognized. The recoverable amount is the higher of an asset’s fair value less costs of disposal
and its value-in-use. For the goodwill impairment test, the recoverable amount usually refers
to the value-in-use calculated by discounting future cash flows expected to be derived from
the cash generating unit to which goodwill is allocated.
Management has considerable discretion in projecting future cash flows and choosing
discount rates. IAS 36 requires that management make cash flow projections based on
reasonable and supportable assumptions and assess the reasonableness of those projections by
comparing projected cash flows and actual cash flows. As a result, past performance should
be a primary benchmark when estimating the recoverable amount of the unit. In fact, poor
economic performance is listed as one of the indicators for impairment in IAS 36. Based on
the above reasoning, we expect that when a firm reports low performance, it is more likely
that an economic impairment needs to be booked. Hence, we test whether the probability of
impairment recognition differs across auditor pair types for firms with low performance.
Holding other things equal, a higher probability of booking an impairment under poor
performance indicates higher auditor quality.
Next, we examine the transparency of impairment-related disclosures. International
accounting standards include specific disclosure requirements for goodwill impairment tests.
Irrespective of whether a goodwill impairment is recognized, the firm must disclose certain
information related to the estimates used to measure the recoverable amounts of cash
generating units containing goodwill. Major disclosures include the carrying amount of
goodwill assigned to each unit, how the firm estimates the recoverable amount of the unit, key
assumptions and approaches that management used to make cash flow projections, growth
rates used to extrapolate beyond the cash flow forecast period, discount rates, etc. Not all
17
French listed firms provide all the required disclosures and the level of disclosure
transparency varies significantly across firms in Europe (ESMA 2013). When economic
conditions (i.e., low performance) suggest that impairment is likely, managers intending to
manipulate the impairment tests and delay impairment recognition will have incentives to
provide less detailed disclosures regarding the procedures used in the impairment tests, and
thus make it more difficult for outsiders to assess the appropriateness of the impairment
recognition. As a result, we use the algebraic difference in impairment disclosure
transparency between firms with low and high operating performance as a proxy for
transparency manipulation by management. The more negative the algebraic difference
between firms with low and high operating performance, the more likely are the firms to
reduce their disclosure when the likelihood of an economic impairment is high, and hence the
more the transparency manipulation that is likely to have taken place. Auditors play a key role
in preventing such manipulation of impairment disclosures by management. When auditors
examine the impairment accounts, they can urge firms to disclose more information, allowing
outsiders to better assess the reasonableness of management’s procedures and key
assumptions. Thus less transparency manipulation can be viewed as an indication of higher
audit quality. Moreover, given that the disclosure requirements are specified in accounting
standards, it is difficult to argue that an auditor does not ask management to provide the
required disclosures due to lack of competence. Thus, whether or not auditors push the firm to
make the required disclosures and prevent firms from doing transparency manipulation should
mainly depend on their independence level. As a result, the audit quality measure using the
transparency proxy likely reflects the effect of auditor independence.
Based on this reasoning, we test the following four sub-hypotheses:
H1a: Unconditional conservatism is not significantly different across auditor pair type.
H1b: Conditional conservatism is not significantly different across auditor pair type.
H1c: The probability of booking an impairment when performance is poor is not
significantly different across auditor pair type.
H1d: The (algebraic) difference in impairment disclosure transparency between firms
with low and high performance is not significantly different across auditor pair type.
18
5. Sample Selection and Research Design
Sample Selection
Our sample includes firms from the 120 listed firms comprising the SBF 120 index, and spans
the period 2006 – 2009. These firms represent large firms (included in the French CAC 40
index) and mid cap firms (the next 80 firms). We delete 10 financial firms because they are
required to follow industry-specific impairment rules and disclosures. Only two of the
remaining 110 firms are audited by a pair of two non-Big 4 auditors. We delete these two
firms because of the small sample size for this subset of firms. Therefore, we study only firms
audited by either Big 4–Big 4 or Big 4–non-Big 4 auditor pairs. Due to missing variables for
some firms, our final sample comprises 91 firms representing 316 firm-year observations. We
winsorize each continuous variable at its first and ninety-ninth percentiles to reduce the
effects of extreme values.
Auditor Pair Type and Unconditional and Conditional Conservatism
We test the relation between auditor pair type and conservatism using established measures of
unconditional and conditional conservatism. Unconditional conservatism (also known as ex
ante or news-independent conservatism) results from (continually) understating the book
value of net assets relative to their economic value. This form of conservatism, which is an
accounting bias toward reporting low earnings and book value of stockholders equity, leads to
higher (internally generated) goodwill and higher market-to-book ratio. Unconditional
conservatism is a primary (though not the sole) source of unrecorded goodwill, which also
includes the present value of expected economic profits (from rents or growth). Empirical
proxies for unconditional conservatism used in the literature are theoretically based on the
Ohlson (1995) residual income model. Roychowdhury and Watts (2007) and García Lara and
Mora (2004) use the market-to-book ratio to proxy for unconditional conservatism.
Roychowdhury and Watts (2007) argue that the market-to-book ratio is influenced by two
factors: (1) the unverifiable (unbooked) increases in value of separable assets in place (true
unconditional conservatism), and (2) the expected value of economic profits (e.g., synergies
between assets in place, growth, rents). We isolate the first factor by controlling for the
second factor using variables such as asset intangibility, firm growth potential, current
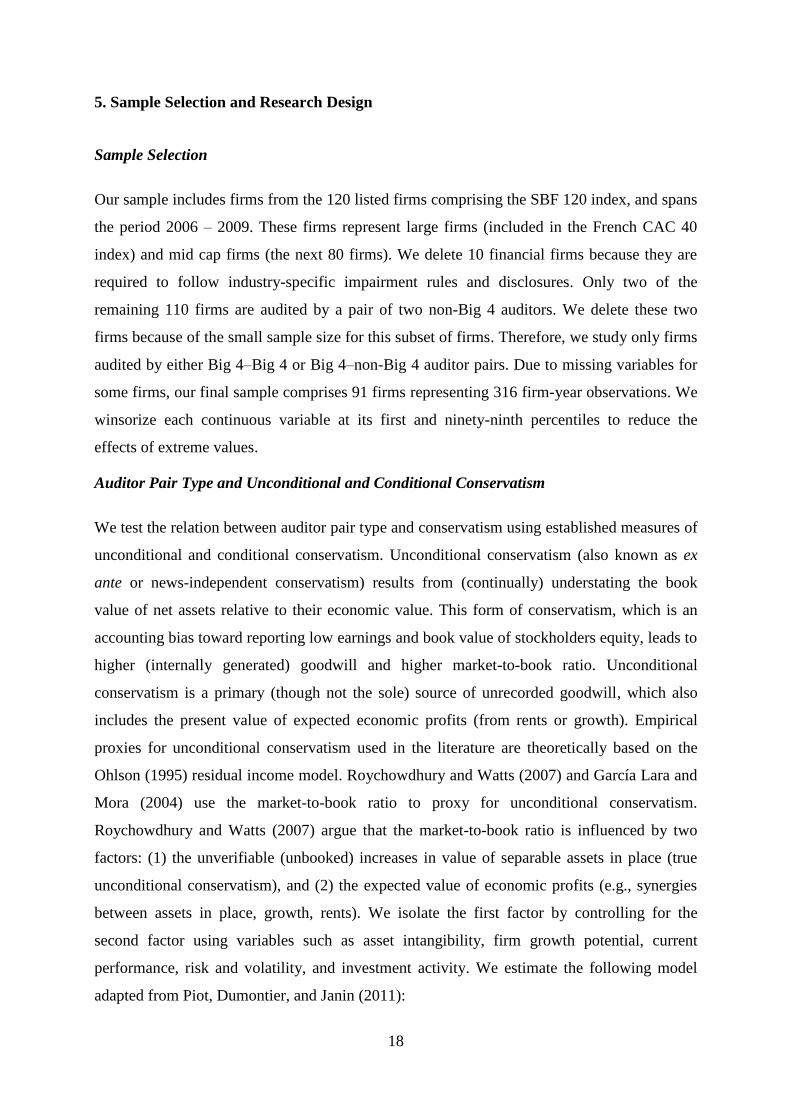
performance, risk and volatility, and investment activity. We estimate the following model
adapted from Piot, Dumontier, and Janin (2011):
19
(1)
where:
- MtoB = market-to-book ratio of equity (Datastream);
- Big4_Small = 1 if one of the two external auditors is a Big 4 auditor and the other is
not (Annual report), and zero if both external auditors are Big 4 auditors;
- Sales =percentage change in total sales (Datastream);
- Return = share return computed over the fiscal year (Datastream);
- Perf = EBITDA divided by total assets (Datastream);
- GW = goodwill divided by total assets (Datastream);
- PPE = property, plant and equipment divided by total assets (Datastream);
- Capex = capital expenditures divided by total assets (Datastream).
To test H1a, we examine whether firms with a Big 4–non-Big 4 auditor pair have higher
market-to-book ratio, which implies that book value is more understated, than firms audited
by a Big 4–Big 4 auditor pair. We expect sales growth, performance, capital expenditures and
share return, which capture expected growth, to be positively related to market-to-book ratio.
The percentage of total assets comprised of goodwill and property, plant and equipment
reflects the intangibility of the business.15
Conditional conservatism (also known as ex post or news-dependent conservatism)
results from writing down book values and decreasing income under sufficiently adverse
circumstances, and not writing up those values when circumstances are favorable. We use the
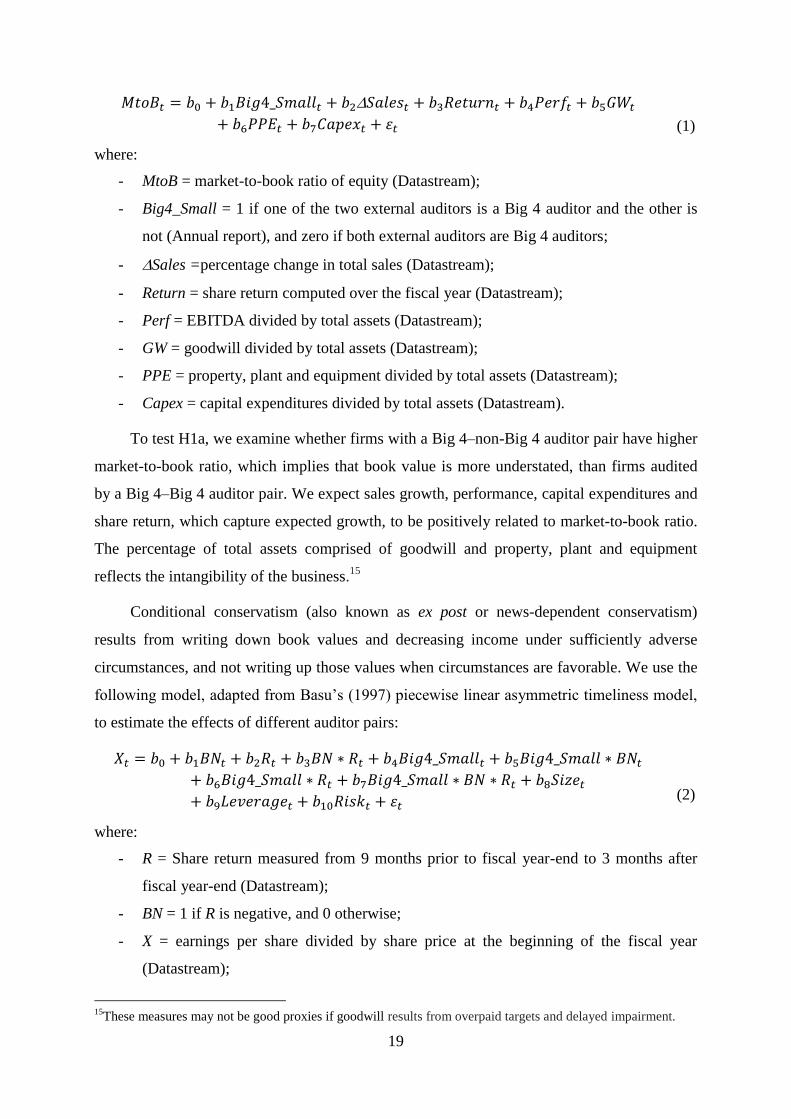
following model, adapted from Basu’s (1997) piecewise linear asymmetric timeliness model,
to estimate the effects of different auditor pairs:
(2)
where:
- R = Share return measured from 9 months prior to fiscal year-end to 3 months after
fiscal year-end (Datastream);
- BN = 1 if R is negative, and 0 otherwise;
- X = earnings per share divided by share price at the beginning of the fiscal year
(Datastream);
15
These measures may not be good proxies if goodwill results from overpaid targets and delayed impairment.
20
- Big4_Small = 1 if one of the two external auditors is a Big 4 auditor and the other is
not, and 0 if both external auditors are Big 4 auditors (Annual report);
- Size = natural logarithm of market value of equity (Datastream);
- Leverage = financial debt minus cash and cash equivalents, divided by market value of
equity (Datastream);
- Risk = 5-year unlevered beta (Datastream);
Conditionally conservative accounting results in more aggressive reporting of bad news
than good news, leading to a positive coefficient, b3. We test H1b by testing whether the
coefficient b7 is positive. A positive estimate of b7 indicates higher conservatism for firms
audited by a Big 4–non-Big 4 auditor pair than for firms audited by a pair of two Big 4
auditors. We also control for size, leverage and risk.16
Auditor Pair Type and Recognition of Economic Impairment
We examine how auditor pairs affect the decision to recognize economic impairment of assets
on the income statement. In essence, goodwill impairment is caused by deteriorating
economic performance of the acquired businesses. Ideally, we should use the projected future
cash flows expected to be generated by the unit containing the goodwill to assess whether the
firm should book an impairment or not. However, because we do not have enough
information to make an objective and accurate estimation, we can only look at current and
past economic performance to assess the future prospects of the business. Since performance
measures at the level of the cash generating unit to which goodwill is allocated are often
unavailable, we can only use performance measures at the firm level to make our predictions.
Prior research on goodwill impairment have used ROA, operating cash flows, and market-to-
book ratio less than one as economic determinants of impairment (Beatty and Weber 2006;
Hayn and Hughes 2006; AbuGhazaleh, Al-Hares, and Haddad 2012; Ramanna and Watts
2012).
In this study, we use the lowest quartile of ROA, the lowest quartile of operating cash
flows scaled by lagged total assets, and market-to-book ratio less than one as low
performance indicators. We expect that firms with low performance indicators are more likely
16
We do not interact these control variables with BN, R, and BN*R as do Khan and Watts (2009). We estimate
the Khan and Watts (2009) model and calculate C_Score using the coefficients from the model. C_Score is
positively associated with Big4_Small (significant at less than 5% level, two-sided), which suggests that the Big
4–non-Big 4 auditor pair is more conditionally conservative. We do not use the Khan and Watts (2009) model to
report our results because the signs of most of the interaction terms in the model used to calculate C_Score are
not as unexpected. One possible reason for the unexpected coefficient signs is the unusual return-earnings
relationship during the financial crisis period.
21
to have suffered an economic impairment. As a result, to test for the timeliness of impairment,
we compare the likelihood of booking an impairment when performance is low for firms
audited by different auditor pairs.
Use of these low performance indicators is justified. When market-to-book ratio is less
than one, the firm’s market value of equity is less than its book value, indicating that current
book value is too high and it is likely that assets have been impaired. The use of ROA and
operating cash flow is consistent with the estimation procedure for goodwill impairment
specified in the international accounting standard. Impairment tests, in particular impairment
tests for goodwill, usually involve discounted cash flow models, and require managers to
make several assumptions. Appendix 1 gives a summary of how impairment tests are
conducted under IAS 36. The procedure is similar to provisions in FAS 142 of US GAAP.
Discounted cash flow models rely on projecting current performance over a business plan. If
current operating performance is low, it is more likely that the present value of projected
future cash flows will be below the carrying value of a given cash generating unit (see
discussion of impairment testing in Appendix 1). Managers can manage the outcome of the
test by choosing either overly optimistic growth assumptions or an artificially low discount
rate (ESMA 2013). We reason that firms in the lowest quartile of ROA or operating cash flow
for our sample are more likely to have economic impairment. We also estimate our model
using the 5th
, 10th
, 15th
and 20th
percentile and the results are qualitatively similar. We
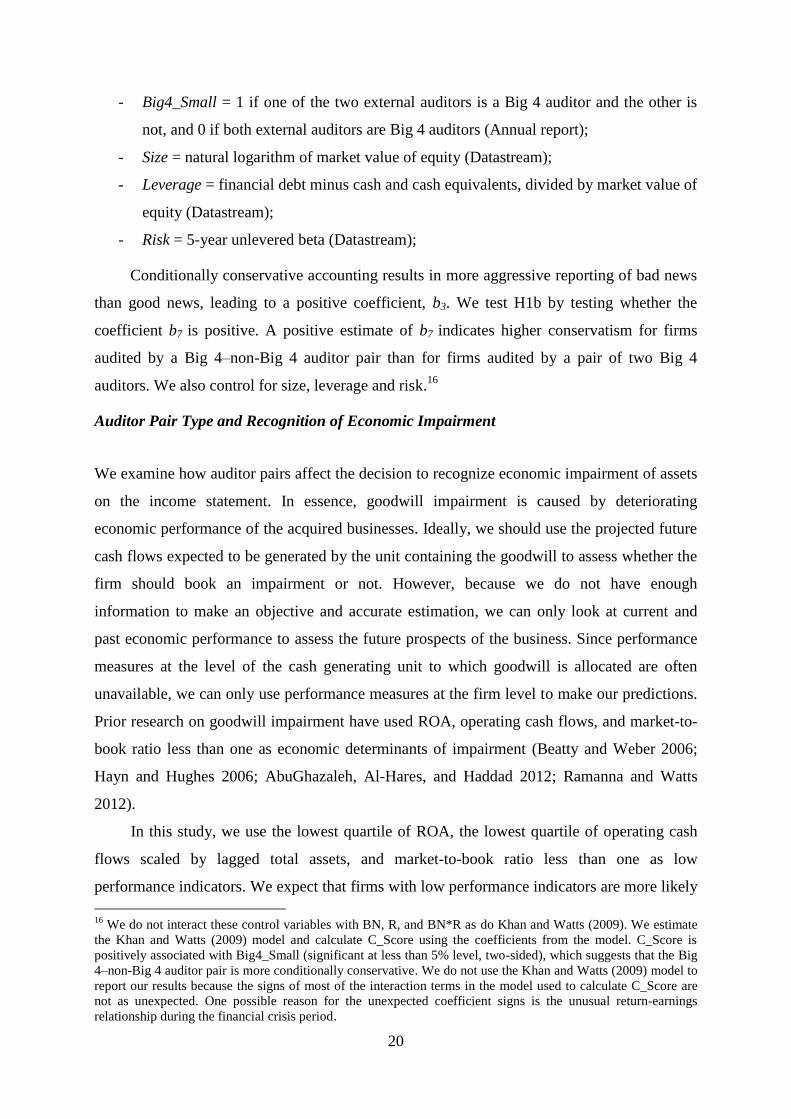
estimate the following probit model:
(3)
where:
- DIMP = 1 the firm books an impairment, and 0 otherwise (Annual report);
- Big4_Small = 1 if one of the two external auditors is a Big 4 and the other is not,
and 0 if both external auditors are Big 4 auditors (Annual report);
- LowPerf = 1 if: (1) EBITDA divided by lagged total assets is below the 25th
percentile of the distribution, and 0 otherwise, or (2) cash from operations divided
by lagged total assets is below the 25th
percentile of the distribution, and 0
otherwise, or (3) market-to-book ratio is below one, and 0 otherwise;
22
- Size = natural logarithm of market value of equity (Datastream);
- GW = goodwill divided by total assets (Datastream);
- MtoB = market-to-book ratio of equity (Datastream);
- Perf = EBITDA divided by total assets (Datastream);
- Return = buy and hold return over the fiscal year (Datastream);
- Sales =percentage change in total sales (Datastream);
- Leverage = financial debt minus cash and cash equivalent, divided by market value
of equity (Datastream);
- Risk = 5-year unlevered beta (Datastream).
To test H1c, we compare the probability of booking an impairment when performance is
low between firms audited by a Big 4–non-Big 4 auditor pair and firms audited by a Big 4–
Big 4 auditor pair, i.e., the sum of coefficients b1 and b3. If b1 + b3 is positive it indicates that
firms with a Big 4–non-Big 4 auditor pair are more likely to book an impairment when the
probability of economic impairment is high.
We control for factors affecting impairment, i.e., operating performance, stock price
performance, business risk, size, market-to-book ratio, leverage and magnitude of goodwill in
the balance sheet. The likelihood of economic impairment decreases with performance (Perf),
market-to-book ratio (MtoB), sales growth ( Sales), stock return (Return) and size (Size), and
increases with goodwill (GW) and business risk (Risk). However, we do not make directional
predictions on the coefficients of these control variables because prior research indicates that
impairment tests may be manipulated.
Auditor Pair Type and Transparency of Impairment-Related Disclosures
For French listed firms, transparency of impairment test disclosures varies widely across
firms. For example, the French pharmaceutical company, Stallergenes, in the “Main
Accounting Methods” section of its 2006 annual report (p. 41), provides only minimal
narrative information regarding impairment tests, such as “A write down is recorded once a
year or more frequently if events or changes in circumstances indicate the likelihood of
impairment for that acquisition goodwill”, and “If an impairment is identified, the recoverable
value of the CGU to which the acquisition goodwill belongs is assessed. An impairment is
recognized as soon as the book value of the CGU to which the acquisition goodwill belongs
exceeds the recoverable value.” No further information regarding impairment tests is provided
in the Notes, although the firm owns a substantial amount of intangible assets (goodwill alone
23
represents 24% of Stallergenes’ total assets) for which impairment tests are required to be
performed at least once a year.
In contrast, France Telecom’s 2008 annual report contains much more transparent
disclosures regarding impairment-testing procedures. In Note 6 (p. 287-289), the company
devotes almost three pages to its impairment tests and provides a wide range of information. It
explains the level at which goodwill is tested, and provides tables with key assumptions used
in the estimation of recoverable amounts (e.g., growth rate to perpetuity for each segment,
main cash generating units and groups of cash generating units, post- and pre-tax discount
rates used for each segment), as well as narrative explanations for specific countries where it
operates.17
Considering these differences in transparency and the incentives to manipulate
impairment tests, we search each annual report for 40 items covering the main disclosures
required by IAS 36 (paragraphs 126 to 133) and other disclosures providing the main
valuation assumptions used in the estimation of recoverable values. These required
disclosures are independent of the outcome of the impairment test, i.e., they should not
depend on whether or not management decided to book an impairment. These 40 items are
allocated to categories of information according to homogeneous topics. Appendix 2 lists the
main categories, and the items in each category.
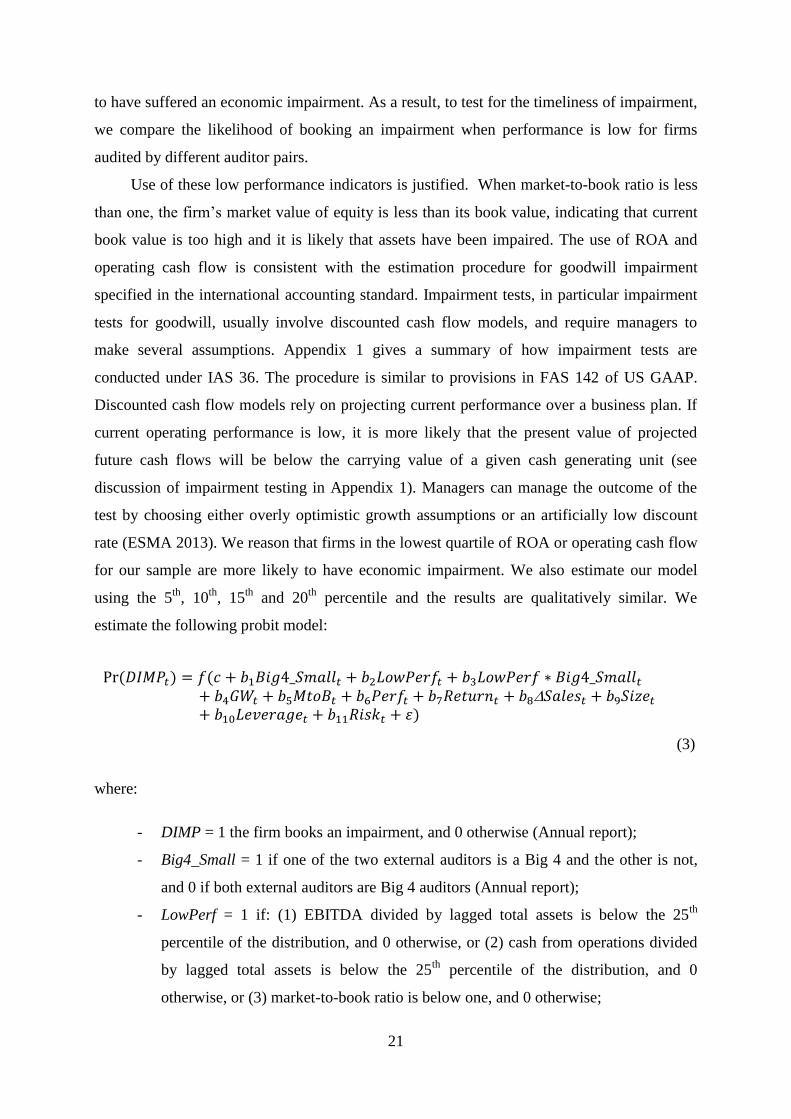
We assign one point per disclosed impairment item that is included in the annual report
for year t, and compute a transparency score as follows:18
∑
(4)
Score is the number of disclosed impairment items for a given firm-year divided by the
maximum possible number of impairment disclosures, and is expressed as a percentage. As
presented in Appendix 2, the list of impairment disclosures is quite comprehensive, covering
technical valuation elements of impairment tests (e.g., discount rates, neutrality of the
financing structure, terminal value issues) as well as descriptive elements (e.g., whether
17
These two examples have been selected on purpose from a low disclosing firm (Stallegenes, 2006) and a high
disclosing firm (France Telecom, 2008), based on our Transparency Score. 18
The variable Score is not completely continuous but can take a large range of values since it equals the sum of
40 items. Because, it is not bounded between 0 or 100 (see Table 1, Panel E), we estimate model (5) with OLS.
The results are qualitatively similar when we use a Tobit model.
24
management explains the alternative between fair value and value-in-use to estimate
recoverable value, or whether valuation consultants were hired to perform impairment tests).
We estimate the following model to examine whether auditor pair composition is
systematically related to the level of transparency of impairment disclosure:
(5)
where:
- Score = measure of transparency of impairment disclosures, defined in (5) (Annual
report);
- Big4_Small = 1 if one of the two external auditors is a Big 4 and the other is not,
and 0 if both external auditors are Big 4 auditors (Annual report); LowPerf = 1 if:
(1) EBITDA divided by lagged total assets is below the 25th
percentile of the
distribution, and 0 otherwise, or (2) cash from operations divided by lagged total
assets is below the 25th
percentile of the distribution, and 0 otherwise, or (3)
market-to-book ratio is below one, and 0 otherwise;
- GW = goodwill divided by total assets (Datastream);
- Float = percentage of shares available to trade (Datastream);
- Risk = 5-year unlevered beta (Datastream);
- Size = natural logarithm of market value of equity (Datastream);
- Perf = EBITDA divided by total assets (Datastream);
- Leverage = financial debt minus cash and cash equivalents, divided by market
value of equity (Datastream);
- Coverage = natural logarithm of the number of recommendations issued by
financial analysts during the year (I/B/E/S);
- CrossList = 1 if the company is cross-listed in the US, and 0 otherwise;
- Change = 1 if the firm changes an external auditor during the fiscal year, and 0
otherwise (Annual report);
The coefficient of interest for testing H1d is b3, which reflects the difference in the level
of transparency manipulation between firms audited by a Big 4–non-Big 4 auditor pair and
firms audited by a Big 4–Big 4 auditor pair. When operating performance is low, impairment
25
is more likely. As a result, given poor operating performance, impairment becomes a bigger
concern for investors. If managers want to avoid booking an appropriate amount of
impairment, they may manipulate the impairment test procedures. Thus, they will have
incentives to provide less transparent impairment-related disclosures in order to reduce the
possibility that outsiders detect the manipulation. Therefore, a decrease in transparency score
when the operating performance is low could indicate that managers are manipulating the
disclosure to support their inappropriate impairment accounting. Auditors can play a very
important role in preventing such manipulation in transparency by making sure that outsiders
have enough information to assess the appropriateness of management’s estimation and
assumption. If audit quality does not differ between Big 4–Big 4 auditor pairs and Big 4–non-
Big 4 auditor pairs, the difference in disclosure quality between firms under low and high
performance should be the same for the two auditor pair groups. Hence, the coefficient on
LowPerf*Big4_Small would be zero. A positive coefficient on LowPerf*Big4_Small would
suggest lower transparency manipulation and hence better audit quality for the Big 4–non-Big
4 auditor pair and vice versa.
We include several control variables in the model, including the percentage of total
assets comprised of goodwill. We expect the level of goodwill to be positively associated with
the transparency of impairment-testing disclosures. We also control for other factors affecting
general disclosures, such as firm size, cross-listing status, business risk, free float,
performance, leverage, and analyst coverage. Large, risky, high performing, cross-listed firms
with large share floats and high financial leverage generally have incentives to disclose more.
However, we do not know if, and how, these incentives affect specific impairment-testing
disclosures. Therefore, we do not make directional predictions for the coefficients of these
control variables. We predict that change in auditor could reduce impairment-testing
disclosures. Analyst coverage captures an alternative channel of communication. Everything
else equal, a firm followed by more analysts may disclose less information in its annual report
as analysts can substitute for the information in the annual report (Botosan 1997, p. 326).
However, prior studies also show that firms with higher disclosure quality tend to have higher
analyst coverage (Healy, Hutton, and Palepu 1999). Therefore, we do not make a directional
prediction for the effect of analyst coverage on impairment-related disclosures.
26
6. Empirical Results
Descriptive Statistics
Table 1, Panel A shows that our sample is relatively uniformly distributed across 10
industries, with chemicals (healthcare) having the highest (lowest) level of representation.
Table 1, Panel B provides unconditional comparisons between firms audited by a Big 4–Big 4
pair and a Big 4–non-Big 4 pair. First, from a market share perspective, approximately 45%
of the firms are audited by a Big 4–Big 4 auditor pair over the period, and the remaining 55%
by a Big 4–non-Big 4 auditor pair. These statistics illustrate that the French audit market is
one of the least concentrated in Europe as more than 50 percent of the large firms are audited
by at least one non-Big 4 auditor whereas the Big 4 market share of listed firms in other G8
countries is typically above 90%.19
Table 1, Panel B provides the descriptive statistics for the main variables. First, it shows
that the market-to-book ratio is significantly higher for firms audited by a Big 4–non-Big 4
pair (significant at less than 5%), consistent with firms audited by a Big 4–non-Big 4 pair
reporting more conservatively than firms audited by a Big 4–Big 4 pair.
Second, while firms audited by a Big 4–Big 4 auditor pair booked impairments 52% of
the time, firms audited by a Big 4–non-Big 4 pair impaired assets 35% of the time (difference
significant at 1%). From a transparency perspective, the mean (median) impairment-test
transparency score for the four-year period is 54 points (54 points). Firms audited by a Big 4–
Big 4 pair exhibit a higher transparency score compared to firms audited by a Big 4–non-Big
4 pair. We note, however, that such a univariate comparison of the frequency of impairment
or transparency score is not dependent on the existence of economic conditions indicating a
high probability of impairment.
Third, Table 1, Panel B also shows that the mean (median) risk of firms in the sample,
as proxied by 5-year unlevered beta, is 0.98 (0.74), the mean (median) return is 8.2% (-0.0%),
the mean (median) percentage of firms’ shareholder’s equity that is available to trade (free
float) is 67% (68%), the mean (median) impairment of assets represents on average 2.2%
(0.0%) of total intangible assets over the time period,20
the mean (median) operating
performance measured by return on assets (EBITDA divided by total assets) is 12.4%
19
http://www.gti.org/Press-room/Press-archive/2007/G8-audit-concentration.asp 20
On the sub-sample of 136 firm-year observations booking impairment, the mean (median) impairment is 5.1%
(1%) of total intangible assets, ranging from 0.1% of goodwill to 55% of goodwill.
27
(10.8%), and the mean (median) market-to-book ratio is 2.3 (2.0). We also observe that
changes of either one or both auditors during a year do not occur frequently, i.e., only 3% of
the time. Goodwill represents on average 28% (27%) of firms’ total assets. Firms audited by
two Big 4 auditors tend to be larger, have more institutional ownership, are more likely to be
cross-listed, have more business risk, are more closely followed by analysts, are less
leveraged, exhibit slightly less sales and assets growth, and spend less on capital expenditures.
In Table 1, Panel C we condition our analyses for the frequency and transparency of
impairments on the existence of economic conditions suggesting the need for testing
impairment. An impairment test is deemed necessary when there is evidence of an economic
impairment, i.e., when market-to-book ratio is below one, when return on assets is low, or
when cash from operations is low. For instance, when market-to-book ratio is below one,
while firms audited by a Big 4–Big 4 auditor pair booked impairment only 43% of the time,
firms audited by a Big 4–non-Big 4 auditor pair booked impairment 67% of the time. This
simple observation indicates that a priori firms audited by a Big 4–non-Big 4 auditor pair
exhibit higher levels of conditional conservatism, i.e., conditional on the existence of poor
economic conditions, they are more likely to recognize bad news through impairments.
From Table 1, Panel C, we also observe that firms audited by a Big 4–non-Big 4 pair
have a higher score for impairment-related disclosures once it is evident that an impairment is
necessary for two of our three measures of low performance. In addition, the change in
disclosure scores when economic performance deteriorates, i.e., when market-to-book ratio is
below one, when the firm is in the lowest quartile of ROA or the lowest quartile of OCF
presented in Table 1, Panel D shows that, for firms audited by a Big 4–non-Big 4 auditor pair,
the disclosure scores increase when the firms report poor performance. By contrast, for firms
audited by a Big 4–Big 4 auditor pair, the disclosure scores decrease under poor performance.
Combining the results from Panels B, C, and D of Table 1, we conclude that although on
average firms audited by a Big 4–Big 4 auditor pair book impairments more frequently and
score higher on impairment-related disclosures, they tend to recognize impairments less
frequently and provide less transparent impairment-related disclosures when economic
conditions suggest that an impairment is likely to have occurred.
In Panel E of Table 1, we perform an analysis of differences in transparency over time.
The results indicate an increase over time in the level of transparency score of impairment
disclosures with the mean (median) score rising from 50 (51) in 2006 to 59 pts (58 pts) in
28
2009. The dispersion of transparency score also tends to increase over the period (from 14 pts
in 2006 to 16 pts in 2009).
We conclude our descriptive analyses with the correlation matrix in Table 1, Panel F.
DIMP is significantly positively correlated with Score, Size, CrossList and Coverage, and
negatively correlated with OCF, Score, Assets, Capex and MtoB. The results also indicate
that Score is positively correlated with CrossList, Size, Float, GW, Leverage and Coverage.
The level of transparency is negatively correlated with Perf, OCF, MtoB, Assets¸ Change
and Capex. Big4_Small is negatively correlated with both DIMP and Score, confirming that
firms audited by Big 4–Big 4 pairs are on average unconditionally more transparent in their
impairment test disclosures.
[Insert Table 1 About Here]
Auditor Pair Type and Conservatism
H1 examines the association between auditor pair type and audit quality. While a Big 4–Big 4
auditor pair is likely to exhibit a higher level of competence, a Big 4–non-Big 4 pair may
offset the potentially lower level of competence with a higher level of independence. The
overall impact of auditor pair composition on audit quality depends on the relative differences
in terms of competence and independence. We use the degree of conservatism in financial
reporting by the client of the auditor pair as the proxy for audit quality, and examine both
unconditional and conditional conservatism. We use model (1) to test H1a, which asserts that
the degree of unconditional conservatism is not a function of auditor pair type, and report the
estimation results in Table 2. The coefficient on Big 4–non-Big 4 auditor pair is positive and
significant at the 5% level indicating a higher audit quality measured by unconditional
conservatism for these auditor pairs compared to Big 4–Big 4 pairs.
[Insert Table 2 About Here]
H1b evaluates audit quality differences measured in terms of conditional conservatism
across the two types of auditor pairs. We test H1b using model (2) which is based on Basu
(1997), and report the estimation results in Table 3.
[Insert Table 3 About Here]
The differential effect on the degree of conditional conservatism, (i.e., the
asymmetrically timely recognition of bad news versus good news) of Big 4–non-Big 4 auditor
29
pair type over Big 4–Big 4 auditor pair type is captured by b7, which is significantly positive
(at 10%; two-tailed test). It indicates that firms audited by a Big 4–non-Big 4 auditor pair
report economic losses “more aggressively” than economic gains. Marmousez (2009) reports
qualitatively similar but statistically stronger results for an earlier time period (2003). Our
comparatively lower statistical significance may be due to the time period of the study, i.e.,
2006-2009. One reason for the lower association between earnings and returns is that our
sample period includes the financial crisis of 2008, when firms’ returns were affected more by
macroeconomic factors than by microeconomic, firm-specific factors.21
Using general measures of conservatism, tests for H1a and H1b indicate better audit
quality for the Big 4–non-Big 4 auditor pair compared with the Big 4–Big 4 auditor pair.22
In
order to provide more refined tests of the effect of auditor pair type on audit quality, we next
analyze a specific account, impairment.
Auditor Pair Type and Recognition of Economic Impairments
The purpose of these tests is to examine whether the differential audit quality across auditor
pair types documented using measures of unconditional and conditional conservatism are also
found at the level of more precise accounting procedures such as impairment testing. In this
regard, H1c examines differences across auditor pair types in timeliness of loss recognition
through impairments. To test H1c, we estimate model (3) which assesses the probability of a
firm reporting an impairment when economic conditions indicate that the probability of
impairment is high. We measure the degree of deterioration in the firm’s economic condition
using our low performance indicators, i.e. lowest quartile of ROA, lowest quartile of OCF,
market-to-book less than one. The coefficient of interest in model (3) is b1+b3, which reflects
the incremental likelihood of impairment for firms with lower economic performance that are
audited by a Big 4–non-Big 4 auditor pair over firms audited by a Big 4–Big 4 auditor pair.
We report the estimation results of the probit model (3) in Table 4.
[Insert Table 4 About Here]
21
Marmousez (2009) also includes smaller firms in her sample, which may be an additional explanation for her
results exhibiting greater statistical significance. 22
The results from model (1) and model (2) suggest that firms audited by a Big 4–non-Big4 auditor pair exhibit
higher unconditional and conditional conservatism. This is not inconsistent with Pope and Walker (2003) and
Beaver and Ryan (2005) who show that for a given firm higher unconditional conservatism ex ante reduces
conditional conservatism ex post. Indeed, we compare levels of conservatism across firms and not relations
between unconditional and conditional conservatism within a given firm.
30
The coefficient of interest, b1+b3, is positive and significant for each of the three low
performance indicators (significant at 5% for ROA and OCF, 1% for market-to-book). These
results indicate that when performance is poor, firms audited by a Big 4–non-Big 4 auditor
pair are more likely to book impairments than firms audited by a Big 4–Big 4 auditor pair.
Taken together, our tests of H1a, H1b and H1c indicate that, on average, firms audited
by Big 4–non-Big 4 auditor pairs exhibit higher levels of audit quality than firms audited by
Big 4–Big 4 auditor pairs. The discussion in Section 4 attributes the difference in audit quality
to differences in competence and/or independence across auditor pairs. Given that Big 4–Big
4 auditor pairs are likely to have higher auditor competence than Big 4–non-Big 4 auditor
pairs, the finding of lower audit quality for firms audited by Big 4–Big 4 auditor pairs
suggests that they must possess lower auditor independence. Given this, our results for H1a,
H1b and H1c indicate that auditor independence is lower for Big 4–Big 4 auditor pairs and
that auditor independence dominates auditor competence in the effect of auditor pair type on
audit quality in this joint audit setting.
Auditor Pair Type and Transparency of Impairment-Related Disclosures
Having documented differences in audit quality across auditor pairs using both aggregate and
specific measures of conservatism, we next attempt to identify the source of such differences.
If we view audit quality as a function of auditor competence and auditor independence, the
higher audit quality for the pair of Big 4 and non-Big 4 auditors must come from higher
auditor independence, as auditor competence for the Big 4–Big 4 pair is unlikely to be lower
than that for the Big 4–non-Big 4 pair. Auditor independence and auditor competence are
difficult to directly measure because it is hard to differentiate whether the auditor fails to
report a breach because they cannot discover it or because they discover it but choose not to
report it. Thus, it is difficult to test the auditor independence explanation directly. We attempt
to strengthen our argument for auditor independence by testing audit quality in a setting
where auditor independence is likely to play a more important role than auditor competence.
We test H1d by comparing the transparency of impairment-related disclosures across auditor
pairs. We reason that because knowing the required impairment-related disclosures listed in
the accounting standards forms the basic or minimal level of auditor competence, whether the
auditor will allow or disallow the management to provide less transparent disclosures when
the operating performance is poor is mainly affected by auditor independence. As a result, if
31
we find any difference in audit quality using the transparency proxy, the difference should be
largely driven by differences in auditor independence.
[Insert Table 5 About Here]
We find that firms audited by Big 4–Big 4 auditor pairs reduce their disclosure
transparency when they have poor performance (the coefficient on LowPerf is negative for all
three indicators, insignificant for ROA and market-to-book, significant at 5% for OCF). In
contrast, firms audited by Big 4–non-Big 4 pairs increase their disclosure transparency when
operating performance is low (the sum of the coefficients on LowPerf and LowPerf*Big
4_Small is positive for all three indicators). This indicates that firms audited by Big 4–Big 4
pairs make less transparent impairment disclosures when firms have poor performance while
firms audited by Big 4–non-Big 4 pairs do not. The difference in the change of disclosure
transparency between the two groups is captured by the coefficient on LowPerf*Big4_Small,
which is positive and significant at 10% for ROA, 5% for OCF, and insignificant for MTB.
This indicates that the Big 4–non-Big 4 auditor pair requires more transparent disclosures by
firms, suggesting that it is more independent compared to the Big 4–Big 4 auditor pair. These
results suggest higher audit quality, and most likely higher auditor independence, for the Big
4–non-Big 4 auditor pair. This is consistent with our expectation developed in section 6 that
Big 4 auditors, which bear disproportionately high reputation and litigation costs when paired
with non-Big 4 auditors, face stronger incentives to force firms to report more transparent
disclosures when the performance is poor.23
The results in Table 5 also show that the transparency of impairment-related disclosures
increases with goodwill in the balance sheet, risk, analyst coverage and auditor change, and
decreases with performance. Overall, the model explains 33% of the variation of the
transparency score.
7. Effect of Self-Selection
We examine the effect of self-selection on our results in this section. Given that firms
voluntarily choose the type of auditor pair, the observed differences in conservatism may be
attributable to differences in underlying characteristics of the firms that make the auditor pair
choice. We use the two-stage procedure proposed by Heckman (1979) and the ‘treatment
23
Additional analysis also shows that when impairment is booked, firms audited by Big 4–non-Big 4 pairs are
associated with larger increase in transparency compared with firms that are audited by Big 4–Big 4 pairs.
Results are available from the authors upon request.
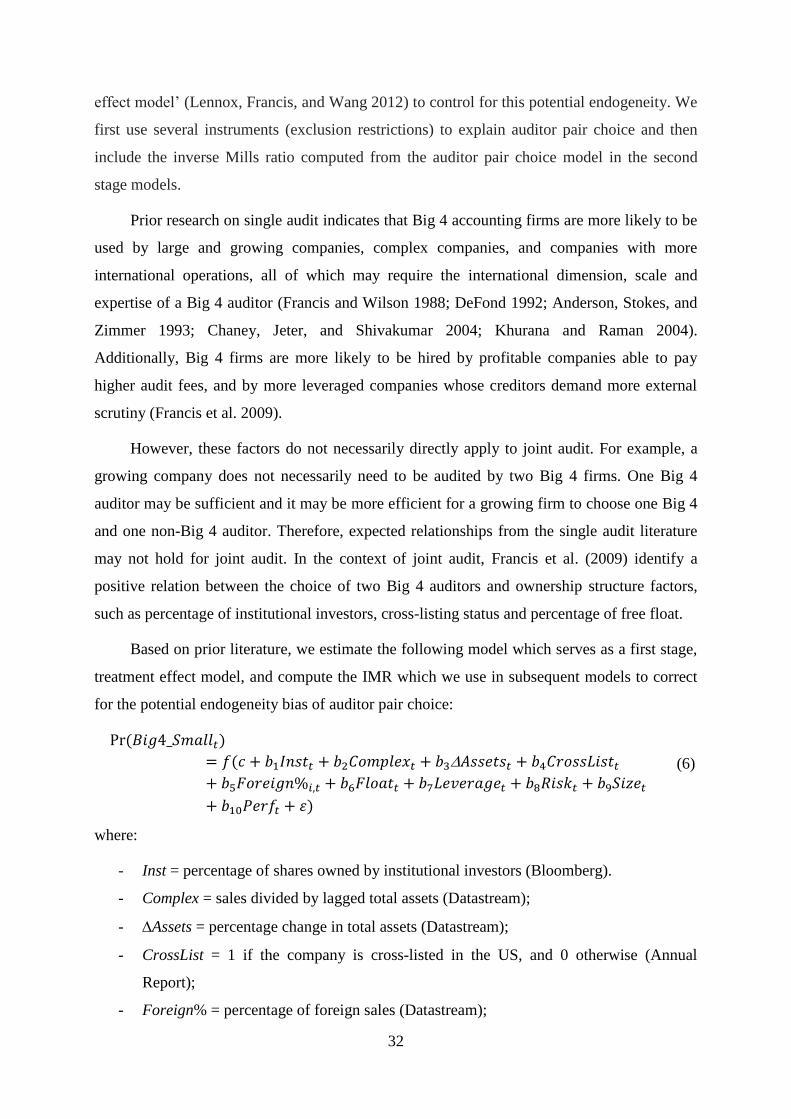
32
effect model’ (Lennox, Francis, and Wang 2012) to control for this potential endogeneity. We
first use several instruments (exclusion restrictions) to explain auditor pair choice and then
include the inverse Mills ratio computed from the auditor pair choice model in the second
stage models.
Prior research on single audit indicates that Big 4 accounting firms are more likely to be
used by large and growing companies, complex companies, and companies with more
international operations, all of which may require the international dimension, scale and
expertise of a Big 4 auditor (Francis and Wilson 1988; DeFond 1992; Anderson, Stokes, and
Zimmer 1993; Chaney, Jeter, and Shivakumar 2004; Khurana and Raman 2004).
Additionally, Big 4 firms are more likely to be hired by profitable companies able to pay
higher audit fees, and by more leveraged companies whose creditors demand more external
scrutiny (Francis et al. 2009).
However, these factors do not necessarily directly apply to joint audit. For example, a
growing company does not necessarily need to be audited by two Big 4 firms. One Big 4
auditor may be sufficient and it may be more efficient for a growing firm to choose one Big 4
and one non-Big 4 auditor. Therefore, expected relationships from the single audit literature
may not hold for joint audit. In the context of joint audit, Francis et al. (2009) identify a
positive relation between the choice of two Big 4 auditors and ownership structure factors,
such as percentage of institutional investors, cross-listing status and percentage of free float.
Based on prior literature, we estimate the following model which serves as a first stage,
treatment effect model, and compute the IMR which we use in subsequent models to correct
for the potential endogeneity bias of auditor pair choice:
(6)
where:
- Inst = percentage of shares owned by institutional investors (Bloomberg).
- Complex = sales divided by lagged total assets (Datastream);
- Assets = percentage change in total assets (Datastream);
- CrossList = 1 if the company is cross-listed in the US, and 0 otherwise (Annual
Report);
- Foreign% = percentage of foreign sales (Datastream);
33
- Float = percentage of shares available to trade (Datastream);
- Leverage = financial debt minus cash and cash equivalents, divided by market value of
equity (Datastream);
- Risk = 5-year unlevered beta (Datastream);
- Size = natural logarithm of market value of equity (Datastream);
- Perf = EBITDA divided by total assets (Datastream).
Table 6 presents the estimation results of the probit model (6) that identifies factors
related to the choice of auditor pair type.
[Insert Table 6 About Here]
The results indicate that larger firms, firms with more complex operations, firms with
higher institutional holdings, firms with more business risk, better performing firms, firms
with higher levels of financial leverage, and firms cross-listed in the US tend to choose a Big
4–Big 4 auditor pair over a Big 4–non-Big 4 auditor pair. Prior research indicates that these
factors are associated with more conservative financial reporting (e.g., Ahmed, Billings,
Morton, and Stanford-Harris 2002; Ramalingegowda and Yu 2012). Therefore, everything
else equal, any selection bias introduced by a firm’s joint auditor pair choice positively
influences the probability of finding higher conservatism for firms audited by two Big 4
auditors, i.e., the selection should bias against our prediction. Overall, the pseudo-R² is 41%
and is relatively high compared to previous studies (see Francis et al. 2009Table 3). We run
the tests for unconditional conservatism, conditional conservatism, and transparency of
impairment with the IMR obtained from the first stage auditor pair choice model as an
additional control variable. We note that the restrictions used in our treatment effect models
are to some extent ad hoc, i.e., we do not rely on established theory to explain why we
exclude some independent variables in the second stage model. However, following Lennox
et al. (2012, p. 610) we corroborate the primary inferences from OLS models when
“defensible exclusion restrictions are not available.” Additionally, the results from model (6)
show that self-selection works against our findings.
Untabulated results24
from our treatment effect models, i.e., models including the IMR
variable derived from model (6), give qualitatively similar results for unconditional
conservatism (market-to-book), conditional conservatism, and transparency of impairment
tests (Score). In these three models the significance of the coefficients of our main variables
24
Available upon request.
34
of interest (i.e., Big4_Small, Big4_Small*BN*R, and Big4_Small*LowPerf) are higher,
consistent with self-selection working against our findings.
8. Conclusion
In the current international debate on legal audit reform, France’s unique institutional
environment offers an ideal setting for assessing the benefits and potential limits of joint
audit. We show that the two dimensions of audit quality, namely competence and
independence, are likely to differ across different auditor pairs. We provide theoretical and
empirical evidence on the implication of joint auditor pairs for accounting conservatism using
established measures of conservatism as well as impairment test timeliness and
transparency.25
We argue that the pairing of two Big 4 auditors, who share the litigation and reputation
cost equally, may rely on each other too much when deciding on whether to report a
discovered breach or not. This situation is less likely to occur when a Big 4 auditor is paired
with a non-Big 4 auditor because the Big 4 auditor bears a disproportionately larger
percentage of the reputation and litigation costs. The unequal risk sharing can motivate the
Big 4 auditor to remain independent and enforce conservative financial reporting. We
examine the relation between auditor pair type and measures of unconditional and conditional
conservatism using market-to-book ratio and Basu’s (1997) asymmetric timeliness
coefficient, respectively, and complement these analyses with tests of impairment timeliness
and transparency which facilitate a finer examination of the relations between auditor pair
type and conservatism.
Using a sample of French listed firms, we present evidence that firms audited by Big 4–
non-Big 4 auditor pairs are more unconditionally and conditionally conservative and more
likely to recognize economic impairment than firms audited by Big 4–Big 4 auditor pairs. We
further show that unlike firms audited by Big 4–Big 4 pairs, firms audited by Big 4–non-Big 4
pairs become more transparent in their impairment disclosure when their operating
performance is poor. Overall, these results are consistent with our theoretical predictions.
We contribute to the literature at several levels. First, we provide insights on the
implication of joint audit for audit quality that are relevant to policy makers. Our study
25
We have also examined the relation between auditor pairs and abnormal accruals and find no statistical
differences between firms audited by Big 4–Big 4 pairs vs. Big 4–non-Big 4 pairs and absolute or signed
abnormal accruals.
35
indicates that policy makers considering joint audit in order to decrease the market
concentration and improve audit quality should consider the composition of auditor pairs. A
pair of two Big 4 auditors will not necessarily result in better audit quality than a pair of one
Big 4 auditor and one non-Big 4 auditor. In fact, our results indicate that the Big 4–non-Big 4
auditor pair could result in higher audit quality due to higher auditor independence. Second,
using self-constructed measures of impairment disclosure transparency, we attempt to
disentangle the effects of competence and independence on audit quality. Lastly, we show
that strategic interactions between the joint auditors are important in determining their action
and hence the audit quality. Specifically, unequal risk sharing between Big and Small auditors
can affect auditors’ independence and is likely to have an effect on audit quality.
The results presented in this study can be generalized to other countries, in particular in
Europe. Among countries using joint audit, France has the largest stock market (third in
Europe behind the UK and Germany) and shares many common institutional features with
other continental European countries such as the origin of the legal system, governance
mechanisms, and capital structure. The time period of our study covers years 2006 to 2009,
which include the financial and economic crisis of 2008 – 2009 that affected all the European
countries as well as many countries outside Europe. This period offers ideal conditions to
assess the implications of auditor pairs on enforcement of impairment tests that ensure
conservatism of financial reporting.
36
Appendix 1 – Impairment Tests: Background
IAS 36, “Impairment of assets” (IASB 2004), prescribes the procedures and disclosures
required to perform impairment tests. IAS 36 covers a large range of assets from tangible to
intangible assets: land, buildings, machinery, investment property, investments in subsidiaries
carried at cost, technologies, brands, customer relationships, and goodwill. Impairments are
required to be reported in profit or loss if the net book value of an asset is higher than the
recoverable value, the latter being the higher of fair value less costs to sell or value-in-use. If
it is impossible to determine the recoverable amount for an individual asset, IAS 36 prescribes
that recoverable amount be determined for groups of assets known as cash generating units. In
order to identify a specific cash generating unit, the associated cash flows must be
independent from cash flows arising from other cash generating units. Goodwill is typically
allocated to one or several cash generating units and tested indirectly within a cash generating
unit or group of cash generating units. The fair value estimate of the cash generating unit is
typically based either on a discounted cash flow approach or on a relative valuation approach
except when a cash generating unit is listed (which is extremely rare). If the recoverable value
of a cash generating unit to which goodwill has been allocated is below its carrying value, the
entity must recognize an impairment loss. The value of goodwill is written down first before
reducing other assets’ carrying values.
Because of the valuation methods used, impairments of assets are based on management
estimates (Petersen and Plenborg 2010, p. 420). Managers usually acknowledge that they use
specific assumptions for impairment testing purposes. For example in Alcatel-Lucent’s 2008
annual report (p. 245) its management acknowledges that “the recoverable values of our
goodwill and intangible assets, as determined for the impairment tests performed by the
Group, are based on key assumptions which could have a significant impact on the
consolidated financial statements. These key assumptions include, among other things, the
following elements: discount rate; and projected cash-flows […].” Managers are often not
explicit regarding the valuation assumptions they used to estimate recoverable values.
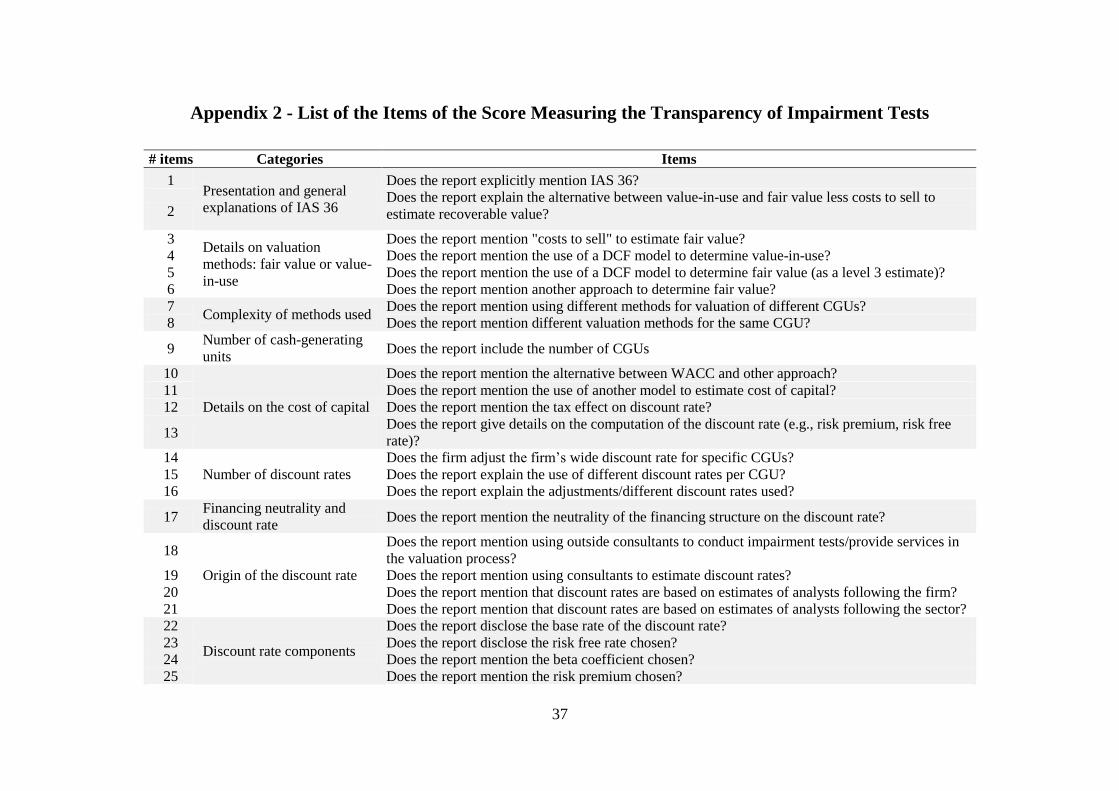
37
Appendix 2 - List of the Items of the Score Measuring the Transparency of Impairment Tests
# items Categories Items
1 Presentation and general
explanations of IAS 36
Does the report explicitly mention IAS 36?
2 Does the report explain the alternative between value-in-use and fair value less costs to sell to
estimate recoverable value?
3 Details on valuation
methods: fair value or value-
in-use
Does the report mention "costs to sell" to estimate fair value? 4 Does the report mention the use of a DCF model to determine value-in-use? 5 Does the report mention the use of a DCF model to determine fair value (as a level 3 estimate)? 6 Does the report mention another approach to determine fair value? 7
Complexity of methods used Does the report mention using different methods for valuation of different CGUs?
8 Does the report mention different valuation methods for the same CGU?
9 Number of cash-generating
units Does the report include the number of CGUs
10
Details on the cost of capital
Does the report mention the alternative between WACC and other approach? 11 Does the report mention the use of another model to estimate cost of capital? 12 Does the report mention the tax effect on discount rate?
13 Does the report give details on the computation of the discount rate (e.g., risk premium, risk free
rate)? 14
Number of discount rates Does the firm adjust the firm’s wide discount rate for specific CGUs?
15 Does the report explain the use of different discount rates per CGU? 16 Does the report explain the adjustments/different discount rates used?
17 Financing neutrality and
discount rate Does the report mention the neutrality of the financing structure on the discount rate?
18
Origin of the discount rate
Does the report mention using outside consultants to conduct impairment tests/provide services in
the valuation process? 19 Does the report mention using consultants to estimate discount rates? 20 Does the report mention that discount rates are based on estimates of analysts following the firm? 21 Does the report mention that discount rates are based on estimates of analysts following the sector? 22
Discount rate components
Does the report disclose the base rate of the discount rate? 23 Does the report disclose the risk free rate chosen? 24 Does the report mention the beta coefficient chosen? 25 Does the report mention the risk premium chosen?
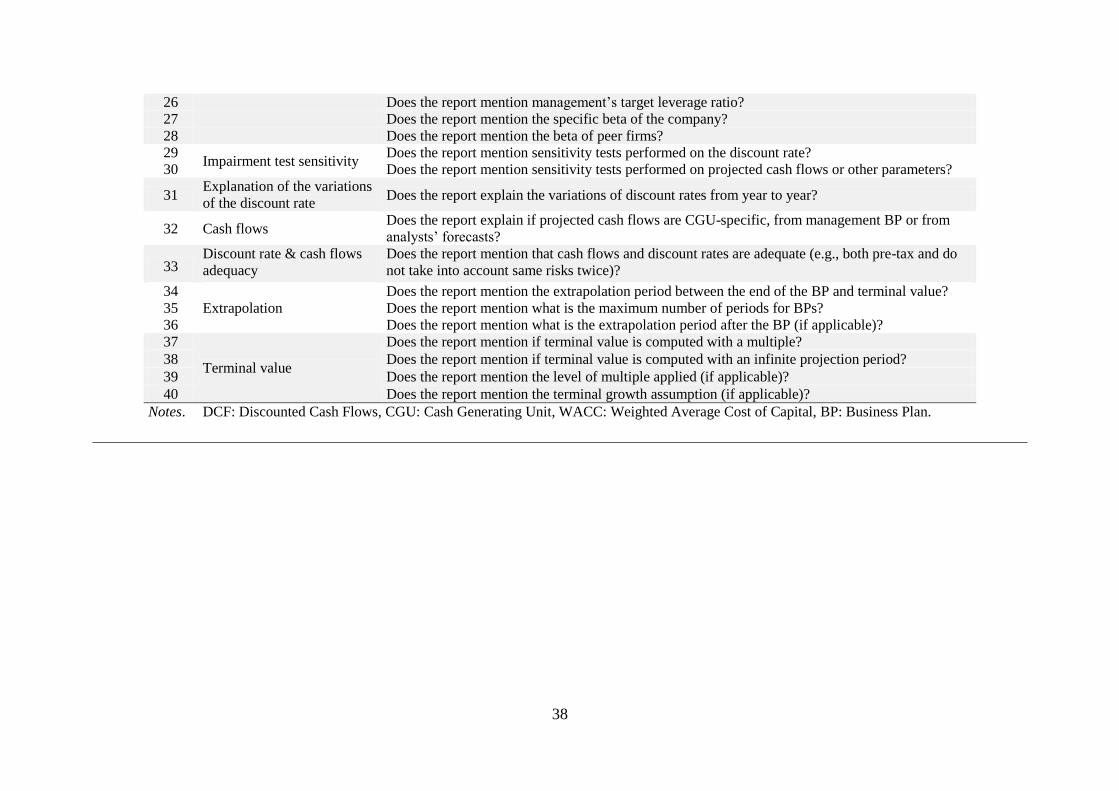
38
26 Does the report mention management’s target leverage ratio? 27 Does the report mention the specific beta of the company? 28 Does the report mention the beta of peer firms? 29
Impairment test sensitivity Does the report mention sensitivity tests performed on the discount rate?
30 Does the report mention sensitivity tests performed on projected cash flows or other parameters?
31 Explanation of the variations
of the discount rate Does the report explain the variations of discount rates from year to year?
32 Cash flows Does the report explain if projected cash flows are CGU-specific, from management BP or from
analysts’ forecasts?
33 Discount rate & cash flows
adequacy Does the report mention that cash flows and discount rates are adequate (e.g., both pre-tax and do
not take into account same risks twice)?
34 Extrapolation
Does the report mention the extrapolation period between the end of the BP and terminal value? 35 Does the report mention what is the maximum number of periods for BPs? 36 Does the report mention what is the extrapolation period after the BP (if applicable)? 37
Terminal value
Does the report mention if terminal value is computed with a multiple? 38 Does the report mention if terminal value is computed with an infinite projection period? 39 Does the report mention the level of multiple applied (if applicable)? 40 Does the report mention the terminal growth assumption (if applicable)?
Notes. DCF: Discounted Cash Flows, CGU: Cash Generating Unit, WACC: Weighted Average Cost of Capital, BP: Business Plan.
39
References
AbuGhazaleh, N. M., O. M. Al-Hares, and A. E. Haddad. 2012. The value relevance of
goodwill impairments: Uk evidence. International Journal of Economics & Finance 4
(4): 206-216.
Ahmed, A. S., B. K. Billings, R. M. Morton, and M. Stanford-Harris. 2002. The role of
accounting conservatism in mitigating bondholder-shareholder conflicts over dividend
policy and in reducing debt costs. The Accounting Review 77 (4): 867-890.
Amiraslani, H., G. E. Latridis, and P. Pope. 2013 Accounting for asset impairment: A test for
IFRS compliance across Europe A research report by the centre for Financial
Analysis and Reporting Research, Cass Business School 68 p.
Anderson, D., D. Stokes, and I. Zimmer. 1993. Corporate takeovers and auditor switching.
Auditing 12 (1): 65-73.
André, P., G. Broye, C. Pong, and A. Schatt. 2013. Are joint audits associated with higher
audit fees? Working paper ESSEC Business School.
Ball, R., A. Robin, and G. Sadka. 2008. Is financial reporting shaped by equity markets or by
debt markets? An international study of timeliness and conservatism. Review of
Accounting Studies 13 (2/3): 168-205.
Basu, S. 1997. The conservatism principle and the asymmetric timeliness of earnings. Journal
of Accounting & Economics 24 (1): 3-37.
Beatty, A., and J. Weber. 2006. Accounting discretion in fair value estimates: An examination
of SFAS 142 goodwill impairments. Journal of Accounting Research 44 (2): 257-288.
Beaver, W. H., and S. G. Ryan. 2005. Conditional and unconditional conservatism:Concepts
and modeling. Review of Accounting Studies 10 (2/3): 269-309.
Becker, C. L., M. L. Defond, J. Jiambalvo, and K. R. Subramanyam. 1998. The effect of audit
quality on earnings management. Contemporary Accounting Research 15 (1): 1-24.
Behn, B. K., C. Jong-Hag, and T. Kang. 2008. Audit quality and properties of analyst
earnings forecasts. Accounting Review 83 (2): 327-349.
Bens, D. A., W. Heltzer, and B. Segal. 2011. The information content of goodwill
impairments and SFAS 142. Journal of Accounting, Auditing & Finance 26 (3): 527-
555.
Botosan, C. A. 1997. Disclosure level and the cost of equity capital. The Accounting Review
72 (3): 323-349.
Carcello, J. V., and A. L. Nagy. 2004. Audit firm tenure and fraudulent financial reporting.
Auditing 23 (2): 57-71.
Chaney, P. K., D. Jeter, and L. Shivakumar. 2004. Self-selection of auditors and audit pricing
in private firms. The Accounting Review 79 (1): 51-72.
Chihi, H., and N. Mhirsi. 2013. Joint audits and audit quality: A matter of size and / or
seniority. Working paper, Université Paris-Dauphine.
DeAngelo, L. E. 1981. Auditor size and audit quality. Journal of Accounting & Economics 3
(3): 183-199.
40
Dechow, P., W. Ge, and C. Schrand. 2010. Understanding earnings quality: A review of the
proxies, their determinants and their consequences. Journal of Accounting &
Economics 50 (2/3): 344-401.
DeFond, M. L. 1992. The association between changes in client firm agency costs and auditor
switching. Auditing 11 (1): 16-31.
Deng, M., L. Tong, D. A. Simunic, and M. Ye. 2012. Do joint audits improve or impair audit
quality? Working paper University of Houston.
Dopuch, N., and D. A. Simunic. 1980. The nature of competition in the auditing profession: A
descriptive and normative view. In Regulation and the accounting profession, eds,
Buckley, J. and F. Weston. Belmont, California.
ESMA. 2013. European enforcers review of impairment of goodwill and other intangible
assets in the IFRS financial statements. European Securities and Market Authority
ESMA Report (January).
European Commission. 2011a. Proposal for a directive of the European parliament and of the
council: Amending directive 2006/43/ec on statutory audits of annual accounts and
consolidated accounts. Brussels.
European Commission. 2011b. Proposal for a regulation of the European parliament and of
the council: On specific requirements regarding statutory audit of public-interest
entities. Brussels.
FASB. 2001. Statement of financial accounting standards (SFAS) No. 142: Goodwill and
other intangible assets. Norwalk, CT: Financial Accounting Standards Board.
Fields, T. D., T. Z. Lys, and L. Vincent. 2001. Empirical research on accounting choice.
Journal of Accounting & Economics 31 (1-3): 255-307.
Francis, J., J. D. Hanna, and L. Vincent. 1996. Causes and effects of discretionary asset write-
offs. Journal of Accounting Research 34 (3): 117-134.
Francis, J., R. LaFond, P. M. Olsson, and K. Schipper. 2004. Costs of equity and earnings
attributes. Accounting Review 79 (4): 967-1010.
Francis, J., P. Olsson, and K. Schipper. 2006. Earnings quality. Foundations & Trends in
Accounting 1 (4): 259-260.
Francis, J. R., C. Richard, and A. Vanstraelen. 2009. Assessing france's joint audit
requirement: Are two heads better than one? Auditing 28 (2): 35-63.
Francis, J. R., and E. R. Wilson. 1988. Auditor changes: A joint test of theory relating to
agency costs and auditor differentiation. The Accounting Review 63 (4): 663.
García Lara, J. M., and A. Mora. 2004. Balance sheet versus earnings conservatism in Europe.
European Accounting Review 13 (2): 261-292.
Hayn, C., and P. J. Hughes. 2006. Leading indicators of goodwill impairment. Journal of
Accounting, Auditing & Finance 21 (3): 223-265.
Healy, P. M., A. P. Hutton, and K. G. Palepu. 1999. Stock performance and intermediation
changes surrounding sustained increases in disclosure. Contemporary Accounting
Research 16 (3): 485-520.
Heckman, J. J. 1979. Sample selection bias as a specification error. Econometrica 47 (1): 153-
161.
41
IASB. 2004. International accounting standard (IAS) No. 36: Impairment of assets. London:
IASC Foundation Publications Department.
Khurana, I. K., and K. K. Raman. 2004. Litigation risk and the financial reporting credibility
of big 4 versus non-big 4 audits: Evidence from anglo-american countries. The
Accounting Review 79 (2): 473-495.
Kim, S., C. Lee, and S. W. Yoon. 2013. Goodwill accounting and asymmetric timeliness of
earnings. Review of Accounting and Finance Forthcoming.
Kothari, S. P., K. Ramanna, and D. J. Skinner. 2010. Implications for gaap from an analysis
of positive research in accounting. Journal of Accounting & Economics 50 (2/3): 246-
286.
Lennox, C. S., J. R. Francis, and Z. Wang. 2012. Selection models in accounting research.
Accounting Review 87 (2): 589-616.
Lesage, C., N. Ratzinger-Sakel, and J. Kettunen. 2011. Is joint audit bad or good? Efficiency
perspective evidence from three European countries. Working paper - HEC Paris,
Ulm University and University of Jyvaskyla.
Li, K. K., and R. G. Sloan. 2011. Has goodwill accounting gone bad? Canadian Academic
Accounting Association, Annual Conference, Toronto.
Marmousez, S. 2009. The choice of joint-auditors and earnings quality: Evidence from
French listed companies. Canadian Academic Accounting Association, Annual
Conference, Montreal.
Mazars. 2010. Contribution to the consultation on the green paper "audit policy: Lessons from
the crisis". available at
http://www.mazars.fr/mazarspage/download/54034/1299441/version/2/file/GreenPape
r_EN.pdf.
Neveling, N. 2007. French CFO attacks joint audit. Accountancy Age: 4-4.
Ohlson, J. A. 1995. Earnings, book values, and dividends in equity valuation. Contemporary
Accounting Research 11 (2): 661-687.
Palmrose, Z.-V. 1988. An analysis of auditor litigation and audit service quality. The
Accounting Review 63 (1): 55-74.
Petersen, C., and T. Plenborg. 2010. How do firms implement impairment tests of goodwill?
Abacus 46 (4): 419-446.
Piot, C., P. Dumontier, and R. Janin. 2011. IFRS consequences on accounting conservatism
within Europe: The role of big 4 auditors. Working paper Université de Grenoble.
Pope, P. F., and M. Walker. 2003. Ex-ante and ex-post accounting conservatism, asset
recognition and asymmetric earnings timeliness. Working paper Lancaster University
and University of Manchester.
Ramalingegowda, S., and Y. Yu. 2012. Institutional ownership and conservatism. Journal of
Accounting & Economics 53 (1/2): 98-114.
Ramanna, K. 2008. The implications of unverifiable fair-value accounting: Evidence from the
political economy of goodwill accounting. Journal of Accounting & Economics 45
(2/3): 253-281.
Ramanna, K., and R. Watts. 2012. Evidence on the use of unverifiable estimates in required
goodwill impairment. Review of Accounting Studies 17 (4): 749-780.
42
Ratzinger-Sakel, N., S. Audousset-Coulier, J. Kettunen, and C. Lesage. 2012. What do we
know about joint audit? : ICAS.
Roychowdhury, S., and R. L. Watts. 2007. Asymmetric timeliness of earnings, market-to-
book and conservatism in financial reporting. Journal of Accounting & Economics 44
(1/2): 2-31.
Sikka, P. 2009. Financial crisis and the silence of the auditors. Accounting, Organizations &
Society 34 (6/7): 868-873.
Thinggaard, F., and L. Kiertzner. 2008. Determinants of audit fees: Evidence from a small
capital market with a joint audit requirement. International Journal of Auditing 12 (2):
141-158.
Watts, R. L. 2003. Conservatism in accounting part i: Explanations and implications.
Accounting Horizons 17 (3): 207-221.
Watts, R. L., and Zimmerman. 1986. Positive accounting theory. NJ: Edgewood Cliff.
Zerni, M., E. Haapamäki, T. Järvinen, and L. Niemi. 2012. Do joint audits improve audit
quality? Evidence from voluntary joint audits. European Accounting Review 21 (4):
731-765.
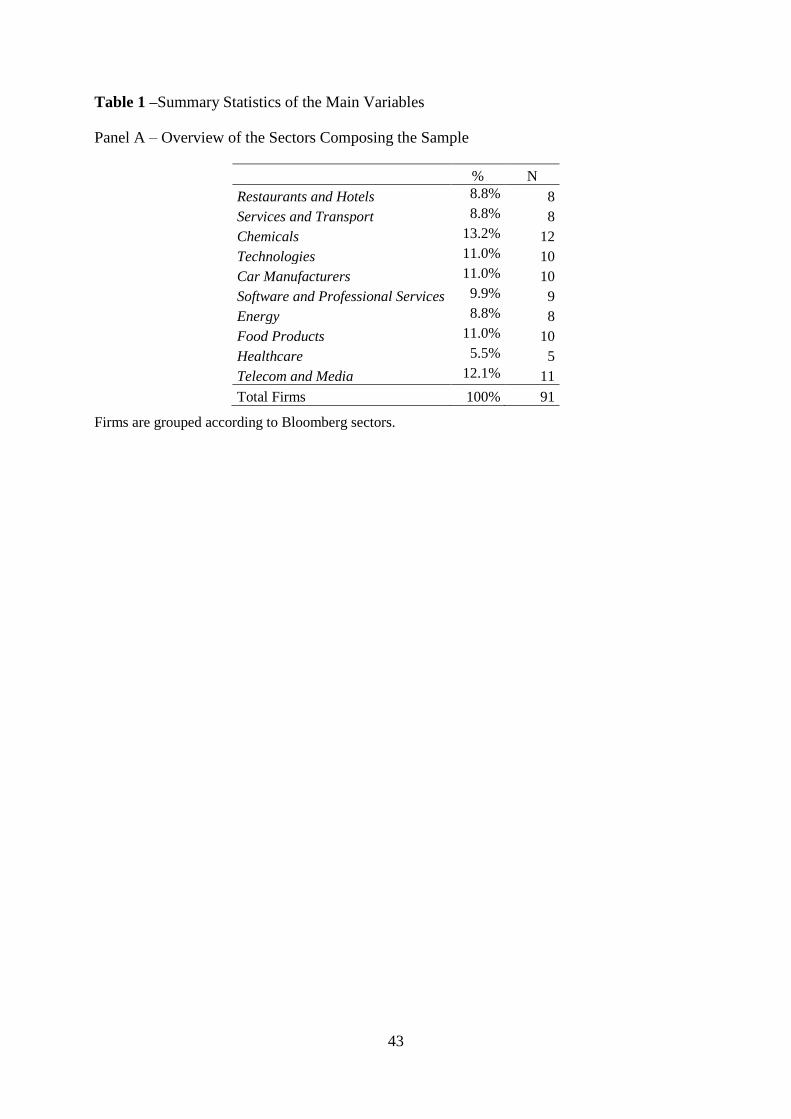
43
Table 1 –Summary Statistics of the Main Variables
Panel A – Overview of the Sectors Composing the Sample
% N
Restaurants and Hotels 8.8% 8
Services and Transport 8.8% 8
Chemicals 13.2% 12
Technologies 11.0% 10
Car Manufacturers 11.0% 10
Software and Professional Services 9.9% 9
Energy 8.8% 8
Food Products 11.0% 10
Healthcare 5.5% 5
Telecom and Media 12.1% 11
Total Firms 100% 91
Firms are grouped according to Bloomberg sectors.
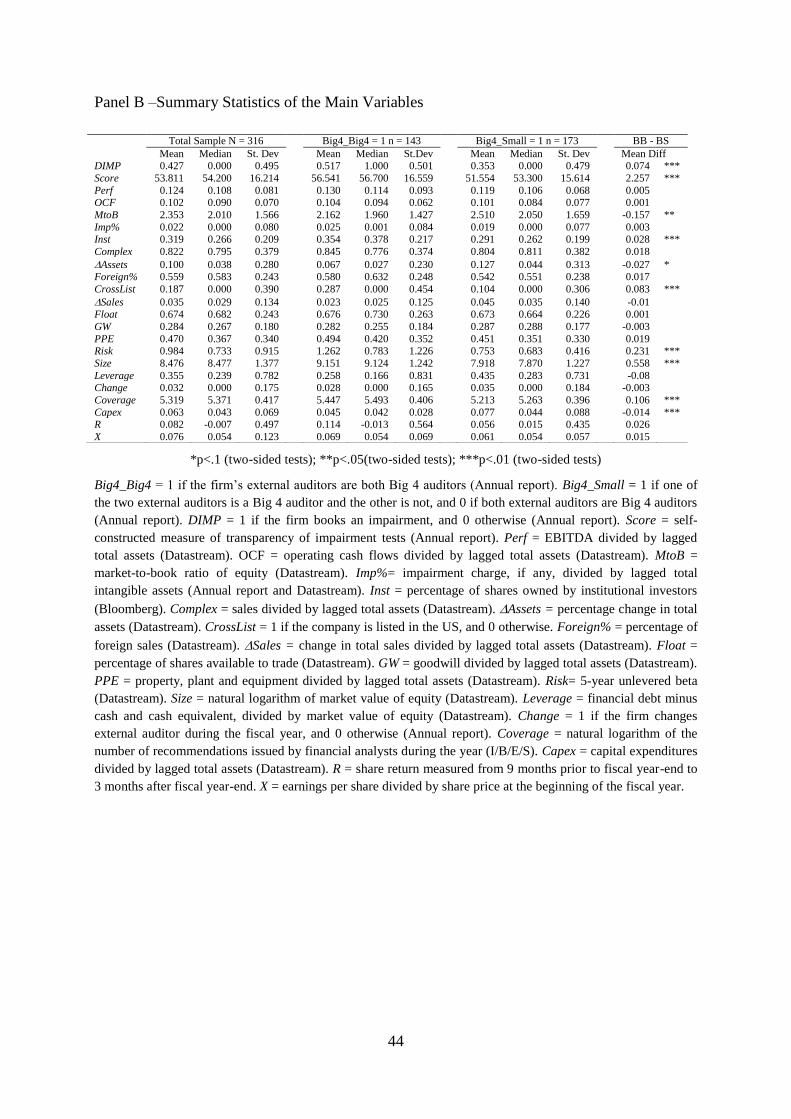
44
Panel B –Summary Statistics of the Main Variables
*p<.1 (two-sided tests); **p<.05(two-sided tests); ***p<.01 (two-sided tests)
Big4_Big4 = 1 if the firm’s external auditors are both Big 4 auditors (Annual report). Big4_Small = 1 if one of
the two external auditors is a Big 4 auditor and the other is not, and 0 if both external auditors are Big 4 auditors
(Annual report). DIMP = 1 if the firm books an impairment, and 0 otherwise (Annual report). Score = self-
constructed measure of transparency of impairment tests (Annual report). Perf = EBITDA divided by lagged
total assets (Datastream). OCF = operating cash flows divided by lagged total assets (Datastream). MtoB =
market-to-book ratio of equity (Datastream). Imp%= impairment charge, if any, divided by lagged total
intangible assets (Annual report and Datastream). Inst = percentage of shares owned by institutional investors
(Bloomberg). Complex = sales divided by lagged total assets (Datastream). Assets = percentage change in total
assets (Datastream). CrossList = 1 if the company is listed in the US, and 0 otherwise. Foreign% = percentage of
foreign sales (Datastream). Sales = change in total sales divided by lagged total assets (Datastream). Float =
percentage of shares available to trade (Datastream). GW = goodwill divided by lagged total assets (Datastream).
PPE = property, plant and equipment divided by lagged total assets (Datastream). Risk= 5-year unlevered beta
(Datastream). Size = natural logarithm of market value of equity (Datastream). Leverage = financial debt minus
cash and cash equivalent, divided by market value of equity (Datastream). Change = 1 if the firm changes
external auditor during the fiscal year, and 0 otherwise (Annual report). Coverage = natural logarithm of the
number of recommendations issued by financial analysts during the year (I/B/E/S). Capex = capital expenditures
divided by lagged total assets (Datastream). R = share return measured from 9 months prior to fiscal year-end to
3 months after fiscal year-end. X = earnings per share divided by share price at the beginning of the fiscal year.
Total Sample N = 316 Big4_Big4 = 1 n = 143
Big4_Small = 1 n = 173 BB - BS
Mean Median St. Dev
Mean Median St.Dev
Mean Median St. Dev
Mean Diff DIMP 0.427 0.000 0.495
0.517 1.000 0.501
0.353 0.000 0.479
0.074 ***
Score 53.811 54.200 16.214
56.541 56.700 16.559
51.554 53.300 15.614
2.257 ***
Perf 0.124 0.108 0.081
0.130 0.114 0.093
0.119 0.106 0.068
0.005 OCF 0.102 0.090 0.070
0.104 0.094 0.062
0.101 0.084 0.077
0.001
MtoB 2.353 2.010 1.566
2.162 1.960 1.427
2.510 2.050 1.659
-0.157 **
Imp% 0.022 0.000 0.080
0.025 0.001 0.084
0.019 0.000 0.077
0.003 Inst 0.319 0.266 0.209
0.354 0.378 0.217
0.291 0.262 0.199
0.028 ***
Complex 0.822 0.795 0.379
0.845 0.776 0.374
0.804 0.811 0.382
0.018
Assets 0.100 0.038 0.280
0.067 0.027 0.230
0.127 0.044 0.313
-0.027 * Foreign% 0.559 0.583 0.243
0.580 0.632 0.248
0.542 0.551 0.238
0.017
CrossList 0.187 0.000 0.390
0.287 0.000 0.454
0.104 0.000 0.306
0.083 ***
Sales 0.035 0.029 0.134
0.023 0.025 0.125
0.045 0.035 0.140
-0.01 Float 0.674 0.682 0.243
0.676 0.730 0.263
0.673 0.664 0.226
0.001
GW 0.284 0.267 0.180
0.282 0.255 0.184
0.287 0.288 0.177
-0.003
PPE 0.470 0.367 0.340
0.494 0.420 0.352
0.451 0.351 0.330
0.019 Risk 0.984 0.733 0.915
1.262 0.783 1.226
0.753 0.683 0.416
0.231 ***
Size 8.476 8.477 1.377
9.151 9.124 1.242
7.918 7.870 1.227
0.558 ***
Leverage 0.355 0.239 0.782
0.258 0.166 0.831
0.435 0.283 0.731
-0.08 Change 0.032 0.000 0.175
0.028 0.000 0.165
0.035 0.000 0.184
-0.003
Coverage 5.319 5.371 0.417
5.447 5.493 0.406
5.213 5.263 0.396
0.106 ***
Capex 0.063 0.043 0.069
0.045 0.042 0.028
0.077 0.044 0.088
-0.014 *** R 0.082 -0.007 0.497 0.114 -0.013 0.564 0.056 0.015 0.435 0.026
X 0.076 0.054 0.123 0.069 0.054 0.069 0.061 0.054 0.057 0.015
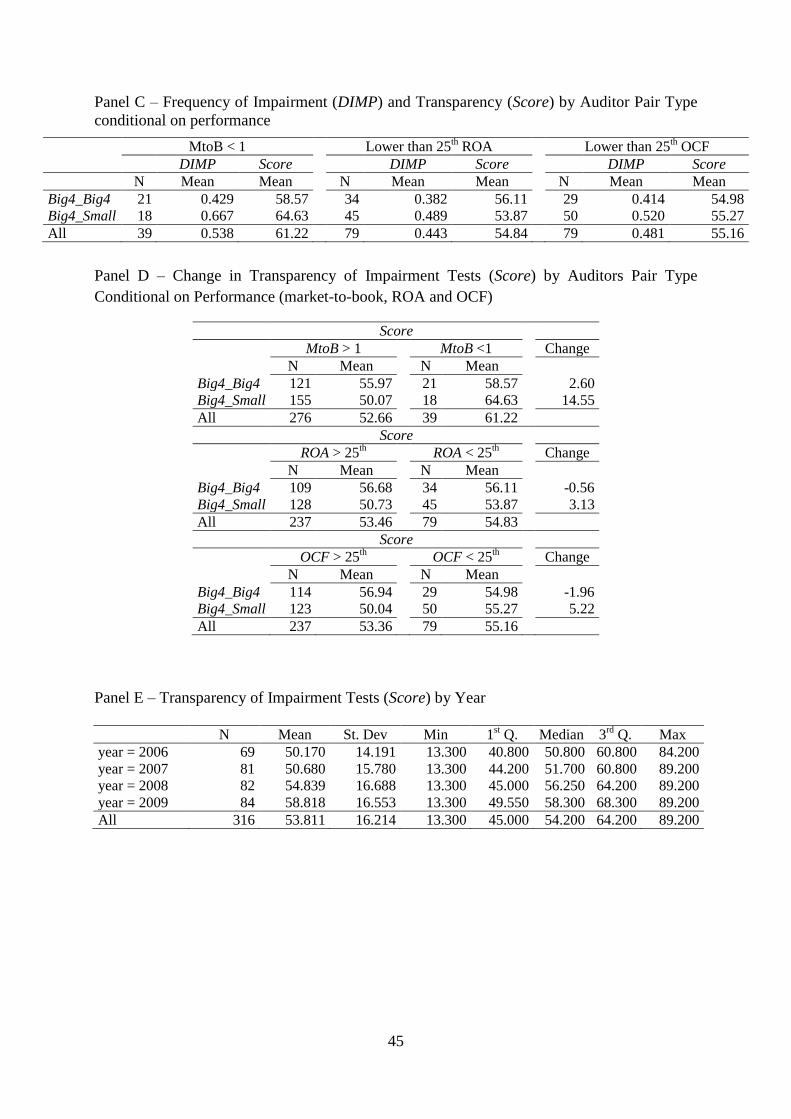
45
Panel C – Frequency of Impairment (DIMP) and Transparency (Score) by Auditor Pair Type
conditional on performance
MtoB < 1 Lower than 25
th ROA Lower than 25
th OCF
DIMP Score
DIMP Score
DIMP Score
N Mean Mean
N Mean Mean
N Mean Mean Big4_Big4 21 0.429 58.57
34 0.382 56.11
29 0.414 54.98
Big4_Small 18 0.667 64.63
45 0.489 53.87
50 0.520 55.27 All 39 0.538 61.22 79 0.443 54.84 79 0.481 55.16
Panel D – Change in Transparency of Impairment Tests (Score) by Auditors Pair Type
Conditional on Performance (market-to-book, ROA and OCF)
Score
MtoB > 1 MtoB <1
Change
N Mean
N Mean
Big4_Big4 121 55.97
21 58.57
2.60 Big4_Small 155 50.07
18 64.63
14.55
All 276 52.66 39 61.22
Score
ROA > 25
th ROA < 25
th
Change
N Mean
N Mean
Big4_Big4 109 56.68
34 56.11
-0.56 Big4_Small 128 50.73
45 53.87
3.13
All 237 53.46 79 54.83 Score
OCF > 25
th OCF < 25th
Change
N Mean
N Mean
Big4_Big4 114 56.94
29 54.98
-1.96 Big4_Small 123 50.04
50 55.27
5.22
All 237 53.36 79 55.16
Panel E – Transparency of Impairment Tests (Score) by Year
N Mean St. Dev Min 1st Q. Median 3
rd Q. Max
year = 2006 69 50.170 14.191 13.300 40.800 50.800 60.800 84.200 year = 2007 81 50.680 15.780 13.300 44.200 51.700 60.800 89.200 year = 2008 82 54.839 16.688 13.300 45.000 56.250 64.200 89.200 year = 2009 84 58.818 16.553 13.300 49.550 58.300 68.300 89.200 All 316 53.811 16.214 13.300 45.000 54.200 64.200 89.200
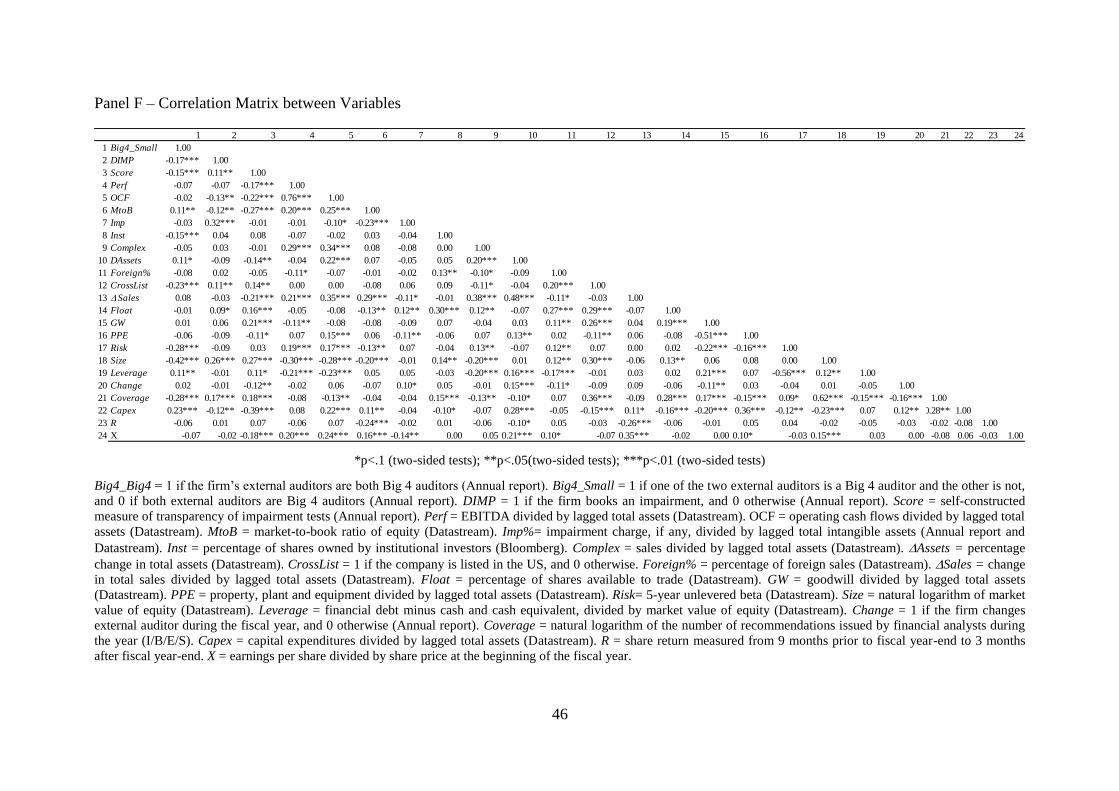
46
Panel F – Correlation Matrix between Variables
*p<.1 (two-sided tests); **p<.05(two-sided tests); ***p<.01 (two-sided tests)
Big4_Big4 = 1 if the firm’s external auditors are both Big 4 auditors (Annual report). Big4_Small = 1 if one of the two external auditors is a Big 4 auditor and the other is not,
and 0 if both external auditors are Big 4 auditors (Annual report). DIMP = 1 if the firm books an impairment, and 0 otherwise (Annual report). Score = self-constructed
measure of transparency of impairment tests (Annual report). Perf = EBITDA divided by lagged total assets (Datastream). OCF = operating cash flows divided by lagged total
assets (Datastream). MtoB = market-to-book ratio of equity (Datastream). Imp%= impairment charge, if any, divided by lagged total intangible assets (Annual report and
Datastream). Inst = percentage of shares owned by institutional investors (Bloomberg). Complex = sales divided by lagged total assets (Datastream). Assets = percentage
change in total assets (Datastream). CrossList = 1 if the company is listed in the US, and 0 otherwise. Foreign% = percentage of foreign sales (Datastream). Sales = change
in total sales divided by lagged total assets (Datastream). Float = percentage of shares available to trade (Datastream). GW = goodwill divided by lagged total assets
(Datastream). PPE = property, plant and equipment divided by lagged total assets (Datastream). Risk= 5-year unlevered beta (Datastream). Size = natural logarithm of market
value of equity (Datastream). Leverage = financial debt minus cash and cash equivalent, divided by market value of equity (Datastream). Change = 1 if the firm changes
external auditor during the fiscal year, and 0 otherwise (Annual report). Coverage = natural logarithm of the number of recommendations issued by financial analysts during
the year (I/B/E/S). Capex = capital expenditures divided by lagged total assets (Datastream). R = share return measured from 9 months prior to fiscal year-end to 3 months
after fiscal year-end. X = earnings per share divided by share price at the beginning of the fiscal year.
1 2 3 4 5 6 7 8 9 10 11 12 13 14 15 16 17 18 19 20 21 22 23 24
1 Big4_Small 1.00
2 DIMP -0.17*** 1.00
3 Score -0.15*** 0.11** 1.00
4 Perf -0.07 -0.07 -0.17*** 1.00
5 OCF -0.02 -0.13** -0.22*** 0.76*** 1.00
6 MtoB 0.11** -0.12** -0.27*** 0.20*** 0.25*** 1.00
7 Imp -0.03 0.32*** -0.01 -0.01 -0.10* -0.23*** 1.00
8 Inst -0.15*** 0.04 0.08 -0.07 -0.02 0.03 -0.04 1.00
9 Complex -0.05 0.03 -0.01 0.29*** 0.34*** 0.08 -0.08 0.00 1.00
10 DAssets 0.11* -0.09 -0.14** -0.04 0.22*** 0.07 -0.05 0.05 0.20*** 1.00
11 Foreign% -0.08 0.02 -0.05 -0.11* -0.07 -0.01 -0.02 0.13** -0.10* -0.09 1.00
12 CrossList -0.23*** 0.11** 0.14** 0.00 0.00 -0.08 0.06 0.09 -0.11* -0.04 0.20*** 1.00
13 Sales 0.08 -0.03 -0.21*** 0.21*** 0.35*** 0.29*** -0.11* -0.01 0.38*** 0.48*** -0.11* -0.03 1.00
14 Float -0.01 0.09* 0.16*** -0.05 -0.08 -0.13** 0.12** 0.30*** 0.12** -0.07 0.27*** 0.29*** -0.07 1.00
15 GW 0.01 0.06 0.21*** -0.11** -0.08 -0.08 -0.09 0.07 -0.04 0.03 0.11** 0.26*** 0.04 0.19*** 1.00
16 PPE -0.06 -0.09 -0.11* 0.07 0.15*** 0.06 -0.11** -0.06 0.07 0.13** 0.02 -0.11** 0.06 -0.08 -0.51*** 1.00
17 Risk -0.28*** -0.09 0.03 0.19*** 0.17*** -0.13** 0.07 -0.04 0.13** -0.07 0.12** 0.07 0.00 0.02 -0.22*** -0.16*** 1.00
18 Size -0.42*** 0.26*** 0.27*** -0.30*** -0.28*** -0.20*** -0.01 0.14** -0.20*** 0.01 0.12** 0.30*** -0.06 0.13** 0.06 0.08 0.00 1.00
19 Leverage 0.11** -0.01 0.11* -0.21*** -0.23*** 0.05 0.05 -0.03 -0.20*** 0.16*** -0.17*** -0.01 0.03 0.02 0.21*** 0.07 -0.56*** 0.12** 1.00
20 Change 0.02 -0.01 -0.12** -0.02 0.06 -0.07 0.10* 0.05 -0.01 0.15*** -0.11* -0.09 0.09 -0.06 -0.11** 0.03 -0.04 0.01 -0.05 1.00
21 Coverage -0.28*** 0.17*** 0.18*** -0.08 -0.13** -0.04 -0.04 0.15*** -0.13** -0.10* 0.07 0.36*** -0.09 0.28*** 0.17*** -0.15*** 0.09* 0.62*** -0.15*** -0.16*** 1.00
22 Capex 0.23*** -0.12** -0.39*** 0.08 0.22*** 0.11** -0.04 -0.10* -0.07 0.28*** -0.05 -0.15*** 0.11* -0.16*** -0.20*** 0.36*** -0.12** -0.23*** 0.07 0.12** -0.28***1.00
23 R -0.06 0.01 0.07 -0.06 0.07 -0.24*** -0.02 0.01 -0.06 -0.10* 0.05 -0.03 -0.26*** -0.06 -0.01 0.05 0.04 -0.02 -0.05 -0.03 -0.02 -0.08 1.00
24 X -0.07 -0.02 -0.18*** 0.20*** 0.24*** 0.16*** -0.14** 0.00 0.05 0.21*** 0.10* -0.07 0.35*** -0.02 0.00 0.10* -0.03 0.15*** 0.03 0.00 -0.08 0.06 -0.03 1.00
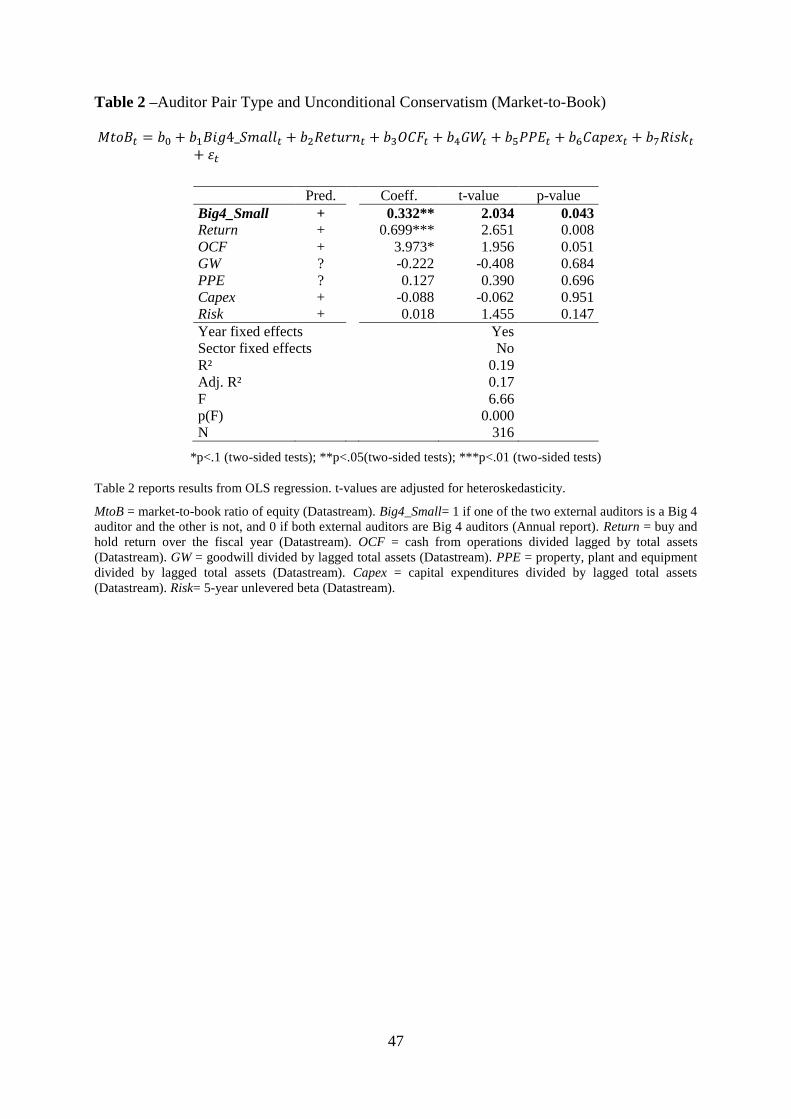
47
Table 2 –Auditor Pair Type and Unconditional Conservatism (Market-to-Book)
Pred.
Coeff. t-value p-value Big4_Small +
0.332** 2.034 0.043 Return +
0.699*** 2.651 0.008
OCF +
3.973* 1.956 0.051 GW ?
-0.222 -0.408 0.684
PPE ?
0.127 0.390 0.696 Capex +
-0.088 -0.062 0.951
Risk +
0.018 1.455 0.147 Year fixed effects
Yes
Sector fixed effects
No R²
0.19
Adj. R²
0.17 F
6.66
p(F)
0.000 N 316
*p<.1 (two-sided tests); **p<.05(two-sided tests); ***p<.01 (two-sided tests)
Table 2 reports results from OLS regression. t-values are adjusted for heteroskedasticity.
MtoB = market-to-book ratio of equity (Datastream). Big4_Small= 1 if one of the two external auditors is a Big 4
auditor and the other is not, and 0 if both external auditors are Big 4 auditors (Annual report). Return = buy and
hold return over the fiscal year (Datastream). OCF = cash from operations divided lagged by total assets
(Datastream). GW = goodwill divided by lagged total assets (Datastream). PPE = property, plant and equipment
divided by lagged total assets (Datastream). Capex = capital expenditures divided by lagged total assets
(Datastream). Risk= 5-year unlevered beta (Datastream).
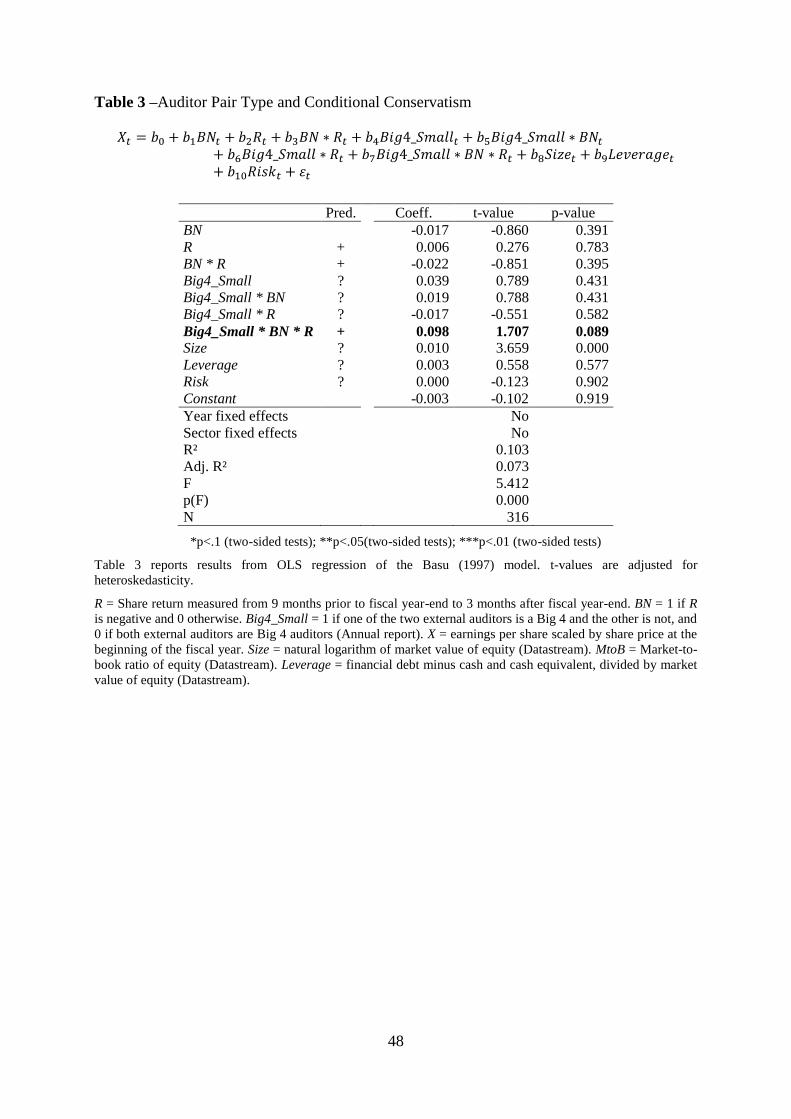
48
Table 3 –Auditor Pair Type and Conditional Conservatism
Pred.
Coeff. t-value p-value BN
-0.017 -0.860 0.391
R +
0.006 0.276 0.783 BN * R +
-0.022 -0.851 0.395
Big4_Small ?
0.039 0.789 0.431 Big4_Small * BN ?
0.019 0.788 0.431
Big4_Small * R ?
-0.017 -0.551 0.582 Big4_Small * BN * R +
0.098 1.707 0.089 Size ?
0.010 3.659 0.000
Leverage ?
0.003 0.558 0.577 Risk ?
0.000 -0.123 0.902
Constant
-0.003 -0.102 0.919 Year fixed effects
No
Sector fixed effects
No R²
0.103
Adj. R²
0.073 F
5.412
p(F)
0.000 N 316
*p<.1 (two-sided tests); **p<.05(two-sided tests); ***p<.01 (two-sided tests)
Table 3 reports results from OLS regression of the Basu (1997) model. t-values are adjusted for
heteroskedasticity.
R = Share return measured from 9 months prior to fiscal year-end to 3 months after fiscal year-end. BN = 1 if R
is negative and 0 otherwise. Big4_Small = 1 if one of the two external auditors is a Big 4 and the other is not, and
0 if both external auditors are Big 4 auditors (Annual report). X = earnings per share scaled by share price at the
beginning of the fiscal year. Size = natural logarithm of market value of equity (Datastream). MtoB = Market-to-
book ratio of equity (Datastream). Leverage = financial debt minus cash and cash equivalent, divided by market
value of equity (Datastream).
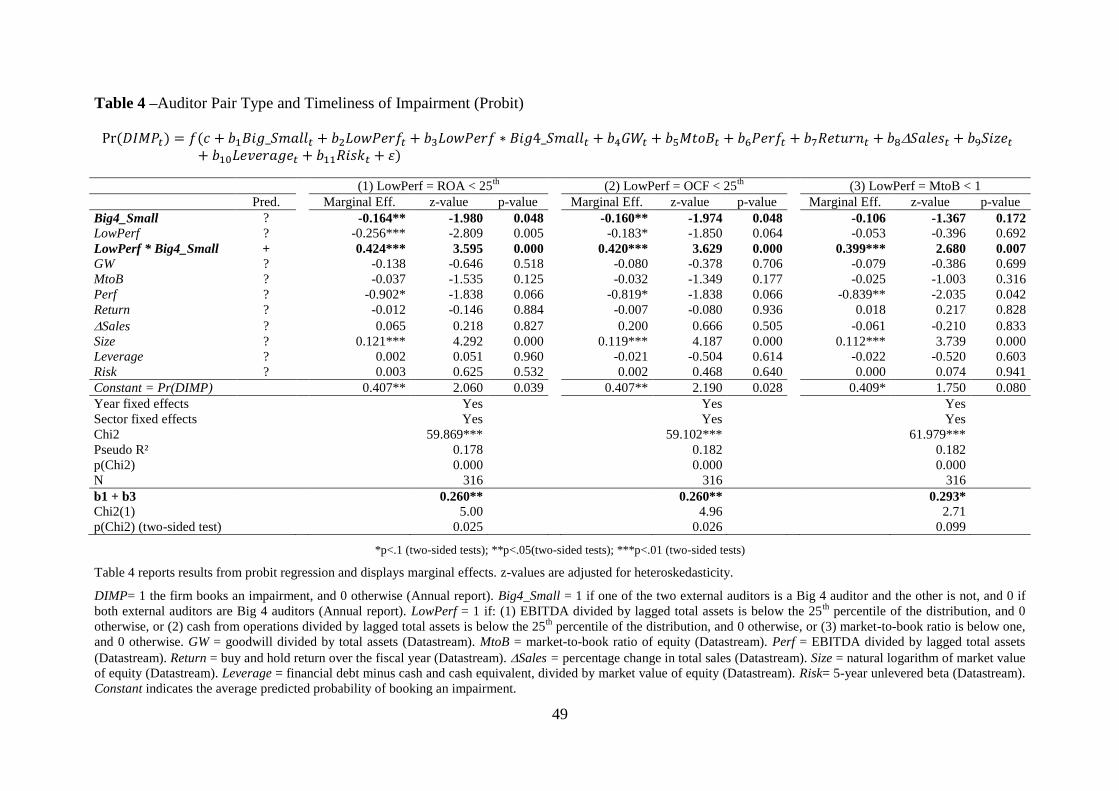
49
Table 4 –Auditor Pair Type and Timeliness of Impairment (Probit)
(1) LowPerf = ROA < 25th
(2) LowPerf = OCF < 25th
(3) LowPerf = MtoB < 1
Pred.
Marginal Eff. z-value p-value
Marginal Eff. z-value p-value
Marginal Eff. z-value p-value
Big4_Small ?
-0.164** -1.980 0.048
-0.160** -1.974 0.048
-0.106 -1.367 0.172
LowPerf ?
-0.256*** -2.809 0.005
-0.183* -1.850 0.064
-0.053 -0.396 0.692
LowPerf * Big4_Small +
0.424*** 3.595 0.000
0.420*** 3.629 0.000
0.399*** 2.680 0.007
GW ?
-0.138 -0.646 0.518
-0.080 -0.378 0.706
-0.079 -0.386 0.699
MtoB ?
-0.037 -1.535 0.125
-0.032 -1.349 0.177
-0.025 -1.003 0.316
Perf ?
-0.902* -1.838 0.066
-0.819* -1.838 0.066
-0.839** -2.035 0.042
Return ?
-0.012 -0.146 0.884
-0.007 -0.080 0.936
0.018 0.217 0.828
Sales ?
0.065 0.218 0.827
0.200 0.666 0.505
-0.061 -0.210 0.833
Size ?
0.121*** 4.292 0.000
0.119*** 4.187 0.000
0.112*** 3.739 0.000
Leverage ?
0.002 0.051 0.960
-0.021 -0.504 0.614
-0.022 -0.520 0.603
Risk ? 0.003 0.625 0.532
0.002 0.468 0.640
0.000 0.074 0.941
Constant = Pr(DIMP) 0.407** 2.060 0.039
0.407** 2.190 0.028
0.409* 1.750 0.080
Year fixed effects
Yes
Yes
Yes
Sector fixed effects
Yes
Yes
Yes
Chi2
59.869***
59.102***
61.979***
Pseudo R²
0.178
0.182
0.182
p(Chi2)
0.000
0.000
0.000
N 316 316 316
b1 + b3
0.260**
0.260**
0.293*
Chi2(1)
5.00
4.96
2.71
p(Chi2) (two-sided test) 0.025 0.026 0.099
*p<.1 (two-sided tests); **p<.05(two-sided tests); ***p<.01 (two-sided tests)
Table 4 reports results from probit regression and displays marginal effects. z-values are adjusted for heteroskedasticity.
DIMP= 1 the firm books an impairment, and 0 otherwise (Annual report). Big4_Small = 1 if one of the two external auditors is a Big 4 auditor and the other is not, and 0 if
both external auditors are Big 4 auditors (Annual report). LowPerf = 1 if: (1) EBITDA divided by lagged total assets is below the 25th
percentile of the distribution, and 0
otherwise, or (2) cash from operations divided by lagged total assets is below the 25th
percentile of the distribution, and 0 otherwise, or (3) market-to-book ratio is below one,
and 0 otherwise. GW = goodwill divided by total assets (Datastream). MtoB = market-to-book ratio of equity (Datastream). Perf = EBITDA divided by lagged total assets
(Datastream). Return = buy and hold return over the fiscal year (Datastream). Sales = percentage change in total sales (Datastream). Size = natural logarithm of market value
of equity (Datastream). Leverage = financial debt minus cash and cash equivalent, divided by market value of equity (Datastream). Risk= 5-year unlevered beta (Datastream).
Constant indicates the average predicted probability of booking an impairment.
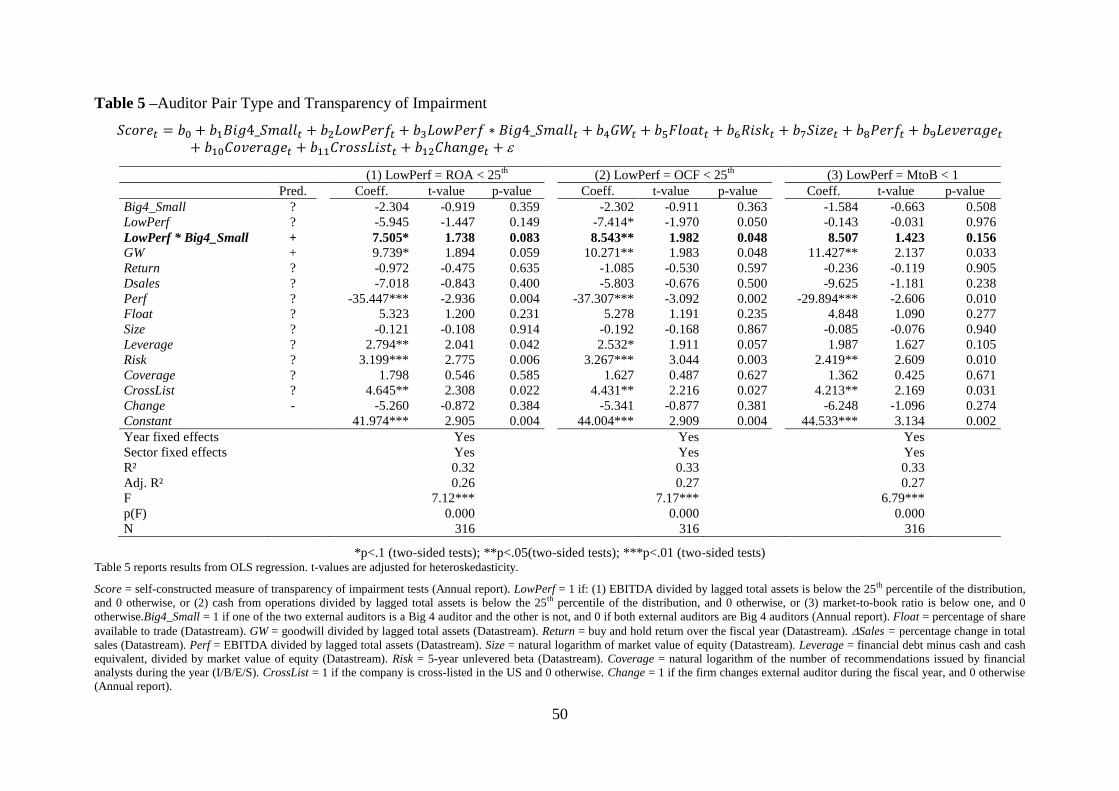
50
Table 5 –Auditor Pair Type and Transparency of Impairment
(1) LowPerf = ROA < 25th
(2) LowPerf = OCF < 25th
(3) LowPerf = MtoB < 1
Pred. Coeff. t-value p-value
Coeff. t-value p-value
Coeff. t-value p-value
Big4_Small ?
-2.304 -0.919 0.359
-2.302 -0.911 0.363
-1.584 -0.663 0.508
LowPerf ?
-5.945 -1.447 0.149
-7.414* -1.970 0.050
-0.143 -0.031 0.976
LowPerf * Big4_Small +
7.505* 1.738 0.083
8.543** 1.982 0.048
8.507 1.423 0.156
GW +
9.739* 1.894 0.059
10.271** 1.983 0.048
11.427** 2.137 0.033
Return ?
-0.972 -0.475 0.635
-1.085 -0.530 0.597
-0.236 -0.119 0.905
Dsales ?
-7.018 -0.843 0.400
-5.803 -0.676 0.500
-9.625 -1.181 0.238
Perf ?
-35.447*** -2.936 0.004
-37.307*** -3.092 0.002
-29.894*** -2.606 0.010
Float ?
5.323 1.200 0.231
5.278 1.191 0.235
4.848 1.090 0.277
Size ?
-0.121 -0.108 0.914
-0.192 -0.168 0.867
-0.085 -0.076 0.940
Leverage ?
2.794** 2.041 0.042
2.532* 1.911 0.057
1.987 1.627 0.105
Risk ?
3.199*** 2.775 0.006
3.267*** 3.044 0.003
2.419** 2.609 0.010
Coverage ?
1.798 0.546 0.585
1.627 0.487 0.627
1.362 0.425 0.671
CrossList ?
4.645** 2.308 0.022
4.431** 2.216 0.027
4.213** 2.169 0.031
Change -
-5.260 -0.872 0.384
-5.341 -0.877 0.381
-6.248 -1.096 0.274
Constant 41.974*** 2.905 0.004
44.004*** 2.909 0.004
44.533*** 3.134 0.002
Year fixed effects
Yes
Yes
Yes
Sector fixed effects
Yes
Yes
Yes
R²
0.32
0.33
0.33
Adj. R²
0.26
0.27
0.27
F
7.12***
7.17***
6.79***
p(F)
0.000
0.000
0.000
N 316 316 316
*p<.1 (two-sided tests); **p<.05(two-sided tests); ***p<.01 (two-sided tests) Table 5 reports results from OLS regression. t-values are adjusted for heteroskedasticity.
Score = self-constructed measure of transparency of impairment tests (Annual report). LowPerf = 1 if: (1) EBITDA divided by lagged total assets is below the 25th percentile of the distribution,
and 0 otherwise, or (2) cash from operations divided by lagged total assets is below the 25th percentile of the distribution, and 0 otherwise, or (3) market-to-book ratio is below one, and 0
otherwise.Big4_Small = 1 if one of the two external auditors is a Big 4 auditor and the other is not, and 0 if both external auditors are Big 4 auditors (Annual report). Float = percentage of share
available to trade (Datastream). GW = goodwill divided by lagged total assets (Datastream). Return = buy and hold return over the fiscal year (Datastream). Sales = percentage change in total
sales (Datastream). Perf = EBITDA divided by lagged total assets (Datastream). Size = natural logarithm of market value of equity (Datastream). Leverage = financial debt minus cash and cash
equivalent, divided by market value of equity (Datastream). Risk = 5-year unlevered beta (Datastream). Coverage = natural logarithm of the number of recommendations issued by financial
analysts during the year (I/B/E/S). CrossList = 1 if the company is cross-listed in the US and 0 otherwise. Change = 1 if the firm changes external auditor during the fiscal year, and 0 otherwise
(Annual report).
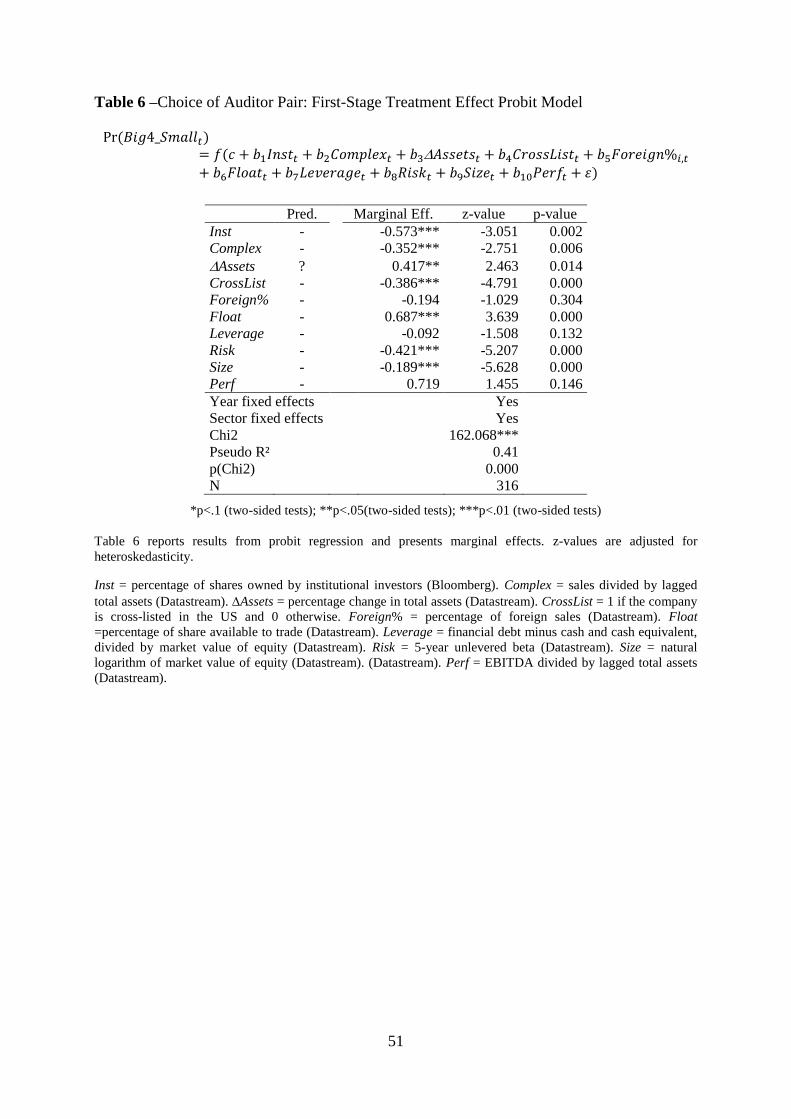
51
Table 6 –Choice of Auditor Pair: First-Stage Treatment Effect Probit Model
Pred. Marginal Eff. z-value p-value Inst -
-0.573*** -3.051 0.002
Complex -
-0.352*** -2.751 0.006 Assets ?
0.417** 2.463 0.014
CrossList -
-0.386*** -4.791 0.000 Foreign% -
-0.194 -1.029 0.304
Float -
0.687*** 3.639 0.000 Leverage -
-0.092 -1.508 0.132
Risk -
-0.421*** -5.207 0.000 Size -
-0.189*** -5.628 0.000
Perf -
0.719 1.455 0.146 Year fixed effects Yes Sector fixed effects
Yes
Chi2
162.068*** Pseudo R²
0.41
p(Chi2)
0.000 N 316
*p<.1 (two-sided tests); **p<.05(two-sided tests); ***p<.01 (two-sided tests)
Table 6 reports results from probit regression and presents marginal effects. z-values are adjusted for
heteroskedasticity.
Inst = percentage of shares owned by institutional investors (Bloomberg). Complex = sales divided by lagged
total assets (Datastream). Assets = percentage change in total assets (Datastream). CrossList = 1 if the company
is cross-listed in the US and 0 otherwise. Foreign% = percentage of foreign sales (Datastream). Float
=percentage of share available to trade (Datastream). Leverage = financial debt minus cash and cash equivalent,
divided by market value of equity (Datastream). Risk = 5-year unlevered beta (Datastream). Size = natural
logarithm of market value of equity (Datastream). (Datastream). Perf = EBITDA divided by lagged total assets
(Datastream).