Embed Size (px)
Citation preview

16
Effect of Magnetic and Mechanical Fields on Phase Liquid Crystalline Transitions in
Solutions of Cellulose Derivatives
S. A. Vshivkov Ural State University
Russia
1. Introduction
Phase diagrams of multicomponent systems provide full information on the thermodynamic
compatibility of components in wide concentration and temperature ranges. One of the first
phase diagrams of polymer–solvent systems was published by Papkov et al., (1937),
Rogovin et al. (1937), Kargin et al. (1939). In 1941, the works of Tager & Kargin (1941)
devoted to the thermodynamics of polymer solutions were published. From the end of the
1940s, systematic research into the thermodynamic properties and construction of phase
diagrams of polymer solutions have been performed at the Laboratory of Colloid Chemistry
(at the Polymer Chair with 1958), Ural State University. Over the course of sixty years, phase
diagrams have been constructed for hundreds of polymer systems with amorphous and
crystalline phase separations. Many of these data were included in textbooks, monographs,
and reviews: Tager (2007), Papkov (1981), Nesterov & Lipatov (1987), Vshivkov (1991),
Chalykh et al. (1998), Malkin & Kulichikhin (1996), Vshivkov et al. (1998), Vshivkov &
Rusinova (1998, 2001), Rusinova & Vshivkov (1997), Klenin (1995). The phase liquid
crystalline transitions of the cellulose derivatives solutions are studied at the polymer chair
of Ural State University last ten years.
Academician Kargin was the first who described the ability of polymers to produce mesophases. In 1941, he wrote “interactions between big molecules is rather strong even when the interaction between individual units is weak. As a result, this can lead to the orientation of big molecules in one common direction”. In 1956 Robinson (1956, 1958) has discovered, that poly(γ-benzyl-L-glutamate) (PBG) can form the liquid crystals in concentrated solutions in chloroform, methylene chloride, trichlorethane, dioxane, m-cresol. Flory (1956) has suggested the phase diagram for a polymer – solvent system with the liquid crystalline transition. At a later date such diagrams were built for the systems: PBG – DMF (Wee & Miller, 1971), polycarbobenzoxyline – DMF (Miller et al., 1974, 1978), poly-p-benzamide – DMA (Papkov et al., 1974), poly-p-benzamide – DMA, LiCl (Iovleva et al., 1976), poly(p-phenyleneterephthalamide) – H2SO4 (Papkov & Kulichikhin, 1977, Andreeva et al., 1981), PBG – ethylene chloride, PBG – benzyl alcohol (Sasaki et al., 1983), poly(p- phenyleneterephthalamide) – H2SO4 – water (Nakajima et al., 1978), PBG – m-cresol (Kiss & Porter, 1977), copolymer on the bases of p-phenylenediamine + terephthalic acid and 4,4”-diphenyldicarboxylic acid) – H2SO4 Lukashova et al. , 1978), PBG – DMF and PBG –
www.intechopen.com

Thermodynamics – Physical Chemistry of Aqueous Systems
408
dicloracetic acid (Konevets et al., 1985), poly(p-benzamide) – DMA – LiCl (Salaris et al., 1976), polyhexylisocyanate and poly(50 % butyl + 50 % p-anisole-3-propyl)isocyanat in tetrachlorethane (Aharoni & Walsh, 1979), copolymer on the bases of p-phenylenterephyhalaamide + benzimidazole) – H2SO4 (Iovleva & Banduryan, 2010). The influence of a magnetic field on the liquid crystal structure was studied by Meuer (1968), de Gennes (1968). The authors have considered such a field distortion of the cholesteric structure and find that the transition to complete nematic order occurs at a critical field strength given by
Hc=
1/2222
0
1
2 m
K
p
(1)
Where p0 is the zero field pitch, Δ┯m , the diamagnetic anisotropy of the liquid crystal, K22 ,
the twist elastic constant. As the field increases the pitch is predicted to oncrease slowly at
first and then diverge logarithmically as the critical field is approached. The theory has been
verified for lyotropic liquid crystals of PBG in a number of different solvents
(Chandrasekhar, 1977, Iizuka, 1973, DuPre & Duke, 1974, 1975, DuPre et al., 1976, 1977, Patel
& DuPre, 1979). Molecules of liquid crystals orient themselves in the magnetic field so that
their long chains are oriented parallel to the magnetic field lines (Miller, 1978). This
orientation is associated with the molecular anisotropy of macromolecules rather than the
existence of permanent magnetic moments.
The LC state in solutions and melts of cellulose derivatives was characterized later on 1970–
1980s (Kulichikhin & Golova, 1985, Meeten & Navard, 1982, Bhadani & Gray, 1983, Navard
& Haudin, 1981, Yunusov et al., 1982, Iovleva, 1989, Vshivkov et al., 2006, 2007, Vshivkov &
Rusinova, 2007, 2008). Molecules of cellulose and cellulose derivatives are characterized by a
rigid helical conformation and, hence, they are capable of ordering and formation of
cholesteric liquid crystals in concentrated solutions. Investigation of the LC state in polymer
solutions is of evident practical importance because, owing to the ability to orient under the
action of external fields, such solutions are used for the preparation of high-modulus fibers.
To control the above processes, the knowledge of phase diagrams for the systems under
processing is crucial. However, data on the phase diagrams of such systems in the applied
magnetic and mechanical fields are not numerous (Vshivkov & Rusinova, 2007, 2008). The
goal of this work is to study phase liquid crystalline transitions of cellulose derivative
solutions in magnetic and in a shear stress fields for the following systems: CEC – DMA,
CEC – DMF, CEC – mixture of trifluoroacetic acid with methylene chloride, HPC – ethanol,
HPC – acetic acid, HPC – DMA, HPC – DMF, HPC –water and poly(γ-benzyl-L-glutamate)
(PBG) – DMF.
2. Results and discussion
2.1 Experimental Cyanoethyl cellulose (CEC) sample with a degree of substitution of 2.6 and Mw= 1.9x10⁵ and hydroxypropyl cellulose (HPC) samples with a degree of substitution of 3.4 and Mw=9.5x10⁴ (HCP-1), 1.4x10⁵ (HPC-2), and 1.15x10⁶ (HPC-3) were used. According to X-ray studies, degree of crystallinity of HPC samples did not exceed 15%. The degree of crystallinity for the CEC samples was 35%. All X-ray measurements were performed on a DRON-13
www.intechopen.com

Effect of Magnetic and Mechanical Fields on Phase Liquid Crystalline Transitions in Solutions of Cellulose Derivatives
409
diffractometer (Cu Kα-irradiation). The CEC and PBG sample with Mη = 2.4× 10⁵ were synthesized at the laboratory of the Institute of Macromolecular Compounds, Russian Academy of Sciences. Dimethylformamide (DMF), dimethylacetamide (DMA), acetic acid (reagent grade), twice-
distilled water, ethanol and a 1 : 1 (by mass) mixture of trifluoroacetic acid with methylene
chloride were used as solvents. The polymer solutions were prepared in sealed ampoules
for several weeks at 298 (water), 340 (in ethanol), 350 K (DMF, DMAA, and TFAA–
methylene chloride mixed solvent).
Phase-transition temperatures Tph were estimated by the cloud-point method. The solution
temperatures were varied at a rate of 12 K/min. The structure of solutions was examined
with the help of an “Olympus BX-51” polarization microscope. A polarization photoelectric
setup was used to determine the type of phase transition in solutions: a sealed ampoule
containing the transparent polymer solution was placed in the gap between the crossed
polaroids and the temperature of the ampoule was decreased. The polarized light of an
LGN-015 He–Ne laser was transmitted through the polaroids in the direction normal to the
ampoule containing the solution. When the solution was transparent (isotropic) the intensity
of the transmitted light was zero. As the system became turbid upon variation in
temperature or increase in the concentration of solution, the transmitted light intensity
increased. This indicated formation of the anisotropic phase, that is, the LC phase transition.
Experiments in the magnetic field were performed using a setup generating a constant
magnetic field with an intensity of up to 15 000 Oe (Fig. 1).
1
23
N S
H
Fig. 1. Schematic presentation of the magnetic facility: ( 1 ) electromagnet tips, ( 2 ) the thermostating jacket and ( 3 ) the ampoule with the test solution. H is the magnetic field vector.
www.intechopen.com

Thermodynamics – Physical Chemistry of Aqueous Systems
410
The sealed ampoule containing a transparent polymer solution was placed between the magnet poles. The magnetic field vector was directed normal to the solution layer (~5 mm thick) in the sealed ampoule. The temperature of solution was varied with the thermostating jacket, and the onset temperature of opalescence development was measured. This temperature was related to the appearance of the LC state. The coefficients of magnetic susceptibility ┯ were determined by means of a vibration magnetometer. The values of ┯ are presented in the table 1. The energy of the magnetic field E stored by the solution volume unit was calculated via equation E=┯H2, where H is the magnetic intensity.
System -┯·107
HPC-1 18,1
CEC 5,3
HPC-1 – Д〈А (ω2=0.5) 6,9
CEC - Д〈А (ω2=0.5) 6,7
HPC-1 – Water (ω2=0.5) 3,4
HPC-1 – С〉3С《《〉 (ω2=0.3) 71,3
PBG 78,8
PBG – DMF (ω2=0.4) 2,3
Table 1. The value of ┯ for the studied systems.
The phase transition temperature under dynamic conditions was measured using two methods: (1) a polymer solution that occurred in the isotropic state at elevated temperatures was placed in a gap between a glass rotor and a stator of the plastoviscometer. The shear rate was set constant, and the working unit was cooled at a rate of 12 K/h. A temperature corresponding to the onset of solution opalescence was taken as the phase transition temperature. (2) a polymer solution was placed in a metallic working unit of the rheometer HAAKE MARS. The shear stress was measured as a function of temperature, and viscosity η was calculated. The temperature corresponding to a sharp change in the run of the η – T curve was taken as the phase transition temperature Tph.
2.2 The HPC, CEC and PBG solutions in organic solvents 2.2.1 Influence of the molecular weight of polymers on the phase liquid crystalline transitions The boundary curves delimiting transparent isotropic and opalescent anisotropic solutions for HPC-1–DMA, HPC-2–DMAA, HPC-1–ethanol, HPC – acetic acid, HPC-2–ethanol, CEC–DMA, CEC–DMF, CEC–(methylene chloride/TFAA) and PBG – DMF systems are determined. Under conventional light, the concentrated solutions of HPC and CEC are opalescent. This is suggests formation of cholesteric liquid crystals. Figures 2 a – c show boundary curves delimiting transparent isotropic and opalescent anisotropic solutions for solutions of the polymers with the different molecular weights. It is seen, that as the molecular mass of the polymer increases, the boundary curve corresponding to the development of anisotropic LC phase in solutions is shifted to lower concentrations. This behavior agrees with the existing theoretical concepts (Flory, 1956). According to Flory, the critical concentration of a polymer, ┮2*, above which the LC order arises, is related to the asymmetry of macromolecules x (the length-to-diameter aspect
ratio) through the following relationship: ┮2* = 8 2(1 )
x x . As the molecular mass of the
polymer increases, the degree of anisometry of macromolecules x increases; as a result, ┮2*
www.intechopen.com

Effect of Magnetic and Mechanical Fields on Phase Liquid Crystalline Transitions in Solutions of Cellulose Derivatives
411
decreases. The boundary curves of the HPC-1 and HPC-2 in acetic acid coincide practically, because the molecular weights of these samples are not too different.
0,40 0,48 0,56
280
320
360
400
T, K
1
2
3III
Fig. 2 a. Boundary curves for the systems: (1) HPC-1 – ethanol, (2) HPC-2 – ethanol, (3) HPC-3 – ethanol. I – isotropic solutions, II – anisotropic solutions.
0,40 0,48 0,56240
270
300
330
T, K
1
2
I
II
Fig. 2 b. Boundary curves for the systems: (1) HPC-1 – DMA, (2) HPC-3 – DMA. I – isotropic solutions, II – anisotropic solutions.
0,28 0,32 0,36 0,40
270
300
330
360
T, K
12
I
II
Fig. 2 c. Boundary curves for the systems: (1) HPC-1 – acetic acid, (2) HPC-2 – acetic acid. I – isotropic solutions, II – anisotropic solutions.
www.intechopen.com

Thermodynamics – Physical Chemistry of Aqueous Systems
412
2.2.2 Influence of the solvent nature on the phase liquid crystalline transitions Figures 2 d – 2 g show the boundary curves for the polymer solutions in the different solvents. It is seen from these figures and from the table 2, that as the solvent polarity is increased (solvent dipole moment µ is increased), the LC phase appears at higher concentrations and lower temperatures since with an increase in polarity, a solvent ruptures bonds between macromolecules to a higher extent. It is seen, that DMA and DMF are the best solvents of the cellulose derivatives. The cellulose and cellulose derivative molecules may form the hydrogen bonds between the chains. So the good solvent has to be also an electron donor. This ability is determined by the ionization potential ┮. As ┮ is decreased, ω2* is increased, that is such solvent is better.
Solvent µ dipole
moment, D [61]
┮-ionization potential,
eV [62]
ω2* (mass fraction) Т=298 К
HPC-1 HPC-2 HPC-3 CEC DMA 3,86 ≤9,65 0,45 0,43 0,42 DMF 3,81 ≤10,16 0,42
ethanol 1,69 10,25 0,44 0,38 <0,36 acetic acid 1,74 10,35 0,3 0,305
water 1,84 12,59 0,25 0,25 0,195
Table 2. Physical parameters of the solvents and critical polymer concentration ω2*, above which the LC order arises. T = 298 K.
0,32 0,40 0,48 0,56240
260
280
300
320
340
360
T, K
I
II
1 23
Fig. 2 d. Boundary curves for the HPC-1 solutions in (1) acetic acid, (2) ethanol, (3) DMA. I – isotropic solutions, II – anisotropic solutions.
0,3 0,4 0,5 0,6
280
320
360
400
T , K
1
2I
II
Fig. 2 e. Boundary curves for the HPC-2 solutions in (1) acetic acid, (2) ethanol. I – isotropic solutions, II – anisotropic solutions.
www.intechopen.com

Effect of Magnetic and Mechanical Fields on Phase Liquid Crystalline Transitions in Solutions of Cellulose Derivatives
413
0,40 0,48 0,56
280
300
320
340
360
T, K
1
2
I
II
Fig. 2 f. Boundary curves for the HPC-3 solutions in: (1) ethanol, (2) DMA. I – isotropic solutions, II – anisotropic solutions.
0,2 0,3 0,4 0,5240
280
320
360
T, K
12 3
I
II
Fig. 2 g. Boundary curves for the CEC solutions in: (1) mixture of trifluoroacetic acid with methylene chloride (1 : 1), (2 ▲) DMF, (3 ▼) DMA. I – isotropic solutions, II – anisotropic solutions.
2.2.3 Influence of the shear stress field on the liquid crystalline phase transitions Figures 3 a, b, c show the temperature dependences of viscosity for the solutions under study. The above dependences are described by curves with well-pronounced sharp maxima. This behavior is typical of the solutions with LC transitions (Kulichikhin & Golova, 1985, Vshivkov & Rusinova, 2008, Gray, 1962). According to Gray (1962), this profile of the temperature dependences of viscosity corresponds to the (isotropic liquid)–(nematic liquid crystal) phase transition. Therefore, upon cooling of HPC, CEC and PBG solutions under deformation conditions, no cholesteric crystals are formed: in other words, under dynamic conditions, a liquid crystal changes its type from cholesteric to nematic. The results obtained are in good agreement with the data of other authors (Volkova et al., 1986), who showed that the shear deformation of CEC solutions (c= 30%) in trifluoroacetic acid and a 2 : 1
www.intechopen.com

Thermodynamics – Physical Chemistry of Aqueous Systems
414
TFAA–methylene chloride mixture results in the formation of similar textures that indicated the formation of an XRD-detectable nematic liquid crystal. Thus, the deformation of CES solutions leads to the change of an LC type from cholesteric to nematic. When the deformed solutions were studied by the method of polarization microscopy, the development of striped textures was observed (fig. 4). This fact is indicative of the formation of the domain supramolecular structure (Papkov & Kulichikhin, 1977, Aharoni & Walsh, 1979). Since, compared to cholesteric liquid crystals, nematic liquid crystals exist at higher temperatures, the temperature–concentration region corresponding to the existence of anisotropic solutions under the mechanical field should change.
Fig. 3 a. Temperature dependences of viscosity for solutions (1, 3) HPC-3–DMA and (2) PBG–DMF (2); C = 42.9 (1), 19.4 (2), 44.5 % (3). Shear rate γ = 8 s–1.
Fig. 3 b. Temperature dependences of viscosity for solutions: HPC-3– ethanol; c = (1) 36 and (2) 42.1%; Shear rate γ = 8 s–1.
www.intechopen.com

Effect of Magnetic and Mechanical Fields on Phase Liquid Crystalline Transitions in Solutions of Cellulose Derivatives
415
Fig. 3 c. Temperature dependences of viscosity for solutions: HPC-1–DMF: c = (1) 50 and (2) 54.9%. Shear rate γ = 8 s–1.
Fig. 4. Mocrograph of the CEC solution in DMA с=51.2 % after deformation. γ=60 s-1. х120.
www.intechopen.com

Thermodynamics – Physical Chemistry of Aqueous Systems
416
The phase transitions in the CEC–DMF and CEC–DMAA systems under static conditions and in a shear field are studied. The mechanical field leads to an extension of the temperature – concentration region of the existence of the LC phase (fig. 5), a phenomenon that is due to the change of orientation of CEC macromolecules in solutions.
Fig. 5 a. Boundary curves of CEC – DMF system. γ: (1) 0, (2) 12 and ( 3 ) 60 s –1.
Fig. 5 b. Boundary curves of CEC – DMА system . γ=0 (1) и 12 s-1 (2).
The dependence of ΔT (ΔT is the difference of phase transition temperatures under dynamic
and static conditions) on the shear rate is described by a curve with a maximum (fig. 6). The
same behavior was reported for some polymer–solvent and polymer–polymer systems with
crystalline phase separation (Vshivkov et al., 1998, Vshivkov & Rusinova, 2001).
www.intechopen.com

Effect of Magnetic and Mechanical Fields on Phase Liquid Crystalline Transitions in Solutions of Cellulose Derivatives
417
ñ-1
0 50 100 150 200 250
Ò
0
10
20
30
12 3
45
6
7
8
9
10
Fig. 6 a. ∆T vs. shear rate for the following solutions: HPC-2 – DMA (1 – 3), CEC – DMF (4, 6, 7), HPC-1 – DMA (5, 8, 9), PE (M=2.3x10⁵) – p-xylene (10). c = 48.9 (1), 44.6 (2), 40.8 (3), 43.0 (4), 50.0 (5), 41.0 (6), 38.0 (7), 45.0 (8) and 40.0 % (9, 10).
ñ-1
0 20 40 60
Ò, K
0
4
8
12
16
20
3
4
5
1
2
Fig. 6 b. ∆T vs. shear rate for the following solutions: (1, 2) CEC in DMA and (3–5) DMF; c = (1) 42.9, (2) 51.2, (3) 43.0, (4) 41.0, and (5) 38.0%.
This pattern of the curve was associated with two opposite processes in the system, namely,
the orientation of macromolecules along the flow direction, which is favorable for phase
transition, and the destruction of nuclei of the new phase by a mechanical field, a process
that retards the formation of the LC phase. In the examined range of shear rates, the
orientation processes dominate, thereby resulting in the elevation of the formation
temperature (relative to static conditions) of the LC phase. as manifested in the elevation of
the LC phase transition temperature. For comparison, Fig. 6 a shows the data for the PE – p-
s-1
s-1
ΔT, K
ΔT
www.intechopen.com

Thermodynamics – Physical Chemistry of Aqueous Systems
418
xylene system with crystalline phase separation (Vshivkov et al., 1998). As follows from fig.
6 a , the orientational processes (increase in ∆T) during the LC transition are observed at
lower shear rate (by approximately an order of magnitude).
2.2.4 Influence of the magnetic field on the liquid crystalline phase transitions Application of the magnetic field raises the temperature of LC phase formation Tph in HPC, CEC and PBG solutions; that is, it widens the temperature–concentration region of the existence of anisotropic solutions. Molecules of liquid crystals orient themselves in the magnetic field so that their long chains are oriented parallel to the magnetic field lines [46]. According to published data (Meuer (1968), de Gennes (1968), Chandrasekhar, 1977, DuPre & Duke, 1974, 1975, DuPre et al., 1976, 1977, Patel & DuPre, 1979), the cholesteric liquid crystal–nematic liquid crystal phase transition occurs in magnetic field. From a certain critical intensity, magnetic field causes untwisting of the cholesteric helix. Eventually, nematic liquid crystals are formed which occur at higher temperatures than cholesteric liquid crystals. Polarization microscopy studies revealed a striped texture of HPC and CEC solutions treated in magnetic field (fig. 7), thus suggesting formation of large supramolecular structures—domains. A similar phenomenon was reported for other polymer–solvent systems (Papkov & Kulichikhin, 1977).
Fig. 7. Micrograph of the HPC-1 solution in DMA. с=52.0 %. х120. 〉=9 kOe.
It was discovered that after the magnetic field was switched off, an increased Tph was preserved in solutions for many hours. This is clearly seen from fig. 8, which demonstrates the time dependence of the time dependences of ΔT (ΔT is the difference in LC phase transition temperatures in the presence and absence of magnetic field) are determined. This fact provides evidence that structures induced by the magnetic field are preserved in solutions. Thus, the systems under study possess memory.
www.intechopen.com

Effect of Magnetic and Mechanical Fields on Phase Liquid Crystalline Transitions in Solutions of Cellulose Derivatives
419
t, ÷0 20 40
Ò, Ê
0
4
8
12
1 23
Fig. 8 a. Time dependence of ∆T for solutions: HCP-3 in DMAA (c = 51.3%) at (1) 370, (2) CEC in DMAA (c = 48.3%) at (2) 370 and (3) 298 K treated with magnetic field with intensity H = 7 kOe.
Fig. 8 b. Time dependence of Tph for solution CEC in DMF (c = 48.3 %) at (1) 370 and (2) 298 K treated with magnetic field with intensity H = 7 kOe.
On the basis of the above data, the times of relaxation τ were calculated for the nematic liquid crystal – cholesteric liquid crystal reverse transition in solutions after switching off
ΔT,E
t, h
t, h
www.intechopen.com

Thermodynamics – Physical Chemistry of Aqueous Systems
420
the magnetic field. Calculations were performed according to the common exponential equation. The values of τ were found to be 18 h (HPC-3–DMAA); τ1= 11 h at 298 K and τ2= 8 h at 370 K (CEC–DMAA). The calculation results made it possible to estimate the order of the enthalpy of activation ΔH* for the nematic liquid crystal–cholesteric liquid crystal transition in solutions after switching off the magnetic field. The value of ΔH* is estimated via the equation ln(τ1/τ2) = (ΔH*/R)(1/T1– 1/T2) as ~ 4 kJ/mol, in qualitative agreement with rather low enthalpies of LC phase transitions (Chandrasekhar, 1977, Plate, 1988). Figures 9 a – 9 c show the boundary curves measured for the HPC-3-DMAA, HPC-1 – ethanol and CEC–DMAA systems at various magnetic field intensities H.
Fig. 9 a. Boundary curves for the HPC-3–DMAA system. H = (1) 0, (2) 3, (3) 5, and (4) 9 kOe.
305
315
325
335
0,43 0,44 0,45 0,46 0,47 0,48 0,49
ω2
T, K
1
2
3
4
Fig. 9 b. Boundary curves for the CEC – DMAA system. H = (1) 0, (2) 3, (3) 5, and (4) 9 kOe.
www.intechopen.com
Effect of Magnetic and Mechanical Fields on Phase Liquid Crystalline Transitions in Solutions of Cellulose Derivatives
421
0,44 0,45 0,46 0,47 0,48
300
320
340
360
2
T, K
1
2
3
Fig. 9 c. Boundary curves for the HPC-1 – ethanol for system. H = (1) 0, (2) 3, (3) 5 kOe.
0 2 4 6 8 100
2
4
6
8
10
H, кЭ
TK
1
2
3
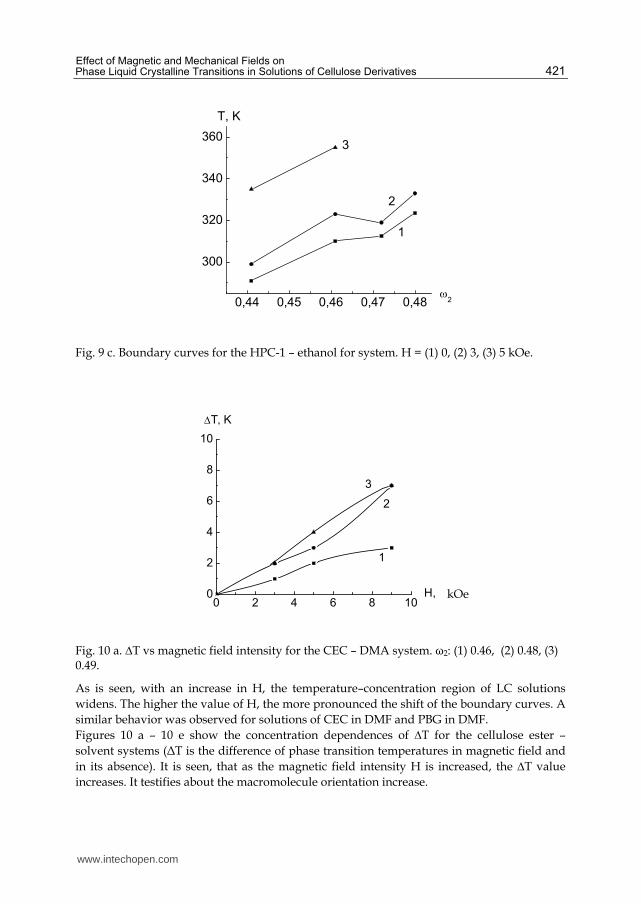
Fig. 10 a. ∆T vs magnetic field intensity for the CEC – DMA system. ω2: (1) 0.46, (2) 0.48, (3) 0.49.
As is seen, with an increase in H, the temperature–concentration region of LC solutions
widens. The higher the value of H, the more pronounced the shift of the boundary curves. A
similar behavior was observed for solutions of CEC in DMF and PBG in DMF.
Figures 10 a – 10 e show the concentration dependences of ∆T for the cellulose ester –
solvent systems (ΔT is the difference of phase transition temperatures in magnetic field and
in its absence). It is seen, that as the magnetic field intensity H is increased, the ∆T value
increases. It testifies about the macromolecule orientation increase.
kOe
www.intechopen.com

Thermodynamics – Physical Chemistry of Aqueous Systems
422
0 2 4 6 8 100
2
4
Н, кЭ
T, K
1
2
3
Fig. 10 b. ∆T vs magnetic field intensity for the CEC – DMF system. ω2: (1) 0.47, (2) 0.49, (3) 0.50.
0 2 4 6 8 100
2
4
6
8
10
12
Н, кЭ
T
1
2
3
4
Fig. 10 c. ∆T vs magnetic field intensity for the HPC-3 – DMA system. ω2: (1) 0.46, (2) 0.48, (3) 0.50, (4) 0.51.
0 2 4 6 8 100
10
20
30
40
H, кЭ
T, K
1
2
3
Fig. 10 d. ∆T vs magnetic field intensity for the HPC-1 – DMA system. ω2: (1) 0.49, (2) 0.52, (3) 0.55.
kOe
kOe
kOe
www.intechopen.com

Effect of Magnetic and Mechanical Fields on Phase Liquid Crystalline Transitions in Solutions of Cellulose Derivatives
423
Fig. 10 e. ∆T vs magnetic field intensity for the HPC-1 – ethanol system. ω2: (1) 0.44, (2) 0.46, (3) 0.47, (4) 0.48.
2.3 HPC solutions in water Aqueous solutions of HPC belong to systems with strong electron-donor (hydrogen) bonds (Belousov & Panov, 1983). Because of the presence of two mobile protons and two unshared electron pairs at the oxygen atom, a water molecule may function both as an electron donor and an electron acceptor and form four hydrogen bonds with an energy of 20 kJ/mol. Therefore, a loose structure with a large free volume is formed in water. In the case of water, the fraction of nonspecific interaction is as low as 7%. Intermolecular interactions of HPC with water may be determined by both the hydrophilic hydration giving rise to hydrogen bonding between a polymer and a solvent and the hydrophobic hydration of water, which consists in densification of water structure around nonpolar methyl and methylene groups of HPC molecules during formation of solutions. Many studies were devoted to phase equilibrium in the HPC–water system, and the LCST values were reported in a number of papers (Vshivkov et al., 2007, Fischer et al., 1995, Kagemoto et al., 1970, Nystrom & Bergman, 1978, Werbowyi & Gray, 1976, 1979, 1980, Nishio et al., 2002, Fortin & Charlet, 1989, Ryotarou & Yoshiyuki, 2003, Guido, 1995, Furusawa & Tagawa, 1985, Suto et al., 1989, Lu & Schwartz, 2002, Bergman & Sundelof, 1977). Figure 11 a displays the phase diagram measured for the HPC-1–water system. This diagram is largely consistent with the phase diagrams described for this system. Four regions can be distinguished in the diagram: (I) the region of isotropic transparent solutions; (II) the region of anisotropic transparent solutions; (III) the region of heat-induced phase separation giving rise to formation of a white anisotropic precipitate; and (IV) the region of anisotropic solutions opalescent over the entire volume (the colorless solutions are observed, which is typical of cholesterol LC solutions. (1* refers to colorless solutions and 2* refers to blue solutions, which is typical of cholesterol LC solutions (Kapustin, 1978). According to Fisher et al. (1995), the crystal solvates are formed in solutions at an HPC concentration of ~ 80 % or above. The boundary curve 1 that characterized the heated induced phase transition has a binodal shape. It appears that the breakdown of hydrophilic and hydrophobic hydration of HPC initially leads to the amorphous phase separation of solutions and formation of two coexistent dilute and concentrated phases (the LCST is 298 K). Simultaneously, anisotropic crystal solvates precipitate in the concentrated phase.
www.intechopen.com

Thermodynamics – Physical Chemistry of Aqueous Systems
424
Fig. 11 a. Phase diagram for the HPC-1–water system. Shear rate γ = 0 (1) and 12 s-1 (2). See text for explanations.
0 ,0 0 ,2 0 ,4 0 ,6 0 ,8 1 ,0
T , Ê
2 6 0
2 8 0
3 0 0
3 2 01
23
2
3
II
III
I
IV
V
11 '
2 ' 3 '
Fig. 11 b. Boundary curves for the HPC-2–water system at γ = (1) 0, (2) 12, and (3) 60 s–1. Color of the solutions: (1') red, (2') green, (3') violet. Comments are given in text.
Figures 11 b and 12 show the phase diagrams for the HPC-2–water and HPC-3–water systems measured under static conditions and in the shear field. The phase diagram of the HPC-2 – water system virtually coincides with that of the HPC-1–water system, since a difference in the molecular masses of these samples is insignificant; the LCST is 298 K. The diagram comprises the regions similar to those characteristic of the HPC-1–water system.
www.intechopen.com

Effect of Magnetic and Mechanical Fields on Phase Liquid Crystalline Transitions in Solutions of Cellulose Derivatives
425
The distinctive feature is a change in the color of solutions with the weight fraction of the polymer ω2 > 0.45. The observed color transition from red to violet through green may be related to a reduction in the cholesteric helix pitch with an increase in the polymer concentration in solutions. Also note that, in contrast to HPC-1 solutions, in the case HPC-2 solutions, the curve delimiting regions II and IV shifts toward lower polymer concentrations at low temperatures. The molecular mass of the HPC-3 sample is almost an order of magnitude higher than that of the HPC-1 and HPC-2 samples, therefore we failed to prepare HPC-3 solutions in a wide concentration range because of its poor solubility. Three regions may be distinguished in the phase diagram: (I) the region of isotropic solutions; (II) the region of transparent anisotropic solutions; and (III) the region, where heating causes phase separation accompanied by formation of the while anisotropic precipitate. A comparison of the phase diagrams indicates that an increase in the molecular mass of the polymer leads to a shift in the boundary curve reflecting the formation of anisotropic LC solutions to lower concentrations. This fact is consistent with the current theoretical concepts [20].
Fig. 12. Boundary curves for the HPC-3–water system at γ = (1) 0 and (2) 12 s–1. Comments are given in text.
2.3.1 Influence of the shear stress field on the liquid crystalline phase transitions The deformation of these systems increases the temperatures of heat-induced separation and decreases the temperatures of transition from region II to region III. As the shear rate is increased, the absolute value of ΔT increases for both transitions and achieves 7 K (ΔT is a difference between phase transition temperatures under dynamic and static conditions). This phenomenon may be explained by the breakdown of nuclei of a new phase under the action of the mechanic field, as was observed for a number of polymer – solvent systems characterized by amorphous and crystalline phase separation (Vshivkov et al., 1998, Vshivkov & Rusinova, 2001).
www.intechopen.com

Thermodynamics – Physical Chemistry of Aqueous Systems
426
2.3.2 Influence of the magnetic field on the liquid crystalline phase transitions Application of magnetic field causes an increase in the phase transition temperature under heating, which is likely associated with a change in the orientation of macromolecules in solution (fig. 13).
Ñ, ì àñ.%
0 20 40 60 80
Òô , Ê
296
300
304
308
312
316
1
2
3
Fig. 13. Boundary curves for the HPC-1–water system. H = (1) 0, (2) 5, and (3) 9 kOe.
t, ÷
0 200 400 600
Ò, Ê
0
2
4
6
8
1
2
Fig. 14. Time dependence of ∆T for HPC-1 solutions in water. c = (1) 53.5 and (2) 49.6%. H= 5 Oe.
Like the HPC and CEC solutions in organic solvents, the HPC – water system possesses memory: an increased Tph is preserved for many hours after the magnetic field is switched off (fig. 14). The calculated time of relaxation necessary to achieve the initial orientation of macromolecules is τ = 260 h (c = 53.5%) and 103 h (c = 49.6%). With an increase in the concentration of the polymer, the time of relaxation grows, since the viscosity of the system increases.
3. Conclusion
Phase diagrams have been constructed for the cellulose ester – water systems under static conditions, in the shear stress and magnetic fields. As the molecular mass of the polymer is
ΔT, K
T, K
C, %
t, h
www.intechopen.com

Effect of Magnetic and Mechanical Fields on Phase Liquid Crystalline Transitions in Solutions of Cellulose Derivatives
427
increased, the curves delimiting isotropic and anisotropic solutions shift to lower concentrations. The deformation causes the formation of domain structure, the changes in the type of the liquid crystal, and in the phase transition temperatures of solutions both upon heating and cooling. As the molecular mass of the polymer increases, the ability of macromolecules to orient under the shear stress field decreases. The concentration and dependence ΔT is described by the curve with maxima. The formation of domains in solutions was observed under the shear stress field. The magnetic field also widens the temperature–concentration region of the existence of the LC phase. This effect is related to the cholesteric liquid crystal – nematic liquid crystal phase transition and the orientation of macromolecules in the direction parallel to the magnetic field lines. In this case, large supramolecular structures (domains) develop in solutions. The effect of magnetic field on the variation in LC transitions with the polymer concentration in solution shows an extremal pattern. Figures 15 and 16 demonstrate the concentration dependences of ∆T for HPC1– DMAA, HPC-3–DMAA, and HPC-1–water systems measured at various magnetic field intensities.
Ñ, ì àñ.%
48 52 56
Ò, Ê
0
10
20
30
40
1
4
3
2
Fig. 15. Concentration dependence of ∆T for solutions of (1, 2) HPC-3 and (3, 4) HPC-1 in DMAA. H =(1, 3) 5 and (2, 4) 9 kOe.
Ñ, ì àñ.%
0 20 40 60 80
Ò, Ê
0
2
4
6
8
12
3
Fig. 16. Concentration dependence of ∆T for HPC-1 solutions in water. H = (1) 5, (2) 9, and (3) 13 kOe.
ΔT, K
ΔT, K
C, %
C, %
www.intechopen.com

Thermodynamics – Physical Chemistry of Aqueous Systems
428
In analyzing the effect of the polymer concentration on magnetic field-induced changes in
phase transition temperatures, two factors should be taken into account. First, as
concentration increases, the number of macromolecules capable of orientation in the
magnetic field grows; as a consequence, Tph should increase. Second, a rise in the polymer
concentration in solution facilitates densification of the fluctuation network of
entanglements. This impedes the occurrence of orientation processes and weakens the effect
of the magnetic field. On the whole, the concentration dependence of ΔT is apparently
described by a curve with a maximum.
It should be noted that for solutions of an HPC-1 sample with a lower molecular mass, the
value of ΔT is much higher. This observation indicates a more distinct orientation of smaller
molecules in the magnetic field, in agreement with the data from (Kol”tsov et al., 1995).
Figures 17 and 18 plot ∆T as a function of lnE for HPC-1–DMAA, HPC-3–DMAA, and CEC – DMAA systems. It is seen that these dependences are described by straight lines. The analogous dependence is determined for the PBG – DMF system. With an increase in the magnetic field energy stored by solutions, the value of ΔT increases. The effect of field on the phase transitions shows a threshold character: a change in Tph begins from a certain critical intensity of the field Hcr. These values are 2.3 and 2.0 kOe for the HPC – DMAA and CEC –DMAA systems, respectively, and 2.3 kOe for the PBG – DMF system. In order of magnitude, these values are consistent with Hcr necessary for the nematic liquid crystal - cholesteric liquid crystal phase transition (Papkov & Kulichikhin, 1977, Chandrasekhar, 1980). In this case, ∆T = Kln(E/E0) or Tph (H > Hcr) = Tph(H = 0) + Kln(E/E0). Coefficient K depends on the molecular mass of the polymer and its concentration in solution.
Fig. 17. Plot of ∆T vs. lnE for solutions of (1–4) HPC-3 and (5, 6) HPC-1 in DMAA c = (1) 46.1, (2) 48.3, (3) 49.6, (4) 51.3, (5) 52.0, and (6) 49.0%.
-1 0 1 20
5
10
15
20
25
30
35
40
T, K
lnE, (Дж/м3)
1
23
4
5
6
www.intechopen.com

Effect of Magnetic and Mechanical Fields on Phase Liquid Crystalline Transitions in Solutions of Cellulose Derivatives
429
Fig. 18. Plot of ∆T vs. lnE for CEC solutions in DMAA. c = (1) 46.0 and (2) 48.8%.
Thus it is revealed a perfect analogy in influence magnetic and mechanical fields in their influence on phase liquid crystal transitions in solutions of rigid chain polymers.
4. Chart of symbols
- PBG – poly(γ-benzyl-L-glutamate, DMF – dimethylformamide, DMA – dimethylacetamide, Hc – a critical field strength,
- p0 – zero field pitch, Δ┯m – diamagnetic anisotropy of the liquid crystal, K22 – the twist elastic constant, LC – liquid – crystalline, CEC – cyanoethyl cellulose, HPC – hydroxypropyl cellulose, Tph – phase-transition temperature, Χ – coefficients of magnetic susceptibility, H – magnetic intensity, E – energy of the magnetic field stored by the solution volume unit, η – viscosity , ┮2* – critical concentration of a polymer, , above which the LC order arises,
- x – asymmetry of macromolecules, ┮ – ionization potential, ΔT – the difference of phase transition temperatures under dynamic and static conditions , γ – shear rate, ΔT – the difference in LC phase transition temperatures in the presence and absence of magnetic field, τ – times of relaxation, ΔH* – enthalpy of activation for the nematic liquid crystal–cholesteric liquid crystal transition, ω2 – mass portion of polymer,
5. Acknowledgment
This work was supported by the Ministry of Education and Science of the Russian Federation (project no. AVTsP 2.1.1/1535 “Development of the Scientific Potential of the Higher School”) and by Federal Agency of Russian Federation (project no. NK-43 P(4), Federal Program “Scientific and Scientific – Pedagogic Personnel of Russia).
-1 0 1 20
1
2
3
4
5
6
7
T, K
lnE, (Дж/м3)
2
1
www.intechopen.com

Thermodynamics – Physical Chemistry of Aqueous Systems
430
6. References
Aharoni, Sh.M. & Walsh, E.K. (1979). Rigid backbone polymers. III. Partitioning of isocyanate polymers between isotropic and anisotropic phases. J. Polym. Sci. Polym. Lett. Ed., Vol. 17, pp. 321-327.
Andreeva, V. M., Konevets, V. I. & Tager, A. A. (1981). Research of the lightscattering of poly(p-phenilene-terephtalamide) solutions at the transition to a liquid crystal condition. Vysokomol. Soedin., B, Vol. 23, No. 7 , pp. 538-541.
Belousov, V. P. & Panov, M. Yu. (1983). Thermodynamics of Nonelectrolyte Aqueous Solutions. Khimiya, Leningrad. [in Russian].
Bergman, R. & Sundelof, Z.O. (1977). Diffusion transport and thermodynamic properties in concentrated water solutions of hydroxypropyl cellulose at temperatures up to phase separation. Eur. Polym. J., Vol. 13, No. 6, pp. 881-889.
Bhadani, S.N. & Gray, D.G. (1983). Cellulose-based liquid crystalline polymers; esters of (hydroxypropyl) cellulose. Mol. Cryst. Liquid Cryst., Vol. 99, No. 1, pp. 29-38.
Chalykh, A. E., Gerasimov, V. K. & Mikhailov, Yu. M. (1998). Phase Diagrams of Polymer Systems. Yanus-K, Moscow. [in Russian].
Chandrasekhar, S. (1977). Liquid crystals. Cambridge Univ. Press, London, Mir, Moscow. Chiba, R. & Nishio, Y. Electrooptical behavior of liquid-crystalline (hydroxypropyl) cellulose
/ inorganic salt aqueous solutions. Macromolecules. Vol. 36, No. 5, pp. 1706-1712. DuPre, D.B. & Duke, R.W. (1975). Temperature, concentration, and molecular weight
dependence of the twist elastic constant of cholesteric poly-γ-benzyl-L-glutamate. J. Chem Phys., Vol. 63, No. 1., pp. 143-148.
Duke, R.W., DuPre, D.B., Hines, W.A. & Samulski, E.T. (1976). Poly(γ-benzyl L-glutamate) helix-coil transition. Pretransition phenomena in the liquid crystal phase. J. Am. Chem. Soc., Vol. 98, No. 10, pp. 3094-3101 .
DuPre, D.B., Duke, R.W., Hines, W.A. & Samulski, E.T. (1977). The Effect of trifluoroacetic acid on the viscoelastic properties of a polypeptide liquid crystal. Mol. Cryst. Liq. Cryst., Vol. 40, No.2, pp. 247-259.
Fischer, H., Murray, M., Keller, A. & Odell, J. A. (1995). On the phase diagram of the system hydroxypropylcellulose-water. J. Mater. Sci., Vol. 30, No. 18, pp.4623-4627.
Flory, P. J. (1956). Phase Equilibria in Solutions of Rod-Like Particles. Proc. R. Soc. Lond., A, V. 234, No. 1, pp. 73-89.
Fortin, S. & Charlet, G. (1989). Phase diagram of aqueous solutions of (hydroxypropyl) cellulose. Macromolecules, Vol. 22, No. 5, pp. 2286-2292.
Furusawa, K. & Tagawa, T. (1985). Adsorption behavior of water-soluble polymer with lower critical solution temperature. Colloid Polym. Sci., Vol. 263, No. 5, pp. 353-360.
de Gennes, P.G. (1968). Calcul de la distorsion d”une structure cholesterique par un champ magnetique. Solid State Comm. Vol. 6, No. 3, pp. 163-165.
63. Gray, G. W. (1962) in Molecular Structure and the Properties of Liquid Crystals. Academic, New York,), p. 92.
Guido, S. (1995). Phase behavior of aqueous solutions of hydroxypropyl cellulose. Macromolecules, Vol. 28, No. 13, pp. 4530-4539.
Iizuka, E. (1973).The effect of magnetic fields on the structure of cholesteric liquid crystals of polypeptides. Polymer J. Vol. 4, No. 4, pp. 401-408.
www.intechopen.com

Effect of Magnetic and Mechanical Fields on Phase Liquid Crystalline Transitions in Solutions of Cellulose Derivatives
431
Iovleva, M.M., Papkov, S.P., Milkova, L.P., Kalmykova, V.D., Volokhina, A.V.& Kudryavtsev, G.I. (1976). Temperature-concentration boundaries of a liquid crystal state of poly (p-benzamide). Vysokomol. Soedin., Ser. B. V. 18, No.11, pp. 830- 832.
Iovleva, M.M. (1989). The schematic phase diagram for the cellulose – monohydrate methylmorpholene-N-oxide system. Vysokomol. Soedin., Ser. A. Vol. 31, No.4, pp. 808- 812.
Iovleva, M.M., Banduryan, S.I. (2010).Phase equilibria in polymer-solution systems: development in the field of fibres. Vysokomol. Soedin., Vol. 52, No.11, pp. 2033- 2037.
Kapustin, A. P. Experimental Methods for Investigation of Liquid Crystals. Nauka, Moscow, 1978). [in Russian].
Kargin, V. A., Papkov, S. P. & Rogovin, Z. A. (1939). About solubility of high-molecular compounds. Zh. Fiz. Khim., Vol. 13, No. 2, pp. 206-210.
Kiss, G. & Porter, R.S. (1977). Rheology of the concentrated solutions of poly-γ-benzyl-L-glutamate. Am. Chem. Soc. Polym. Prepr., Vol. 18, No.1, pp. 185-186 .
Klenin, V. I. Thermodynamics of Systems with Flexible Chain Polymers. Saratov. Gos. Univ., Saratov, 1995). [in Russian].
Kol’tsov, A. I., Kapralov, V. M., Rot, Kh., Hachaturov, A.S., & Shabsels, B.M. (1995).Orientation of solutions of poly-γ-benzyl-L-glutamate fractions of various molecular weight in a magnetic field according to a deuteron magnetic resonance data. Polymer Science, B, Vol. 37, No.10, pp. 500-502.
Konevets, V. I., Andreeva, V. M., Tager, A. A., Ershova, I.A. & Kolesnikova E.N. (1985). Studying of the moderate-concentrated solution structure of some polyamides in the composition region, preceding the liquid crystal formation. Vysokomol. Soedin., Ser. A. Vol. 27, No.5 , pp. 959- 967.
Kulichikhin, V. G. & Golova, L. K. (1985). Liquid – crystalline state of cellulose and cellulose derivatives. Khim. Drev., No. 3, pp. 9-27.
Lu, X., Hu, Z. & Schwartz, J. (2002). Phase transition behavior of hydroxypropylcellulose under interpolymer complexation with poly(acrylic acid). Macromolecules, Vol. 35, No. 7, pp. 9164-9168.
Lukashova, I.N., Volokhina, A.V. & Papkov, S. P. (1978). Phase transformations and viscosity properties of aromatic соpolyаmide solutions. Vysokomol. Soedin., Ser. B. Vol. 20, No.2, pp. 151-154.
Malkin, A. Ya. & Kulichikhin, S. G. (1996). Phase transitions in the polymer systems, caused by action of mechanical fields. Polymer Science, B, Vol. 38, No. 2, pp.362-374.
Meeten, G.H. & Navard, P. (1982). The cholesteric nature of cellulose triacetate solutions. Polymer, Vol. 23, No. 12, pp. 1727-1731.
Meuer, R.B. (1968). Distortion of a cholesteric structure by a magnetic field. Appl. Phys. Lett., Vol. 14, No. 3, pp. 208-212..
Miller, W.G., Wu, C.C., Wee, E.L., Santee, G.L. & Rai, J.H. ed K.D. Goebel. (1974). Thermodynamics and dynamics of polypeptide liquid crystals. Pure Appl. Chem., Vol. 38, No. 1., pp. 37- 58.
Miller, W.G., Kou, L., Tohyama, K. & Voltaggio, V. (1978).Kinetic aspects of the formation of the ordered phase in stiff-chain helical polyamide acids. J. Polym. Sci. Polym. Symp. Vol. 65, pp. 91-106.
Miller, W.G. (1978). Stiff chain polymer lyotropic liquid crystals. Ann. Rev. Phys.Chem. Vol. 29, pp. 519- 535.
www.intechopen.com

Thermodynamics – Physical Chemistry of Aqueous Systems
432
Nakajima, A., Hirai, T. & Hayashi, T. (1978). Phase relationship of rodlike polymer, poly(p-phenyleneterephthalamide), in sulfuric acid-water system. Polymer Bulletin, Vol. 1, No. 2, pp. 143-147.
Navard, P., Haudin, I.M. & Dayan, D.G. (1981). Cholesteric liquid crystalline phases based on (acetoxypropyl)cellulose. Macromolecules. Vol. 14, No. 6, pp. 715-719. (1981).
Nesterov, A. E. & Lipatov, Yu. S. (1987). Phase state of polymer solutions and blends. Naukova Dumka, Kiev. [in Russian].
Nikitskii, B.P. (1971). Chemist”s Handbook. Moscow. Chimiya. Nishio, Y., Chiba, R., Miyashita, Y., Oshima, K., Miyajima, T., Kimura, N. & Suzuki, H.
(2002). Salt addition effects on mesophase structure and optical properties of aqueous hydroxypropyl cellulose. Polym. J. (Tokyo), Vol. 34, No. 9, pp. 149- 157.
Nystrom, B. & Bergman, R. (1978). Velocity sedimentation transport properties in dilute and concentrated solutions of hydroxypropyl cellulose in water at different temperatures up to phase separation. Eur. Polym. J. , Vol. 14, No. 6, pp. 431-437.
Papkov, S. P., Rogovin, Z. A.& Kargin, V. A. (1937). About solubility of cellulose and its ethers. Zh. Fiz. Khim., Vol. 10, No. 1, pp. 156-157.
Papkov, S. P. , Kargin, V. A. & Rogovin, Z. A. (1937). Solubility of cellulose and its ethers. II. About applicability of a rule of phases to cellulose ether solutions. Zh. Fiz. Khim. , Vol. 10, No. 4-5 , pp. 607-619.
Papkov, S.P., Kulichikhin, V.G., Kalmykova, V.D. & Malkin, A.Ya. (1974). Rheological properties of anisotropic poly(para-benzamide) solutions. J. Polym. Sci. : Polym.
Phys. Ed. Vol. 12, pp. 1753-1770. Papkov, S. P. & Kulichikhin, V. G. (1977). Liquid crystalline state of polymers. Khimiya,
Moscow. [in Russian]. Papkov, S. P. (1981). Phase equilibrium in polymer–solvent system. Khimiya, Moscow. [in
Russian]. Patel, D. L. & DuPre, D.B. (1979). Poly (γ-benzyl-L-glutamate) liquid crystals in benzene.
Mol. Cryst. Liq. Cryst . Vol. 53, No. 2, pp. 323 – 334. Platé, N. A. (1988). Liquid crystal polymers. Khimiya, Moscow; (1993) Plenum, New York. Robinson C. (1956). Liquid-crystalline structures in solutions of a polypeptide. Trans. Faraday
Soc. Vol. 52. No.1, pp. 571- 592. Robinson, C., Ward, J.C. & Buvers, R.B. (1958). Liquid-crystalline structures in polypeptide
solutions. Disc. Faraday Soc. V. 25. No.1, pp. 29-42. Rogovin, Z. A., Kargin, V. A. & Papkov, S. P. (1937). Solubility of cellulose and its ethers. III.
Heterogeneity influence of acetylcellulose on its solubility. Zh. Fiz. Khim., Vol. 10, No.6 , pp. 793-797.
Rusinova, E. V. & Vshivkov, S. A. (1997). Phase transitions in polymer blends induced by mechanical fields. Polymer Science, A. Vol. 39, No. 10, pp. 1066-1073.
Rusinova, E. V.,Vshivkov, S. A. & Alekseeva, M.S. (2007). Phase transitions in liquid crystalline solutions of hydroxypropyl cellulose under deformation. Polymer Science, B, Vol. 49, No. 1-2, pp. 26-29.
Salaris, F., Valenti, B., Costa, G. & Ciferri, A. (1976). Phase equilibria of poly(p-benzamide) in N,N-dimethylacetamide/lithium chloride solutions. Makromol. Chem., Vol. 177, pp. 3073- 3076.
Sasaki S., Tokuma K. & Uematsu I. (1983). Phase behavior of poly(γ-benzyl L-glutamate) solutions in benzyl alcohol. Polymer Bulletin. V. 10, No. 6, pp. 539-546.
www.intechopen.com

Effect of Magnetic and Mechanical Fields on Phase Liquid Crystalline Transitions in Solutions of Cellulose Derivatives
433
Suto, S., Nishibory, W., Kudo, K. & Karasawa, M. Lyotropic liquid crystalline solutions of hydroxypropyl cellulose in water: Effect of salts on the turbidity and viscometric behavior. J. Appl. Polym. Sci., Vol. 37, No. 3, pp. 737-749.
Tager, A. & Kargin, V. A. (1941). Convertibility research of nitrocellulose, benzylcellulose and gelatin solutions. I. Zh. Fiz. Khim. Vol. 15, No. 9, pp. 1029- 1035.
Tager, A. & Kargin, V. A. (1941). Process of dissolution and swelling of cellulose ethers. Zh. Fiz. Khim. Vol. 15, No.9, pp. 1036-1054.
Tager. A. A. (1993). Foundations of nonelectrolyte solutions science. Ural. Gos. Univ., Yekaterinburg. [in Russian].
Tager, A. A. (2007). Physical chemistry of polymers. World of Science, Moscow. [in Russian]. Volkova, L. A., Kutsenko, L. I., Kulakova, O. M. & Mel’tser, Yu. A. (1986). Liquid
crystalline state of the cyanethylcellulose concentrated solutions in trifluoroacetic acid and in its mixes with organic solvents. Vysokomol. Soedin., B, Vol. 28, No. 1, pp. 27- 31.
Vshivkov, S. A. (1991). Methods for investigation of phase equilibrium of polymer solutions. Ural. Gos. Univ., Sverdlovsk. [in Russian].
Vshivkov, S. A., Kulichikhin, S. G. & Rusinova, E. V. (1998). Phase transitions in polymer solutions induced by mechanical fields. Russian Chem. Rev. Vol. 67, No. 3, pp. 233-243.
Vshivkov, S. A. & Rusinova, E. V. (2001). Phase Transitions in Polymer Systems Induced by Mechanical Field. Ural. Gos. Univ., Yekaterinburg. [in Russian].
Vshivkov, S.A., Rusinova, E.V., Kudrevatykh, N.V., Galyas, A.G., Alekseeva, M.S. & Kuznetsov, D.K. (2006). Phase transitions of hydroxypropylcellulose liquid-crystalline solutions in magnetic field. Polymer Science. A. Vol. 48, No 10, pp. 1115-1119.
Vshivkov, S.A., Adamova, L.V., Rusinova, E.V., Safronov, A.P., Dreval, V.E. & Galyas, A.G. (2007). Thermodynamics of liquid-crystalline solutions of hydroxypropyl cellulose in water and ethanol. Polymer Sci. A. Vol. 49, No. 5, pp. 578-583.
Vshivkov, S.A., Rusinova, E.V. & Kutsenko, L.I. (2007). Phase transitions in solutions of hydroxypropyl cellulose and cyanoethyl cellulose. Polymer Sci. B. Vol. 49, No. 5-6, pp.114-117.
Vshivkov, S.A. & Rusinova. E.V. (2007). Phase diagrams of a hydroxypropyl cellulose – water system under static conditions and in the shear field. Polymer Sci. B. Vol. 49, No. 7-8, pp. 209-212.
Vshivkov, S.A. Rusinova, E.V. Kutsenko, L.I. & Galyas, A.G. (2007). Phase transitions in liquid-crystalline cyanoethyl cellulose solutions in magnetic field. Polymer Sci. B. Vol. 49, No.7-8, pp. 200-202.
Vshivkov, S.A. Rusinova, E.V. & Kutsenko, L.I. (2007). Phase transitions of liquid crystalline cyanoethyl cellulose solutions under static conditions and on shear field. Polymer Sci. B. Vol. 49, No. 5-6, pp. 152-154.
Vshivkov, S.A. & Rusinova, E.V. (2007). Phase liquid-crystalline transitions in hydroxypropylcellulose-ethanol and hydroxypropylcellulose – acetic acid systems under deformation. Polymer Sci., B. Vol. 49, No. 9-10, pp. 229-231.
Vshivkov, S.A. & Rusinova, E.V. (2008). Phase and structural transformations of liquid – crystalline polymer systems in the mechanical field. Polymer Sci., A. Vol. 50, No. 2, pp. 135-141.
www.intechopen.com

Thermodynamics – Physical Chemistry of Aqueous Systems
434
Vshivkov, S.A. & Rusinova, E.V. (2008). Effect of magnetic fields oh phase transitions in solutions of cellulose derivatives. Polymer Sci., A. Vol. 50, No. 7, pp. 725-732.
Wee E. L. & Miller W. G. (1971). Liquid crystal-isotropic phase equilibriums in the system poly(gamma-benzyl-alpha-L-glutamate)-methylformamide. J. Phys. Chem., V. 75, No. 10, pp. 1446-1452.
Werbowyj, R. S. & Gray, D. G. (1976). Liquid Crystalline Structure In Aqueous Hydroxypropyl Cellulose Solutions. Mol. Cryst. Liq. Cryst., Vol. 34, No.4, pp. 97-103.
Werbowyj, R. S. & Gray, D. G. (1979). Cholesteric structure in concentrated hydroxypropyl cellulose solutions. Am. Chem. Soc., Polym. Prepr. Div. Polym. Chem., Vol. 20, No. 1, pp. 102-105.
Werbowyj, R. S. & Gray, D. G. (1980). Ordered phase formation in concentrated hydroxpropylcellulose solutions. Macromolecules, Vol. 13, No. 1, pp. 69-73.
Yunusov, B.Yu., Khanchich, O.A., Dibrova, A.K., Primkulova, M.T. & Serkov, A.T. (1982). Phase transition at heating of liquid crystal solutions of acetates of cellulose in trifluoroacetic acid. Vysokomol. Soedin., B. Vol. 24, No.6 , pp. 414-418.
www.intechopen.com

Thermodynamics - Physical Chemistry of Aqueous SystemsEdited by Dr. Juan Carlos Moreno Piraján
ISBN 978-953-307-979-0Hard cover, 434 pagesPublisher InTechPublished online 15, September, 2011Published in print edition September, 2011
InTech EuropeUniversity Campus STeP Ri Slavka Krautzeka 83/A 51000 Rijeka, Croatia Phone: +385 (51) 770 447 Fax: +385 (51) 686 166www.intechopen.com
InTech ChinaUnit 405, Office Block, Hotel Equatorial Shanghai No.65, Yan An Road (West), Shanghai, 200040, China Phone: +86-21-62489820 Fax: +86-21-62489821
Thermodynamics is one of the most exciting branches of physical chemistry which has greatly contributed tothe modern science. Being concentrated on a wide range of applications of thermodynamics, this book gathersa series of contributions by the finest scientists in the world, gathered in an orderly manner. It can be used inpost-graduate courses for students and as a reference book, as it is written in a language pleasing to thereader. It can also serve as a reference material for researchers to whom the thermodynamics is one of thearea of interest.
How to referenceIn order to correctly reference this scholarly work, feel free to copy and paste the following:
S. A. Vshivkov (2011). Effect of Magnetic and Mechanical Fields on Phase Liquid Crystalline Transitions inSolutions of Cellulose Derivatives, Thermodynamics - Physical Chemistry of Aqueous Systems, Dr. JuanCarlos Moreno Piraján (Ed.), ISBN: 978-953-307-979-0, InTech, Available from:http://www.intechopen.com/books/thermodynamics-physical-chemistry-of-aqueous-systems/effect-of-magnetic-and-mechanical-fields-on-phase-liquid-crystalline-transitions-in-solutions-of-cel

© 2011 The Author(s). Licensee IntechOpen. This chapter is distributedunder the terms of the Creative Commons Attribution-NonCommercial-ShareAlike-3.0 License, which permits use, distribution and reproduction fornon-commercial purposes, provided the original is properly cited andderivative works building on this content are distributed under the samelicense.