Embed Size (px)
Citation preview

EFFECT OF MATERNAL DIETARY FATS AND ANTIOXIDANTS ON
GROWTH RATE AND BONE DEVELOPMENT OF COMMERICAL BROILERS
By
Douglas L. Taylor
Thesis submitted to the Faculty of the
Virginia Polytechnic Institute and State University
in partial fulfillment of the requirements for the degree of
Master of Science
in
Animal and Poultry Science
(Poultry Physiology)
APPROVED:
Dr. D. M. Denbow, Advisor
Dr. G. Minish Dr. J. H. Wilson
May, 1998
Blacksburg, Virginia

ii
EFFECT OF MATERNAL DIETARY FATS AND ANTIOXIDANTS ON
GROWTH AND BONE DEVELOPMENT OF COMMERCIAL BROILERS
D. L. Taylor
Dr. D. M. Denbow, Chairman
Department of Animal and Poultry Science
ABSTRACT
The effect of maternal dietary fats on growth rate and bone development of commercial
broilers was examined. Three hundred fifty female chicks were winged banded, weighed and
equally divided among six starter pens (1.52 X 3.66m) with litter floors. At 20 wk of age, each
pen was fed a basal laying diet supplemented with either 3% chicken fat (CF), soybean oil (SBO)
or menhaden oil (MO). Each diet was provided with or without the antioxidant ethoxyquin,
producing a total of six dietary treatments. Addition of fats [soybean (SBO), menhaden oil
(MO), chicken fat (CF), soybean + antioxidant (SA), menhaden + antioxidant (MA), and chicken
+ antioxidant (CA)] to the maternal diet altered the tissue and yolk composition of hens to reflect
the dietary source. Response variables measured were body weight, tibia weight and length, and
breaking strength (stress, force, energy, bone wall, and diameter). Chick tissue from hens fed a
MO and MA diet exhibited greater (P<0.01) amounts of DPA (22:5n3), DHA (22:6n3) and total
n-3 fatty acids than the remaining dietary treatments. Tissues from chicks fed a SBO and SA
diet displayed larger levels of 18:2n6 and total n-6 fatty acids when compared to all other
treatments. Male and female chicks from the menhaden type diets (MO and MA) were lighter
(P<0.01) during grow out period than from soybean (SBO and SA) and chicken (CF and CA)
type diets. Chicks tibiae diameter from CF maternal diet tended to be larger than the MO
maternal diet, with significance being noted at d 14 (P<0.01) and 28 (P<0.01). Increases were
observed in shear force and stress required to break chick tibia from SBO maternal diet
compared to those from the CF and MO maternal diets. The SBO maternal diet stimulates
growth rate and bone development and strength of the progeny.
(Key words: chickens, bone development, breaking strength, growth rate, fatty acids)

iii
ACKNOWLEDGMENTS
The author wishes to express his gratitude to Dr. D. Michael Denbow, major adivsor, for his
suggestions, guidance, and encouragement throughout this period of study. Thanks are also
expressed to Professors Gary Minish, and James H. Wilson for their suggestions and assistance in
reviewing this thesis.
To Barbara Self, words can’t express my gratitude! Thank you for always helping and
assisting me throughout my study, and sharing your expertise whether on the farm or in the lab.
To Connie, thank you for allowing me to make a friend, and for helping me on what
sometimes seemed like a never ending journey. Also, thanks for having candy available when
needed.
To Jimmie Johnson, thank you for you continuous encouragement to press on, and to not give
up. Thanks for reminding me that I wasn’t ever on this journey alone.
To the chicken farm crew, thank you for keeping such a watchful eye over my feathered
friends, and for helping me every time at the farm. I hope that union that you always speak of comes
through.
To my fellow graduate students, Herman, Sharonda, Aiming , Kwame, and Alice, thank you
for your guidance and support on certain issues. Even though I wasn’t always present in the office,
you always made me feel apart of it. Thank you.
I wish to also extend appreciation to Letecia Moye and Anthony Gayles for their assistance in
setting tabs and formatting the document.
I wish to extend my final thanks to my family, especially Omessia, Haywood Sr., Haywood
Jr., Samantha, Jokale (girlfriend), and the world’s greatest grandmother and aunt. Without your love
and support, I wouldn’t be here. Thank you for being by my side, believing in me, and putting up
with me during the good and bad times. Once again thank you.

iv
TABLE OF CONTENTS
Page
ABSTRACT
ACKNOWLEGMENTS iii
TABLE OF CONTENTS iv
LIST OF TABLES v
INTRODUCTION 1
REVIEW OF LITERATURE 2
Yolk and Lipid Composition 2
Dietary Effects of Endogenous Fatty Acids Composition 3
Maternal Diet Influence of Egg Yolk Lipid Composition 4
Fatty Acid Metabolism 5
Effect of Menhaden Oil 6
Effect of Soybean Oil 7
Bone Development 7
Bone Breaking Strength 8
Dietary Fats in Broiler Breeder Diet 9
MATERIALS AND METHODS 10
Broiler Breeders 10
Broiler Progeny 11
Fatty Acid Analysis 12
Bone Breaking Strength 13
Statistical Analysis 14
RESULTS 15
Maternal Tissue Fatty Acid Composition 15
Yolk Fatty Acid Composition 16
Maternal Diet and Growth Rate 16
Tibia Development and Bone Strength 17
DISCUSSION 19

v
IMPLICATIONS 23
REFERENCES 72
APPENDICES 79
Appendix A: Tissue Homogenization and Extraction of Lipids 79
Appendix B: Yolk and Diet Lipid Extraction 82
Appendix C: Methylation of Lipids 84
Appendix D: Fatty Acid Analysis By Gas Chromatography 87
VITA 88

vi
LIST OF TABLES
TABLE 1. BROILER BREEDER HEN DIET 24
TABLE 2. BROILER CHICK COMMERCIAL STARTER DIET 25
TABLE 3. FATTY ACIDS COMPOSITION OF BROILER BREDER HEN UTERUS 26
TABLE 4. FATTY ACID COMPOSITION OF BROILER BREEDER HEN HEART 27
TABLE 5. FATTY ACID COMPOSITION OF BROILER BREEDER HEN LIVER 28
TABLE 6. FATTY ACID COMPOSITION OF BROILER BREEDER HEN YOLK1 29
TABLE 7. FATTY ACID COMPOSITION OF BROILER BREEDER HEN YOLK2 30
TABLE 8. MALE BODY WEIGHTS ACCORDING TO MALERNAL DIET 31
TABLE 9. MALE BODY WEIGHTS ACCORDING TO MALERNAL DIET 32
TABLE 10. FEMALE BODY WEIGHTS ACCORDING TO MALERNAL DIET 33
TABLE 11. EGG WEIGHTS ACCORDING TO MATERNAL DIET 34
TABLE 12. MALE TIBIAE MEASUREMENTS ACCORDING TO MATERNAL
DIET AT 14 DOA 35
TABLE 13. MALE TIBIAE MEASUREMENTS ACCORDING TO MATERNAL
DIET AT 28 DOA 36
TABLE 14. MALE TIBIAE MEASUREMENTS ACCORDING TO MATERNAL
DIET AT 14 DOA 37
TABLE 15. MALE TIBIAE MEASUREMENTS ACCORDING TO MATERNAL
DIET AT 28 DOA 38
TABLE 16. FEMALE TIBIAE MEASUREMENTS ACCORDING TO MATERNAL
DIET AT 14 DOA 39
TABLE 17. FEMALE TIBIAE MEASUREMENTS ACCORDING TO MATERNAL
DIET AT 28 DOA 40
TABLE 18. SHANK AND KEEL MEASUREMENTS OF MALE CHICKS 4 WOA
TRIAL 1 41
TABLE 19. SHANK AND KEEL MEASUREMENTS OF MALE CHICKS 4 WOA
TRIAL 2 42
TABLE 20. SHANK AND KEEL MEASUREMENTS OF FEMALE CHICKS 4WOA
TRIAL 3 43

vii
TABLE 21. SHANK AND KEEL MEASUREMENTS OF MALE CHICKS 4 WOA
TRIAL 3 44
TABLE 22. SHEAR FORCE REQUIRED TO BREAK MALE TIBIAE ACCORDING
TO MATERNAL DIET 45
TABLE 23. SHEAR STRESS REQUIRED TO BREAK MALE TIBIAE ACCORDING
TO MATERNAL DIET 46
TABLE 24. ANALYSIS OF VARIANCE FOR PARAMETER OF MALE CHICK
TIBIAE ACCORDING TO MATERNAL DIET AT 14 DOA (TRIAL 1) 47
TABLE 25. ANALYSIS OF VARIANCE FOR PARAMETER OF MALE CHICK
TIBIAE ACCORDING TO MATERNAL DIET AT 14 DOA (TRIAL 2) 48
TABLE 26. ANALYSIS OF VARIANCE FOR PARAMETER OF MALE CHICK
TIBIAE ACCORDING TO MATERNAL DIET AT 14 DOA (TRIAL 3) 49
TABLE 27. ANALYSIS OF VARIANCE FOR PARAMETER OF MALE CHICK
TIBIAE ACCORDING TO MATERNAL DIET AT 28 DOA (TRIAL 1) 50
TABLE 28. ANALYSIS OF VARIANCE FOR PARAMETER OF MALE CHICK
TIBIAE ACCORDING TO MATERNAL DIET AT 28 DOA (TRIAL 2) 51
TABLE 29. ANALYSIS OF VARIANCE FOR PARAMETER OF MALE CHICK
TIBIAE ACCORDING TO MATERNAL DIET AT 28 DOA (TRIAL 2) 52
TABLE 30. ANALYSIS OF VARIANCE OF MALE BW ACCORDING TO
MATERNAL DIET (TRIAL 1) 53
TABLE 31. ANALYSIS OF VARIANCE OF MALE BW ACCORDING TO
MATERNAL DIET (TRIAL 2) 54
TABLE 32. ANALYSIS OF VARIANCE OF MALE BW ACCORDING TO
MATERNAL DIET (TRIAL 3) 55
TABLE 33. ANALYSIS OF VARIANCE OF FEMALE BW ACCORDING TO
MATERNAL DIET (TRIAL 3) 56
TABLE 34. ANALYSIS OF VARIANCE FOR FATTY ACID COMPOSITION OF
4 WOA CHICK YOLK ACCORDING TO MATERNAL DIET (TRIAL 1) 57
TABLE 35. ANALYSIS OF VARIANCE FOR FATTY ACID COMPOSITION OF
4 WOA CHICK YOLK ACCORDING TO MATERNAL DIET (TRIAL 1) 58

viii
TABLE 36. ANALYSIS OF VARIANCE FOR FATTY ACID COMPOSITION OF
4 WOA CHICK YOLK ACCORDING TO MATERNAL DIET (TRIAL 1) 59
TABLE 37. ANALYSIS OF VARIANCE FOR FATTY ACID COMPOSITION OF
4 WOA CHICK YOLK ACCORDING TO MATERNAL DIET (TRIAL 2) 60
TABLE 38. ANALYSIS OF VARIANCE FOR FATTY ACID COMPOSITION OF
4 WOA CHICK YOLK ACCORDING TO MATERNAL DIET (TRIAL 2) 61
TABLE 39. ANALYSIS OF VARIANCE FOR FATTY ACID COMPOSITION OF
4 WOA CHICK YOLK ACCORDING TO MATERNAL DIET (TRIAL 2) 62
TABLE 40. ANALYSIS OF VARIANCE FOR FATTY ACID COMPOSITION OF
4 WOA CHICK HEART ACCORDING TO MATERNAL DIET (TRIAL 1) 63
TABLE 41. ANALYSIS OF VARIANCE FOR FATTY ACID COMPOSITION OF
4 WOA CHICK HEART ACCORDING TO MATERNAL DIET (TRIAL 1) 64
TABLE 42. ANALYSIS OF VARIANCE FOR FATTY ACID COMPOSITION OF
4 WOA CHICK YOLK ACCORDING TO MATERNAL DIET (TRIAL 1) 65
TABLE 43. ANALYSIS OF VARIANCE FOR FATTY ACID COMPOSITION OF
4 WOA CHICK LIVER ACCORDING TO MATERNAL DIET (TRIAL 1) 66
TABLE 44. ANALYSIS OF VARIANCE FOR FATTY ACID COMPOSITION OF
4 WOA CHICK LIVER ACCORDING TO MATERNAL DIET (TRIAL 1) 67
TABLE 45. ANALYSIS OF VARIANCE FOR FATTY ACID COMPOSITION OF
4 WOA CHICK LIVER ACCORDING TO MATERNAL DIET (TRIAL 1) 68
TABLE 46. ANALYSIS OF VARIANCE FOR FATTY ACID COMPOSITION OF
4 WOA CHICK UTERUS ACCORDING TO MATERNAL DIET (TRIAL 1) 69
TABLE 47. ANALYSIS OF VARIANCE FOR FATTY ACID COMPOSITION OF
4 WOA CHICK UTERUS ACCORDING TO MATERNAL DIET (TRIAL 1) 70
TABLE 48. ANALYSIS OF VARIANCE FOR FATTY ACID COMPOSITION OF
4 WOA CHICK UTERUS ACCORDING TO MATERNAL DIET (TRIAL 1) 71
INTRODUCTION
Non-infectious skeletal diseases cost the commercial broiler industry millions of dollars
annually. While the cause has not been elucidated, perhaps the most extensively studied area of
skeletal abnormalities is the link between bone development and nutrition. For example, high
levels of vitamin D in maternal and chick diets can cause a greater incidence of leg
abnormalities, and elevated vitamin A can interfere with vitamin D absorption and utilization
(Hargis, 1992).
The most practical method of increasing the metabolized energy (ME) of poultry diets is
by the addition of fat. Fat supplies more metabolized energy per unit weight than any other
ingredient in poultry diets. However, not all fats are equally utilized by poultry. The energy
value of fat in diets is influenced by its chemical structure which affects fat digestion and
absorption. Menhaden oils, rich in polyunsaturated fatty acids (PUFA), is highly digestible for
chickens and represents a traditional fat sources in broiler diets (Engberg et al.,1996). However,
PUFA's are highly susceptible to oxidation during storage, leading to an interest in determining
fat quality for diet supplementation.
Recently, more fat has been added to commercial broiler diets to increase energy density.
The addition of 5% poultry fat to broiler breeder diets has been reported to increase egg
production (Brake et al., 1989). Changes in the lipid fatty acid composition of the maternal diet
are reflected in the fatty acid composition of the yolk. All the fatty acids found in the yolk are
formed by the liver of the hen and deposited prior to oviposition. Since the egg is nutritionally
isolated after oviposition, the hen has an important role in the nutrition of the developing
embryo.
Denbow (1994) performed an experiment in which he used three different supplemental
oils; menhaden (MO), soybean oil (SBO), and chicken fat (CF). While the focus of that study
was on the effects of maternal fats on embryonic mortality, it was also observed that bones
growth of chicks may be affected by maternal dietary lipid composition. At 4 weeks of age,
chicks from hen fed MO and SBO diets exhibited larger body size, tibiae weight, and bone
strength (as measured by breaking force, energy and stress) when compared to chicks fed CF
diet. The present study was designed to focus on the relationship of dietary fat on bone growth,
development, and tibia strength.

2
REVIEW OF LITERATURE
Yolk and Lipid Composition
There are two components of egg yolks: white and yellow. White yolk consist of
approximately two-thirds protein and one-third fat, whereas yellow yolk consist of two-thirds fat
and one-third protein and accounts for 98% of total yolk (Schjeide et al., 1963). The white yolk
lies beneath the germinal disc in alternating concentric rings with yellow yolk. Since the egg
yolk contains most all the lipids found in the egg, lipid deposition must occur during yolk
maturation and is not influenced by fertilization or transport through the oviduct (Noble and
Cocchi,1990).
The yolk is initially bound by a four-layer vitelline membrane which is laid down during
yolk maturation as it travels through the oviduct. The vitelline membrane provides mechanical
strength but is permeable to water and mineral salts (King and McLelland, 1984).
The overall lipid to protein ratio in the egg is 2:1. The yolk of the average chicken egg
contain 6g of lipid mainly in the form of triacylglyerols, phospholipids (such as
phosphatidylcholine and phosphatidylethanolamine) and free cholesterol (Noble and Cocchi,
1989; 1990). Minor yolk components includes cholesteryl esters and free fatty acids. Each lipid
component has a unique fatty acid profile. The phospholipid component exhibits characteristic
levels of linoleic (18:2n6), arachidonic (20:4n6) and docoshexaenoic acid (DHA, 22:6n3) as well
as other polyunsaturated fatty acids (Noble and Cocchi, 1990).
In the avian liver, extensive reprocessing of glycerides and fatty acid residues from the
portomicrons remnants occurs. The modified lipid is then reformed and included in particles of
very-low density lipoprotein (VLDL) which then pass to the Golgi complex where they acquire
phospholipids and further glycosylation. Completed particles of VLDL are finally concentrated
in secretory vesicles, and then discharge into the blood (Bensadoun and Rothfeld, 1972).
VLDL particles are then carried into the blood to the ovarian follicles where they diffuse
through holes in the capillaries. The basal lamina offers some resistence and particles of VLDL
accumulate in the layer. Evan et al. (1979) reported that basal lamina filters out all particles
larger than the VLDL of laying birds. Once in the blood the particles enter the yolk by receptor-
mediated endocytosis through the oolemma (Perry et al., 1984).

3
Dietary Effects on Endogenous Fatty Acid Composition
Many studies have addressed changes in long chain polyunsaturated fatty acid (PUFA)
metabolism in maternal-filial systems (Cherian and Sim, 1993). Once a fertilized egg is
incubated, the constituents of the yolk are the sole supply of nutrients for the developing embryo.
Therefore, it is possible to determine the net movement of n-3 or n-6 PUFA from the yolk to the
developing embryo and quantify the changes in the lipid composition of the progeny. Studies
indicate that the presence of n-3 or n-6 fatty acids in the laying hen diet can enrich the egg yolk
lipids and the tissue of the chick (Cherian and Sim, 1992).
There have been attempts to increase the n-3 fatty acid content of poultry by
supplementation of poultry diets with oils rich in n-3 fatty acids (Chanmugan et al., 1992). Birds
supplemented with linseed oil, rich in linolenic acid (C18:3n3), had significantly higher levels of
n-3 fatty acids and higher n-3:n-6 ratios than those supplemented with the same level of
menhaden oil, which is high in C18:3n3. Levels of eicosapentaenoic acid (C20:5n3) were
increased in the group fed linseed oil or menhaden oil compared to those fed corn oil.
Although desaturase activities regulate tissue concentrations of fatty acids, especially for
PUFA, dietary lipid can dictate fatty acid composition in poultry. Varying the type and amount
of dietary unsaturated fat dramatically modifies the fatty acid composition of lipids in the hen
yolk and in the tissues of growing chicks (Watkins, 1991). Feeding linseed oil, which is rich in
α-linolenic acid, to chicks depresses the amount of arachidonic acid but concomitantly raises
levels of eicosapentaenoic acid in organ lipids presumably by enhancing (n-3) PUFA formation.
The long chain PUFA (especially eicosapentaenoic and docosahexaenoic acids) present in fish
oils are extremely effective in lowering total (n-6) PUFA in chick liver and in depressing VLDL
production rates in roosters (Phetteplace and Watkins, 1990).
Phetteplace and Watkins (1989) reported that high levels of 18:3n3 (linseed oil) in
chicken formed 20:5n3 fatty acid, and that the conversion of 18:2n6 to 20:4n6 was decreased.
High levels of 18:2n6 found in soybean oil increased the rate at which 20:4n6 were produced.
Simopoulos (1988) found that liver tissue of chicks fed linseed oil displayed high levels of
18:3n3, 20:5n3, 225n3, and 22:6n3 fatty acids. Chickens fed menhaden oil had a decrease in the
amount of 20:4n6 compared to the chicks fed soybean oil and chicken fat.

4
Maternal Dietary Influence on Egg Yolk Lipid Composition
Fatty acids destined from the yolk are synthesized in the hen’s liver, permitting
manipulation of fatty acid components through dietary measures (Cherian et al., 1996).
Cruickshank (1934) investigated the effects of degree of dietary fatty acid saturation on egg fatty
acid composition. Eggs were collected and analyzed for fatty acid composition as determined by
iodine value (degree of unsaturation). Hens fed hemp oil which is unsaturated produced eggs
with iodine values of 124 and 126 compared with the control values of 84 to 88 found in eggs
from birds fed a commercial mash diet. The iodine value of eggs from hens fed satrurated
mutton fat was not different from that of the controls. Machlin et al. (1962) fed White Leghorns
diets containing 15% safflower or hydrogenated coconut oil for a 12-wk period. Eggs from hens
fed hydrogenated coconut oil contained significant quantities of lauric (12:0) and myristic (14:0)
acids and significantly less 20:4n6 acid than hens fed safflower oil. Furthermore, egg yolks were
enriched with n-6 or n-3 PUFA by incorporation of fats rich in these respective essential fatty
acids (Cherian and Sim, 1993).
A maternal diet influence has also been reported for turkeys (Couch et al., 1974; Vilchez
et al., 1990). Couch et al. (1974) divided Beltsville White turkey breeder hens into five groups
which received either a fat free, 3% SBO, 30% SBO, 3% neat’s foot oil, or a control diet (2.26%
total fats). Hens fed the fat-free diet laid eggs with the lowest stearic (18:0) acid level, whereas
hens fed 30% SBO laid eggs with significantly higher levels. The opposite effect was seen with
oleic (18:1n9) acid.
Vilchez et al. (1990) fed medium-sized turkey breeder hen diets containing no fat, 5%
animal-vegetable (AV) fat, 5% corn oil (CO) or 5% olive oil (OO) for a 20 wk period. Hens fed
the AV or CO diets had significantly higher plasma levels of 14:0 and 18:0 fatty acids than the
controls. Hens fed the OO diet had significantly higher plasma 18:1n9 acid levels than the
remaining treatments. Likewise, hens fed the CO diet had significantly higher 18:2n6 acid in
plasma. Egg yolk fatty acid composition of birds fed the OO diet contained significantly higher
18:1n9 acid when compared with the remaining treatments. In contrast, yolk from hens fed the
CO diet had higher levels of 18:0, 18:2n6 and 20:4n6 acids.

5
Fatty Acid Metabolism
Lipid metabolism is an important aspect of chick embryonic development because avian
embryos derive over 90% of their caloric requirement from fatty acid oxidation (Donaldson,
1981). The embryo requires fatty acids to synthesize phospholipids for membrane formation,
and for synthesis of triglycerides for energy storage (Donaldson, 1981). These properties make
lipids a most efficient resevoir of energy.
Fat can represent 15-20% of the total body weight of broilers (Leveille et al., 1981).
According to Evans (1977), greater than of 85% of the total body fat functions as an energy
supply, and is stored in adipose tissue. Therefore, only 15% of the fat found in the body, or 2 to
3% of the total body weight, are used for functions other than energy storage.
Upon absorption from the intestinal lumen, hydrolyzed products of lipid digestion
including long chain fatty acids and monoacylglycerols must be re-esterfied within the
endoplasmic reticulum of the enterocytes prior to transport. The resultant triglycerides are
packaged with cholesterol, phospholipids, and protein to form lipoproteins. In mammals, these
lipoproteins are referred to as chylomicrons because they are transported within the lymphatic
system (Bensadoun and Rothfeld, 1972). However, in poultry these lipoproteins are referred to
as portomicrons, because they are transferred to the hepatic portal circulation (Bensadoun and
Rothfeld, 1972). On the other hand, short chain fatty acids (<12 carbons) and free glycerol are
transported directly to the liver via the portal system in both poultry and mammals.
Fatty acids are transported as triglycerides in very low density lipoproteins (VLDL) to
adipose tissue storage sites (Leclercq et al., 1974). Once the VLDL’s released by the liver reach
the target tissue, lipoprotein lipase hydrolyzes them for free fatty acid uptake by the cell. After
hydrolyzation, most of the VLDL’s are converted to low density lipoprotein (LDL). It is
estimated that 50% of the LDL are eventually degraded by the liver and extrahepatic tissues
(Leveille et al., 1979).
The parent compound of n-3 fatty acid is linolenic acid (18:3n3). This acid is converted
in both mammalian and avian species by a delta 6 desaturase to 18:4n3. Desaturase enzymes
remove a hydrogen thereby forming a carbon to carbon double bond in the backbone chain. The
20:5n3 serves as a precursor for series 3 prostanoids through the cyclooxygenase pathway and
series 5 leukotrienes through the lipoxygenase pathway; it can also be desatuated (delta 4 -
desaturase) to 22:6n3 (Simopoulos, 1988).

6
Metabolism of the n-6 fatty acids occurs via the same enzymes. The parent compound of
the n-6 series, lenoleic acid (18:2n6), is desaturated to 18:3n6 by delta 6-desaturase. Elongation
of γ-linolenic acid (18:3n6) produces 20:3n6; delta 5-desaturase converts the compound to
arachidonic acid (20:4n6) (Ackerman, 1995). Arachidonic acid is further metabolized by either
the cyclooxygenase or lipoxygenase pathway. The cyclooxygenase pathway converts
arachidonic acid to prostaglandins (PGD2, PGE2, PGF2, PGI2) and thromboxanes (TxA2).
Lipoxygenase pathway converts arachidonic acid to leukotrienes (Smith, 1989).
There is competition between n-3 and n-6 fatty acids for all desaturase enzymes. It
appears that n-3 fatty acid are preferred by delta 6-esaturase enzymes (Simopoulos, 1988).
Inclusion of feed stuffs rich in n-3 fatty acids to the diet results in the replacement of n-6 with
n-3 fatty acids in the cell membranes resulting in an increase of 20:5n3, PGI3, TxA3 and
leukotriene B5 (Cahaner et al., 1995). Conversely, diets high in 18:2n6 greatly increases the
20:4n6 content of tissue and therefore influences the production of prostaglandins and
thromboxanes and decreases 20:5n3, PGI3, TxA3 and leukotriene B5 (Smith, 1989). If diets
contain appreciable amounts of both 18:2n6 and 18:3n3 acids, 18:3n3 is metabolized more
readily than 18:2n6 (Simopoulos, 1988).
Effects of Menhaden Oil
In the poultry industry, menhaden oil has been an important ingredient of chicken and
turkey rations for over 30 years. Menhaden oil (MO) is a rich dietary source of long chain n-3
PUFA, particularly 20:5n3, 22:5n3, and 22:6n3 acids. Marine oils have been shown to stimulate
growth rates when used in conjunction with other fats, or when used alone (Dansky, 1961).
Edward et al (1963), demonstrated that menhaden fish oil and safflower oil gave equal growth
stimulation when added to a high protein diet (Dansky, 1961). The n-3 fatty acid content of
broiler thigh muscle was increased by dietary supplementation with either linseed or menhaden
oil (Chanmugam et al., 1991).
Edwards and Marion (1963) studied the effect of MO on both growth rate and fatty acid
composition of White Plymouth Rock cockerels. One group received a basal casein-gelatin diet
supplemented with either 0% or 4% MO while the second group was fed a soybean protein diet
supplemented with 0% or 4% MO. The addition of fat increased 4 wk BW regardless of diet.
The fatty acid composition of the liver of birds supplemented with MO contained significantly
elevated levels of 20:5n3, 22:6n3, and 22:5n3 acids. EPA and other n-3 PUFA levels in broilers

7
were enhanced as a result of feeding diets supplemented with menhaden oil (Marion and
Woodroof, 1965; Edwards and May, 1995). Hulan et al. (1988) demonstrated that broiler
chickens fed a diet containing 5.0% fish oil has substantial amounts of EPA, DHA, and other n-3
PUFA deposited in tissues. Fish oil added to diets of young turkeys consistently increased body
weights. Potter (1980) reported there were factors responsible for the increase in growth rate,
which were not present in water or ether extracts of fish meal but remained in the residues of
these extractions.
Effects of Soybean Oil
Soybean oil contains large amounts of PUFA including 18:1n9, 18:2n6, 18:3n3, and
18:3n6 acids. These long chain PUFA have been shown to increase growth rate, lower feed
intake and improve feed conversion (Atteh et al., 1989; Scaife et al., 1994). Atteh et al. (1989)
fed male broiler a basal diet with either 5% animal-vegetable blend (AV), SBO, canola oil
(CAO) or canola soapstock (CS) from 0 to three wk. At three WOA, SBO-fed birds exhibited a
higher BW (531.2g) than AV (527.2g), and CAO (502.8g) or CS (509.6g). Birds fed SBO also
had lower feed intake and superior feed conversion when compared to other treatments. Scaife
et al. (1994) fed 19-day of age broiler hens a basal diet supplemented with either 5% SBO or
rapeseed oil (RSO) for a 5-wk period. At 54 d, SBO fed birds showed higher live weight gain
when compared to the RSO fed birds.
Growth stimulation with fats has been obtained with practical broiler rations containing
predominately corn meal and soybean meal. Including 7.5 % soybean oil in such a ration
improved growth rate by approximately 8 percent over similar rations unsupplemented with fat
(Skinner et al., 1990). Watkins et al. (1996) reported that feeding soybean oil to chicks produced
higher PGE2 levels in bone and depressed bone formation rates when compared to feeding
menhaden oil.
Bone Development
Bone formation and bone resorption are regulated by systemic hormones and locally
produced factors within the skeleton. Among these factors are cytokines and growth factors
such as interleukin-1 (IL-1), IL-6, epidermal growth factor (EGF), fibroblast growth factor
(FGF), insulin-like growth factor (IGF-I and II), transforming growth factor-β (TGF-β), and
eicosanoids (Watkins et al., 1996). Eicosanoids are local modifiers of bone metabolism and
include prostaglandins which are derivatives of 20-carbon carboxylic acids formed by the cyclo-

8
oxygenase pathway. Prostaglandin E2 (PGE2), derived from n-6 PUFA, causes resorption of
bone mineral and the release of calcium in vitro (Klein and Raisz, 1970). Considerable clinical
and experimental evidence has revealed that PG is a potent stimulator of bone formation (Marks
and Miller, 1993). Recent studies on bone formation in chicks demonstrated that diets enriched
with saturated fats or vitamin E stimulated bone formation (Xu et al., 1995). In addition, diets
enriched with n-6 PUFA elevated in vivo bone PGE2 production and lowered the rate of
trabecular bone formation (Watkins et. al., 1996).
Prostaglandin E2 was reported to increase IGF-I transcript and polypeptide levels in rats
calvaria cells (McCarthy et al., 1991, Schmid et al. 1992) and stimulate the expression of mRNA
for IGF binding protein-3 (BP-3) to enhance the IGFBP-3 binding affinity to rat calvaria
(Schmid et al., 1992).
Dietary manipulation of fat intake may effect bone cell function and play a role in the
local regulation of bone formation. Recently it was reported that 21-day-old chicks consuming a
soybean oil diet rich in n-6 PUFA had higher concentration of the PGE2 precursor 20:4n6, but
lower concentrations of IGF-I in epiphyseal cartilage, cortical bone, and liver compared with
those fed menhaden oil rich in (n-3) PUFA (Watkins et al., 1996).
Bone Breaking Strength
In the poultry industry, processing of spent hens often results in many broken and
shattered bones, especially in cage-maintained birds. Bone breaking strength has received
considerable attention during the past decade. Bone breaking strength and bone ash content are
common methods used to evaluate dietary adequacy, bone mineralization and bone fragility
(Rowland, et al., 1967). Rowland et al. (1967) noted that the bone ashing process was more time
consuming than bone breaking strength tests, but that both tests were equally reliable. Both
procedures require defleshing of bone after excision and weighing (Orban et al., 1993).
Frost and Rowland (1991) and Orban et al. (1993) reported a correlation between bone
breaking strength and bone density (or bone mineral mass). Positive correlations were found
between bone breaking strength and bone density (.81), bone density and weight (.82), tibia
breaking strength and tibia weight (.70) and tibia weight and body weight (.62).
Lott et al. (1992) examined the effects of bone handling on bone breaking strength.
Fresh, frozen, and oven dried bones were compared. Only minor differences in breaking
strength were detected between fresh and frozen bone. However, drying the bones decreased
9
their strength approximately 50%. The breaking strength of fresh and frozen bones of male
broilers was significantly higher than that of females (Lott et al., 1992). However, these
differences disappeared after the bones were dried (Lott et al., 1992). Lott et al. (1992) also
tested poultry bones in the fresh, frozen and thawed, and dried condition. They observed no
differences between fresh and frozen but noted a 50% decrease in the strength of dried bones.
Dietary Fats in Broiler Breeder Diet
The addition of fat to the broiler breeder diets has been used to increase metabolizable
energy, feed conversion, egg production, fertility and hatchability (Atteh and Lesson, 1983;
Brake, 1990; Triyuwanta et al., 1992). Fats are widely used as a source of energy in broiler
diets, although its efficiency of utilization is dependent on the fatty acid composition. Atteh and
Lesson (1983) found that saturated fat is less efficiently utilized than unsaturated fatty acids,
confirming earlier studies by Renner and Hill (1961). Atteh and Lesson (1984) fed male broiler
chicks a basal diet supplemented with either 8.8% 18:1n9 acid or 8.8% 16:0 acid. The 16:0 acid
fed birds ate more feed (29.4 g/bird), gained less overall weight (365.7 g) and had lower feed
conversion (1.72) than 18:1n9 acid fed birds (26.6 g/bird, 411.9 g and 1.59, respectively).
Certain fat sources can also form insoluble soaps comprised of fatty acids and minerals during
digestion, causing these components to become unavailable thus having a detrimental effect on
mineral metabolism (Atteh and Lessom, 1983).

10
Materials and Methods
Broiler Breeder
Commercially sexed Abor Acre broiler breeder chicks arrived July, 1996. Three
hundred fifty female chicks were winged banded, weighed and equally divided among six starter
pens (1.52 x 3.66m) with litter floors. Water and a commerical broiler starter feed composition
(Table 2) were provided for ad libitum consumption for 10d. From d 10 through 20, the females
were fed specific daily amounts with unlimited water access. At 20 d, a skip-a-day feeding
regime was implemented as specified in the Arbor Acre Broiler Breeder Growth Guidelines
while water was provided ad libitum. Artificial lighting was provided continuously on d one and
then gradually decreased as follows: 16h on d 3 and 4, 12h from d 5-7, and 8h daily starting d 8
onward as per breeder company specifications.
Seventy-five male chicks were also wing-banded, weighed and equally divided among
two grower pens (1.52 x 1.33m). Water and a commercial broiler starter feed were provided for
ad libitum consumption until the birds were 4 weeks of age. Thereafter, a skip-a-day feeding
program was implemented with water provided ad libitum. Artificial lighting was provided as
described above. Male and female BW was monitored weekly and compared to the Arbor Acre
breeder guidelines. Feed was adjusted to maintain body weight guidelines.
At 8 wk of age, the birds were moved into growing pens (3.04 x 2.66m). The skip-a-day
feeding program was maintained as per company specifications and water was provided ad
libitum. Artificial lights were kept constant at 8 h/d.
At 20 wk of age, the number of hens was reduced to 300 by culling those farthest from
the flock average. The hens were randomly divided among six treatment pens (3.04 x 2.66m).
Seven roosters were also placed in each pen. In addition nine culled hens were sacrificed by
cervical dislocation. The heart, uterus and liver were removed, placed on ice, then immediately
frozen for subsequent fatty acid analysis.
Begining at 20 wk of age, hens was fed a basal laying diet (Table 1) supplement with
either 3% chicken fat (CF), soybean oil (SBO) or menhaden oil (MO). In addition, each diet was
provided with or without the antioxidant ethoxyquin (0.00025%), producing a total of six dietary
treatment groups. The antioxidant was added to each fat prior to inclusion in the diet. Samples
of each individual fat were taken and immediately frozen for subsequent fatty acid analysis.

11
The female diet was placed in feeders which had grills designed to deny male access.
The grill had a 4.13 cm horizontal and 7.62 cm vertical opening. The males were fed a standard
male breeder diet which was placed in feeders raised above the reach of the females. The skip-a-
day feeding program was continued and water was provided for ad libitum comsumption. The
skip-a-day feeding program was discontinued at 25 wk of age (WOA) and replaced with a daily
restricted feeding program as specified by Arbor Acre breeder guidelines. Lighting was
increased 1h weekly until 14h/d was reached and maintained. Both male and female BW was
monitored biweekly and compared to the Arbor Acre broiler breeder guidelines. Feeding
allocations were adjusted to maintain these body weight targets.
Egg production commenced at approximately 23 WOA. At 25 WOA, nine eggs were
collected from each treatment group. The yolks were collected and immediately frozen at -20°C
for subsequent fatty acid analysis. This procedure was repeated at 8 and 24 wk of production (33
and 49 WOA, respectively).
Beginning at 25 WOA, and every 3 weeks thereafter, eggs were collected for five
consecutive d and set in the incubator. Percent fertility and hatchability were determined. All
eggs that failed to hatch were opened and examined macroscopically. Embryos were classified
as either early, mild, or late dead, or pipped embryos.
From 36 weeks of age, broiler breeder weights were monitored monthly and compared to
Arbor Acre breeder weight guidelines. Water and artificial lighting were provided as described
above until the end of the experiment (51 WOA). At 20 and 51 WOA the heart, uterus and liver
were excised from nine hens per treatment group and immediately frozen at –20°C for
subsequent fatty acid analysis.
Broiler Progeny
The progeny from those eggs collected at 25 WOA were hatched, wing-banded, weighed
and placed in grower pens (1.52 x 3.66m) according to maternal diets. All chicks were fed an
identical starter diet (Table 2) and raised under similar conditions. Feed and water were
provided for ad libitum consumption, and lighting was continuous. The chicks were weighed
weekly and sampled as described below. Broilers chicks were weighed weekly until the end of
the experiment (4 wk).
For the first hatch, eggs were collected and set during the second wk of broiler breeder
production (pre-peak). The total number of chicks placed in grower pens was as follows: MO

12
progeny, 86; SBO progeny, 101; and CF progeny, 107. At 2 and 4 WOA, 25 males from each
treatment group (i.e. maternal diet) were sacrificed by cervical dislocation. The left or right tibiae
were removed, weighed, the length and diameter measured, and then refrigerated for subsequent
bone strength tests. At 4 WOA, the remaining birds were sacrificed by cervical dislocation. In
addition to tibia measurements, the length of the shank and keel from each bird were measured.
During wk 8 of broiler breeder production (peak), eggs were collected, set, incubated and
hatched. The total number of chicks placed into grower pens was as follows: MO progeny, 113;
SBO progeny, 104; and CF progeny, 104. Measurements were made as described for hatch one.
The total number of chicks from the third hatch included: MO progeny, 74; SBO progeny, 199;
CF progeny, 214. Measurements were made as described for the first hatch.
Eggs from the last hatch was collected and set. Both female and males were used and the
same procedures were followed as stated above. Upon hatching, nine chicks per treatment group
were sacrificed at hatch by cervical dislocation and their heart, uterus, and liver immediately
removed and placed on ice for subsequent fatty acid analysis. The total number of chicks from
the third hatch included: MO progeny, 111; SBO progeny, 149; CF progeny, 178.
Fatty Acid Analysis
Fatty acid analysis was performed as described by Nelson (1975), Christi (1982) and
Bear-roger (1985). The samples tested were as follows: 1) the individual dietary fats, 2) broiler
breeder hen tissues including liver, heart, and uterus prior to feeding the experimental diets and
at the end of the experiment, and 3) egg yolks from 2, 8, and 24 wk of production. The tissue
required homogenization and filtration prior to fat extraction, methylation and analysis. A 0.5 g
tissue sample was placed into a 50 ml glass screw-top tub and homogenized (Polytron
homogenizer) in 2:1 chloroform:methanol. The solution was then filtered (Whatman #40 filter,
12.5 cm diameter) into a second test tube. KCL (0.88%) was added to filtrate; the test tubes were
shaken (Eberbach Corp. horizontal shaker) and centrifuged (3 min at 3000 rpm, 1380 g) to
separate the aqueous and organic layers. Upon completion, the aqueous layer was siphoned off,
leaving the fatty acid dissolved in the lower, chloroform layer. The chloroform was then
evaporated (Organomation Meyer N-evap analytical evaporator model # 112) under a N stream
at 60 C. The resulting product was then transferred to a 15 ml glass screw-top tub to await
methylation and analysis.

13
Lipid extraction of egg yolk and dietary fat followed a more simplified approach. All
samples (0.5 g each) were dissolved in chloroform:methanol (2:1), shaken for 10 min (Eberbach
corp. horizontal shaker) and vortexed. The samples were filtered (Whatman # 40 filter, 12.5 cm
diameter). Once the samples were ready for methylation, the internal standard (40µg/ml 17:1 in
chloroform:methanol (2:1, Nuchek Prep Inc.) and triglyceride standard (TG dissolved in
chloroform:methanol (2:1) NuChek Prep Inc. were added, and the samples evaporated, under a
stream of N at 60 C (organomation Meyer N-evap analytical evaporator model # 112) until
approximately 2-3 drops remained. NaOH (400-µl, in methanol) was added, and the samples
heated (5 min, 100 C) in a dry block heater to saponify the lipids. Once cooled, 0.4 ml BF3 was
added, and the samples were again heated (5 min, 100 C) in a dry block heater to methylate the
fatty acid.
The samples were cooled and iso-octane and distilled water was added; the test tubes
were shaken (Eberbach Corp. horizontal shaker) and centrifuged (10 min, 2000 rpm, 650 g); the
methylated fatty acids were dissolved in iso-octane once this step was completed. The iso-
octane layer was then transferred to a crimp vial and ready for injection into a gas
chromatographer (Hewlett Packard model # 5890, with automatic sampler (Hewlett Packard
model # 7673), flame ionization detector and integrator {(Hewlett Packard model # 3393. The
column used was fused silica capillary column (J & W Scientific model # DB225), 30 m long
and 1.5 mm inner diameter}. Retention peaks for each fatty acid were compared to known
standards. The 20:5n3 and 22:5n3 acids were calculated by comparison with the 17:1
(chloroforn:methanol, 2:1) internal standard.
Bone Breaking Strength
All mechanical testing was conducted on an Instron Universal Testing Machine (Model #
1011, Instron, Canton Mass.), which was set at a maximum load of 1000 and 2000 Newtons for
bones from 2 and 4 week old chicks, respectively and cross head speed of 5 mm/min. Bones
strength was measured by shear force and stress. Shear test was performed using a double shear
block test fixture (Wilson et al., 1984). The shear fixture was designed so that the shear force
was exerted on a 12.7 mm section loaded at the center of the shaft. The bones were loaded at a
rate of 5.00 mm/min. Test position of each bone was such that the smallest dimension of the
cross-section was parallel to the direction of loading. These test resulted in the ultimate shear
force, shear stress, and fracture energy being determined for each bone (Wilson et al., 1984).

14
Shear stress was determined mathematically by dividing shear force by 2 times the cross
sectional area of the bone, thus accounting for bone diameter and bone wall thickness.
Statistical Analysis
A one way ANOVA was conducted to analyze the effects of maternal dietary fat on
growth rate and bone parameters (tibiae weight, length and diameter, shank and keel
measurements, shear force and stress required to break individual tibiae) of broiler progeny, and
yolk and tissue fatty acid composition of both broiler breeder hens and broiler progeny. Where
significant differences were found among treatment (i.e. maternal diets), comparisons among
multiple means were separated using a Duncan’s Multiple Range test. Calculations were made
using the General Linear Model of the SAS Institute Inc.
15
RESULTS
Maternal Tissue Fatty Acid Composition
Uterine tissue from hens fed diets containing chicken fat (CF) diet showed significantly
(p<0.01) increased levels of 14:1n5 and trans-16:1n7 fatty acids when compared to those in the
chicken-antioxidant (CA), soybean oil (SBO), soybean-antioxidant (SA), menhaden oil (MO),
and menhaden-antioxidant (MA) treatments (Table 3). The levels of fatty acid 16:0 were not
different in uterine tissue from the CF and SBO treatments, but were increased when compared
to the MA and MO treatments. The levels in the CA treatment were intermediate. The levels of
18:0 were decreased in uterine tissues of hens fed SBO and SA compared to CF and CA, while
the levels were intermediate in hens fed MA and MO treatments. Feeding CF significantly
increased levels of 18:1(iso) compared to all other treatments.
Levels of 18:2n6 in uterine tissue of hens were highest in the SBO and SA treatments,
compared to the remaining groups. The levels of 18:3n3 fatty acid were significantly decreased
in the uterus of hens fed MO when compared to chicks fed CF diet. The level 20:0 was
significantly elevated in the uterus of hens fed CF. Feeding chicken fat generally elevated the
levels of 20:2n6 while decreasing 22:6n3 compared to diets containing menhaden oil. Levels of
soybean fed hens were intermediate. Levels of 20:3n6 in uterine tissue were lowest in the MO
and MA treatments compared to the remaining groups, whereas levels of n-3 fatty acids were
significantly higher in uterus of hens fed MA and MO and lowest in other treatments. Total
PUFA levels were highest in hens fed CF treatments, intermediate in SBO and lowest in the
remaining groups.
Heart tissues from hens fed MA had significant levels of 15:0 fatty acid compared to hens
fed CA, while values in the remaining treatments were intermediate. Tissues from hens fed CF
diet contained significantly (p<0.01) higher levels of 16:0, trans-16:1n7, and 18:1(iso) fatty
acids, and was also significantly different from all other treatments (Table 4). Levels of 16:1n7
was high in heart tissue from hens fed CF treatment, intermediate in MA and lowest in the SBO
treatment. Feeding SBO and SA significantly increased levels of 18:2n6 fatty acid. Fatty acid
18:3n3 were present in the highest levels in hens fed a CF diet. Levels of 20:1n9 fatty acid was
significantly (p<0.01) highest in hens fed CA compared to remaining treatments. The levels of n-
3 and n-6 fatty acids followed the same trends seen in uterine tissue. Feeding chicken fat
generally elevated the levels of total SUFA, MUFA, and PUFA.

16
Liver tissues from hens fed a MA treatment had significantly higher in levels of 15:0
fatty acid, while hens fed a CA treatment were significantly lower (Table 5). Fatty acid 17:0
increased significantly (p<0.01) in liver tissue of MA fed chicks. Levels of 18:2n6 fatty acids
was highest in hens fed SBO treatment, intermediate in CF and lowest in the remaining groups.
Levels of 22:4n6 in liver tissue of hens were highest in SBO treatment, intermediate in CF, and
lowest in the remaining groups. Levels of 22:5n3 fatty acid were significantly elevated in hens
fed a MO and MA treatment. Levels of total PUFA was highest in hens fed a SA treatment,
intermediate in the CF, and lowest in all other groups.
Yolk Fatty Acid Composition
The yolk from hens fed diets containing fish oil had elevated amounts of 14:1n5 and 15:0
fatty acid compared to the remaining treatments (Table 6). The levels of 18:0 were highest in
yolk from hens fed CA while there was no differences in the remaining groups. Levels of 18:2n6
fatty acid was high in yolk from the SBO and SA treatment, intermediate in CF, and lowest in all
other groups. Yolk from SBO and SA treatment showed significantly high levels 18:3n3 fatty
acid while yolk from MO treatment was intermediate and all other treatment were the lowest.
Feeding SBO generally decreased levels of 22:6n3 fatty. Levels of total PUFA was highest in
yolk from the MO and MA diet, intermediate in CF, and lowest in the remaining treatments.
Levels of 14:1n5 was highest in yolk fed a MO and MA treatment, while those fed a SA
treatment was significantly lower (Table 7). Fatty acid 15:0 showed elevated levels in yolk from
diets containing fish oil, but was significantly low in all other treatments. Levels of 17:0 fatty
acid were highest in those yolk from hens fed a MO treatment, while all other treatments showed
no significant difference. Levels of 18:0 fatty acid was highest in yolk from hens fed a SBO
treatment, intermediate in those fed CF, and lowest in all other groups. Levels of 18:2n6 fatty
acid was high in yolks from hens fed a SBO and SA treatment, intermediate in those fed diets
containing chicken fat, and lowest in the remaining treatments. Levels of 18:3n3 were highest in
yolk from hens fed a SBO diet and lowest in those fed a CF treatment.
Maternal Diet and Growth Rate
At hatch (d 0), male chick (35.80 ± 0.43g) from diets containing menhaden oil weighed
significantly (p<0.01) less than chicks coming from diets containing chicken fat and soybean oil
(Table 8). Over the next 21d, chicks from SBO fed hens weighed significantly more than all
other treatments. Chicks from the CF maternal diet were significantly larger than those from

17
MO fed hens. At d 28, chicks (1119.09 ± 14.30g) from the SBO fed hens and those from the SA
fed hens (1115.36 ± 23.11g) were significantly larger than all other treatments. Feeding a CA
treatment significantly increased shank and keel measurements (Table 18). Shank measurements
were intermediate in the SA treatment and lowest in the MA treatment. Keel measurements were
low in those chicks fed a CF treatment.
Upon hatch, chicks (41.78 ± 0.33g and 43.08 ± 0.39g) whose maternal diet was MO and
MA were significantly lighter than chicks from CF and SBO maternal diets (44.15 ± 0.40g and
43.64 ± 0.37g, respectively)(Table 9). Chicks from the MO and MA treatment continued to be
significantly lighter through the following 21 d, and were still significantly lighter (1138.28 ±
20.43g and 1036.92 ± 32.39g) at the end of 28 d (chicks from CF, CA, SBO, and SA fed hens
were 1215.59, 1221.64, 1225.87, and 1221.96, respectively). Shank and keel measurements
were significantly larger in those chicks fed a CF treatment (Table 19).
At hatch (d 0), chicks from MO fed hens weighed significantly less than chicks from all
other treatments (Table 10). Over the next 21 d, the chicks from the CF fed hens weighed more
than those from MO and SBO fed hens. Chicks from the SBO maternal diet were larger than the
chicks from the MO fed hens. At d 28, chicks (1052.21 ± 18.86g) from the SA fed hens and the
CF fed hens (1048.74 ± 14.27g) chicks were significantly larger than the MO treatment (952.92
± 15.58g). Shank and keel measurements were larger in those chicks fed a CF diet (Table 20).
Tibia Development and Bone Strength
There was no significant difference observed in tibia weight or length, among chicks
according to maternal diet (Table 12). At 14 DOA, the diameter of tibiae excised from male
chicks whose maternal diet was SBO and SA was significantly lower and different from all the
other diets. Also at 14 DOA, there was no significant difference in force and bone wall
thickness. As shown in (Table 13) at 28 d, there was still no significant difference in weight, nor
was there any difference in diameter of tibiae from SA and CF diets. Chicks fed SBO type diet
showed significant differences in force and energy. There was no significant (p<0.01) difference
in bone wall thickness between CF, CA, SA, and MO extracted tibiae, but CF and SA was
different from MA.
At 14 DOA, there was no significant difference in tibia weight or length according to
maternal diet (Table 14). Male tibiae from the diet CA showed significant differences in force

18
and stress when compared to all the other maternal diets. Those chicks fed a diet containing CF
or SBO was significantly high in energy when compared to those chicks fed MO treatments. As
shown in (Table15) at 28 DOA, tibia from chicks fed CA showed significant (p<0.01)
differences in tibia length, but not weight when compared to all other treatments. The tibiae
from a CF diet showed significantly higher bone wall thickness when compared to the remaining
dietary treatments.
At 14 DOA, tibiae from female chicks fed a SA diet showed higher tibia weights, and
SBO displayed significantly higher tibia length among all other maternal diets (Table 16). Force
and energy were significantly (p<0.01) higher in tibia from CF fed chicks. Also at 14 DOA,
stress was significantly (p<0.01) higher in tibia of MO fed chicks. At 28 d, tibia weight and
diameter were significantly (p<0.01) greater in those chicks in which their dietary treatment was
CF. The tibia from CF fed chicks showed significantly higher levels of force and stress when
compared to al other maternal diets (Table 17).

19
DISCUSSION
Fatty acid composition of CF, MO, and SBO is well documented (Dansky, 1961; Atteh et
al., 1989; Chanmugan et al., 1994; Scaife et al., 1994). Results of this study confirmed the
observation of these authors. SBO was rich in 18:2n6, 18:3n3, total PUFA and n-6 fatty acids
whereas MO was rich in 22:5n3, 22:6n3 and n-3 fatty acids. The only n-3 fatty acid not present
in large amounts is 18:3n3. The fatty acid profile of the MO and SBO diets were in accordance
with other researchers (Machlin et al., 1962; Skinner et al., 1990; Lin et al., 1991).
Addition of chicken fat into broiler breeder diets caused an increase in total MUFA. The
n-3 and n-6 fatty acids are highly dependent on the ratio of 18:2n6 and 18:3n3 in the diet
(Elswyk et al., 1994). Dietary lipid composition significantly altered the fatty acid composition
of all the tissues examined. When rich in n-3 fatty acids were included in the diet of hens, there
was a significant (P<0.05) incorporation of long chain EPA (22:5n3) and DHA (22:6N3) with a
concomitant reduction in arachidonic acid (20:4n6) in the liver and eggs when compared to
feeding CF or SBO. This agrees with the results of Cherian et al. (1996).
As reported by Hulan et al. (1988), Simopouls (1988) and Chanmugan et al. (1991),
desaturase enzymes prefer n-3 acids as a substrate over n-6 fatty acids. Therefore, n-3 fatty acids
are more readily metabolized by the liver than n-6 fatty acids resulting in a decrease of 20:4n6
acids and subsequent prostoglandin production (Cherian et al., 1996). Addition of soybean oil
(SBO) elevated levels of 18:2n6 and decreased 20:2n6, particularly when SBO was the sole lipid
supplement. The proportions of 20:5n3, 22:5n3, and 22:6n3 were significantly reduced in the
liver tissue from hens fed SBO supplemented diets (Scaife et al., 1993). Incorporation of MO
into the breeder hen diet significantly increased the concentration of long chain n-3 fatty acids
and significantly decreased the amounts of 20:4n6 acids within 2 wk of production. These
effects lasted throughout the entire production period.
The major changes in egg yolk fatty acids by dietary linolenic acid (LNA) can be
summarized as an increase in polyunsaturated fatty acids (PUFA) and a decrease in mono-
unsaturated fatty acids (MUFA). However, the increase in PUFA in the yolk lipid from LNA
diets was mainly caused by the increase in n-3 fatty acids 18:3n3, 22:5n3, and 22:6n3 (Ahn et
al., 1995). The maternal tissue fatty acid composition paralleled that of the dietary source. In
this study, levels of 22:5n3 and 22:6n3 in all groups fed menhaden oil (MO) were significantly
higher than the groups fed the same level of either CF or SBO. Similarly, levels of
20
docosapentaenoic acid (22:6n3) were higher in controls fed the same levels of corn oil than
groups fed linseed oil (Chanmugam et al., 1992). Lipids of all groups fed menhaden oil had
significantly higher 22:5n3 to 20:4n6 ratios compared with linseed and corn oil groups fed the
same levels of oil.
The present study indicates that the inclusion of n-3 or n-6 fatty acids in the laying hen
diet can enrich the egg yolk lipids and tissue lipids of the hatched chicks with n-3 and n-6 fatty
acids, respectively. The increased supply of dietary 18:3n3 tends to increase the levels of the
long chain n-3 fatty acids such as EPA, DPA, DHA associated with a corresponding reduction in
the level of 20:4n6 in the egg yolk (Cherian and Sim, 1992).
Antioxidants play an integral role in providing a defense mechanism against the
damaging effects of reactive free radical and singlet oxygen. Diet is an important source of
antioxidants that falls into two classes: water soluble and lipid-soluble (Bhagavan and Nair,
1996). Amino acids have been reported to be either antioxidants or prooxidants or, to have no
effect on the oxidation of lipids. Alaiz et al. (1995) reported that addition of oxidized
lipids/amino acids reaction products (OLAARP) efficiently reduced peroxidation in a soybean
oil diet. In this study, chicks fed diets containing antioxidants showed no significant differences
in parameters measured. Alaiz et al. (1995) was not able to find significant differences in growth
rate as a result of employing either butylhydroxytoluene (BHT) or ethoxyquin (EQ) in broiler
feed. Male tibia parameters at 14 d showed no significant differences. Female tibia followed
the same result stated for the male tibia.
Reports on the influence of maternal fatty acids on yolk composition are numerous, but
reports on the influence of those fatty acids on total yolk or egg weight are few. Vilchez et al.
(1992) reported that hens fed MO diets laid eggs which weighed significantly (P<0.01) less than
eggs from hens fed CF diets. Quails fed diets enriched with linoleic acid (18:2n6) produced eggs
with yolk that weighed significantly (P<0.05) more than those from quail hens fed diet high in
18:0 or 14:0 acids. Unfortunately, total egg weight and quail chick weight was not reported
(Vilchez et al., 1992).
Some of the fatty acids of yolk lipid from different strain of hens varied significantly.
Among the fatty acids, 18:1n9 and 18:2n6 had large variation. As n-3 fatty acids in eggs
increased, the percentage incorporation of those fatty acids to the progeny tissue tended to

21
decrease. The higher level of LNA in the egg from n-3 PUFA diet did not cause any change in
the percentage incorporation of LNA (Vilchez et al., 1992).
Fatty acids present in the day-old chicks reflected those contained in the egg yolk, and,
therefore reflected those of the maternal diet. Alterations in fatty acids composition of egg yolk
can have a dramatic impact on embryonic development (Donaldson, 1981). This has been
reported from current studies among embryos from menhaden oil (MO) fed hens. Dietary oils
significantly (P<0.05) altered the fatty acid composition of all the tissues examined. When n-3
fatty acid rich in MO was included in the diet, a significant (P<0.05) incorporation of longer
chain EPA and DHA with reduction in arachidonic acid (20:4n6) was observed in the liver and
eggs (Cherian et al., 1996). Long chain n-3 fatty acids (FA) were not detected in the adipose
tissue of many of the birds except those fed diets containing menhaden oil.
Body weight had been reported to correlate with both tibia breaking strength and bone
density. A significant relationship was also found between body weight (BW) and dry tibia
weight (r=.66, P<0.0001) (Frost and Roland, 1990). Adding higher levels of 1, 25-(OH)2 D3
caused highly significant linear increases in tibia breaking strength, tibia weight, and bone
density.
The growth promoting properties of SBO were reported in Scaife et al. (1994) and
confirmed by the data from this experiment. The presence of increased levels of 18:2n6 acid,
which is rapidly metabolized to 20:4n6 acid, then enters the cyclooxygenase pathway to produce
prostaglandins which stimulate growth rate and bone development in animals (Lefkowth et al.,
1986; Scaife et al., 1994). Atteh et al. (1984) did a study on the effect of fats in broilers chick
diets and reported that soybean oil (SBO) fed chicks exhibited a significant (P<0.01) decrease in
bone ash.
Arachidonic acid (20:4n6) is a precursor for prostaglandins (PGI2 and PGE2) which
stimulate bone growth. Chicks from SBO and CF fed hens had (P<0.01) higher levels of 20:4n6
acid than the same chick tissue from MO fed hens. Prostaglandin E2 and I2 have been known to
have a positive effect on growth and bone development (Friedman, 1981; Croft et al., 1985;
Ackerman, 1995). Male chick parameter exhibited very little significant differences at 14 day of
age.
At 14 DOA, tibia diameter of hens fed CF and MO diet were larger than those fed a SBO
treatment. At d 28, male chick parameters exhibited significant differences. Chicks from hens

22
fed a SBO and CF diet had heavier tibia weights than those from hens fed a MO diet. These data
corroborated a study by (Scaife et al. 1994). Since SBO and CF contained higher levels of
arachidonic (20:4n6) acid and hence more prostaglandins, the present results should be expected.
Similarly, chick tibia from the SBO and CF diets were significantly thicker than MO maternal
diet tibiae. The diameter continued to be significantly larger in those chicks fed a CF and SBO
maternal diet. Shear force showed significant differences in those chick fed a diet containing
soybean oil. Shank measurements were larger in those chicks fed a CA maternal diet when
compared to all other treatments.
In this study, male chick tibia parameters exhibited significant differences. At 14 DOA,
there were no significant differences in tibia weight and length. Both shear force and stress were
significantly increased in those chicks fed a CA maternal diet. By 28 DOA, the SBO maternal
diet produced a thicker tibia than both CF and MO maternal diet tibiae. Similarly, chick tibia
from the SBO maternal diet were significantly (P<0.01) thicker than MO and CF maternal diet
tibiae. Throughout the entire grow out period, there was no significant difference detected in
tibia length according to the maternal diet.
In this study, tibiae of females chicks were weighed at 14 and 28 days of age (DOA) and
the tibiae from the hens fed the SBO and CF diet were significantly (P<0.01) heavier than tibiae
from MO maternal diets. The length and diameter of female chick tibiae were significantly
(P<0.01) different at these same time periods confirming results by Frost and Roland (1991). At
both 14 and 28d, shear force and energy was extremely high in those female tibia in which their
maternal diet was CF. Shank and keel was significantly larger in those female chicks fed a CA
maternal diet.

23
IMPLICATIONS
Non-infectious skeletal diseases cause the commercial broiler industry millions of dollars
annually. Poultry nutritionists are being challenged to develop new diets that would maximize
the broilers genetic potential and reduce related bone stress disorders. If a maternal dietary
influence on bone growth and development can be found, poultry nutritionist could formulate a
more precise ration that would meet the needs of the commercial broiler industry. Reducing the
occurrences of these skeletal diseases by dietary mean would increase the overall health of the
birds and decrease the amount of revenue lost yearly due to these abnormalities. This study
shows that if dietary fats particularly soybean oil (SBO) and chicken fat (CF) into the broiler
breeders diet it would increase egg and body weight and help supply those essential fatty acids
need for growth and development.

24
Table 1. Broiler Breeder Hen Diets
Diets
Ingredient CF CA SBO SA MO MA
Corn Meal 58.70 58.70 58.70 58.70 58.70 58.70Soybean Meal 20.50 20.50 20.50 20.50 20.50 20.50Wheat Middlings 8.65 8.65 8.65 8.65 8.65 8.65Limestone 6.53 6.53 6.53 6.53 6.53 6.53Fatγ
Chicken Fat 3.00Chicken_Antioxidant 3.00Soybean Oil 3.00Soybean + Antioxidant 3.00Menhaden Oil 3.00Menhaden + Antioxidant 3.00
Ethoxyquin 0.0025 0.0025 0.0025Defluorinated P 1.86 1.86 1.86 1.86 1.86 1.86Salt 0.25 0.25 0.25 0.25 0.25 0.25DL-Methionine 0.18 0.18 0.18 0.18 0.18 0.18Lysine HCL 0.03 0.03 0.03 0.03 0.03 0.03Baciform 50α 0.05 0.05 0.05 0.05 0.05 0.05Vitamin/Mineral Mixβ 0.25 0.25 0.25 0.25 0.25 0.25
1CF = Chicken Fat; CA =Chicken + Antioxidant; SBO = Soybean oil; SA = Soybean + Antioxidant; MO = Menhaden Oil; MA =Menhaden + Antioxidant. Ethoxyquin (0.0025%) was added directly to the fats in order to prevent oxidation prior to mixing. αBaciform 50 is a coccidiostat.
β Supplied by Hoffman-LaRoche, formulated to supply the following to each kilogram of finished feed: vitamin A, 11,000 IU;cholecalciferol, 2,750 ICU; vitamin E, 22 IU; riboflavin, 7.7 mg; menadione sodium bisulfite, 4.96 mg; niacin, 38.6 mg; d-pantothenicacid, 13.2 mg; folic acid, 1.1 mg, vitamin B12 , 13µg; biotin, 110µg; choline chloride, 441 mg; thiamine, 1.8 mg; pyridoxine, 4.7 mg;ethoxyquin, 55 mg; manganese, 55mg; zinc, 50 mg; iron, 30 mg; copper, 5 mg; iodine, 0.5 mg; and selenium, 0.1 mg.

25
Table 2. Broiler Chick Commercial Starter Diet1
Ingredients (%)
Corn Meal 60.45Soybean Meal 23.45Stabilized Animal Fat 4.00Fish Meal 2.50Corn Gluten Meal 4.00Alfalfa Meal 2.00Defluorinated Phosphate 1.50Limestone 1.00Salt 0.40Trace Mineral Mixβ 0.10Vitamin Premixδ 0.50Baciform 50α 0.05
1All chicks were fed this diet regardless of maternal diet.βProvides per kilogram of diet: cobalt, 450 mg; copper, 5 g; iodine, 2 g;
manganese, 120 g, zinc, 120 g; iron, 40 g, with calcium carbonate as a diluent.δProvides per kilogram of diet: vitamin A, 8.81x10⁵ USP; vitamin D3, 4.41x10⁵;
vitamin E, 220 IU; menadione sodium bisulfite complex, 350 g; menadione, 180 mg;riboflavin, 660 mg; d-calcium pantothenate, 1.3 g; d-pentothenic acid, 1.2 g; niacin,6.6 g; choline choride, 50 g; choline, 43 g; vitamin B12, 1 g; selenium, 40 g; methionine,
100 g; folic acid, 60 mg; ethoxyquin, 25 g. αBaciform 50 is a coccidiostat.

26
TABLE 3. FATTY ACID COMPOSITION OF BROILER BREEDER HEN UTERUS 50 WOA1
Diets
(µµg/mg tissue)
FATTY ACID CF CA MO MA SBO SA
14:1n5 12.82A ± 3.09 0.0B ± 0.0 1.37B ± 0.90 0.48B ± 0.48 0.63B ± 0.63 0.00B ± 0.0015:0 9.46 ± 1.79 4.90 ± 1.19 5.92 ± 0.22 7.80 ± 0.90 6.54 ± 1.64 6.07 ± 0.7316:0 2505.22A ± 320.70 1476.86BC ± 183.23 857.05C ± 70.08 896.99C ± 115.34 1977.76AB ± 369.56 1103.44C ± 194.57t16:1n7 126.47A ± 27.67 58.71B ± 11.18 19.24B ± 7.88 62.12B ± 13.32 57.70B ± 18.17 34.96B ± 9.4216:1n7 55.95 ± 10.26 25.19 ± 6.35 74.45 ± 29.47 13.57 ± 1.66 22.01 ± 2.68 126.35 ± 107.5317:0 75.80 ± 13.43 41.19 ± 9.36 45.41 ± 6.93 48.29 ± 7.03 34.21 ± 7.76 175.57 ± 114.0518:0 2587.95ab ± 193.64 2859.23a ± 776.84 1963.7abc ± 208.45 2103.64abc ± 255.75 1498.82bc ± 267.54 1187.20c ± 277.8218:1 382.50a ± 56.43 241.60b ± 35.53 235.03b ± 39.34 197.06b ± 27.80 196.88b ± 31.30 194.86b ± 33.4718:2n6 2478.48AB ± 628.38 2017.74AB ± 420.10 1502.75B ± 150.99 1635.21B ± 246.70 3701.90A ± 558.79 3242.03AB ± 983.4318:3n6 7.08 ± 5.15 0.00 ± 0.00 5.03 ± 2.89 1.37 ± 0.90 1.56 ± 1.56 0.00 ± 0.0018:3n3 82.28A ± 21.80 25.98BC ± 14.97 6.98C ± 2.59 33.76BC ± 13.13 29.13BC ± 7.40 46.31AB ± 11.9520:0 289.39A ± 86.25 95.16B ± 24.75 53.37B ± 12.82 51.97B ± 10.81 78.36B ± 17.71 94.29B ± 23.4420:1n9 164.64 ± 59.00 99.69 ± 66.05 98.40 ± 40.47 174.05 ± 53.80 99.88 ± 58.56 34.79 ± 25.4820:2n6 230.67a ± 108.72 133.92ab ± 40.07 34.90b ± 14.54 31.92b ± 11.03 91.15b ± 44.86 47.78b ± 11.6220:3n6 4274.50A ± 544.02 4324.94A ± 482.39 1972.49B ± 306.24 2183.43B ± 240.23 5026.57A ± 545.04 5715.09A ± 847.1220:4n6 2182.40AB ± 740.34 1808.97AB ± 54.14 771.33B ± 293.50 1714.72AB ± 128.24 2990.23A ± 929.14 1195.86AB ± 485.7122:5n3 266.34B ± 131.73 162.04B ± 56.7 947.52A ± 105.78 1238.17A ± 186.67 202.84B ± 62.07 361.63B ± 141.3422:6n3 3.01B ± 3.01 2.82B ± 2.01 10.53B ± 2.24 26.74A ± 5.32 1.93B ± 0.99 4.77B ± 3.10TOTS 5467.83A ± 456.15 4477.37AB ± 936.59 2925.52BC ± 262.69 3108.72BC ± 375.64 3595.74BC ± 359.28 2566.58C ± 368.40TOTM 742.40 ± 92.45 425.21 ± 78.44 428.52 ± 42.09 447.29 ± 81.66 377.12 ± 89.05 390.98 ± 165.47TOTP 10967.2A ± 2140.22 8476.4ABC ± 628.01 5250.6C ± 632.45 6872.5BC ± 576.60 10127.8AB ± 1288.52 9187.9AB ± 1326.46
1Values represent mean + standard error; N=7 for CF; 9 for CA; 9 for MA; 8 for MO; 9 for SA; 9 for SBO.2Dietary treatments represent the maternal diet; CF = Chicken Fat; CA = Chicken + Antioxidant; SBO = Soybean Oil; SA = Soybean +Antioxidant; MO = Menhaden Oil; MA = Menhaden + Antioxidant; TOTS = Total Saturated Fatty Acid; TOTM = Total Monounsaturated FattyAcid; TOTP = Total Polyunsaturated Fatty Acid.A-C Means within a row lacking the same superscript differ significantly (P<0.01).a-c Means within a row lacking the same superscript differ significant (P<0.05).

27
TABLE 4. FATTY ACID COMPOSITION OF BROILER BREEDER HEN HEART 50 WOA1
Diets
(µµg/mg tissue)
FATTY ACID CF CA MO MA SBO SA14:1n5 27.82 ± 4.64 14.68 ± 4.34 20.58 ± 4.03 22.44 ± 9.81 12.68 ± 2.86 10.30 ± 3.6115:0 13.08abc ± 1.52 5.43c ± 1.54 16.90ab ± 2.56 18.43a ± 2.81 8.60bc ± 3.53 12.94abc ± 4.5616:0 5428.79A ± 511.55 3568.23B ± 383.56 3913.56B ± 206.38 3848.11B ± 380.46 3295.42B ± 200.48 4144.00B ± 265.08t16:1n7 117.67a ± 19.21 73.87b ± 14.61 65.54b ± 8.15 74.07b ± 20.29 48.17b ± 8.70 70.14b ± 11.0616:1n7 617.54A ± 103.81 314.90B ± 70.14 356.27B ± 40.62 419.76AB ± 122.10 201.35B ± 19.80 261.47B ± 67.4617:0 38.89 ± 4.21 32.06 ± 2.68 55.84 ± 2.56 52.10 ± 3.52 33.82 ± 1.56 44.51 ± 2.4418:0 2830.91 ± 155.05 2539.35 ± 28.14 2607.08 ± 81.32 2580.92 ± 239.54 2684.71 ± 111.45 2813.95 ± 111.5418:1 4912.56A ± 597.40 2551.79B ± 354.26 2443.19B ± 385.89 1920.88B ± 431.79 1981.64B ± 169.74 2919.62B ± 397.1218:2n6 4221.71A ± 330.73 3189.15B ± 252.79 3258.40B ± 149.75 2708.49B ± 156.39 4027.30A ± 264.83 4721.18A ± 256.4318:3n3 48.17A ± 10.01 16.53B ± 6.71 9.21B ± 3.09 5.64B ± 2.22 5.53B ± 2.43 16.95B ± 8.9520:0 100.36 ± 14.09 37.64 ± 13.18 54.84 ± 9.54 38.70 ± 15.09 121.16 ± 21.26 164.74 ± 27.5420:1n9 10.35b ± 5.26 25.84a ± 5.55 4.45b ± 2.99 6.28b ± 4.94 7.42b ± 5.22 5.63b ± 3.7820:2n6 339.92A ± 49.87 218.09AB ± 49.50 168.21B ± 55.21 100.79B ± 48.00 75.68B ± 23.59 177.22B ± 44.2220:4n6 183.14B ± 42.14 269.62B ± 36.51 414.96A ± 56.77 269.29B ± 47.07 140.34B ± 24.23 234.22B ± 54.8022:4n6 4188.52A ± 183.60 4233.24A ± 168.82 3176.25B ± 188.82 2954.98B ± 224.55 4179.94A ± 175.36 4108.29A ± 195.0122:5n3 27.51B ± 14.23 12.45B ± 6.78 84.08A ± 17.62 81.42A ± 16.82 3.67B ± 1.95 12.86B ± 4.3522:6n3 77.99B ± 18.18 72.92B ± 28.75 1574.51A ± 235.77 1453.81A ± 216.05 109.2B ± 43.15 156.58B ± 59.82TOTS 8412.05a ± 658.09 6182.72b ± 513.55 6648.23b ± 328.79 6538.28b ± 532.63 6143.73b ± 302.76 7180.16ab ± 380.01TOTM 5685.95A ± 708.50 2981.10B ± 444.08 2890.05B ± 403.14 2443.45B ± 556.52 2251.28B ± 176.86 3267.18B ± 465.96TOTP 12535.30A ± 674.33 11574.92AB ± 773.48 7365.95C ± 371.17 6245.16C ± 388.81 10312.67B ± 533.29 12220.03AB ± 995.34
1Values represent mean ± standard error; N=9 for CF; 9 for CA; 8 for MA; 9 for MO; 9 for SA; 9 for SBO.2Dietary treatments represent the maternal diet; CF = Chicken Fat; CA = Chicken + Antioxidant; SBO = Soybean Oil; SA = Soybean +Antioxidant; MO = Menhaden Oil; MA = Menhaden + Antioxidant; TOTS = Total Saturated Fatty Acid; TOTM = Total Monounsaturated FattyAcid; TOTP = Total Polyunsaturated Fatty Acid.A-C Means within a row lacking the same superscript differ significantly (P<0.01).a-c Means within a row lacking the same superscript differ significant (P<0.05).

28
TABLE 5. FATTYACID COMPOSITION OF BROILER BREEDER HEN LIVER 50 WOA1
Diets
(µµg/mg tissue)
FATTYACID
CF CA MO MA SBO SA
14:1n5 21.22 ± 8.52 11.69 ± 3.68 28.58 ± 8.80 40.26 ± 12.14 11.25 ± 2.73 20.08 ± 4.6915:0 19.58C ± 3.53 11.54C ± 0.99 34.79B ± 5.32 49.42A ± 8.34 14.19C ± 3.06 18.89C ± 3.3316:0 11359.71 ± 2095.09 7329.56 ± 564.30 9617.99 ± 1553.72 13275.21 ± 2196.46 8806.03 ± 1220.67 11524.72 ± 1847.73t16:1n7 385.27 ± 141.86 141.06 ± 19.11 191.84 ± 41.50 385.21 ± 96.07 178.03 ± 54.15 215.48 ± 48.8016:1n7 793.57 ± 278.23 303.51 ± 24.47 594.48 ± 130.04 1135.67 ± 366.00 308.86 ± 74.81 1236.64 ± 627.1217:0 114.32B ± 21.59 66.02B ± 6.13 131.40B ± 24.02 206.27A ± 42.29 90.39B ± 12.95 114.43B ± 16.3218:0 5441.12 ± 734.37 3358.84 ± 256.63 3518.24 ± 473.80 6147.5 ± 1420.77 4750.58 ± 690.22 4478.25 ± 738.5618:1 13829.66 ± 4205.41 4921.52 ± 660.36 9403.09 ± 2104.42 17382.58 ± 5257.24 6846.88 ± 2035.17 9193.12 ± 2601.6218:2n6 3836.4B ± 637.51 2608.8B ± 408.18 2699.50B ± 386.20 3760.50B ± 658.01 4321.1AB ± 799.68 5770.9A ± 599.4018:3n3 54.06B ± 14.21 54.78B ± 28.06 64.35B ± 14.05 92.39B ± 31.99 149.56B ± 32.56 278.55A ± 50.6820:2n6 21.39 ± 14.72 0.0 ± 0.0 64.35 ± 47.47 17.25 ± 12.90 5.26 ± 3.68 24.65 ± 16.3120:3n6 220.24 ± 67.49 87.66 ± 24.06 77.69 ± 28.77 178.38 ± 60.43 74.71 ± 34.22 137.65 ± 50.7620:4n6 93.29 ± 46.96 56.70 ± 13.09 42.66 ± 39.08 24.39 ± 12.25 97.69 ± 20.56 80.44 ± 15.9022:4n6 3794.50B ± 1582.34 2180.19B ± 190.51 775.36B ± 154.00 2535.91B ± 1293.77 9088.20A ± 3128.92 2270.14B ± 105.1922:5n3 267.60B ± 203.27 77.70B ± 29.74 2005.1A ± 1283.71 915.60AB ± 186.85 305.90B ± 82.39 196.20B ± 163.1322:6n3 2942.61 ± 725.03 1818.52 ± 228.75 93.86 ± 19.28 204.21 ± 58.70 2440.14 ± 293.91 4050.03 ± 1311.39TOTS 16934.75 ± 2750.56 10765.97 ± 807.95 13302.43 ± 2043.49 19678.50 ± 3568.54 13661.20 ± 1621.65 16136.30 ± 2512.17TOTM 15064.62 ± 734.71 5452.59 ± 703.68 10282.35 ± 2290.46 19036.13 ± 5738.54 7494.60 ± 2178.51 10943.89 ± 2947.49TOTP 11822.29B ± 6244.06 7520.8BC ± 429.78 5720.50C ± 1330.46 7052.1BC ± 1689.06 10037.15BC ± 728.91 19446.98A ± 3031.81
1Values represent mean± standard error; N=9 for CF; 9 for CA; 9 for MA; 8 for MO; 9 for SA; 9 for SBO.2Dietary treatments represent the maternal diet; CF = Chicken Fat; CA = Chicken + Antioxidant; SBO = Soybean Oil; SA = Soybean +Antioxidant; MO = Menhaden Oil; MA = Menhaden + Antioxidant; TOTS = Total Saturated Fatty Acid; TOTM = Total Monounsaturated FattyAcid; TOTP = Total Polyunsaturated Fatty Acid.A-C Means within a row lacking the same superscript differ significantly (P<0.01).

29
TABLE 6. FATTY ACID COMPOSITION OF BROILER BREEDER HEN YOLK 2 WK OF LAY (HATCH 1) 1
Diets
(µµg/mg tissue)
FATTY ACID CF CA MO MA SBO SA14:1n5 13.61BC ± 2.56 8.87C ± 1.42 22.59A ± 3.07 21.18AB ± 4.89 10.30C ± 1.76 10.61C ± 1.3815:0 7.24B ± 1.32 5.30B ± 0.69 15.70A ± 1.72 11.82A ± 2.69 4.95B ± 1.07 5.44B ± 0.6416:0 4264.52 ± 556.84 3786.77 ± 257.72 4518.01 ± 426.23 4087.24 ± 407.79 4355.31 ± 453.08 3897.89 ± 265.41t16:1n7 81.82 ± 11.07 641.67 ± 461.17 63.75 ± 15.78 131.80 ± 70.06 93.79 ± 25.48 82.02 ± 14.4816:1n7 450.33 ± 69.02 203.54 ± 62.28 468.39 ± 41.88 330.56 ± 84.06 266.66 ± 41.43 258.12 ± 43.3317:0 29.38b ± 3.68 857.99a ± 388.49 46.90b ± 4..38 254.36b ± 156.52 44.66b ± 17.17 289.60ab ± 260.4618:0 1542.88AB ± 310.30 2461.92A ± 626.09 1007.14B ± 108.37 751.56B ± 116.65 1039.70B ± 169.21 1236.90B ± 334.1518:1 3820.16 ± 912.28 1178.54 ± 711.22 3552.37 ± 720.10 1443.72 ± 667.73 3035.02 ± 614.90 2012.32 ± 664.7118:2n6 1323.3BC ± 212.78 637.2D ± 207.86 1154.3BCD ± 121.42 774.0CD ± 189.20 1960.0A ± 186.44 1682.70AB ± 250.2218:3n6 1323.28 ± 212.78 637.19 ± 207.86 1154.3 ± 121.42 774.04 ± 189.20 1689.70 ± 275.03 1682.68 ± 250.2218:3n3 34.97BC ± 6.42 11.94C ± 3.92 50.51B ± 15.71 31.09BC ± 10.55 86.26A ± 13.33 86.97A ± 13.8920:1n9 34.97 ± 6.42 11.94 ± 4.87 50.81 ± 5.19 31.09 ± 9.05 86.26 ± 13.33 86.97 ± 13.9820:2n6 24.73 ± 14.93 35.67 ± 24.24 15.71 ± 15.71 6.68 ± 6.68 10.53 ± 10.53 4.28 ± 4.2820:3n6 38.15 ± 13.22 23.25 ± 10.29 32.41 ± 18.43 44.02 ± 17.86 39.82 ± 21.37 36.22 ± 16.9520:4n6 1.76 ± 1.16 10.89 ± 8.70 3.67 ± 2.05 2.33 ± 1.61 13.23 ± 5.69 12.87 ± 5.4622:4n6 1622.17 ± 1138.83 4086.92 ± 1617.96 2488.38 ± 1649.22 2493.80 ± 1643.41 23.87 ± 13.26 111.64 ± 99.1522:6n3 366.69 ± 154.31 166.71 ± 111.56 1.12 ± 0.82 25.79 ± 24.24 167.16 ± 39.59 129.06 ± 52.37TOTS 5844.02 ± 666.69 7111.99 ± 723.90 5587.72 ± 536.30 5105.10 ± 506.23 5444.62 ± 537.67 5429.84 ± 434.89TOTM 4400.91 ± 982.33 2044.58 ± 754.69 4157.93 ± 759.88 1949.32 ± 694.49 3492.05 ± 631.96 2450.06 ± 683.72TOTP 9421.71ab ± 1065.69 7881.98ab ± 1252.41 11529.32a ± 1017.43 10230.86a ± 1135.87 5761.09b ± 1248.01 9160.49ab ± 1495.98
1Values represent mean + standard error; N=9 for CF; 9 for CA; 9 for MA; 8 for MO; 9 for SA; 9 for SBO.2Dietary treatments represent the maternal diet; CF = Chicken Fat; CA = Chicken + Antioxidant; SBO = Soybean Oil; SA = Soybean +Antioxidant; MO = Menhaden Oil; MA = Menhaden + Antioxidant; TOTS = Total Saturated Fatty Acid; TOTM = Total Monounsaturated FattyAcid; TOTP = Total Polyunsaturated Fatty Acid.A-D Means within a row lacking the same superscript differ significantly (P<0.01).a-c Means within a row lacking the same superscript differ significant (P<0.05).

30
TABLE 7. FATTY ACID COMPOSITION OF BROILER BREEDER HEN YOLK 24 WK OF LAY (HATCH 2) 1
Diets
FATTY ACID CF CA
(µµg/mg tissue)
MO MA SBO SA
14:1n5 4.04C ± 1.12 5.45BC ± 0.91 13.81A ± 2.83 10.09AB ± 1.97 4.10C ± 1.34 2.62C ± 0.7615:0 4.96B ± 0.67 5.27B ± 0.84 12.77A ± 1.33 10.67A ± 1.40 5.39B ± 0.84 4.96B ± 0.5216:0 3978.62 ± 225.67 4240.24 ± 260.62 4356.98 ± 405.00 3972.00 ± 400.25 4681.12 ± 273.10 3788.31 ± 312.63t16:1n7 78.34 ± 6.89 80.26 ± 10.48 87.57 ± 11.78 57.14 ± 10.55 81.57 ± 11.71 58.48 ± 7.4516:1n7 310.33 ± 21.65 364.26 ± 29.99 383.47 ± 61.96 315.72 ± 44.00 266.56 ± 25.37 197.29 ± 16.2917:0 29.76B ± 1.46 30.37B ± 2.12 50.31A ± 5.72 39.98B ± 2.47 29.50B ± 4.99 30.20B ± 2.2018:0 1171.84ab ± 79.52 1145.39ab ± 107.12 1031.71b ± 109.29 911.84b ± 96.43 1356.30a ± 67.52 1114.11ab ± 92.3918:1 4067.58 ± 774.92 4631.07 ± 641.46 4364.35 ± 679.31 4106.02 ± 429.16 4153.29 ± 812.80 3299.60 ± 675.0118:2n6 1317.47B ± 83.98 1486.33B ± 103.15 1191.60B ± 120.71 1174.14B ± 123.57 2118.20A ± 111.49 1998.97A ± 182.2318:3n3 31.33B ± 3.75 35.31B ± 4.49 40.08B ± 7.16 33.54B ± 8.04 108.22A ± 6.02 102.51A ± 12.9320:2n6 0.00 ± 0.00 0.00 ± 0.00 0.00 ± 0.0 0.00 ± 0.00 0.00 ± 0.00 0.00 ± 0.0020:3n6 28.27 ± 11.23 37.79 ± 19.60 11.03 ± 7.42 0.00 ± 0.00 3.28 ± 3.28 17.30 ± 8.8820:4n6 0.00 ± 0.00 3.90 ± 1.56 0.00 ± 0.00 1.53 ± 1.53 1.99 ± 1.36 2.49 ± 1.8822:4n6 7.46 ± 5.50 8.69 ± 6.17 2.66 ± 2.66 7.17 ± 5.10 0.00 ± 0.00 11.38 ± 5.73TOTS 5185.20 ± 303.27 5421.28 ± 671.19 5451.79 ± 515.48 4934.50 ± 496.10 6073.45 ± 336.86 4937.58 ± 398.55TOTM 4491.63 ± 798.37 5116.37 ± 671.19 4889.30 ± 745.13 4522.53 ± 478.89 4613.76 ± 832.62 3660.53 ± 690.79TOTP 10510.60 ± 1573.68 8575.09 ± 1368.90 13557.49 ± 632.14 10431.47 ± 1857.14 12202.48 ± 1833.51 9208.38 ± 1623.91
1Values representµg/ mg tissue + SEM; N=9 for CF; 9 for CA; 9 for MA; 8 for MO; 9 for SA; 9 for SBO.2Dietary treatments represent the maternal diet; CF = Chicken Fat; CA = Chicken + Antioxidant; SBO = Soybean Oil; SA = Soybean +Antioxidant; MO = Menhaden Oil; MA = Menhaden + Antioxidant; TOTS = Total Saturated Fatty Acid; TOTM = Total Monounsaturated FattyAcid; TOTP = Total Polyunsaturated Fatty Acid.A-C Means within a row lacking the same superscript differ significantly (P<0.01).a-b Means within a row lacking the same superscript differ significant (P<0.05).

31
TABLE 8. MALE BODY WEIGHTS ACCORDING TO MATERNAL DIET (TRIAL 1)1
Age CF CA MO MA SBO SA
(g)
1 d 37.16AB ± 0.42 36.80BC ± 0.32 35.80C ± 0.43 36.03BC ± 0.33 36.04BC ± 0.41 38.23A ± 0.38
7 d 107.83B ± 1.32 107.18B ± 0.18 108.03B ± 2.13 110.22B ± 1.74 112.45B ± 1.57 119.35A ± 1.66
14 d 318.66A ± 4.11 321.75A ± 4.20 314.13AB ± 5.44 298.87C ± 4.66 323.76A ± 3.74 303.85BC ± 4.12
21 d 646.63ab ± 10.26 628.80b ± 10.75 625.67b ± 14.03 616.56b ± 13.28 661.64a ± 9.40 638.80ab ± 12.59
28 d 1112.45A ± 19.15 1108.08A ±15.40 1065.12B ± 22.12 963.72B ± 27.26 1119.08A ± 14.30 1115.36A ± 23.11
1Dietary treatments represent the maternal diet; CF = Chicken Fat; CA = Chicken + Antioxidant; SBO = Soybean Oil; SA = Soybean + Antioxidant; MO = Menhaden Oil; MA = Menhaden + AntioxidantA-C Means within a row lacking the same superscript differ significantly (P<0.01).a-c Means within a row lacking the same superscript differ significant (P<0.05).

32
TABLE 9. MALE BODY WEIGHTS ACCORDING TO MATERNAL DIET (HATCH 2)1
Age CF CA MO MA SBO SA
(g)
1 d 44.15AB ± 0.40 43.45B ± 0.33 41.78B ± 0.46 43.08B ± 0.39 43.64AB ± 0.37 44.84A ± 0.36
7 d 129.33AB ± 1.61 123.68C ± 1.87 116.21C ± 1.57 123.83BC ± 1.82 128.73AB ± 1.68 133.43A ± 1.52
14 d 364.54A ± 5.13 359.24A ± 4.21 335.17B ± 4.12 332.93B ± 4.92 358.08A ± 3.80 357.27A ± 4.63
21 d 741.27A ± 10.42 737.19AB ± 9.45 671.93C ± 14.07 660.50C ± 15.55 734.00AB ± 7.85 717.07B ± 11.80
28 d 1215.59B ± 19.78 1221.64AB ± 18.18 1138.28B ± 20.43 1036.92C ± 32.39 1225.87A ± 18.46 1221.96AB ± 20.43
1Dietary treatments represent the maternal diet; CF = Chicken Fat; CA = Chicken + Antioxidant; SBO = Soybean Oil; SA = Soybean + Antioxidant; MO = Menhaden Oil; MA = Menhaden + AntioxidantA-C Means within a row lacking the same superscript differ significantly (P<0.01).

33
TABLE 10. FEMALE BODY WEIGHTS ACCORDING TO MATERNAL DIET (HATCH 3)1
Age CF CA MO MA SBO SA
(g)
1 d 48.08A± 0.47 46.76B ± 0.44 45.09C ± 0.32 46.10BC ± 0.39 46.11BC± 0.55 47.44AB ± 0.38
7 d 125.89 ± 1.48 128.95 ± 1.58 125.78 ± 1.58 123.09 ± 2.08 126.37 ± 1.55 123.50 ± 1.48
14 d 288.79 ± 2.98 282.46 ± 3.57 290.72 ± 4.13 286.55 ± 4.63 295.58 ± 3.31 289.66 ± 3.74
21 d 657.05a± 7.60 617.63b ± 9.67 624.43b ± 10.94 628.73ab ± 11.21 645.41ab ± 9.00 631.34ab ± 11.55
28 d 1048.74A ± 14.27 993.48B ± 12.48 952.92B ± 15.58 1008.78B ± 17.32 1024.54A ± 12.51 1052.21A ± 18.86
1Dietary treatments represent the maternal diet; CF = Chicken Fat; CA = Chicken + Antioxidant; SBO = Soybean Oil; SA = Soybean+ Antioxidant; MO = Menhaden Oil; MA = Menhaden + AntioxidantA-C Means within a row lacking the same superscript differ significantly (P<0.01).a-b Means within a row lacking the same superscript differ significant (P<0.05).

34
TABLE 11. EGG WEIGHTS ACCORDING TO MATERNAL DIETS1
Wk of Lay CF CA MO MA SBO SA
(g)
2 51.25a ± 0.87 48.17bc ± 1.08 48.81abc ± 0.95 47.96bc ± 0.81 47.20c ± 1.70 50.74ab ± 0.71
6 60.86A± 0.35 59.96AB± 0.42 57.51C ± 0.47 56.68C ± 0.41 58.99B ± 0.42 60.49A ± 0.34
10 63.81A± 0.71 63.61A ± 0.43 60.87B ± 0.35 61.49B ± 0.46 62.02B ± 0.50 64.44A ± 0.44
14 66.63A± 0.55 65.77A ± 0.48 62.92B ± 0.51 63.94B ± 0.38 65.62A ± 0.47 66.18A ± 0.42
18 68.25A± 0.56 67.84A ± 0.57 65.49B ± 0.40 65.50B ± 0.53 68.21A ± 0.50 68.03A ± 0.40
22 70.09a ± 0.65 67.08ab ± 0.56 67.39b ± 0.47 67.99b ± 0.62 68.94ab ± 0.55 68.95ab ± 0.42
1Dietary treatments represent the maternal diet; CF = Chicken Fat; CA = Chicken + Antioxidant; SBO = Soybean Oil; SA = Soybean + Antioxidant; MO = Menhaden Oil; MA = Menhaden + AntioxidantA-C Means within a row lacking the same superscript differ significantly (P<0.01).a-c Means within a row lacking the same superscript differ significant (P<0.05).

35
TABLE 12. MALE TIBIAE MEASUREMENTS ACCORDING TO MATERNAL DIET AT 14 DOA (TRIAL 1)1
CF CA MO MA SBO SA
Tibia Wt.(g) 3.45 ± 0.08 3.69 ± 0.10 3.39 ± 0.08 3.38 ± 0.11 3.51 ± 0.07 3.50 ± 0.09
Tibia Len. (mm) 56.08 ± 0.36 57.05 ± 0.49 56.72 ± 0.51 55.69 ± 0.35 56.62 ± 0.29 56.44 ± 0.36
Diameter (mm) 4.51AB ± 0.08 4.73A ± 0.09 4.49AB ± 0.09 4.72A ± 0.04 4.38B ± 0.08 4.32B ± 0.09
Force (N) 293.96 ± 17.56 308.13 ± 12.80 283.64 ± 14.43 296.75 ± 10.52 268.08 ± 10.31 291.96 ± 13.14
Energy (N-mm) 207.80 ± 31.86 252.04 ± 30.12 203.80 ± 22.11 235.20 ± 32.66 223.00 ± 20.81 199.96 ± 19.25
Bone Wall (mm) 1.41 ± 0.04 1.39 ± 0.06 1.45 ± 0.05 1.29 ± 0.05 1.38 ± 0.03 1.29 ± 0.06
Stress (MPa) 14.36 ± 0.93 14.32 ± 0.91 13.89 ± 0.70 14.29 ± 0.60 13.75 ± 0.62 16.05 ± 0.68
1Dietary treatments represent the maternal diet; CF = Chicken Fat; CA = Chicken + Antioxidant; SBO = Soybean Oil; SA = Soybean+ Antioxidant; MO = Menhaden Oil; MA = Menhaden + AntioxidantA-B Means within a row lacking the same superscript differ significantly (P<0.01).

36
TABLE 13. MALE TIBIAE WEIGHTS ACCORDING TO MATERNAL DIET AT 28 DOA (TRIAL1 )1
CF CA MO MA SBO SA
Tibia Wt. (g) 12.00a ± 0.32 11.86ab± 0.28 11.61ab ± 0.28 10.98b ± 0.35 12.45a ± 0.28 12.45a ± 0.34
Tibia Len. (mm) 85.16 ± 0.52 85.16 ± 0.67 84.71 ± 0.55 83.5 ± 0.71 85.97 ± 0.57 84.34 ± 0.61
Diameter (mm) 7.85A ± 0.17 7.32BC ± 0.13 7.12CD ± 0.16 6.77D ± 0.11 7.62AB ± 0.14 7.50B ± 0.14
Force (N) 494.65B ± 31.04 491.52B ± 34.57 497.68B ± 41.19 441.83B ± 36.74 634.32A ± 58.63 628.50A ± 49.31
Energy (N-mm) 456.26b ± 62.14 519.04ab ± 62.55 463.88b ± 81.27 461.70b ± 68.55 757.25a ± 110.33 616.04ab ± 93.49
Bone Wall (mm) 2.01A ± 0.04 1.88AB ± 0.03 1.90AB ± 0.04 1.65C ± 0.04 1.79B ± 0.05 2.00A ± 0.03
Stress (MPa) 8.75b ± 0.43 10.03b ± 0.60 10.24ab ± 0.78 10.70ab ± 0.86 12.70a ± 1.05 10.04ab ± 0.94
1Dietary treatments represent the maternal diet; CF = Chicken Fat; CA = Chicken + Antioxidant; SBO = Soybean Oil; SA = Soybean+ Antioxidant; MO = Menhaden Oil; MA = Menhaden + AntioxidantA-D Means within a row lacking the same superscript differ significantly (P<0.01).a-b Means within a row lacking the same superscript differ significant (P<0.05).

37
TABLE 14. MALE TIBIAE MEASUREMENTS ACCORDING TO MATERNAL DIET AT 14 DOA (TRIAL 2)1
CF CA MO MA SBO SA
Tibia Wt. (g) 3.59 ± 0.09 3.88 ± 0.10 3.52 ± 0.80 3.52 ± 0.76 3.84 ± 0.10 3.86 ± 0.06
Tibia Len. (mm) 57.48 ± 0.39 58.41 ± 0.41 56.23 ± 0.89 54.18 ± 2.13 57.06 ± 0.60 57.93 ± 0.34
Diameter (mm) 4.68 ± 0.39 4.37 ± 0.09 4.49 ± 0.08 4.54 ± 1.07 4.32 ± 0.08 4.71 ± 0.08
Force (N) 340.04b ± 17.10 391.16a ± 18.40 337.72b ± 12.00 312.01b ± 19.77 354.80b ± 15.09 333.04b ± 11.80
Energy (N-mm) 284.32AB ± 33.45 340.76A ± 32.69 195.20C ± 22.74 231.08BC ± 25.74 293.58AB ± 24.82 297.28AB ± 30.83
Bone Wall (mm) 1.51 ± 0.05 1.72 ± 0.05 1.56 ± 0.03 1.75 ± 0.26 1.58 ± 0.04 1.52 ± 0.04
Stress (MPa) 14.98B ± 0.70 18.09A ± 0.90 15.60B ± 0.60 14.77B ± 0.85 16.79AB ± 0.61 14.72B ± 0.77
1Dietary treatments represent the maternal diet; CF = Chicken Fat; CA = Chicken + Antioxidant; SBO = Soybean Oil; SA = Soybean+ Antioxidant; MO = Menhaden Oil; MA = Menhaden + AntioxidantA-B Means within a row lacking the same superscript differ significantly (P<0.01).a-b Means within a row lacking the same superscript differ significant (P<0.05).

38
TABLE 15. MALE TIBIAE MEASUREMENTS ACCORDING TO MATERNAL DIET AT 28 DOA (TRIAL 2)1
CF CA MO MA SBO SA
Tibia Wt. (g) 12.77B ± 0.25 13.52B ± 0.29 12.43B ± 0.29 11.01B ± 0.42 20.76A ± 8.03 14.68B ± 0.32
Tibia Len. (mm) 86.65B ± 0.49 88.58A ± 0.47 85.82BC ± 0.63 84.64C ± 0.74 86.66B ± 0.50 85.04BC ± 0.52
Diameter (mm) 7.77A ± 0.13 7.76A ± 0.16 7.72A ± 0.18 7.08B ± 0.13 7.51AB ± 0.16 7.40AB ± 0.16
Force (N) 807.12A ± 60.58 735.84AB ± 51.90 614.80B ± 34.62 616.83B ± 45.13 693.16AB ± 48.96 594.41B ± 39.79
Bone Wall (mm) 2.07A ± 0.03 1.94B ± 0.04 1.75C ± 0.03 1.74C ± 0.03 1.85BC ± 0.03 1.86BC ± 0.03
Stress (MPa) 14.30 ± 1.08 13.30 ± 0.73 12.37 ± 0.71 13.56 ± 0.86 13.68 ± 0.82 12.04 ± 0.74
1Dietary treatments represent the maternal diet; CF = Chicken Fat; CA = Chicken + Antioxidant; SBO = Soybean Oil; SA = Soybean+ Antioxidant; MO = Menhaden Oil; MA = Menhaden + AntioxidantA-C Means within a row lacking the same superscript differ significantly (P<0.01).

39
TABLE 16. FEMALE TIBIAE MEASUREMENTS ACCORDING TO MATERNAL DIET AT 14 DOA (TRIAL 3)1
CF CA MO MA SBO SA
Tibia Wt. (g) 3.79A ± 0.10 3.36C ± 0.06 3.41BC ± 0.07 3.33C ± 0.11 3.66AB ± 0.11 3.93A ± 0.11
Tibia Len. (mm) 55.86ab ± 0.45 55.16b ± 0.34 56.28ab ± 0.30 55.29b ± 0.44 56.93a ± 0.49 56.02ab ± 0.34
Diameter (mm) 5.01A ± 0.10 4.71B ± 0.07 4.60B ± 0.07 4.65B ± 0.08 4.63B ± 0.07 4.68B ± 0.07
Force (N) 340.56A ± 10.67 281.72C ± 12.32 330.48AB ± 14.68 293.95BC ± 13.05 331.84AB ± 11.01 326.58AB ± 12.88
Energy (N-mm) 269.80A ± 27.66 170.36B ± 17.50 188.44B ± 23.01 178.83B ± 26.43 260.72A ± 23.46 258.41A ± 27.13
Bone Wall (mm) 1.37 ± 0.02 1.35 ± 0.03 1.26 ± 0.04 1.39 ± 0.05 1.31 ± 0.03 1.44 ± 0.03
Stress (MPa) 14.50BC ± 0.63 12.91C ± 0.48 16.44A ± 0.59 14.64BC ± 0.76 16.13AB ± 0.56 14.69BC ± 0.43
1Dietary treatments represent the maternal diet; CF = Chicken Fat; CA = Chicken + Antioxidant; SBO = Soybean Oil; SA = Soybean+ Antioxidant; MO = Menhaden Oil; MA = Menhaden + AntioxidantA-C Means within a row lacking the same superscript differ significantly (P<0.01).

40
TABLE 17. FEMALE TIBIAE MEASUREMENTS ACCORDING TO MATERNAL DIET AT 28 DOA1
CF CA MO MA SBO SA
Tibia Wt. (g) 11.91A ± 0.25 9.88C ± 0.24 10.05C ± 0.23 10.35B ± 0.21 10.41B ± 0.07 10.77B ± 0.25
Tibia Len. (mm) 84.39 ± 0.45 82.41 ± 0.49 83.72 ± 0.42 84.22 ± 0.59 84.04 ± 0.64 84.30 ± 0.50
Diameter (mm) 7.90A ± 0.15 7.24BC ± 0.13 7.46B ± 0.12 7.26B ± 0.13 6.85C ± 0.14 7.50B ± 0.14
Force (N) 496.24A ± 46.54 344.88BC ± 20.78 431.35AB ± 29.91 394.78BC ± 35.04 314.56C ± 10.31 366.88BC ± 21.20
Energy (N-mm) 349.37 ± 67.34 210.24 ± 28.38 260.04 ± 43.91 234.66 ± 50.45 181.88 ± 17.14 255.12 ± 48.84
Bone Wall (mm) 1.51 ± 0.05 1.60 ± 0.05 1.62 ± 0.05 1.59 ± 0.04 1.76 ± 0.05 1.63 ± 0.05
Stress (MPa) 10.88A ± 1.07 8.10B ± 0.45 9.44AB ± 0.57 9.25AB ± 0.79 7.50B ± 0.38 8.21B ± 0.51
1Dietary treatments represent the maternal diet; CF = Chicken Fat; CA = Chicken + Antioxidant; SBO = Soybean Oil; SA = Soybean+ Antioxidant; MO = Menhaden Oil; MA = Menhaden + AntioxidantA-C Means within a row lacking the same superscript differ significantly (P<0.01).

41
TABLE 18. SHANK AND KEEL MEASUREMENTS OF 4 WOA MALE CHICKS1
cm CF CA MO MA SBO SA
Shank 7.986B ± 0.0978 8.354A ± 0.0605 8.113B ± 0.0822 8.020B ± 0.0668 8.054B ± 0.0816 7.876B ± 0.1165Shank/BW 0.007BC ± 0.0001 0.007C ± 0.0001 0.007B ± 0.0001 0.007BC ± 0.0001 0.007B ± 0.0001 0.008A ± 0.0002Keel 9.208D ± 0.0083 10.573A ± 0.0983 10.013B ± 0.1348 9.652BC ± 0.1340 10.487A± 0.0776 9.528CD± 0.1273Keel/BW 0.008C ± 0.0002 0.009A ± 0.0001 0.009B ± 0.0001 0.008BC ± 0.0001 0.009A ± 0.0001 0.009A ± 0.0002
1Values represent mean ± standard error; N=23 for CF; 26 for CA; 25 for MA; 24 for MO; 23 for SA; 25 for SBO.2Dietary treatments represent the maternal diet; CF = Chicken Fat; CA = Chicken + Antioxidant; SBO = Soybean Oil; SA = Soybean +Antioxidant; MO = Menhaden Oil; MA = Menhaden + Antioxidant.A-D Means within a row lacking the same superscript differ significantly (P<0.01)

42
TABLE 19. SHANK AND KEEL MEASUREMENT OF MALES CHICKS 4-WOATRIAL 21
cm
CF CA MO MA SBO SA
SHANK 8.551AB ± 0.055 8.368BC ± 0.055 8.680A ± 0.131 8.192BC ± 0.091 8.560AB ± 0.064 8.428ABC ± 0.076SHANK/BW 0.006C ± 0.0001 0.006C ± 0.0001 0.007B ± 0.0001 0.008A ± 0.0001 0.007C ± 0.0001 0.007B ± 0.0001KEEL 10.829A ± 0.115 10.340B ± 0.142 10.952A± 0.111 10.31B ± 0.133 10.691AB ± 0.091 10.568AB ± 0.152KEEL/BW 0.008C ± 0.0001 0.008C ± 0.0001 0.029AB± 0.0001 0.010A ± 0.0002 0.008C ± 0.0001 0.009B ± 0.00011Values represent mean ± standard error; N=22 for CF; 27 for CA; 25 for MO; 25 for MA; 25 for SBO; 23 for SA.2Dietary treatments represent the maternal diet; CF = Chicken Fat; CA = Chicken + Antioxidant; SBO = Soybean Oil; SA = Soybean +Antioxidant; MO = Menhaden Oil; MA = Menhaden + Antioxidant.A-C Means within a row lacking the same superscript differ significantly (P<0.01).

43
TABLE 20. FEMALE SHANK AND KEEL MEASUREMENTS 4 WOATRIAL 31
cm
CF CA MO MA SBO SAShank 7.616B ± 0.053 8.030A ± 0.066 7.725B ± 0.045 7.769B ± 0.072 7.725B ± 0.069 7.792B ± 0.045Shank/BW 0.007 ± 0.0001 0.007 ± 0.0001 0.007 ± 0.0001 0.007 ± 0.0001 0.007 ± 0.0001 0.007 ± 0.0001Keel 9.408C ± 0.102 9.917A ± 0.087 9.612BC ± 0.087 9.643BC ± 0.088 9.820AB ± 0.092 9.800AB ± 0.059Keel/BW 0.009AB ± 0.0001 0.008C ± 0.001 0.009A ± 0.0001 0.009B ± 0.0001 0.009AB ± 0.0001 0.009A ± 0.0001
1Values represent mean ± standard error; N=23 for CF; 25 for CA; 23 for MA; 24 for MO; 24 for SA; 25 for SBO.2Dietary treatments represent the maternal diet; CF = Chicken Fat; CA = Chicken + Antioxidant; SBO = Soybean Oil; SA = Soybean +Antioxidant; MO = Menhaden Oil; MA = Menhaden + Antioxidant.A-C Means within a row lacking the same superscript differ significantly (P<0.01).

44
TABLE 21. MALE SHANK AND KEEL MEASUREMENTS OF 4 WOA MALE CHICKSTRIAL 31
cm
CF CA MO MA SBO SA
Shank 7.758 ± 0.141 7.900 ± 0.069 8.017 ± 0.166 7.680 ± 0.070 7.932 ± 0.052 7.744 ± 0.081Shank/BW 0.007 ± 0.0001 0.007 ± 0.0001 0.007 ± 0.0001 0.007 ± 0.0001 0.007 ± 0.0001 0.007 ± 0.0001Keel 9.179 ± 0.097 9.354 ± 0.101 9.473 ± 0.156 9.376 ± 0.138 9.704 ± 0.102 9.304 ± 0.090Keel/BW 0.009 ± 0.0001 0.008 ± 0.0002 0.008 ± 0.0001 0.009 ± 0.0002 0.009 ± 0.0001 0.008 ± 0.0001
No significant differences (P>0.01) or (P<0.05)1Values represent mean ± standard error; N=22 for CF; 27 for CA; 25 for MA; 25 for MO; 23 for SA; 25 for SBO.2Dietary treatments represent the maternal diet; CF = Chicken Fat; CA = Chicken + Antioxidant; SBO = Soybean Oil; SA = Soybean +Antioxidant; MO = Menhaden Oil; MA = Menhaden + Antioxidant.A-C Means within a row lacking the same superscript differ significantly (P<0.01).

45
TABLE 22. SHEAR FORCE REQUIRED TO BREAK MALE TIBIAE ACCORDING TOMATERNAL DIET1
_________________________(N + SEM)______________________
DIETS 14 DOA 28 DOACF 293.96 ± 17.56 494.65B ± 31.04
CA 308.13 ± 12.80 491.52B ± 34.57
MO 283.64 ± 14.43 497.68B ± 41.19
MA 296.75 ± 10.52 441.83B ± 36.74
SBO 268.03 ± 10.13 634.32A ± 58.63
SA 291.96 ± 13.14 628.50A ± 49.31
1Values represent mean ± standard error; N=22 for CF; 27 for CA; 25 for MA; 25 for MO; 23 forSA; 25 for SBO.2Dietary treatments represent the maternal diet; CF = Chicken Fat; CA = Chicken + Antioxidant;SBO = Soybean Oil; SA = Soybean + Antioxidant; MO = Menhaden Oil; MA = Menhaden +Antioxidant.A-B Means within a column lacking the same superscript differ significantly (P<0.01).

46
TABLE 23. SHEAR STRESS REQUIRED TO BREAK MALE CHICK TIBIAEACCORDING TO MATERNAL DIET.
TRIAL 21
_________________________(N/mm2 + SEM)_________________________
DIETS 14DOA 28DOACF 8.75b ± 0.434 14.36 ± 0.939CA 10.03b ± 0.602 14.32 ± 0.911MO 10.24ab ± 0.786 13.89 ± 0.700MA 10.70ab ± 0.869 14.29 ± 0.602SBO 12.70a ± 1.051 13.75 ± 0.620SA 11.04ab ± 0.944 16.05 ± 0.680
1Values represent mean ± standard error; N=22 for CF; 27 for CA; 25 for MA; 25 for MO; 23 forSA; 25 for SBO.2Dietary treatments represent the maternal diet; CF = Chicken Fat; CA = Chicken + Antioxidant;SBO = Soybean Oil; SA = Soybean + Antioxidant; MO = Menhaden Oil; MA = Menhaden +Antioxidant.A-B Means within a row lacking the same superscript differ significantly (P<0.01).

47
TABLE 24. ANALYSIS OF VARIANCE FOR PARAMETER OF MALE CHICKTIBIAE ACCORDING TO MATERNAL DIETAT 14 DOA. (TRIAL 1)
Fatty AcidSource ofVariation df Mean
SquareF P
Tibia wt. Maternal dietError
5143
1.65731.581 1.50 0.1932
Total 148
Tibia wt./BW Maternal dietError
5143
1.1 x 10⁻⁵
1.7 x 10⁻⁴ 1.95 0.0899Total 148
Tibia Length Maternal dietError
5143
29.5365.8 x 102 1.43 0.2156
Total 148
Tibia Length/BW Maternal dietError
5143
5.6 x 10⁻³
2.9 x 10² 5.54 0.0001Total 148
Diameter Maternal dietError
5143
3.52526.044 3.87 0.0025
Total 148
Force Maternal dietError
5140
2.1 x 10⁴
6.1 x 10⁵ 0.99 0.4280Total 145
Stress Maternal dietError
5140
84.8941.9 x 103 1.23 0.2989
Total 145
Bone Wall Maternal dietError
5140
5.3 x 10⁻⁶
1.2 x 10⁻⁴ 1.20 0.3115Total 145

48
TABLE 25. ANALYSIS OF VARIANCE FOR PARAMETER OF MALE CHICKTIBIAE ACCORDING TO MATERNAL DIET AT 14 DOA . (TRIAL 1)
Fatty AcidSource ofVariation df Mean
SquareF P
Tibia wt. Maternal dietError
5144
38.3453.6 x 102 3.02 0.0126
Total 149
Tibia wt./BW Maternal dietError
5144
1.8 x 10⁻⁵
2.4 x 10⁻⁴ 2.27 0.506Total 149
Tibia Length Maternal dietError
5144
83.2011.3 x 103 1.76 0.1245
Total 149
Tibia Length/BW Maternal dietError
5144
1.9 x 10⁻³
1.4 x 10² 3.90 0.0024Total 144
Diameter Maternal dietError
5144
25.80381.125 9.16 0.0001
Total 149
Force Maternal dietError
5140
7.8 x 10⁵
6.3 x 10⁶ 3.34 0.0058Total 145
Stress Maternal dietError
5141
2.0 x 10²
2.2 x 10³ 2.57 0.0293Total 146
Bone Wall Maternal dietError
5141
2.2357.474 8.43 0.0001
Total 146

49
TABLE 26. ANALYSIS OF VARIANCE FOR PARAMETER OF MALE CHICKTIBIAE ACCORDING TO MATERNAL DIET AT14 DOA. (TRIAL 2)
Fatty AcidSource ofVariation df Mean
SquareF P
Tibia wt. Maternal dietError
5144
3.0 x10³
9.4 x 10⁴ 0.92 0.4668Total 149
Tibia wt./BW Maternal dietError
5144
3.7 x 10⁻²
1.127 0.96 0.4415Total 149
Tibia Length Maternal dietError
5144
2.8 x 10²
3.6 x 10³ 2.25 0.0528Total 149
Tibia Length/BW Maternal dietError
5144
3.3 x 10⁻⁴
6.6 x 10⁻² 0.15 0.9806Total 149
Diameter Maternal dietError
5144
25.067713.781 1.01 0.4132
Total 149
Force Maternal dietError
5144
8.5 x 10⁴
9.2 x 10⁵ 2.67 0.0243Total 149
Stress Maternal dietError
5144
2.2 x 10²
2.0 x 10³ 3.23 0.0085Total 149
Bone Wall Maternal dietError
5144
1.7 x 10³
5.1 x 10⁴ 0.98 0.4316Total 149

50
TABLE 27. ANALYSIS OF VARIANCE FOR PARAMETER OF MALE CHICKTIBIAE ACCORDING TO MATERNAL DIETAT 28 DOA. (TRIAL 2)
Fatty AcidSource ofVariation df Mean
SquareF P
Tibia wt. Maternal dietError
5144
1.5 x10³
3.9 x 10⁴ 1.17 0.3250Total 149
Tibia wt./BW Maternal dietError
5144
9.7 x 10⁻⁴
2.5 x 10⁻² 1.10 0.3628Total 149
Tibia Length Maternal dietError
5144
2.4 x 10²
1.1 x 10⁻³ 6.11 0.0001Total 149
Tibia Length/BW Maternal dietError
5144
3.7 x 10⁻³
6.7 x 10⁻³ 16.67 0.0001Total 149
Diameter Maternal dietError
5144
9.17390.8840 2.91 0.0156
Total 149
Force Maternal dietError
5144
8.6 x 10⁵
7.9 x 10⁶ 3.07 0.0115Total 149
Stress Maternal dietError
5144
89.0452.4 x 103 1.03 0.4034
Total 149
Bone Wall Maternal dietError
5144
1.9356.031 9.24 0.0001
Total 149

51
TABLE 28. ANALYSIS OF VARIANCE FOR PARAMETER OF FEMALE CHICKTIBIAE ACCORDING TO MATERNAL DIET AT 14 DOA. (TRIAL 3)
Fatty AcidSource ofVariation df Mean
SquareF P
Tibia wt. Maternal dietError
5143
7.86735.206 6.39 0.0001
Total 148
Tibia wt./BW Maternal dietError
5143
3.6 x 10⁻⁵
2.0 x 10⁻⁴ 5.03 0.0003Total 148
Tibia Length Maternal dietError
5143
52.646574.638 2.62 0.0267
Total 148
Tibia Length/BW Maternal dietError
5143
3.2 x 10⁻³
2.8 x 10⁻² 3.31 0.0074Total 148
Diameter Maternal dietError
5143
3.23625.004 3.70 0.0035
Total 148
Force Maternal dietError
5142
6.9 x 10⁴
5.4 x 10⁵ 3.63 0.0040Total 147
Stress Maternal dietError
5142
2.0 x 10²
1.2 x 10³ 4.75 0.0005Total 147
Bone Wall Maternal dietError
5142
23.1906.8 x 102 0.96 0.4423
Total 147

52
TABLE 29. ANALYSIS OF VARIANCE FOR PARAMETER OF FEMALE CHICKTIBIAE ACCORDING TO MATERNAL DIET AT 28 DOA. (TRIAL 3)
Fatty AcidSource ofVariation df Mean
SquareF P
Tibia wt. Maternal dietError
5143
63.887199.846 9.14 0.0001
Total 148
Tibia wt./BW Maternal dietError
5143
1.2 x 10⁻⁵
1.5 x 10⁻⁴ 2.27 0.0508Total 148
Tibia Length Maternal dietError
5143
68.9821.0 x 103 1.97 0.863
Total 148
Tibia Length/BW Maternal dietError
5143
2.1 x 10⁻³
8.1 x 10⁻² 7.68 0.0001Total 148
Diameter Maternal dietError
5143
15.30770.559 6.20 0.0001
Total 148
Force Maternal dietError
5141
5.2 x 10⁵
2.7 x 10⁶ 4.92 0.0003Total 146
Stress Maternal dietError
5141
1.8 x 10²
1.5 x 10³ 3.32 0.0073Total 146
Bone Wall Maternal dietError
5142
0.79910.398 2.18 0.0593
Total 147

53
TABLE 30. ANALYSIS OF VARIANCE OF MALE BW ACCORDINGTO MATERNALDIET. (TRIAL 1)
AgeSource ofVariation df Mean
SquareF P
1d Maternal dietError
5378
2.6 x 10²
3.6 x 10³ 5.52 0.0001Total 383
7d Maternal dietError
5373
1.0 x 10⁴
6.5 x 10⁴ 11.52 0.0001Total 378
14d Maternal dietError
5373
3.2 x 10⁴
4.5 x 10⁵ 5.30 0.0001Total 378
21d Maternal dietError
5216
5.7 x 10⁴
1.1 x 10⁶ 2.27 0.0487Total 221
28d Maternal dietError
5216
6.7 x 10⁵
3.3 x 10⁶ 8.65 0.0001Total 221

54
TABLE 31. ANALYSIS OF VARIANCE OF MALE BW ACCORDING TO MATERNALDIET. (TRIAL 2)
AgeSource ofVariation df Mean
SquareF P
1d Maternal dietError
5410
4.3 x 10³
4.0 x 10² 7.61 0.0001Total 415
7d Maternal dietError
5405
1.1 x 10⁴
7.9 x 10⁴ 11.56 0.0001Total 410
14d Maternal dietError
5368
5.5 x 10⁴
4.7 x 10⁵ 8.63 0.0001Total 373
21d Maternal dietError
5219
2.8 x 10⁵
1.0 x 10⁶ 11.51 0.0001Total 224
28d Maternal dietError
5141
8.5 x 10⁵
1.7 x 10⁶ 13.99 0.0001Total 146

55
TABLE 32. ANALYSIS OF VARIANCE OF MALE BW ACCORDING TO MATERNALDIET. (TRIAL 3)
AgeSource ofVariation df Mean
SquareF P
1d Maternal dietError
5395
2.3 x 10²
5.5 x 10³ 3.39 0.0051Total 400
7d Maternal dietError
5391
1.4 x 10⁴
7.4 x 10⁴ 15.65 0.0001Total 396
14d Maternal dietError
5361
2.9 x 10⁴
3.9 x 10⁵ 5.33 0.0001Total 366
21d Maternal dietError
5208
4.8 x 10⁴
1.0 x 10⁶ 2.01 0.0788Total 213
28d Maternal dietError
5199
1.8 x 10⁵
2.9 x 10⁶ 2.59 0.0271Total 204

56
TABLE 33. ANALYSIS OF VARIANCE OF FEMALE BW ACCORDING TOMATERNAL DIET. (TRIAL 3)
AgeSource ofVariation df Mean
SquareF P
1d Maternal dietError
5387
3.7 x 10²
4.9 x 10³ 5.86 0.001Total 392
7d Maternal dietError
5386
1.4 x 10³
6.6 x 10⁴ 1.66 0.1435Total 391
14d Maternal dietError
5356
6.1 x 10³
2.9 x 10⁵ 1.47 0.2000Total 361
21d Maternal dietError
5210
4.1 x 10⁴
7.5 x 10⁵ 2.29 0.0469Total 215
28d Maternal dietError
5199
5.3 x 10⁵
1.5 x 10⁶ 13.87 0.0001Total 204

57
TABLE 34. ANALYSIS OF VARIANCE FOR FATTY ACID COMPOSITION OF 4WOA CHICK YOLK TISSUE ACCORDING TO MATERNAL DIET. (TRIAL 1)
Fatty AcidSource ofVariation df Mean
SquareF P
14:1N5 Maternal dietError
548
1.6 x 10³
3.3 x 10³ 4.47 0.0021Total 53
15:0 Maternal dietError
548
8.7 x 10²
1.0 x 10³ 8.25 0.0001Total 53
16:0 Maternal dietError
548
3.5 x 10⁶
7.2 x 10⁷ 0.47 0.7981Total 53
t16:1N7 Maternal dietError
548
4.5 x 10³
5.2 x 10⁴ 1.40 0.2406Total 53
16:1N7 Maternal dietError
548
1.6 x 10⁶
1.5 x 10⁷ 3.35 0.0113Total 53
17:0 Maternal dietError
548
3.0 x 10³
5.2 x 10³ 2.48 0.0448Total 53
18:0 Maternal dietError
548
9.8 x 10⁶
2.6 x 10⁷ 3.41 0.0103Total 53
18:1 Maternal dietError
548
3.7 x 10⁷
2.3 x 10⁸ 2.40 0.0504Total 53

58
TABLE 35. ANALYSIS OF VARIANCE FOR FATTY ACID COMPOSITION OF 4WOA CHICK YOLK TISSUE ACCORDING TO MATERNAL DIET. (TRIAL 1)
Fatty AcidSource ofVariation df Mean
SquareF P
18:2N6 Maternal dietError
548
4.4 x 10²
2.1 x 10³ 2.28 0.0616Total 53
18:3N6 Maternal dietError
548
6.8 x 10⁶
9.7 x 10⁶ 4.27 0.0027Total 53
18:3N3 Maternal dietError
548
3.9 x 10²
3.4 x 10³ 1.00 0.4282Total 53
20:1N9 Maternal dietError
548
4.5 x 10⁴
2.3 x 10⁴ 9.81 0.0001Total 53
20:2N6 Maternal dietError
548
4.0 x 10³
3.7 x 10⁴ 0.70 0.6246Total 53
20:3N6 Maternal dietError
548
3.5 x 10³
1.4 x 10⁵ 0.18 0.9673Total 53
20:4N6 Maternal dietError
548
1.4 x 10³
9.6 x 10³ 1.21 0.3185Total 53
22:4N6 Maternal dietError
548
4.2 x 10⁷
4.1 x 10⁸ 1.57 0.1867Total 53

59
TABLE 36. ANALYSIS OF VARIANCE FOR FATTY ACID COMPOSITION OF 4WOA CHICK YOLK TISSUE ACCORDING TO MATERNAL DIET. (TRIAL 1)
Fatty AcidSource ofVariation df Mean
SquareF P
22:5N3 Maternal dietError
548
2.1 x 10⁸
9.1 x 10⁸ 2.48 0.0442Total 53
22:6N3 Maternal dietError
548
1.0 x 10⁶
3.2 x 10⁶ 1.96 0.1021Total 53
TOTS Maternal dietError
548
2.3 x 10⁹
4.4 x 10⁸ 1.74 0.1436Total 53
TOTM Maternal dietError
548
3.8 x 10⁷
2.9 x 10⁸ 1.99 0.0978Total 53
TOTP Maternal dietError
548
1.8 x 10⁸
6.3 x 10⁸ 2.70 0.0314Total 53

60
TABLE 37. ANALYSIS OF VARIANCE FOR FATTY ACID COMPOSITION OF 4WOA CHICK YOLK TISSUE ACCORDING TO MATERNAL DIET. (TRIAL 2)
Fatty AcidSource ofVariation df Mean
SquareF P
14:1N5 Maternal dietError
548
1.1 x 10³
8.4 x 10² 6.87 0.0001Total 53
15:0 Maternal dietError
548
540.20426.06 12.17 0.0001
Total 53
16:0 Maternal dietError
548
8.1 x 10⁶
7.2 x 10⁷ 1.07 0.3868Total 53
t16:1N7 Maternal dietError
548
7.4 x 10³
4.3 x 10⁴ 1.65 0.1655Total 53
16:1N7 Maternal dietError
548
5.8 x 10⁵
2.0 x 10⁵ 3.41 0.0103Total 53
17:0 Maternal dietError
548
3.2 x 10³
5.4 x 10³ 5.76 0.0003Total 53
18:0 Maternal dietError
548
9.9 x 10⁵
3.7 x 10⁶ 2.54 0.0406Total 53
18:1 Maternal dietError
548
8.9 x 10⁶
1.9 x 10⁸ 0.43 0.8247Total 53

61
TABLE 38. ANALYSIS OF VARIANCE FOR FATTY ACID COMPOSITION OF 4WOA CHICK YOLK TISSUE ACCORDING TO MATERNAL DIET. (TRIAL 2)
Fatty AcidSource ofVariation df Mean
SquareF P
18:3N6 Maternal dietError
548
7.6 x 10⁶
6.7 x 10⁶ 10.97 0.0001Total 53
18:3N3 Maternal dietError
548
1.2 x 10³
1.3 x 10⁴ 0.83 0.5332Total 53
20:1N9 Maternal dietError
548
5.9 x 10⁴
2.5 x 10⁴ 22.54 0.001Total 53
20:3N6 Maternal dietError
548
9.6 x 10³
4.7 x 10⁴ 1.96 0.1022Total 53
20:4N6 Maternal dietError
548
102.53734.74 1.34 0.2638
Total 53
22:4N6 Maternal dietError
548
7.7 x 10²
9.6 x 10³ 0.77 0.5740Total 53
22:5N3 Maternal dietError
548
7.5 x 10⁵
7.3 x 10⁵ 9.92 0.0001Total 53

62
TABLE 39. ANALYSIS OF VARIANCE FOR FATTY ACID COMPOSITIONOF 4 WOA CHICK YOLK TISSUE ACCORDING TO MATERNAL DIET.(TRIAL 2)
Fatty AcidSource ofVariation df Mean
SquareF P
22:6N3 Maternal dietError
548
1.8 x 10⁸
1.0 x 10⁹ 1.64 0.1667Total 53
TOTS Maternal dietError
548
2.2 x 10⁷
1.4 x 10⁸ 1.15 0.2050Total 53
TOTM Maternal dietError
548
1.1 x 10⁷
2.1 x 10⁸ 0.49 0.7825Total 53
TOTP Maternal dietError
548
1.5 x 10⁸
1.0 x 10⁹ 1.46 0.2209Total 53

63
TABLE 40. ANALYSIS OF VARIANCE FOR FATTY ACID COMPOSITION OF 4WOA CHICK HEART TISSUE ACCORDING TO MATERNAL DIET.
Fatty AcidSource ofVariation df Mean
SquareF P
14:1N5 Maternal dietError
547
1.9 x 10³
1.1 x 10⁴ 1.68 0.1539Total 52
15:0 Maternal dietError
547
1.0 x 10³
3.6 x 10³ 2.69 0.0323Total 52
16:0 Maternal dietError
547
2.4 x 10⁷
5.1x 10⁷ 4.55 0.0018Total 52
t16:1N7 Maternal dietError
547
2.3 x 10⁴
8.4 x 10⁴ 2.67 0.0332Total 52
16:1N7 Maternal dietError
547
9.5 x 10⁵
2.4 x 10⁶ 3.69 0.0067Total 52
17:0 Maternal dietError
547
4.1 x 10³
3.5 x 10³ 10.91 0.0001Total 52
18:0 Maternal dietError
547
6.7 x 10⁵
8.3 x 10⁶ 0.75 0.5893Total 52
18:1 Maternal dietError
547
5.4 x 10⁷
6.9 x 10⁷ 7.35 0.0001Total 52

64
TABLE 41. ANALYSIS OF VARIANCE FOR FATTY ACID COMPOSITION OF 4WOA CHICK HEART TISSUE ACCORDING TO MATERNAL DIET.
Fatty AcidSource ofVariation df Mean
SquareF P
18:2N6 Maternal dietError
547
4.3 x 10²
4.4 x 10³ 0.92 0.4734Total 52
18:3N6 Maternal dietError
547
2.4 x 10⁷
2.5 x 10⁷ 9.22 0.0001Total 52
18:3N3 Maternal dietError
547
1.1 x 10⁴
1.7 x 10⁴ 6.13 0.0002Total 52
20:0 Maternal dietError
547
1.1 x 10³
1.3 x 10⁵ 8.21 0.0001Total 52
20:1N9 Maternal dietError
547
2.8 x 10³
9.2 x 10³ 2.93 0.0219Total 52
20:2N6 Maternal dietError
547
3.9 x 10⁵
8.8 x 10⁵ 4.17 0.0032Total 52
20:3N6 Maternal dietError
547
9.6 x 10⁴
2.7 x 10⁵ 3.30 0.0124Total 52
2:4N6 Maternal dietError
547
4.0 x 10⁵
8.3 x 10⁵ 4.51 0.0020Total 52

65
TABLE 42. ANALYSIS OF VARIANCE FOR FATTY ACID COMPOSITION OF 4WOA CHICK HEART TISSUE ACCORDING TO MATERNAL DIET.
Fatty AcidSource ofVariation df Mean
SquareF P
22:4N6 Maternal dietError
547
1.4 x 10⁷
4.4 x 10³ 9.12 0.0001Total 52
22:5N3 Maternal dietError
547
5.7 x 10⁴
5.7 x 10⁴ 9.30 0.0001Total 52
22:6N3 Maternal dietError
547
1.0 x 10⁸
7.4 x 10⁷ 13.16 0.0001Total 52
TOTS Maternal dietError
547
3.2 x 10⁷
9.0 x 10⁷ 3.37 0.0110Total 52
TOTM Maternal dietError
547
6.9 x 10⁷
9.7 x 10⁷ 6.71 0.0001Total 52
TOTP Maternal dietError
547
2.9 x 10⁸
1.8 x 10⁸ 15.16 0.0001Total 52
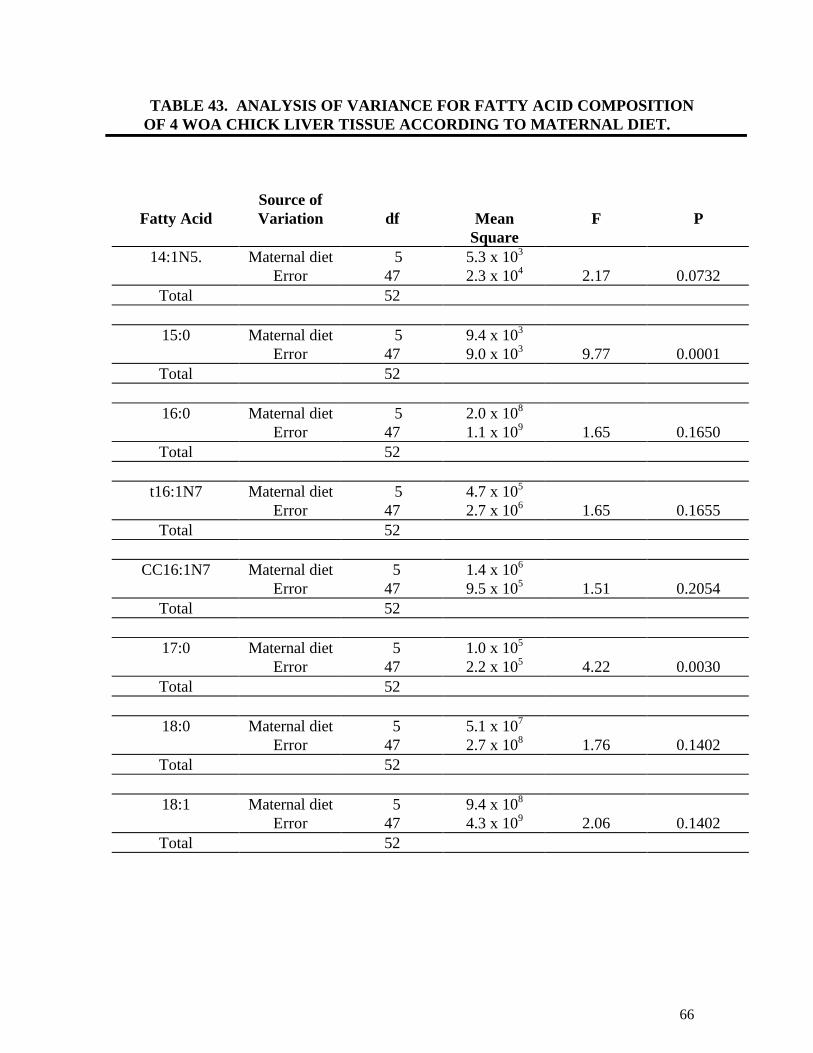
66
TABLE 43. ANALYSIS OF VARIANCE FOR FATTY ACID COMPOSITIONOF 4 WOA CHICK LIVER TISSUE ACCORDING TO MATERNAL DIET.
Fatty AcidSource ofVariation df Mean
SquareF P
14:1N5. Maternal dietError
547
5.3 x 10³
2.3 x 10⁴ 2.17 0.0732Total 52
15:0 Maternal dietError
547
9.4 x 10³
9.0 x 10³ 9.77 0.0001Total 52
16:0 Maternal dietError
547
2.0 x 10⁸
1.1 x 10⁹ 1.65 0.1650Total 52
t16:1N7 Maternal dietError
547
4.7 x 10⁵
2.7 x 10⁶ 1.65 0.1655Total 52
CC16:1N7 Maternal dietError
547
1.4 x 10⁶
9.5 x 10⁵ 1.51 0.2054Total 52
17:0 Maternal dietError
547
1.0 x 10⁵
2.2 x 10⁵ 4.22 0.0030Total 52
18:0 Maternal dietError
547
5.1 x 10⁷
2.7 x 10⁸ 1.76 0.1402Total 52
18:1 Maternal dietError
547
9.4 x 10⁸
4.3 x 10⁹ 2.06 0.1402Total 52

67
TABLE 44. ANALYSIS OF VARIANCE FOR FATTY ACID COMPOSITIONOF 4 WOA CHICK LIVER TISSUE ACCORDING TO MATERNAL DIET.
Fatty AcidSource ofVariation df Mean
SquareF P
18:2N6 Maternal dietError
547
6.1 x 10⁵
6.2 x 10⁶ 0.92 0.4736Total 52
18:3N3 Maternal dietError
547
8.9 x 10⁵
7.9 x 10⁶ 1.06 0.3946Total 52
20:1N9 Maternal dietError
547
2.1 x 10⁴
1.7 x 10⁵ 1.16 0.3426Total 52
20.2N6 Maternal dietError
547
2.1 x 10⁴
1.7 x 10⁵ 1.16 0.3426Total 52
20:3N6 Maternal dietError
547
1.6 x 10⁵
9.4 x 10⁵ 1.59 0.1816Total 52
20:4N6 Maternal dietError
547
3.3 x 10⁴
3.1 x 10⁵ 1.00 0.4309Total 52
22:4N6 Maternal dietError
547
3.8 x 10⁸
1.0 x 10⁹ 3.54 0.0085Total 52
22:5N3 Maternal dietError
547
1.7 x 10⁷
1.1 x 10⁸ 1.40 0.2418Total 52

68
TABLE 45. ANALYSIS OF VARIANCE FOR FATTY ACID COMPOSITIONOF 4 WOA CHICK LIVER TISSUE ACCORDING TO MATERNAL DIET.
Fatty AcidSource ofVariation df Mean
SquareF P
22:6N3 Maternal dietError
547
1.0 x 10⁸
1.7 x 10⁸ 5.79 0.0003Total 52
TOTS Maternal dietError
547
4.4 x 10⁸
2.3 x 10⁹ 1.74 0.1436Total 52
TOTM Maternal dietError
547
1.1 x 10⁹
5.1 x 10⁹ 2.02 0.0935Total 52
TOTP Maternal dietError
547
1.1 x 10⁹
1.2 x 10⁹ 8.32 0.0001Total 52

69
TABLE 46. ANALYSIS OF VARIANCE FOR FATTY ACID COMPOSITIONOF 4 WOA CHICK UTERUS TISSUE ACCORDING TO MATERNAL DIET.
Fatty AcidSource ofVariation df Mean
SquareF P
14:1N5. Maternal dietError
545
9.3 x 10²
4.9 x 10² 16.98 0.0001Total 50
15:0 Maternal dietError
545
1.0 x 10²
5.3 x 10² 1.73 0.1476Total 50
16:0 Maternal dietError
545
1.6 x 10⁷
2.0 x 10⁷ 7.43 0.0001Total 50
Ct16:1N7 Maternal dietError
545
4.9 x 108.7 x 10 5.11 0.0009
Total 50
CC16:1N7 Maternal dietError
545
8.7 x 10⁴
8.8 x 10⁵ 0.83 0.5370Total 50
17:0 Maternal dietError
545
1.2 x 10⁵
9.6 x 10⁵ 1.20 0.3225Total 50
18:0 Maternal dietError
545
1.7 x 10⁷
6.2 x 10⁷ 2.49 0.0452Total 50
18:1 Maternal dietError
545
1.9 x 10⁵
5.1 x 10⁵ 3.35 0.0117Total 50

70
TABLE 47. ANALYSIS OF VARIANCE FOR FATTY ACID COMPOSITIONOF 4 WOA CHICK UTERUS TISSUE ACCORDING TO MATERNAL DIET.
Fatty AcidSource ofVariation df Mean
SquareF P
t18:2N6 Maternal dietError
545
1.8 x 10⁷
1.1 x 10⁸ 1.48 0.2162Total 50
18:2N6 Maternal dietError
545
4.6 x 10²
1.5 x 10³ 2.61 0.0369Total 50
18:3N6 Maternal dietError
545
3.9 x 10²
1.8 x 10³ 1.87 0.1193Total 50
18:3N3 Maternal dietError
545
2.4 x 10⁴
6.1 x 10⁴ 3.65 0.0074Total 50
20:0 Maternal dietError
545
2.9 x 10⁵
4.3 x 10⁵ 6.04 0.0002Total 50
20:1N9 Maternal dietError
545
1.1 x 10⁵
1.0 x 10⁶ 0.95 0.4563Total 50
20:2N6 Maternal dietError
545
2.2 x 10⁵
7.8 x 10⁵ 2.59 0.0385Total 50
20:3N6 Maternal dietError
545
9.3 x 10⁷
9.9 x 10⁷ 8.51 0.0001Total 50

71
TABLE 48. ANALYSIS OF VARIANCE FOR FATTY ACID COMPOSITIONOF 4 WOA CHICK UTERUS TISSUE ACCORDING TO MATERNAL DIET.
Fatty AcidSource ofVariation df Mean
SquareF P
22:4N6 Maternal dietError
545
2.5 x 10⁷
1.3 x 10⁸ 1.77 0.1392Total 50
22:5N3 Maternal dietError
545
4.0 x 10³
3.7 x 10³ 9.68 0.0001Total 50
22:6N3 Maternal dietError
545
8.8 x 10⁶
5.8 x 10⁶ 13.68 0.0001Total 50
TOTS Maternal dietError
545
4.6 x 10⁷
1.0 x 10⁸ 1.57 0.1888Total 50
TOTM Maternal dietError
545
6.8 x 10⁵
3.9 x 10⁶ 1.57 0.1888Total 50
TOTP Maternal dietError
545
1.7 x 10⁸
5.1 x 10⁸ 3.14 0.0164Total 50

72
References
Ackerman, L., 1995. Reviewing the biochemical properties of fatty acids. Veterinary Med.
28:1138-1148.
Ahn, D. U., H. H. Sunwood, F. H. Wolfe, and J. S. Sim, 1995. Effects of dietary α-linolenic acid
and strain of hen on the fatty acid composition, storage stability, and flavor characteristics
of chicken eggs. Prog. Lipid Res. 20:96-104.
Ajuyah, A. O., R. T Hardin, and J. S. Sim, 1993. Effect of dietary full-fat flax seed with and
without antioxidant on the fatty acid composition of major lipid classes of chicken meats.
Poultry Sci. 72:125-136.
Ajuyah, A. O., K. H. Lee, R. T. Hardin, and J. S. Sim, 1991. Changes in the yield and in the fatty
acid composition of whole carcass and selected meat portions of broiler chickens fed full-
fat oil seeds. Poultry Sci. 70:2304-2314.
Alaiz, M., R. Zamora, and F. J. Hidalgo, 1996. Contribution of the formation of oxidized lipid/
amino acids reaction products to the productive role of amino acids in oils and fats. J.
Agric. Food Chem. 44:1890-1895.
Artman, N. R., 1964. Interaction of fats and fatty acids as energy sources for the chick. Poultry
Atteh, O. J., and S. Lesson, 1983. Effects of dietary fatty acids and calcium levels on
performance and mineral metabolism of broiler chicks. Poultry Sci. 62:2412-2419.
Atteh, O. J., and S. Lesson, 1984. Effects of dietary saturated or unsaturated fatty acids and
calcium levels on performance and mineral metabolism of broiler chicks. Poultry Sci.
63:2252-2260.
Bartov, I., and S. Bornstein, 1977. Stability of abdominal fat and meat of broilerss:
Relative effects of vitamin E, butylated hydroxytoluene and ethoxyquin. Br.
Poultry Sci. 18:59-68.
Blanch, A., A. C. Barroeta, M. D. Baucells, and F. Puchal, 1995. The nutritive value of dietary
fats in relation to their chemical composition. Poultry Sci. 74:1335-1340.
Beily, J., and B. March, 1957. Fat studies in poultry. 2. Fat supplements in chick and
poult rations. Poultry Sci. 33:1220-1227.
Bensadoun, A., and Rothfled, 1972. The form of absorption of lipids in the chicken,
Gallus domesticus. Proc Exp. Biol. Med. 141:814-817.

73
Bhagavan, H. N., and P. P. Nair, 1992. Antioxidants in dietary fats. J. Am. Oil Chem.
44:686-691.
Brake, J., 1990. Effect of four levels of added fat on broiler breeder performance.
Poultry Sci. 69:1659-1663.
Cahaner, A., Y. Pinchasov, and I. Nir, 1995. Effects of dietary protein under high ambient
temperature on body weight, breast meat yield, and abnormal fat deposition of broiler
stocks differing in growth rate at fatness. Poultry Sci. 74:968-975.
Chanmugam, P., M. Boudreau, T. Boutte, R. S. Park, J. Hebert, L. Berrio, and D. H. Hwang,
1992. Incorporation of different types of n-3 fatty acids into tissue lipids of poultry.
Poultry Sci. 71:516-521.
Cherian, G., F. W. Wolfw, and J. S. Sim, 1996. Dietary oils with added tocopherol: Effects on
egg or tissue tocopherol, fatty acids, and oxidative stability. Poultry Sci. 75:423-431.
Cherian, G., and J. S. Sim, 1993. Net transfer and incorporation of yolk n-3 fatty acids into
developing chick embryos. Poultry Sci. 72:98-105.
Cherian, G., J. Sim, 1992. Omega-3 fatty acid and cholesterol content of newly hatched chicks
from α-linolenic acid enriched eggs. J. Lipids. 32:706-710.
Croft, K. D., J. P. Codde, A. Barden, R. Vandognen, and L. L. Beilin, 1985. Onset of
changes in phospholipid fatty acids composition and prostaglandin synthesis following
dietary manipulation with n-6 and n-3 fatty acids in the rat. Biochem. Biophys. Acta.
834:316-323.
Dansky, L. M., 1961. The growth promoting properties of menhaden oil as influenced by
various fats. Poultry Sci. 41:1352-1354.
Donaldson, W. E., 1981. Lipid metabolism in chick embryos. Poultry Sci. 60:1964-1970.
Edwards,H. M., Jr., and J. E. Marion, 1963. Influence of dietary menhaden oil on
growth rate and tissue fatty acids of the chick. J. Nutr. 81:123-130.
Edwards, H. M., Jr., and K. N. May, 1965. Studies with menhaden oil in practical-type
broiler rations. Poultry Sci. 44:685-689.
Engberg, R. M., C. Lauridsen, S. K. Jensen, and K. Jakobsen, 1996. Inclusion of oxidized
vegetable oil in broiler diet. Its influence on nutrient balance and on the antioxidative
status of broilers. Poultry Sci. 75:1003-1011.

74
Evan, A. J., 1977. The growth of fat. In: Growth and Poultry Meat Production. Pg. 29-64
Boorman, and B. J. Wilson, ed., Bri. Poultry Sci. Ltd. Edinburgh, Scotland.
Fleming, R. H., C. C. Whitehead, D. Alvey, N. G. Gregory, and L. J. Wilkins, 1994. Bone
structure and breaking strength in laying hens housed in different husbandry systems. Br.
Poult. Sci. 35:651-662.
Friedman, Z., 1981. Effects of dietary variation in linoleic acid content on prostaglandin
synthesis in infants. Prog. Lipid Res. 20:59-66.
Frost, T. J., and D. A. Roland, 1991. Current methods used in determination and evaluation of
the tibia strength: Acorrelation study involving birds fed various levels of cholecalciferol.
Poultry Sci. 70:1640-1643.
Griffith, M. and R. Schexnailder, 1971. Response of chicks to several sources of unidentified
growth factors. Poultry Sci. 50:1581.
Hargis, P. S., M. E. Van Elswyk, and B. M. Hargis, 1991. Dietary modification of yolk lipid with
menhaden oil. J. Nutr. 81: 136-142.
Hinner, S. W., and C. W. McKinney, 1974. Some factors affecting chick response to
defatted fish meal. Poultry Sci. 53:1935-1936.
Hulan, H. W., R. G. Ackman, W. M. N. Ratnayake, and F. G. Proudfoot, 1989. Omega-n3 fatty
acid levels and general performance of commercial broiler fed practical levels of redfish
meal. Poultry Sci. 68:153-162.
King, A. S., and J. McLelland, 1984. Birds: Their Structure and Function, 2nd ed. Pitman
Press, Bath, England.
Kline, D. C., and L. G. Raisz, 1970. Prostaglandins: stimulation of bone resorption
in tissue culture. Endocrinology 86:1436-1440.
Lauridsen, C., and J. F. Jensen, 1995. Effects of synthetic antioxidants in feed of
different technological treatments on the performance of broilers. Arch.
Geflugelk. 59:73-81.
Lefkowith, J. B., H. Sprecher, and P. Needlemen, 1986. The regulation of the biosynthesis of
prostaglandins and leukotrienes. Prog. Lipid Res. 25:111-117.

75
Lesson, S., and J. D. Summers, 1983. Influence of nutritional modification of skeletal
size of Leghorn and broiler breeder chicks. Poultry Sci. 63:1222-1227.
Leveille, G. A., D. R. Romsos, Y. Y. Yeh, and E. K. O'Hea, 1975. Lipid biosynthesis in the
chick. A consideration of site of synthesis, influence of diet and possible regulatory
mechanisms. Poultry Sci. 54:1075-1093.
Lillie, A. J., N. Menge, J. J. Miner, and C. A. Denton, 1958. Unidentified factors in
poultry nutrition. Poultry Sci. 37:344-352.
Lin, C. F., A. Asghar, J. I. BuCkley, D. J. Booren, and C. J. Flegal, 1989. Effects of dietary oil
and antioxidants. Br. Poult. Sci. 30:250-254.
Lin, C. F., A. Asghar, J. I Gray, D. J. Buckley, A. M. Booren, R. L. Crackel, and C. J. Flegal,
1989. Effects of oxidised dietary oil and antioxidant supplementation on broiler growth
and meat stability. Br. Poult. Sci. 30:855-864.
Lott, B. D., F. N. Reece, and J. H. Drott, 1992. Effects of preconditioning of bone breaking
strength. Poultry Sci. 59:724-725.
Machlin, L. J., R. S. Gordon, L. Marr, and C. W. Pope, 1962. Effect of dietary fat on the fatty
acid composition of eggs and tissue of the hen. Can. J. Anim. Sci. 41:331- 334.
Marion, J. E., and J. G. Woodroof, 1965. Lipid fractions of chicken broiler tissues and
their fatty acid composition. J. Food Sci. 30:38-43.
Marks, S. C., S. C. Miller, 1993. Prostaglandins and the skeleton: the legacy and
challenges of two decades of research. Endocrine J. 1:337-344.
Mason, M. E., J. Sacks and E. L. Stephenson, 1961. Isolation and nature of an
unidentified growth factor(s) in condensed fish soulbles. J. Nutrition 75:253-264.
McCarthy, T. L., M. Centrella, L. G. Raisz, and E. Canalis, 1991. Prostaglandins E2
stimulates insulin-like growth factor-I synthesis in osteoblast-enriched cultures
from fetal rat bones. Endocrinology 128:2895-2900.
McGinnis, J., L. R. Berg, J. R. Stern, M. E. Starr, R. A. Wilcox and J. S. Carver, 1951.
The effect of different antibiotics on growth of turkey poults. Poultry Sci. 30:492-496.
Merkely, J. W., and C. J. Wabeck, 1975. Cage density and frozen storage effect on bone
strength of broilers. Poultry Sci. 54:1624-1627.

76
Menge, H., and R. J. Little, 1960. An unidentified mineral response required by the
chick. Poultry Sci. 35:244-246.
Noble, R. C., and M. Cocchi, 1990. Lipid metabolism and the neonatal chicken. Prog.
Lipid Res. 29:107-140.
Nobel, R. C., M. Cocchi, and H. M. Bath, 1993. α-Tocopherol absorption and
polyunsaturated fatty acid metabolism in the developing chick embryo. Br. Poult. Sci.
34:815-818.
Norrdin, R. W., W. S. Jee, and W. B. High, 1990. The role of prostaglandins in bone
in vivo. Prostaglandins Leuko. Essent. Fatty Acids 41:139-149.
Orban, J. L., D. A. Roland, Sr., M. M. Bryant, and J. C. Williams, 1993. Factors influencing
bone mineral content, density, breaking strength and ash as response criteria for assessing
bone quality in chickens. Poultry Sci. 72:437-446.
Petersen, C. F., A. C. Wiese and A. R. Pappenhagen, 1953. Chick growth response to an
unidentified factors in fish solubles, dried whey and other supplements. Poultry Sci.
32:921.
Potter, L. M., J. R. Shelton, and C. M. Parson, 1980. The unidentified growth factor in
menhaden fish oil. Poultry Sci. 59:128-134.
Potter, L. M., J. R. Shelton, and L. B. Melton, 1973. Evidence of an unidentified growth
factor in corn fermentation solubles for young turkeys. Poultry Sci. 52:2075-2076.
Raisz, L. G., P. M. Fall, 1990. Biphasic effects of prostaglandins E2 on bone formation
in cultured fetal rat calvariae: interaction with cortisol. Endocrinology 126:1654-
1659.
Rath, N. C., G. R. Bayyari, J. N. Beasley, W. E. Huff, and J. M. Balog, 1994. Age-related
changes in the incidence of tibia dyschondroplasia in turkeys. Poultry Sci. 73:1254-1259.
Reiser, R., 1950. The essential role of fatty acids in rations for growing chicks. J. Nutr.
42:319-323.
Renner, R., and F. W. Hill, 1961. Utilization of fatty acids by the chicken. J. Nutr.
74:259-264.
Ross, E., and R. H. Harms, 1970. The response of chicks to sodium sulfate
supplementation of a corn-soy diet. Poultry Sci. 49:1605-1610.

77
Rowland, Jr., L. O., R. H. Harms, H. R. Wilson, I. J. Ross, and J. L. Fry, 1967. Breaking
strength of chick bones as an indication of dietary calcium and phosphorus adequacy.
Proc. Soc. Exp. Biol. Med. 126:299-401.
Sanders, A. M., and H. M. Edwards, 1991. The effect of 1, 25-Dihydroxycholecalciferol on
performance and bone development in the turkey poult. Poultry Sci. 70:853-866.
SAS Institute, 1985. SAS User’s Guide: Statistics Version, 5th Edition. SAS Institute
Inc., Cary NC.
Scaife, J. R., J. Moyo, H. Galbraith, W. Michie, and V. Cambell, 1994. Effect of different
supplemental fats and oils on the tissue fatty acid composition and growth of female
broilers. Br. Poult. Sci. 35:107-118.
Schjeide, O. A., M. Wilkensm R. G. McCandlessm R. Munn, M. Peterson, and E. Carlsen, 1963.
Liver synthesis, plasma transport, and structural alterations accompanying the passage of
yolk protein. Am. Zool. 3:167-184
Scottt, M. L. and L. S. Jensen, 1952. The effect of antibiotics upon the requirement of
turkeys for unidentified vitamins. Poultry Sci. 31:986-993.
Simopoulos, A. P., 1988. N-3 Fatty acids in growth and development and in health
and disease. Nutr. Today. 23:10-19.
Smith, W. L., 1989. The eicosanoids and their biochemical mechanism of action.
Biochem. J.: 259:315-324.
Spandorf, A. H., 1984. Using antioxidants in ingredients and finished feeds. Poultry
Digest. Pg. 238-239.
Touchburn, S. P., V. D. Chamberlin, M. G. McCartney and E. C. Naber, 1963. Unidentified
reproductive and progeny growth factors in turkey nutrition. Poultry Sci. 42:1314.
Triyuwanta, C. L., and Y. Nys, 1992. Dietary phosphorus and food allowance of dwarf
breeders affect reproductive performance of hens and bone development of their progeny.
Br. Poult. Sci. 33:363-379.
Van Elswyk, M. E., B. M. Hargis, J. D. Williams, and P. S. Hargis, 1994. Dietary menhaden oil
contributes to hepatic lipidosis in laying hens. Poultry Sci. 73:653- 662.

78
Vilchez, C., S. P. Touchburn, E. R. Chavez, and C. W. Chan, 1990. The influence of
different dietary fats on the reproductive performance of turkey hens. Can. J. Animal Sci.
70:679-684.
Watkins, B. A., C. L. Shen, K. Allen, and M. F. Seifert, 1996. Dietary (n-3) and (n-6)
polyunsaturated and acetylsalicylic acid alter ex vivo PGE2 biosynthesis, tissue
IGF-I levels, and bone morphometry in chicks. J. Bone Miner. Res. 11:1321-1132.
Watkins, B. A., C. L. Shen, J. P. McMurtry, H. Xu, S. D. Bain, K. Allen, and M. F.
Seifert, 1995. Dietary lipids modulate bone prostaglandins E2 production,
insulin-like growth factor-I concentration and formation rate in chicks. J.
Bone Miner. Res. 11:1084-1091.
Whitehead, C. C., and H. D. Griffin, 1982. Plasma lipoprotein concentration as an
Indicator of fatness in broilers. Br. Poultry Sci. 23:299-305
Wilson, J. H., 1991. Bone strength of caged layers as affected by dietary calcium and
phosphorus concentrations, preconditioning, and ash content. Br. Poultry Sci.
32:501-508.
Wisman, E. L., 1960. Chick growth response to fish by-products and arsanilic acid.
Poultry Sci. 39:1140-1148.
Xu, H., B. A. Watkins, and M. F. Seifert, 1995. Vitamin E stimulation trabecular
bone formation and alters epiphyseal cartilage morphometry. Calcif. Tissue
Int. 57:293-300.

79
APPENDICES
Appendix A
Tissue Homogenization and Extraction of Lipids
Equipment:
Polytron homogenizer
N-Evap (Organomation Meyer N-Evap analytical evaporator model #112)
Aspiration apparatus (large Erlenmeyer flask, tubing and Pasteur pipette)
Horizontal shaker (Eberbach Corp.)
Centrifuge
Reagent:
Methanol (Chromatography grade) – Baxter Catalogue #230-4
Chloroform (Chromatographic grade) – Baxter Catalogue # 049-4
Chloroform : methanol (2:1, v/v)
0.88% KCl (8.8 g KCl per liter distilled water)
Supplies:
General:
Teflon policeman spatula (Baxter Catalogue #R5115-2)
3 – 50 ml glass test tubes (for rinse solutions)
Pasteur pipettes
Per tissue sample:
2 - 50 ml glass screw – top tubes with Teflon lined caps
1 - 15 ml glass screw – top test tube with Teflon lined cap
1 – short stem glass funnel with #40 Whatman filter paper (12.5 cm
diameter)
Procedure:]
1. Weigh out 0.5 g tissue and place it in a 50 ml glass screw – top test tube.
2. Add 7 ml of methanol.
3. Homogenize for 20 seconds with Polytron homogenizer.
4. Add 14 ml of chloroform and homogenize again for 20 seconds.

80
5. Filter homogenate through #40 Whatman filter paper into another 50 ml glass screw-
top test tube.
6. Clean homogenizer. Fill 3 - 50 ml glass tubes: 2 with chloroform: methanol (2:1) and
one with distilled water. Run, for several seconds, the first tube of chloroform:
methanol (2:1), followed by the distilled water and the second tube of chloroform:
methanol (2:1). The same rinse solution can be used for 4 samples; then discard the
solution into the waste collection jar and replace the solution.
7. Allow samples to filter completely, but do not let it dry.
8. Using the police-man spatula, scrape the homogenate off the filter paper and place it
back into the same 50 ml glass tube used for the previous homogenization.
9. Add 12 ml chloroform: methanol (2:1), homogenize for 20 seconds, and refilter
through the same filter paper used previously; thus, collecting all of the solvent in the
same tube.
10. Add another 12 ml of chloroform: methanol (2:1) to the 50 ml glass tube and
homogenize for a short time (to recover all of the tissue homogenate) and pour the
solution over the residue from the previus filteration. Clean homogenizer as outlined
above in step 6.
11. When filteration is complete, add 8.5 ml (0.88%) KCl to each of the 50 ml tubes
containing the filtered liquid.
12. Cap the 50 ml glass tubes tightly and place in a horizontal shaker on low for 5 minutes.
13. Centrifuge the tubes for approximately 3 minutes a 1000 rpm to separate the aqueous
and organic phases. The lipids will remain in the lower (chloroform) layter.
14. Remove the upper, aqueous layer via vacuum aspiration.
15. Evaporate the chloroform layter which remains under a steady stream of N at 60°C
using N- Evap until approximately 3 ml remain.
16. Using a Pasteur pipette, transfer the remaining solution to a 15 ml screw - top glass
test tube. Rinse the 50 ml tube with 8 ml chloroform: methanol (2:1) and transfer the
rinsings to the same 15 ml tube.
17. This preparation will be methylated to determine total fatty acid content, following the
methylation procedures found in Appendix C.

81
References:
Beare-Rogers, J., 1985. Methods for Nutritional Assessment of Fats.
American Oil Chemists’ Society, Champaign, IL.
Bligh, E. G., and W. J. Deyer, 1959. A rapid method of total lipid
Extraction and purification. Can J. Biochem. Physiol. 37:911-917.
Christie, W. W., 1982. Lipid Analysis: Isolation, analysis and identification
of lipids. American Elsevier Publishing Co., Inc., N. Y.
Nelson, G.J., 1975. Analysis of Lipids and Lipoproteins. (Perkins, E. G., ed.)
pp 1-22, American Oil Chemists’ Society, Champaign, IL.

82
Appendix B
Yolk and Diet Lipid Extraction
Equipment:
N-Evap (Organomation Meyer N-Evap analyical evaporator model #112).
Horizontal shaker (Eberbach Corp.)
Multi tube vortex (American Scientific Product)
Reagents:
Methanol (Chromatographic grade) – Baxter Catalogue # 230-4
Chloroform (Chromatographic grade) – Baxter Catalogue #049-4
Chloroform : methanol (2:1, v/v)
Supplies:
General:
Teflon policeman spatula (Baxter Calalogue #R5115-2
3 - 50 ml glass test tubes (for rinse solutions)
Pasteur pipettes
Per yolk or fat sample:
2 - 50 ml glass screw – top test tubes with Teflon lined caps
1 - 15 ml glass screw – top test tube with a Teflon lined caps
1 – short stem glass funnel with #40 Whatman filter paper (12.5 cm
diameter)
Procedure:
1. Weigh out 0.5 yolk or fat and place it in a 50 ml glass screw – top test tube.
2. Add 9.5 ml chloroform: methanol (2:1) tightly cap the tubes and place in a test tube
rack.
3. Place the rack in a horizontal shaker on low for 5-10 minutes.
4. Move the shaken test tube rack to a rack vortexer and vortex for 3-5 minutes.
5. Filter the homogenate through #40 Whatman filter paper into another 50ml glass
screw – top test tube.
6. Allow sample to filter completely into a second 50 ml glass screw – top test tube.
7. Using a Pasteur pipette, transfere 400 ? into a 15 ml glass screw –top tube.

83
8. This preparation will be methylated to determine total fatty acid content, following the
methylation procedures found in Appendi.
References:
Beare-Rogers, J., 1985. Methods for Nutritional Assessment of Fats.
American Oil Chemists’ Society, Champaign, IL.
Bligh, E. G., and W. J. Deyer, 1959. A rapid method of total lipid
Extraction and purification. Can J. Biochem. Physiol. 37:911-917.
Christie, W. W., 1982. Lipid Analysis: Isolation, analysis and identification
of lipids. American Elsevier Publishing Co., Inc., N. Y.
Nelson, G.J., 1975. Analysis of Lipids and Lipoproteins. (Perkins, E. G., ed.)
pp 1-22, American Oil Chemists’ Society, Champaign, IL.

84
Appendix C
Methylation of Lipids
Equipment:
N-Evap (Organomation Meyer N-Evap analytical evaporator model #112).
100-1000 ? Eppendorf pippettor
Dry block heater
Centrifuge
Reagents:
Iso-octane (Chromatographic grade) – Baxter Catalogue #362-4
Boron Trifluoride (BF3, 12% in methanol) – Supelco Catalogue #3-3021
0.5 N NaOH (in methanol)
Triglyceride standard solution in chloroform: methanol (2:1)- NuChek Prep Inc.
Fatty Acid Catalogue Amount (mg)16:1 T-150 850.016:1n7 T-215 150.017:0 T-155 50.018:0 T-160 900.018:1n9 T-235 1050.0t18:2n6 T-255 50.018:2n6 T-250 1000.018:3n6 T-265 50.018:3n3 T-260 75.020:0 T-170 50.020:1n9 T-270 50.020:2n6 T-280 50.020:3n6 T-285 50.020:4n6 T-295 400.022:4n6 U-83-M 75.022:6n3 T-310 100.0
Reagents: (cont’d)
Internal standard solution (40µg/µl 17:1 in chloroform: methanol (2:1)
NuChek Prep Inc. – C 17: 1 10-heptadecaenoic methyl-code U-42-M
Supplies: (per sample being methylated)
15 ml glass screw-top test tube
Eppendorf pipette tips

85
Pasteur pipettes
Crimp vials (Hewlett Packard Catalogue #5181-3375) and caps (Hewlett Packard
Catalogue #5181-1210)
Procedure:
1. Lipid samples are already dissolved in chloroform: methanol (2:1) and ready for
methylation in 15 ml glass screw – top test tubes.
2. Add appropriate amount of troglyceride standard (TG STD) and internal standard
(INT STD) to each 15 ml glass screw- top test tube:
Sample TG STD INT STD
Yolk or Pure Fat 10µl 10µl
Heart or Liver:
Day old 10µl 10µl
4 WOA 20µl 20µl
Hen 10µl 20µl
Uterus 10µl 10µl
3. Evaporate the solution down to 2-3 drops, under a steady stream of N at 60°C, using
N-Evap.
4. Add 400µl 0.5 N NaOH to the 15 ml glass screw-top test tubes and cap tightly.
5. Place tubes in a 100°C dry block heater for 5 munutes to saponify the lipids.
6. Remove tubes from the dry block heater and place into a test tube rack. Cool the test
tubes by running cold tap water over the rack.
7. Uncap tubes (keeping the caps with the corresponding tubes) and add 0.4 ml BF3,
recap all tubes tightly.
8. Place tubes in a 100°C dry block heater for 5 minutes to methylate the fatty acids.
9. Remove tubes from the dry block heater and place into a test tube rack. Cool tubes by
running cold tap water over the rack.
10. Uncap tubes (keeping each cap with the corresponding tube), add 1 ml iso-octane and
8.5 ml distilled water. Recap the tubes tightly and place in a test tube rack.
11. Place the test tube rack in a horizontal shaker on a low speed for 5 minutes.

86
12. Centrifuge samples for 10 minutes at 2000 rpm to separate the solvent phases (While
this is occurring, label 1.5 ml crimp vials with both a diamond tipped pen and a
marker; place sodium sulfate, a dessicant, in each vial to a depth of 1 mm.).
13. Remove the test tubes from the centrifuge. Using a Pasteur pipette, the upper iso-
octane layer (containing the methylated fatty acids) to a crimp vial and cap.
14. The sample is now ready for injection into the gas chromatograph. Store at -20°C until
all samples are ready for fatty acid analysis by the GC.
References:
Christopherson, S. W., and R. L. Glass, 1969. Preparation of milk fat methyl esters by
alcoholysis in an essentially nonalcoholic solution. J. Dairy Sci. 52:1289-1290.
Metacalfe, L. D., and A. A. Schmitz, 1961. The rapid preparation of fatty acids esters for
gas chromatographic analysis. Anal. Chem. 33:514-515.
Metacalfe, L. D., A. A. Schmitz and J. R. Pelka., 1966. Rapid preparation of fatty acid
esters from lipids from gas chromatographic analysis. Anal. Chem. 38:514-515.
Nelson, G. J., S. Darshan, and J. E. Hunt, 1986. Effect of nutritional status on fatty acid
Composition of rat liver and cultured hepatocytes. Lipids 21:454-459.

87
Appendix D
Fatty Acid Analysis by Gas Chromatography
Equipment:
Crimp vials (Hewlett Packard Catalogue #5181-3375) with sealed caps (Hewlett
Packard Catalogue #518101210) containing prepared samples for fatty acid analysis.
Gas chromatograph (Hewlett Packard model #5890) with automatic sampler
(Hewlett Packard model #7673) and integrator (Hewlett Packard model #3393)
Fused silica capillary column (J & W Scientific model #DB225), 30 m long, 0.15
mm inner diameter and 0.15µm wide.
Procedure:
1. Load prepared standard vials into the automatic samplers first and begin analysis. Use
these results as standards to compare all results to.
2. Load all other prepared vials into the automatic sampler and run.
3. Multiply yolk and dietary fatty acids by 20 (only 1/20th of the sample was used.
References:
Hewlett Packard GC model #5890 with automatic sampler (Hewlett Packard model
#7673) and integrator (Hewlett Packard model #3393) instruction guide.
Nelson, G. J., S. Darshan, and J. E. Hunt, 1986. Effect of nutritional status on fatty acid
composition of rat liver and cultured hepatocytes. Lipids 21:454-459.

88
VITA
Douglas Lumont Taylor was born on April 11, 1974 in Garysburg, North Carolina
to Omessia and Haywood L. Arrington. After attending public school in Garysburg,
North Carolina, he graduated from Northampton County High School-West in June, 1992.
He pursued his studies at North Carolina Agricultural and Technical State University and
graduated with an B. S. degree in Agricultural Science (Animal Science) in May, 1996. In
August, 1996 he entered the graduate program at Virginia Polytechnic Institute and State
University, Blacksburg, Virginia, and received a M. S. in Animal and Poultry Science in
May, 1998 under the supervision of Dr. D. M. Denbow
Douglas L. Taylor

79