Embed Size (px)
Citation preview

Effect of metabolic presbyacusis on cochlear
responses: A simulation approach using a
physiologically-based model
Amin Saremi and Stefan Stenfelt
Linköping University Post Print
N.B.: When citing this work, cite the original article.
Original Publication:
Amin Saremi and Stefan Stenfelt, Effect of metabolic presbyacusis on cochlear responses: A
simulation approach using a physiologically-based model, 2013, Journal of Acoustical Society
of America, (134), 4, 2833-2851.
http://dx.doi.org/10.1121/1.4820788
Copyright: Acoustical Society of America
http://acousticalsociety.org/
Postprint available at: Linköping University Electronic Press
http://urn.kb.se/resolve?urn=urn:nbn:se:liu:diva-98271

1 Biophysics of an Aging Cochlea
Effect of Metabolic Presbyacusis on Cochlear Responses: A Simulation Approach Using a
Physiologically-based Model
Amin Saremi
Department of Clinical and Experimental Medicine, Division of Technical Audiology,
Linköping University, SE-581 85, Sweden, and Linnaeus Centre HEAD, Swedish Institute for
Disability Research,
Stefan Stenfelt
Linnaeus Centre HEAD, Swedish Institute for Disability Research, Department of Clinical
and Experimental Medicine, Division of Technical Audiology, Linköping University, SE-581
85, Sweden.
Corresponding author; electronic mail: [email protected]
Phone: +46 764490119, +46 10 1038629
Fax: +46 13 28214

2 Biophysics of an Aging Cochlea
Abstract
In the presented model electrical, acoustical, and mechanical elements of the cochlea are
explicitly integrated into a signal transmission line where these elements convey physiological
interpretations of the human cochlear structures. As a result, this physiologically-motivated
model enables simulation of specific cochlear lesions such as presbyacusis. The hypothesis is
that high-frequency hearing loss in older adults may be due to metabolic presbyacusis
whereby age-related cellular/chemical degenerations in the lateral wall of the cochlea cause a
reduction in the endocochlear potential. The simulations quantitatively confirm this
hypothesis and emphasize that even if the outer and inner hair cells are totally active and
intact, metabolic presbyacusis alone can significantly deteriorate the cochlear functionality.
Specifically, in the model, as the endocochlear potential decreases, the transduction
mechanism produces less receptor current such that there is a reduction in the battery of the
somatic motor. This leads to a drastic decrease in cochlear amplification and frequency
sensitivity, as well as changes in position-frequency map (tuning pattern) of the cochlea. In
addition, the simulations show that the age-related reduction of the endocochlear potential
significantly inhibits the firing rate of auditory nerve which might contribute to the decline of
temporal resolution in the aging auditory system.
PACS numbers: 4364Bt, 4364Kc, 4366Sr.

3 Biophysics of an Aging Cochlea
I. INTRODUCTION
Age-related hearing loss (ARHL) is currently one of the top three most widespread
chronic health issues among individuals over 65 years old (Gordon-Salant, 2010). As the life
expectancy is rapidly increasing globally, ARHL will impose even more social and economic
costs on both individuals and the welfare system. In spite of this, its underlying mechanisms
are not entirely known; moreover, today’s regular clinical tests do not clearly differentiate the
physiological origins of the inner-ear pathologies (Stenfelt and Ronnberg, 2009).
It is strongly believed that many major features of human auditory system such as
compression, dynamic range, active amplification, frequency discrimination, and temporal
coding are firmly attributed to functionality of the cochlea (Moore, 2003), a spiral-shaped
cavity in the inner ear. Several human and animal studies have suggested that ARHL may
substantively take root from age-related metabolic/cellular degenerations in the lateral wall of
the cochlea and especially the stria vascularis (Schmiedt et al., 2002; Mills et al., 2006; Lang
et al., 2010). This leads to decline of the electrical potentials inside the mammalian cochleae,
a medical condition known as metabolic presbyacusis.
The stria vascularis is a vascularized tissue at the lateral wall of the cochlea which
injects the potassium ions (𝑘+) into the scala media (SM). This is directly linked to the
existing 89mV endocochlear potential (EP) along the human cochlear duct (Slepecky, 1996).
Most of the lateral wall cells are fibrocytes. Because of the age-related changes in these cells,
the 𝑘+ recycling is impaired and is not capable of maintaining the original EP anymore. One
candidate for being an underlying metabolic cause of such age-related degenerations is the
trans-membrane protein Cadherin (calcium-dependent adhesion). Trowe et al. (2011) showed
that age-related loss of E-cadherin in wild mice interferes with the architectural maintenance
of the basal and marginal fibrocystic cells which leads to loss of stria vascularis integrity and
eventually a notable decrease of the EP inside the cochlea.
4 Biophysics of an Aging Cochlea
Models have been exploited as powerful analytical tools to sharpen our understanding
of various mechanisms and systems. Over the last five decades, several auditory filter models
have been developed to analyse hearing-related mechanisms and apply to various
psychoacoustical measures of the auditory system. These computational models classically
exploit different types and combinations of filters such as gammatone filters including all-
pole versions and the gammachirps [e.g. (Irino and Patterson, 2001)] to mimic the processing
stages of the auditory system. As a matter of fact, the more recent auditory filter models are
capable of reproducing several key features of the auditory system such as tuning, critical
bands, compression and frequency- and level-dependent amplitude responses [see (Meddis
and Lopez-Poveda, 2010) for a review]. Moreover, these computational models are very
useful for being incorporated within advanced machine hearing-systems. However, for such
models the strategy is to mimic the over-all psychoacoustic outcomes by means of filter banks
without directly linking these outcomes with fundamental biophysical details and undergoing
cellular subprocesses.
In the last decade or so, the evolution of measurement techniques have led to
experimental data on cell-level structural details and their corresponding mechanisms inside
the inner ear (Cooper, 1998; de Boer and Nuttall, 2000; Rubles and Ruggero, 2001; Nowotny
and Gummer, 2005; Ghaffari et al., 2007; Chen et al., 2011). Based on these explicit findings,
new models have been developed to either explain functionality of specific parts of the
mammalian cochlear system (Lopez-Poveda and Eustaquio-Martin, 2006; Liu and Neely,
2009) or to simulate the entire cochlear responses (Ramamoorthy et al., 2007). The difference
between these newer models and the classic filter models is that these newer models comprise
more fundamental biophysical parameters such as electromechanical properties of the
cochlear structures rather than solely computational filters.

5 Biophysics of an Aging Cochlea
The physiologically-based model presented here belongs to this latter generation of
auditory models. The model incorporates passive vibrations; nonlinear transduction of the hair
cells, the outer hair cell’s (OHC’s) somatic motor, as well as the tectorial membrane (TM),
shearing and vibration to neural conversion at the inner hair cells (IHCs). The input to the
model is the sound-induced acoustical vibration of the stapes and the output of the model is
the neural activity on the afferent auditory nerve (AN). The current model is developed with
the aim of simulating how an age-related degeneration of the EP (metabolic presbyacusis)
modifies the frequency characteristics and the temporal features of the cochlear responses.
According to the simulation results, the model overcomes the issue of the OHC’s body
time-constant meaning that the somatic motor is capable of supplying power at frequencies
way above the cut-off of the OHC basolateral membrane. Besides, the model incorporates
longitudinal coupling whereas most of the ‘classical’ models assume that cochlear structures
are longitudinally de-coupled except for the energy propagation through the fluid, to obtain
simplicity (Ghaffari et al., 2007). Here however, the structural coupling is included and its
significant influence on the amplification and tuning pattern of the cochlea is discussed.
The human cochlea is totally buried in petrous bones which makes it rather inaccessible
for in vivo measurements. However, experimental data on the guinea-pig and gerbil cochleae
are partly available (de Boer and Nuttall, 2000; Cooper, 1998; Schmiedt, 2002). Therefore,
wherever it is necessary, the electromechanical parameters of the model are modified to those
of the guinea-pig to enable the quantitative comparison between these experimental data and
the predictions of the model.
II. MODELING METHOD
Inside the SM lies the organ of Corti which is sandwiched between two cellular
matrices, the basilar membrane (BM) and the tectorial membrane (TM) (Nam and Fettiplace,
2011). An airborne sound pressure field is transmitted via the outer and middle ear to the

6 Biophysics of an Aging Cochlea
inner ear. It causes the stapes to vibrate resulting in a travelling wave along the organ of Corti
propagating from the base towards the apex (Bekesy, 1960). The organ of Corti rests on the
BM; The displacement on the BM deflects the OHC’s stereocillia, opens the
mechanoelectrical transduction (MET) channels and eventually triggers an active electro-
mechanical element –the OHC- which stretches against the reticular lamina (RL) on one side
and the BM on the other side (Lu et al., 2009). This molecular force generator is known as the
somatic motility.
The somatic motor boosts the vibrations along the cochlear duct by pumping active
force and energy into the transmission line. These boosted vibrations are transmitted to the
IHCs via RL-TM shearing and are converted to changes in receptor potentials that instantly
modulate neurotransmitter release at synapses on the auditory nerve afferents towards the
central auditory cortices (Slepecky, 1996).
------- Please Insert Figure 1 here-------
As depicted in Fig. 1, the entire organ of Corti is modeled to consist of ‘N’ discrete
partitions along the cochlear duct extending from the base (on the left) to the apex (on the
right) according to the lumped element modeling approach. Each vertical branch of the
transmission line in Fig. 1 represents a single cochlear partition. Each partition comprises
three passive mechanical loads: BM, RL and TM. The OHCs are suspended between the RL
and the BM; and the OHC motile forces (depicted by 𝑓𝑂𝐻𝐶 in Fig. 1) are represented by a pair
of forces inside the organ of Corti which on a cycle-to-cycle basis alternately pull the RL and
the BM (via Dieters cells) together and push them apart. For simplicity, the Dieters supporting
cells have been considered as incompressible masses here.
As illustrated Fig. 1, the EP controls the functionality of both OHCs and IHCs by
providing them with the necessary supply voltage. Thus, a reduction of the EP modifies the
functionality of both OHCs and IHCs and consequently reshapes the frequency characteristic

7 Biophysics of an Aging Cochlea
and temporal features of the cochlear response. Figure 2 illustrates a single cochlear partition
along the organ of Corti. This 𝑖𝑡ℎ partition consists of two passive loads (BM and RL) and an
active electro-mechanical component (OHC) acting between them.
------- Please Insert Figure 2 here-------
A. The Passive Loads
In order to explain the vibrations, each single passive mechanical load is modeled by a
viscous ‘mass-spring-damper’ combination. Thus for a typical 𝑖𝑡ℎ partition, the BM is
represented by its mass (𝑀𝑏𝑖), its stiffness (𝐾𝑏𝑖) and its damping coefficient (𝑅𝑏𝑖). Similarly,
RL and TM are modeled by (𝑀𝑟𝑖 , 𝐾𝑟𝑖, 𝑅𝑟𝑖) and (𝑀𝑡𝑖 , 𝐾𝑡𝑖 , 𝑅𝑡𝑖), respectively. Here, only the
shearing impedance of the TM is included and the bending impendence has been neglected.
The OHC’s body is similarly modeled by a passive ‘mass-spring-damper’ (𝑀𝑂𝐻𝐶𝑖,
𝐾𝑂𝐻𝐶𝑖, 𝑅𝑂𝐻𝐶𝑖
). For simplicity, the OHC’s molecular motor is assumed to be centered in the
middle of the OHC. Therefore, the OHC’s mass (𝑀𝑂𝐻𝐶𝑖) can be equally distributed between
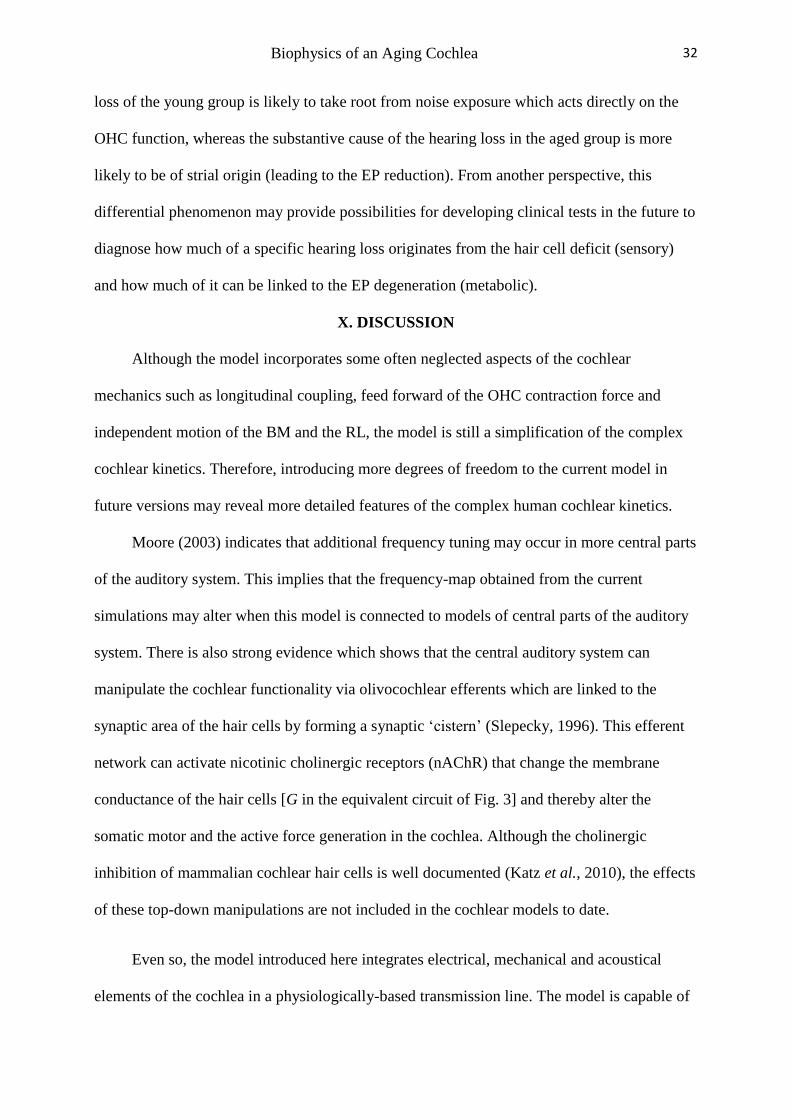
the two loads, RL and BM. The values of these mechanical parameters are presented in Table
I of Appendix A.
B. Active Processes
To explicitly investigate the active force generation inside the cochlea a 3-stage system
is introduced in Fig. 3. The corresponding sub-processes are: 1) The stria vascularis: the
biological battery. 2) The MET: the driver of OHC’s molecular motor. 3) The somatic
motility: the OHC’s molecular motor.
------- Please Insert Figure 3 here-------
1. Stria Vascularis: The Biological Battery of the Somatic Motor
The stria vascularis continuously pumps potassium ions (𝑘+) into the cochlear
endolymph of SM (Slepecky, 1996). The flow of these electrically-charged ions (𝑘+) directly

8 Biophysics of an Aging Cochlea
contributes to the existing potential difference of 89mV between SM and scala tympani (ST)
observed in a healthy human cochlea.
The stria vascularis as a vascularized cellular body can be represented by a
resistance, 𝑅𝑠𝑡. The electromechanical gradients driving the flow of the 𝑘+ ions into the SM is
represented by an ideal voltage source (battery), EP, and the fluid resistance inside the SM is
denoted by 𝑅𝑠𝑚, as shown in Fig 3. This biological battery supports the cochlear system by
providing the MET channels of both the OHCs and the IHCs with the current (𝐼𝑠𝑎𝑡). Thus, EP
is illustrated as a controller of the OHC and the IHC blocks in Fig. 1.
2. MET: The Driver of the Somatic Motor
There are approximately 10 000 outer hair cells per human cochlea and there may be up
to 200 MET channels per cell (Fettiplace and Hackney, 2006). The key element of existing
models of transduction is that the MET channels are opened by the applied elastic forces, the
‘gating springs’, which are stretched when the hair bundle (HB) is swerved. The MET
channel is a cation channel most selective for 𝐶𝑎2+ (Fettiplace and Hackney, 2006). The
opening of the MET channels results in release of charged 𝐶𝑎2+ions which induce a receptor
current (𝑖𝑟). This receptor current, in turn, triggers the somatic motor. Thus the OHC MET
mechanism can be regarded as the ‘driver’ for the somatic motor and the whole cochlear
amplifier.
------- Please Insert Figure 4 here-------
The MET channels open in approximately 100 microseconds (fast adaption) generating
a peak current(Fettiplace and Hackney, 2006); the channels then re-close slowly (slow
adaption) and the receptor current decays to a non-zero residual level (𝐼𝑟𝑒𝑠) with a specific
time constant. The relation between RL displacement (𝛥𝑥𝑟) and the peak current induced by
opening of the MET channels is estimated by a first-order Boltzmann function (Slepecky,
1996). Equation (1) gives the curve shown in Fig. 4(a).

9 Biophysics of an Aging Cochlea
𝑖𝑟 =𝐼𝑠𝑎𝑡
1+(𝐼𝑠𝑎𝑡𝐼𝑟𝑒𝑠
−1).𝑒−𝑍.𝛥𝑥𝑟 (1)
According to Eq. (1), the shape of the MET curve is determined by three physiological
parameters 𝐼𝑠𝑎𝑡, 𝐼𝑟𝑒𝑠 and Z. The saturation current (𝐼𝑠𝑎𝑡) is the maximal receptor current inside
the SM which is provided by the ‘physiological battery’ of the stria vascularis, as previously
described. The non-zero residual current (𝐼𝑟𝑒𝑠) is an off-set parameter for the MET curve and
is measured in some mammalians to be between 3% to 7% of the saturation current [(Holt et
al., 1997), Fig. 3]. The parameter Z denotes the instantaneous potential difference between the
opened and closed states of the MET channels (Patuzzi and Moleirinho, 1998).
These three parameters may differ from basal to apical regions leading to various MET
curves; however, such variations are not considered in the current model. In other words, the
MET curve seen in Fig. 4 is assumed here to apply to all positions along the cochlear duct. It
has been shown that using a second-order Boltzmann function (a three-state MET channel)
results in more sensitivity around the resting position and thus can be a more realistic model
of the MET mechanism (Slepecky, 1996). However, here a first-order Boltzmann is used to
keep the parameters to only three biological parameters.The values for these MET parameters
are presented in Table III of Appendix A.
Figure 4(a) illustrates the Boltzmann function [Eq. (1)] for two conditions: 1. a healthy
cochlea where the stria vascularis is capable of recycling and pumping sufficient amount of
potassium ions in order to maintain the maximum EP of 89 mV (solid lines), 2. an impaired
cochlea where the EP has degenerated to half of its maximum (EP=44.5 mV) as a result of
age-related metabolic failures in stria vascularis. When the EP is decreased to its half, the
saturation current (𝐼𝑠𝑎𝑡) in Fig. 3 is decreased to its half as well. According to Eq. (1) this
reshapes the MET curve [Fig. 4, dashed lines].
Equation (1) includes only information about the peaks of the receptor current known as
the ‘fast adaption’ and not the whole process. To also include the ‘slow adaption’ concept

10 Biophysics of an Aging Cochlea
above (re-closure of the MET channels) as well, Eq. (1) should be combined with Eq. (6),
described shortly.
3. OHC Motility: the Somatic Motor
The experiments have demonstrated that individual OHCs, dissociated from the cochlea
and then electrically stimulated, shorten in response to depolarization and lengthen for hyper-
polarization (Fettiplace and Hackney, 2006). Because of the high speed of their mechanical
response, these cells can theoretically alter their length in synchrony with the incoming
acoustical stimulus for the frequencies spanning the entire auditory range, pulling/pushing the
RL and the BM and thereby pumping energy into the transmission line of Fig. 1. This
molecular motor is modeled here as proposed by Liu and Neely (2009). The OHC’s
membranous body has a conductance G and capacitance C; thus the receptor current (𝑖𝑟)
induces a receptor voltage (𝑉𝑟). The somatic motor is believed to be driven by this receptor
voltage (Liu and Neely, 2009).
The piezoelectric component [the dashed box in Fig. 3] represents the electromechanical
interaction whereby the gating current 𝑖𝑑 is converted to a mechanical contraction force
( 𝑓𝑂𝐻𝐶) with the piezoelectric transform ratio of T. This leads to a mechanical velocity
(𝑥�̇�) acting over the output mechanical load impedance (𝑍𝑙𝑜𝑎𝑑), which consists of the RL
from one side and the BM from the other side. If the contraction of the OHC (𝑥𝑜) is the output
of the somatic motor, the nonlinear circuit shown in Fig. 3 can be solved in the time domain
according to Eq. (2) below. The values for the parameters of this piezoelectric model are
presented in Table II of Appendix A.
𝑥𝑜(𝑡) = 𝑖𝑟(𝑡).
𝑇. (𝑍𝑙𝑜𝑎𝑑. ∫1𝑐𝑔
𝑑𝑡)−1
𝑑 [(𝐺 +𝑑𝐶𝑑𝑡
) + (∫1𝑐𝑔
𝑑𝑡 + 𝑍𝑙𝑜𝑎𝑑)]
𝑑𝑡
(2)

11 Biophysics of an Aging Cochlea
As shown in Fig. 2, the OHC contraction force (𝑓𝑂𝐻𝐶) pulls/pushes two parallel
mechanical loads in relation to each other: 1. a BM load (via path 1) with an impedance of
𝑍𝐵𝑀 = (𝑀𝑏 +𝑀𝑂𝐻𝐶
2) . 𝑗𝜔 + 𝑅𝑏 +
𝐾𝑏
𝑗𝜔 and 2. a RL load (via path 2) with an impedance
of 𝑍𝑅𝐿 = (𝑀𝑟 +𝑀𝑂𝐻𝐶
2) . 𝑗𝜔 + 𝑅𝑟 +
𝐾𝑟
𝑗𝜔 where 𝑗 denotes the imaginary unity (√−1 ) and 𝜔 is
the angular velocity. The load impedance, 𝑍𝑙𝑜𝑎𝑑, can then be written according to Eq. (3).
𝑍𝑙𝑜𝑎𝑑 = 𝑍𝐵𝑀||𝑍𝑅𝐿 =𝑍𝐵𝑀 . 𝑍𝑅𝐿
𝑍𝐵𝑀 + 𝑍𝑅𝐿 (3)
C. Inner Hair Cells (IHCs)
The IHCs convert sound-induced motion of the RL (via TM) into changes in receptor
potentials that instantly regulate neurotransmitter release at synapses on the auditory nerve
afferents (Fettiplace and Hackney, 2006). One of the most poorly understood details of
cochlear mechanics is how RL motion leads to deflection of IHC HB and finally excitation of
the auditory nerve fibers. The common conception is that IHC excitation is due to shearing
between RL and TM (Slepecky, 1996); however, recent works indicate that deflection of the
OHC HB changes the RL-TM space (the gap between RL and TM) and produces a fluid flow
in the gap that bends the IHC HB (Li et al., 2011).
Nowotny and Gummer (2005) also confirm this by showing the phase difference
between the TM and the RL which results in a stimulus-dependent modulation of the width of
the subtectorial gap leading to pulsating of the subtectorial fluids. They conclude that instead
of the RL-TM shearing, this subtectorial flow may directly couple somatic electromotality of
the OHCs to the HB of the IHCs. For simplicity, such a subtectorial flow is neglected in this
work and the classic ‘RL-TM shearing’ view is adopted for the current model.
Ninety-five percent of the auditory nerve fibers innervate the IHCs (Slepecky, 1966);
they carry the temporal information necessary for auditory processing by the central nervous
system (Slepecky, 1996). The IHCs lack prestin and, therefore, any associated active somatic

12 Biophysics of an Aging Cochlea
contractility; they are believed to function as sensory elements (Fettiplace and Hackney,
2006). The peak receptor current (ir) induced by opening of the IHC MET channels as a
function of HB displacement is also estimated by a Boltzmann function similar to that of the
OHC MET. However, two of the three physiological parameters (𝐼𝑟𝑒𝑠 and Z) differ from that
of the OHC MET. These two parameters were estimated from measurements on the IHC
receptor currents in the gerbil cochlea [(Jia et al., 2007), Fig. 1]. Those measurements have
been carried out in both apical and basal turns of the cochlea leading to two different MET
curves; here such variations have been neglected for simplicity and the averaged parameters
are generalized for the entire cochlear length [Fig. 4(c)].
D. The Transmission Line, Coupling and the Loading Effect
Cochlear models typically assume that BM is longitudinally uncoupled.
Mathematically, the decoupled BM is very attractive to modelers; it allows the equations that
describe the motion of a single partition to be independent of the equations that describe the
motion of other adjacent partitions along the cochlear duct. As a result, most cochlear models
today are based on locally reacting representation of the discrete cochlear partitions, whereby
the cochlear partitions are assumed to be longitudinally uncoupled except for energy
propagation through the fluid (Ghaffari et al., 2007).
Naidu and Mountain (2001) have quantified longitudinal coupling along the BM of
gerbils. Besides, Meaud and Grosh (2010) have also introduced a 3-dimensional model of the
cochlea and simulated the effect of TM longitudinal coupling on the cochlear response; they
demonstrated that structural longitudinal coupling is non-negligible.
In the current model, the longitudinal coupling along the organ of Corti is modeled by
springs and dampers between the cochlear partitions along the transmission line (𝐾ℎ𝑖 , 𝑅ℎ𝑖 in
Fig. 1). This approach is very similar to the one-dimensional model of [Naidu and Mountain
(2001), Fig. 7], except that, here the longitudinal damping (𝑅ℎ𝑖) is also included. By adding

13 Biophysics of an Aging Cochlea
the longitudinal coupling (𝐾ℎ𝑖, 𝑅ℎ𝑖) in the transmission line of Fig. 1, the 𝑖𝑡ℎ cochlear
partition has an equivalent impedance of ( 𝑍𝑝𝑎𝑠𝑠𝑖𝑣𝑒)𝑖 according to Eq. (4) below.
( 𝑍𝑝𝑎𝑠𝑠𝑖𝑣𝑒)𝑖
= 𝑀𝑏𝑒𝑓𝑓𝑖. 𝑗𝜔 + 𝑅𝑏𝑒𝑓𝑓𝑖
+𝐾𝑏𝑒𝑓𝑓𝑖
𝑗𝜔+ [( 𝑍𝑝𝑎𝑠𝑠𝑖𝑣𝑒)𝑖+1| | (𝑅ℎ𝑖 +
𝐾ℎ𝑖
𝑗𝜔)] (4.a)
𝑀𝑏𝑒𝑓𝑓𝑖= 𝑀𝑏𝑖 + 𝑀𝑂𝐻𝐶𝑖
+ 𝑀𝑟𝑖 + 𝑀𝑡𝑖 (4.b)
𝐾𝑏𝑒𝑓𝑓𝑖= 𝐾𝑏𝑖 + 𝐾𝑂𝐻𝐶𝑖
+ 𝐾𝑟𝑖 + 𝐾𝑡𝑖 (4.c)
𝑅𝑏𝑒𝑓𝑓𝑖= 𝑅𝑏𝑖 + 𝑅𝑂𝐻𝐶𝑖
+ 𝑅𝑟𝑖 + 𝑅𝑡𝑖 (4.d)
Where 𝑀𝑏𝑒𝑓𝑓𝑖, , 𝐾𝑏𝑒𝑓𝑓𝑖
, 𝑅𝑏𝑒𝑓𝑓𝑖 are respectively the effective acoustical mass, stiffness
and damping of 𝑖𝑡ℎ partition resting on the BM. The term ( 𝑍𝑝𝑎𝑠𝑠𝑖𝑣𝑒)𝑖+1 denotes the passive
impedance loaded to the partition by the proceeding (𝑖 + 1)𝑡ℎ partition via the longitudinal
coupling. This phenomenon, addition of the impedances of proceeding partitions on the
previous ones, is referred to as loading effect.
The passive system is solved by converting it to its equivalent electrical analogy, as
described by Saremi and Stenfelt, (2011). The longitudinal components (𝑅ℎ𝑖 and 𝐾ℎ𝑖) are
assumed to be fractions of the partition’s effective stiffness and damper resting on the BM.
The fraction is determined so that Eq. 4 above gives characteristic frequencies (CFs) similar
to the position-frequency map of a passive cadaver cochlea [(Bekesy, 1960), Fig. 11-43].
E. Linearization and Small-Signal Analysis
The nonlinearity in this cochlear model originates from two different sources: 1) the
MET mechanism [as seen in the curves of Fig. 4], and 2) the OHC’s gating capacitance (𝑐𝑔)
in the piezoelectric circuit of the somatic motility [Fig. 3].
The gating capacitance (𝑐𝑔) depends on the density of the motor molecules (prestin) in
the OHC lateral membrane and is decreased as the cell is hyperpolarized (Santos-Sacchi,
1991). It was argued by Pattuzi (1996) that linearization of 𝑐𝑔is mathematically legitimate as
long as the membrane potential (V) does not fluctuate more than tens of millivolts. Liu and

14 Biophysics of an Aging Cochlea
Neely (2010) showed in their simulations that changes in membrane potential (V) as a result
of stimuli was no larger than 4 mV for single tones at a high intensity of 110 dB SPL at the
frequency range of 0.125 to 8 kHz. Also, they showed that with typical stiffness-dominated
loads, the nonlinear gating capacitance can be assumed linear.
1. Small-signal Analysis of the MET
A non-linear system such as the cochlea can be analyzed in time domain only,
withholding the analysis of the cochlear frequency response. Fortunately, the MET curve
created by Eq. (1) [seen in Fig. 4(a)] can be linearized using a small-signal approach whereby
the linearization is formed around a specific point (operating point) on the MET curve. The
linearization is regionally valid for small excursions around this operating point [the small
line in Fig. 4(a)]. This enables further investigation and simulation of the cochlear response in
the frequency domain at different sound intensities as long as the fluctuation in the sound
intensity is small enough. As the small-signal model takes different operating points on the
MET curve, the linear relation between the displacement and the receptor current around that
operating point is given according to Eq. (5) below:
𝑖𝑟 = 𝛼𝑑 . 𝑥𝑟𝑙 (5)
Here 𝑥𝑟𝑙 is the RL displacement and 𝛼𝑑 denotes the first derivative (slope) of the MET
curve at the operating point [see Fig. 4(b)]; it also represents a displacement-to- current gain.
Experiments have demonstrated that the receptor current has a fast adaption to a step
deflection of the HB (Fettiplace and Hackney, 2006); the peaks of the receptor current
corresponding to the fast adaption were estimated by Eq. 1 and were shown in Fig. 4.
However, there is a slow adaption as the MET channels re-close. Thus, the receptor current
has a low-pass filtered response to a velocity impulse which has not been included in Eq. (5);
this requires addition of an extra term leading to Eq. (6) below (Liu and Neely, 2010).
𝑖𝑟 = 𝛼𝑑. 𝑥𝑟𝑙 + 𝛼𝑣. (𝑑𝑥𝑟𝑙
𝑑𝑡) → 𝐼𝑟(𝑗𝜔) = 𝑋𝑟𝑙(𝛼𝑑 + 𝛼𝑣. 𝑗𝜔) (6)

15 Biophysics of an Aging Cochlea
Where the term 𝑑𝑥𝑟𝑙
𝑑𝑡 is the RL velocity and 𝛼𝑣 denotes a velocity-to-current gain
corresponding to MET’s sensitivity to RL velocity (Liu and Neely, 2010). An interpretation of
Eq. (6) is that the receptor current is sensitive to the velocity of the HB as well as to its
displacement. As emphasized by Lu et al. (2009), a velocity-sensing HB accounts for more
features of cochlear amplification than a displacement-sensing HB only. According to Eq. (6),
𝑖𝑟 can be written in frequency domain as 𝐼𝑟(𝑗𝜔).
Another interpretation of Eq. (6) is that it introduces a linear time-invariant (LTI)
system with a time constant of 𝛼𝑣
𝛼𝑑 modeling the ‘gating spring’. The MET current is induced
in response to a displacement step of the HB (fast adaption) [the peak currents are estimated
by Eq. (1)] then the MET channels are slowly reclosed and the induced current is adapted
with a sub-millisecond time constant (slow adaption). The experiments in-vivo showed a time
constant of 230 𝜇𝑠 [Fettiplace et al. (2005), Fig. 2(B)] for mice. However for humans, as Liu
and Neely (2009) proposed, we used a tenfold larger time constant to calculate 𝛼𝑣 here.
2. Frequency Response of a Single Cochlear Partition
The passive mechanical components of the transmission line (masses, springs and
dampers) are all linear components. Therefore, the frequency response of a single passive
cochlear partition [𝐻𝑡𝑟𝑖𝑔 𝑖𝑛 Fig. 2(b)] , defined as its displacement with regards to the
displacement of the previous partition, can be calculated using Eq. (4.a).
An important benefit of linearization is that the OHC somatic motor can be regionally
characterized by a transform function 𝐻𝑜(𝑗𝜔) = 𝑋𝑜(𝑗𝜔)
𝑋𝑟𝑙(𝑗𝜔) as well; which relates OHC
contraction (𝑋𝑜) with the RL displacement (𝑋𝑟𝑙). This transfer function can be regarded as an
open-loop displacement gain produced by the OHC.
Converting Eq. (2) from time domain into the frequency domain and inserting 𝐼𝑟(𝑗𝜔)
from Eq. (6) in it, gives the following equation (Liu and Neely, 2010).

16 Biophysics of an Aging Cochlea
𝐻𝑜(𝑗𝜔) = 𝑋𝑜(𝑗𝜔)
𝑋𝑟𝑙(𝑗𝜔)→ 𝐻𝑜(𝑗𝜔) =
𝑇(𝛼𝑑+𝛼𝑣.𝑗𝜔)/𝑐𝑔
𝑗𝜔.𝑐𝑔+(𝐺+𝑗𝜔𝐶)[1+𝑇2.𝑐𝑔(𝐾+𝑗𝜔.𝑍𝑙𝑜𝑎𝑑)] (7)
Since the OHC somatic motor pulls BM and RL towards each other, RL and BM are
two parallel loads [Eq. (3)]; the OHC contraction is distributed between them according to
following Eq. (8.a) and Eq. (8.b).
𝐻𝑜𝐵𝑀(𝑗𝜔) = 𝐻𝑜(𝑗𝜔).
𝑍𝑅𝐿
𝑍𝐵𝑀 + 𝑍𝑅𝐿 (8. 𝑎)
𝐻𝑜𝑅𝐿(𝑗𝜔) = 𝐻𝑜(𝑗𝜔).
𝑍𝐵𝑀
𝑍𝐵𝑀 + 𝑍𝑅𝐿 (8. 𝑏)
Here 𝐻𝑜𝑅𝐿(𝑗𝜔) denotes the amount of OHC contraction which is added to the RL
displacement (path 2 in Fig .2) and 𝐻𝑜𝐵𝑀(𝑗𝜔) denotes the amount of OHC contraction which
contributes to boosting the vibration on the BM (path 1 in Fig. 2). Since the BM’s impedance
is larger than the RL’s impedance (𝑍𝐵𝑀 > 𝑍𝑅𝐿), the OHC contraction boosts the RL
displacement more than it does the BM displacement [𝐻𝑜𝑅𝐿(𝑗𝜔) > 𝐻𝑜𝐵𝑀
(𝑗𝜔)] according to
Eq. (8.a) and Eq. (8.b). This is consistent with laser-Doppler-vibrometer measurements by
Nowotny and Gummer (2005) which indicate that the RL vibration pattern under the
influence of the OHC somatic electromotility is much greater than the vibration on the BM.
Liu and Neely (2009) simplify Eq. (3) to 𝑍𝑙𝑜𝑎𝑑 = 𝑍𝑅𝐿; as a result, the longitudinal feed-
forward on the BM (path 1 in Fig. 2) is ignored. It will be shown [Fig. 9(a) and Fig. 9(b)] that
although the boosted displacement on BM [𝐻𝑜𝐵𝑀(𝑗𝜔)] is relatively small to that of RL
[𝐻𝑜𝑅𝐿(𝑗𝜔)], such a simplification ignores some significant features of the cochlear amplifier.
According to Fig. 2, the frequency response (H) of a single cochlear partition is
calculated by Eq. (9) below. Equation (9) formulates the feed-forward nature of the OHC’s
contraction force on the RL vibration pattern. Equations (7-9) are valid as long as the
variations in stimuli around the operating point are small enough.
𝐻 = 𝐻𝑡𝑟𝑖𝑔. [1 + 𝐻𝑜𝑅𝐿(𝑗𝜔)] (9)

17 Biophysics of an Aging Cochlea
3. Frequency Response of a Cochlear Partition as a Part of the Transmission Line
So far, the linear approximation for a single cochlear partition has been made and its
transform function (H) has been calculated leading to Eq. (9). However, since the vibration is
assumed to propagate from the base towards the apex (Bekesy, 1960) along a transmission
line, the cochlear frequency response at any specific location along the cochlea with respect to
the base (RL/base velocity ratio) must be obtained by computing all the prior partitions in
series. Thus, the frequency response of the 𝑖𝑡ℎ partition is calculated by multiplying all the
frequency responses of the prior partitions leading to Eq. (10.a) and Eq. (10.b) below. The
notations are similar to those illustrated in the block diagram of Fig. 2(b).
(𝐻𝑡𝑟𝑖𝑔)𝑖 = (𝐻𝑡𝑟𝑖𝑔)𝑖−1. [1 + (𝐻𝑜𝐵𝑀)𝑖−1]. (𝐻𝑝𝑎𝑠𝑠𝑖𝑣𝑒)𝑖−1 (10. 𝑎)
𝐻𝑖 = (𝐻𝑡𝑟𝑖𝑔)𝑖. (𝐻𝑜𝑅𝐿)𝑖 ; 𝑖 = 1, … , 𝑁 (10. 𝑏)
III. SIMULATION RESULTS
The simulations of the linear model are implemented in MATLAB where the number of
cochlear partitions is arbitrary and is here chosen to 100 (n=100) as a trade-off between
computation time and resolution.
All the presented results are linearly calculated at the sharpest point on the MET curve
[Fig. 4(a), the small lines] corresponding to a 300 nm displacement of the RL (where αd =
1.37 × 10⁻³).
A. Simulations of Cochlear Amplification
Figure 5(a) illustrates the RL/base velocity ratios according to the transfer function H at
three locations along the cochlea (30%, 50% and 70% of the cochlear length from the base)
and it illustrates the hundredfold amplification of vibrations as a result of the cochlear
amplification. The CF of the curves decreases from base to apex and the cochlear
amplification becomes less, near the apex.
------- Please Insert Figure 5 here-------

18 Biophysics of an Aging Cochlea
Figure 5(b) shows the CFs of the cochlear partitions in this simulation and compares
them with CFs predicted by Greenwood (1990). The average difference in the CFs between
the current model and those predicted by Greenwood (1990) is approximately 13.5% for the
frequencies between 0.25 and 10.0 kHz; the greatest differences are observed at the highest
frequencies.
Figure 6 illustrates the RL velocity ratios along the cochlea from base to apex for pure
tones of 1, 2, and 4 kHz. Figure 6 illustrates the magnitude and the phase of the wave at
different cochlear positions (‘panoramic view’) in response to specific stimulation frequencies
as well as the phase decays corresponding to each stimuli.
------- Please Insert Figure 6 here-------
1. Quantitative Comparison of Model Predictions with the Experimental Data.
Human cochlea is too deeply buried inside the thick petrous bone which makes it
inaccessible for in vivo measurements. However, in vivo data on guinea pig cochlea are to
some extent available. In order to compare these experimental data with the model
predictions, the corresponding parameters of the human model (listed in tables I to III in
appendix A) were modified to those of the guinea pig cochlea presented in [Ramamoorthy et
al. (2007), table I, II]. The modified model was used for simulating the guinea pig BM
velocity ratios at the sharpest point of the MET curve where the somatic motor functions
maximally. This point must approximately correspond to the experimental data at a relatively
low level of 20 dB SPL which also depicts the highest amplification and sensitivity.
Cooper (1998) measured the BM mechanical responses to pure tone stimuli at the basal
turn of the guinea pig cochlea at 3mm from the base (CF=17 kHz) using a displacement-
sensitive laser interferometer. de Boer and Nuttall (2000) also recorded data on velocity of the
BM at the same location of the cochlea using a laser velocimeter [(de Boer and Nuttall, 2000),
Fig. 1]. With this technique they obtained frequency response of the BM velocity ratio with

19 Biophysics of an Aging Cochlea
respect to stapes (BM velocity divided by stapes velocity) for stimulation level of 60,70,80,90
dB SPL.
The data obtained by Cooper, (1998) had been normalized with respect to the lowest
measured frequency of the BM vibration whereas the measurements by de Boer and Nuttall,
(2000) had been normalized to the peak of the BM response for the stimuli at 20 dB SPL.
There is a considerable amount of variation between these two data sets in many aspects.
However, both studies report a similar amount of peak-to-peak amplification at the CF.
[(Cooper, 1998), Fig. 1(A)] illustrates a 53 dB amplification while [(de Boer and Nuttall,
2000), Fig. 1 upper panel] depicts a 50 dB peak-to-peak amplification. The data from these
two experiments are read at several points and are averaged to minimize the variations. Here,
we use the amplification at the lowest measured frequency of the BM response as the uniform
reference of the normalization.
------- Please Insert Figure 7 here-------
Figure 7(a) compares the averaged data from the experiments at 20 dB SPL with the
prediction of the modified model at the sharpest point of the MET curve. The model predicts a
peak of 53.5 dB which is only slightly higher than the averaged experimental data. The CF
predicted by the model (CF=17.31 kHz) is also slightly higher than that of the experimental
data (CF=17 kHz). However, the amplitude prediction of the model exhibits a higher
𝑄10𝑑𝐵 factor and is notably sharper than that of the experimental data.
[(de Boer and Nuttall, 2000), Fig. 2(A)] shows experimental data on the phase of the
BM vibration at the basal region of the guinea pig cochlea between 2 mm to 5mm from the
base which corresponds to 8% to 20% of the animal’s cochlear length. These data are fitted
with a decaying exponential function and are compared with the model prediction at these
locations for the same CF. Figure 7(b) illustrates a reasonable match between the
experimental data and the model prediction.

20 Biophysics of an Aging Cochlea
B. Simulation of Metabolic Presbyacusis
The presented physiologically-based model is used in this section to simulate the effect
of age-related degenerations in the stria vascularis on the functionality of the OHCs and the
IHCs and eventually the whole cochlear response.
1. Effect of Metabolic Presbyacusis on the Magnitude of the Cochlear Amplifier.
Figure 8(left and middle) shows the RL/base velocity ratios at locations 30% and 70%
from the base respectively for three conditions: 1) a healthy fully-active cochlea where the EP
is at its maximum value of 89 mV, 2) an impaired cochlea where the EP has degenerated to
half of its maximum amount [EP= 44.5 mV] and 3) a passive (dead) cochlea with no active
processes (EP=0).
As seen in Fig. 8 (left), when the EP is decreased to its half value both the amplification
and the sharpness of the curves are reduced. However, this reduction is not linear (meaning
that the amplification’s peak does not drop to its half value). When the EP is halved, the peak
of the ‘healty’ curve drops from 63.1 dB down to 44.3 dB (corresponding to a 19.2-dB loss).
The partition’s CF is also shifted from 4700 Hz to 4212 Hz. Once the active processes are
totally dead (passive cochlea) the curve is flattened, the amplification is significantly
decreased and the CF is further down-shifted to 3026 Hz.
------- Please Insert Figure 8 here-------
A similar effect is seen in Fig. 8 (middle) at 70% of the cochlear length where the
degeneration of the EP causes the amplification to decrease from 13.6 dB to 11.6 dB
(corresponding to a 2-dB loss) and the CF is down-shifted from 340 Hz to 271 Hz. In case of
a dead (passive) cochlea, the amplification is further decreased and the CF is shifted to 217
Hz. Figure 8 (right) summerises the changes in the tuning pattern along the cochlea as a result
of the EP degeneration.

21 Biophysics of an Aging Cochlea
Equation (7) explains the underlying reason for the declines of the cochlear amplifier in
an aging cochlea. Equation (7) states that the amplitude of the somatic motor is linearly
proportional to the slope of the MET curve (𝛼𝑑) and the velocity sensing coefficient (𝛼𝑣).
When the EP degenrates, the MET curve re-shapes [Fig. 4(a), dashed line] which leads to
change of its slope, 𝛼𝑑. [Fig. 4(b), dashed line].
If the MET mechanism (defined in Eq. 6) is regarded as a first order LTI system, its
time constant is proportional to 𝛼𝑣
𝛼𝑑 indicating that 𝛼𝑣 and 𝛼𝑑 should vary proportionally to
maintain the time constant of the system. Therefore, as the MET mechanism is reshaped, both
𝛼𝑑 and 𝛼𝑣 decrease according to the new MET curve which consequently causes the OHC
contraction force (the output of Eq.7) to decrease as well.
From another perspective, a hearing threshold occurs around 1 nm displacement of BM
(and thus approximately 2 nm displacemet of the RL) in a healthy and active cochlea
(Fettiplace and Hackney, 2006) which corresponds to a slope of 0.00022 [nm/s] on the MET
curve. When the EP is halved [EP=44.5 mV, dashed line in Fig. 4(b)] the necessary
displacement to result in a same slope of 0.00022 nm/s ,and thus the same amount of somatic
amplification, is increased to 80 nm. In other words, more displacement (sound pressure) is
required to maintain the the same excitation level [small arrow in Fig. 4(b)] which implies
that the hearing threshold has been shifted from 2 nm to 80 nm (approximately 32 dB).
2. Effect of Metabolic Presbyacusis on the Temporal Features of the Cochlear Responses.
The EP provides the necessary voltage supply not only for the OHC’s MET channels to
function optimally but also for the IHCs as well. As a result, degeneration of the EP can
directly alter the functionality of the IHCs and therefore modify two important features of the
cochlear response, 1. temporal resolution of the cochlear system and 2. intensity coding of the
sound on the auditory nerve.

22 Biophysics of an Aging Cochlea
The opening of the IHC mechanoelectrical transduction channels results in a flux of
calcium ion which induces a receptor current (𝑖𝑟), a similar mechanism to the OHC MET as
shown by the Boltzmann curve in Fig. 4(c). The ion influx into the cell leads to 𝐶𝑎2+ build-
up at the presynaptic area of the IHC-AN complex. Sumner et al. (2002) modeled this time-
variant calcium concentration, denoted as [𝐶𝑎2+](t), as a classic first-order low-pass filtered
function of the receptor current [𝑖𝑟(𝑡)] according to the equation below.
𝑖𝑟(𝑡) = 𝑑[𝐶𝑎2+](t)
𝑑𝑡+
[𝐶𝑎2+](t)
𝜏 (11)
In other words, Eq. 11 characterizes a first-order LTI system where the time constant
(𝜏) determines the speed of the presynaptic calcium concentration. The probability of a neural
firing by the IHC on the auditory nerve is proportional to the cube of this presynaptic calcium
concentration (Sumner et al., 2002). Equation (12) presents the transmitter release (firing) rate
at time t on the auditory nerve, 𝑘(𝑡), as a function of the calcium concentration.
𝑘(𝑡) = max (([𝐶𝑎2+]3(𝑡) − [𝐶𝑎2+]𝑡ℎ3
)𝑍, 0) (12)
In Eq. (12), Z is a scalar for converting calcium concentration levels into release rate,
and [𝐶𝑎2+]𝑡ℎ denotes a threshold constant which depends on the fiber type; e.g it is 44.8 pA
for high spontenous rate (HSR) fibers whose spontenous rate is higher than 18 spikes per
second [(Sumner et al., 2002),Table II]. When the EP is decreased, the IHC’s MET produces
less receptor current [Fig. 4(c), the dashed line] which means that 𝐶𝑎2+ flux is less; this leads
to inhibition of the firing rate, 𝑘(𝑡), according to Eq. (12).
As shown by the small arrow in Fig 4. (c ) at an examplary point on the IHC MET curve
corresponding to a 50 nm displacement of the IHC HB, when the EP is halved the recptor
current (proportional to the 𝐶𝑎2+ flux) is decreased from 0.1 nA to 0.05 nA. As a result, the
transmitter release rate, 𝑘(𝑡), on the HSR fibers is drastically decreased according to Eqs.
(11) and (12).

23 Biophysics of an Aging Cochlea
The exact timing of the auditory nerve activations is determined by the neurotransmitter
firing rate. Therefore, the transmitter release rate has a great impact on the temporal coding
features of the auditory signal such as phase locking (Sumner et al., 2002). A decrease in the
neurotransmitter firing rate means a longer time interval between the firings which, at least
partly, may explain the decline of temporal resolution, the ability to follow rapid acoustic
changes over time, in an aging auditory system.
Kurt et al. (2012) also studied the role of the IHC ion channels on the temporal structure
of auditory information in the mice cochlea. They observed that deficiency of the IHC MET
channels decreased the IHC receptor current which consequently impaired the spike timing of
the auditory fibers, as predicted here. They concluded that this may have a disadvantageous
effect on the detection of signals in noisy environments.
3. Effect of Metabolic Presbyacusis on the Rate-Intensity Function of the Auditory nerve.
The sound pressure results in mechanical vibrations within the cochlear structures
which are eventually coded into neural information. It is believed that the intensity of the
sound-induced cochlear vibrations is coded in terms of neural firing rate (Moore, 2003) on the
auditory nerve (AN) according to specific rate-intensity transfer functions at the IHC-AN
stage. These transfer functions are shown in [(Sumner et al., 2002), Fig. 3] for various fibers
in the guinea pig cochlea. Even if the OHC dysfunction is a very important source of the
cochlear loss as already shown in Fig. 8, the IHC dysfunction can also contribute to the
audiometric loss. This is because when the rate-intensity transfer function of the IHC-AN is
impaired as a result of the EP reduction, there would be a decline in neural coding of the
sound intensity leading to an extra loss in addition to the amplification loss attributed to
dysfunction of the OHC’s somatic motor. How can this additional loss be quantified and
analysed?

24 Biophysics of an Aging Cochlea
Lopez-Poveda and Eustaquio-Martin (2006) introduced an electrical-circuit equivalent
of an IHC to model the nonlinear (compressive) transfer function of the IHCs. Their model
can be used to simulate the effect of age-related EP reduction on the membrane potential [the
EP is represented by 𝐸𝑡 in the schematic description of (Lopez-Poveda and Eustaquio-Martin,
2006), Fig. 1]. The membrane potential can then be linked to the rate-intensity characteristic
of the firings on the auditory nerve synapse according to Eq. (4) to Eq. (12) of (Sumner et al.,
2002).
------- Please Insert Figure 9 here-------
There are three major catagories of auditory nerve fibers in mamalian inner ear in terms
of spontaneous rates. Here we conduct our quantitative analysis solely on the medium
spontaneous rate (MSR) fibers which have a dynamic range approximately from10 dB SPL to
50 dB SPL. The mamalian MSR fibers can typlically fire up to approximately 300 times per
second before they saturate at this level (Sumner et al., 2002) . Figure 9.(left) depicts how this
maximum firing rate of the MSR is affected by reduction of the EP. As the EP is halved
(EP=44.5 mV) the maximum firing rate decreaes from 300 to 261.4 spikes/second.
A second-order Boltzmann function is used to fit the experimental data on the rate-
intensity transfer function of the guinea pig M1 fibers (Winter et al., 1990) at CF of 16 kHz as
seen in Fig. 9.(middle). The maximum firing rate is in the numerator of the Boltzmann
function. Therefore, when the maximum firing rate is reduced to 261.4 spikes/second as
explained above, this rate-intensity transfer function is reshaped accordingly; it is illustrated
by the dashed lines in Fig. 9(middle). At an examplary level of 30 dB SPL [Fig. 9(middle),
solid line] the auditory nerve was activated with a firing rate of 250 spike/second in the
healthy cochlea. However, in the case where the EP is halved [Fig. 9(middle), dashed line]
then an intensity of approximately 35 dB SPL is needed to produce the same firing rate (250
spike/second) which indicates a 5-dB loss. The corresponding losses at the CF of 16 kHz

25 Biophysics of an Aging Cochlea
(basal region) in the dynamic range of the MSR fiber (approximately from 10 dB SPL to 45
dB SPL) have been summarised in Fig. 9(right). These IHC-related losses are at the order of
2-4 dB at low and medium intensities (10-35 dB) and becomes greater around the saturation
point of the fiber. Figure 9 suggests that, at least in the basal region, the corresponding loss
for the low and medium intensity stimuli as a result of the IHC-AN dysfunction caused by the
EP reduction to half of its maximum value is relatively small in comparison with the 20-dB
OHC-related amplification loss depicted in Fig. 8.
However, the method used here for investigating the IHC-related loss associated with
presbyacusis is solely via simulating the effect of the EP reduction on the discharge rate of the
auditory nerve for different sound intesities. However, near the fiber’s threshold, other bio-
neural factors (rather than the discharge rate solely) such as temporal integration may
contribute to determine whether a specific stimulation will be detected or not. Considering the
existance of these factors near the threshold, the presented approach may underestimate the
associated IHC-related audiometric loss, defined as the amount of elevation in behavioural
thresholds.
Besides, it has been suggested that near threshold, a single spike, rather than a series of
neural spikes, may be sufficient to make a sound detectable. Furthermore, Meddis (2006)
investigated the timing of the ‘first-spike’ and the role of the calium dynamics on the the AN
first-spike latency by including a calcium influx model identical to Eq. (11) and Eq. (12) here.
He then simulated the absolute thresholds of the auditory nerve fibers based on this ‘first-
spike latency’ concept. In summary, although the analysis presented in this section is capable
of quantifying the decline in the rate-intensity function of the IHC-AN complex caused by the
age-related EP reduction (Fig. 9), it may not be sufficient to fully account for the IHC-related
threshold elevations associated with metabolic presbyacusis.
IX. ANALYSIS

26 Biophysics of an Aging Cochlea
A. Time Constant of the Outer Hair Cell’s Body.
One, so far, unresolved issue with the somatic motor is the membrane time constant.
The OHC’s membranous body has a capacitance and a resistance, modeled by C and 1/G as
shown in Fig. 3. This implies that the receptor voltage (𝑉𝑟) is low-pass filtered according to
the membrane time constant (product of membrane resistance and capacitance). Since the
somatic motor is controlled by this receptor voltage (Liu and Neely, 2009), the amplification
of the somatic motor must be attenuated at higher frequencies due to the low-pass effect. The
highest cut-off frequency corresponding to the physiological parameters (C and G) here is
around 1000 Hz. On the contrary, Fig. 5(a) indicates that the somatic motor functions well
above this cut-off frequency, even more powerfully than at the low frequencies. This is in line
with available experimental data (Pattuzi, 1996). Hence, the model developed here
demonstrates how elements of an active electromechanical system can interact to overcome
the low-pass filtering due to the membrane RC time constant.
B. High Frequency Profile of the Matabolic Presbyacusis.
Comparing left panel of Fig. 8 with the middle panel indicates that at a position
corresponding to 30% of the cochlear length from the base (basal region) with a CF of 4700
Hz, the amplification peak drops 19.2 dB as a result of the EP degeneration whereas at 70% of
the cochlear length (apical region with CF of 341 Hz) this attenuation is merely 2 dB.
Figure 10(a) shows these shifts as a function of the CFs for frequencies between 50 and
4000 Hz. Similar to Fig 8 (a), (b), they were calculated by comparing the peaks of the
RL/base velocity ratios of the healthy cochlea (EP=89mV) with those of the presbyacusis
cochlea (EP=44.5mV). Since the amplification peaks of the healthy cochlea were regarded as
reference, the illustrated shifts have negative values. The result demonstrates a flat loss at low
frequencies coupled with a shallow high-frequency sloping loss above 1 kHz as shown in Fig.
10(a). This is consistent with Schmiedt (2010) where he argues that the reason why

27 Biophysics of an Aging Cochlea
presbyacusis is associated with higher frequencies is that the cochlear amplification is greater
at higher frequencies (basal region) than at lower frequencies (apical region) therefore the
lack of amplification is more significantly felt in higher frequencies.
------- Please Insert Figure 10 here-------
1. Quantitative Comparison of the Model Prediction of Presbyacusis with the Animal Data.
Schmiedt et al. (2002) measured the compound action potential (CAP) thresholds in
groups of aged gerbils versus a control group of young gerbils. They recorded the CAP
thresholds in the aged gerbil cochleae with reduced levels of the EP (67 mV, 55 mV, 48 mV,
43 mV and 17 mV) versus a control group (young and healthy, EP=95 mV) at 12 different
frequencies ranging from 500 Hz to 20 kHz.
In order to quantitatively analyze these data and compare them with the predictions of
this model, the data for the EP=48 mV case are read from [(Schmiedt et al., 2002), Fig. 4,
bottom panel]. For example at 500 Hz, the CAP threshold has been reported 22 dB SPL for
the control group (filled square) whereas it is 36 dB SPL for the aged group with EP=48 mV
(filled triangle) which indicates a -14 dB SPL attenuation. The corresponding attenuations are
calculated this way for other points and are shown by the crosses in Fig. 10(c). This resulting
curve represents the CAP threshold elevations recorded from a very old gerbil cochlea which
may also suffer from other types of hearing impairment (sensory and/or neural).
Schmiedt et al. (2002) also recorded CAP thresholds from furosemide treated gerbil
cochleae. Furosemide is a loop diuretic which disrupts the stria vascularis functionality
without significantly affecting the OHCs and therefore is often used for creating a fast
experimental model of metabolic presbyacusis. The corresponding attenuations are obtained
as explained above from the recorded CAP thresholds of the Furosemide treated gerbil
cochleae for EP= 46 mV [reported by (Schmiedt et al., 2002), Fig. 4, top panel, empty
triangles]. Besides, Schmiedt et al. (2002) reported mean CAP threshold shifts of 10

28 Biophysics of an Aging Cochlea
Furosemide treated gerbils as well. The corresponding curve for EP=57.5 mV is also obtained
from [(Schmiedt et al., 2002), Fig. 7, top panel, filled circles].
The above three sets of experimental data are shown respectively by crosses, squares
and stars in Fig. 10(c) versus the model prediction (solid line). Figure 10(c) indicates that
among these three sets of experimental data, the curve representing the CAP thresholds of
Furosemide treated gerbil with EP=46 mV (squares) shows the closest match with the model
prediction. This curve (squares) is then fitted with a function (dashed line) comprising a
constant level at low frequencies followed by a sloping line at higher frequencies with a break
point at 4.2 kHz. Figure 10(c) depicts a reasonable correlation between the fitted function
(dashed line) and the prediction of the model (solid line), both in terms of the overall shape, a
flat loss in lower frequencies followed by sloping loss at higher frequencies, and in terms of
quantitatively reproducing the maximum of 40-45 dB loss at 16 kHz.
A comparison between Fig. 10(a) and Fig. 10(c) indicates that both human and animal
models depict a similar shape. However, the human model [Fig. 10(a)] illustrates only a 20
dB loss at 4 kHz whereas the clinical data suggests that the corresponding loss may be much
more than this [Schmiedt et al., (2002), Fig. 7, bottom panel]. Firstly, unlike the gerbils, there
are no in vivo measurements available on the EP values inside aged human cochleae; thus it is
not very clear how much of the observed audiometric loss in aged human is purely attributed
to metabolic presbyacusis. Secondly, if the values of two specific parameters (T and/or 𝛼𝑣 in
table III of Appendix A) are slightly increased, the model is capable of reproducing the
suggested 40 dB loss at 4 kHz. However, there is not enough physiological justification to
change the values of these two human parameters from their current values.
C. The Phase Difference between Passive Vibration and the Somatic Motor.
Figure 10(b) illustrates a 𝜋
2 phase difference between the BM velocity (𝐻𝑡𝑟𝑖𝑔) and the
OHC motility force (𝐻𝑜) in the middle of the cochlear duct. It implies that the BM and the RL

29 Biophysics of an Aging Cochlea
move separately, squeezing the fluid in between inside the tunnel of Nuel which produces a
flow in longitudinal direction (fluidal coupling). Figure 10(b) also indicates that age-related
decrease of the EP does not influence this existing phase difference between the BM velocity
and the OHC motile force. The phase conveys information about the timing of the
corresponding mechanism. Therefore, it can be inferred that while the age-related decrease of
the EP leads to drastic declines in the magnitude of the OHC’s somatic motor [Fig. 8 and Fig.
10(a), (c)], it does not significantly affect the phase and the timing of the process.
D. Effect of Metabolic Presbyacusis on the Tuning Pattern of the Cochlea.
Figure 8(right) reveals another effect of metabolic presbyacusis on the cochlear
response. The position-frequency map of the cochlea is modified as the active processes
decline. It indicates that the CFs of the cochlear partitions tend to decrease in a presbyacusis
cochlea. This is consitent with Robles and Ruggero (2001) where they argue that in a passive
cochlea (EP=0) the CFs are siginficantly shifted to lower frequencies.
In other words, Fig. 8(right) depicts the decrease in the CFs along the cochlear duct as
the activity level of the hair cells declines due to age-related reduction of the EP.
Ramamoorthy et al. (2007) also illustrate how the CFs are shifted basalwards as the activity
level of the outer hair cells decreases; their model quantifies the corresponding shifts for 0%,
50%, 75%, 90% and 100% activity levels [Ramamoorthy et al. (2007), Fig. 7]. Furthermore,
Lopez-poveda et al. (2007) measured the behavioral psychophysical tuning curves at different
sound intensities using forward masking method at probe frequencies 125, 250, 500 Hz
(apical) versus 6000 Hz (basal) . Their results experimentally confirmed that at higher sound
intensities (where the activity level of the hair cell is relatively lower) the CFs almost always
decreased both in the apical and basal regions of the cochlea.
E. Effect of Common Simplifications on the Output of the Model.

30 Biophysics of an Aging Cochlea
All cochlear models are a simplification of the undergoing mechanisms and complex
kinematics of the cochlea. Longitudinal feed forward, structural coupling and the TM passive
load are commonly neglected by modelers to obtain computational simplicity (Ghaffari et al.,
2007). Figure 11(left) demonstrates that if the longitudinal feed-forward on the BM (path2 in
Fig. 2) is neglected, which is the case in typical cochlear models that lack longitudinal
structural coupling, the cochlear amplification drastically deteriorates. In this case, as Fig.
11(middle) shows, the model produces a different frequency-position map, approaching that
of a dead (passive) cochlea.
These are consistent with the results from [Meaud and Grosh (2010), Fig .2 and Fig.
10], which emphasize that the structural coupling along the BM and the TM is significant.
Figure11 (right) indicates that excluding the TM passive load (represented by 𝑀𝑡𝑖 , 𝐾𝑡𝑖 and
𝑅𝑡𝑖 in Fig. 1) from the model, causes both the cochlear amplification and the frequency
sensitivity to significantly decrease. This is consistent with measurements by Gummer et al.
(1996) which emphasize the crucial role of the TM in boosting both magnitude and sensitivity
of the cochlear amplifier. Therefore, the TM passive load must also be included in a realistic
cochlear model.
------- Please Insert Figure11 here-------
F. Effect of Metabolic Presbyacusis on Distortion Product Otoacoustic Emissions.
Discovery of the otoacoustic emissions (OAE) provided the first evidence for existence
of a nonlinear active process inside the mammalian cochlea. Since then, OAEs have been
considered as a direct measure of the compression and the active amplifications. Therefore,
one would most likely expect to see a decline in these emissions as a result of aging. On the
contrary, animal models of metabolic presbyacusis do not show a significant reduction in
distortion product otoacoustic emissions (DPOAEs) levels as a result of the EP degeneration
(Schmiedt et al., 2002).

31 Biophysics of an Aging Cochlea
The DPOAEs are generated by nonlinearity of the cochlear functions and are related to
the resting position of the organ of Corti and the MET channels (Brown et al., 2009). As the
dashed circle in Fig. 4(a) shows, around the resting point (zero displacement of the HB) the
difference between the solid line (of healthy cochlea EP=89 mV) and the dashed line (of
presbyacusis cochlea EP=44.5 mV) is small. Thus, the value of the receptor current is almost
equal for both conditions regardless of the EP value. The receptor current induces a voltage
current which drives the somatic motor (Fig. 3) according to Eq. (7). As the HB starts to
deflect, the difference between these two curves rapidly grows. It has been simulated earlier
what great impacts this difference would have on the magnitude of the cochlear amplifier
[Fig. 8 and Fig. 10(a)].
Since the DPOAEs are related to the resting position and the effect of the EP reduction
on the MET mechanism is very small around this resting point, thus according to the model,
one would expect that the DPOAE levels are relatively insensitive to changes in the EP.
Despite this reasoning is based on the nature of the MET mechanism and the governing
equations of the presented modeling work, an elaborate DPOAE simulation may be required
to fully confirm this logic.
Schmiedt (2010), [Fig. 2.9, top and middle panels], showed that when the OHCs
themselves are manipulated (i.e. by destructive noise exposure), unlike the case of the EP
reduction, the DPOAEs are drastically reduced. This suggests that the DPOAEs may reflect
the status of the OHCs rather than the pathologies in the stria vascularis. This hypothesis is in
line with outcome of the clinical study by He and Schmiedt (1996) where they compare the
otoacoustic emission levels recorded from an aged group with those from a group of hearing
impaired young individuals. Their results demonstrate that aged subjects can have much
greater hearing losses before the decline of the otoacoustic emissions becomes notable as
compared to young subjects. They hypothesize that this may be mainly because the hearing
32 Biophysics of an Aging Cochlea
loss of the young group is likely to take root from noise exposure which acts directly on the
OHC function, whereas the substantive cause of the hearing loss in the aged group is more
likely to be of strial origin (leading to the EP reduction). From another perspective, this
differential phenomenon may provide possibilities for developing clinical tests in the future to
diagnose how much of a specific hearing loss originates from the hair cell deficit (sensory)
and how much of it can be linked to the EP degeneration (metabolic).
X. DISCUSSION
Although the model incorporates some often neglected aspects of the cochlear
mechanics such as longitudinal coupling, feed forward of the OHC contraction force and
independent motion of the BM and the RL, the model is still a simplification of the complex
cochlear kinetics. Therefore, introducing more degrees of freedom to the current model in
future versions may reveal more detailed features of the complex human cochlear kinetics.
Moore (2003) indicates that additional frequency tuning may occur in more central parts
of the auditory system. This implies that the frequency-map obtained from the current
simulations may alter when this model is connected to models of central parts of the auditory
system. There is also strong evidence which shows that the central auditory system can
manipulate the cochlear functionality via olivocochlear efferents which are linked to the
synaptic area of the hair cells by forming a synaptic ‘cistern’ (Slepecky, 1996). This efferent
network can activate nicotinic cholinergic receptors (nAChR) that change the membrane
conductance of the hair cells [G in the equivalent circuit of Fig. 3] and thereby alter the
somatic motor and the active force generation in the cochlea. Although the cholinergic
inhibition of mammalian cochlear hair cells is well documented (Katz et al., 2010), the effects
of these top-down manipulations are not included in the cochlear models to date.
Even so, the model introduced here integrates electrical, mechanical and acoustical
elements of the cochlea in a physiologically-based transmission line. The model is capable of

33 Biophysics of an Aging Cochlea
simulating the effect of age-related degeneration in the lateral wall of the cochlea on the
cochlear responses and quantitatively explaining the experimental data. Besides, the model
predicts the changes in the position-frequency map (tuning pattern) of the cochlea as the
active processes decline in an aging cochlea.
Our simulations confirm and quantify the prevailing hypothesis of metabolic
presbyacusis and its high-frequency profile. As the electromechanical parameters of the
model were modified to those of the guinea pig [Ramamoorthy et al. (2007), table I, II], the
model could closely predict the experimentally-measured CAP threshold elevations in
Furosemide treated gerbils reported by [(Schmiedt et al., 2002), Fig. 7]. Gerbil and guinea pig
cochleae are structurally and electromechanically similar (Robles and Ruggero, 2001) and the
guinea pig parameters used here seem to be more realistic than the human parameters in terms
of quantitative reproduction of the amplification loss associated with presbyacusis.
Auditory models classically consider the BM motion as a perfect representative of the
vibration pattern and simplify the cochlear mechanics to study of the BM vibration. This is
mainly based on the erroneous assumption that the motion of the RL and the BM are similar.
However, a key idea behind the current modeling approach is the independence of the RL
from the BM which enables them to move separately. This is consistent with the
measurements by Nowotny and Gummer (2005). A newer and more explicit report byChen et
al., (2011) also indicates that the motion of the RL is greater in amplitude and has a different
timing and phase from the motion of the BM. Furthermore, the presented cochlear model
includes the IHC-AN synapse and quantitatively studies the inhibition of the AN firing rate
caused by the EP reduction. The consequent impact of the AN firing rate inhibition on the
rate-intensity function of the auditory fibers is studied and possible limitations of this
approach in fully understanding the IHC-related audiometric loss associated with metabolic
presbyacusis are discussed.

34 Biophysics of an Aging Cochlea
The non-linear piezoelectric model of the OHC motility here is taken from (Liu and
Neely, 2009). However, in their work the TM mechanical load was ignored. Also to simplify
Eq. (3), the mass of the RL was neglected and, as a consequence, the feed-forward on the BM
was removed from the model. As depicted in Fig. 11, these may not be realistic assumptions.
Lu (2009) introduced a multi-compartmental model which included the longitudinal fluid
flow. Even though the parameters of the model conveyed physiological interpretations, the
simulations did not demonstrate greater cochlear amplification at higher frequencies [Lu
(2009), Fig. 1-3 and Fig. 2-4] as expected in accordance with the experimental data.
XI. CONCLUSION AND FUTURE WORKS
A physiologically-motivated electromechanical model of the human cochlea in form of
a signal transmission line with finite number of partitions has been presented. A linear
analysis of the model was conducted to simulate the cochlear response to acoustical stimuli in
the frequency domain. The main idea was that an age-related decrease in the EP alters the
MET mechanism leading to a decline of the active force/displacement generated by the
somatic motor and, eventually, high-frequency hearing threshold elevation observed in an
aging auditory system. In this regard, the model prediction showed a reasonable match with
the measured CAP threshold elevations in aged and Furosemide treated gerbils.
The simulations showed that age-related reduction of the EP not only reduces the
cochlear amplification by affecting the OHC somatic motor, but also it inhibits the firing rate
of the auditory nerve by reshaping the IHC mechanoelectrical transduction. A decrease in the
firing rate means a longer time interval between the firings which might, at least partly,
explain the decline of temporal resolution, the ability to follow acoustic variations over time,
in the aging auditory system. In order to optimally process a speech signal in every-day
situations listeners must be capable of resolving a number of simultaneous acoustic cues that
vary as a function of time both in the speech (target) and in the disturbing background sounds

35 Biophysics of an Aging Cochlea
(noise). If temporal resolution is impaired then the listeners may experience difficulties
perceiving speech (Moore, 2003). Furthermore, Lopez-poveda and Barrios (2013) reasoned
that since neurotransmitter firing is of a stochastic nature, a reduced firing rate could degrade
speech intelligibility in fluctuating background noise more than in quiet.
There have been great efforts and advancements in hair cell regeneration since 25 years
ago [see (Stone and Cotanche, 2007) for a review]. These efforts are mainly focused on
regenerating hair cells solely, based on a to-some-extent erroneous assumption that age-
related hearing loss in humans is largely sensory in nature rather than metabolic. Whereas our
simulations quantitatively demonstrated that even if the OHCs are totally intact and fully
active, the age-related metabolic degenerations in the lateral wall of the cochlea can result in
significant declines of the cochlear responses both in magnitude and temporal features. This
means that exclusively focusing on hair cell regeneration may not be fruitful if the main
problem lies somewhere else, in the supporting cells of the lateral wall of the cochlea.
The stria vascularis is the only known epithelial tissue where blood vessels pass through
its two cellular layers. Therefore, the functionality of these vascularized cellular layers may be
dependent on the health of these supporting vessels as well as the blood in them. Thus, the
capability of the stria vascularis in keeping the 𝑘+ cycle and thereby the optimum EP inside
the cochlear duct may be very sensitive to the underlying metabolic status of the individual.
Apart from the age-related cellular degenerations, the effects of metabolic disorders
caused by specific health conditions such as syndrome X (metabolic syndrome), diabetes and
cardiovascular diseases on functionality of this vascular tissue have not yet been thoroughly
investigated. However, recently Fukushima et al. (2006) studied cadaver temporal bones of 18
diabetic humans to measure the effects of diabetes on the cochlear structures. Their results
indicated that type 2 diabetes mellitus leads to thickening of stria vascularis reminiscent of
aged stria vascularis. Riquelme et al. (2010) investigated this underlying similarity by

36 Biophysics of an Aging Cochlea
studying the role of an insulin-related peptide, insulin-like growth factor 1 (IGF-1), on the
stria vascularis. Their results showed that the wild mice which lacked IGF-1 developed a pre-
maturely aged stria vascularis resembling the diabetic strial phenotype. Since this model can
be regarded as a biophysical foundation for coupling the cochlear mechanics with
functionality of the stria vascularis, it can be useful in the future for simulating how these
metabolic disorders can manipulate the cochlear responses and thereby the whole auditory
system.
Moreover, this modeling approach can potentially be expanded to further simulate the
effect of other cell-level cochlear lesions rather than solely in stria vascularis, such as the
cellular lesions induced by over stimulation, on the cochlear responses. This is important
because from a clinical point of view, aging is often accompanied with some degrees of noise
induced lesions since most aged humans have, to some extent, been exposed to destructive
levels of noise through their lives [see audiograms in (Schmiedt, 2010), Fig. 2.13]. This
modeling approach, together with explicit clinical tests, can be helpful in paving the way
towards differential diagnosis and better understanding of these two very common cochlear
origins of sensorineural hearing impairments.
Acknowledgement
This research is sponsored by the Swedish Research Council (349-2007-8654). Parts of this
study were presented at the cochlear mechanic workshop, MA, USA, in July 2011 and at the
inner ear biology conference, Tubingen, Germany, in October 2012.
APENDIX A: ASSIGNING PARAMETERS FOR HUMAN COCHLEA
In a normal adult mammalian cochlea, the stiffness of the BM decreases progressively
from base towards apex while the mass increases (Bekesy, 1960). The structures of interest
are housed in a rather inaccessible part of the skull, totally embedded in bone (Slepecky,
1996) which makes real-time measurements of in vivo human cochlea rather difficult.

37 Biophysics of an Aging Cochlea
However, measurements on passive cochleae in cadavers are to some extent available. The
available data at some specific locations of the cochlea (such as in basal or apical regions)
were fitted by either linear or exponential functions to obtain values for the in-between
positions. For example, [Liu and Neely, (2010), table I] gave the mass of the BM per unit area
at the base (8 × 10⁻⁵𝑔𝑐𝑚−2), in the middle of the cochlea (2.8 × 10⁻⁴ 𝑔𝑐𝑚−2), and at the
apex (2.1 × 10⁻³ 𝑔𝑐𝑚−2). These data were interpolated by an exponential function to obtain
the values for the partitions in between these three points, as seen in table I.
When no data were available for the human, we tried to extrapolate values from other
mammalian cochleae. As long as human in vivo data are not available, the validity of such
extrapolations can be discussed. However, the idea is to use realistic physiological parameters
in so far as possible to simulate the effect of specific physiological lesions (specifically
metabolic presbyacusis) on the output cochlear response. The model consists of a necessarily
large number of parameters. The mechanical parameters are presented in table I, the electro-
mechanical parameters attributed to the somatic motor are given in table II, and the
parameters related to the MET mechanism and stria vascularis are presented in table III. The
tables also summarize the sources and the methods used to obtain the parameter values.
TABLE I. Mechanical parameters of organ of Corti
Name Definition Value Unit Source
N Number of partitions 100 - -
L Length of an average
human cochlea
0.035 m (Bekesy, 1960)
i Partition’s index 1 to N - -
W BM width 0.031+[0.02 ×
10−4 × (𝑖 − 1)]
cm Linearly interpolated
from [(Liu and Neely,

38 Biophysics of an Aging Cochlea
2010), Table I].
A Cochlear cross-
sectional area
6.3 × 10⁻³
+ [5.99 × 10⁻⁴
× (𝑖 − 1)]
𝑐𝑚2 Linearly interpolated
from [(Liu and Neely,
2010), Table I]
𝑀𝑏𝑖 BM mass per unit
area
3.6631 × 10⁻⁵
× 𝑒0.0405×𝑖
𝑔𝑐𝑚−2 Exponentially
interpolated from
[(Liu and Neely,
2010), Table I]
𝐾𝑏𝑖 BM stiffness per unit
area
6.777 × 10⁵
× 𝑒16.74×𝑖
𝑔𝑠−2𝑐𝑚−2 Exponentially
interpolated from
[(Liu and Neely,
2010), Table I]
𝑅𝑏𝑖 Damping of BM per
unit area
√𝑀𝑏𝑒𝑓𝑓𝑖.𝐾𝑏𝑖
𝑄, Q=6
𝑀𝑏𝑒𝑓𝑓𝑖 is defined
by Eq. (4.b)
𝑔𝑠−1𝑐𝑚−2 [(Lu, 2009), Table
1.1]
𝑀𝑂𝐻𝐶𝑖 OHC mass per
partition
2.18 × 10⁻⁸
× 𝑒0.0698×𝑖 × (100
𝑁)
g Calculated from [(Liu
and Neely, 2010),
Table I] for a single
partition
𝐾𝑂𝐻𝐶𝑖 OHC stiffness per
partition
201.689
× 𝑒−0.0563×𝑖
× (100
𝑁)
𝑔𝑠−2 Calculated from [(Liu
and Neely, 2010),
Table I] for a single
partition

39 Biophysics of an Aging Cochlea
𝑅𝑂𝐻𝐶𝑖 OHC damping per
partition
7.745 × 10⁻⁴
× 𝑒0.0107×𝑖 × (100
𝑁)
𝑔𝑠−1 Calculated from [(Liu
and Neely, 2010),
Table I] for a single
partition
𝑀𝑟𝑖 RL mass per unit
area
0.66× 𝑀𝑏𝑖 𝑔𝑐𝑚−2 [(Lu, 2009), Table
1.1]
𝐾𝑟𝑖 RL stiffness per unit
area
0.2× 𝐾𝑏𝑖 𝑔𝑠−2𝑐𝑚−2 [(Lu, 2009), Table
1.1]
𝑅𝑟𝑖 RL damping per unit
area
√𝑀𝑟𝑖.𝐾𝑟𝑖
𝑄, Q=4
𝑔𝑠−1𝑐𝑚−2 [(Lu, 2009), Table
1.1]
𝑀𝑡𝑖 Effective TM shear
mass per partition
𝐿
𝑁𝜌𝑇𝑀. ℎ. 𝑙. 𝑒50.𝐿
𝑖
𝑁
h= TM thickness
b= TM width
𝜌𝑇𝑀= density of the
TM layer
𝑔 Extrapolated from
[(Ramamoorthy et al.,
2007), Table II]
𝐾𝑡𝑖 TM shear stiffness
per unit area
6 × 10³ × 𝑒−220.𝐿𝑖𝑁
𝑁𝑚−2 [(Ramamoorthy et al.,
2007), Table II]
𝑅𝑡𝑖 TM damping per
unit area
√𝑀𝑡𝑖.𝐾𝑡𝑖
𝑄, Q=4
𝑔𝑠−1𝑐𝑚−2 TM and RL are
assumed to have a
similar quality factor
(Q=4)
G The geometry gain
of organ of Corti per
partition
0.92-0.0062×i - Linearly interpolated
from (Nam and
Fettiplace, 2011)

40 Biophysics of an Aging Cochlea
OHC Total number of
OHCs in an average
human cochlea
11000 - (Fettiplace and
Hackney, 2006)
TABLE II: Electromechanical parameters of the OHC.
Name Definition Value Unit Source
C membrane capacitance 13.62 × 𝑒0.0175×𝑖 pF Exponentially
interpolated from
[(Liu and Neely,
2010), Table I]
G Membrane conductance 89.58 × 𝑒−0.0102×𝑖 nS Exponentially
interpolated from
[(Liu and Neely,
2010), Table I]
𝐶𝑔 Small-signal Linear gating
capacitance
17.364× 𝑒0.0137×𝑖 pF Exponentially
interpolated from
[(Liu and Neely,
2010), Table I]
T Piezoelectric
transmformation ratio
8𝑥105 m𝐶−1 [(Liu and Neely,
2009), Table I]
K Static axial stiffness 0.02 N𝑚−1 [(Liu and Neely,
2009), Table I]
TABLE III: Electromechanical parameters of the OHC MET and stria vascularis battery.
41 Biophysics of an Aging Cochlea
Name Definition Value Unit Source
EP Stria vascularis battery 89 mV (Slepecky, 1996)
𝐼𝑠𝑎𝑡 Saturation current of
MET
500 pA Assumed to be
constant along the
cochlear duct
𝑅𝑠𝑡 + 𝑅𝑠𝑚 Combination of the SM
resistance and the
Electrical resistance of
tstria vascularis
𝑅𝑠𝑡 + 𝑅𝑠𝑚 =𝐸𝑃
𝐼𝑠𝑎𝑡=
178× 106
ohm calculated in order to
produce
𝐼𝑠𝑎𝑡 =500pA by a
voltage difference of
EP=89 mV
Z Sharpness of the MET
curve
-1.098 - (Holt et al., 1997)
𝐼𝑟𝑒𝑠 Non-zero residual current
of MET when there is no
stimuli
3.5% of
𝐼𝑠𝑎𝑡
A Extrapolated from
[(Holt et al., 1997),
Fig. 3(a)]
𝛼𝑑 Slope of the MET fast
adaption curve [Fig. 4(a)]
𝑑[𝐸𝑞. (1)]
𝑑𝑥
A𝑚−1 Calculated according
to Eq. (1)
𝛼𝑣 Velocity-to-current gain
defined by Eq. (6)
(𝛼𝑣 = 𝑇. 𝛼𝑑)𝑎
where T denotes
the time constant
under which the
MET channels
reclose
As𝑚−1 Fettiplace et al.
(2005)
a The time constant is considered to be tenfold larger than the time constant illustrated in
[Fettiplace et al. (2005), Fig. 2(B)]

42 Biophysics of an Aging Cochlea
References
Bekesy, G. V. (1960). "Part 4: Cochlear Mechanics" in Experiments in the Hearing (McGraw-
Hill, New York, USA), pp 403-703.
Brown, D. J., Hartsock, J. J., Gill, R. M., Fitzgerald, H. E., and Salt, A. N. (2009).
"Estimating the operating point of the cochlear transducer using low-frequency biased
distortion products," J. Acous. Soc. Am. 125, 2129-2145.
Chen, F., Zha, D., Fridberger, A., Zheng, J., Choudhury, N., Jacques, S. L., Wang, R. K., Shi,
X., and Nuttall, A. L. (2011). "A differentially amplified motion in the ear for near-
threshold sound detection," Nature neuroscience 14, 770-774.
Cooper, N. P. (1998). "Harmonic distortion on the basilar membrane in the basal turn of the
guinea-pig cochlea," J. Physiology. 509 ( Pt 1), 277-288.
De Boer, E., and Nuttall, A. L. (2000). "The mechanical waveform of the basilar membrane.
III. Intensity effects," J. Acous. Soc. Am. 107, 1497-1507.
Fettiplace, R., Crawford, A. C., and Kennedy, H. J. (2005). "Signal transformation by
mechanotransducer channels of mammalian outer hair cells.," Auditory Mechanisms:
Proceedings of the 9th International Symposium, Portland USA. 1, 245-252.
Fettiplace, R., and Hackney, C. M. (2006). "The sensory and motor roles of auditory hair
cells," Nature reviews. Neuroscience 7, 19-29.
Fukushima, H., Cureoglu, S., Schachern, P. A., Paparella, M. M., Harada, T., and Oktay, M.
F. (2006). "Effects of type 2 diabetes mellitus on cochlear structure in humans,"
JAMA Otolaryngol Head Neck Surg. 132, 934-938.
Ghaffari, R., Aranyosi, A. J., and Freeman, D. M. (2007). "Longitudinally propagating
traveling waves of the mammalian tectorial membrane," PNAS 104, 16510-16515.

43 Biophysics of an Aging Cochlea
Gordon-Salant S., Frisina, R. D. (2010). "Introduction and overview," in The Aging Auditory
system, edited by Gordon-Salant S. F., Fristina, R. D., Popper, A. N., Fay, R, R.
(Springer Science+Business Media, USA ), pp. 1-8.
Greenwood, D. D. (1990). "A cochlear frequency-position function for several species - 29
Years Later," J. Acous. Soc. Am. 87, 2592-2605.
Gummar, A.W., Hemmert, W., Zenner, H. (1996) "Resonant tectorial membrane motion in
the inner ear: Its crucial role in frequency tuning" Proc. Natl. Acad. Sci. USA. 93,
8727-8732.
He, N. J., and Schmiedt, R. A. (1996). "Effects of aging on the fine structure of the 2f1-f2
acoustic distortion product," J. Acous. Soc. Am. 99, 1002-1015.
Holt, J. R., Corey, D. P., and Eatock, R. A. (1997). "Mechanoelectrical transduction and
adaptation in hair cells of the mouse utricle, a low-frequency vestibular organ," The
Journal of neuroscience : J. Neurosci. 17, 8739-8748.
Irino, T., and Patterson, R. D. (2001). "A compressive gammachirp auditory filter for both
physiological and psychophysical data," J. Acous. Soc. Am. 109, 2008-2022.
Jia, S., Dallos, P., and He, D. Z. (2007). "Mechanoelectric transduction of adult inner hair
cells," J. Neurosci. 27, 1006-1014.
Katz, E., Elgoyhen, A. B., Fuchs, P. A. (2010). "Cholinergic inhibition of hair cells," in
Auditory and Vestibular Efferents, edited by Ryugo, D. K., Popper, A. N., Fay, R., R.
(Springer Handbook of Auditory Research, USA ), pp. 103-133.
Kurt, S., Sausbier, M., Ruttiger, L., Brandt, N., Moeller, C. K., Kindler, J., Sausbier, U.,
Zimmermann, U., van Straaten, H., Neuhuber, W., Engel, J., Knipper, M., Ruth, P.,
and Schulze, H. (2012). "Critical role for cochlear hair cell BK channels for coding the
temporal structure and dynamic range of auditory information for central auditory
processing," FASEB J. 26, 3834-3843.

44 Biophysics of an Aging Cochlea
Lang, H., Jyothi, V., Smythe, N. M., Dubno, J. R., Schulte, B. A., and Schmiedt, R. A.
(2010). "Chronic reduction of endocochlear potential reduces auditory nerve activity:
further confirmation of an animal model of metabolic presbyacusis," J. Assoc. Res.
Otolaryngol. 11, 419-434.
Li, Y., Mead, J., Grosh, K., (2011). "coupling the subtectorial fluid with the tectorial
membrane and hair bundles of the cochlea," AIP: What Fire is in Mine Ears:
Proceedings of the 11th International Mechanics of Hearing Workshop 1403, 104-109.
Liu, Y. W., and Neely, S. T. (2009). "Outer hair cell electromechanical properties in a
nonlinear piezoelectric model," J. Acous. Soc. Am. 126, 751-761.
Liu, Y. W., and Neely, S. T. (2010). "Distortion product emissions from a cochlear model
with nonlinear mechanoelectrical transduction in outer hair cells," J. Acous. Soc. Am.
127, 2420-2432.
Lopez-Poveda, E. A., and Barrios, P. (2013). "Perception of stochastically undersampled
sound waveforms: a model of auditory deafferentation," Front. Neurosci. 7:124.
Lopez-Poveda, E. A., Barrios, L. F., Alves-Pinto, A. (2007). "Psychophysical estimates of
level-dependent best-frequency shifts in the apical region of the human basilar
membrane," J. Acoust. Soc. Am. 121(6), 3646-3654.
Lopez-Poveda, E. A., and Eustaquio-Martin, A. (2006). "A biophysical model of the inner
hair cell: the contribution of potassium currents to peripheral auditory compression,"
JARO 7, 218-235.
Lu, s. (2009). "A physiologically based nonlinear multicompartment cochlear model with
a piezoelectric OHC feedback system. " in Dissertation: a nonlinear
multicompartmental cochlear model, (Boston University, College of Engineering,
USA), pp 45-73.

45 Biophysics of an Aging Cochlea
Lu, S., Mountain, D., and Hubbard, A. (2009). "Is stereocilia velocity or displacement
feedback used in the cochlear amplifier?," Concepts and Challenges in the Biophysics
of Hearing: Proceedings of the 10th Internaional Workshop on Mechanics of Hearing,
297-302.
Meaud, J., and Grosh, K. (2010). "The effect of tectorial membrane and basilar membrane
longitudinal coupling in cochlear mechanics," J. Acous. Soc. Am. 127, 1411-1421.
Meddis, R. (2006). "Auditory-nerve first-spike latency and auditory absolute threshold: A
computer model, " J. Acous. Soc. Am. 119 , 406-4017.
Meddis, R., Lopez-Poveda EA. (2010). "Peripheral auditory system: from pinna to auditory
nerve," in: Meddis, Lopez-Poveda, Popper, Fay (eds.) Computer Models of the
Auditory System. Springer Handbook of Auditory Research, vol. 35, Springer, New
York, pp 7-38.
Mills, J. H., Schmiedt, R. A., and Dubno, J. R. (2006). "Age-related hearing loss: a loss of
voltage, not hair cells," Semin Hear. 27, 228-236.
Moore, B. C. J. (2003). "Coding of sounds in the auditory system and its relevance to signal
processing and coding in cochlear implants," Otology & Neurotology 24, 243-254.
Naidu, R. C., and Mountain, D. C. (2001). "Longitudinal coupling in the basilar membrane,"
J. Assoc. Res. Otolaryngol. 2, 257-267.
Nam, J. H., and Fettiplace., R. (2011). "A cochlear partition model incorporating realistic
electrical and mechanical parameters for outer hair cells," AIP: What Fire is in Mine
Ears: Proceedings of the 11th International Mechanics of Hearing Workshop 1403,
170-175.
Nowotny, M., and Gummer, A. W. (2005). "What do the OHCs move with their
electromotility? " Auditory Mechanisms: Proceedings of the 9th International
Symposium, Portland USA., 101-102.

46 Biophysics of an Aging Cochlea
Pattuzi, R. (1996). "Cochlear micromechanics and macromechanics," in The Cochlea, edited
by Dallos, P., Popper, A., N., Fay, R., R. (Springer-Verlag, USA), pp. 186-257.
Patuzzi, R., and Moleirinho, A. (1998). "Automatic monitoring of mechano-electrical
transduction in the guinea pig cochlea," Hear. Res. 125, 1-16.
Ramamoorthy, S., Deo, N. V., and Grosh, K. (2007). "A mechano-electro-acoustical model
for the cochlea: Response to acoustic stimuli," J. Acous. Soc. Am. 121, 2758-2773.
Riquelme, R., Cediel, R., Contreras, J., la Rosa Lourdes, R. D., Murillo-Cuesta, S.,
Hernandez-Sanchez, C., Zubeldia, J. M., Cerdan, S., and Varela-Nieto, I. (2010). "A
comparative study of age-related hearing loss in wild type and insulin-like growth
factor I deficient mice," Front Neuroanat. 4, 27.
Robles, L., and Ruggero, M. A. (2001). "Mechanics of the mammalian cochlea,"
Physiological reviews 81, 1305-1352.
Santos-Sacchi, J. (1991). "Isolated supporting cells from the organ of Corti: some whole cell
electrical characteristics and estimates of gap junctional conductance," Hear. Res. 52,
89-98.
Saremi, A., and Stenfelt, S. (2011). "A physiological signal transmission model to be used for
specific diagnosis of cochlear impairments," AIP: What Fire is in Mine Ears:
Proceedings of the 11th International Mechanics of Hearing Workshop 1403, pp. 369-
373.
Schmiedt, R. A. (2010). "physiology of cochlear presbyacusis," in The Aging Auditory system,
edited by Gordon-Salant S. F., Fristina, R. D., Popper, A. N., Fay, R, R. (Springer
Science+Business Media, USA ), pp. 9-38.
Schmiedt, R. A., Lang, H., Okamura, H. O., and Schulte, B. A. (2002). "Effects of furosemide
applied chronically to the round window: a model of metabolic presbyacusis," J.
Neurosci. 22, 9643-9650.

47 Biophysics of an Aging Cochlea
Slepecky, N. B. (1996). "Structure of the mamalian cochlea," in The Cochlea, edited by edited
by Dallos, P., Popper, A., N., Fay, R., R. (Springer-Verlag, USA), pp. 44-129.
Stenfelt, S., and Ronnberg, J. (2009). "The Signal-Cognition interface: Interactions between
degraded auditory signals and cognitive processes," Scand J Psychol. 50, 385-393.
Stone, J. S., and Cotanche, D. A. (2007). "Hair cell regeneration in the avian auditory
epithelium," Int. J. Dev. Biol. 51, 633-647.
Sumner, C. J., Lopez-Poveda, E. A., O'Mard, L. P., and Meddis, R. (2002). "A revised model
of the inner-hair cell and auditory-nerve complex," J. Acous. Soc. Am. 111, 2178-
2188.
Trowe, M. O., Maier, H., Petry, M., Schweizer, M., Schuster-Gossler, K., and Kispert, A.
(2011). "Impaired stria vascularis integrity upon loss of E-cadherin in basal cells,"
Dev Biol 359, 95-107.
Winter, I. M., Robertson, D., and Yates, G. K. (1990). "Diversity of characteristic frequency
rate-intensity functions in guinea pig auditory nerve fibres," Hear. Res. 45, 191-202.
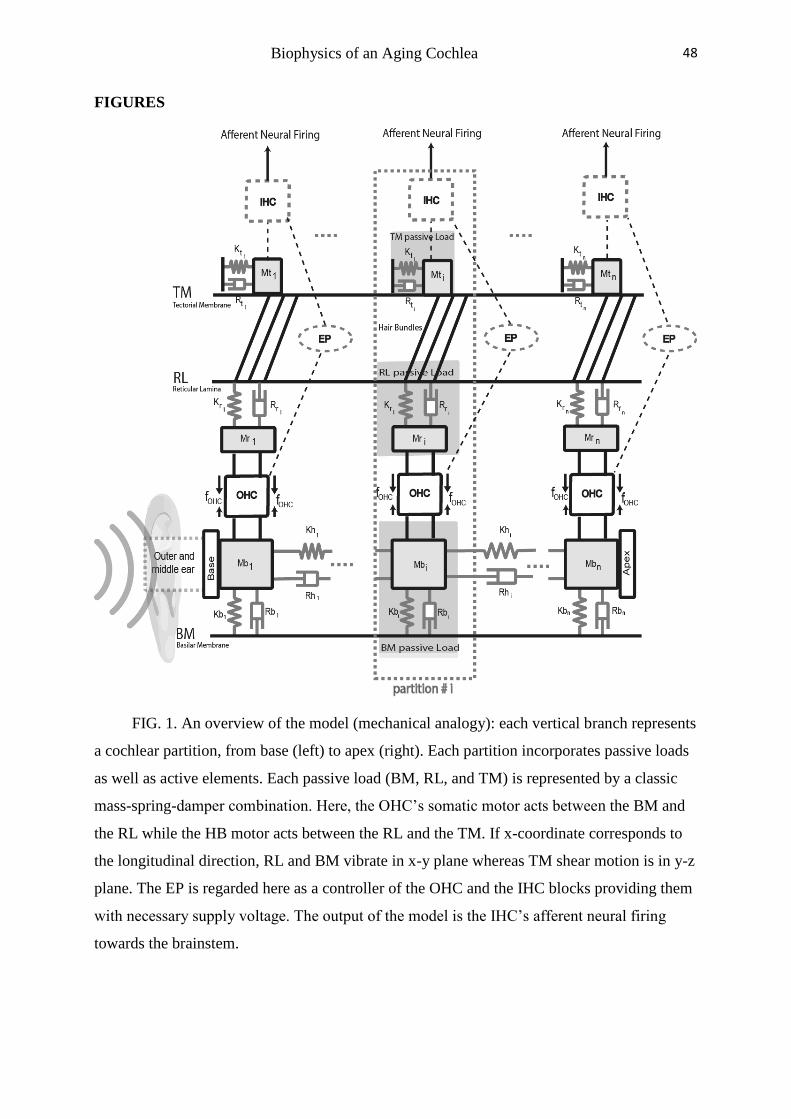
48 Biophysics of an Aging Cochlea
FIGURES
FIG. 1. An overview of the model (mechanical analogy): each vertical branch represents
a cochlear partition, from base (left) to apex (right). Each partition incorporates passive loads
as well as active elements. Each passive load (BM, RL, and TM) is represented by a classic
mass-spring-damper combination. Here, the OHC’s somatic motor acts between the BM and
the RL while the HB motor acts between the RL and the TM. If x-coordinate corresponds to
the longitudinal direction, RL and BM vibrate in x-y plane whereas TM shear motion is in y-z
plane. The EP is regarded here as a controller of the OHC and the IHC blocks providing them
with necessary supply voltage. The output of the model is the IHC’s afferent neural firing
towards the brainstem.

49 Biophysics of an Aging Cochlea
FIG. 2. (a) A single cochlear partition along the organ of Corti (the ith partition)
depicting a model of the BM and RL and the OHC. The OHC’s somatic motor generates a
pair-force (fOHC) pushing BM (path 1) and RL (path 2) towards each other. (b) A schematic of
how the somatic motor boosts the passive vibrations by means of two feed-forwards; one on
the RL and the other one on the BM.

50 Biophysics of an Aging Cochlea
FIG. 3. The Stria vascularis is modeled by its body resistance (Rst) together with an
ideal voltage source (EP). The fluid inside SM is assumed to have a resistance of Rsm. This
physiological battery provides the MET channels of the OHC HB with necessary
charge/current to function properly. The MET mechanism drives the somatic motor and is
defined by Eq. (1) and (6) and the corresponding physiological parameters. The somatic motor
is taken from the piezoelectric model of [Liu and Neely (2009), Fig. 1]. The dashed box
represents a nonlinear piezoelectric component which converts the gating electrical current
( id) into a mechanical force ( fOHC) which results in the OHC’s contraction (Xo).

51 Biophysics of an Aging Cochlea
FIG. 4. (a) The peak receptor current (ir) induced by opening of the MET channels as a
function of the HB displacement (Δxr) estimated by the Boltzmann function in Eq. (1). The
MET is illustrated for two conditions: 1. Healthy and fully active cochlea (EP=89 mV, solid
line) 2. A presbyacusis cochlea where the EP is degenerated to its half value (EP=44.5 mV,

52 Biophysics of an Aging Cochlea
dashed line). (b) The corresponding slopes are illustrated for the two conditions above. (c)
The peak receptor current (ir) induced by the opening of the MET channels as a function of
the HB displacement for the IHCs is also estimated by Eq. (1). The IHC MET is illustrated for
the same two conditions above.
FIG. 5. (a) The magnitudes of the RL/base velocity ratios at three representative
locations, at 30%, 50% and 70% of the total cochlear length from the base. These ratios are
calculated at an intensity corresponding to a 300 nm displacement of the RL. (b) The position-
frequency map from the simulations and the position-frequency predicted by Greenwood
(1990).

53 Biophysics of an Aging Cochlea
FIG. 6. The vibration pattern along the cochlea (the ‘panoramic view’) in response to
pure tones of 1,2 and 4 kHz when simulated at a low intensity. (left) The magnitudes in dB.
(right) The corresponding phase in cycles.

54 Biophysics of an Aging Cochlea
FIG. 7. Comparison between experimental data and the model predictions. (a) Averaged
data from [de Boer and Nuttall, (2000), Fig. 1] and [Cooper, (1998), Fig. 1(A)] on the
amplitude of the BM motion in the guinea pig cochlea in response to a low level (20 dB)
stimuli at a location 3mm from the base (crosses) versus the model prediction at the same
location on the cochlea (solid line). (b) The phase of the BM vibration have been reported by
[(de Boer and Nuttall, 2000), Fig. 2(B)] at locations between 2mm and 5mm from the base,
corresponding to 8% to 20% of the guinea pig cochlear length. These data (crosses) have been
fitted with a decaying exponential function (dashed line) and shown versus the model
prediction of the phase at the same cochlear region (solid line).

55 Biophysics of an Aging Cochlea
FIG. 8. The effect of the EP degeneration on the gain of the cochlear amplifier and the
position-frequency map (tuning pattern) of the cochlea for three conditions: 1) healthy and
fully-active cochlea [EP=89mV], 2) when the EP is degenerated to half of its maximum value
as a result of metabolic presbyacusis [EP=44.5 mV] and, 3) dead cochlea [EP=0]. (left)
Magnitude of the RL/base velocity ratios at a location corresponding to 30% of the total
cochlear length from the base. (middle) Magnitude of the RL/base velocity ratios at a position
corresponding to 70% of the total length from the base. (right) The CFs are shifted backwards
as a result of the EP degeneration.

56 Biophysics of an Aging Cochlea
FIG. 9(left) The decline in firing rate of the MSR auditory fiber as a function of the EP
reduction. (middle) Data from Winter et al. (1990) on the firing rate of the MSR auditory
nerve fibers as a function of the sound intensity at a basal region of the guinea pig cochlea
tuned to 16 kHz (crosses). These data are fitted by a three-state, second-order Boltzmann
curve leading to a rate-intensity transfer function (solid line). The reduction in the maximum
firing rate in turn leads to a decline of the rate-intensity characteristic of the MSR fiber
(dashed line). The arrow depicts that as the EP drops to half, in order to obtain a rate of 250
[spikes/second] a higher sound intensity is required. (right) The intensity loss caused by the
rate-intensity transfer function being manipulated by the EP reduction, illustrated in the
dynamic range of the MSR fibers.

57 Biophysics of an Aging Cochlea
FIG. 10 (a) the decline of the human cochlear amplification caused by age-related
reduction of the EP shown as a function of the CF for the frequencies from 50 to 4000 Hz. It
demonstrates a flat loss in the lower frequencies followed by a sloping loss. (b) The phase
difference between the BM velocity (𝐻𝑡𝑟𝑖𝑔) and the OHC motility force (𝐻𝑜) in the middle of
the cochlear duct for the healthy (EP= 89mV) and the presbyacusis (EP=44.5mV) cochlea. (c)
The predictions of the modified model for guinea pig versus the CAP threshold deteriorations
reported by [Schmiedt, et al. (2002), Fig. 4 and Fig. 7] from Furosemide treated and aged
gerbil cochleae.

58 Biophysics of an Aging Cochlea
FIG.11. The effect of some common simplifications on the output of the cochlear
model. (left) Gain of the cochlear amplifier changes after removal of the BM feed-forward
[path (1) in Fig. 2] as a result of neglecting the longitudinal structural coupling. (middle) After
removal of the BM feed-forward, the position-frequency map (tuning pattern) of the cochlea
approaches that of a dead (passive) cochlea. (right) Changes in amplification and sensitivity
as a result of neglecting the TM’s passive mechanical load from the model.