Embed Size (px)
Citation preview
HAL Id: hal-03427542https://hal.archives-ouvertes.fr/hal-03427542
Submitted on 14 Nov 2021
HAL is a multi-disciplinary open accessarchive for the deposit and dissemination of sci-entific research documents, whether they are pub-lished or not. The documents may come fromteaching and research institutions in France orabroad, or from public or private research centers.
L’archive ouverte pluridisciplinaire HAL, estdestinée au dépôt et à la diffusion de documentsscientifiques de niveau recherche, publiés ou non,émanant des établissements d’enseignement et derecherche français ou étrangers, des laboratoirespublics ou privés.
Effect of Methane, CO 2 , and H 2 S on the Solubility ofMethyl and Ethyl Mercaptans in a 25 wt %
Methyldiethanolamine Aqueous Solution at 333 and 365K
Christophe Coquelet, Eric Boonaert, Alain Valtz, Stanley Huang
To cite this version:Christophe Coquelet, Eric Boonaert, Alain Valtz, Stanley Huang. Effect of Methane, CO 2 , and H2 S on the Solubility of Methyl and Ethyl Mercaptans in a 25 wt % Methyldiethanolamine AqueousSolution at 333 and 365 K. Journal of Chemical and Engineering Data, American Chemical Society,2021, 66 (11), pp.4000-4017. �10.1021/acs.jced.1c00160�. �hal-03427542�

1
Effect of methane, CO2 and H2S on the solubility of methyl and ethyl
mercaptans in a 25wt% methyldiethanolamine aqueous solution at 333 and
365K
Christophe Coqueleta,*, Eric Boonaerta, Alain Valtza, Stanley Huangb
aMines ParisTech, PSL University, CTP-Centre of Thermodynamics of Processes, 35 rue Saint
Honoré, 77305 Fontainebleau Cedex, France
b Former employee of Chevron, 1400 Smith Street, Houston, TX 77002
*Corresponding author. Tel: +33164694962, E-mail address: [email protected] (C.
Coquelet)
Abstract
We have investigated the solubility of methanethiol and ethanethiol (methyl and ethyl mercaptans
in an aqueous methyldiethanolamine solution (25 wt% ) by using static-analytic method at 333 and
365K. The measurements were done for different pressure of methane in the absence of acid gas
with individual acid gas present, and with mixture of acid gases present (CO2 and/with H2S).
Additional measurement of Henry’s law constant were realized by considering gas stripping
method. Effect of total pressure (realized by addition of methane) and effect of acid gas loading
for a constant total pressure around 7 MPa were studied. The increasing of pressure and acid gas
loading increase the apparent Henry’s law constant of the mercaptan, highlighting a drop out effect
of the mercaptans.
Keywords:Data; Vapor–liquid equilibrium; Solubility, Henry’s law constant, gas processing, experimental work
2
1. Introduction
Acid gases are present in natural gas and must be removed before its fractionation or liquefaction.
Acid gas absorption1 is the most popular operation unit considered to remove CO2 and H2S and this
operation requires one solvent. Depending on the concentration of the acid gases, physical (pure
organic compound in general) or chemical solvents are considered (Osman et al.2). In acid gas
absorption, chemical solvent are generally preferred. They are aqueous alkanolamine solution
where the chemical solvent reacts with CO2 and H2S to form regenerable salts. These salts are also
thermally regenerable.
Unfortunately, H2S is not the single sulfur compound presents in natural gas. If one of the
hydrogen atoms of H2S is replaced by an alkyl group, we have chemical from mercaptan or thiol
family. methanethiol and ethanethiol are the two main sulfur compounds present in quantity with
CO2 and H2S. According to Huguet et al.3, the specification of typical treated gas contains minor
amounts of contaminants: 2% CO2, 2–4 ppm H2S and 5–30 ppm total sulfur (mercaptans and COS).
Mercaptans or thiols compounds are volatile compounds. They can be responsible of malodorous
conditions and serious environmental concerns. Moreover, it is well known that mercaptans exhibit
similar toxicity to hydrogen sulfide. In effect, very important quantity mercaptans may affect
nervous system, can cause various health complications for example convulsion, narcosis,
pulmonary oedema and so can paralyze respiratory system. As mercaptans are classified as acid
component (R-SH) they can also cause serious corrosion problems and environmental damages
due to acid deposition and rapid acidification. Some of them maybe introduced to the environment
through anthropogenic resources not only fossil fuel burning or petrochemical industry but also
from municipal sewage systems.
As mention by Awan et al.4, environmental protection agencies force oil and gas companies
reducing sulfur emission in effluent stream. Consequently, these restrictions led engineering
companies to investigate the effects of these substances on the performances of amine systems
(Pellegrini et al.5 and Langè et al.6,) particularly for acid gases removing using alkanolamine
solvent.

3
It doesn’t exist a large number of papers in the open literature concerning the solubility of
methanethiol and ethanethiol in aqueous alkanolamine solution in the presence of acid gases. We
can cite the work of Awan et al.7 who studied the solubility of n-propylmercaptan in 50wt% MDEA
aqueous solution. We can also cite the works of Coquelet and Richon8, and Coquelet et al.9 who
have used gas stripping method to determine apparent Henry’s law constant and limiting activity
coefficient of mercaptans in different aqueous MDEA solutions. Jou and Mather10 have published
some solubility data of methanethiol (methyl mercaptan) in 50wt% aqueous MDEA solution at 40
and 70°C. In their paper, Jou and Mather have indicated that the presence of methanethiol doesn’t
affect the solubility of the acid gases. They have also investigated the measured data and analyzed
the effect of methanethiol by comparing the variation Henry’s law constant (calculated after
computation of methanethiol fugacity) as a function of acid gas loading. It is important to notice
that they have measured the methanethiol solubility at constant total pressure. They concluded that
Henry’s law constant is an increasing function with acid gas loading. This point was also
highlighted by Bedell and Miller1.
Why it is so important to consider the Henry’s law constant? By definition the partition coefficient
of component is defined by L
i
g
ii
C
CK if we consider the molar concentrations in vapour and liquid
phases. The molar concentration is defined by Lorg
Lorg
ii
V
nC with n the mole number and V the volume
of vapour or liquid phase. Moreover, at infinite dilution we can expressed the pressure by 𝑃𝑖𝜑𝑖 =
𝛾𝑖∞𝑥𝑖𝑃𝑖
𝑠𝑎𝑡 with 𝜑𝑖 the fugacity of component i, 𝛾𝑖∞ the limiting activity coefficient of component i
and 𝑃𝑖𝑠𝑎𝑡 the pure component vapour pressure of component i. At infinite dilution, 𝜑𝑖 is constant.
Considering the vapour phase we have 𝑃𝑖 =𝑛𝑖
𝑔𝑍𝑅𝑇
𝑉𝑔 . Consequently, 𝐾𝑖 =𝐶𝑖
𝑔
𝐶𝑖𝐿 =
𝑦𝑖𝑛𝑔𝑉𝐿
𝑥𝑖𝑛𝐿𝑉𝑔 =𝑃𝑖𝑉𝐿
𝑥𝑖𝑛𝐿𝑅𝑇𝑍=
𝛾𝑖∞𝑃𝑖
𝑠𝑎𝑡𝑣𝐿
𝑍𝑅𝑇𝜑𝑖 with vL the molar volume of the solvent. The product
𝛾𝑖∞𝑃𝑖
𝑠𝑎𝑡
𝜑𝑖is the apparent Henry’s law
constant and it is in effect the key thermodynamic we have to investigate.
In this paper, we have investigated the solubility of methanethiol and ethanethiol (methyl
and ethyl mercaptan) in a 25wt% aqueous MDEA solution in the presence of CO2, H2S and CO2 +
H2S. The objective of this work is to propose a methodology of work and to evaluate the effect of
total pressure and acid gas loading on the liquid and vapor concentrations of mercaptans and there

4
apparent Henry’s law constant. We have used two different techniques. The first one is the gas
stripping method in order to determine the apparent Henry’s law constant at infinite dilution and
atmospheric pressure without methane, CO2 and H2S. The second one is based on static analytic
method and is similar to the one used by Awan et al.7.
2. Experimental part
2.1. Materials
In Table 1, the suppliers of of the different chemical species and their given purities are listed.
Water (H2O, CAS Number: 7732-18-5) was deionized and degassed.
Table 1: CAS Numbers, Purities and Suppliers of Materials.
Chemical Name Formula CAS No. Purity mol% Analysis
methoda Supplier
Methyldiethanolamine (MDEA) C5H15NO2 105-59-9 >99 GC Aldrich
Methanethiol (Methyl Mercaptan (MM)) CH4S 74-93-1 >99 GC Aldrich
Ethanethiol (Ethyl Mercaptan (EM)) C2H6S 75-08-1 >99 GC Acros
Carbon dioxide CO2 124-38-9 99.995 GC Air Liquide
Hydrogen sulfide H2S 7783-06-4 99.7 GC Air Liquide
Methane CH4 74-82-8 99.995 GC Messer
Water H2O 7732-18-5 Ultra pure
(18.2 MΩ·cm) Millipore/ Direct Q (direct-Q5)
a GC: Gas Chromatography
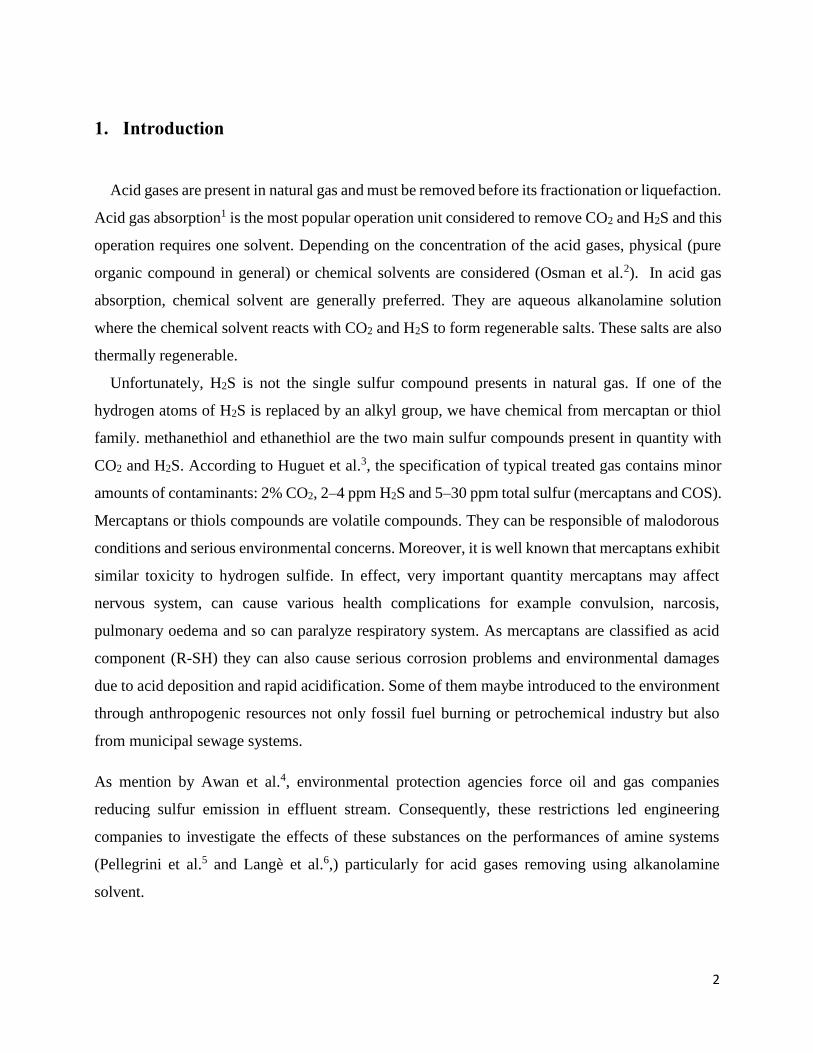
Table 2 presents the concentrations of the solvent loading with methanethiol and ethanethiol for
the gas stripping measurement and the vapour liquid equilibrium measurement using static
analytic-method. Solvents are prepared in a vessel by different weighing. First, the vessel is
weighed under vacuum, than we add the MDEA, than the water and finally the mercaptan.
Ethanethiol is added using a gas chromatograph syringe. Concerning methanethiol, as it is a
gaseous component, we have connected the recipient directly to the MM bottle and controlled the
quantity introduced by difference of pressure. The accuracy of the mass comparator used the
different weighing (CC1200, METTLER TOLEDO) is ±1 mg. We have tried to prepare mixture
with the same mercaptan global concentration close to 2000 ppm.
5
Table 2: Concentration of prepared 25 wt % MDEA aqueous solution for gas stripping and static-analytic
measurements.
gas stripping
measurement
25 wt % MDEA aqueous solution
EM (2281ppm) MM (2438ppm) EM (1839ppm)
MDEA H2O MDEA H2O C2H5SH MDEA H2O CH3SH MDEA H2O C2H5SH
Ma /g.mol-1 119.61 18.02 119.16 18.02 62.14 119.16 18.02 48.11 119.16 18.02 48.11
mb /g 300.12 100.02 81.39 243.94 2.0197 46.77 140.55 0.9632 79.59 238.81 1.5935
mass frac 0.7504 0.2496 0.2486 0.7452 0.0062 25.24 75.85 0.52 24.87 74.63 0.498
mol frac 0.048 0.952 0.04792 0.94980
2281 ppm
0.0478 0.9498 2438 ppm
0.0479 0.9503 1839 ppm
Uc(x) 6.10-7 6.10-7 6.10-7 1.10-6 1.10-6 1.10-6 3.10-6 2.10-6 6.10-7 1.10-6 1.10-6 a: molar mass; b: mass of the component weighed. C: Expanded uncertainty on mole fraction (k=2)
2.2. Apparatus and method
a. Gas stripping measurement
The determination of the apparent Henry’s Law Constant and Infinite Dilution Activity
Coefficient are being measured using dilutor technique (gas stripping method). The measurements
had been carried out from 25 till 75°C for the two mercaptans. 5 to 6 temperature points had been
measured. The equipment is similar to the equipment used in previous work realized in our research
group (Coquelet and Richon8, Coquelet et al.9, Zin et al.11, Hajiw et al.12). Figure 1 shows the
flowsheet of the experimental set-up employed to determine the apparent Henry’s law constant.
Briefly, two cells (saturator and dilutor cells) are immersed inside a liquid bath regulated to within
0.01 K. A platinum probe is inserted in the dilutor cell and is in immersed in the liquid phase. It is
connected to an electronic display and is used for temperature readings. Considering supplier
specification, the temperature uncertainty is estimated to be U(T) = 0.2 K. The exponential dilutor
is not equipped with pressure transducer. In consequence, the value of atmospheric pressure is
given by GE Druck DPI 142, Precision Barometic Indicator with an accuracy of U(P) = 0.04 kPa.
Samples are analysed by a gas chromatograph (PERICHROM model PR2100, France) equipped
with a flame ionization detector (FID) connected to a data software system. Helium is used as the
carrier gas. The reference of the analytical column is 15% APIEZON L, 80/100 Mesh (Silcosteel,
length 1.2 m, diameter 2 mm) from RESTEK, France. As presented in our previous papers, this
method is based on the variation of vapor phase concentration when the highly diluted solute of
the liquid mixture in the dilutor cell is stripped from the solution by a flow of inert gas (helium).
Periodically, the concentration of the gas leaving the cell is sampled using a gas sampling valve
6
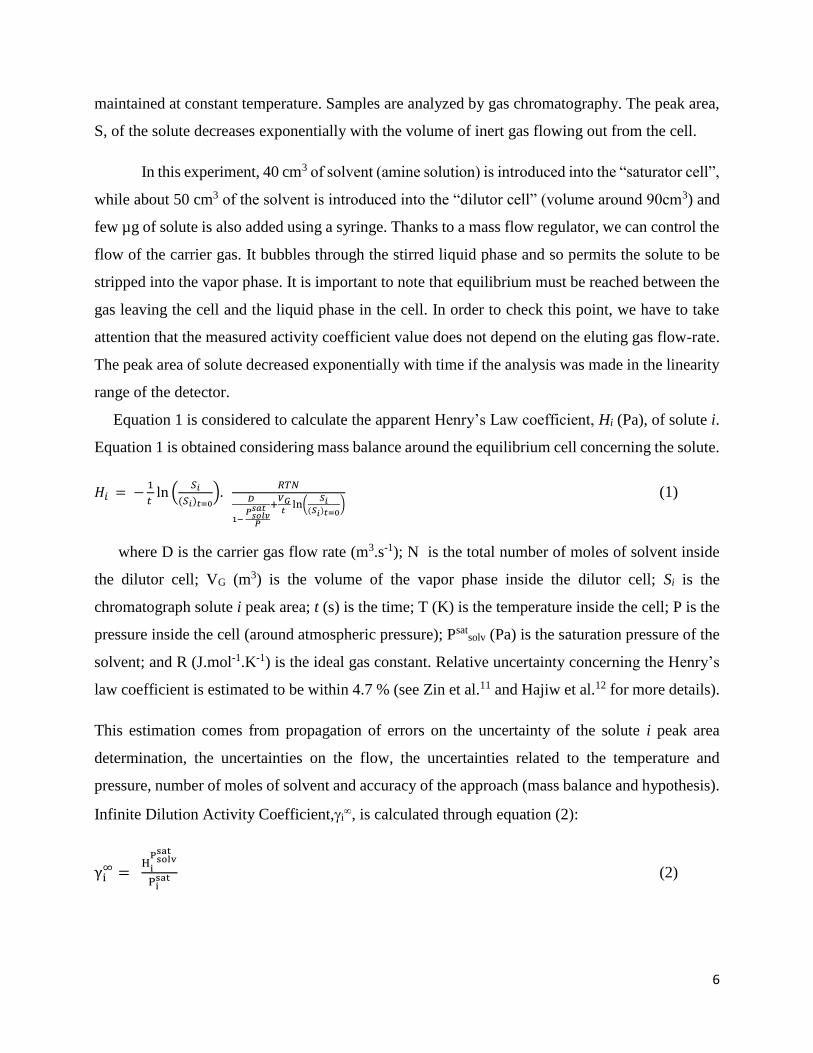
maintained at constant temperature. Samples are analyzed by gas chromatography. The peak area,
S, of the solute decreases exponentially with the volume of inert gas flowing out from the cell.
In this experiment, 40 cm3 of solvent (amine solution) is introduced into the “saturator cell”,
while about 50 cm3 of the solvent is introduced into the “dilutor cell” (volume around 90cm3) and
few µg of solute is also added using a syringe. Thanks to a mass flow regulator, we can control the
flow of the carrier gas. It bubbles through the stirred liquid phase and so permits the solute to be
stripped into the vapor phase. It is important to note that equilibrium must be reached between the
gas leaving the cell and the liquid phase in the cell. In order to check this point, we have to take
attention that the measured activity coefficient value does not depend on the eluting gas flow-rate.
The peak area of solute decreased exponentially with time if the analysis was made in the linearity
range of the detector.
Equation 1 is considered to calculate the apparent Henry’s Law coefficient, Hi (Pa), of solute i.
Equation 1 is obtained considering mass balance around the equilibrium cell concerning the solute.
𝐻𝑖 = −1
𝑡 ln (
𝑆𝑖
(𝑆𝑖)𝑡=0).
𝑅𝑇𝑁𝐷
1− 𝑃𝑠𝑜𝑙𝑣
𝑠𝑎𝑡
𝑃
+𝑉𝐺𝑡
ln(𝑆𝑖
(𝑆𝑖)𝑡=0) (1)
where D is the carrier gas flow rate (m3.s-1); N is the total number of moles of solvent inside
the dilutor cell; VG (m3) is the volume of the vapor phase inside the dilutor cell; Si is the
chromatograph solute i peak area; t (s) is the time; T (K) is the temperature inside the cell; P is the
pressure inside the cell (around atmospheric pressure); Psatsolv (Pa) is the saturation pressure of the
solvent; and R (J.mol-1.K-1) is the ideal gas constant. Relative uncertainty concerning the Henry’s
law coefficient is estimated to be within 4.7 % (see Zin et al.11 and Hajiw et al.12 for more details).
This estimation comes from propagation of errors on the uncertainty of the solute i peak area
determination, the uncertainties on the flow, the uncertainties related to the temperature and
pressure, number of moles of solvent and accuracy of the approach (mass balance and hypothesis).
Infinite Dilution Activity Coefficient,i, is calculated through equation (2):
γi∞ =
Hi
Psolvsat
Pisat (2)

7
Figure 1: Flow diagram of the equipment: BF, bubble flow meter; C, gas chromatograph; D, dilutor; d.a.s., data acquisition system; He,helium cylinder;
E1, E2, heat exchangers; FE, flow meter electronic; FR, flow regulator; L, sampling loop; LB, liquid bath; O, O-ring; PP,platinum resistance
thermometer probe; S, saturator; SI, solute injector; Sp, septum; SV, sampling valve; TR, temperature regulator;VSS, variable speed stirrer.

8
The correlation (DIPPR n°101) to calculate saturation pressure is given in equation (3), with details
concerning the calculation of the saturation pressure are presented Table 3.
𝑃𝑠𝑎𝑡 = 𝑒(𝐴+𝐵
𝑇+𝐶 ln(𝑇)+𝐷∙𝑇𝐸)
(3)
Concerning the solvent, its vapor pressure is calculated using equation (4).
𝑃𝑠𝑜𝑙𝑣𝑠𝑎𝑡 = 𝑥𝑤𝑎𝑡𝑒𝑟𝑃𝑤𝑎𝑡𝑒𝑟
𝑠𝑎𝑡 + 𝑥𝑀𝐷𝐸𝐴𝑃𝑀𝐷𝐸𝐴𝑠𝑎𝑡 (4)
With xi the mole fraction of component i. This equation is derived from 𝑃 = 𝑃𝑤𝑎𝑡𝑒𝑟 + 𝑃𝑀𝐷𝐸𝐴 =
𝛾𝑤𝑎𝑡𝑒𝑟𝑥𝑤𝑎𝑡𝑒𝑟𝑃𝑤𝑎𝑡𝑒𝑟𝑠𝑎𝑡 + 𝛾𝑀𝐷𝐸𝐴𝑥𝑀𝐷𝐸𝐴𝑃𝑀𝐷𝐸𝐴
𝑠𝑎𝑡 with i the activity coefficient of component i. Kim et
al.13 have shown with their measurements using ebulliometer that the activity coefficient is close
to one for a 25wt% aqueous MDEA solution. Moreover, 𝑃𝑀𝐷𝐸𝐴𝑠𝑎𝑡 ≪ 𝑃𝑤𝑎𝑡𝑒𝑟
𝑠𝑎𝑡 .
Table 3: Coefficient of the pure component vapor pressure correlation (Eq. 3).
Parameters MM EM Water
A 54.15 65.551 73.649
B -4337.7 -5027.4 -7258.2
C -4.8127 -6.6853 -7.3037
D 4.5x10⁻¹⁷ 6.32x10⁻⁶ 4.17 x10⁻⁶
E 6 2 2
Source: Simulis™ thermodynamics from PROSIM, France.
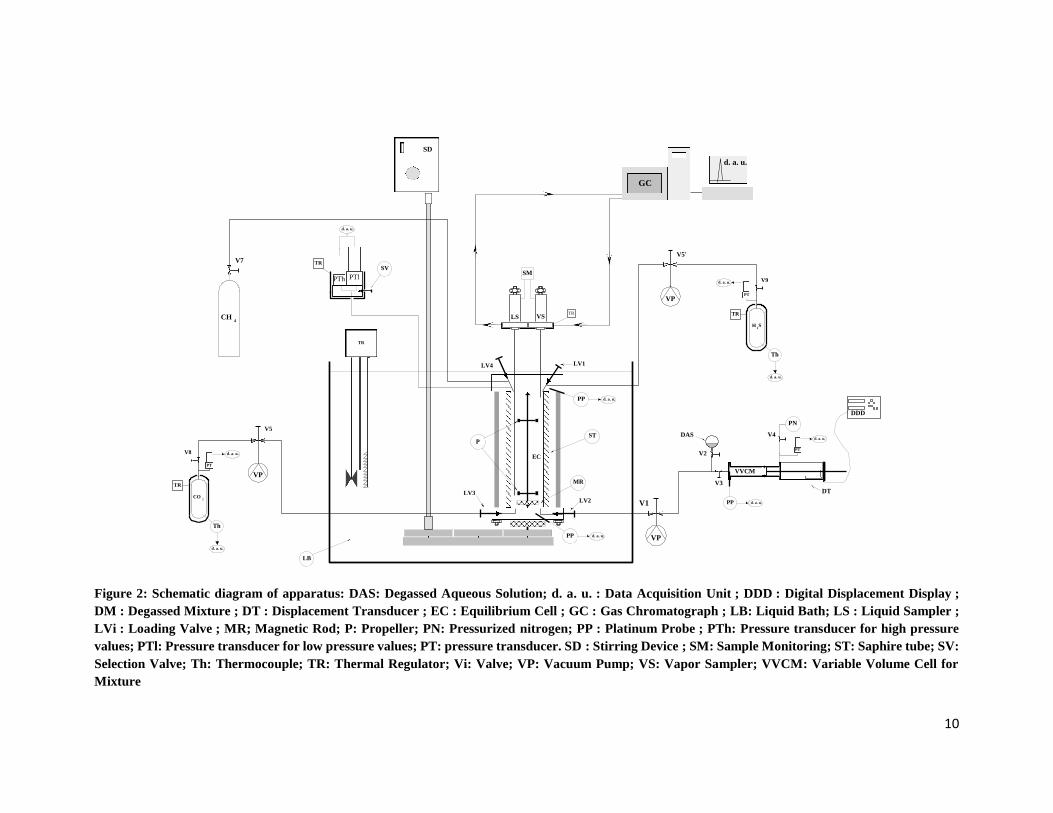
b. Static analytic method
A “static-analytic” technique based on a closed-circuit method is used for the determination of
partition coefficient methanethiol and ethanethiol in 50 wt% MDEA aqueous solution in the
presence of CO2 and H2S. The equipment is similar to the one used by Dicko et al.14, Awan et al.7
and Skylogianni et al.15. The flowsheet of the equipment is presented in figure 2. Briefly, the
apparatus is equipped with two online capillary samplers (ROLSI®, Armines’ patent) connected to
a gas chromatograph through a heated transfer line. The capillary samplers are capable of
withdrawing micro samples without perturbing the equilibrium conditions over numerous
samplings, thus leading to repeatable and reliable results. An internal stirring system with external
motor reduced the time required to reach equilibrium. Analytical work was carried out using a gas
chromatograph (PERICHROM model PR2100, France) equipped with a thermal conductivity

9
detector (TCD) and a flame ionization detector (FID) connected to a data software system. Helium
is used as the carrier gas in this experiment. A Porapak R GC column is used (Porapak R 80 / 100
mesh, 2 m x 2 mm ID Silcosteel). Also a pre column used (length 0.25 m) in order to separate
MDEA from the other species. Considering the value of the total pressure, we have considered that
the mole ratio 𝑛𝑤𝑎𝑡𝑒𝑟
𝑛𝑀𝐷𝐸𝐴⁄ is constant.
The equilibrium cell temperature is measured at two points, one for vapor and the other for
liquid phase by using two four-wire Pt100 Platinum Resistance Thermometer probes. Probes are
inserted in the upper and lower flanges. The platinum probes are calibrated against a reference
four-wire PT-25 Platinum Resistance Thermometer probe (PT-100). The 25 reference platinum
resistance thermometer (TINSLEY Precision Instruments) was calibrated by the Laboratoire
National d'Essais (Paris) based on the 1990 International Temperature Scale (ITS 90). The resulting
accuracy for temperature is not higher than ± 0.015 °C by the temperature range. The pressure
transducers have been calibrated against a PACE 5000 Modular Pressure Calibrator (GE Sensing,
France). Pressure measurement accuracy are estimated to be within ± 0.8 kPa. Calibration of GC
detectors is realized by injection of known quantities of chemicals in the GC using GC syringe and
eVol analytical electronic syringe. Several volumes of each component are injected in order to
obtain a correlation to link mole number injected and the corresponding GC peak areas for the
different GC detectors. Estimation of the detectors accuracy for each component are obtained with
the help of polynomial expressions whereby the numbers of moles are expressed as a function of
peak areas. Table 4 shows the results.
Table 4: Components and accuracy (typical accuracy values).
Component Phase Detector (sensitivity) Mole number relative accuracy/ %
CH4 Vapor TCD (gain=0.5) 2.5
H2O Liquid TCD (gain=0.5) 1.5
CO2 Liquid/vapor TCD (gain=0.5) 2.0
CH4 Liquid FID (10nA) 2.5
EM Liquid FID (10nA) 3.0
MM Vapor FID (10nA) 1.8
H2S Vapor TCD (gain=0.05) 2.2
H2S Liquid TCD (gain=0.5) 1.9
10
Figure 2: Schematic diagram of apparatus: DAS: Degassed Aqueous Solution; d. a. u. : Data Acquisition Unit ; DDD : Digital Displacement Display ;
DM : Degassed Mixture ; DT : Displacement Transducer ; EC : Equilibrium Cell ; GC : Gas Chromatograph ; LB: Liquid Bath; LS : Liquid Sampler ;
LVi : Loading Valve ; MR; Magnetic Rod; P: Propeller; PN: Pressurized nitrogen; PP : Platinum Probe ; PTh: Pressure transducer for high pressure
values; PTl: Pressure transducer for low pressure values; PT: pressure transducer. SD : Stirring Device ; SM: Sample Monitoring; ST: Saphire tube; SV:
Selection Valve; Th: Thermocouple; TR: Thermal Regulator; Vi: Valve; VP: Vacuum Pump; VS: Vapor Sampler; VVCM: Variable Volume Cell for
Mixture
VP
EC
ST
LV1
GC
d. a. u.
LS VS
SM
TR
SD
PP d. a. u.
V5
LV2
EC
PP d. a. u.
MR
CH4
TR
PTlPTh
SV
d. a. u.
LV3
V7
CO2
PT
TR
Th
V8 d. a. u.
d. a. u.
LV4
P
LB
TR
VP
V5'
H2S
PT
d. a. u.
TR
Th
V9
d. a. u.
VP
V2
V3
V4DAS
PN
DT
VVCM
DDD
V1
PT
d. a. u.
PP d. a. u.
11
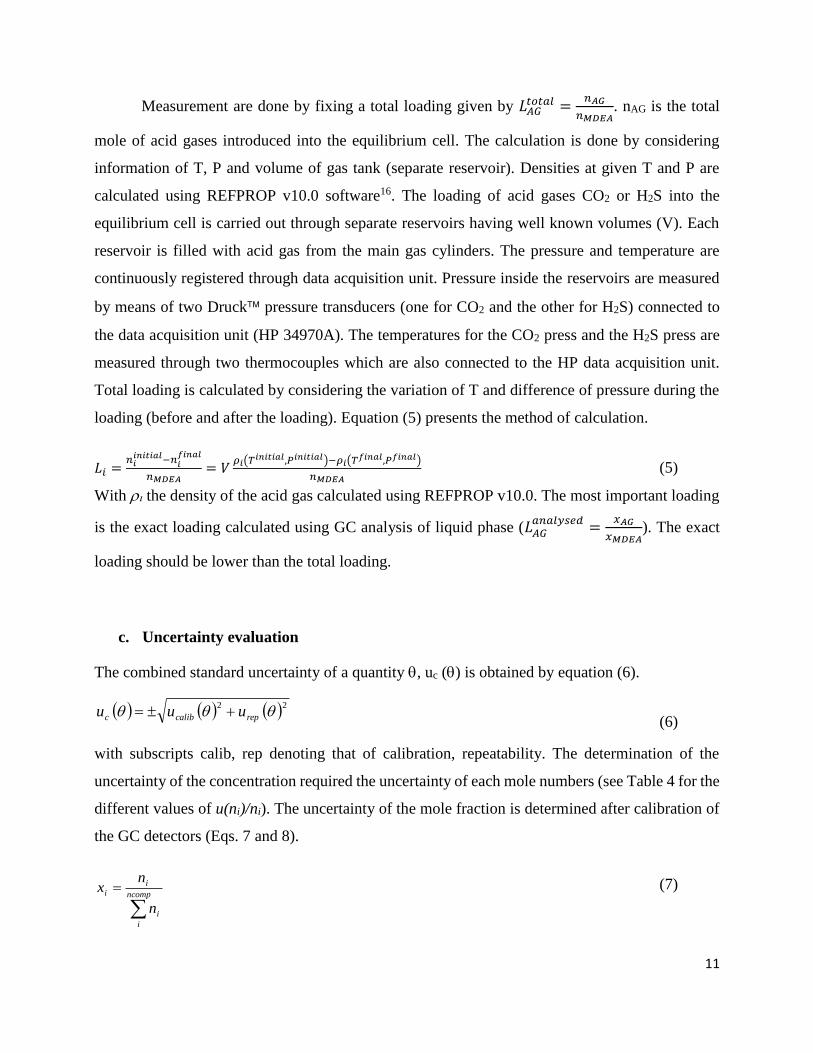
Measurement are done by fixing a total loading given by 𝐿𝐴𝐺𝑡𝑜𝑡𝑎𝑙 =
𝑛𝐴𝐺
𝑛𝑀𝐷𝐸𝐴. nAG is the total
mole of acid gases introduced into the equilibrium cell. The calculation is done by considering
information of T, P and volume of gas tank (separate reservoir). Densities at given T and P are
calculated using REFPROP v10.0 software16. The loading of acid gases CO2 or H2S into the
equilibrium cell is carried out through separate reservoirs having well known volumes (V). Each
reservoir is filled with acid gas from the main gas cylinders. The pressure and temperature are
continuously registered through data acquisition unit. Pressure inside the reservoirs are measured
by means of two Druck pressure transducers (one for CO2 and the other for H2S) connected to
the data acquisition unit (HP 34970A). The temperatures for the CO2 press and the H2S press are
measured through two thermocouples which are also connected to the HP data acquisition unit.
Total loading is calculated by considering the variation of T and difference of pressure during the
loading (before and after the loading). Equation (5) presents the method of calculation.
𝐿𝑖 =𝑛𝑖
𝑖𝑛𝑖𝑡𝑖𝑎𝑙−𝑛𝑖𝑓𝑖𝑛𝑎𝑙
𝑛𝑀𝐷𝐸𝐴= 𝑉
𝜌𝑖(𝑇𝑖𝑛𝑖𝑡𝑖𝑎𝑙,𝑃𝑖𝑛𝑖𝑡𝑖𝑎𝑙)−𝜌𝑖(𝑇𝑓𝑖𝑛𝑎𝑙,𝑃𝑓𝑖𝑛𝑎𝑙)
𝑛𝑀𝐷𝐸𝐴 (5)
With the density of the acid gas calculated using REFPROP v10.0. The most important loading
is the exact loading calculated using GC analysis of liquid phase (𝐿𝐴𝐺𝑎𝑛𝑎𝑙𝑦𝑠𝑒𝑑
=𝑥𝐴𝐺
𝑥𝑀𝐷𝐸𝐴). The exact
loading should be lower than the total loading.
c. Uncertainty evaluation
The combined standard uncertainty of a quantity , uc () is obtained by equation (6).
22 repcalibc uuu
(6)
with subscripts calib, rep denoting that of calibration, repeatability. The determination of the
uncertainty of the concentration required the uncertainty of each mole numbers (see Table 4 for the
different values of u(ni)/ni). The uncertainty of the mole fraction is determined after calibration of
the GC detectors (Eqs. 7 and 8).
ncomp
i
i
i
i
n
nx (7)
12
ncomp
i
i
i
i
i nun
xxu
ji
2
2
(8)
For example, for a binary system, one can calculate
2
2
2
2
1
1111 1
n
nu
n
nuxxxu .
We consider for each mole number that we have uncertainty of Type B.
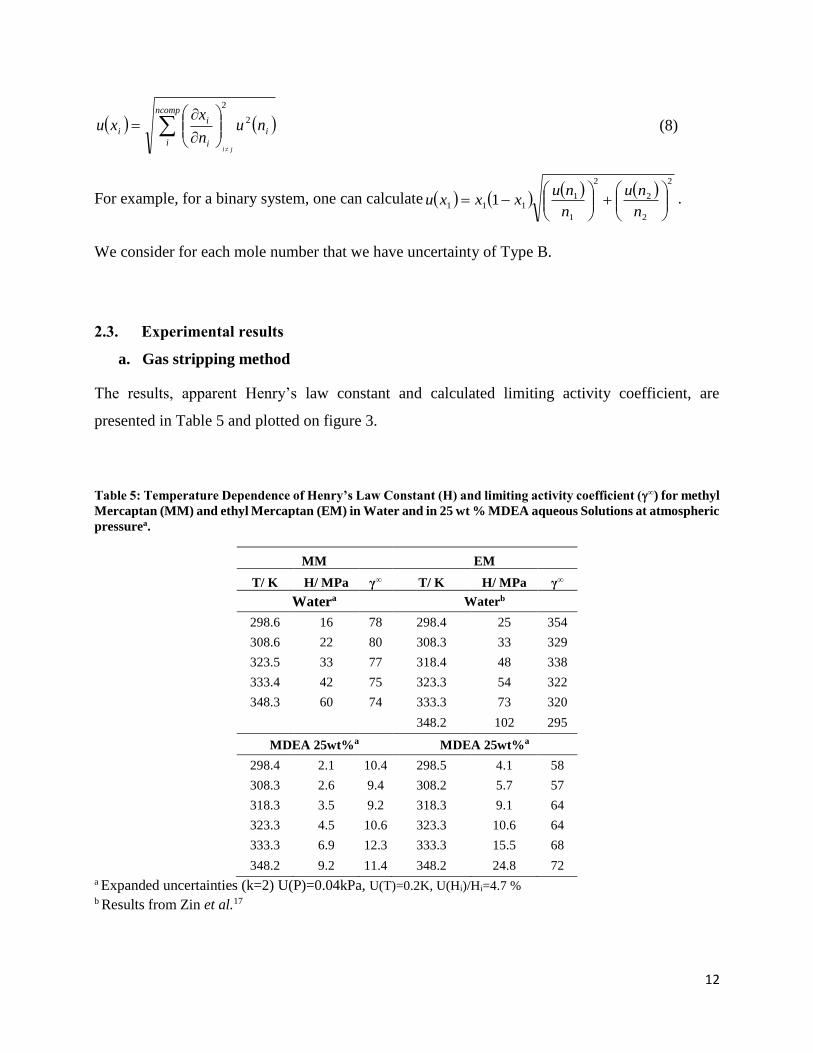
2.3. Experimental results
a. Gas stripping method
The results, apparent Henry’s law constant and calculated limiting activity coefficient, are
presented in Table 5 and plotted on figure 3.
Table 5: Temperature Dependence of Henry’s Law Constant (H) and limiting activity coefficient (∞) for methyl
Mercaptan (MM) and ethyl Mercaptan (EM) in Water and in 25 wt % MDEA aqueous Solutions at atmospheric
pressurea.
MM EM
T/ K H/ MPa γ∞ T/ K H/ MPa γ∞
Watera Waterb
298.6 16 78 298.4 25 354
308.6 22 80 308.3 33 329
323.5 33 77 318.4 48 338
333.4 42 75 323.3 54 322
348.3 60 74 333.3 73 320
348.2 102 295
MDEA 25wt%a MDEA 25wt%a
298.4 2.1 10.4 298.5 4.1 58
308.3 2.6 9.4 308.2 5.7 57
318.3 3.5 9.2 318.3 9.1 64
323.3 4.5 10.6 323.3 10.6 64
333.3 6.9 12.3 333.3 15.5 68
348.2 9.2 11.4 348.2 24.8 72 a Expanded uncertainties (k=2) U(P)=0.04kPa, U(T)=0.2K, U(Hi)/Hi=4.7 % b Results from Zin et al.17
13
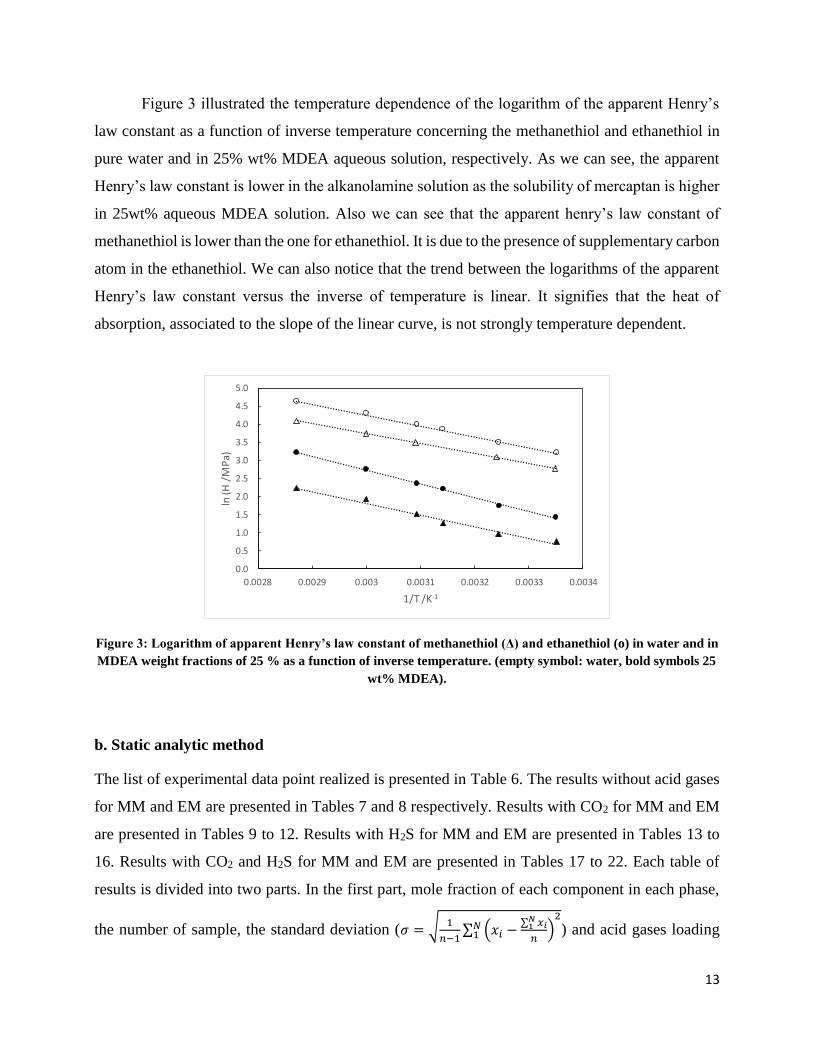
Figure 3 illustrated the temperature dependence of the logarithm of the apparent Henry’s
law constant as a function of inverse temperature concerning the methanethiol and ethanethiol in
pure water and in 25% wt% MDEA aqueous solution, respectively. As we can see, the apparent
Henry’s law constant is lower in the alkanolamine solution as the solubility of mercaptan is higher
in 25wt% aqueous MDEA solution. Also we can see that the apparent henry’s law constant of
methanethiol is lower than the one for ethanethiol. It is due to the presence of supplementary carbon
atom in the ethanethiol. We can also notice that the trend between the logarithms of the apparent
Henry’s law constant versus the inverse of temperature is linear. It signifies that the heat of
absorption, associated to the slope of the linear curve, is not strongly temperature dependent.
Figure 3: Logarithm of apparent Henry’s law constant of methanethiol (Δ) and ethanethiol (o) in water and in
MDEA weight fractions of 25 % as a function of inverse temperature. (empty symbol: water, bold symbols 25
wt% MDEA).
b. Static analytic method
The list of experimental data point realized is presented in Table 6. The results without acid gases
for MM and EM are presented in Tables 7 and 8 respectively. Results with CO2 for MM and EM
are presented in Tables 9 to 12. Results with H2S for MM and EM are presented in Tables 13 to
16. Results with CO2 and H2S for MM and EM are presented in Tables 17 to 22. Each table of
results is divided into two parts. In the first part, mole fraction of each component in each phase,
the number of sample, the standard deviation (𝜎 = √ 1
𝑛−1∑ (𝑥𝑖 −
∑ 𝑥𝑖𝑁1
𝑛)
2𝑁1 ) and acid gases loading
0.0
0.5
1.0
1.5
2.0
2.5
3.0
3.5
4.0
4.5
5.0
0.0028 0.0029 0.003 0.0031 0.0032 0.0033 0.0034
ln (H
/M
Pa)
1/T /K-1

14
are presented. In the second part, the corresponding calibration uncertainties for each component
are presented. Using our experimental results we have calculated the apparent Henry’s law
constant. It is defined by equation (10). Ki is the partition coefficient.
Table 6: List of experimental VLE data realized. Pressurization will be done using CH4.
System T / K P / MPa No. of Experimental data
MM + CO2 (no H2S) 333 and 365 Around 7 6 (3 pts /T)
MM + H2S (no CO2) 333 and 365 Around 7 6
MM + H2S (3 CO2 loadings) 333 and 365 Around 7 6
EM + H2S (no CO2) 333 and 365 Around 7 6
EM + CO2 (no H2S) 333 and 365 Around 7 6
EM + CO2 (3 H2S loadings) 333 and 365 Around 7 6
𝐻𝑖 =𝑃𝑦𝑖
𝑥𝑖= 𝑃𝐾𝑖 (10)
Using our experimental results, we have compared the influence of mercaptan concentration, total
pressure and acid gases loading on the variation of the apparent Henry’s law constant. We have
considered the apparent Henry’s law constant measured by gas stripping method as the reference.
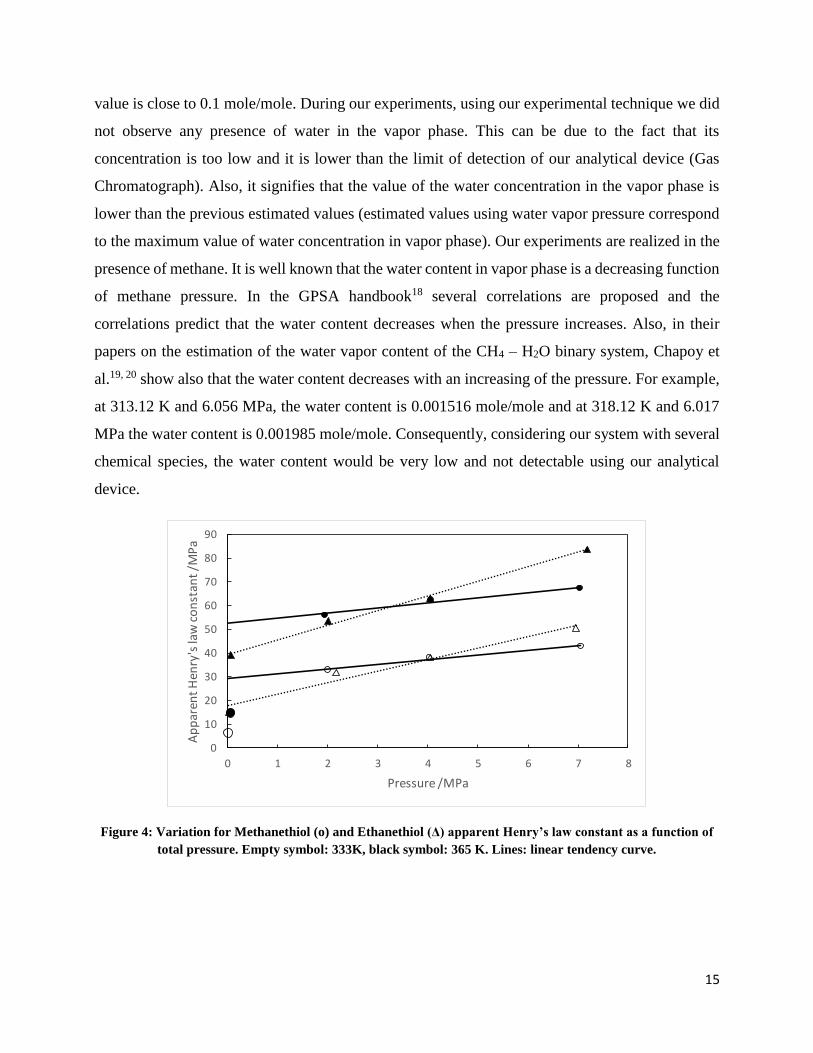
The table 7 presents the results concerning the two mercaptans without any acid gases. The results
are also plotted in figure 4. We can observed a linear dependency between apparent Henry’s law
constant and total pressure and a continuity from measurement using gas stripping method for EM
but not for MM. We can suspect that it may be due to the fact chemical reaction between MM and
aqueous MDEA solution is more important than with EM (certainly, there is no chemical reaction
with EM). Methane, which is not present during gas stripping measurement, may inhibit the
reaction with MM and drop out MM for the solution. Another explanation can be that the rate of
the reaction is very low in comparison to the residence time of the MM in comparison to the time
of stripping. Probably it leads to some inaccuracy with gas stripping measurement method. In
Tables 23 to 26 apparent Henry’s law constant are calculated.
On each table of results, we did not include the vapor concentration of water. A rough estimation
can be done by divided the water vapor pressure by the total pressure. At 333K and 7MPa, the
water concentration is approximatively equal to 0.003 mole/mole, and at 365K and 7 MPa, the
15
value is close to 0.1 mole/mole. During our experiments, using our experimental technique we did
not observe any presence of water in the vapor phase. This can be due to the fact that its
concentration is too low and it is lower than the limit of detection of our analytical device (Gas
Chromatograph). Also, it signifies that the value of the water concentration in the vapor phase is
lower than the previous estimated values (estimated values using water vapor pressure correspond
to the maximum value of water concentration in vapor phase). Our experiments are realized in the
presence of methane. It is well known that the water content in vapor phase is a decreasing function
of methane pressure. In the GPSA handbook18 several correlations are proposed and the
correlations predict that the water content decreases when the pressure increases. Also, in their
papers on the estimation of the water vapor content of the CH4 – H2O binary system, Chapoy et
al.19, 20 show also that the water content decreases with an increasing of the pressure. For example,
at 313.12 K and 6.056 MPa, the water content is 0.001516 mole/mole and at 318.12 K and 6.017
MPa the water content is 0.001985 mole/mole. Consequently, considering our system with several
chemical species, the water content would be very low and not detectable using our analytical
device.
Figure 4: Variation for Methanethiol (o) and Ethanethiol (Δ) apparent Henry’s law constant as a function of
total pressure. Empty symbol: 333K, black symbol: 365 K. Lines: linear tendency curve.
0
10
20
30
40
50
60
70
80
90
0 1 2 3 4 5 6 7 8
Ap
par
ent
Hen
ry's
law
co
nst
ant
/MP
a
Pressure /MPa

16
Table 7: Vapor Liquid equilibrium data of Methanethiol (2438 ppm) in 25 wt% MDEA aqueous solution. x corresponds to the standard deviation due to
repeatability measurements and u(x) corresponds to uncertainties due to GC detectors calibration
Ta Pa MM CH4 MDEA H2Ob MM CH4
K MPa n x x x x x x x x n y y y y
332.68 2.0033 6 0.00253 2E-05 0.00041 2E-06 0.04777 9E-07 0.94929 2E-05 4 0.04123 1E-04 0.95877 1E-04
332.71 4.0292 6 0.00210 2E-05 0.00084 2E-05 0.04777 2E-06 0.94929 4E-05 5 0.01987 1E-05 0.98013 1E-05
332.69 7.0543 7 0.00167 3E-05 0.00145 1E-05 0.04776 1E-06 0.94912 2E-05 6 0.01013 3E-05 0.98987 3E-05
364.54 1.9405 7 0.00205 3E-05 0.00039 5E-06 0.04780 2E-06 0.94977 4E-05 10 0.05917 9E-05 0.94083 9E-05
364.58 4.0580 7 0.00178 2E-05 0.00087 1E-05 0.04779 1E-06 0.94957 3E-05 4 0.02742 1E-05 0.97258 1E-05
364.60 7.0408 7 0.00157 2E-05 0.00153 1E-05 0.04776 1E-06 0.94914 3E-05 5 0.01503 2E-05 0.98497 2E-05
T MM CH4 MM CH4 MDEA H2O T MM CH4 MM CH4 MDEA H2O
K u(y) u(y) u(x) u(x) u(x) u(x) K u(y) u(y) u(x) u(x) u(x) u(x)
332.68 1E-04 2E-03 5E-05 7E-06 1E-03 2E-02 364.54 2E-04 2E-03 4E-05 7E-06 1E-03 2E-02
332.71 6E-05 2E-03 4E-05 2E-05 1E-03 2E-02 364.58 8E-05 2E-03 4E-05 2E-05 1E-03 2E-02
332.69 3E-05 2E-03 3E-05 3E-05 1E-03 2E-02 364.60 4E-05 2E-03 3E-05 3E-05 1E-03 2E-02 a Expanded uncertainties (k=2) U(P)=0.0008MPa, U(T)=0.02K bVapor water content is not measured and lower than the limit of detection of the TCD detector
17
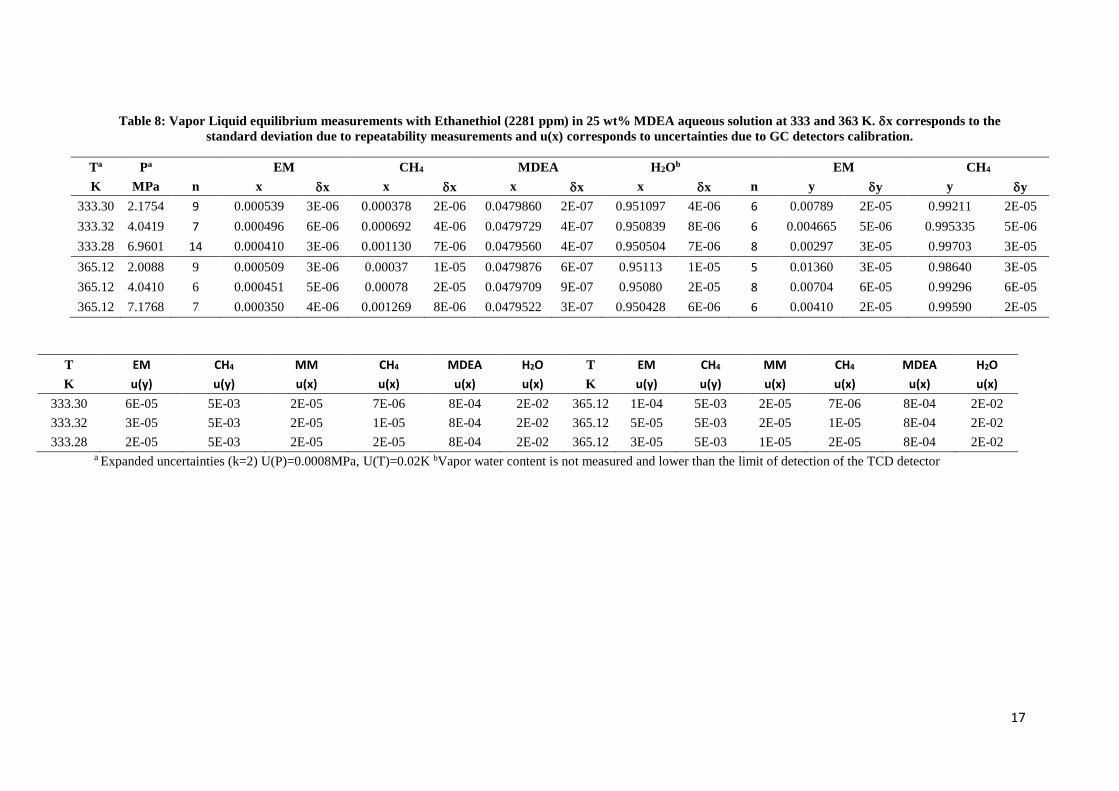
Table 8: Vapor Liquid equilibrium measurements with Ethanethiol (2281 ppm) in 25 wt% MDEA aqueous solution at 333 and 363 K. x corresponds to the
standard deviation due to repeatability measurements and u(x) corresponds to uncertainties due to GC detectors calibration.
Ta Pa EM CH4 MDEA H2Ob EM CH4
K MPa n x x x x x x x x n y y y y
333.30 2.1754 9 0.000539 3E-06 0.000378 2E-06 0.0479860 2E-07 0.951097 4E-06 6 0.00789 2E-05 0.99211 2E-05
333.32 4.0419 7 0.000496 6E-06 0.000692 4E-06 0.0479729 4E-07 0.950839 8E-06 6 0.004665 5E-06 0.995335 5E-06
333.28 6.9601 14 0.000410 3E-06 0.001130 7E-06 0.0479560 4E-07 0.950504 7E-06 8 0.00297 3E-05 0.99703 3E-05
365.12 2.0088 9 0.000509 3E-06 0.00037 1E-05 0.0479876 6E-07 0.95113 1E-05 5 0.01360 3E-05 0.98640 3E-05
365.12 4.0410 6 0.000451 5E-06 0.00078 2E-05 0.0479709 9E-07 0.95080 2E-05 8 0.00704 6E-05 0.99296 6E-05
365.12 7.1768 7 0.000350 4E-06 0.001269 8E-06 0.0479522 3E-07 0.950428 6E-06 6 0.00410 2E-05 0.99590 2E-05
T EM CH4 MM CH4 MDEA H2O T EM CH4 MM CH4 MDEA H2O
K u(y) u(y) u(x) u(x) u(x) u(x) K u(y) u(y) u(x) u(x) u(x) u(x)
333.30 6E-05 5E-03 2E-05 7E-06 8E-04 2E-02 365.12 1E-04 5E-03 2E-05 7E-06 8E-04 2E-02
333.32 3E-05 5E-03 2E-05 1E-05 8E-04 2E-02 365.12 5E-05 5E-03 2E-05 1E-05 8E-04 2E-02
333.28 2E-05 5E-03 2E-05 2E-05 8E-04 2E-02 365.12 3E-05 5E-03 1E-05 2E-05 8E-04 2E-02 a Expanded uncertainties (k=2) U(P)=0.0008MPa, U(T)=0.02K bVapor water content is not measured and lower than the limit of detection of the TCD detector

18
Table 9: Vapor Liquid equilibrium data of Methanethiol (2438 ppm) in 25 wt% MDEA aqueous solution with CO2 (total loading 0.257 and 0.486). x corresponds to
the standard deviation due to repeatability measurements and u(x) corresponds to uncertainties due to GC detectors calibration.
Ta Pa MM CH4 CO2 MDEA H2Ob CO2 Loading
K MPa n x x x x x x x x x x
332.70 7.0019 7 0.00176 1E-05 0.00111 4E-06 0.01084 9E-05 0.047256 5E-06 0.93904 9E-05 0.229
332.69 6.9884 7 0.00132 1E-05 9.35E-04 1E-06 0.02247 1E-04 0.046728 6E-06 0.92855 1E-04 0.481
Ta Pa MM CH4 CO2
K MPa n y y y y y y
332.70 7.0019 7 0.01773 4E-05 0.98143 5E-05 0.00084 1E-05
332.69 6.9884 7 0.01596 1E-04 0.97736 9E-05 0.00668 6E-05
T MM CH4 CO2 MM CH4 CO2 MDEA H2O
K u(y) u(y) u(y) u(x) u(x) u(x) u(x) u(x)
332.70 5E-05 2E-03 1E-05 4E-05 2E-05 2E-04 9E-04 2E-02
332.69 5E-05 2E-03 7E-05 3E-05 2E-05 5E-04 9E-04 2E-02 a Expanded uncertainties (k=2) U(P)=0.0008MPa, U(T)=0.02K bVapor water content is not measured and lower than the limit of detection of the TCD detector

19
Table 10: Vapor Liquid equilibrium data of Methanethiol (2438 ppm) in 25 wt% MDEA aqueous solution with CO2 (total loading 0.257 and 0.486). x corresponds
to the standard deviation due to repeatability measurements and u(x) corresponds to uncertainties due to GC detectors calibration.
Ta Pa MM CH4 CO2 MDEA H2Ob CO2 Loading
K MPa n x x x x x x x x x x
364.60 7.0092 6 0.00146 2E-05 1.16E-03 6E-06 0.00887 9E-05 0.047362 5E-06 0.94115 1E-04 0.187
364.60 7.0108 8 0.00136 2E-05 1.03E-03 1E-05 0.01936 3E-04 0.046870 2E-05 0.93137 3E-04 0.413
Ta Pa MM CH4 CO2
K MPa n y y y y y y
364.60 7.0092 5 0.02131 8E-05 0.97190 9E-05 0.00679 5E-05
364.60 7.0108 6 0.02111 8E-05 0.95021 1E-04 0.02868 1E-04
T MM CH4 CO2 MM CH4 CO2 MDEA H2O
K u(y) u(y) u(y) u(x) u(x) u(x) u(x) u(x)
364.60 6E-05 2E-03 8E-05 3E-05 2E-05 2E-04 9E-04 2E-02
364.60 6E-05 2E-03 3E-04 3E-05 2E-05 4E-04 9E-04 2E-02 a Expanded uncertainties (k=2) U(P)=0.0008MPa, U(T)=0.02K bVapor water content is not measured and lower than the limit of detection of the TCD detector
20
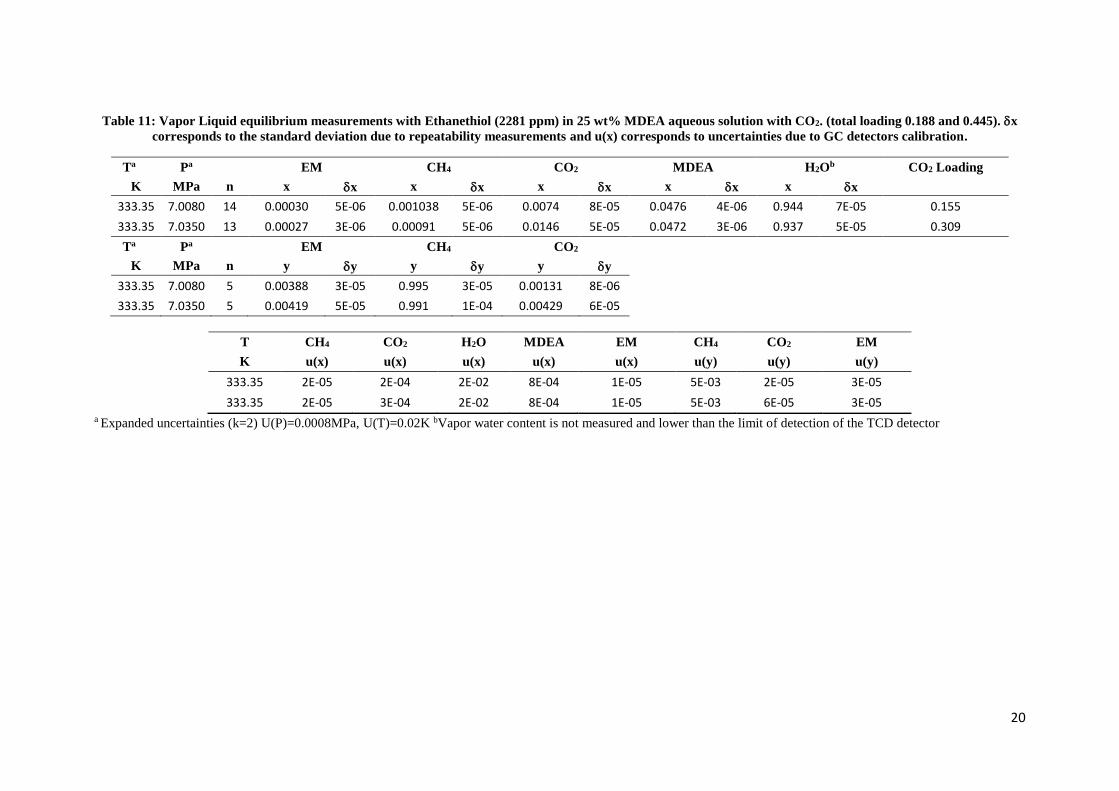
Table 11: Vapor Liquid equilibrium measurements with Ethanethiol (2281 ppm) in 25 wt% MDEA aqueous solution with CO2. (total loading 0.188 and 0.445). x
corresponds to the standard deviation due to repeatability measurements and u(x) corresponds to uncertainties due to GC detectors calibration.
Ta Pa EM CH4 CO2 MDEA H2Ob CO2 Loading
K MPa n x x x x x x x x x x
333.35 7.0080 14 0.00030 5E-06 0.001038 5E-06 0.0074 8E-05 0.0476 4E-06 0.944 7E-05 0.155
333.35 7.0350 13 0.00027 3E-06 0.00091 5E-06 0.0146 5E-05 0.0472 3E-06 0.937 5E-05 0.309
Ta Pa EM CH4 CO2
K MPa n y y y y y y
333.35 7.0080 5 0.00388 3E-05 0.995 3E-05 0.00131 8E-06
333.35 7.0350 5 0.00419 5E-05 0.991 1E-04 0.00429 6E-05
T CH4 CO2 H2O MDEA EM CH4 CO2 EM
K u(x) u(x) u(x) u(x) u(x) u(y) u(y) u(y)
333.35 2E-05 2E-04 2E-02 8E-04 1E-05 5E-03 2E-05 3E-05
333.35 2E-05 3E-04 2E-02 8E-04 1E-05 5E-03 6E-05 3E-05 a Expanded uncertainties (k=2) U(P)=0.0008MPa, U(T)=0.02K bVapor water content is not measured and lower than the limit of detection of the TCD detector
21
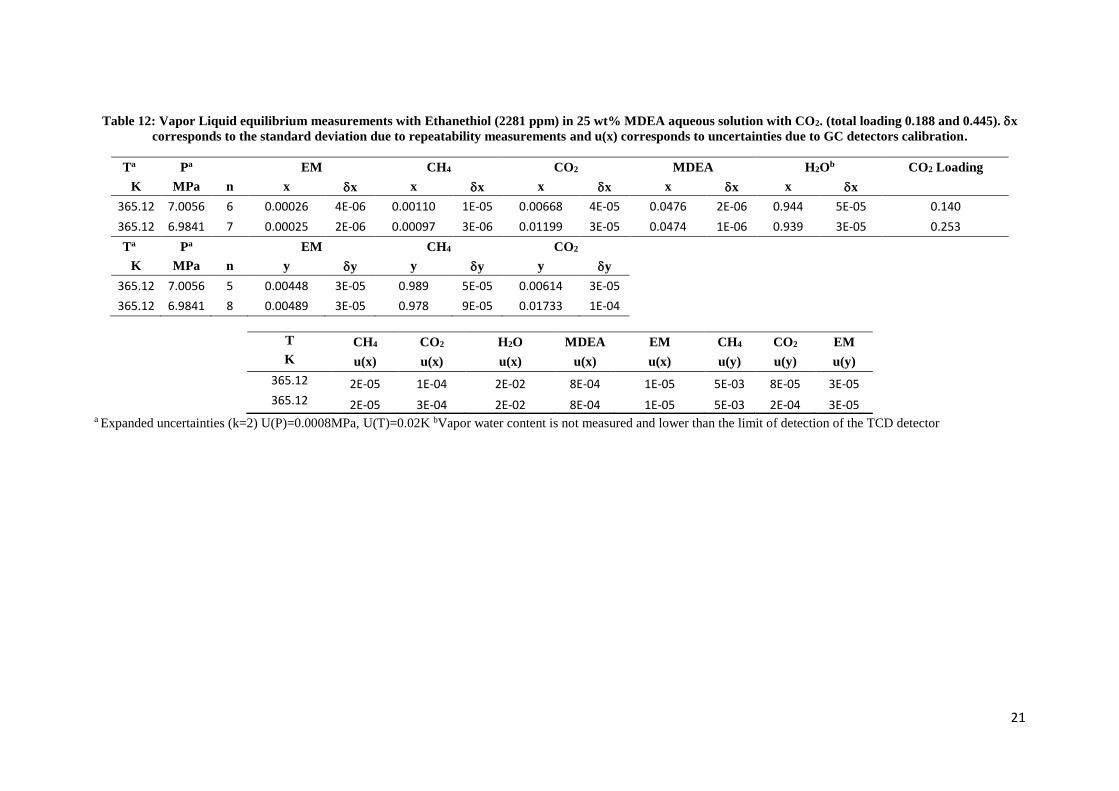
Table 12: Vapor Liquid equilibrium measurements with Ethanethiol (2281 ppm) in 25 wt% MDEA aqueous solution with CO2. (total loading 0.188 and 0.445). x
corresponds to the standard deviation due to repeatability measurements and u(x) corresponds to uncertainties due to GC detectors calibration.
Ta Pa EM CH4 CO2 MDEA H2Ob CO2 Loading
K MPa n x x x x x x x x x x
365.12 7.0056 6 0.00026 4E-06 0.00110 1E-05 0.00668 4E-05 0.0476 2E-06 0.944 5E-05 0.140
365.12 6.9841 7 0.00025 2E-06 0.00097 3E-06 0.01199 3E-05 0.0474 1E-06 0.939 3E-05 0.253
Ta Pa EM CH4 CO2
K MPa n y y y y y y
365.12 7.0056 5 0.00448 3E-05 0.989 5E-05 0.00614 3E-05
365.12 6.9841 8 0.00489 3E-05 0.978 9E-05 0.01733 1E-04
T CH4 CO2 H2O MDEA EM CH4 CO2 EM
K u(x) u(x) u(x) u(x) u(x) u(y) u(y) u(y)
365.12 2E-05 1E-04 2E-02 8E-04 1E-05 5E-03 8E-05 3E-05 365.12 2E-05 3E-04 2E-02 8E-04 1E-05 5E-03 2E-04 3E-05
a Expanded uncertainties (k=2) U(P)=0.0008MPa, U(T)=0.02K bVapor water content is not measured and lower than the limit of detection of the TCD detector
22
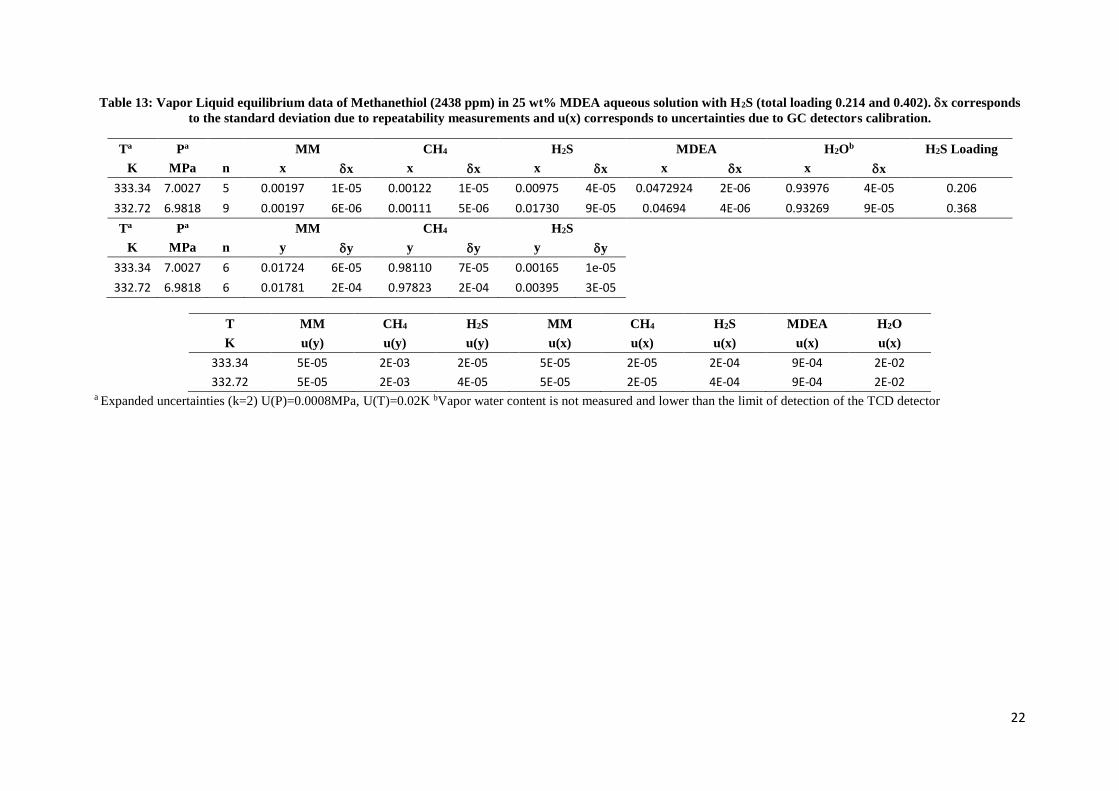
Table 13: Vapor Liquid equilibrium data of Methanethiol (2438 ppm) in 25 wt% MDEA aqueous solution with H2S (total loading 0.214 and 0.402). x corresponds
to the standard deviation due to repeatability measurements and u(x) corresponds to uncertainties due to GC detectors calibration.
Ta Pa MM CH4 H2S MDEA H2Ob H2S Loading
K MPa n x x x x x x x x x x
333.34 7.0027 5 0.00197 1E-05 0.00122 1E-05 0.00975 4E-05 0.0472924 2E-06 0.93976 4E-05 0.206
332.72 6.9818 9 0.00197 6E-06 0.00111 5E-06 0.01730 9E-05 0.04694 4E-06 0.93269 9E-05 0.368
Ta Pa MM CH4 H2S
K MPa n y y y y y y
333.34 7.0027 6 0.01724 6E-05 0.98110 7E-05 0.00165 1e-05
332.72 6.9818 6 0.01781 2E-04 0.97823 2E-04 0.00395 3E-05
T MM CH4 H2S MM CH4 H2S MDEA H2O
K u(y) u(y) u(y) u(x) u(x) u(x) u(x) u(x)
333.34 5E-05 2E-03 2E-05 5E-05 2E-05 2E-04 9E-04 2E-02
332.72 5E-05 2E-03 4E-05 5E-05 2E-05 4E-04 9E-04 2E-02 a Expanded uncertainties (k=2) U(P)=0.0008MPa, U(T)=0.02K bVapor water content is not measured and lower than the limit of detection of the TCD detector
23
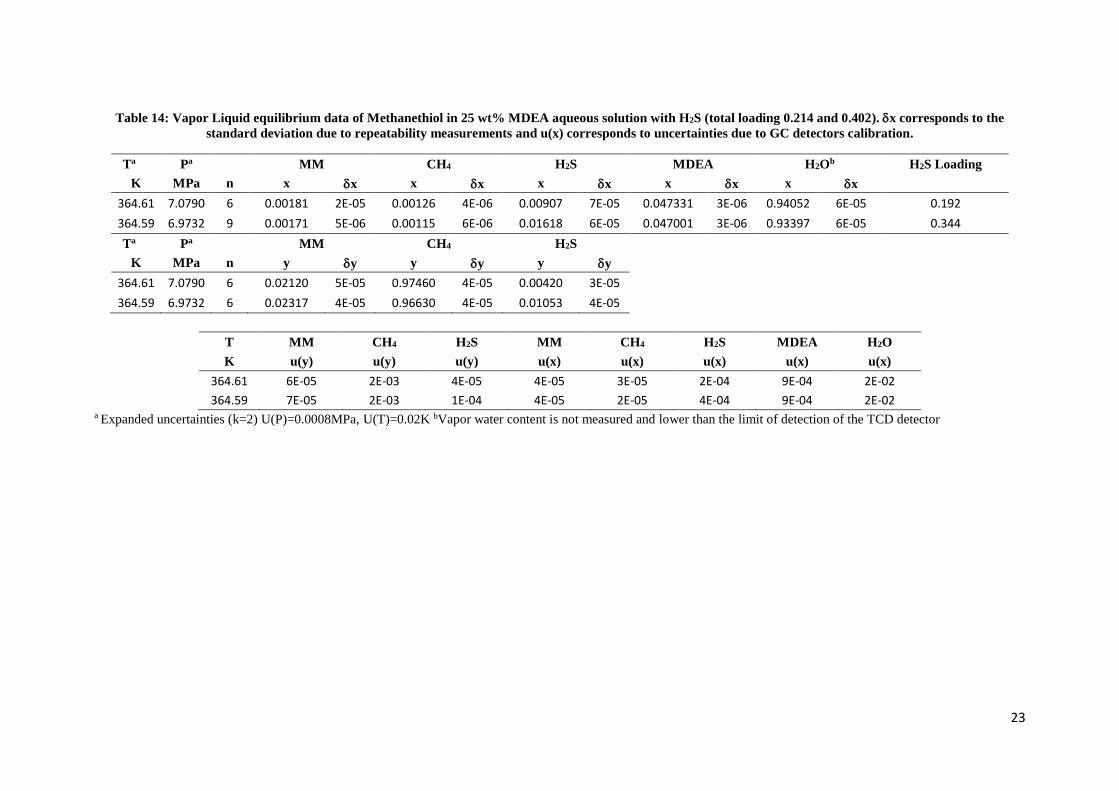
Table 14: Vapor Liquid equilibrium data of Methanethiol in 25 wt% MDEA aqueous solution with H2S (total loading 0.214 and 0.402). x corresponds to the
standard deviation due to repeatability measurements and u(x) corresponds to uncertainties due to GC detectors calibration.
Ta Pa MM CH4 H2S MDEA H2Ob H2S Loading
K MPa n x x x x x x x x x x
364.61 7.0790 6 0.00181 2E-05 0.00126 4E-06 0.00907 7E-05 0.047331 3E-06 0.94052 6E-05 0.192
364.59 6.9732 9 0.00171 5E-06 0.00115 6E-06 0.01618 6E-05 0.047001 3E-06 0.93397 6E-05 0.344
Ta Pa MM CH4 H2S
K MPa n y y y y y y
364.61 7.0790 6 0.02120 5E-05 0.97460 4E-05 0.00420 3E-05
364.59 6.9732 6 0.02317 4E-05 0.96630 4E-05 0.01053 4E-05
T MM CH4 H2S MM CH4 H2S MDEA H2O
K u(y) u(y) u(y) u(x) u(x) u(x) u(x) u(x)
364.61 6E-05 2E-03 4E-05 4E-05 3E-05 2E-04 9E-04 2E-02
364.59 7E-05 2E-03 1E-04 4E-05 2E-05 4E-04 9E-04 2E-02 a Expanded uncertainties (k=2) U(P)=0.0008MPa, U(T)=0.02K bVapor water content is not measured and lower than the limit of detection of the TCD detector

24
Table 15: Vapor Liquid equilibrium measurements with Ethanethiol (2281ppm) in 25 wt% MDEA aqueous solution H2S (total loading 0.215 and 0.419). x
corresponds to the standard deviation due to repeatability measurements and u(x) corresponds to uncertainties due to GC detectors calibration.
Ta Pa EM CH4 H2S MDEA H2Ob H2S Loading
K MPa n x x x x x x x x x x
333.37 6.9843 6 0.00041 5E-06 0.00109 1E-05 0.0063 1E-04 0.0476 5E-06 0.944 9E-05 0.132
333.29 6.9840 11 0.00037 4E-06 0.00095 9E-06 0.0151 4E-04 0.0472 2E-05 0.936 3E-04 0.320
Ta Pa EM CH4 H2S
K MPa n y y y y y y
333.37 6.9843 5 0.00409 2E-05 0.995 2E-05 0.00078 1E-05
333.29 6.9840 6 0.00410 5E-05 0.993 6E-05 0.00303 5E-05
T CH4 H2S H2O MDEA EM CH4 H2S EM
K u(x) u(x) u(x) u(x) u(x) u(y) u(y) u(y)
333.37 2E-05 2E-04 9E-05 8E-04 2E-05 5E-03 2E-05 3E-05
333.29 2E-05 4E-04 3E-04 8E-04 1E-05 5E-03 6E-05 3E-05 a Expanded uncertainties (k=2) U(P)=0.0008MPa, U(T)=0.02K bVapor water content is not measured and lower than the limit of detection of the TCD detector
25
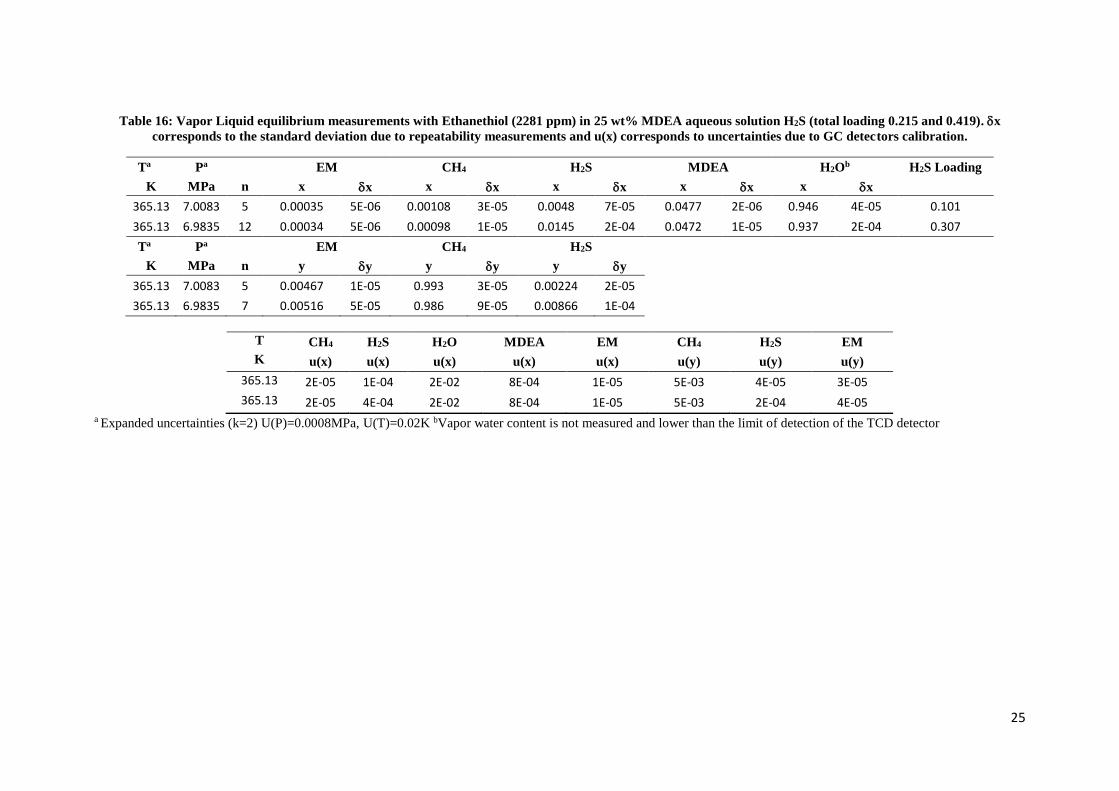
Table 16: Vapor Liquid equilibrium measurements with Ethanethiol (2281 ppm) in 25 wt% MDEA aqueous solution H2S (total loading 0.215 and 0.419). x
corresponds to the standard deviation due to repeatability measurements and u(x) corresponds to uncertainties due to GC detectors calibration.
Ta Pa EM CH4 H2S MDEA H2Ob H2S Loading
K MPa n x x x x x x x x x x
365.13 7.0083 5 0.00035 5E-06 0.00108 3E-05 0.0048 7E-05 0.0477 2E-06 0.946 4E-05 0.101
365.13 6.9835 12 0.00034 5E-06 0.00098 1E-05 0.0145 2E-04 0.0472 1E-05 0.937 2E-04 0.307
Ta Pa EM CH4 H2S
K MPa n y y y y y y
365.13 7.0083 5 0.00467 1E-05 0.993 3E-05 0.00224 2E-05
365.13 6.9835 7 0.00516 5E-05 0.986 9E-05 0.00866 1E-04
T CH4 H2S H2O MDEA EM CH4 H2S EM
K u(x) u(x) u(x) u(x) u(x) u(y) u(y) u(y)
365.13 2E-05 1E-04 2E-02 8E-04 1E-05 5E-03 4E-05 3E-05
365.13 2E-05 4E-04 2E-02 8E-04 1E-05 5E-03 2E-04 4E-05 a Expanded uncertainties (k=2) U(P)=0.0008MPa, U(T)=0.02K bVapor water content is not measured and lower than the limit of detection of the TCD detector
26
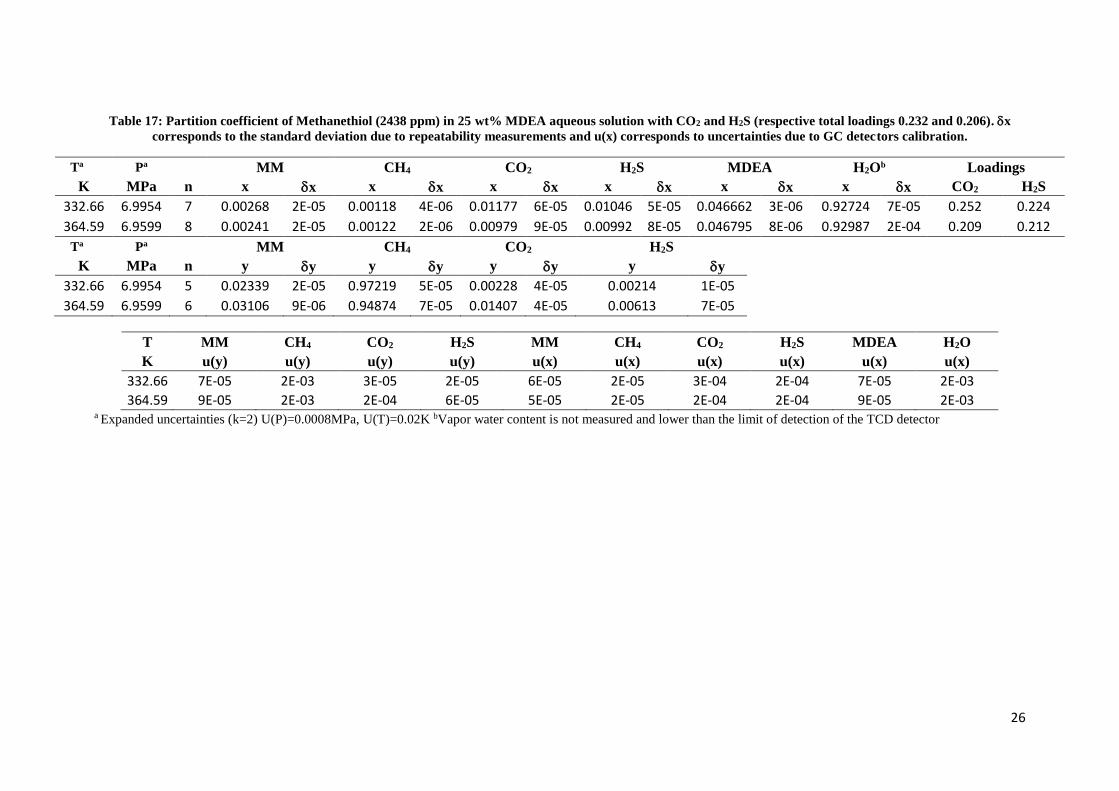
Table 17: Partition coefficient of Methanethiol (2438 ppm) in 25 wt% MDEA aqueous solution with CO2 and H2S (respective total loadings 0.232 and 0.206). x
corresponds to the standard deviation due to repeatability measurements and u(x) corresponds to uncertainties due to GC detectors calibration.
Ta Pa MM CH4 CO2 H2S MDEA H2Ob Loadings
K MPa n x x x x x x x x x x x x CO2 H2S
332.66 6.9954 7 0.00268 2E-05 0.00118 4E-06 0.01177 6E-05 0.01046 5E-05 0.046662 3E-06 0.92724 7E-05 0.252 0.224
364.59 6.9599 8 0.00241 2E-05 0.00122 2E-06 0.00979 9E-05 0.00992 8E-05 0.046795 8E-06 0.92987 2E-04 0.209 0.212
Ta Pa MM CH4 CO2 H2S
K MPa n y y y y y y y y
332.66 6.9954 5 0.02339 2E-05 0.97219 5E-05 0.00228 4E-05 0.00214 1E-05
364.59 6.9599 6 0.03106 9E-06 0.94874 7E-05 0.01407 4E-05 0.00613 7E-05
T MM CH4 CO2 H2S MM CH4 CO2 H2S MDEA H2O
K u(y) u(y) u(y) u(y) u(x) u(x) u(x) u(x) u(x) u(x)
332.66 7E-05 2E-03 3E-05 2E-05 6E-05 2E-05 3E-04 2E-04 7E-05 2E-03
364.59 9E-05 2E-03 2E-04 6E-05 5E-05 2E-05 2E-04 2E-04 9E-05 2E-03 a Expanded uncertainties (k=2) U(P)=0.0008MPa, U(T)=0.02K bVapor water content is not measured and lower than the limit of detection of the TCD detector
27
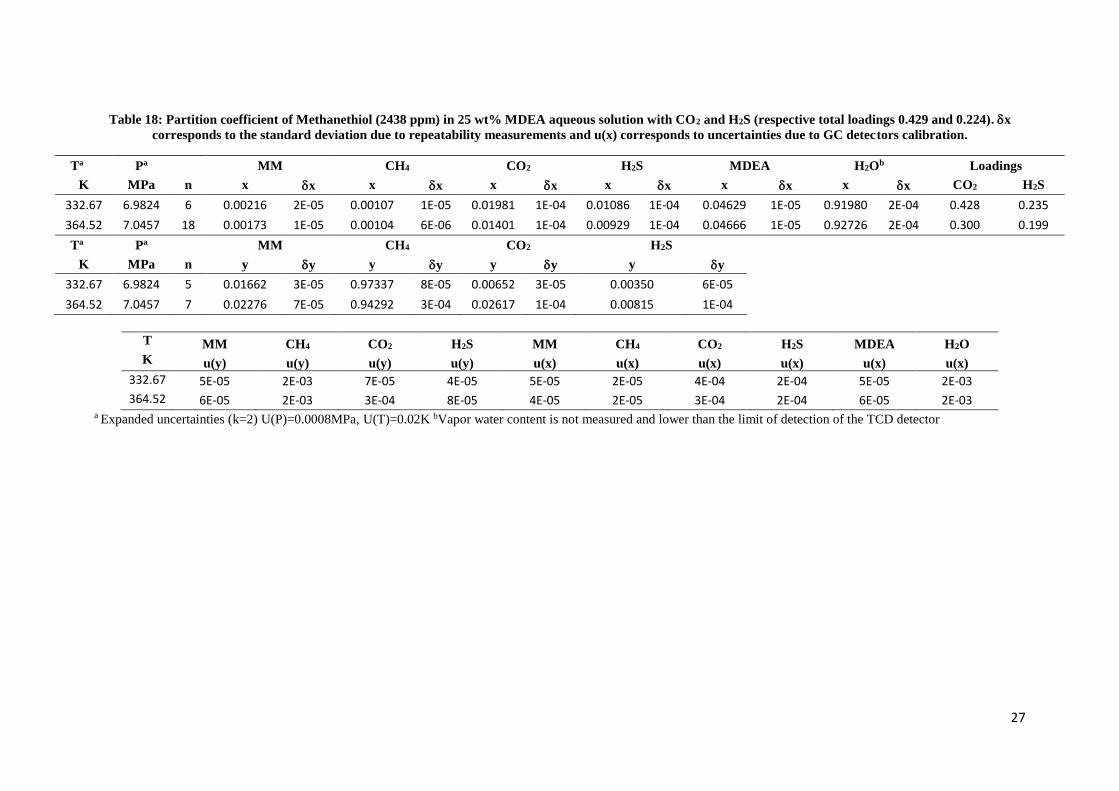
Table 18: Partition coefficient of Methanethiol (2438 ppm) in 25 wt% MDEA aqueous solution with CO2 and H2S (respective total loadings 0.429 and 0.224). x
corresponds to the standard deviation due to repeatability measurements and u(x) corresponds to uncertainties due to GC detectors calibration.
Ta Pa MM CH4 CO2 H2S MDEA H2Ob Loadings
K MPa n x x x x x x x x x x x x CO2 H2S
332.67 6.9824 6 0.00216 2E-05 0.00107 1E-05 0.01981 1E-04 0.01086 1E-04 0.04629 1E-05 0.91980 2E-04 0.428 0.235
364.52 7.0457 18 0.00173 1E-05 0.00104 6E-06 0.01401 1E-04 0.00929 1E-04 0.04666 1E-05 0.92726 2E-04 0.300 0.199
Ta Pa MM CH4 CO2 H2S
K MPa n y y y y y y y y
332.67 6.9824 5 0.01662 3E-05 0.97337 8E-05 0.00652 3E-05 0.00350 6E-05
364.52 7.0457 7 0.02276 7E-05 0.94292 3E-04 0.02617 1E-04 0.00815 1E-04
T MM CH4 CO2 H2S MM CH4 CO2 H2S MDEA H2O
K u(y) u(y) u(y) u(y) u(x) u(x) u(x) u(x) u(x) u(x)
332.67 5E-05 2E-03 7E-05 4E-05 5E-05 2E-05 4E-04 2E-04 5E-05 2E-03
364.52 6E-05 2E-03 3E-04 8E-05 4E-05 2E-05 3E-04 2E-04 6E-05 2E-03 a Expanded uncertainties (k=2) U(P)=0.0008MPa, U(T)=0.02K bVapor water content is not measured and lower than the limit of detection of the TCD detector
28
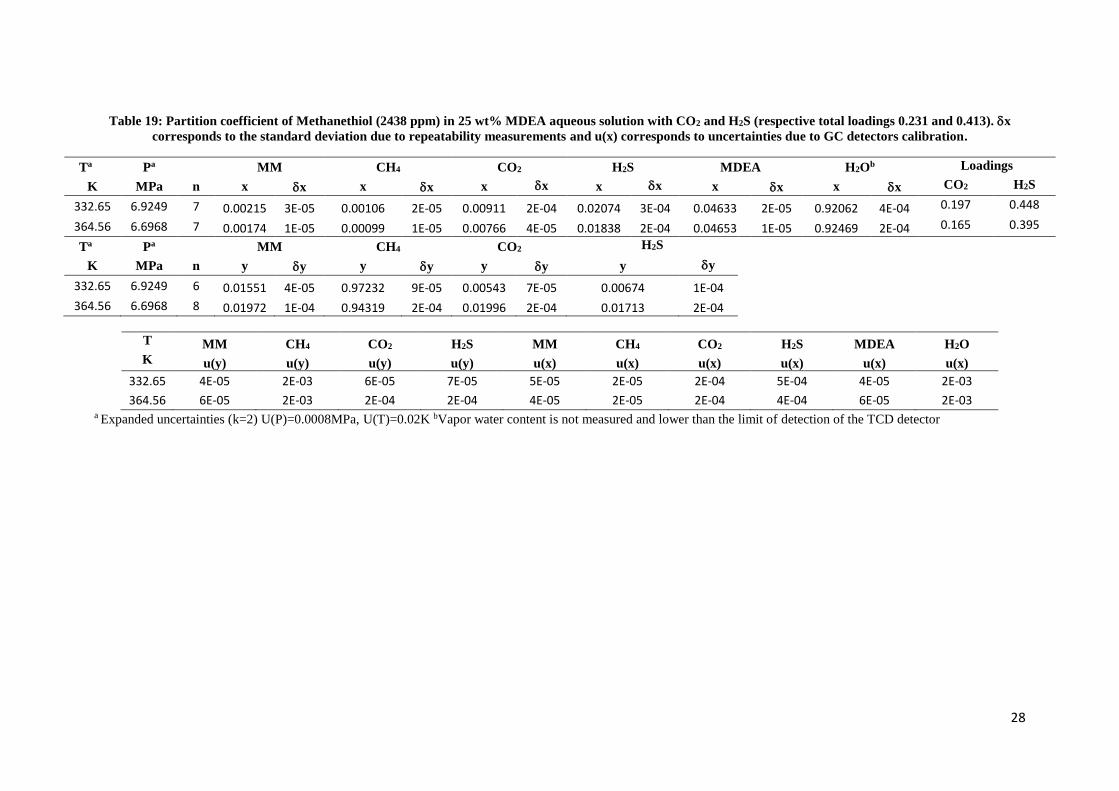
Table 19: Partition coefficient of Methanethiol (2438 ppm) in 25 wt% MDEA aqueous solution with CO2 and H2S (respective total loadings 0.231 and 0.413). x
corresponds to the standard deviation due to repeatability measurements and u(x) corresponds to uncertainties due to GC detectors calibration.
Ta Pa MM CH4 CO2 H2S MDEA H2Ob Loadings
K MPa n x x x x x x x x x x x x CO2 H2S
332.65 6.9249 7 0.00215 3E-05 0.00106 2E-05 0.00911 2E-04 0.02074 3E-04 0.04633 2E-05 0.92062 4E-04 0.197 0.448
364.56 6.6968 7 0.00174 1E-05 0.00099 1E-05 0.00766 4E-05 0.01838 2E-04 0.04653 1E-05 0.92469 2E-04 0.165 0.395
Ta Pa MM CH4 CO2 H2S
K MPa n y y y y y y y y
332.65 6.9249 6 0.01551 4E-05 0.97232 9E-05 0.00543 7E-05 0.00674 1E-04
364.56 6.6968 8 0.01972 1E-04 0.94319 2E-04 0.01996 2E-04 0.01713 2E-04
T MM CH4 CO2 H2S MM CH4 CO2 H2S MDEA H2O
K u(y) u(y) u(y) u(y) u(x) u(x) u(x) u(x) u(x) u(x)
332.65 4E-05 2E-03 6E-05 7E-05 5E-05 2E-05 2E-04 5E-04 4E-05 2E-03
364.56 6E-05 2E-03 2E-04 2E-04 4E-05 2E-05 2E-04 4E-04 6E-05 2E-03 a Expanded uncertainties (k=2) U(P)=0.0008MPa, U(T)=0.02K bVapor water content is not measured and lower than the limit of detection of the TCD detector
29
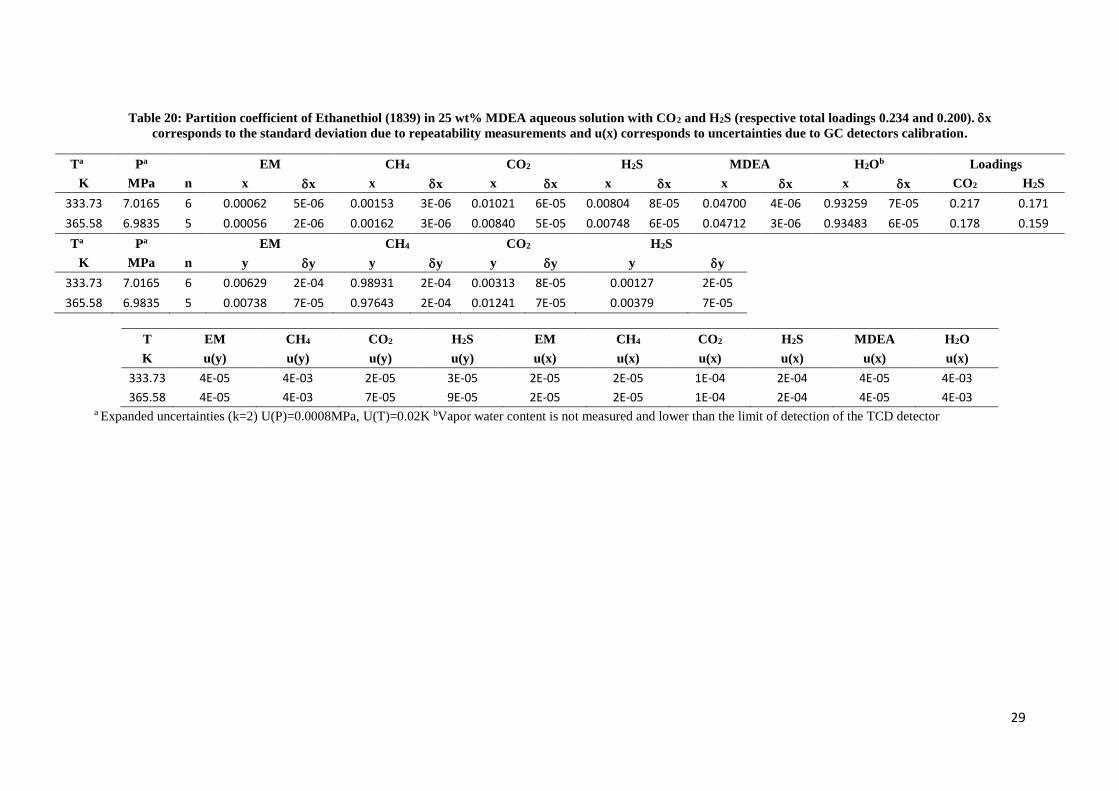
Table 20: Partition coefficient of Ethanethiol (1839) in 25 wt% MDEA aqueous solution with CO2 and H2S (respective total loadings 0.234 and 0.200). x
corresponds to the standard deviation due to repeatability measurements and u(x) corresponds to uncertainties due to GC detectors calibration.
Ta Pa EM CH4 CO2 H2S MDEA H2Ob Loadings
K MPa n x x x x x x x x x x x x CO2 H2S
333.73 7.0165 6 0.00062 5E-06 0.00153 3E-06 0.01021 6E-05 0.00804 8E-05 0.04700 4E-06 0.93259 7E-05 0.217 0.171
365.58 6.9835 5 0.00056 2E-06 0.00162 3E-06 0.00840 5E-05 0.00748 6E-05 0.04712 3E-06 0.93483 6E-05 0.178 0.159
Ta Pa EM CH4 CO2 H2S
K MPa n y y y y y y y y
333.73 7.0165 6 0.00629 2E-04 0.98931 2E-04 0.00313 8E-05 0.00127 2E-05
365.58 6.9835 5 0.00738 7E-05 0.97643 2E-04 0.01241 7E-05 0.00379 7E-05
T EM CH4 CO2 H2S EM CH4 CO2 H2S MDEA H2O
K u(y) u(y) u(y) u(y) u(x) u(x) u(x) u(x) u(x) u(x)
333.73 4E-05 4E-03 2E-05 3E-05 2E-05 2E-05 1E-04 2E-04 4E-05 4E-03
365.58 4E-05 4E-03 7E-05 9E-05 2E-05 2E-05 1E-04 2E-04 4E-05 4E-03 a Expanded uncertainties (k=2) U(P)=0.0008MPa, U(T)=0.02K bVapor water content is not measured and lower than the limit of detection of the TCD detector

30
Table 21: Partition coefficient of Ethanethiol in 25 wt% MDEA aqueous solution with CO2 and H2S (respective total loadings 0.234 and 0.413) (global concentration
of EM: 1839 ppm). x corresponds to the standard deviation due to repeatability measurements and u(x) corresponds to uncertainties due to GC detectors
calibration.
Ta Pa EM CH4 CO2 H2S MDEA H2Ob Loadings
K MPa n x x x x x x x x x x x x CO2 H2S
333.75 7.0290 6 0.00068 6E-06 0.00151 2E-06 0.00945 3E-05 0.01815 8E-05 0.04655 4E-06 0.92365 8E-05 0.203 0.390
365.58 7.0118 7 0.00056 6E-06 0.00158 4E-06 0.00730 5E-05 0.01665 2E-04 0.04673 8E-06 0.92718 2E-04 0.156 0.356
Ta Pa EM CH4 CO2 H2S
K MPa n y y y y y y y y
333.75 7.0290 5 0.00576 6E-05 0.98498 1E-04 0.00455 7E-05 0.00471 8E-05
365.58 7.0118 10 0.00795 1E-04 0.96419 3E-04 0.01604 2E-04 0.01181 2E-04
T EM CH4 CO2 H2S EM CH4 CO2 H2S MDEA H2O
K u(y) u(y) u(y) u(y) u(x) u(x) u(x) u(x) u(x) u(x)
333.75 3E-05 4E-03 2E-05 1E-04 2E-05 2E-05 1E-04 5E-04 3E-05 4E-03
365.58 5E-05 4E-03 8E-05 3E-04 2E-05 2E-05 1E-04 4E-04 5E-05 4E-03 a Expanded uncertainties (k=2) U(P)=0.0008MPa, U(T)=0.02K bVapor water content is not measured and lower than the limit of detection of the TCD detector

31
Table 22: Partition coefficient of Ethanethiol (1839 ppm) in 25 wt% MDEA aqueous solution with CO2 and H2S (respective total loadings 0.404 and 0.202). x
corresponds to the standard deviation due to repeatability measurements and u(x) corresponds to uncertainties due to GC detectors calibration.
Ta Pa EM CH4 CO2 H2S MDEA H2Ob Loadings
K MPa n x x x x x x x x x x x x CO2 H2S
333.77 6.6937 7 0.00064 7E-06 0.00152 7E-06 0.01850 7E-05 0.00839 6E-05 0.04659 5E-06 0.92436 1E-04 0.397 0.180
365.60 7.0410 8 0.00056 3E-06 0.00161 3E-06 0.01445 5E-05 0.00773 9E-05 0.04681 3E-06 0.92884 6E-05 0.309 0.165
Ta Pa EM CH4 CO2 H2S
K MPa n y y y y y y y y
333.77 6.6937 5 0.00610 6E-05 0.98297 8E-05 0.00851 5E-05 0.00243 1E-05
365.60 7.0410 5 0.00810 9E-05 0.95725 1E-04 0.02920 2E-05 0.00544 1E-04
T EM CH4 CO2 H2S EM CH4 CO2 H2S MDEA H2O
K u(y) u(y) u(y) u(y) u(x) u(x) u(x) u(x) u(x) u(x)
333.77 4E-05 4E-03 5E-05 6E-05 2E-05 2E-05 3E-04 2E-04 4E-05 4E-03
365.60 5E-05 4E-03 2E-04 1E-04 2E-05 2E-05 2E-04 2E-04 5E-05 4E-03 a Expanded uncertainties (k=2) U(P)=0.0008MPa, U(T)=0.02K bVapor water content is not measured and lower than the limit of detection of the TCD detector

32
Table 23: Methanethiol and Ethanethiol partition coefficient and apparent Henry’s Law constant in 25
wt% MDEA aqueous solution at 333 and 363 K.
Methanethiol (2438 ppm) Ethanethiol (2281 ppm)
Ptotal/MPa KMM HMM/MPa Ptotal/MPa KEM HEM/MPa
333 K
Gas stripping method 6.1 Gas stripping method 15.0
2.0033 16.31 32.7 2.1754 14.6 31.9
4.0292 9.45 38.1 4.0419 9.4 38.0
7.0543 6.08 42.9 6.9601 7.2 50.5
365 K
Gas stripping method 14.5 Gas stripping method 39.1
1.9405 28.89 56.1 2.0088 26.7 53.6
4.0580 15.40 62.4 4.0410 15.6 63.1
7.0408 9.58 67.5 7.1768 11.7 84.0
In order to characterise the dependency of the apparent Henry’s law constant to the
concentration of mercaptan, we have modified our experimental procedure. Tests were only
done with ethanethiol. We did not introduced ethanethiol directly in the vessel with the solvent.
We have injected a known quantity of ethanethiol using a GC syringe directly in the equilibrium
cell. Solvent, composed with only water and MDEA, is after introduced into the equilibrium
cell. We have measured the concentration of each phase and determined the apparent Henry’s
law constant. We have realized the measurement considering seven injections in order to have
a global concentration of ethanethiol (EM) comprise between 200 and 1199 ppm. Results are
presented on figure 5. Our results seem to confirm that apparent Henry’s law constant depends
on the global ethanethiol concentration. Moreover, we can also observe on figure 5 that we have
a lot of dispersion. This can be attributed to the fact the injection is not so accurate. These tests
have validated our choice to introduce the mercaptan directly in the MDEA solution and not
separately.

33
Figure 5: Variation of ethanethiol (EM) apparent Henry’s law constant in 25 wt% MDEA aqueous solution as a function of total pressure for various EM
concentrations. Δ: 200ppm, ×: 998 ppm, +: 398 ppm, □: 401 ppm, ♦: 2000 ppm, ●: 1199 ppm, ■: 690 ppm, ▲: gas stripping method (exponential dilutor).
0
10
20
30
40
50
60
70
80
0 1 2 3 4 5 6 7 8
Ap
par
en
t H
en
ry's
law
co
nst
ant
/MP
a
Pressure /MPa

34
2.4. Discussions
According to Table 23, we can observed that the apparent Henry’s law constant increase with
the addition of CH4 (increasing of total pressure). According to the Tables 24 to 26, we can
observed that the apparent Henry’s law constant increase with the addition of acid gases (CO2,
H2S and CO2+H2S). Also, results with pure CO2 and pure H2S are plotted on figures 6 and 7
respectively. This can be attributed by a drop out phenomenon: CO2 and H2S are better
solubilized than mercaptan due to their strongest acid base reaction. Consequently, electrolytes
are produced and lead to a salting out effect for the mercaptans and so concentration of
mercaptan decreases in the liquid phase and increases in the vapour phase. We can also
observed that this effect is more pronounced with CO2 and for ethanethiol. With CO2 we have
creation of bicarbonate (R2NHCH3HCO3) which are ions with a more important size and so have
a more important contribution to the entropy of the aqueous solution (higher activity
coefficient). Solubility of MM is higher than the solubility of EM. It is due to the fact that
ethanethiol have 2 carbon atoms (solvation effect with MM needs less molecule of water).
Figures 6 and 7 shows the variation of the apparent Henry’s law constant with acid gas loading.
Table 24: Methanethiol and ethanethiol partition coefficient and apparent Henry’s Law constant in 25
wt% MDEA aqueous solution at 333 and 363 K and around 7 MPa in the presence of CO2.
Methanethiol (2438 ppm) Ethanethiol (2281 ppm)
CO2 loading KMM HMM/MPa CO2 loading KEM HEM/MPa
333 K
0 - 49.6 0 50.5
0.187 10.07 70.5 0.155 12.93 90.6
0.481 12.09 84.5 0.309 15.52 109.2
365 K
0 - 78.5 0 84.0
0.229 14.60 102.3 0.140 17.23 120.7
0.413 15.52 108.8 0.253 19.56 136.6

35
Figure 6: Variation for Methanethiol (o) and Ethanethiol (Δ) apparent Henry’s law constant as a function
CO2 loading. Empty symbol: 333K, black symbol: 365 K. Lines: linear tendency curve.
Table 25: Methanethiol and ethanethiol partition coefficient and apparent Henry’s Law constant in 25
wt% MDEA aqueous solution at 333 and 363 K and around 7 MPa in the presence of H2S.
Methanethiol (2438 ppm) Ethanethiol (2281 ppm)
H2S loading KMM HMM/MPa H2S loading KEM HEM/MPa
333 K
0 49.6 0 - 50.5
0.206 8.74 61.2 0.132 9.98 69.7
0.368 9.03 63.1 0.320 11.08 77.4
365 K
0 78.5 0 - 84.0
0.192 11.68 82.7 0.101 13.34 93.5
0.344 13.57 94.6 0.307 15.18 106.0
20
40
60
80
100
120
140
160
0 0.1 0.2 0.3 0.4 0.5 0.6
Ap
par
ent
Hen
ry's
law
co
nst
ant
/MP
a
Exact CO2 loading

36
Figure 7: Variation for Methanethiol (o) and Ethanethiol (Δ) apparent Henry’s law constant as a function
H2S loading. Empty symbol: 333K, black symbol: 365 K. Lines: linear tendency curve.
Table 26: Methanethiol and ethanethiol partition coefficient and apparent Henry’s Law constant in 25
wt% MDEA aqueous solution at 333 and 363 K and around 7 MPa in the presence of H2S.
Methanethiol (2438 ppm) Ethanethiol (2281 ppm)
CO2 loading H2S loading KMM HMM/MPa CO2 loading H2S loading KEM HEM/MPa
333 K
0 0 - 49.6 0 0 - 50.5
0.252 0.224 8.71 60.9 0.217 0.171 10.20 71.6
0.428 0.235 7.68 53.6 0.203 0.390 8.46 59.7
0.197 0.448 7.23 50.1 0.397 0.180 9.55 63.9
365 K
0 0 - 78.5 0 0 - 84.0
0.209 0.212 12.91 89.8 0.178 0.159 13.05 91.2
0.300 0.199 13.15 92.7 0.156 0.356 14.09 98.8
0.165 0.395 11.30 75.7 0.309 0.165 14.47 101.9
From Table 26, it is possible to observe the influence of the two acid gases on apparent Henry’s
law constant. In Figure 8, we have plotted the variation of apparent Henry’s law constant of the
two mercaptans as a function of CO2 loading but for an approximate given loading of H2S equal
to 0.2 for methanethiol and 0.17-0.16 for ethanethiol. As we can observed, H2S reduces the
slope of apparent Henry’s law constant versus the CO2 loading curve. The concentration of
mercaptan in the liquid phase decreases but in parallel, as we have introduced also some H2S,
the vapor concentration decreases more strongly.
20
30
40
50
60
70
80
90
100
110
120
0 0.05 0.1 0.15 0.2 0.25 0.3 0.35 0.4
Ap
par
ent
Hen
ry's
law
co
nst
ant
/MP
a
Exact H2S loading

37
A
B
Figure 8: Variation of Methanethiol (o, A) and Ethanethiol (Δ, B) apparent Henry’s law constant as a
function CO2 loading (H2S loading is fixed). Empty symbol: 333K, black symbol: 365 K. Lines: linear
tendency curve. ×: without H2S at 333K, *: with H2S at 365 K.
The last point to be analyzed is the impact of CO2 and H2S separately on mercaptan solubility.
We have considered the ratios 𝑥𝑀𝑀
𝑥𝑀𝑀,𝑤𝑖𝑡ℎ𝑜𝑢𝑡 𝑎𝑐𝑖𝑑 𝑔𝑎𝑠⁄ and
𝑥𝐸𝑀𝑥𝐸𝑀,𝑤𝑖𝑡ℎ𝑜𝑢𝑡 𝑎𝑐𝑖𝑑 𝑔𝑎𝑠
⁄ . It is
another way to observe the drop out effects due to addition of acid gases. The ratios are equal
to one without acid gas. Figures 9 and 10 show the influence of acid gas loading (CO2 and H2S)
for ethanethiol and methanethiol ratios for each temperature respectively. We can see that with
CO2 the ratio decreases strongly. With H2S, the ratio seems to increase before decreasing.
Moreover, we can also observed that methanethiol does not behave like ethanethiol. With
methanethiol, addition of acid gas seems to increase its solubility in comparison to its solubility
in the solution without acid gas before decreasing. This effect is more pronounced with H2S.
Can we consider that with H2S, the interaction between methanethiol and the solvent is stronger
in comparison to the one between ethanethiol and the solvent (size effect, chemical reaction,
etc..)? And consequently, leading to a higher solubility? It seems that it happens also with CO2
at low temperature. We can say that it may exists a weakly reactive chemical reaction between
with methanethiol (MM) and MDEA. To conclude this study, we propose to summarize in
figure 11 the thermodynamic behaviour of mercaptan considering the apparent Henry’s law
constant as a function of total pressure (due to introduction of methane) and acid gases loading
(CO2 and/or H2S). Starting of apparent Henry’s law constant without methane and acid gas (for
example, obtained by gas stripping method), we can say that apparent Henry’s law constant
increases with pressure and addition of acid gases. It also increases if we increase the global
concentration of mercaptan.
20
30
40
50
60
70
80
90
100
110
120
0 0.1 0.2 0.3 0.4 0.5 0.6
Ap
par
ent
Hen
ry's
law
co
nst
ant
MM
/M
Pa
Exact CO2 loading
20
40
60
80
100
120
140
160
0 0.05 0.1 0.15 0.2 0.25 0.3 0.35 0.4 0.45
Ap
par
ent
Hen
ry's
law
co
nst
ant
EM /
MP
a
Exact CO2 loading

38
A
B
Figure 9: Influence of H2S (Δ) and CO2 (o) on the solubility of ethanethiol (EM) in 25wt% MDEA aqueous
solution (A: 333K, B: 365K) at pressure around 7 MPa.
A
B
Figure 10: Influence of H2S (Δ) and CO2 (o) on the solubility of methanethiol (MM) in 25wt% MDEA
aqueous solution (A: 333K, B: 365K).
0.5
0.6
0.7
0.8
0.9
1
1.1
0 0.05 0.1 0.15 0.2 0.25 0.3 0.35
xEM
/xEM
(wit
ho
ut
acid
gas
)
Acid gas loading
0.5
0.6
0.7
0.8
0.9
1
1.1
0 0.05 0.1 0.15 0.2 0.25 0.3 0.35
xEM
/xEM
(wit
ho
ut
acid
gas
)
Acid gas loading
0.5
0.6
0.7
0.8
0.9
1
1.1
1.2
1.3
0 0.1 0.2 0.3 0.4 0.5 0.6
xMM
/xM
M (w
ith
out
aci
d g
as)
Acid gas loading
0.5
0.6
0.7
0.8
0.9
1
1.1
1.2
0 0.1 0.2 0.3 0.4 0.5
xMM
/xM
M (w
ith
out
aci
d g
as)
Acid gas loading

39
Figure 11: Apparent Henry’s law constant of mercaptan as a function of global mercaptan concentration,
total pressure and acid gas loading.
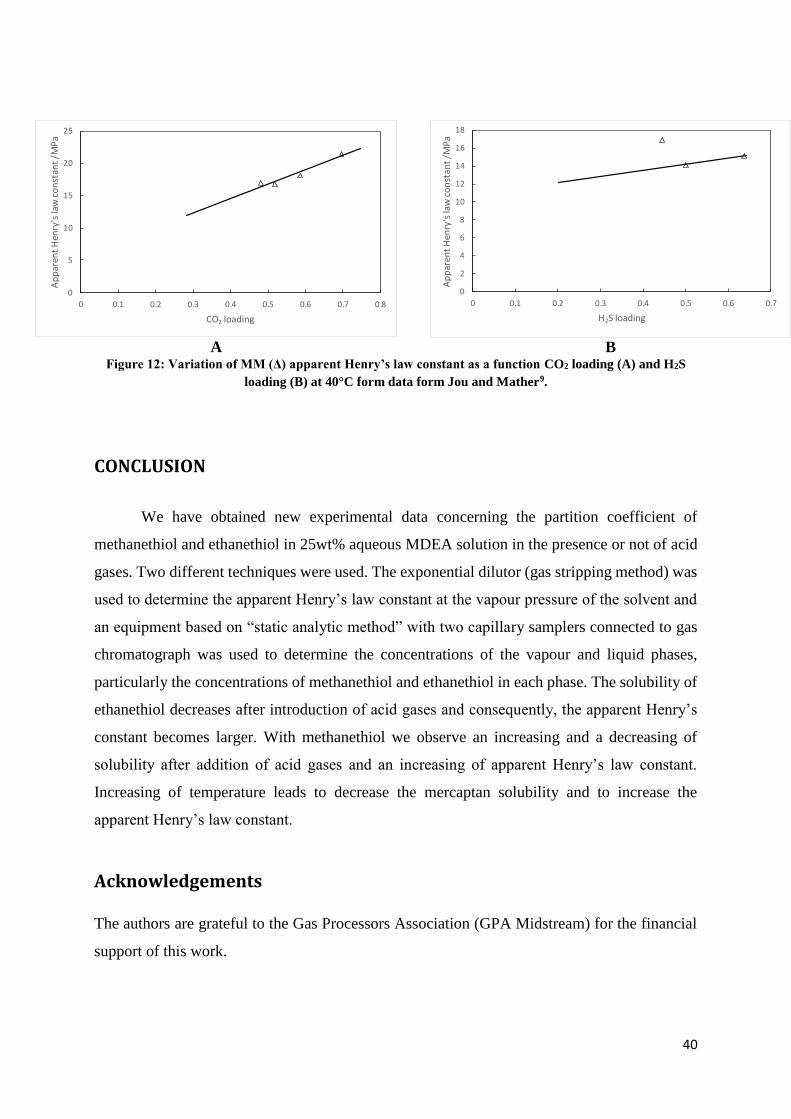
We have analysed the results obtained by Jou and Mather10 considering our method of analysis.
In figure 12, we have plotted the apparent Henry’s law constant as a function of CO2 and H2S
loadings. We remind that Jou and Mather have done their measurements at constant total
pressure 6.89 MPa. We observe the same tendency with their data like with ours. The slight
dispersion maybe due to the fact that the global methanethiol concentration is not the same for
all the measurements done by Jou and Mather. Moreover, using their data we can also show
that the apparent Henry’s law constant increase when the concentration of methanethiol
increases.
40
A
B
Figure 12: Variation of MM (Δ) apparent Henry’s law constant as a function CO2 loading (A) and H2S
loading (B) at 40°C form data form Jou and Mather9.
CONCLUSION
We have obtained new experimental data concerning the partition coefficient of
methanethiol and ethanethiol in 25wt% aqueous MDEA solution in the presence or not of acid
gases. Two different techniques were used. The exponential dilutor (gas stripping method) was
used to determine the apparent Henry’s law constant at the vapour pressure of the solvent and
an equipment based on “static analytic method” with two capillary samplers connected to gas
chromatograph was used to determine the concentrations of the vapour and liquid phases,
particularly the concentrations of methanethiol and ethanethiol in each phase. The solubility of
ethanethiol decreases after introduction of acid gases and consequently, the apparent Henry’s
constant becomes larger. With methanethiol we observe an increasing and a decreasing of
solubility after addition of acid gases and an increasing of apparent Henry’s law constant.
Increasing of temperature leads to decrease the mercaptan solubility and to increase the
apparent Henry’s law constant.
Acknowledgements
The authors are grateful to the Gas Processors Association (GPA Midstream) for the financial
support of this work.
0
5
10
15
20
25
0 0.1 0.2 0.3 0.4 0.5 0.6 0.7 0.8
Ap
par
ent
Hen
ry's
law
co
nst
ant
/MP
a
CO2 loading
0
2
4
6
8
10
12
14
16
18
0 0.1 0.2 0.3 0.4 0.5 0.6 0.7
Ap
par
ent
Hen
ry's
law
co
nst
ant
/MP
a
H2S loading

41
REFERENCES
[1] Bedell, S.A.; Miller, M., Aqueous amines as reactive solvents for mercaptan removal. Ind.
Eng. Chem. Res. 2007, 46, 3729-3733
[2] K. Osman, K.; Coquelet, C.; Ramjugernath, D. Review of carbon dioxide capture and
storage with relevance to South African power sector. South Africa J. Sc. 2014, 110, 1-12
[3] Huguet, E. ; Coq, B. ; Durand, R. ; Leroi, C. ; Cadours, R. ; Hulea, V. A highly efficient
process for transforming methylmercaptan into hydrocarbons and HS on solid acid catalysts
Applied Catalysis B. 2013, 134– 135, 344-348
[4] Awan, J. A.; Kontogeorgis, G. M.; Tsivintzelis, I.; Coquelet, C. Vapor–liquid–liquid
equilibrium measurements and modeling of ethanethiol+ methane+ water, 1-propanethiol+
methane+ water and 1-butanethiol+ methane+ water ternary systems at 303, 335, and 365 K
and pressure up to 9 MPa. Ind. Eng. Chem. Res. 2013, 52(41), 14698-14705.
[5] Pellegrini, L.A. ; Langè, S ; Moioli, S.;Picutti, B. ; Vergani,P. Influence of gas impurities
on thermodynamics of amine solutions. 1. Aromatics. Ind. Eng. Chem. Res. 2013, 52, 2018-
2024.
[6] Langè, S. ; Pellegrini, L.A. ; Moioli, S.; Picutti, B. ; Vergani, P Influence of gas impurities
on thermodynamics of amine solutions. 2. Mercaptans. Ind. Eng. Chem. Res. 2013, 52, 2025–
2031
[7] Awan, J.A.; Valtz,, A. Coquelet, C.; Richon, D. Effect of acid gases on the solubility of n-
propylmercaptan in 50wt% methyl-diethanolamine aqueous solution, Chem. Eng. Research
and. Design. 2008, 86, 600-605.
[8] Coquelet, C.; Richon, D. Measurement of Henry’s law constants and infinite dilution activity
coefficients of propyl mercaptan, butyl mercaptan and dimethyl sulfide in water and in 50 wt %
methyldiethanolamine aqueous solution using a gas stripping technique, J. Chem. Eng. Data
2005, 50, 2053-2057.
[9] Coquelet, C.; Laurens, S.; Richon, D. Measurement of Henry’s law constants and infinite
dilution activity coefficients of Propyl Mercaptan, Butyl Mercaptan and Dimethyl Sulfide in
water and in 25, 35 and 50 wt % Methyldiethanolamine aqueous solutions using a gas stripping
technique, J. Chem. Eng. Data 2008, 53, 2540-2543.
42
[10] Jou, F. Y.; Mather, A. E.; Ng, H. J. Effect of CO2 and H2S on the Solubility of Methanethiol
in an Aqueous Methyldiethanolamine Solution. Fluid Phase Equilib. 1999, 158, 933-938.
[11] Zin, R.M.; Coquelet, C.; Valtz, A.; Mutalib, M.I.A.; Sabil, K.M. Measurement of Henry’s
Law Constant and Infinite Dilution Activity Coefficient of Isopropyl Mercaptan and Isobutyl
Mercaptan in Methyldiethanolamine (1)+ Water (2) with w 1= 0.25 and 0.50 at temperature of
298 to 348K using Inert Gas Stripping Method. J. Chem. Therm. 2016, 93, 193-199
[12] Hajiw, M.; Valtz, A.; El-Ahmar, E.; Coquelet, C. How measurement of limiting activity
coefficient can help for the selection of solvents for oxygenated compounds extraction. J. Env.
Chem. Eng. 2017, 5, 1205-1209.
[13] Kim, I., Svendsen, H.F., Borresen, E. Ebulliometric determination of vapour-liquid
Equilibria for pure water, monoethanolamine, N-methyldiethanolamine, 3-(methylamino)-
propylamine, and their binary and ternary solutions. J. Chem. Eng. Data 2008, 53, 2521-2531.
[14] Dicko, M.; Coquelet, C.; Jarne, C.; Northrop, S.; Richon, D. Acid Gases Partial Pressures
above a 50 wt% aqueous Methyldiethanolamine Solution. Experimental work and modeling,
Fluid Phase Equilib. 2010, 289, 99-109
[15] E Skylogianni, E.; Mundal, I.; Pinto, D.; Coquelet, C.; Knuutila, H.K. Hydrogen sulfide
solubility in 50 wt% and 70 wt% aqueous methyldiethanolamine at temperatures from 283 to
393 K and total pressures from 500 to 10000 kPa. Fluid Phase Equilib. 2020, 112498
[16] Lemmon, E.; Bell, I. H.; Huber, M.; McLinden, M., NIST Standard Reference Database
23: Reference Fluid Thermodynamic and Transport Properties-REFPROP, Version 10.0,
National Institute of Standards and Technology. 2018. URL http://www.nist. gov/srd/nist23.
cfm.
[17] Zin, R.M.; Coquelet, C.; Valtz, A.; Mutalib, M.I.A.; Sabil, K.M. A New Thermodynamic
Correlation for Apparent Henry's Law Constants, Infinite Dilution Activity Coefficient and
Solubility of Mercaptans in Pure Water. J. Natural Gas Eng. 2017, 2, 148-170
[18] Gas Processors Suppliers Association, GPSA, 2018, Engineering Data Book, 14th Edition,
Tulsa, OK.
[19] Chapoy, A.; Coquelet, C.; Richon, D. Solubility measurement and modeling of water in
the gas phase of the methane/water binary system at temperatures from 283.08 to 318.12 K and
pressures up to 34.5 MPa. Fluid Phase Equilib. 2003, 214, 101-117.
[20] Chapoy, A.; Coquelet, C.;Richon, D. Corrigendum to “Revised solubility data and
modeling of water in the gas phase of the methane/water binary system at temperatures from
283.08 to 318.12 K and pressures up to 34.5 MPa”. Fluid Phase Equilib. 2005, 230, 210-214.
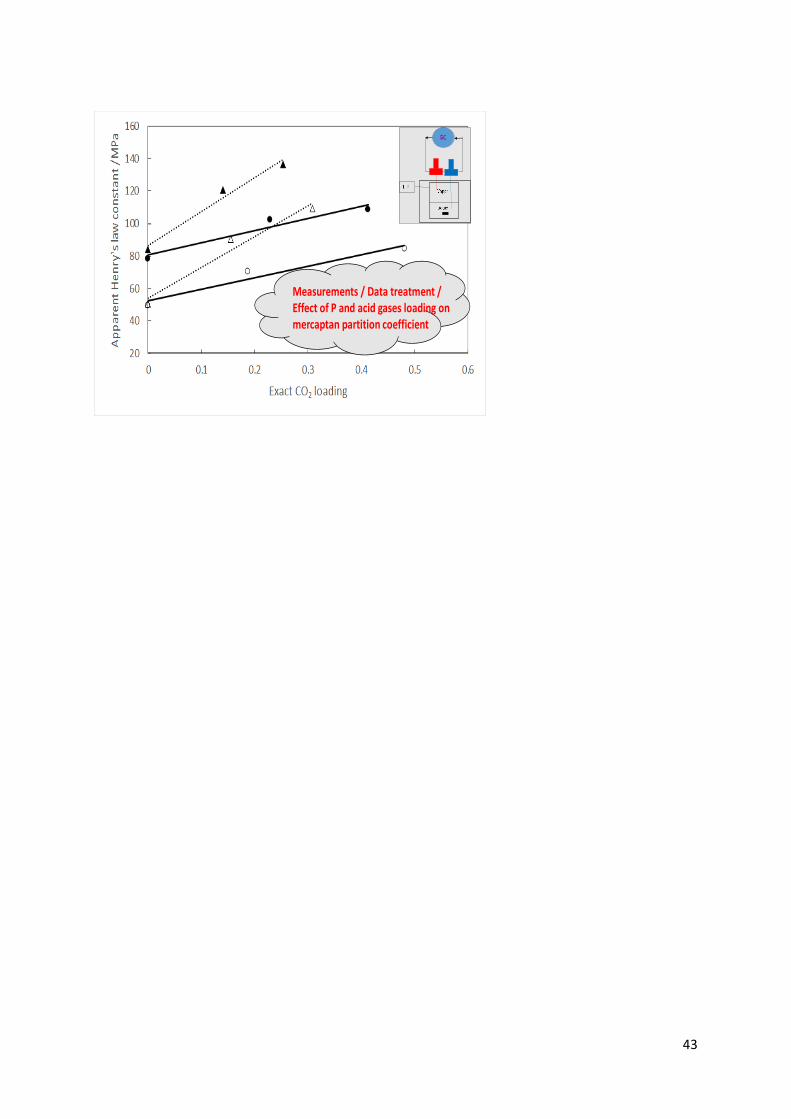
TOC Graphic
43
Measurements / Data treatment / Effect of P and acid gases loading on mercaptan partition coefficient