Embed Size (px)
Citation preview

S.V. RajGlenn Research Center, Cleveland, Ohio
Jacob A. KerrPennsylvania State University, State College, Pennsylvania
Effect of Microstructural Parameters on the Relative Densities of Metal Foams
NASA/TM—2010-216797
December 2010
https://ntrs.nasa.gov/search.jsp?R=20110000504 2020-05-22T05:21:28+00:00Z

NASA STI Program . . . in Profi le
Since its founding, NASA has been dedicated to the advancement of aeronautics and space science. The NASA Scientifi c and Technical Information (STI) program plays a key part in helping NASA maintain this important role.
The NASA STI Program operates under the auspices of the Agency Chief Information Offi cer. It collects, organizes, provides for archiving, and disseminates NASA’s STI. The NASA STI program provides access to the NASA Aeronautics and Space Database and its public interface, the NASA Technical Reports Server, thus providing one of the largest collections of aeronautical and space science STI in the world. Results are published in both non-NASA channels and by NASA in the NASA STI Report Series, which includes the following report types: • TECHNICAL PUBLICATION. Reports of
completed research or a major signifi cant phase of research that present the results of NASA programs and include extensive data or theoretical analysis. Includes compilations of signifi cant scientifi c and technical data and information deemed to be of continuing reference value. NASA counterpart of peer-reviewed formal professional papers but has less stringent limitations on manuscript length and extent of graphic presentations.
• TECHNICAL MEMORANDUM. Scientifi c
and technical fi ndings that are preliminary or of specialized interest, e.g., quick release reports, working papers, and bibliographies that contain minimal annotation. Does not contain extensive analysis.
• CONTRACTOR REPORT. Scientifi c and
technical fi ndings by NASA-sponsored contractors and grantees.
• CONFERENCE PUBLICATION. Collected papers from scientifi c and technical conferences, symposia, seminars, or other meetings sponsored or cosponsored by NASA.
• SPECIAL PUBLICATION. Scientifi c,
technical, or historical information from NASA programs, projects, and missions, often concerned with subjects having substantial public interest.
• TECHNICAL TRANSLATION. English-
language translations of foreign scientifi c and technical material pertinent to NASA’s mission.
Specialized services also include creating custom thesauri, building customized databases, organizing and publishing research results.
For more information about the NASA STI program, see the following:
• Access the NASA STI program home page at http://www.sti.nasa.gov
• E-mail your question via the Internet to help@
sti.nasa.gov • Fax your question to the NASA STI Help Desk
at 443–757–5803 • Telephone the NASA STI Help Desk at 443–757–5802 • Write to:
NASA Center for AeroSpace Information (CASI) 7115 Standard Drive Hanover, MD 21076–1320

S.V. RajGlenn Research Center, Cleveland, Ohio
Jacob A. KerrPennsylvania State University, State College, Pennsylvania
Effect of Microstructural Parameters on the Relative Densities of Metal Foams
NASA/TM—2010-216797
December 2010
National Aeronautics andSpace Administration
Glenn Research CenterCleveland, Ohio 44135

Acknowledgments
This investigation, which was completed as part of Mr. Kerr’s summer internship research, was supported by NASA’s Subsonic Fixed Wing Program. Mr. Jacob Kerr thanks NASA’s Undergraduate Student Research Program (USRP) for funding his summer internship at the Glenn Research Center.
Available from
NASA Center for Aerospace Information7115 Standard DriveHanover, MD 21076–1320
National Technical Information Service5301 Shawnee Road
Alexandria, VA 22312
Available electronically at http://gltrs.grc.nasa.gov
Trade names and trademarks are used in this report for identifi cation only. Their usage does not constitute an offi cial endorsement, either expressed or implied, by the National Aeronautics and
Space Administration.
This work was sponsored by the Fundamental Aeronautics Program at the NASA Glenn Research Center.
Level of Review: This material has been technically reviewed by technical management.

NASA/TM—2010-216797 1
Effect of Microstructural Parameters on the Relative Densities of Metal Foams
S.V. Raj
National Aeronautics and Space Administration Glenn Research Center Cleveland, Ohio 44135
Jacob A. Kerr
Pennsylvania State University State College, Pennsylvania 16801
Abstract A detailed quantitative microstructural analyses of primarily open cell FeCrAlY and 314 stainless
steel metal foams with different relative densities and pores per inch (p.p.i.) were undertaken in the present investigation to determine the effect of microstructural parameters on the relative densities of metal foams. Several elements of the microstructure, such as major and minor cell sizes, cell areas and perimeters, ligament dimensions, cell shapes and area fractions of closed and open cells, were measured. The cross-sections of the foam ligaments showed a large number of pores, and their circularity factors and average sizes were determined. The area fractions of the open cells and ligaments decreased while that of the closed cells increased linearly with increasing relative density. The relative densities and p.p.i. were not significantly dependent on cell size, cell perimeter and ligament dimensions within the limits of experimental scatter. A phenomenological model is proposed to rationalize the present microstructural observations.
1.0 Introduction Aircraft noise is a major environmental concern especially during takeoff and landing (Ref. 1).
Compared to the 1960’s, commercial airplanes are significantly quieter today due to several improvements in design and materials technology (Refs. 2 and 3). Nevertheless, further reductions in these noise levels are desirable. Thus, the National Aeronautics and Space Administration (NASA) has identified an ambitious goal of further reducing aircraft noise by -52 dB relative to the International Civil Aviation Organization (ICAO) Chapter 4 certification standards by the year 2020 under its Subsonic Fixed Wing (SFW) project (Ref. 4). It is expected that these noise reduction goals will be achieved through a combination of design changes and the development of suitable materials (Refs. 3 and 4).
Open cell foams and other cellular materials have been successfully used for sound absorption in many non-aerospace applications (Refs. 5 and 6). More recently, metal foams have been proposed for use in jet engines as acoustic treatment over rotors (Ref. 7), fan blades (Ref. 8) and other applications (Ref. 9). The flow resistance (Refs. 10 and 11) and sound absorption property (Refs. 12, 13, 14, and 15) studies on metal foams have established their effectiveness as sound absorbers especially at higher frequencies typically above 500 Hz (Ref. 12). Unlike materials that reflect acoustic waves to isolate noise, foams and other cellular materials absorb sound energy. Although the physics of sound absorption in porous materials is fairly complex (Ref. 5), it is generally agreed that sound energy is primarily dissipated within the porous microstructure through viscous and thermal losses (Refs. 12 and 13).
The properties of foams, including sound absorption, are dependent on their relative density, ρ*/ρs, where ρ* and ρs are the densities of the foam and the solid material, respectively, and microstructure (Refs. 5, 11, 13, 14, and 16). Although the wavelengths of the sound waves are much larger than the cell dimensions (Ref. 6), it is expected that the dimensions of the cells and their three-dimensional connectivity are likely to influence their sound absorption properties as energy is transferred to pumping the air columns

NASA/TM—2010-216797 2
within the cells (Fig. 1). Simple formulae exist for correlating the foam relative densities and their microstructures with static flow resistance and sound attenuation (Refs. 5, 10, 11, 12, 13, and 14). Other factors, such as the relative area fractions of closed and open cells, are likely to influence the acoustic properties (Ref. 12).
A qualitative and quantitative understanding of the role of the foam microstructure on the acoustic and mechanical properties of metal foams is important if they are to be used as acoustic liners in aircraft engines. Particularly, establishing the three-dimensional topology of the microstructures of open cell foams is important effectively to model fluid flow through them and to understand their mechanical properties. Identification of other microstructural features that affect sound absorption and mechanical properties is also important for several reasons. First, microstructural data are required to develop realistic physics-based design models to simulate the behavior of these foam acoustic liners under engine operating conditions. Second, the data are likely to be useful to foam manufacturers to enable them to optimize processing and manufacturing parameters in a cost effective manner. Third, foam manufacturers can use these microstructural data to ensure batch-to-batch reproducibility and maintain quality control. Fourth, the aircraft engine manufacturer can use the microstructural information for formulating materials design specifications.
However, due to difficulties in controlling process variables, the microstructures of the foams and their properties can vary by large amounts. Although commercially manufactured foams are specified by pores per inch (p.p.i.) and their relative densities, it is noted that the reported values of p.p.i. are not necessarily identical from one manufacturer to another (Ref. 17). For example, some vendors specify the p.p.i. of their products with that of the precursor polyurethane foam rather than the finished product without accounting for metal shrinkage during the manufacturing process. It should be noted that the reticulated polymer foam precursors used in the manufacture of the metal foams have a large variation in p.p.i. and relative densities (Refs. 18 and 19).
Figure 1.—Schematic showing alternating layers of an open cell cellular material. The energy of sound waves of
frequency, f, and wavelength, λ, is expended as air within the cells is pumped in and out along the y and z axes. The major, dL, and minor, dT, dimensions are much smaller than λ.

NASA/TM—2010-216797 3
Among the several possible idealized topological representations of the foam microstructures (Ref. 5), the three-dimensional, space-filling Kelvin tetrakaidecahedron (Refs. 5, 20, and 21) is often favored for modeling the foam cellular network. This cell has 14 faces consisting of 6 squares and 8 hexagonal faces. In other words, about 43 percent of the faces are squares, 0 percent faces are pentagonal and 57 percent of the faces are hexagonal. It is worth noting that other topological models have been proposed, where pentagonal faces are incorporated in the cell geometry (Refs. 22 and 23). In reality, foam cells deviate from these ideal conditions, where they may be distorted and their sizes and shapes non-uniform. Importantly, experimental observations do not agree with these theoretical models (Refs. 24, 25, 26, 27, and 28).
The overall objectives of this investigation were to characterize the microstructures of FeCrAlY and stainless steel foams with two specific goals. First, to establish the probable cell topology of the foams from the geometries of the cell faces in order to determine the validity of the Kelvin and other theoretical models (Refs. 20, 22, and 23). These results are reported elsewhere, where it was shown that the cells in these foams possess 11 faces consisting of 3 quadrilateral, 6 pentagonal and 2 hexagonal faces (i.e., 3-6-2 cell) (Ref. 28). It was demonstrated that the experimental observations did not agree with the Kelvin and other theoretical models. Second, to determine the effects of ρ*/ρs and lineal cell density, denoted as cells per mm (c.p.mm.), on: (a) area fractions of closed and open cells faces; (b) major, dL and minor, dT, sizes of cell faces; and (c) ligament lengths, l, and thicknesses, t. This paper reports the quantitative microstructural observations on several metal foams.
2.0 Experimental Procedures The foam panels were procured from PORVAIR Fuel Cells Technology, Inc., Hendersonville, North
Carolina. The foam panels were manufactured from precursor polyurethane foams dipped in metal powder slurries. The excess slurry was squeezed out of the slurry-filled polyurethane foams before being burnt off during the subsequent sintering process leaving behind the metal foam panels. Measurements were conducted on FeCrAlY and 314 stainless steel foam panels with the nominal c.p.mm. varying between 0.2 (5 p.p.i.1) and 4.7 (120 p.p.i.), and the nominal (i.e., the manufacturer supplied values) (ρ*/ρS)nominal varying between 3 and 15 percent. The dimensions of the panels were approximately 210 x 210 mm with the thicknesses varying between 3.2 and 25.4 mm.
Square specimens ~ 25.4 x 25.4 mm in cross-sectional dimensions or 50 mm in diameter were wire electro-discharge machined from these panels for metallographic analyses (Fig. 2(a)). The magnitudes of (ρ*/ρS)actual were determined by measuring the geometric and immersion densities of the foam cubes approximately 25.4 mm long and 25.4 mm wide with thicknesses equal to that of the foam panel. The immersion density measurements were conducted using n-propanol. Although the relative density and other measurements were primarily conducted on FeCrAlY and 314 stainless steel foams, a few measurements were also made on Haynes 25 foams. Optical and scanning electron microscopes (SEM) were used for qualitative characterization of the foam microstructures. In-situ quantitative metallographic measurements were conducted on 6 to 7 randomly selected areas for each foam specimen at a magnification of 100x using a Keyence2 digital optical microscope (VHX-100K Series) equipped with a lens with a long depth of focus and with the ability to vary the magnification from 100x to 5000x (Fig. 2(a)). The microscope was equipped with a x-y stage and imaging and data acquisition software to enable in-situ quantitative measurements to be performed. The effective spatial resolution of the microscope was 1.9 (horizontal) x 1.9 (vertical) µm/pixel at a magnification of 100x (Ref. 29). The microscope was calibrated using a precision scale prior to each set of measurements to a measurement accuracy of 0.01 mm. The complex nature of the three-dimensional microstructures consisting of randomly stacked interconnected cells made it difficult to characterize these foams. As a result, a large number of faces were measured to ensure representative measurements and to minimize experimental errors.
1 The nominal p.p.i. values refer to those reported by the manufacturer based on the precursor foam. 2 Keyence is the trade mark of Keyence Corporation of America, Woodcliff Lake, New Jersey.

NASA/TM—2010-216797 4
Figure 2.—(a) Schematic showing the locations of the three foam specimens on the 210 x 210 mm panels, and the areas of microstructural observations on each foam specimen. (b) Micrograph with a 300 x 300 µm grid pattern overlay used for point counting. The test lines were used for measuring c.p.mm. (c) Micrograph showing tracings of the perimeters, the major, dL, and minor, dT, diameters of the cell faces. The numbers correspond to the measured cell face. (d) Schematic showing the dimensions, l and t, of the ligaments.

NASA/TM—2010-216797 5
Figure 2.—Concluded.
The area fractions of closed and open cell faces, as well as those of the ligaments, were measured by the point counting method, where the point fraction, PP, is equal to the area fraction, Af, of the measured microstructural feature (Ref. 30). Measurements of PP were conducted by electronically overlaying a rectangular grid with 9 rows and 11 columns on each field of view (Fig. 2(b)). The grid size was 300 x 300 µm. The number of measurements varied between 968 and 1056. The number of counts along each horizontal line also gives the number of cells per unit length. The perimeters of the cell faces were determined by tracing the contours of each face3 (Fig. 2(c)). The imaging software calculated the corresponding areas of the cell faces. The equivalent diameters of the cell faces were determined from the perimeter data assuming that they could be represented as circles. The number of cell faces measured varied between 220 and 320 depending on the foam panel. The magnitudes of dL and dT were also directly measured on the same cell faces for which the perimeters were determined (Fig. 2(c)). The number of direct measurements of the cell sizes varied between 440 and 636.
Measurement of ligament lengths and thicknesses posed a special challenge because the triple points were not always well defined. Additionally, the ligament thickness was not always uniform. As far as possible, the ligament lengths were measured from the center of one triple point to the center of the other, and the ligament thicknesses were measured in the middle section of the ligaments (Fig. 2(d)). The total number of measurements varied between 315 and 790 depending on the foam panel. The perimeters of the porosity in the ligaments were traced as described above on different sets of specimens, and the corresponding pore areas were evaluated by the microscope’s imaging software. The total number of measurements varied between 75 and 385 counts. The error bars reported in this paper represent the 95 percent confidence limit.
3 Only the perimeters and diameters of the open faces were measured since it was not possible to clearly distinguish the boundaries between two adjacent closed faces.
l
(d)
ligament
Cell faces
t

NASA/TM—2010-216797 6
3.0 Results 3.1 Comparison of the Nominal and Measured Parameters
Figure 3(a) compares the measured relative densities, (ρ*/ρS)actual, of several metal foams with the nominal values, (ρ*/ρS)nominal, provided by the manufacturer; the broken line has a slope of unity. It is evident that the measured and the nominal values are scattered evenly about this line thereby indicating a reasonable agreement between these quantities for all p.p.i. In contrast, the measured and nominal lineal cell densities show no significant correlation with the data scattered about an average measured value of 2.8 c.p.mm. (70 p.p.i.) (Fig. 3(b)).4 This observation is consistent with other reported results in the literature (Ref. 17). The lack of any correlation observed in Figure 3(b) and the constant measured value of 2.8 c.p.mm. (70 p.p.i.) is suggestive of the fact that the metal powder slurry will shrink at about the same rate under similar processing conditions irrespective of p.p.i. of the polyurethane foam precursors. Thus, (ρ*/ρS)actual is the only relevant variable to be considered for these foams; therefore, the nominal c.p.mm. values will be only used as identification parameters in this paper.
Figure 3.—Plots of measured and nominal parameters for FeCrAlY, Haynes 25 and 314 stainless steel foams: (a) Relative density; (b) lineal cell density.
4The equivalent p.p.i. are shown in Figure 3(b) in a tabular form for easy reference.

NASA/TM—2010-216797 7
3.2 Microstructures of the Foams
Figures 4 (a) to (c) show optical macrographs of FeCrAlY foams with (ρ*/ρS)actual varying between 3.3 and 8.6 percent and nominal lineal cell densities varying between 0.2 and 4.7 c.p.mm. Figures 4(d) to (e) show SEM micrographs for FeCrAlY foams with (ρ*/ρS)actual = 9.3 and 10.1 percent and nominal lineal cell densities of 3.9 and 3.1 c.p.mm., respectively. A close observation of these microstructures reveals that the number of closed faces of the cells qualitatively increases with increasing (ρ*/ρS)actual and c.p.mm. A cross-section of the foams showed that there was significant porosity in the ligaments (Fig. 4(f)).
Figure 4.—(a) to (c) Optical and (d) to (e) SEM microstructures of FeCrAlY foams; (f) optical microstructure
of a ligament cross-section showing voids. (a) 0.2 c.p.mm.; (ρ*/ρS)actual = 3.3 percent; (b) 2.4 c.p.mm.; (ρ*/ρS)actual = 4.1 percent; (c) 4.7 c.p.mm.; (ρ*/ρS)actual = 8.6 percent; (d) 3.1 c.p.mm.; (ρ*/ρS)actual = 10.1 percent; (e) 3.9 c.p.mm.; (ρ*/ρS)actual = 9.3 percent; (f) 1.6 c.p.mm.; (ρ*/ρS)actual = 5.3 percent.

NASA/TM—2010-216797 8
3.3 Area Fraction Measurements
Figures 5(a) to (c)5 show the variation of (ρ*/ρS)actual with increasing values of the area fractions of closed, (Af)closed faces, and open, (Af)open faces, faces, and ligaments, (Af)ligaments, respectively, where the slopes represent linear regression values. The data are scattered about the regression lines with relatively low values of coefficients of determination, Rd
2, which were 0.448, 0.512 and 0.408 for Figures 5(a), (b) and (c), respectively. Despite this fact, some general trends are discernable in the data. First, the relative density increases with increasing area fraction of closed faces (Fig. 5(a)). Second, the relative density decreases with increasing area fractions of open faces (Fig. 5(b)) and ligaments (Fig. 5(c)). Third, the area fraction of closed faces decreases linearly with increasing area fraction of open cell faces (Fig. 5(d)). In the latter case, the regression line is represented by
(Af)closed faces = –2.0 (Af)open faces + 1.2 (Rd2 = 0.719) (1)
Figure 5.—(a) to (c) Variations of the measured values of relative densities of FeCrAlY and 314 stainless steel foams
with the area fractions of (a) closed faces, (b) open faces, and (c) ligaments. (d) Inverse linear relationship between the area fractions of closed and open faces. The broken lines represent the regressed values.
5 All error values reported in the text and the figures in this paper represent 95 percent confidence values.

NASA/TM—2010-216797 9
3.4 Cell Face Diameters
Figures 6(a) to (d) shows the frequency histograms of dL for several FeCrAlY foams for different values of (ρ*/ρS)actual varying between 5.0 and 16.5 percent. The corresponding average face dimensions varied between 204.5 ± 4.5 µm and 222.6 ± 5.2 µm. Clearly, the values of dL do not vary significantly for foams of different relative densities. Figure 7(a) confirms that (ρ*/ρS)actual is independent of dL and dT for both the FeCrAlY and the stainless steel foams. The vertical broken lines represent the average measured values, (dL)average
6 = 212.4 ± 6.4 µm and (dT)average = 156.4 ± 4.5 µm, of the face major and minor dimensions, respectively. Similarly, the nominal lineal cell densities (Fig. 7(b)) and (Af)open faces (Fig. 7(c)) are independent of the cell face dimensions, where most of the data are scattered about the vertical mean lines.
Figure 6.—Frequency histograms of dL for FeCrAlY foams with nominal lineal cell density of 3.1 c.p.mm. and actual
relative densities of (a) 5.0 percent; (b) 6.5 percent; (c) 10.1 percent; and (d) 16.5 percent.
6 The two outlier data for FeCrAlY were not considered in this evaluation.

NASA/TM—2010-216797 10
Figure 7.—Variations of (a) (ρ*/ρS)actual, (b) nominal lineal cell density and (c) (Af)open faces with dL and dT. The
vertical broken lines represent the average measured values of the major and minor face dimensions.
3.5 Cell Face Perimeter and Area
Figure 8(a) shows the variation of the relative density as a function of the measured perimeters of the cell faces for the FeCrAlY and stainless steel foams with different values of nominal lineal cell densities. The vertical broken line represents an average value of 624 ± 12.9 µm of the data with the exception of the two outlier data points for the FeCrAlY foam with a nominal lineal cell density of 2.4 c.p.mm. Similar to the observations shown in Figure 7 (a), the relative densities are independent of the perimeters of the cell faces of the foams. Figures 8(b) and (c) show the variation of relative densities with the corresponding areas evaluated by the imaging software and the equivalent diameters, (deq)perimeter, calculated from the perimeter data, respectively. It is worth noting that the average value of (deq)perimeter
7 = 198.5 µm is between (dL)average and (dT)average, thereby suggesting that the two independent sets of experimental measurements shown in Figures 7 and 8 are consistent within the errors in measurement.
7 As before, the two outlier data points for the FeCrAlY foams were not considered in the evaluation of the average value (deq)perimeter.

NASA/TM—2010-216797 11
Figure 8.—Variations of (ρ*/ρS)actual with (a) cell face perimeters, (b) cell face areas and (c) equivalent cell face diameters derived from the perimeter values. The vertical broken lines show the average values.
3.6 Ligament Dimensions and Microstructures
The measured relative densities of the foams are independent of the ligament length (Fig. 9(a)) and ligament thickness (Fig. 9(b)). The data are vertically scattered along average values of laverage =133.9 ± 2.9 µm and taverage = 41.1 ± 1.2 µm represented by the broken vertical lines in the figures. Thus, the relative densities of these foams are independent of the ligament dimensions. Figure 9(c) shows the variation of (ρ*/ρS)actual with the ratio t/l. The figure also shows the predicted variation of ρ*/ρS with t/l based on the Gibson-Ashby equation (Ref. 6)
ρ*/ρS = C (t/l)q (2)
where C is a constant depending on the cell shape, and q = 1 or 2 for closed and open cells, respectively. Specifically, the predicted curve shown in Figure 9(c) is for open cells (i.e., q = 2) with C = 1 (Ref. 6). Although there is an apparent dependence of (ρ*/ρS)actual on t/l with C = 1 and q = 2 in Equation (1), a careful examination of the results reveals that most of the data are clustered in the range 0.25 ≤ t/l ≤ 0.30, thereby being consistent with the lack of significant correlations between ρ*/ρS and ligament dimensions observed in Figures 9(a) and (b). Thus, the apparent agreement of the empirical models with the experimental data must be considered fortuitous for the current data consistent with the observations shown in Figures 9(a) and (b).

NASA/TM—2010-216797 12
Figure 9.—Variations of (ρ*/ρS)actual with (a) ligament length, (b) ligament thickness and (c) ratio t/l. The predicted values are based on Equation (2) given in Reference 6.
The cross-sectional microstructures of the ligaments revealed significant porosity (Figs. 4(e)). The ligament thicknesses were non-uniform and showed frequent necking in several regions. Figures 10(a) to (c) show the distributions of the areas of the ligament cavities for several FeCrAlY foams.8 The average values of the areas of the pores varied between 293.6 ± 1.4 and 831.3 ± 1.6 µm2.
The circularity factor (C.F.) of the ligament pores was evaluated from Equation (3), where C.F. = 1 for a circular pore (Ref. 17).
= 2perimeter
area4πC.F. (3)
Figure 10(d) shows the frequency and cumulative distributions of C.F. for a FeCrAlY foam with (ρ*/ρS)actual = 5.3 percent. The frequency histogram exhibits a log normal distribution. Similar log normal distributions were observed for the other foams. The average values of C.F. varied between 0.5 and 0.7, which are consistent with the fact that the pores were non-circular.
8 As noted earlier, these measurements were conducted on different set of specimens than those evaluated for the other quantitative metallographic measurements.

NASA/TM—2010-216797 13
Figure 10.—Frequency histograms and cumulative frequencies showing the distribution of cross-sectional areas
of porosity within the ligaments for FeCrAlY foams (a) (ρ*/ρS)actual = 2.3 percent; 1.6 c.p.mm.; (b) (ρ*/ρS)actual = 4.7 percent; 2.4 c.p.mm.; (c) (ρ*/ρS)actual = 3.9 percent; 3.1 c.p.mm. (d) Distribution of the circularity factor for a FeCrAlY foam with (ρ*/ρS)actual = 2.3 percent; 1.6 c.p.mm.
The area fraction of the porosity in the ligaments, Afp, was determined from the ratio of the average area of the ligament pores to the average cross-sectional area of the ligaments.9 Figure 11 shows that Afp decreases with increasing (ρ*/ρS)actual through a power-law relationship given by
(ρ*/ρS) = 2.9(Afp)–0.2 (Rd2 = 0.862) (4)
where (ρ*/ρS)actual is expressed in percentage.
9 It is noted that Afp represents the fraction of the ligament cross-section occupied by porosity and it should not be confused with the area fraction of ligament porosity within the foam cell volume.

NASA/TM—2010-216797 14
Figure 11.—Correlation between the measured relative density and the
area fraction of ligament porosity.
4.0 Discussion The observations reported in this paper reveal several important characteristics about the
microstructures of these metal foams:
a) The measured and nominal relative densities of the foams are in very good agreement within the limits of experimental scatter, whereas there is no correlation between the measured and the nominal lineal cell densities (Fig. 3). All the foams had an average measure lineal cell density of 2.8 c.p.mm. (70 p.p.i.).
b) The (ρ*/ρS)actual increases with increasing area fraction of closed faces and decreases with increasing area fractions of open faces and ligaments (Fig. 5). Importantly, (Af)closed faces and (Af)open faces are inversely related through Equation (1).
c) The measured relative densities are independent of several microstructural parameters, such as cell diameters, perimeters and areas, and ligament length and thicknesses.
d) A large amount of porosity was observed in the ligaments with the pore distribution being log normal and the pore geometry being predominantly non-circular.
Empirical relationships have been proposed relating cell size, d, with ligament thickness (or
diameter), lineal cell density and relative density for PORVAIR foams (Refs. 16 and 31):10
( )
=
0.7p.p.i.
0.1sρ*ρ
1.4t (5)
( )
−=
−0004.0
ρ*ρ s
1
100sρ*ρ
td e (6)
10 It is noted that the original reference source is an internal report (Ref. 31).

NASA/TM—2010-216797 15
Similarly, Zhao et al. (Ref. 10) have also proposed that t ∝ d using a different relationship. An examination of Figure 9 reveals that there is no correlation between ligament thickness and relative density and lineal cell density. Therefore, the present data do not support the validity of Equation (5). Similarly, Figures 7 and 8 reveal that the cell diameter does not change with either relative density or nominal lineal cell density thereby revealing that Equation (6) is inconsistent with the present observations. Importantly, Figure 3(b) shows that the measured lineal cell density is about 2.8 c.p.mm. independent of the different p.p.i. for the metal foams studied in this investigation.
Gibson and Ashby (Ref. 6) proposed a simple relationship between relative density and ligament dimensions given by Equation (2). Figure 12(a) schematically illustrates that Gibson-Ashby model would require the mass of the metal to be spread primarily in the ligaments, thereby increasing ligament thickness and decreasing cell size with increasing relative density for constant c.p.mm. and constant area conditions. However, Figures 9(a) and (b) reveal that (ρ*/ρS)actual is independent of t and l so that this model does not explain the present observations.
Figure 12(b) proposes an alternate phenomenological model, where the relative density increases with increasing area fraction of closed faces as observed in Figure 5(a). There is a corresponding decrease in the area fractions of open cell faces and ligaments. This model does not require the relative density to vary with cell size, cell perimeter, ligament dimensions and other microstructural parameters. Assuming the mass is entirely distributed in the ligaments, triple points and the closed faces of the cell, the relative density can be expressed as
(ρ*/ρS) = B(1 – (Af)open faces)p (7)
where B and p are dimensionless constants. The constant B is expected to be dependent on the geometry of the foam cell. Figure 13 shows the double logarithmic plot of the measured relative density against (1–(Af))open faces. As evident from Figure 13, there is some scatter in the data about the regression line. A linear regression analysis of the data revealed that B = 41.5 and p = 3.0 with Rd
2 = 0.408.
Figure 12.—Schematic foam microstructures showing that the relative density can be increased by either (a) increasing ligament thickness in accordance to the Gibson-Ashby model (Ref. 6) or (b) increasing the area fraction of closed faces without increasing ligament thickness. An increase in the ligament thickness in (a) will lead to a corresponding decrease in cell size so that dL > dL1 > dL2.

NASA/TM—2010-216797 16
Figure 13.—Double logarithmic plot of (ρ*/ρS)actual against (1 – (Af))open faces for both FeCrAlY and stainless steel foams.
It should be noted that Equation (7) implicitly assume that the ligaments do not have any porosity. In
reality, the PORVAIR foams show extensive porosity in the ligaments (Fig. 10). Therefore, Equation (7) overestimates the relative density of the foams. Thus, these equations must be suitably corrected for the area fraction of ligament porosity, Afp. Since Afp were determined on foams different than those on which the other microstructural were made, this correction could not be incorporated.
5.0 Summary and Conclusions Quantitative metallographic data were obtained on primarily open cell FeCrAlY and 314 stainless
steel foams with nominal relative densities varying between 3 and 15 percent, and nominal lineal cell densities varying between 0.2 and 4.7 c.p.mm. The present observations reveal that while the measured and nominal values of relative densities are in good agreement, there is no correlation between the measured and nominal lineal cell densities. Instead, the measured lineal cell densities were constant equal to 2.8 c.p.mm. for all the foam studied in this investigation. An examination of the foam microstructures revealed that there was a qualitative increase in the number of closed faces with increasing values of nominal relative density and lineal cell density. Extensive porosity was observed in the cross-sectional microstructures of the foam ligaments. The relative density increased with increasing area fraction of closed faces and decreased with increasing area fractions of open faces and ligaments. There was an inverse linear relationship between the area fractions of closed and open faces. In contrast, the relative density did not vary with other microstructural features: cell size, cell perimeter, cell area, and ligament dimensions. A strong inverse power-law correlation was observed between the area fractions of the ligament porosity and the measured relative density.
Empirical (Refs. 10, 16, and 31) and theoretical (Ref. 6) correlations between microstructural features, such as ligament dimensions and cell sizes, and the relative densities do not explain the present observations. Instead, the proposed phenomenological model rationalizes the current results by suggesting that the relative density is directly dependent on the relative area fractions of closed and open cell faces.
NASA/TM—2010-216797 17
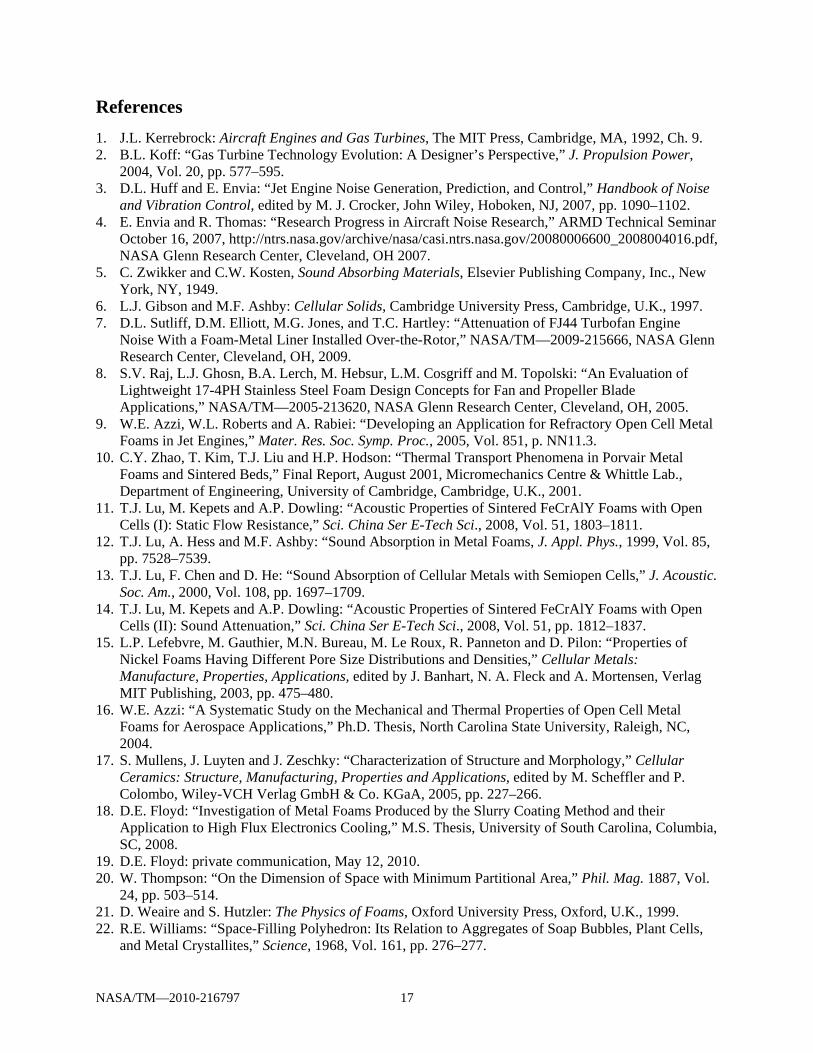
References
1. J.L. Kerrebrock: Aircraft Engines and Gas Turbines, The MIT Press, Cambridge, MA, 1992, Ch. 9. 2. B.L. Koff: “Gas Turbine Technology Evolution: A Designer’s Perspective,” J. Propulsion Power,
2004, Vol. 20, pp. 577–595. 3. D.L. Huff and E. Envia: “Jet Engine Noise Generation, Prediction, and Control,” Handbook of Noise
and Vibration Control, edited by M. J. Crocker, John Wiley, Hoboken, NJ, 2007, pp. 1090–1102. 4. E. Envia and R. Thomas: “Research Progress in Aircraft Noise Research,” ARMD Technical Seminar
October 16, 2007, http://ntrs.nasa.gov/archive/nasa/casi.ntrs.nasa.gov/20080006600_2008004016.pdf, NASA Glenn Research Center, Cleveland, OH 2007.
5. C. Zwikker and C.W. Kosten, Sound Absorbing Materials, Elsevier Publishing Company, Inc., New York, NY, 1949.
6. L.J. Gibson and M.F. Ashby: Cellular Solids, Cambridge University Press, Cambridge, U.K., 1997. 7. D.L. Sutliff, D.M. Elliott, M.G. Jones, and T.C. Hartley: “Attenuation of FJ44 Turbofan Engine
Noise With a Foam-Metal Liner Installed Over-the-Rotor,” NASA/TM—2009-215666, NASA Glenn Research Center, Cleveland, OH, 2009.
8. S.V. Raj, L.J. Ghosn, B.A. Lerch, M. Hebsur, L.M. Cosgriff and M. Topolski: “An Evaluation of Lightweight 17-4PH Stainless Steel Foam Design Concepts for Fan and Propeller Blade Applications,” NASA/TM—2005-213620, NASA Glenn Research Center, Cleveland, OH, 2005.
9. W.E. Azzi, W.L. Roberts and A. Rabiei: “Developing an Application for Refractory Open Cell Metal Foams in Jet Engines,” Mater. Res. Soc. Symp. Proc., 2005, Vol. 851, p. NN11.3.
10. C.Y. Zhao, T. Kim, T.J. Liu and H.P. Hodson: “Thermal Transport Phenomena in Porvair Metal Foams and Sintered Beds,” Final Report, August 2001, Micromechanics Centre & Whittle Lab., Department of Engineering, University of Cambridge, Cambridge, U.K., 2001.
11. T.J. Lu, M. Kepets and A.P. Dowling: “Acoustic Properties of Sintered FeCrAlY Foams with Open Cells (I): Static Flow Resistance,” Sci. China Ser E-Tech Sci., 2008, Vol. 51, 1803–1811.
12. T.J. Lu, A. Hess and M.F. Ashby: “Sound Absorption in Metal Foams, J. Appl. Phys., 1999, Vol. 85, pp. 7528–7539.
13. T.J. Lu, F. Chen and D. He: “Sound Absorption of Cellular Metals with Semiopen Cells,” J. Acoustic. Soc. Am., 2000, Vol. 108, pp. 1697–1709.
14. T.J. Lu, M. Kepets and A.P. Dowling: “Acoustic Properties of Sintered FeCrAlY Foams with Open Cells (II): Sound Attenuation,” Sci. China Ser E-Tech Sci., 2008, Vol. 51, pp. 1812–1837.
15. L.P. Lefebvre, M. Gauthier, M.N. Bureau, M. Le Roux, R. Panneton and D. Pilon: “Properties of Nickel Foams Having Different Pore Size Distributions and Densities,” Cellular Metals: Manufacture, Properties, Applications, edited by J. Banhart, N. A. Fleck and A. Mortensen, Verlag MIT Publishing, 2003, pp. 475–480.
16. W.E. Azzi: “A Systematic Study on the Mechanical and Thermal Properties of Open Cell Metal Foams for Aerospace Applications,” Ph.D. Thesis, North Carolina State University, Raleigh, NC, 2004.
17. S. Mullens, J. Luyten and J. Zeschky: “Characterization of Structure and Morphology,” Cellular Ceramics: Structure, Manufacturing, Properties and Applications, edited by M. Scheffler and P. Colombo, Wiley-VCH Verlag GmbH & Co. KGaA, 2005, pp. 227–266.
18. D.E. Floyd: “Investigation of Metal Foams Produced by the Slurry Coating Method and their Application to High Flux Electronics Cooling,” M.S. Thesis, University of South Carolina, Columbia, SC, 2008.
19. D.E. Floyd: private communication, May 12, 2010. 20. W. Thompson: “On the Dimension of Space with Minimum Partitional Area,” Phil. Mag. 1887, Vol.
24, pp. 503–514. 21. D. Weaire and S. Hutzler: The Physics of Foams, Oxford University Press, Oxford, U.K., 1999. 22. R.E. Williams: “Space-Filling Polyhedron: Its Relation to Aggregates of Soap Bubbles, Plant Cells,
and Metal Crystallites,” Science, 1968, Vol. 161, pp. 276–277.

NASA/TM—2010-216797 18
23. D. Weaire and R. Phelan: “The Structure of Monodisperse Foam,” Phil. Mag. Lett., 1994, Vol. 70, pp. 345–350.
24. E.B. Matzke: “The Three-Dimensional Shape of Bubbles in Foam – An Analysis of the Role of Surface Forces in Three-Dimensional Cell Shape Determination,” Amer. J. Botany, 1946, Vol. 33, pp. 58–80.
25. C. Monnereau and M. Vignes-Adler: “Optical Tomographic of Real Three-Dimensional Foams,” J. Coll. Interface Sci., 1998, Vol. 202, pp. 45–53.
26. C. Monnereau, B. Prunet-Foch, and M. Vignes-Adler: “Topology of Slightly Polydisperse Real Foams,” Phys. Rev. E, 2001, Vol. 63, p. 061402.
27. K. Kose: “3D NMR Imaging of Foam Structures,” J. Magnet. Resonance, 1996, Vol. A 118, pp. 195–201.
28. S.V. Raj: “Microstructural Characterization of Metal Foams: An Examination of the Applicability of the Theoretical Models for Modeling Foams,” NASA/TM—2010-216342, NASA Glenn Research Center, Cleveland, OH (2010).
29. www.keyence.com/products/microscope/microscope/vhx600/vhx600_specifications_1.php. 30. J.C. Russ and R.T. Dehoff: “Practical Stereology,” (2nd Ed.), Kluwer Academic/Plenum Publishers,
New York, NY, 2000. 31. D. Floyd, “Fluid Properties of Open Cell Sintered Iron Based Porous Metal Structures: Experimental
Results and Discussion,” PORVAIR Internal report, July 2001, PORVAIR Fuel Cell Technology, Henderson, NC, 2001.

REPORT DOCUMENTATION PAGE Form Approved
OMB No. 0704-0188 The public reporting burden for this collection of information is estimated to average 1 hour per response, including the time for reviewing instructions, searching existing data sources, gathering and maintaining the data needed, and completing and reviewing the collection of information. Send comments regarding this burden estimate or any other aspect of this collection of information, including suggestions for reducing this burden, to Department of Defense, Washington Headquarters Services, Directorate for Information Operations and Reports (0704-0188), 1215 Jefferson Davis Highway, Suite 1204, Arlington, VA 22202-4302. Respondents should be aware that notwithstanding any other provision of law, no person shall be subject to any penalty for failing to comply with a collection of information if it does not display a currently valid OMB control number. PLEASE DO NOT RETURN YOUR FORM TO THE ABOVE ADDRESS.
1. REPORT DATE (DD-MM-YYYY) 01-12-2010
2. REPORT TYPE Technical Memorandum
3. DATES COVERED (From - To)
4. TITLE AND SUBTITLE Effect of Microstructural Parameters on the Relative Densities of Metal Foams
5a. CONTRACT NUMBER
5b. GRANT NUMBER
5c. PROGRAM ELEMENT NUMBER
6. AUTHOR(S) Raj, S., V.; Kerr, Jacob, A.
5d. PROJECT NUMBER
5e. TASK NUMBER
5f. WORK UNIT NUMBER WBS 561581.02.08.03.15.12
7. PERFORMING ORGANIZATION NAME(S) AND ADDRESS(ES) National Aeronautics and Space Administration John H. Glenn Research Center at Lewis Field Cleveland, Ohio 44135-3191
8. PERFORMING ORGANIZATION REPORT NUMBER E-17428
9. SPONSORING/MONITORING AGENCY NAME(S) AND ADDRESS(ES) National Aeronautics and Space Administration Washington, DC 20546-0001
10. SPONSORING/MONITOR'S ACRONYM(S) NASA
11. SPONSORING/MONITORING REPORT NUMBER NASA/TM-2010-216797
12. DISTRIBUTION/AVAILABILITY STATEMENT Unclassified-Unlimited Subject Categories: 01, 07, 26, and 31 Available electronically at http://gltrs.grc.nasa.gov This publication is available from the NASA Center for AeroSpace Information, 443-757-5802
13. SUPPLEMENTARY NOTES Submitted to Metallurgical and Materials Transactions A.
14. ABSTRACT A detailed quantitative microstructural analyses of primarily open cell FeCrAlY and 314 stainless steel metal foams with different relative densities and pores per inch (p.p.i.) were undertaken in the present investigation to determine the effect of microstructural parameters on the relative densities of metal foams. Several elements of the microstructure, such as longitudinal and transverse cell sizes, cell areas and perimeters, ligament dimensions, cell shapes and volume fractions of closed and open cells, were measured. The cross-sections of the foam ligaments showed a large number of shrinkage cavities, and their circularity factors and average sizes were determined. The volume fractions of closed cells increased linearly with increasing relative density. In contrast, the volume fractions of the open cells and ligaments decreased with increasing relative density. The relative densities and p.p.i. were not significantly dependent on cell size, cell perimeter and ligament dimensions within the limits of experimental scatter. A phenomenological model is proposed to rationalize the present microstructural observations. 15. SUBJECT TERMS Metal foams; Aviation noise; Foam cells; Foam microstructure; Kelvin model
16. SECURITY CLASSIFICATION OF: 17. LIMITATION OF ABSTRACT UU
18. NUMBER OF PAGES
24
19a. NAME OF RESPONSIBLE PERSON STI Help Desk (email:[email protected])
a. REPORT U
b. ABSTRACT U
c. THIS PAGE U
19b. TELEPHONE NUMBER (include area code) 443-757-5802
Standard Form 298 (Rev. 8-98)Prescribed by ANSI Std. Z39-18


![[1] Sound Lecture Physics Department](https://img.pdfslide.net/doc/110x75/544acd2fb1af9feb3d8b4cfc/1-sound-lecture-physics-department.jpg)