Embed Size (px)
Citation preview
Effect of Non-ionic Surfactants and Its Role in K Intercalationin Electrolytic Manganese Dioxide
AVIJIT BISWAL, B.C. TRIPATHY, T. SUBBAIAH, D. MEYRICK, MIHAIL IONESCU,and MANICKAM MINAKSHI
The effect of non-ionic surface active agents (surfactants) Triton X-100 (TX-100) and Tween-20(Tw-20) and their role in potassium intercalation in electrolytic manganese dioxide (EMD)produced from manganese cake has been investigated. Electrosynthesis of MnO2 in the absenceor presence of surfactant was carried out from acidic MnSO4 solution obtained from manganesecake under optimized conditions. A range of characterization techniques, including fieldemission scanning electron microscopy, transmission electron microscopy (TEM), Rutherfordback scattering (RBS), and BET surface area/porosity studies, was carried out to determine thestructural and chemical characteristics of the EMD. Galvanostatic (discharge) and potentio-static (cyclic voltammetric) studies were employed to evaluate the suitability of EMD in com-bination with KOH electrolyte for alkaline battery applications. The presence of surfactantplayed an important role in modifying the physicochemical properties of the EMD by increasingthe surface area of the material and hence, enhancing its electrochemical performance. TheTEM and RBS analyses of the discharged EMD (c-MnO2) material showed clear evidence ofpotassium intercalation or at least the formation of a film on the MnO2 surface. The extent ofintercalation was greater for EMD deposited in the presence of TX-100. Discharged MnO2
showed products of Mn2+ intermediates such as MnOOH and Mn3O4.
DOI: 10.1007/s40553-014-0022-9� ASM International (ASM) and The Minerals, Metals & Materials Society (TMS) 2014
I. INTRODUCTION
THE intense interest in manganese oxides for energyapplications is driven by the low cost and non-toxicity ofthese materials when compared with nickel and cobaltoxides. The rich chemistry and diverse crystallinestructures of MnO2 offer a versatility that allows itsuse in a range of applications.[1] Of the different types ofMnO2, such as natural manganese dioxide (NMD),chemical manganese dioxide (CMD), activated manga-nese dioxide (AMD), and electrolytic manganese diox-ide (EMD), EMD is most widely applied in batteryindustries.[2,3] EMD is composed predominantly of thec-phase and may be produced cost effectively with lowenvironmental impact. EMD has a high redox potential,high rate capability, long storage life, and betterperformance over a wide temperature range relative toits nickel and cobalt counterparts.[4–8]
It is anticipated that over the next decade, the pricing forhigh purity EMD will increasingly be affected by thedemand for lithium-ion batteries containing cathodic
material derived from EMD. This rechargeable batteryhas quickly become the technology of choice in the cordlesspower tool industry and is being increasingly applied in theelectric vehicle (EV) and hybrid electric vehicle (HEV)industries. The EV and HEV battery markets will likelyexpand rapidly over the next few years, and this willtranslate toattractive returns forhigh-endEMDproducers.An estimated two billion manganese versions of lithiumprimary (non-rechargeable) batteries and half a billionlithium manganese secondary (rechargeable) batteries areproduced per annum, with growth rates in excess of 10 and20 pct, respectively.[9] This increasingdemandgives rise to aneed for high purity EMD from alternative sources.Numerous reports are available regarding the synthesis ofEMD (c-MnO2) from various manganese ores[10–14] and itsrole as a cathode in alkalineZn-MnO2 systems,[3,4,8,15]whilethe possibility of producing EMD from low grade andsecondary manganese resources has not been fully ex-plored. Production of EMD from a range of sources will benecessary to meet future escalating demand.In this context, we have produced battery grade
EMD, in the presence of surfactants, from manganesecake, a side product obtained during the processing ofmanganese nodules.[16] Surfactants play a significantrole in modifying the growth pattern (and hence thephysicochemical properties) of electrodeposits throughadsorption on the MnO2 electrode surface.[17] Surfaceadsorption of surfactants influences the kinetics ofelectron transfer through blocking of active sites andalso affects electrostatic interactions between electroac-tive species in the electrolytic bath. Consequently,addition of organic surfactants to the electrolytic bath
AVIJIT BISWAL, Ph.D. Scholar, and B.C. TRIPATHY and T.SUBBAIAH, Senior Scientists, are with the CSIR - Institute ofMineralsand Materials Technology, Bhubaneswar 751013, India, and also withthe Academy of Scientific and Innovative Research, AnusandhanBhavan, New Delhi 110001. D. MEYRICK, Senior Lecturer, andMANICKAMMINAKSHI, Lecturer, are with the School of Engineer-ing and Information Technology, Murdoch University, Murdoch, WA6150, Australia. Contact e-mail: [email protected] MIHAILIONESCU, Senior Research Scientist, is with the Environment, LucasHeights Laboratories, ANSTO, Menai, NSW 2234, Australia.
Manuscript submitted March 21, 2014.@Article published online June 17, 2014
226—VOLUME 1E, SEPTEMBER 2014 METALLURGICAL AND MATERIALS TRANSACTIONS E

affects the morphology and mechanical properties ofelectrochemically deposited material, leading to alteredelectrochemical behavior of materials. Use of surfac-tants during preparation of materials for battery appli-cations has been widely reported in the literature.[17–23]
Surfactants may be used during chemical co-precipita-tion,[18,19] liquid co-precipitation,[20] as well as electro-chemical deposition methods.[21,22] Ghaemi et al.[22]
have reported improved charge/discharge cycle behaviorof EMD prepared in the presence of t-octyl phenoxypolyethoxy ethanol (Triton X-100). The absence of thissurfactant was found to produce EMD unsuitable for arechargeable battery application. EMD prepared in thepresence of cetyltrimethylammonium bromide (CTAB)or sodium n-dodecylbenzenesulfonate (SDBS) has alsobeen reported and found suitable for battery applica-tions.[23] The positive effect of use of CTAB and SDBSon the performance of Zn-MnO2 alkaline batteries hasbeen reported earlier.[23] Triton X-100 is reported[21] tooffer the best improvement in capacitance behavior ofEMD, possibly due to strong adsorption of the surfac-tant, resulting in an increase in specific capacitance ofthe energy storage device.
The current work evaluates the use of Triton X-100along with Tween-20 on EMD produced from asecondary source. The difference in chemical structureobserved (detailed in results and discussion section) forthe two non-ionic surfactants (TX100 and Tw20)intrigued to investigate their role in EMD for energystorage devices. To the best of our knowledge, no workhas been reported on the suitability for rechargeablebattery applications of EMD from manganese cakeprepared in the presence of the above mentionedsurfactants. Most of the reported literature on EMDmaterial in aqueous solutions is based on the well-known protonation or lithiation mechanisms.[24–28] Inthis work, TEM imaging and Rutherford back scatter-ing analyses gave intriguing insights suggesting that thepotassium ion may be intercalated in the c-MnO2
structure. The extent of intercalation depends on thetype of surfactant used. The influence of these twosurfactants on the structural, morphological, and elec-trochemical characteristics of the EMD produced frompurified manganese sulfate solution obtained frommanganese cake was thus investigated. This work notonly examines the suitability of these two surfactants inimproving the electrochemical activity of MnO2 materialbut also opens a new possibility for utilization of asecondary source to produce an energy material.
II. EXPERIMENTAL
A. Materials and Methods for Producing EMD
Electrolytic manganese dioxide (EMD) was producedfrom purified MnSO4 solutions obtained from manga-nese cake at an anodic current density of 200 Am�2 in aglass cell, as reported in our previous work.[16] Purified
MnSO4 solution was obtained after leaching of manga-nese cake, followed by two stages of purification.[16,29]
All EMD samples were prepared with in situ addition ofa calculated (as per critical micelle concentration)quantity of surfactant to the electrolytic bath containing50 g dm�3 MnSO4 and 25 g dm�3 H2SO4. The criticalmicelle concentrations (CMC) of Triton X-100 (TX-100,SLR) and Tween-20 (Tw-20, SLR) are 0.02 and0.01 wt pct, respectively. EMD samples prepared from0 t, 5 t, 10 t, 15 t, and 30 t cmc values of TX-100 (wheret denotes CMC) have been labeled EMD0, EMDTX5,EMDTX10, EMDTX15, and EMDTX30, respectively. Sim-ilarly the EMD produced from the electrolytic bathcontaining 10, 15 t, and 30 t CMC of Tw-20 has beenlabeled EMDTw10, EMDTw15, and EMDTw30, respec-tively. The electro-synthesized EMD was scraped offfrom the anodic substrate after the deposition andwashed thoroughly with deionized water before dryingin an oven. The dried mass was ground and sievedthrough a 53-lm mesh to obtain EMD powder. Theresultant product in powder form was washed repeat-edly with de-ionized water, until the sample was sulfatefree. The EMD powder was finally dried and cooled in adesiccator and subjected to physical and electrochemicalcharacterization.
B. Structural, Thermal, and Microscopic Analyses
X-ray diffractograms were recorded for the resultantEMD powders using PANalytical diffractometer (PW1830, Philips, Japan)withCuKa radiation, k = 1.5418 A.The scans were recorded in 2h range 15 to 80 deg. BETsurface area and pore size analysis were carried out usingQuantachrome (Autosorb-iQ) Surface area analyzer. Dif-ferential thermal analysis (DTA) and thermogravimetry(TG) (Perkin Elmer Diamond) of the EMD samples werecarried out under an inert atmosphere over a temperaturerange between 303 K and 1273 K (30 �C and 1000 �C)with a heating rate of 278 K (5 �C) min�1. The surfacemorphology of the EMD samples was determined usingfield emission scanning electron microscope (FESEM,ZEISS: SUPRA55). Fourier transform infrared (FT-IR)spectra were recorded on a Nicolet 6070 spectrophotom-eter in the frequency range 400 to 4500 cm�1. Themorphology and interplanar spacings of the productsformed before and after discharge were determined bytransmission electron microscopy (TEM) coupled withenergy dispersive analysis (EDS) using a JEOL 2010FTEM model operated at 200 kV. TEM specimens wereprepared by grinding a small fragment of material scrapedfrom the pressedpellet undermethanol and dispersing on aperforated carbon support film. Specimens were examinedat liquid nitrogen temperature in a cooling stage, to reducebeamdamage and contamination effects. Rutherford backscattering analysis (RBS) was used in conjunction withproton induced X-ray emission (PIXE) to determine theconcentrations of elements such as O, C, Na, Ni, Co, Mn,and P. The RBS and PIXE measurements were madesimultaneously on an ion beam accelerator using a2.6 MeV proton beam at ANSTO facilities.
METALLURGICAL AND MATERIALS TRANSACTIONS E VOLUME 1E, SEPTEMBER 2014—227

C. Electrochemical Characterization
The pellet preparation, cell arrangement, and all otherconditions and parameters were identical to those of ourprevious work.[29] For cyclic voltammetric (CV) experi-ments, a standard three-electrode cell was used. For thispurpose, EMD was used as the working electrode. Thecounter electrodewas a zinc foil, whichwas separated fromthe main electrolyte (9 MKOH) by means of a porous fritto avoid the spallation of zinc inserted into the MnO2.Mercury-mercury oxide (Hg/HgO) served as the referenceelectrode. Reported potentials are relative to Hg/HgOwith a slow scan rate of 50 lV/s. For the galvanostaticexperiments the applied discharge current was 20 mAwith a cut-off voltage (COV) of 0.9 V, while the appliedcharge current was 40 mA with a cut-off voltage of 1.9 V.The discharge capacities were recorded for up to 15 cycles.The galvanostatic measurements were carried out using aBITRODE deep cycle battery tester (LCN1-25-24, USA).
III. RESULTS AND DISCUSSION
A. Electrolysis
The current efficiency (CE) and energy consumption(EC) of electrodeposited EMDprepared in the presence ofTX-100 and Tw-20 surfactants are given in Table I. In theabsence of surfactant as additive in the bath, 89 pctCEwasobserved. With the introduction of a small amount ofsurfactant (TX-100), the CE slightly increased to 89.5 pctwith slight decrease in EC from 1.65 to 1.64 kWh kg�1.With an increase in the concentration of TX-100, thecurrent efficiency decreased, and an increase in energyconsumption was observed, while with the addition of tentimes theCMCofTw-20, theCE increased to 98 pct, whileEC decreased from 1.65 to 1.46 kWh kg�1 during elec-trolysis. This suggests strongadsorptionof the additives onthe electrode surface, as suggested by Ghaemi et al.[22]
In general, the electrodeposition of manganese diox-ide from an acidic sulfate solution proceeds through thefollowing reactions:
At anode:Mn2þ þ 2H2O!MnO2 þ 4Hþ þ 2e� ½1�
At cathode: 2Hþ þ 2e� ! H2: ½2�
At the anode, the formation of MnO2 does not takeplace in a single step; rather, Mn3+ as an intermediate
species is first formed[24,26,30–32] together with some solidintermediates such as MnOOH(s) and Mn2O3(s). Beingunstable in acidic solution,[2] the Mn3+ ion undergoes adisproportionation reaction forming Mn4+ and Mn2+.
Mn2þsol !Mn3þads þ e� ½3�
2Mn3þads !Mn4þads þMn2þsol : ½4�
During the electrodeposition process, Mn3+ ions maybe trapped in the MnO2 lattice, possibly resulting indefects in the crystal structure.[22] Adsorption of surfac-tants at the substrate/electrolytic solution interface mayinhibit the rate of Eq. [3] due to the blocking of theactive growth sites, thereby allowing electrodepositionpreferentially on the crevices. The electron/ion transferkinetics depends largely on the degree of surfacecoverage of the electrode due to mechanical blockingthat is caused through electrostatic interactions.[33,34]
Coverage of the electrode surface may change theelectrical double layer characteristics and thus affectthe interfacial energy, dielectric constant, potential, andcurrent distribution at the electrodes, resulting inmodified crystal growth. Hence, organic surfactantsmay play a crucial role in facilitating the formation ofcompact deposits with greater surface area. However,the effect of surfactant concentration should be wellunderstood. Higher concentrations may lead to irregularmorphology owing to higher ohmic potential drop andelectrode overvoltage.[35]
B. Structure and Function of Surfactant in the Solution
Surfactants lower the surface tension of a liquid aswell as liquid–liquid interfacial tension or liquid–solidinterfacial tension. Surfactants are amphiphilic mole-cules with both hydrophilic and lipophilic moieties. Theadsorption and desorption of these amphiphilic mole-cules at the solid liquid interface were possible in thiswork with the given applied potential range. Criticalmicelle concentration (CMC) is the concentration of asurfactant above which micelle formation occurs. Theexistence of micelles does not preclude the existence ofindividual surfactant molecules in solution. Furtheraddition of surfactant after reaching the CMC willultimately increase the no. of micelles. The structure of amaterial electrodeposited in the presence of a surfactant
Table I. Effect of the Surfactants TX-100 and Tw-20 on Current Efficiency (CE) and Energy Consumption (EC) during Electrode-position of MnO2
SurfactantAmountin CMC CE (pct) EC (kWh kg�1) BET Surface Area (m2 g�1) Open Circuit Voltage (V)
Nil 89 1.65 101.908 1.550TX 10 t 89.5 1.64 125.843 1.605
15 t 87 1.74 173.982 1.57830 t 70 2.07 114.685 1.482
Tw 10 t 98.3 1.46 146.971 1.54815 t 95.7 1.58 152.525 1.50830 t 85.8 1.72 133.188 1.480
228—VOLUME 1E, SEPTEMBER 2014 METALLURGICAL AND MATERIALS TRANSACTIONS E

can be related to the micelle population. With anincrease in the concentration of surfactant (from 10 to30 t in the current study), a different morphologicalpattern may be created in the diffusion layer of theelectrode.[33] Surfactant adsorbed to charged surfacesmay arrange in bilayers called admicelles, forming amolecular layer with head groups down on the surfaceand a second layer with head groups facing thesolution.[36] The CMC values reported for non-ionicsurfactants Tw-20 and TX-100 are 8.5 9 10�4 and9.2 9 10�4 M, respectively.[37] The surfactant with low-er CMC implies higher adsorbed amounts. Hence, tomake a comparative study of the effect of surfactants onthe electrochemical processes, the two non-ionic surfac-tants (Tw and TX) with different chemical structureswere chosen.
In the case of TX-100, the hydrophobic aromatichydrocarbon is oriented toward the solution.[34] With anincrease in surfactant concentration (beyond the CMC),surfactants may assume a range of conformationsincluding the interweaving of hydrophobic chains ofadjacent molecules and the formation of admicelles.[38]
The underlying mechanism of adsorption is an attrac-tion between the oxygen atoms in polyoxyethylenegroups of TX-100 or Tw molecule and the Mn+2
species, forming Mn+2-TX and Mn+2-Tw pairs, respec-tively. These pairs will be affected by surfactant con-centration and will influence the electrodeposition ofMnO2. Hence, the concentration of surfactant should belimited to a particular value, above which there will beundesirable consequences in terms of physical andelectrochemical characteristics of deposited EMD.
C. Structural Characterization
Figure 1 shows the X-ray diffraction (XRD) patternsof EMD samples prepared at different concentrations ofsurfactants. The diffraction patterns show in situ addi-tion of either surfactant to the electrolytic bath had nosignificant effect on the crystalline phase of c-MnO2. Thepeak intensity for all samples is weak, with peakbroadening indicating a typical amorphous quality tothe deposit. All of the diffraction peaks can be indexedto an orthorhombic phase of c-MnO2 with latticeconstants: a = 8.70 A, b = 2.90 A and c = 4.41 A.This is in good agreement with the standard values(JCPDS card no. 65-1298; a = 9.27 A, b = 2.87 A,c = 4.53 A). The peaks at 2h values of ~22, ~37.2, ~42,~56, and ~68 deg correspond to the 110, 021, 121, 240/221, and 002/061 crystal planes of c-MnO2, respectively.
The FTIR spectra recorded for the EMD samples inthe presence and absence of surfactant (Figure 2) showsignificant IR peaks at different frequency ranges. Thebroad absorption band detected in the finger printregion of 400 to 600 cm�1 confirms the structuralvibrations occur in MnO6 octahedral in c-MnO2 struc-ture.[39] The absorption band at 1100 cm�1 can beattributed to the MnO2 stretching mode and/or O-Hbending vibrations[39] associated with hydrogen bond-ing, indicating the presence of bound water mole-cules.[40,41] The strong absorption band at ~1630 cm�1
can be attributed to O-H bending vibrations associated
with the water crystallization,[40] and a broad absorptionband at ~3400 cm�1 is due to OH stretching vibra-tions.[40–43] Additional peaks at 968 and 1025 cm�1 areattributed to Mn-O-H structural vibrations in agree-ment with the spectral features reported by McBride.[44]
D. Thermal Analysis
Thermodynamic stability as well as electrical conduc-tivity of manganese dioxide are strongly governed by thepresence of water molecules in the crystal lattices; thewater content causes a variation in the crystal latticewith a consequent effect on electrical conductivity. Thewater content enhances the transportation of activeionic species and consequently increases the specificcapacitance of manganese dioxide.[45] Hence to deter-mine the role of thermal stability, thermal analysis(TGA and DTA) was carried out for all EMD samples(Figures 3(a) and (b)). Release of physisorbed water
4000 3500 3000 2500 2000 1500 1000 5000
5
10
15
20
25
30
35
40
45
50
11303375
16351420
EMDTX30
EMDTW30
EMDTW15
EMDTX15
Tra
nsm
itta
nce
/ a.
u.
Wavenumber / Cm-1
EMD0
754
MnO2 region
Fig. 2—FTIR spectra of EMD samples (a) EMD0, (b) EMDTX15, (c)EMDTw15, (d) EMDTw30, (e) EMDTX30.
15 20 25 30 35 40 45 50 55 60 65 70 75 80
002221 061
e
d
c
b
a
240121021
Inte
nsity
(a.
u)
110
(degrees) 2θ
Fig. 1—X-ray diffraction patterns of (a) EMD0, (b) EMDTX15, (c)EMDTX30, (d) EMDTw15, (e) EMDTw30.
METALLURGICAL AND MATERIALS TRANSACTIONS E VOLUME 1E, SEPTEMBER 2014—229
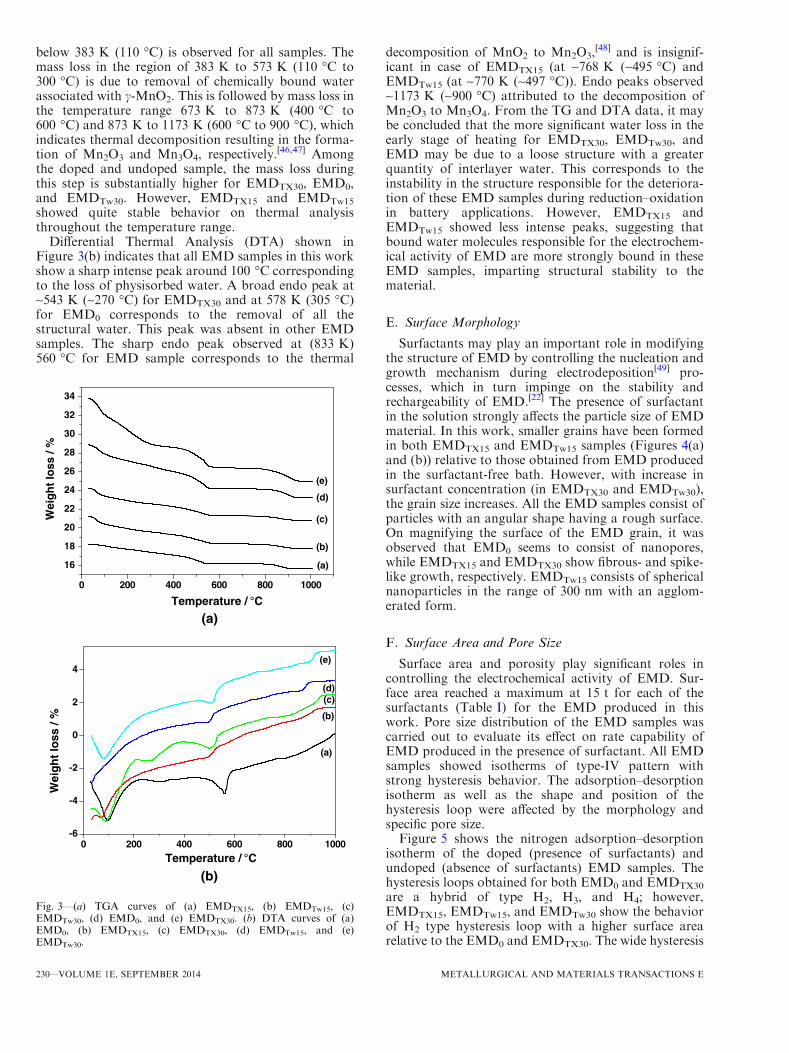
below 383 K (110 �C) is observed for all samples. Themass loss in the region of 383 K to 573 K (110 �C to300 �C) is due to removal of chemically bound waterassociated with c-MnO2. This is followed by mass loss inthe temperature range 673 K to 873 K (400 �C to600 �C) and 873 K to 1173 K (600 �C to 900 �C), whichindicates thermal decomposition resulting in the forma-tion of Mn2O3 and Mn3O4, respectively.
[46,47] Amongthe doped and undoped sample, the mass loss duringthis step is substantially higher for EMDTX30, EMD0,and EMDTw30. However, EMDTX15 and EMDTw15
showed quite stable behavior on thermal analysisthroughout the temperature range.
Differential Thermal Analysis (DTA) shown inFigure 3(b) indicates that all EMD samples in this workshow a sharp intense peak around 100 �C correspondingto the loss of physisorbed water. A broad endo peak at~543 K (~270 �C) for EMDTX30 and at 578 K (305 �C)for EMD0 corresponds to the removal of all thestructural water. This peak was absent in other EMDsamples. The sharp endo peak observed at (833 K)560 �C for EMD sample corresponds to the thermal
decomposition of MnO2 to Mn2O3,[48] and is insignif-
icant in case of EMDTX15 (at ~768 K (~495 �C) andEMDTw15 (at ~770 K (~497 �C)). Endo peaks observed~1173 K (~900 �C) attributed to the decomposition ofMn2O3 to Mn3O4. From the TG and DTA data, it maybe concluded that the more significant water loss in theearly stage of heating for EMDTX30, EMDTw30, andEMD may be due to a loose structure with a greaterquantity of interlayer water. This corresponds to theinstability in the structure responsible for the deteriora-tion of these EMD samples during reduction–oxidationin battery applications. However, EMDTX15 andEMDTw15 showed less intense peaks, suggesting thatbound water molecules responsible for the electrochem-ical activity of EMD are more strongly bound in theseEMD samples, imparting structural stability to thematerial.
E. Surface Morphology
Surfactants may play an important role in modifyingthe structure of EMD by controlling the nucleation andgrowth mechanism during electrodeposition[49] pro-cesses, which in turn impinge on the stability andrechargeability of EMD.[22] The presence of surfactantin the solution strongly affects the particle size of EMDmaterial. In this work, smaller grains have been formedin both EMDTX15 and EMDTw15 samples (Figures 4(a)and (b)) relative to those obtained from EMD producedin the surfactant-free bath. However, with increase insurfactant concentration (in EMDTX30 and EMDTw30),the grain size increases. All the EMD samples consist ofparticles with an angular shape having a rough surface.On magnifying the surface of the EMD grain, it wasobserved that EMD0 seems to consist of nanopores,while EMDTX15 and EMDTX30 show fibrous- and spike-like growth, respectively. EMDTw15 consists of sphericalnanoparticles in the range of 300 nm with an agglom-erated form.
F. Surface Area and Pore Size
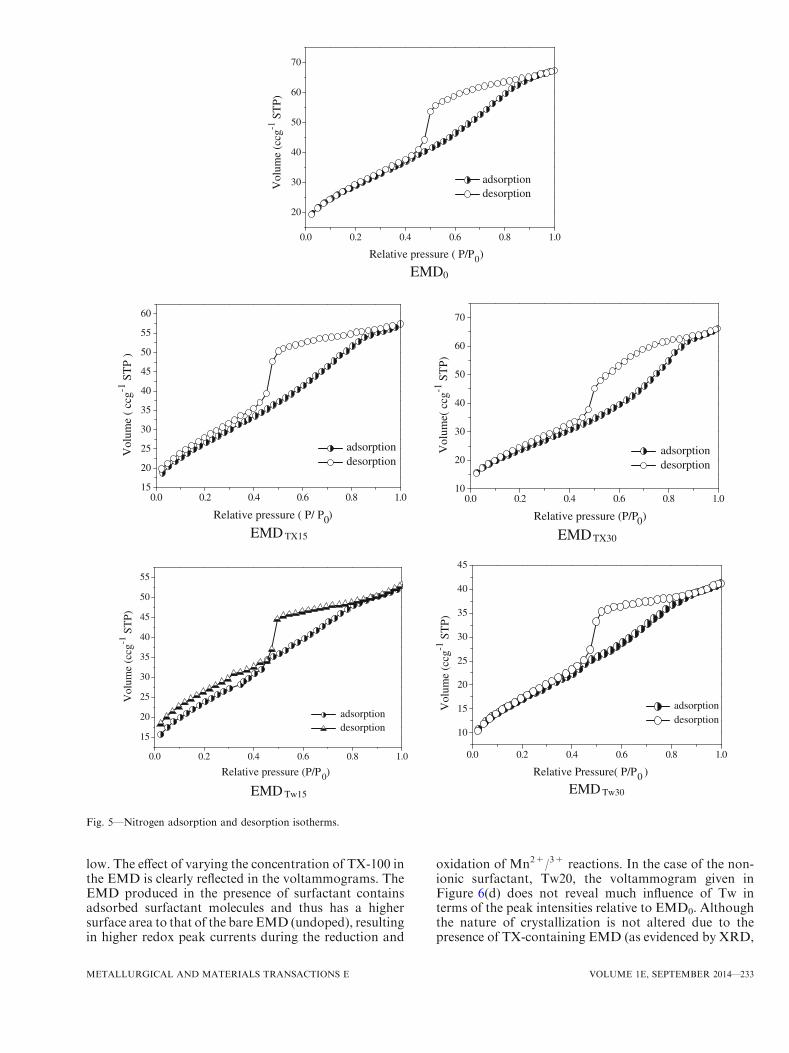
Surface area and porosity play significant roles incontrolling the electrochemical activity of EMD. Sur-face area reached a maximum at 15 t for each of thesurfactants (Table I) for the EMD produced in thiswork. Pore size distribution of the EMD samples wascarried out to evaluate its effect on rate capability ofEMD produced in the presence of surfactant. All EMDsamples showed isotherms of type-IV pattern withstrong hysteresis behavior. The adsorption–desorptionisotherm as well as the shape and position of thehysteresis loop were affected by the morphology andspecific pore size.Figure 5 shows the nitrogen adsorption–desorption
isotherm of the doped (presence of surfactants) andundoped (absence of surfactants) EMD samples. Thehysteresis loops obtained for both EMD0 and EMDTX30
are a hybrid of type H2, H3, and H4; however,EMDTX15, EMDTw15, and EMDTw30 show the behaviorof H2 type hysteresis loop with a higher surface arearelative to the EMD0 and EMDTX30. The wide hysteresis
0 200 400 600 800 1000
16
18
20
22
24
26
28
30
32
34
(e)
(d)
(c)
(a)
Wei
gh
t lo
ss /
%
Temperature / °C
(b)
0 200 400 600 800 1000-6
-4
-2
0
2
4(e)
(d)(c)
(b)
Wei
gh
t lo
ss /
%
(a)
Temperature / °C
(a)
(b)
Fig. 3—(a) TGA curves of (a) EMDTX15, (b) EMDTw15, (c)EMDTw30, (d) EMD0, and (e) EMDTX30. (b) DTA curves of (a)EMD0, (b) EMDTX15, (c) EMDTX30, (d) EMDTw15, and (e)EMDTw30.
230—VOLUME 1E, SEPTEMBER 2014 METALLURGICAL AND MATERIALS TRANSACTIONS E

loop indicates that all the EMD samples are predom-inantly composed of mesopores. Mesopores with radiusof 1.87 to 1.97 and 1.68 to 1.95 nm are obtained forEMDTX15 and EMDTw15, respectively, versus EMD0
with a pore radius of 1.58 to 1.96 nm. The pore sizediameters and distribution of all samples were calculatedusing the Barrett–Joyner–Halenda (BJH) method. Itwas also observed that with addition of surfactant, the
surface area of EMD increases markedly (Table I),limited by a certain concentration (CMC value) ofsurfactant, after which it decreases. EMDTX15 andEMDTw15 show the highest surface area of 173.9 and152.5 m2 g�1 in comparison with EMD0, which shows asurface area of 101.9 m2 g�1. In general, EMD preparedin the presence of surfactant shows a higher surface areathan that produced in the absence of surfactant. As
Fig. 4—a FESEM images of EMD0 (a1, a2), EMDTX15 (b1, b2), EMDTX30 (c1, c2). b FESEM images of EMDTw15 (d1, d2), EMDTw30 (e1, e2).
METALLURGICAL AND MATERIALS TRANSACTIONS E VOLUME 1E, SEPTEMBER 2014—231

reported by[50,51] charge transfer processes between theelectrolyte and the crystal phase can be affected bymicro/meso porosity, and a decrease in the pore sizemay lead to reduction of accessible electrochemicalactive sites. To support this fact, doped EMD samplesobtained in this work with high surface area as well aswith greater pore size show improved cyclic behavior(discussed in the Section III–G) relative to ‘‘non-surfac-tant’’ material, due to greater electrochemically accessi-bility of sites available for proton diffusion inside MnO2
cathode.
G. Electrochemical Activity
The electrochemical behavior of the EMD samples wascharacterized by potentiostatic (potential controlled) andgalvanostatic (current controlled) experiments. Cyclicvoltammograms of the doped and undoped EMD mate-rials are shown in Figure 6. The cyclic voltammogram ofEMD0 (Figure 6(a)) is initiated in the cathodic region andthen reversed back to the anodic region before it finishes
at the starting potential. The CV is characterized by awell-defined reduction peak (C1 = �0.390 V) and anoxidation peak (A1 = �0.09 V) which is a fingerprint forelectron transfer processes corresponding to a redoxbehavior suitable for energy storage and battery applica-tions. For TX-added EMD, it is observed that thecathodic and anodic currents in Figure 6(b) are higher,and the reduction and oxidation peaks (at C1 = �0.450andA1 = 0.030) have becomemore defined. The effect ofadding more TX (TX30) during electrodeposition ofEMDalso had an impact on the voltammogram shown inFigure 6(c). The redox peaks have shifted to lowerpotentials (at C1 = �0.430 and A1 = �0.025) with theseparation between the peaks reduced to 0.040 V, indi-cating excellent reversibility. However, the area under thepeak for TX30 is less than that for TX15. Furtheraddition of TX did not influence the redox process (notshown here). TX has both hydrophilic and lipophilicgroups so that when its concentration reaches or sur-passes CMC, the surfactant tends to form micelles, andthe adsorption of Mn2+ ions would be comparatively
Fig. 4—continued.
232—VOLUME 1E, SEPTEMBER 2014 METALLURGICAL AND MATERIALS TRANSACTIONS E
low. The effect of varying the concentration of TX-100 inthe EMD is clearly reflected in the voltammograms. TheEMD produced in the presence of surfactant containsadsorbed surfactant molecules and thus has a highersurface area to that of the bare EMD (undoped), resultingin higher redox peak currents during the reduction and
oxidation of Mn2+/3+ reactions. In the case of the non-ionic surfactant, Tw20, the voltammogram given inFigure 6(d) does not reveal much influence of Tw interms of the peak intensities relative to EMD0. Althoughthe nature of crystallization is not altered due to thepresence of TX-containing EMD (as evidenced by XRD,
0.0 0.2 0.4 0.6 0.8 1.0
20
30
40
50
60
70
Vol
ume
(ccg
-1 S
TP)
Relative pressure ( P/P0)
adsorption desorption
EMD0
0.0 0.2 0.4 0.6 0.8 1.015
20
25
30
35
40
45
50
55
60
Vol
ume
( cc
g-1 S
TP
)
Relative pressure ( P/ P0)
adsorption desorption
0.0 0.2 0.4 0.6 0.8 1.010
20
30
40
50
60
70
Vol
ume(
ccg
-1 S
TP)
Relative pressure (P/P0)
adsorption desorption
EMD TX15 EMDTX30
0.0 0.2 0.4 0.6 0.8 1.0
15
20
25
30
35
40
45
50
55
Vol
ume
(ccg
-1 S
TP)
Relative pressure (P/P0)
adsorption desorption
0.0 0.2 0.4 0.6 0.8 1.0
10
15
20
25
30
35
40
45
Vol
ume
(ccg
-1 S
TP)
Relative Pressure( P/P0 )
adsorption desorption
EMD Tw15 EMD Tw30
Fig. 5—Nitrogen adsorption and desorption isotherms.
METALLURGICAL AND MATERIALS TRANSACTIONS E VOLUME 1E, SEPTEMBER 2014—233

Figure 1), the change in morphology and larger surfacearea (Table I) was reflected in the electrochemistry,suggesting a higher rate of nucleation when TX-100 ispresent in the electrolyte.
The results of cyclic voltammetry for these studieswere also confirmed by galvanostatic charge/dischargestudies (Figure 7). As expected, the available dischargecapacity for the TX-added EMD showed 273 mAh g�1
(Figure 7(b)), while the surfactant-free EMD showedjust 170 mAh g�1 (Figure 7(a)), additional capacity of38 pct. The difference in capacities between the variousconcentrations of TX (Figures 7(b) to (c)) is negligible(only 20 mAh g�1). On the other hand, non-ionicsurfactant (Tw) in Figure 7(d) showed only a slightimprovement of 181 mAh g�1 relative to EMD0. Thegalvanostatic and potentiostatic results of this studyagree well.
To investigate the role of the discharge mechanism inthe alkaline KOH electrolyte, the cathode material afterdischarge was thoroughly washed with distilled water,and the variation in crystal structure analyzed throughXRD before and after the electrochemical processes.The XRD results are displayed in Figure 8. The XRDpattern shows a peak at 2h = 27 deg with higher
intensity, corresponding to conductive carbon as anadditive in the cathode material to improve the conduc-tivity. In addition to the parent MnO2 diffraction lines,the evolution of new diffraction peaks corresponding toMnOOH and Mn3O4 is seen in Figure 8. The diffractionpattern obtained for EMD material prepared in thepresence or absence of surfactants shows the surfactantsdid not influence the formation of the dischargedproducts. The product obtained is in accordance withthe well-known mechanism of c-MnO2 as an insertionelectrode in aqueous KOH electrolyte involves H+
insertion forming the manganese oxy hydroxides(MnOOH) and manganese (III) oxide (Mn3O4).
[24–26]
The TEM images of the discharged material, on theother hand, show a different but intriguing picture. TheTEM images of the cathode (c-MnO2) material preparedin the presence of surfactants before and after dischargeare shown in Figure 9. The TEM image of the cathodematerial before discharge (Figure 9(a)) showed theparent MnO2 and carbon as additive, but after discharge(for undoped; Figure 9(b)), the regions A and Bcorrespond to MnO2 with a small amount of potassium(EDS analysis not shown here). For TX-added EMD,Figure 9(c), all regions labeled A to E showed MnO2
-0.6 -0.5 -0.4 -0.3 -0.2 -0.1 0.0 0.1 0.2 0.3-0.004
-0.002
0.000
0.002
0.004
- 0.097 V
A1
Cu
rren
t / A
Potential vs. Hg/HgO / V
C1
- 0.390 V
(a) EMD0
-0.6 -0.5 -0.4 -0.3 -0.2 -0.1 0.0 0.1 0.2 0.3-0.004
-0.002
0.000
0.002
0.0040.030 V
A1
Cu
rren
t / A
Potential vs. Hg/HgO / V
C1
- 0.450 V
(b) TX15
-0.6 -0.5 -0.4 -0.3 -0.2 -0.1 0.0 0.1 0.2 0.3-0.004
-0.002
0.000
0.002
0.004 - 0.025 V
A1
Cu
rren
t / A
Potential vs. Hg/HgO / V
C1
- 0.430 V
(c) TX30
-0.6 -0.5 -0.4 -0.3 -0.2 -0.1 0.0 0.1 0.2 0.3-0.004
-0.002
0.000
0.002
0.004
- 0.085 V
A1
Cu
rren
t / A
Potential vs. Hg/HgO / V
(d) TW15
C1
- 0.450 V
Fig. 6—Cyclic voltammograms of the EMD samples (a) containing no surfactant, (b) Triton (TX15), (c) Triton (TX30), and (d) Tween (Tw15).
234—VOLUME 1E, SEPTEMBER 2014 METALLURGICAL AND MATERIALS TRANSACTIONS E

with a larger amount of potassium. For Tw-addedEMD, Figure 9(d), except the regions 3 and 4, allregions are identified as K� free MnO2 suggesting onlya small amount of potassium ion is present. Almost allthe reported literature on MnO2 in alkaline electrolytedescribe either protonation[24–27] or lithiation[3,15,28] asthe mechanism involved during discharge but anunusual observation of potassium ion insertion or assurface film formation is evidenced in this study.Interestingly, the extent of potassium ion increases withTX-100 as the surfactant, and this conclusion is furthersupported by Rutherford backscattering experiments,discussed in the next section. The observed microscopyresults are in parallel with the cyclic voltammogramsand discharge behavior, indicating that the surfactantfacilitates K+ insertion.
A close inspection of Figures 7(a) and (d) reveals thatthe discharge curves for surfactant-free and Tw-added
EMD materials exhibit a sharp drop in potential at1.3 V, although the cells have been tested under identicalconditions. These curves in Figures 7(a) and (d) showtypical anodic limited behavior, suggestive of passiv-ation of zinc on the surface of the MnO2 cathode. Thishas been confirmed through the simultaneous PIXE andRBS analyses of the EMD material before and afterdischarge. A typical bar graph containing several stepscorresponding to elements such as K, Mn, Zn, and C isgiven in Figure 10. The variation in the quantity ofmanganese and carbon across the electrodes before andafter discharge appears to be fairly constant. However,it is quite important to note the differences seen in theconcentrations of the potassium and zinc. For theelectrode before discharge, the concentrations of potas-sium and zinc are nil, as is expected given there is nopotassium and zinc in the fresh sample. For thedischarged electrode, the concentration of potassiumion is increased, particularly in the case of TX-100 as thesurfactant. This reflects the TEM microscopy analysisand further supports the potassium intercalation. Afurther notable point in the RBS analysis, in Figure 10,is the high concentration of zinc for EMD0 and Tw30
electrodes. This shows that the zinc has been precipi-tated on the cathode as Zn(OH)2, thus inhibiting furtherelectron transfer. Hence, the two cells are anode limitedwith a sharp fall of potential as seen in the dischargecurve Figures 7(a) to (d).The cumulative discharge capacities of the EMD samples
in the presence and absence of surfactant TX and Tw areshown in Figure 11. The charge and discharge character-istics enable evaluation of the suitability of the preparedEMD as a battery material. In Figure 6, it was clearlyindicated that surfactant works up to an optimum level,abovewhich an alteration in the cyclic behavior is observed.Interestingly both surfactants employed in this workshowed their best performance at their 15 t (CMC 9 15)value. EMDTX15 and EMDTw15 showed cumulative dis-charge capacity of ~2213 and ~2242 mAh g�1 at 15th cycle,respectively, against a cumulative discharge capacity of~1300 mAh g�1 for EMD0 at 11th cycles which remainconstant so far.Thedischarge capacity of 280 mAh g�1wasobtained from the EMD0 against 170 mAh g�1 for thereported values for EMD in the absence of additives.[52] Theinitial discharge capacity, above and below which thedischarge capacity decreases, of 270 mAh g�1was observedfor EMDTX15, where as the initial discharge capacity ofEMDTw15 was 240 mAh g�1, somewhat less than theEMDTw10 (275 mAh g�1). In spite of this, the EMDTX15
showed better cycling stability and higher cumulativedischarge capacity than EMD0, EMDTw10, and EMDTw30.The available cumulative discharge capacity forEMD0after10th cycles was quite low of ~1300 mAhg g�1, so the cyclingstudies were halted well before the cut-off range. Thecharacteristic property of non-ionic surfactant is a tendencyto accumulate in electrolytic solution that enhances theadsorption. In the case of TX, nucleation and growth ofelectrodepositedMnO2grains in apreferential directionwaspromoted while favoring a high surface area of the deposit.TX-100 renders the surfacemore hydrophobic and acts as amolecular spacer[21,53] through the steric factor of the phenylring,while theTwcounterpart is without a phenyl ring. This
0 100 200 3000.0
0.4
0.8
1.2
1.6
(d)(c)
(b)(a)
Cel
l Po
ten
tial
/ V
Discharge Capacity / mAh g -1
Fig. 7—First discharge behavior of the EMD samples (a) containingno surfactant, (b) Triton (TX15), (c) Triton (TX30), and (d) Tween(Tw30).
20 30 40 50 60 70
C
(d)
(c)
(b)
2 theta / degrees
Mn3O4MnO OH
MnO2
(a)
C
Carbon
ΔΟ
•
Ο
Ο
Ο
••
•
Ο
Ο
Ο
•
•
Ο
Ο
Ο
•
•
•
Ο
Ο
Ο
•
•
•
Δ
Δ
Δ •••
•Ο
ΟΟΟ
Δ
Fig. 8—X-ray diffraction patterns of the discharged EMD samples(a) containing no surfactant, (b) Triton (TX15), (c) Triton (TX30),and (d) Tween (Tw30).
METALLURGICAL AND MATERIALS TRANSACTIONS E VOLUME 1E, SEPTEMBER 2014—235

difference in structure observed for non-ionic surfactant leda role for Mn deposition by facilitating uniform currentdistribution resulting in Mn-TX complexes. Hence, thepresence of TX molecules facilitated the superior electro-chemical performance of discharge capacity 275 mAh g�1.The enhancement of cycle life in the presence of the two
surfactants may be attributed to the following: EMDTX15
offers high surface area with large pore size (mesopores)with nanofibrous morphology (as per the FESEM images)which decreases the solid state diffusion path length ofprotons and electrons into and out of the bulk ofMnO2, ashappened in MnO2 films.[54] As explained before, the largepore size facilitates the proton diffusion inside the MnO2
electrode, during charge–discharge cycling resulting goodcyclic stability. Second in terms of conductance, EMDTX15
consists of smaller particles with porous structures, andEMDTw15 composedof sphericalnanoparticles (as shown inFESEM image), which allow better contact with the
Fig. 9—TEM images of EMD (c-MnO2) samples (a) before and (b) after discharge containing no surfactant, (c) discharged Triton (TX30), and(d) discharged Tween (Tw15).
0
5
10
15
20
25
EMD (TX30
) EMD (TW30
)
Before / After discharge
Before / After discharge
Rel
ativ
e C
om
po
siti
on
/ at
. (%
)
KMnZnC
Before / After discharge
EMD0
Fig. 10—Simultaneous PIXE and RBS analyses of the possible ele-ments present in the discharged EMD samples containing no surfac-tant, Triton (TX30), and (d) Tween (Tw30).
236—VOLUME 1E, SEPTEMBER 2014 METALLURGICAL AND MATERIALS TRANSACTIONS E

graphite powder. Thermal stability of EMDTX15 andEMDTw15 is also responsible for the good cyclic behaviorofEMDTX15 andEMDTw15 in comparison toEMD0,whichresists the capacity fading during charge–discharge cycling.
IV. CONCLUSIONS
EMD samples have been prepared from purifiedmanganese sulfate solution obtained from manganesecake in the presence or absence of surfactants. Thesurfactants played a role in the intercalation behavior. Aunique observation of potassium ion intercalation inc-MnO2 structure is reported. From the present study,the following conclusions can be drawn.
1. EMD samples prepared in the presence and absenceof surfactants show the characteristic peak ofc-MnO2 and are electrochemically active. Additionof surfactant and surfactant type (either TX-100 orTw-20) has no significant effect on the crystal struc-ture of EMD.
2. FESEM images indicate that presence of surfactantsin the electrolytic bath plays a key role in control-ling the growth and nucleation of the depositedmaterial and hence modifies the structure accord-ingly giving porous morphology to the material.
3. The presence of surfactant enhances the electro-chemical activity of EMD, not only by modifyingthe structure but also by increasing the BET surfacearea and porosity of the EMD samples. EMDdoped with surfactants has good cycle life in spiteof a decrease in initial discharge capacity, relativeto surfactant-free EMD.
4. The presence of surfactant affects the thermal sta-bility of the material and also brings mild changesin spectroscopic analytics. There optimum concen-tration of surfactant must be essential for the posi-tive consequences in the performance and behaviorof the EMD.
5. TEM imaging and RBS analysis showed evidencefor potassium intercalation with the extent beinggreater for TX-100 as the surfactant. The
2 4 6 8 10 12 14 160
50
100
150
200
250
300
edc
b
Dis
char
ge c
apac
ity(m
Ah
g-1)
Cycle number
a
0 2 4 6 8 10 12 14 160
250
500
750
1000
1250
1500
1750
2000
2250
cb
de
Cum
ulat
ive
dis
char
ge c
apac
ity(m
Ahg
-1)
Cycle number
a
0 2 4 6 8 10 12 14 160
50
100
150
200
250
300
d
c
baDis
char
ge c
apac
ity(
mA
h g-1
)
Cycle number
0 2 4 6 8 10 12 14 160
250
500
750
1000
1250
1500
1750
2000
2250
cd
b
Cum
ulat
ive
dis
char
ge c
apac
ity (
mA
hg-1
)
Cycle number
a
(a) (b)
(c) (d)
Fig. 11—(a) Discharge capacities versus cycling behavior of (a) EMD0, (b) EMDTX30, (c) EMDTX5, (d) EMDTX10, (e) EMDTX15. (b) Cumulativedischarge capacities versus cycling behavior of (a) EMD0, (b) EMDTX30, (c) EMDTX5, (d) EMDTX10, (e) EMDTX15. (c) Discharge capacities ver-sus cycling behavior of (a) EMD0, (b) EMDTw30, (c) EMDTw10, (d) EMDTw15. (d) Cumulative discharge capacities versus cycling behavior of(a) EMD0, (b) EMDTw30, (c) EMDTw10, (d) EMDTw15.
METALLURGICAL AND MATERIALS TRANSACTIONS E VOLUME 1E, SEPTEMBER 2014—237

discharged product of the EMD material showedevidence of protonation.
ACKNOWLEDGMENTS
The authors are thankful to Prof. B.K. Mishra,Director, CSIR-IMMT, Bhubaneswar, for permittingto publish the paper. Authors also thank to the Minis-try of Earth Sciences for partly sponsoring the work.The first author, A. Biswal is thankful to Council ofScientific and Industrial Research (CSIR), India forawarding Senior Research Fellowship. The author(M.M.) wishes to thank both the Australian ResearchCouncil (ARC) and Australian Nuclear Science andEngineering (AINSE/AINGRA 08048) for providingexperimental time to enable work on TEM and RBSfacilities.
REFERENCES1. O. Schilling and J.R. Dahn: J. Appl. Crystallogr., 1998, vol. 31,
pp. 396–406.2. Y. Chabre and J. Pannetier: Prog. Solid State Chem., 1995, vol. 23,
pp. 1–130.3. M. Minakshi, P. Singh, T.B. Issa, S. Thurgate, and R. De Marco:
J. Power Sources, 2004, vol. 138, pp. 319–22.4. D. Balachandran, D. Morgan, G. Ceder, and A. van de Walle: J.
Solid State Chem., 2003, vol. 173, pp. 462–75.5. A. Urfer, G.A. Lawrance, and D.A.J. Swinkles: J. Appl. Electro-
chem., 1997, vol. 27, pp. 667–72.6. K. Kordesch and M. Weissenbacher: J. Power Sources, 1994,
vol. 51, pp. 61–78.7. W. Jantscher, L. Binder, D.A. Fiedler, R. Andreaus, and K.
Kordesch: J. Power Sources, 1999, vol. 79, pp. 9–18.8. S. Chou, F. Cheng, and J. Chen: J. Power Sources, 2006, vol. 162,
pp. 727–34.9. K. Kordesch, W. Harer, W. Taucher, and K. Tomantscher: Pro-
ceedings of 22nd Intersociety Energy Conversion Engineering Con-ference, 1987, vol. 2, p. 1102.
10. H. Malankar, S.S. Umare, K. Singh, and M. Sharma: J. SolidState Electrochem., 2010, vol. 14, pp. 71–82.
11. A.M.A. Hashem, K.S. Abou-El-Sherbini, S. Zein-El-Abedin, andH. Abbas: J. Mater. Sci. Technol., 2006, vol. 22, pp. 25–30.
12. A.M.A. Hashem, K.S. Abou-El-Sherbini, M.H. Askar, and A.M.Hashim: J. Mater. Sci. Technol., 2001, vol. 17, pp. 351–54.
13. A.G. Kholmogorov, A.M. Zhyzhaev, U.S. Kononov, G.A.Moiseeva, and G.L. Pashkov: Hydrometallurgy, 2000, vol. 56,pp. 1–11.
14. J.M.M. Paixdo, J.C. Amaral, L.E. Memoria, and L.R. Freitas:Hydrometallurgy, 1995, vol. 39, pp. 215–22.
15. M. Minakshi, P. Singh, T.B. Issa, S. Thurgate, and R. De Marco:J. Power Sources, 2004, vol. 130, pp. 254–59.
16. A. Biswal, K. Sanjay, M.K. Ghosh, T. Subbaiah, and B.K.Mishra: Hydrometallurgy, 2011, vol. 110, pp. 44–49.
17. Suhasini and A.C. Hegde: J. Electroanal. Chem., 2012, vol. 676,pp. 35–39.
18. Y. Li, H. Xie, J. Wang, and L. Chen: Mater. Lett., 2011, vol. 65,pp. 403–05.
19. R. Jiang, T. Huang, J. Liu, J.H. Zhuang, and A. Yu: Electrochim.Acta, 2009, vol. 54, pp. 3047–52.
20. H. Zhang, Y. Wang, C. Liu, and H. Jiang: J. Alloys Compd., 2012,vol. 517, pp. 1–8.
21. S. Devaraj and N. Munichandraiah: J. Electrochem. Soc., 2007,vol. 154, pp. A901–A909.
22. M. Ghaemi, L. Khosravi-Fard, and J. Neshati: J. Power Sources,2005, vol. 141, pp. 340–50.
23. R. Khayat Ghavami, Z. Rafiei, and S.M. Tabatabaei: J. PowerSources, 2007, vol. 164, pp. 934–46.
24. K. Kordesch, J. Gsellmann, M. Peri, K. Tomantschger, and R.Chemelli: Electrochim. Acta, 1981, vol. 26, pp. 1495–1504.
25. A. Kozawa and J.F. Yeager: J. Electrochem. Soc., 1965, vol. 112,pp. 959–63.
26. H.S. Wroblowa and N. Gupta: J. Electraonal. Chem., 1987,vol. 238, pp. 93–102.
27. Y.F. Yao, N. Gupta, and H.S. Wroblowa: J. Electroanal. Chem.,1987, vol. 223, pp. 107–17.
28. M. Minakshi, P. Singh, and D.R.G. Mitchell: J. Electrochem. Soc.,2007, vol. 154, pp. A109–13.
29. A. Biswal, B.C. Tripathy, T. Subbaiah, D. Meyrick, and M.Minakshi: J Solid State Electrochem., 2013, vol. 17, pp. 1349–56.
30. S. Nijjer, J. Thonstad, and G.M. Haarberg: Electrochim. Acta,2000, vol. 46, pp. 395–99.
31. W.H. Kao and V.J. Weibel: J. Appl. Electrochem., 1992, vol. 22,pp. 21–27.
32. F.-Q. Xue, Y.-L. Wang, W.-H. Wang, and X.-D. Wang: Electro-chim. Acta, 2008, vol. 53, pp. 6636–42.
33. Z. Kozarac, S. Nikolic, I. Ruzic, and B. Cosovic: J. Electroanal.Chem., 1982, vol. 137, pp. 279–92.
34. I. Felhosi, J. Telegdi, G. Palinkas, and E. Kalman: Electrochim.Acta, 2002, vol. 47, pp. 2335–40.
35. D.S. Wen and B.X. Wang: Int. J. Heat Mass Transf., 2002, vol. 45,pp. 1739–47.
36. F.J. Srydlowskl, D.L. Dunmire, E.E. Peck, R.L. Eggers, and W.R.Matson: Anal. Chem., 1981, vol. 53, pp. 193–96.
37. A.M. Rodriguez, M.A.C. Vilchez, and R.D. Alvarez: J. ColloidInterface Sci., 1997, vol. 187, pp. 139–47.
38. B. Factor, B. Muegge, S. Workman, E. Bolton, J. Bos, and M.M.Richter: Anal Chem., 2001, vol. 73, pp. 4621–24.
39. H. Abbas and S.A. Nasser: J. Power Sources, 1996, vol. 58, pp. 15–21.
40. J.B. Fernandes, B.D. Desai, and V.N.K. Dalal: Electrochim. Acta,1983, vol. 28, pp. 309–15.
41. M.V. Ananth, S. Pethkar, and K. Dakshinamuthi: J. PowerSources, 1998, vol. 75, pp. 278–82.
42. P. Ruetschi: J. Electrochem. Soc., 1984, vol. 131, pp. 2737–44.43. J. Fitzpatrick, L.A.H. Maclean, D.A.J. Swinkels, and F.L. Tye: J.
Appl. Electrochem., 1997, vol. 27, pp. 243–53.44. M.B. McBride: Soil Sci. Soc. Am., 1987, vol. 51, pp. 1466–72.45. J.P. Zheng, P.J. Cygan, and T.R. Jow: J. Electrochem. Soc., 1995,
vol. 142, pp. 2699–2703.46. J.H. Sharp and D.M. Tinsley: J. Therm. Anal., 1971, vol. 3, pp. 43–
48.47. J.B. Fernandes, B.D. Desai, and V.N.K. Dalal: J. Power Sources,
1985, vol. 16, pp. 1–43.48. M.I. Zaki, M.A. Hassan, L. Pasupulety, and K. Kumari: Ther-
mochim. Acta, 1997, vol. 303, pp. 171–80.49. J.O. Besenhard, J. Gurtler, P. Komenda, and A. Paxions: J. Power
Sources, 1987, vol. 20, pp. 253–58.50. H. Adelkhani and M. Ghaemi: Solid State Ion., 2008, vol. 179,
pp. 2278–83.51. S.M. Davis, W.L. Bowden, and T.C. Richards: J. Power Sources,
2005, vol. 139, pp. 342–50.52. M.M. Thackeray: Prog. Solid State Chem., 1997, vol. 25, pp. 1–71.53. P. Matejka, B. Vickova, J. Vohlidal, P. Pancoska, and V.
Baumruk: J. Phys. Chem., 1992, vol. 96, pp. 1361–66.54. S.C. Pang, M.A. Anderson, and T.W. Chapman: J. Electrochem.
Soc., 2000, vol. 147, pp. 444–50.
238—VOLUME 1E, SEPTEMBER 2014 METALLURGICAL AND MATERIALS TRANSACTIONS E