Embed Size (px)
Citation preview

University of Arkansas, FayettevilleScholarWorks@UARK
Theses and Dissertations
12-2011
Effect of Nutrient Supplements on CucumberFermentation by Lactic Acid BacteriaShruti TripuraneniUniversity of Arkansas, Fayetteville
Follow this and additional works at: http://scholarworks.uark.edu/etd
Part of the Food Chemistry Commons
This Thesis is brought to you for free and open access by ScholarWorks@UARK. It has been accepted for inclusion in Theses and Dissertations by anauthorized administrator of ScholarWorks@UARK. For more information, please contact [email protected], [email protected].
Recommended CitationTripuraneni, Shruti, "Effect of Nutrient Supplements on Cucumber Fermentation by Lactic Acid Bacteria" (2011). Theses andDissertations. 160.http://scholarworks.uark.edu/etd/160

EFFECT OF NUTRIENT SUPPLEMENTS ON CUCUMBER FERMENTATION BY
LACTIC ACID BACTERIA

EFFECT OF NUTRIENT SUPPLEMENTS ON CUCUMBER FERMENTATION BY
LACTIC ACID BACTERIA
A thesis submitted in partial fulfillment
of the requirements for the degree of
Master of Science in Food Science
By
Shruti Tripuraneni
University College of Technology, Osmania University,
Bachelor of Technology in Food Technology, 2008
December 2011
University of Arkansas
ABSTRACT
Lactic acid bacteria (LAB) are important industrial microorganisms involved in
fermentation of food and beverage products. The strict fermentative growth of LAB has complex
requirements of various nutrients including amino acids, vitamins and minerals. Information
about the effect of these nutrients on the growth of LAB in cucumber fermentation is not readily
available. It is evident, from previous research that certain nutrients like; leucine, isoleucine,
tryptophan, valine, biotin, nicotinic acid, pantothenic acid, riboflavin, manganese and
magnesium are beneficial for LAB growth, but are not provided in sufficient quantities by the
cucumber in the brine.
The objective of this study was to determine the efficacy of (1) the above mentioned
nutrients (2) the most effective concentrations of biotin, isoleucine and valine alone and (3)
combination of biotin, isoleucine and valine with cucumber fermentation brine, on the
production of LAB and lactic acid in brine.
The yield of LAB was determined from microscopical counts using a hemacytometer,
lactic acid concentration, dry weight and the final sugar concentration in the brine was
determined. The first three trials established that biotin, valine and isoleucine improved LAB
growth. Efficacy of five different concentrations each of biotin, valine and isoleucine in
cucumber juice was determined in trial four. Biotin and isoleucine treatments at three different
concentrations, in trial four, were equally effective on LAB growth; hence the lowest
concentrations of 614 nM of biotin and 0.76 mM of isoleucine were selected; whereas valine
treatments showed a relative small increase in the LAB growth with increase in concentration
and 1.17 mM of valine was the most effective of all the valine treatments. These optimized

concentrations of nutrients were used in trial five, in different combinations. Of these, biotin and
valine treatments when used individually or in combination showed a significant increase in
LAB growth and the rate of production and concentration of lactic acid in the brine. These
results indicated that the addition of biotin and valine potentially increased the number of LAB.
Additional research is required using whole cucumbers to develop effective treatments.

This thesis is approved for recommendation
to the Graduate Council
Thesis Director:
__________________________
Dr. Ron. W. Buescher
Thesis Committee:
___________________________
Dr. Edward. E. Gbur
___________________________
Dr. Luke. R. Howard

THESIS DUPLICATION RELEASE
I hereby authorize the University of Arkansas Libraries to duplicate this thesis when needed for
research and/or scholarship.
Agreed ________________________________
Shruti Tripuraneni
Refused _______________________________
Shruti Tripuraneni

ACKNOWLEDGEMENT
It is my honor to express my deep and sincere gratitude to my advisor, D. Ron W.
Buescher. His wide knowledge, logical thinking and encouragement have been of great help for
me. I am grateful to my committee member, Dr. Edward E. Gbur, for his valuable guidance,
constructive comments and for his support throughout this work. I owe my deepest gratitude to
Dr. Luke R. Howard, for being in my masters committee.
My sincere thanks to Dr. Mi J. Cho for her help also for sharing her experiences which
were of great value during this study. Special thanks to Dr. Dinesh Babu. I am grateful to him for
all the help and suggestions he has given throughout thesis writing. I also acknowledge Madison
R. Weskamp for her timely help and making this work possible.
I would like to extend my sincere gratitude to my family and my friends Komi and Sai
for all the love and encouragement. Finally, I would like to thank all my friends at the
University of Arkansas for giving me a home away from home.

DEDICATION
I would like to dedicate this work to all my teachers. I am indebted to many of my
teachers who inspired me throughout my academic career. My heartfelt thanks to all my teachers
for instilling all the important values of life.

TABLE OF CONTENTS
Page
I. INTRODUCTION 1
II. CHAPTER
I. LITERATURE REVIEW 3
OBJECTIVES 16
II. METHODS AND MATERIALS 18
Preparation of Fermentation stock solution 18
Treatment 19
Chemical Assay 22
Microbiological Assay 25
Statistical Analysis 27
III. RESULTS: IDENTIFICATION OF CERTAIN AMINO ACIDS, VITAMINS
AND MINERALS THAT ENHANCE LACTIC ACID BACTERIA
FERMENTATION OF CUCUMBER JUICE
Results: Amino Acids 29
Results: Vitamins 37
Results: Minerals 45
IV. FURTHER EXAMINATION OF CONCENTRATIONS OF BIO, ILE AND
VAL THAT ENHANCE LACTIC ACID BACTERIA FERMENTATION OF
CUCUMBER JUICE
Results 52
V. EFFECT OF BIOTIN, ISOLEUCINE AND VALINE ALONE AND IN
COMBINATIONS ON LACTIC ACID BACTERIA FERMENTATION OF
CUCUMBER JUICE
Results 62
VI. DISCUSSION AND SUMMARY 69
REFERENCES 74
APPENDIX 81
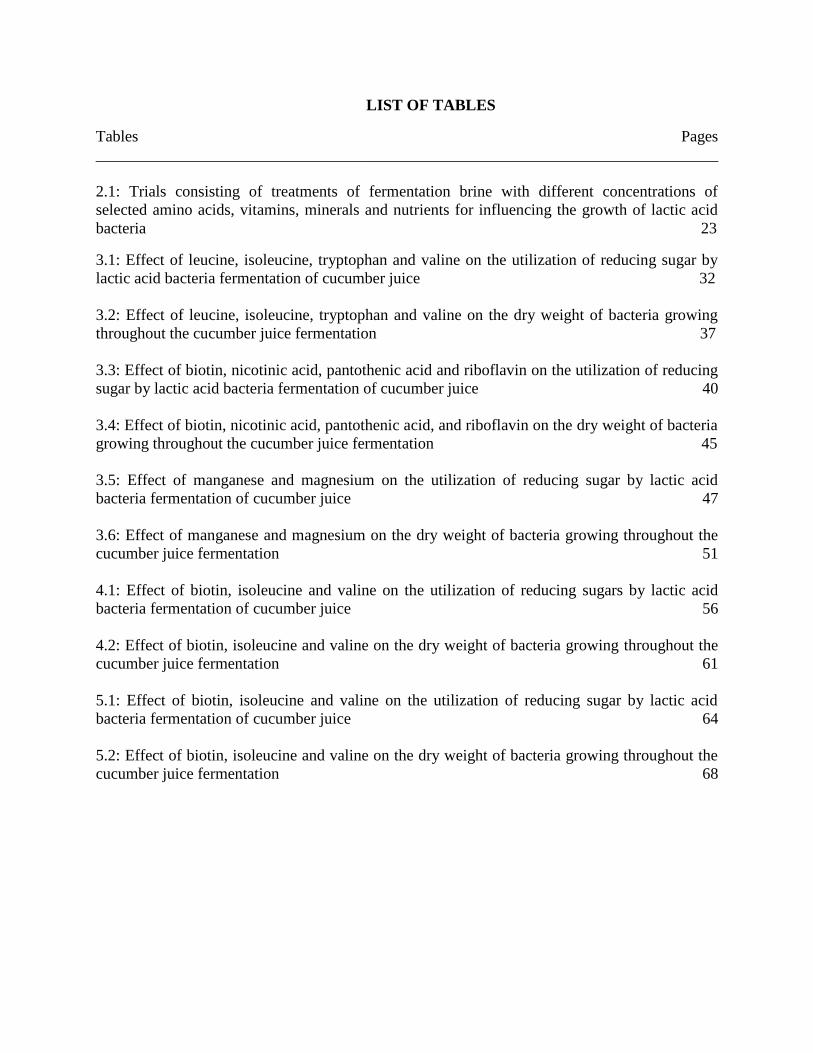
LIST OF TABLES
Tables Pages
______________________________________________________________________________
2.1: Trials consisting of treatments of fermentation brine with different concentrations of
selected amino acids, vitamins, minerals and nutrients for influencing the growth of lactic acid
bacteria 23
3.1: Effect of leucine, isoleucine, tryptophan and valine on the utilization of reducing sugar by
lactic acid bacteria fermentation of cucumber juice 32
3.2: Effect of leucine, isoleucine, tryptophan and valine on the dry weight of bacteria growing
throughout the cucumber juice fermentation 37
3.3: Effect of biotin, nicotinic acid, pantothenic acid and riboflavin on the utilization of reducing
sugar by lactic acid bacteria fermentation of cucumber juice 40
3.4: Effect of biotin, nicotinic acid, pantothenic acid, and riboflavin on the dry weight of bacteria
growing throughout the cucumber juice fermentation 45
3.5: Effect of manganese and magnesium on the utilization of reducing sugar by lactic acid
bacteria fermentation of cucumber juice 47
3.6: Effect of manganese and magnesium on the dry weight of bacteria growing throughout the
cucumber juice fermentation 51
4.1: Effect of biotin, isoleucine and valine on the utilization of reducing sugars by lactic acid
bacteria fermentation of cucumber juice 56
4.2: Effect of biotin, isoleucine and valine on the dry weight of bacteria growing throughout the
cucumber juice fermentation 61
5.1: Effect of biotin, isoleucine and valine on the utilization of reducing sugar by lactic acid
bacteria fermentation of cucumber juice 64
5.2: Effect of biotin, isoleucine and valine on the dry weight of bacteria growing throughout the
cucumber juice fermentation 68

LIST OF FIGURES
Figures Pages
__________________________________________________________________________
3.1: Effect of leucine, isoleucine, tryptophan and valine on lactic acid production during
cucumber fermentation 31
3.2: Effect of leucine, isoleucine, tryptophan and valine on the live lactic acid bacteria
microscopic count during fermentation of cucumber juice 35
3.3: Effect of leucine, isoleucine, tryptophan and valine on the total number of lactic acid
bacteria in fermented cucumber juice 36
3.4: Effect of biotin, nicotinic acid, pantothenic acid and riboflavin on lactic acid production
during cucumber fermentation 39
3.5: Effect of biotin, nicotinic acid, pantothenic acid and riboflavin on the live lactic acid bacteria
microscopic count during fermentation of cucumber juice 43
3.6: Effect of biotin, nicotinic acid, pantothenic acid and riboflavin on the total number of lactic
acid bacteria in fermented cucumber juice 44
3.7: Effect of manganese and magnesium on lactic acid production during cucumber juice
fermentation 46
3.8: Effect of manganese and magnesium on the live lactic acid bacteria microscopic count
during fermentation of cucumber juice 49
3.9: Effect of manganese and magnesium on the total number of lactic acid bacteria in fermented
cucumber juice 51
4.1: Effect of biotin, isoleucine, valine on lactic acid production during cucumber
fermentation 55
4.2: Effect of biotin, isoleucine and valine on the live lactic acid bacteria microscopic count
during fermentation of cucumber juice 59
4.3: Effect of biotin, isoleucine and valine on the total number of lactic acid bacteria in
fermentation of cucumber juice 60
5.1: Effect of biotin, isoleucine and valine on lactic acid production during cucumber
fermentation 63
5.2: Effect of biotin, isoleucine and valine on the live lactic acid bacteria microscopic count
during fermentation of cucumber juice 66

5.3: Effect of biotin, isoleucine and valine on the total number of lactic acid bacteria in
fermentation of cucumber juice 69

1
INTRODUCTION
The lactic acid bacteria (LAB) present in small numbers on fresh cucumbers
produce lactic acid by fermentation. The lactic acid inhibits the growth of undesirable
microorganisms. Sugar is the most essential nutrient for fermentation where sugars, glucose and
fructose are converted to lactic acid by LAB. Previous research on the micronutrient
requirements of LAB growth has established that amino acids, vitamins and minerals increase
the population of LAB and the concentration of lactic acid produced in the brine. These nutrients
have to be provided to LAB by the substrate or they need to be supplemented.
Some work has been carried out on determining the nutritional requirements of
LAB, predominantly Lactobacillus plantarum as it is the major contributor of lactic acid in
cucumber fermentation (Pederson and Albury 1969; Costilow and others 1956). Previous
researchers have demonstrated that L. plantarum depends on cucumber as a source of amino
acids (Leucine, Isoleucine, Typtophan and Valine), vitamins (Biotin, Nicotinic acid, Pantothenic
acid and Riboflavin) and minerals (Manganese and Magnesium) which are essential for its
growth (Costilow and Fabian 1953 a, b, c; Kashket 1987; Moretrow and others 1998; Lu and
others 2002; Weymarn and others 2002). de Man, Rogosa and Sharpe (MRS) basal medium is a
selective media for LAB growth which contains amino acids, vitamins and minerals in required
concentrations. For the LAB fermenting cucumbers the above mentioned micro nutrients are not
provided in sufficient concentrations by the cucumber fruit in comparison with their
concentration in MRS basal agar. Brine was supplemented with the above nutrients based on
their concentration in MRS basal agar (Appendix: Table 2) as it is a selective growth media for
LAB and promotes its luxuriant growth. The primary goal of this study was to find the effect of
different concentrations of the nutrients supplemented on LAB growth. Increase in the LAB

2
numbers may increase the concentration and the rate of lactic acid production. Any of these
nutrients could be a potential supplement to increase the LAB number and the lactic acid
concentration in cucumber fermentation.
3
CHAPTER I
LITERATURE REVIEW
OVERVIEW OF CUCUMBER FERMENTATION
Fermentation of cucumbers is advantageous over processing techniques like
pasteurization and refrigeration since it provides preservation and bulk storage of seasonal
production (Fleming 1984). Lactic acid bacteria (LAB) metabolize sugars in cucumber
fermentation and make them unavailable for spoilage/pathogenic organisms and extend
cucumber shelf life.
During industrial fermentation, the harvested cucumbers are placed in large
outdoor open tanks with salted brine to equilibrate to approximately 5-10% sodium chloride
concentration and are allowed to ferment naturally by indigenous LAB (Breidt and others 2007).
After placing the cucumbers in the brine, sugar and water soluble nutrients diffuse out of the
cucumber tissue into the surrounding brine within a period of 24 hrs and salt diffuses into the
cucumber tissue until equilibrium is attained (Costilow and Fabian 1953 b). The nutrients in the
brine from the cucumber favor the growth of LAB which are acid and salt tolerant.
Homofermentative strains of LAB metabolize glucose in cucumber producing about 85%
of the lactic acid (Kandler and Weiss 1986; Mundt 1984) and heterofermentative strains produce
lactic acid, carbon dioxide, ethanol and/or acetic acid. Fructose in cucumber is oxidized by
homofermentative bacteria to lactate via lactate dehydrogenase (Li 2006) and heterofermentative
bacteria metabolize fructose to mannitol via mannitol dehydrogenase (Hammes and others 1991),
which is converted to lactic acid, ethanol acetate and carbon dioxide (Li 2006).
The high sodium chloride concentration and low pH prevents growth of spoilage causing
microorganisms. The fermentation tanks are left open to the atmosphere for the ultraviolet rays

4
to penetrate the brine and prevent oxidative yeast and mold growth (Fleming and others 1988).
Carbon dioxide in the brine responsible for bloater formation in cucumbers is reduced by
sparging with air (Fleming and others 1988).
By the end of fermentation of cucumbers, the brine pH is reduced to 3.3-3.5 with most
reducing sugars converting to lactic acid, and there may be a change in the appearance of their
flesh from opaque to translucent. The product is removed and salt is generally leached to a lower
salt concentration of 3-5% (Fleming and others 1987), then the fermented cucumbers are
packaged with acidified (vinegar) brine and flavoring.
MICROORGANISMS INVOLVED IN CUCUMBER FERMENTATION
Lactic acid bacteria are non-sporing, cocci or rods in shape and ferment sugars to produce
lactic acid (Axelsson 2004). Sodium chloride concentration of the brine controls type and
number of microflora including LAB, yeast, and coliform participating in fermentation
(Axelsson 2004; Costilow and Fabian 1953b). The microorganisms indigenous to cucumber
fermentation are Lactobacillus plantarum, Pediococcus cerevisiae, Leuconostoc mesenteroides,
Streptococcus faecalis and Lactobacillus brevis (Maki 2004).
The micro-floral population of fresh cucumbers is dominated by gram-negative aerobic
bacteria, coliforms and yeast LAB is present in insignificant numbers initially (Nout and
Rombouts 1992; Font de Valdez and others 1990; Etchells and others 1975) and proliferate with
rapid production of lactic acid. Acid produced acts on the spoilage and pathogenic organism’s
cytoplasmic membrane and interferes with the maintenance of the membrane during
fermentation (Caplice and Fitzgerald 1999). The high NaCl concentrations suppress the growth
of gram-negative aerobic bacteria. Coliform and yeast counts decrease within the first 5 days of

5
fermentation (Costilow and Fabian 1953a) and LAB being acid tolerant multiplies and
outnumbers the initial microflora.
Among the LAB species growing in cucumber fermentation, L. plantarum is the major
contributor of lactic acid and not L. mesenteroides or other gas producing species of
Lactobacillus (Etchells and Jones 1946; Costilow and others 1956). L. plantarum also completes
the final state of cucumber fermentation (Pederson and Albury 1969). The comparatively low
growth-limiting internal pH of L. plantarum and ability to maintain a pH gradient across the cell
membrane at high organic acid concentration may contribute to its acid-tolerance (McDonald
and others 1990). It produces energy and lactic acid via Embden-Meyerhof pathway on
metabolizing hexose; with energy produced used for cell maintenance and cell division (Lelong
and others 1991; Kemp and others 1989). In general, L. plantarum is auxotropic for many
vitamins and amino acids (Koser 1968; Ledesma and others 1977; Morishita and others 1981).
Strains isolated from cucumber fermentations have also shown a positive effect on their growth
rate in presence of these growth factors (Rosen and Fabian 1953; Rogosa and others 1961).
Considering that L. plantarum is the rate determining factor in cucumber fermentation, it is
important that the study on nutritional requirements of the micro-flora in cucumber fermentation
should be designed based on its nutritional requirements.

6
FACTORS AFFECTING LACTIC ACID BACTERIA GROWTH AND METABOLISM
IN CUCUMBER FERMENTATION
According to Orla-Jensen (1942) the mode of sugar fermentation (homofermentation or
heterofermentation), morphology (cocci or rods) and variation in the growth temperature and the
degree of sugar utilization are the basis of LAB classification. The physiology of LAB has
always been of interest as these bacteria are involved in the acidification of food. But LAB can
change their metabolism to suit different conditions leading to different end-products. In general,
LAB growth is primarily influenced by various factors such as pH of the media, fermentation
temperature, media composition (sugars and nutrients) and their mode of fermentation (Etchells
and others 1975; Hofvendahl and Hahn-Hägerdal 2000; Mussatto and others 2008).
pH
LAB are active over a wide pH range (Axelsson 2004). LAB maintain an alkaline
cytoplasm when compared to its medium of growth. The ability to regulate the cytoplasmic or
intracellular pH is one of the most important physiological characteristics of LAB which makes
them acid tolerant when compared to numerous bacterial species (Hutkins and Nannen 1993;
McDonalds and others 1990). The organic acids produced by acid tolerant LAB enter the cells of
acid-non-tolerant microflora consequently collapsing the energy generated by the transfer of
proton and electron across an energy- transducing membrane used for chemical or mechanical
work in a cell. Collapsing this energy inhibits nutrient transport in the cell hence killing the
microbes (Freese and others 1973; Hunter and Segel 1973).
The optimum internal pH for L. plantarum growth in cucumber fermentation is 6.0-6.5
(Li 2006). It stops multiplying at an internal pH 4.6 to 4.8 irrespective of the growth media

7
(McDonald and others 1990) which gives it an advantage over less acid tolerant microorganisms.
L. plantarum maintains a pH gradient despite high lactic and acetic acid concentrations; which
contributes to its ability to complete cucumber fermentation (McDonald and other 1990).
The buffering capacity of the vegetables affects the extent of multiplication of the
predominant culture fermenting the substrate (Li 2006). In cucumber fermentation when the
brine pH (L. plantarum external pH) declines to around 3.3 to 3.5, LAB fermentation ceases
(Passos and others 1994). Preventing the external pH of the medium (brine in this study) from
falling to 3.5 and maintaining a pH above 4.0 might extend the period of fermentation and
increase the number of L. plantarum in the brine. Several methods have been adopted including
using sodium acetate and calcium acetate as pH buffers (Fleming and others 1978) to assure
complete fermentation of sugars in cucumber.
Fermentation Temperature
Cucumber fermentation is carried only in the warm months of March through September
in the US, and it is important that all the fermentation is carried out when the brine temperature
is around 16 to 30°C (Etchells and Jones 1946). Temperature for vegetable fermentation is
optimized depending on the predominant culture growing during fermentation. L. plantarum
predominant in cucumber fermentation rapidly grows at 18°C (Raccach 1982). The optimum
temperature for cucumber fermentation is 24-30°C favoring rapid lactic acid production and
increased rate of LAB growth. The curing and fermentation is retarded to a large extent at 7-10ºC
(Pederson and Albury 1950).
8
Salt Concentration
Sodium chloride in cucumber fermentation is responsible for three important purposes; it
acts as a preservative, enhances the flavor of the product and also maintains the firm texture of
the fruit (Fleming and others 1987).
To prevent non-lactic fermentations and inhibit the growth of coliform bacteria (Etchells
and others 1975) it is important to maintain a high concentration of sodium chloride in the brine,
but high concentrations of salt (12-16% after equilibration) in the brine retards the production of
lactic acid by suppressing LAB growth (Etchells and Jones 1946) and favors the growth of
halophilic microorganisms similar to species in the genus Aerobacter (Etchells and others 1975).
Therefore, Etchells and Hontz (1972) have suggested that lactic acid concentration should be at
least 0.6% before increasing the brine strength for storage stability. Thus, concentrations of 5-
10% after equilibration of salt in the brine are maintained commercially, which is favorable for
LAB growth and inhibits Enterobacter (Etchells and others 1975).
Salt also suppresses the growth of microorganisms producing enzymes which act on the
pectic substances and soften the pickles. To ensure desirable level of acid production, the salt
strength at the early part of the fermentation should be controlled. Once fermentation is
completed, salt concentration may be increased to 10-12% after equilibration for higher osmotic
pressure to ensure product stability by preventing the growth of yeast and Enterobacter (Maki
2004).

9
Sugar
Lactic acid bacteria have complex nutritional requirements, including sugars,
amino acids, peptides, fatty acids, salts, nucleic acid derivatives and vitamins (He`bert and others
2004). Glucose and fructose are the major sugars in the cucumber fruit; raffinose and stachyose,
are the transport sugars present in small amounts (Hendrix 1982; McCombs and others 1976).
Glucose and fructose are metabolized by LAB through the glycolytic cycle where one molecule
of glucose or fructose liberates 2 molecules of lactic acid (Gunsalus and others 1955). Lu and
others (2002) concluded that glucose is metabolized faster than fructose in cucumber
fermentation, but glucose fermentation terminates before all of the glucose has been converted to
lactic acid. However, fructose is completely fermented to lactic acid (Lu and Fleming 2001).
Cucumbers contain around 2-3% fermentable sugars (Handley and others 1983;
McCombs and others 1976) and the metabolism of the glucose and fructose is regulated by
different mechanisms of LAB in the transport step and the subsequent steps of glycolysis (Lu
and Fleming 2001). In L. plantarum, glucose and fructose are transported and metabolized into
the cells via the phosphoenolpyruvate (PEP)- dependent sugar phosphotransferase system (PTS)
and glycolysis respectively to produce lactic acid (Thompson 1987). Homolactics metabolize
glucose to pyruvate via the glycolytic pathway which is further reduced to lactic acid via lactate
dehydrogenase. In contrast to homolactics, heterolactics produce lactic acid via phosphoketolase
pathway (Li 2006). Carbon dioxide splits from the glucose molecule and the pentose splits into
three carbon and two carbon fragments, which are reduced to lactic acid and ethanol respectively
(Li 2006). Fructose is reduced to fructose-6-phosphate which is reduced to glucose-6-phosphate
and then reduced to pyruvate via glycolysis. Pyruvate is reduced to lactic acid through the same
pathway as followed in glucose metabolism. On the other hand, heterofermentative bacteria in

10
cucumber fermentation convert fructose to mannitol by mannitol dehydrogenase (Hammes and
others 1991) which is then converted to lactate, ethanol, acetic acid and carbon dioxide (Li
2006).
Costilow and Fabian (1953a) indicated that supplementing the brine with sugar increased
the number of LAB without any significant increase in lactic acid. Presence of cations and anions
in the fermentation media affects the extent of sugar utilization by LAB. Also addition of organic
acids increases fructose utilization and has no effect on the glucose conversion to acids.
Similarly Mn2+
significantly increased both glucose and fructose utilization; however nitrates
inhibited the growth of starter culture (Lu and others 2002).
Lactic acid and residual sugar after fermentation can serve as substrates for yeast growth
resulting in carbon dioxide production, which leads to bloater formation, resulting in texture
defects and economic losses to the manufacturer (Li 2006; Fleming and others 1995). Growth of
spoilage micro-organisms is another problem faced by pickle producers due to incomplete
conversion of fermentable sugars to lactic acid (Daeschel and others 1988).
Influence of Nutrients on Lactic acid Bacteria
Lactic acid bacteria require multiple micronutrients including amino acids (Costilow and
Fabian 1953a,b and d; Morishita and others 1981), minerals (Weymarn and others in 2002) and
vitamins (Costilow and others 1953a,b). Cucumber fruit contains certain vitamins and minerals
essential for LAB growth in required concentrations. The nutritional value of cucumbers based
on USDA (2010) reports is given in Appendix: Table 1. Micronutrients in which cucumber is
deficient could be supplemented in the brine to improve LAB activity.

11
Amino Acids
LAB can metabolize all amino acids, but the ability to synthesize protein greatly varies
among different LAB species (Williams and others 2001; Liu and others 2003). Leucine (Leu),
isoleucine (Ile), valine (Val), glutamic acid (Glu), cystine (Cys), and tryptophan (Trp) are the
essential amino acids for L. plantarum growth (Costilow and Fabian 1953b, c; Saguir and Nadra
2007; Meretro and others 1998). These essential nutrients are not present in cucumber juice in
sufficient concentrations and need to be supplemented (Appendix: Table1). According to a study
conducted by Saguir and Nadra (2007), no growth of L. plantarum was observed in the absence
of Ile, Val and lowering the concentration of Leu decreased its growth by 85%. Trp is also
among the essential amino acids for L. plantarum growth, but in the presence of high yeast
activity an increase in the rate of lowering Trp concentration from the brine was observed
(Costilow and Fabian 1953c). The yeast could have been destroying or utilizing it making it
unavailable for L. plantarum (Costilow and Fabian 1953c). Reduction in Trp concentration was
critical for the growth of L. plantarum, further reducing the lactic acid levels in the brine
(Costilow and Fabianc). Therefore as Trp is important for L. plantarum growth and not present
in required concentration it needs to be supplemented in the brine.
Studies conducted to determine the role of threonine (Thr), Cys and Glu in L. plantarum
growth concluded that L. plantarum did not require Thr (Lyman and others 1947; Stokes and
Gunness 1943). However Cys was utilized by L. plantarum, but only within the first three days
of fermentation (Costilow and Fabian 1953c, d). Similarly Glu was also required for L.
plantarum growth in small concentrations; but its addition favored coliform growth (Ragheb and
Fabian 1956), which is undesirable in cucumber fermentation. Hence in my research Thr, Cys
and Glu were not used as nutrient supplements.

12
Vitamins
Peterson and Peterson (1945) reported that the major micronutrients promoting the
growth of about 50 microorganisms including L. plantarum were biotin, nicotinic acid,
pantothenic acid and riboflavin. Pantothenic acid (Hills 1943), nicotinic acid (Dorfman and
others 1939) and riboflavin (Klein and Kamin 1942; Snell and Strong 1939) increased respiration
of microbial cells by increasing metabolism of substrates like glucose, lactate and pyruvate.
Costilow and Fabian (1953a, d) have shown that L. plantarum required biotin, niacin, and
pantothenic acid for enhanced acid production during cucumber fermentation. Nicotinic acid and
pantothenic acid were indispensible for the growth of all species of LAB (Kashket, 1987).
Rogosa and others (1961) studied the nutritional requirements of oral isolates of LAB and
recognized two types of nutritional requirements; one required nicotinic acid and pantothenic
acid and the second type required nicotinic acid and riboflavin, although the bacterial growth
was subdued in the absence of pantothenic acid. The second type of strains was further divided
based on their fermentation reactions and the strains requiring nicotinic acid and pantothenic acid
had a standardized fermentation reaction. It was determined that the second type was identical to
L. plantarum in their fermentation reaction (Rogosa and others 1961).
Pantothenic acid is present in sufficient amounts in cucumber for LAB growth (Rosen
and Fabian 1953) and L. plantarum significantly decreased the concentration of pantothenic acid
synthetically added to the brine (Costilow and Fabian 1953c, d). Even when small concentrations
of pantothenic acid were added to the cucumber brine, LAB growth increased qualitatively and
quantitatively (Snell 1946). Pantothenic acid played a major role as growth enhancer in rumen
strains of LAB where growth was limited without added vitamin B (Ford and others 1958).

13
Studies conducted earlier conveyed that nicotinic acid (niacin) greatly stimulated the
growth of acid producing species of LAB and was essential for their growth (Snell and others
1939; Snell and Wright LD 1941; Snell 1946). Nicotinic acid was labeled essential for twenty-
two organisms and stimulated the growth of four others (Russell and others 1954). Kligler and
others (1943 a,b) reported that in order for LAB to metabolize glucose it was essential to have
nicotinic acid in the medium.
Biotin exists in two forms whereby β-biotin is twice as active as α-biotin (Peterson and
Peterson 1945, Rosen and Fabian 1953). Biotin is another essential vitamin for LAB growth; it is
present in abundance in fermentation brine within 12hrs of brining along with nicotinic acid
(Rosen and Fabian 1953). In a study conducted by Rosen and Fabian (1953) when L. plantarum
was inoculated in a synthetic media supplemented with biotin, the biotin content in the media
was drastically reduced and a significant increase in the growth rate was observed in comparison
with the control, which indicated that biotin was essential for of L. plantarum growth. But when
a similar study was conducted using cucumber juice supplemented with biotin as the media for L.
plantarum, its growth rate in cucumber juice was similar to that in a synthetic media
supplemented with biotin. However, there was very small change in the biotin concentration of
the cucumber juice, indicating that certain components in cucumber juice have similar biological
activity as biotin, which prevented biotin from being depleted (Costilow and Fabian 1953c, d).
Snell and Strong (1939) reported that several species of LAB require riboflavin for
growth. Riboflavin is an essential component of cell membrane metabolism as it is the precursor
of the flavin mononucleotide (FMN) and flavin adenine dinucleotide (FAD), it carries hydrogen
in biological redox reactions (Capozzi and others 2011). Riboflavin when added as a growth
supplement stimulated LAB growth and improved the rate of acid production (Snell 1946).

14
All the strains of L. casei require folic acid and pyridoxal for their growth whereas L.
plantarum grows well in their absence (Rogosa and others 1961; Costilow and others 1956).
Shankman and others (1947) reported that folic acid was not essential for twenty-three species of
LAB. Hence, folic acid and pyridoxal will not be included in this study.
Minerals
Minerals needed for LAB growth have been studied using a mixture containing ions of
potassium, sodium, magnesium, manganese, iron, chlorine
and phosphate. Of these magnesium
and manganese stimulated LAB growth (MacLeod and Snell 1947). Manganese and magnesium
ions function as essential co-factors for enzymes which aid primary sugar metabolism of LAB,
more importantly for the transport and reduction of fructose (Weymarn and others 2002).
Magnesium is required LAB and it is essential for the growth of L. casei, L. lactis, L.
delbrueckii, L. helveticus and L. acidophilus (Macleod and Snell 1947, Boyaval 1989; Weymarn
and others 2002; Lu and others 2002). It acts as the cofactor in many enzyme involving transport
and metabolic processes such as fructokinase, phosphoketolase and acetate kinase (Raccach
1985; Weymarn and others 2002). According to Weymarn and others (2002) sulfates from the
salt MgSO4.7H2O aid catabolism and act as essential co-factors for enzymes in the primary sugar
metabolism. Activation of LAB strains which require Mg2+
can also be accomplished by Mn2+
(Nilsson and others 1942), but some enzyme reactions associated with growth and metabolism
cannot take place when Mg2+
is substituted by Mn2+
(Boyaval 1989).
In a study conducted by Woolley (1941) using several metallic salts, it was determined that
Mn2+
was the most effective cation in stimulating the growth of LAB. Mn2+
can act as a cofactor
for several important functions including sugar transport and metabolic processes; it aids
15
enzymes in the pathway from glyceraldehydes-3-P to pyruvate and lactate dehydrogenase
(Raccach 1985; Weymarn 2002), it acts as a detoxifying agent and stabilizer for sub-cellular
entities. It specifically displays defense mechanism against oxygen toxicity for L. plantarum
which are deficient of the enzyme superoxide dismutase; and provides protection from OH-
damage and H2O
2 toxicity (Archibald and Fridovich 1981a, b; Archibald 1986). LAB can
accumulate large concentrations of intracellular Mg2+
and Mn2+
cations (Lu and others 2002).
Mn2+
cation significantly increased the utilization of sugar by LAB which increased the rate on
fermentation (Lu and others 2001); however high Mn2+
concentrations of 120 mM or higher
displayed an inhibitory effect on the utilization of the sugars, fructose and glucose by LAB (Lu
and others 2002).
16
OBJECTIVES
Many researchers have demonstrated the growth of L. plantarum in the presence of amino acids,
vitamins and minerals as nutrient supplements. However very little is known regarding
supplementing the cucumber juice fermentation brine with micronutrients and their effect on
LAB growth. Basis for the selection of the nutrients to be tested for their effect on LAB growth
were:
a. Studies conducted in the past to determine the effect on LAB growth and percentage acid
produced by supplementing certain nutrients in different growth substrates.
b. Concentration of certain nutrients in cucumber juice.
c. Providing nutrients in required concentrations based on the composition of MRS basal
agar which is a selective media for LAB growth.
Specific objectives of the study were:
1. Identification of certain amino acids, vitamins and minerals that enhance lactic acid bacteria
fermentation of cucumber juice: Determine the effectiveness of Leu, Ile, Trp, Val, biotin,
nicotinic acid, pantothenic acid, riboflavin, manganese and magnesium in enhancing lactic
acid fermentation of cucumber juice.
Determine the nutrient supplements which effectively increase the rate of lactic
acid bacterial fermentation in cucumber juice.
Evaluate the yield of lactic acid in the brine during cucumber juice fermentation.
Screen the nutrients which effectively enhance the yield of LAB growing in
cucumber juice fermentation.

17
Based on the results from objective 1; nutrients which proved to be effective in increasing the
number of LAB taking part in the fermentation and the concentration of lactic acid were selected
and used in objective 2.
2. Further examination of concentrations of biotin, Ile and Val that enhance lactic acid
bacteria fermentation of cucumber juice.
Determine the lowest and the most favorable concentration of screened nutrient
supplements which effectively increase lactic acid and LAB yield in cucumber
juice fermentation.
Evaluate the lowest concentration that effectively increases the rate of
fermentation.
Based on the results from objective 2 the most effective concentrations of biotin, Ile and Val
were used in objective 3
3. Determine the effect of biotin, Ile and valine alone and in combinations on lactic acid
bacteria fermentation of cucumber juice.
Evaluate the effect of adding two or more nutrients to the brine in their most
effective concentration in enhancing the rate of fermentation and the yield of
lactic acid and LAB.

18
CHAPTER II
METHODS AND MATERIALS
PREPARATION OF FERMENTATION STOCK SOLUTION
Sterilized Cucumber Juice
Cucumbers were obtained from local pickle industries; they were sorted for absence of
decay and mechanical damage and homogenized using a blender (Waring commercial blender,
Kent city, MI). The homogenate was strained through Miracloth (EMD Biosciences, Inc. La
Jolla, CA) and sterilized at 121oC for 15 minutes in an autoclave (Amsco 8816A, Erie, PA). The
sterilized cucumber juice was stored at 7oC until used for fermentation. Immediately before using
the juice, residues which separated out from the juice after sterilizing were discarded and the
clear juice was mixed with stock fermentation brine in equal portions for the treatments.
Stock Fermentation Brine
Composition of stock fermentation brine was 12% (±0.5%) sodium chloride, 0.1%
potassium sorbate and 0.4% acetic acid in water. Potassium sorbate was added to prevent surface
yeast and mold growth (Gates and Costilow 1981), similarly acetic acid was added to retard the
growth of coliform bacteria (Etchells and others 1964). The 1:1 mixture of the stock brine and
cucumber juice established the fermentation brine for testing the effects of selected nutrients.

19
TREATMENTS
Five fermentation trials were conducted as shown in table 2.1. In each trial, cucumber
juice and nutrient (amino acids, vitamins and minerals) supplemented brine formulation in glass
jars were randomly assigned to each treatment group. Each treatment was in replications of five.
MRS basal agar is a selective medium which supports the good growth of Lactobacilli (de Man
and others 1960). Concentrations of selected nutrients used in the brines for the first three trials
were decided based on the nutrient concentrations in de Man, Rogosa and Sharpe (MRS) basal
agar (Appendix: Table 1). First concentration for each nutrient treatment in trial I, II and III were
the same concentration as in the basal agar and second and third concentrations were half and
double the first concentration respectively. Trials I, II and III were conducted to determine the
efficacy of the nutrients in objective 1 in increasing the yield of lactic acid and the number of
LAB growing during fermentation. Treatments in the following trials included:
Trial-I: A control and Leu (Alfa Aesar, Meysham, Lancs), Ile (Alfa Aesar, Meysham, Lancs),
Trp (Fisher Scientific Company, Fair Lawn, NJ) or Val (Calbiochem, San Diego, CA) added to
the brine in three concentrations (Table 2.1).
Trial-II: A control and biotin (Calbiochem, San Diego, CA), pantothenic acid (ICN
Pharmaceuticals, Inc. Cleveland, OH), riboflavin (Eastman Kodak Company, Rochester, NY) or
nicotinic acid (ICN Pharmaceuticals, Inc. Cleveland, OH) added to the brine in three
concentrations (Table 2.1).
Trial-III: A control and magnesium (MgSO4, Fisher Scientific Company, Fair Lawn, NJ) or
manganese (MnSO4.H2O, Fisher Scientific Company, Fair Lawn, NJ) added to the brine in three
concentrations (Table 2.1).

20
TRIAL IV and V: Trial IV was conducted to accomplish objective 2. In trial IV nutrient
treatments; biotin, Ile and Val which significantly increased the lactic acid yield and LAB count
during fermentation in objective 1 (trial I, II and III) were used in five different concentrations.
All three biotin and Ile treatments were significantly different from the control but comparable to
each other hence two more concentrations; one above the highest and one below the lowest of
the concentrations from objective 1 were added to the treatments in trial IV. Whereas Val
treatments followed a different trend; increase in the concentration of Val in the treatments
increased the number of LAB. Therefore two higher concentrations were added to the existing
concentrations in trial IV to determine the lowest but the most effective concentration of the
nutrients. The most effective nutrient concentrations of biotin, Ile and Val from objective 2 (trial
IV) were used in combinations in trial V which was conducted to determine the results of
objective 3.
Stock brine treatments were with nutrients as shown in Table 2.1.1. Val, Ile, biotin,
pantothenic acid, nicotinic acid, riboflavin and salts of manganese and magnesium were
dissolved in the stock fermentation brine. Leu and Trp had poor water solubility; therefore, stock
fermentation was made separately for these treatments. Leu and Trp were dissolved in 100 ml of
hot water at 70ºC; this solution was made up to 1000 ml with water. Nutrient dissolved water
was used in place of normal tap water while making the stock fermentation brine for these
nutrients with 12% sodium chloride, 0.1% potassium and 0.4% acetic acid. Sterilized cucumber
juice (100 ml) and treatment fermentation brines (100 ml) were mixed together in 200 ml glass
jars for each treatment sample. A separate set of treatments with 100 ml were also placed for
fermentation which prepared for determining LAB yield based on dry weight.
21
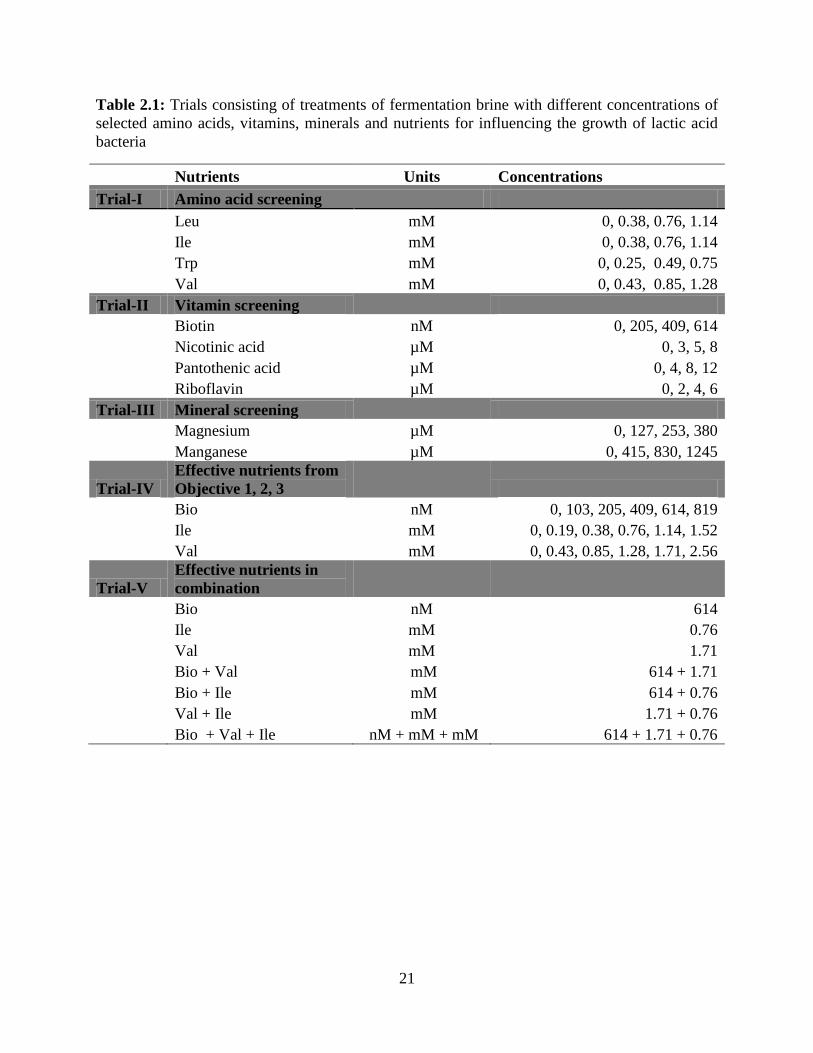
Table 2.1: Trials consisting of treatments of fermentation brine with different concentrations of
selected amino acids, vitamins, minerals and nutrients for influencing the growth of lactic acid
bacteria
Nutrients Units Concentrations
Trial-I Amino acid screening
Leu mM 0, 0.38, 0.76, 1.14
Ile mM 0, 0.38, 0.76, 1.14
Trp mM 0, 0.25, 0.49, 0.75
Val mM 0, 0.43, 0.85, 1.28
Trial-II Vitamin screening
Biotin nM 0, 205, 409, 614
Nicotinic acid µM 0, 3, 5, 8
Pantothenic acid µM 0, 4, 8, 12
Riboflavin µM 0, 2, 4, 6
Trial-III Mineral screening
Magnesium µM 0, 127, 253, 380
Manganese µM 0, 415, 830, 1245
Trial-IV
Effective nutrients from
Objective 1, 2, 3
Bio nM 0, 103, 205, 409, 614, 819
Ile mM 0, 0.19, 0.38, 0.76, 1.14, 1.52
Val mM 0, 0.43, 0.85, 1.28, 1.71, 2.56
Trial-V
Effective nutrients in
combination
Bio nM 614
Ile mM 0.76
Val mM 1.71
Bio + Val mM 614 + 1.71
Bio + Ile mM 614 + 0.76
Val + Ile mM 1.71 + 0.76
Bio + Val + Ile nM + mM + mM 614 + 1.71 + 0.76

22
CULTURE INOCULATION AND FERMENTATION
Inoculum for fermentation trials were developed from active fermentation by LAB
associated with cucumber. Whole cucumbers were placed in equal volume of fermentation brine
containing 12% sodium chloride, 0.7% calcium chloride, 0.1% potassium sorbate, 0.2% acetic
acid and 0.02% CaNa2EDTA, for fermentation at 25±0.5°C. Live LAB count in the whole
cucumber fermentation was monitored using microscopic counting and confirmed using MRS
agar plate counts during the fermentation. When the live LAB count was around 108
cells/ml the
fermentation brine was used as an inoculum for the treatment brines. The active fermentation
brine (0.1 ml) was diluted to 100 ml with deionized water. 200 ml of the treatment samples were
inoculated with 1 ml of the diluted active fermentation brine and then placed at 25-27oC for
fermentation. The cell count was diluted to around 105 cells/200 ml of fermentation brine.
CHEMICAL ASSAYS
pH Assay
According to the research conducted on the brine conditions unfavorable for LAB growth
in vegetable fermentation, when the brine pH (LAB external pH) falls to 3.3 to 3.5, the cucumber
fermentation is completely terminated (Passos and others 1994; Etchells and others 1975;
McDonald and others 1990). Therefore, it was important to maintain the external pH at 4.00 to
prevent the ceasing of L. plantarum growth. pH was measured every other day using Barnant-30
digital pH meter with a VWR Symphony gel filled, combination pH electrode (Symphony
SP7OP). When the sample pH was below pH 4.0±0.2 it was adjusted using 1 N NaOH.
Sometimes for small (around pH 0.1), pH adjustment was made with 0.1 N NaOH. The amount
23
of NaOH added to the samples was recorded and taken into account when calculating the percent
lactic acid in the samples.
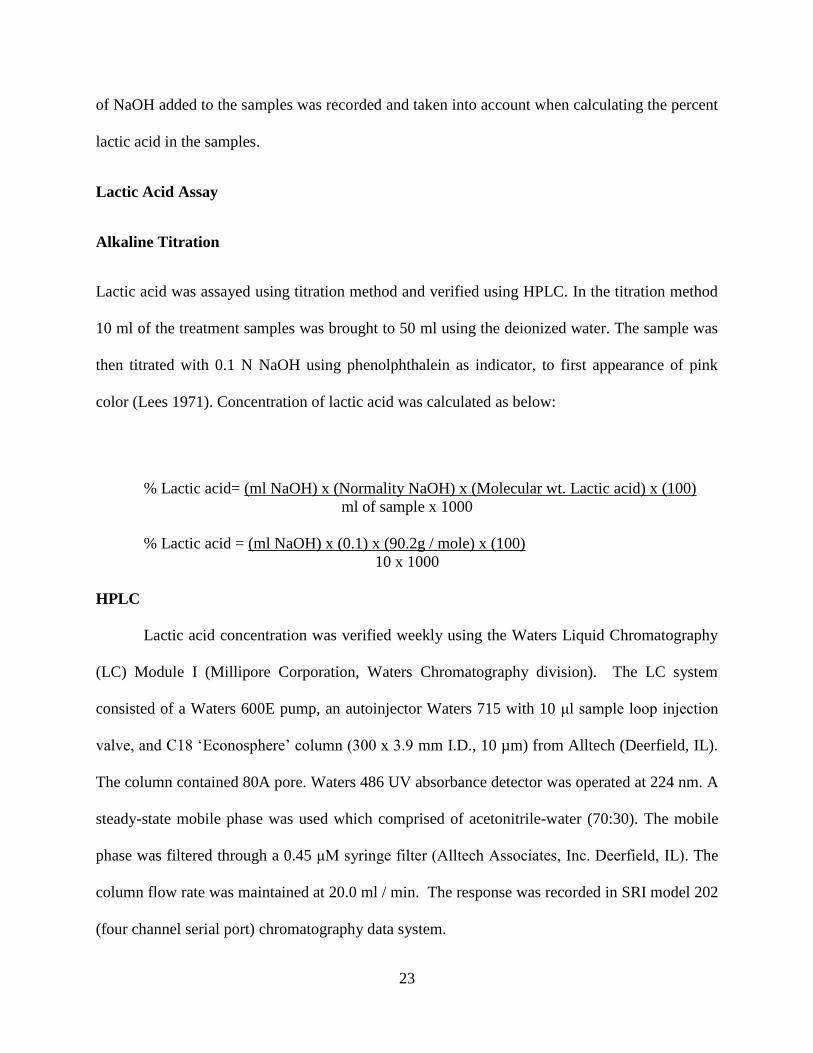
Lactic Acid Assay
Alkaline Titration
Lactic acid was assayed using titration method and verified using HPLC. In the titration method
10 ml of the treatment samples was brought to 50 ml using the deionized water. The sample was
then titrated with 0.1 N NaOH using phenolphthalein as indicator, to first appearance of pink
color (Lees 1971). Concentration of lactic acid was calculated as below:
% Lactic acid= (ml NaOH) x (Normality NaOH) x (Molecular wt. Lactic acid) x (100)
ml of sample x 1000
% Lactic acid = (ml NaOH) x (0.1) x (90.2g / mole) x (100)
10 x 1000
HPLC
Lactic acid concentration was verified weekly using the Waters Liquid Chromatography
(LC) Module I (Millipore Corporation, Waters Chromatography division). The LC system
consisted of a Waters 600E pump, an autoinjector Waters 715 with 10 μl sample loop injection
valve, and C18 ‘Econosphere’ column (300 x 3.9 mm I.D., 10 µm) from Alltech (Deerfield, IL).
The column contained 80A pore. Waters 486 UV absorbance detector was operated at 224 nm. A
steady-state mobile phase was used which comprised of acetonitrile-water (70:30). The mobile
phase was filtered through a 0.45 μM syringe filter (Alltech Associates, Inc. Deerfield, IL). The
column flow rate was maintained at 20.0 ml / min. The response was recorded in SRI model 202
(four channel serial port) chromatography data system.

24
Preparation of Standard Curve
Lactic acid concentrations of 2, 4, 8 16 and 32 mM were established in the fermentation
stock brine for standard curves using DL-lactic acid 99% purity (Sigma Chemical Co, St. Louis,
MO). Concentrations of lactic acid in millimoles were plotted versus peak areas of DL-lactic
acid. The standard curve with correlation coefficient around R2 = 0.998 was established. The
equation of this line was used for the quantification of unknown samples.
Sodium Chloride Assay
Sodium chloride was assayed by modified titration method of Sigma Technical Bulletin
No.830, in which 1ml of brine sample was mixed with 10 ml of deionized water, 4 drops of 66%
sulphuric acid and two drops of diphenylcarbazone and then titrated with 0.141N Hg(NO3)2 to
first appearance of a slight, but permanent violet color. The concentration of NaCl was
calculated as follows:
% NaCl = ml Hg(NO3)2 x Normality Hg(NO3)2 x 58.44 x 100
1000
Reducing Sugar Assay
Reducing sugars in the fermentation brines were determined by the Nelson-Somogyi method
(Nelson 1944; Somogyi 1952) and expressed as µmoles glucose per ml reaction mixture. For
every fermentation trial, a standard curve was developed using fermentation stock brine with
12% NaCl spiked with concentrations of 27.75 mM, 13.88 mM, 6.94 mM, 3.47 mM, 1.74 mM
and 0.87 mM of D-(+)-glucose (Sigma Chemical Co. St. Louis, MO).
A 0.4 ml sample was added with equal volume of Nelson’s alkaline copper reagent in a
glass tube (12.5 ml Nelson’s reagent A: 12.5 g anhydrous NaCO3, 12.5 g potassium tartrate, 10 g

25
NaHCO3 and 100g Na2SO4 made up to 500 ml with H2O; mixed with 0.5 ml Nelson’s reagent B:
7.5g CuSO4.5H2O dissolved in 50 ml H2O with 1 drop of H2SO4 added). The contents in the
glass tubes were mixed well and placed in boiling water bath for 20 min. After boiling the tubes
were removed from the water bath and cooled. 0.4 ml of Arsenomolybdate reagent
(Arsenomolybdate reagent: 25g (NH4)6Mo7O24.4H2O dissolved in 450 ml H2O and added with
21 ml conc H2SO4 producing acid molybdate which mixed with 3 g of Na2HAsO.7H2O dissolved
in 25 ml H2O. It was stored at 37º C for 24 hrs before use) was added and mixed for five minutes
to dissolve Cu2O and to reduce the arsenomolybdate. The volume was brought to 10 ml with
distilled water and absorbancy was read at 520 nm using Varian CARY 50 Bio UV-Visible
spectrophotometer.
MICROBIOLOGICAL ASSAYS
Quantifying Live And Dead Lactic Acid Bacteria
Microbial numbers were determined every second day throughout the fermentation
period and until the live LAB declined to 103
cells/ml less. LAB were enumerated by microscopic
and plating techniques. Each treatment was assayed in triplicate by each method of analysis.
Sample Preparation
The dead LAB which had settled at the bottom and the walls of the container were
introduced back into the brine for even distribution of the live and dead LAB. The distribution
was carried on by vortexing the glass jars they were fermented. One ml of brine samples was
diluted with 9 ml of PBS (phosphate buffered saline: 8 g NaCl, 0.2 g KCl, 0.24 g KH2PO4 and

26
1.44 g Na2HPO4 in 1 L of deionized water). Samples were diluted with 10X serial dilutions of
PBS until the LAB count was within 25 to 200 in number.
Microscopic Technique
One ml of the sample diluted with 10X serial dilution of PBS was mixed with 100 µl of
10% Tween 20 and vortexed for 3 hrs to separate clusters of the bacteria. The vortexed sample
was stained with one drop of Trypan Blue (Sigma Chemicals Co, St. Louis, MO), a vital stain
which selectively colors dead tissues and cells blue. After staining, the dead bacteria were
completely blue in color and the live bacteria had a blue outline with transparent white cell body.
Samples were placed onto a Spencer Bright-Line hemacytometer (American Optical
Corporation, Buffalo, NY) and viewed under a compound microscope (Model 06.16.62, 115
volts, 60 cycles, 15 watts, American Optical Co, Buffalo, NY) with 45X magnification. The
hemacytometer consisted of nine 1 mm squares divided into smaller squares. Cells were counted
in four corner squares and the count was averaged. Each 1 mm square represented a volume of
0.1 mm3
or 10-4
cm3. Since 1cm
3 is equivalent to 1 ml, the number of cells per ml was determined
using the formula:
Cells / ml = (The average count per square) x (The dilution factor) x 104
Plating Technique
To verify reliability of the microscopic technique, weekly plate counts of LAB were
determined. MRS agar plates (Difco Lactobacilli MRS agar, Detroit, MI) were inoculated by
spread plate method; every plate was divided into two parts and two 0.1 ml of PBS dilutions of
every brine sample were spread onto MRS plates in triplicate and incubated in incubator (Fisher

27
Scientific Isotemp 655D, Phoenix, AZ) at 35 to 37° C for 48 hrs under aerobic conditions
followed by colony counting in CFU / ml.
LAB Dry Weight Assay
After fermentation the samples especially prepared for measuring LAB dry weight yield
were centrifuged at 10,000 rpm for 20 mins in pre-weighted tubes (Beckman Coulter) and the
residue was washed with deionized water and re-centrifuged three times. Residues were dried at
50o
C for 12 hrs and weighed to determine the weight of the residual LAB. The difference in the
weight of the residue from the fermented treatments and unfermented samples determined the net
dry mass of LAB produced in the fermentation.
STATISTICAL ANALYSIS
All treatments were performed with five replications. Lactic acid concentrations were
modeled as a quadratic function of time allowing the regression coefficients to differ by nutrient
type and concentration. Lactic acid concentrations and viable LAB counts on several days
throughout the experiment and reducing sugar and total bacterial weight on the final day of the
experiment were analyzed as a two factor factorial (nutrient type x concentration) analysis of
variance. Significant differences among the means were determined using a protected least
significant difference (LSD).
The logarithms of the viable LAB were modeled as a function of time allowing the
regression coefficient to depend on nutrient types and concentration. The function consisted of
two segments, the first of which was a quadratic function of time and the second was a quadratic
or a horizontal line, depending on the nutrient and concentration. The estimated maximum log
units were determined from the fitted model.

28
All statistical analyses were carried out using SAS®, version 9.2. A significance level of
5% was used in all analysis.

29
CHAPTER III
RESULTS
IDENTIFICATION OF CERTAIN AMINO ACIDS, VITAMINS AND MINERALS THAT
ENHANCE LACTIC ACID BACTERIA FERMENTATION OF CUCUMBER JUICE:
AMINO ACIDS
PRODUCTION OF LACTIC ACID
Enhanced production of lactic acid as influenced by supplementation of cucumber juice
with Leu, Ile, Trp and Val was tested. Lactic acid concentrations of treatment brines during
fermentation were plotted and the results are illustrated in Figure 3.1. The results revealed that
except for Trp treatments all other amino acid treatments were effective in increasing the lactic
acid concentration in the brines. Among the effective treatments, addition of 0.38 mM and 0.76
mM Leu in the treatment brines effectively raised the final lactic acid concentration by 7.3%
(Figure 3.1 Leu). Lactic acid concentrations of the brines containing 0.38 mM 0.76 mM and 1.14
mM of Ile were higher than the control from day 11 onwards and it continued to rise until
fermentation was complete (Figure 3.1 Ile). Final lactic acid concentration of Ile treatment brines
was 13.2% higher than the control which was significantly different (P<0.05). Lactic acid levels
in the Val treatments brine were similar to the control until day 18. From day 20 onwards acid
levels in treatments of 0.85 mM and 1.28 mM Val were higher compared to the control and a
10% higher concentration of lactic acid was observed on day 23 (final day of fermentation)
(Figure 3.1 Val).

30
Lactic acid concentration in the treatments during fermentation was also measured using
HPLC on day 2, 8, 16 and 23. These concentrations were compared with the ones determined
using titration method to confirm the data collected using titration method. Lactic acid levels
reported from the titrations on day 2 and 23 were 3.1% lower than the concentrations determined
using HPLC. The difference in the reported lactic acid levels determined using the two methods
was not significant (P>0.05) (SEM: ±0.05).

31
Figure 3.1: Effect of leucine, isoleucine, tryptophan and valine on lactic acid concentration
determined throughout cucumber juice fermentation
Note:
Leu- leucine, Ile- isoleucine, Trp-tryptophan and Val- valine
Arrow indicates the day when the lactic acid concentration in the treatment brines was
significantly different from the control as estimated using LSD (P<0.05).
Symbols of the treatment concentrations which significantly differ from the control are
indicated next to the arrow.
0.00
0.20
0.40
0.60
0.80
1.00
1.20
0 5 10 15 20 25
% L
act
ic a
cid
Day
Leu
(▲, O)
Control (◊)
0.38mM (▲)
0.76mM (O) 1.14mM (X)
0.00
0.20
0.40
0.60
0.80
1.00
1.20
0 5 10 15 20 25%
La
ctic
aci
d
Day
Ile
(▲, O, X)
Control (◊)
0.38mM (▲)
0.76mM (O) 1.14mM (X)
0.00
0.20
0.40
0.60
0.80
1.00
1.20
0 5 10 15 20 25
% L
act
ic a
cid
Day
Trp
Control (◊)
0.25mM (▲)
0.49mM (O) 0.75mM (X)
0.00
0.20
0.40
0.60
0.80
1.00
1.20
0 5 10 15 20 25
% L
act
ic a
cid
Day
Val
(O, X)
Control (◊)
0.43mM (▲)
0.85mM (O) 1.28mM (X)

32
DEPLETION OF REDUCING SUGARS
Amount of sugars utilized in the amino acids supplemented treatments was determined by
comparing the initial and final sugar concentration in the fermentation brine (Table 3.1).
Treatments of 0.38 mM Ile and 0.25 mM and 0.75 mM Trp had significantly lower (P<0.05)
concentrations of residual sugars in comparison to the control and other treatments.
Table 3.1: Concentration of reducing sugar after complete fermentation in the treatments
supplemented with leucine, isoleucine, tryptophan and valine
Leu
(mM)
RG*
(mM)
Ile
(mM)
RG*
(mM)
Trp
(mM)
RG*
(mM)
Val
(mM)
RG*
(mM)
0 2.15 a 0 2.15
a 0 2.15
a 0 2.15
a
0.38 1.98ab
0.38 1.54c 0.25 1.57
c 0.43 2.13
a
0.76 1.77bc
0.76 1.73b 0.49 1.89
b 0.85 2.03
a
1.14 2.04a 1.14 1.81
b 0.75 1.85
bc 1.28 1.83
b
Note:
Leu- leucine, Ile- isoleucine, Trp-tryptophan and Val- valine
RG* - Residual glucose
Means with no common letters differ significantly from control as estimated using LSD
(P<0.05).
The standard error of the means for this data is ±0.06.
The concentration of reducing sugars in unfermented cucumber juice and brine mixture
before inoculation was 26.72 mM.
LACTIC ACID BACTERIA PRODUCTION
NUMBER OF LIVE, DEAD AND TOTAL CELLS
The effect of adding Leu, Ile, Trp and Val individually to the brine on the viable (live)
cell count of LAB during cucumber juice fermentation was estimated using a microscope and is
shown in Figure 3.2. All the treatments of Ile and a few Val treatments were effective in
increasing the number of LAB. Ile treatments promoted growth of the fermenting organisms; this

33
action became evident considerably before maximum population of LAB was achieved. A
minimum of two log units’ difference in the viable LAB count was observed between the Ile
treatments and the control all through the log and stationary phase of LAB growth cycle (Figure
3.2 Ile). Ile treatments showed highest log cfu/ml of LAB. A rise of 9.6% in the maximum viable
LAB cell count in the Val treatment of 1.28 mM was observed, which was significantly higher
(P<0.05) than the maximum viable cell count in the control (Figure 3.2 Val). In the death phase
viable LAB units in Val treatments and the control were comparable. Trp and Leu were less
active in increasing the number of viable LAB cells in the fermentation brine. Live LAB count in
these treatments was not significantly different (P>0.05) from the control.
Along with the viable cell count of LAB, non-viable (dead) cells were also counted using
the microscopic technique. The viable and non-viable cell counts together were considered as the
total number of cells at different stages of fermentation. Total number of cells which were part
of the cucumber juice fermentation is illustrated in Figure 3.3. Considering that Ile was effective
in increasing the viable LAB cell count it is evident that the total LAB count was also
significantly higher (P<0.05) than the control. Total LAB count in these treatments was around
14.20 log units/ml which is 9.3% higher than the control. Val treatment at 1.28 mM also
promoted LAB growth; the total number of LAB cells in this treatment at the end of fermentation
were 13.88 log units/ml. Trp in the fermentation brine was slightly effective in promoting LAB
growth which increased the viable cell count in the treatments, but the rise was not significant.
However the small increase in the number of viable cells at every stage of fermentation summed
significantly increased (P<0.05) the total number of cells at the end of fermentation in these
treatments. Unlike in Trp treatments; no change in the total LAB counts of the Leu treatments
was observed in comparison to the control.

34
Although the viable LAB cells were counted using microscopic technique, the
confirmation of the results from this technique was done using plating technique. Samples were
plated on day 3, 9, 17 and 23 and the counts were compared with the viable LAB counts from the
microscopic technique. The difference in the LAB count from the two techniques was around
3.1% which was significantly low (P<0.05), confirming the result from microscopic technique
with standard error of the mean (±0.08).

35
Figure 3.2: Effect of leucine, isoleucine, tryptophan and valine on the live lactic acid
bacteria microscopic count determined throughout cucumber juice fermentation
Note:
Leu- leucine, Ile- isoleucine, Trp-tryptophan and Val- valine
Arrow indicates the day when the live bacterial count in the treatment brines was
significantly different from the control as estimated using LSD (P<0.05).
Star indicates the day when the live bacterial count among the treatments was not
significantly different as estimated using LSD (P>0.05).
Symbols of the treatment concentrations which significantly differ from the control are
indicated next to the arrow and the star.
0.00
2.00
4.00
6.00
8.00
10.00
12.00
0 5 10 15 20 25
LA
B l
og
co
un
ts
Day
Trp
Control (◊)
0.25mM (▲)
0.49mM (○) 0.75mM (x)
0.00
2.00
4.00
6.00
8.00
10.00
12.00
0 5 10 15 20 25L
AB
lo
g c
ou
nts
Day
Ile
▲, O, X
▲, O, X
Control (◊)
0.38mM (▲)
0.76mM (○) 1.14mM (x)
0.00
2.00
4.00
6.00
8.00
10.00
12.00
0 5 10 15 20 25
LA
B l
og
co
un
ts
Day
Leu
Control (◊)
0.38mM (▲)
0.76mM (○) 1.14mM (x)
0.00
2.00
4.00
6.00
8.00
10.00
12.00
0 5 10 15 20 25
LA
B l
og
co
un
ts
Day
Val
X
X
Control (◊)
0.43mM (▲)
0.85mM (○) 1.28mM (x)

36
Figure 3.3: Effect of leucine, isoleucine, tryptophan and valine on the total number of lactic
acid bacteria in fermented cucumber juice on the last day of fermentation
Note:
Leu- leucine, Ile- isoleucine, Trp-tryptophan and Val- valine
The standard error of the means for this data was ± 0.01.
Bars with no common letter differ significantly from the control as estimated using LSD
(P<0.05)
LAB DRY WEIGHT
Dry weight of the total LAB taking part in the fermentation was also measured to confirm
the effect of the selected amino acids on the yield of these microorganisms. The results from this
assay are reported in Table 3.2. As expected Ile treatments of 0.38 mM and 0.76 mM stood out
from the rest of the treatments with the highest dry weight of LAB which were significantly
(P>0.05) higher than the control. However same was not the case with the Val treatment of 1.28
mM which promoted LAB number; but the value was comparable to the control. Another
observation was the significantly low (P<0.05) dry weights of LAB in Trp and Leu treatments in
comparison to the control.
12.00
12.50
13.00
13.50
14.00
14.50
LA
B l
og c
ou
nt
Amino acid treatments
0.38mM 0.38mM 0.76mM 0.76mM 1.14mM 1.14mM 0.25mM 0.49mM 0.75mM 0.43mM 0.85mM 1.28mM
Leu Control Ile Trp Val
a
a a
a
b b
b
c c
c
c
b
c

37
Table 3.2: Dry weight (DW) of bacteria (live and dead together) measured after complete
fermentation in the treatment samples supplemented with leucine, isoleucine, tryptophan
and valine
Leu
(mM)
DW
(mg/ml)
Ile
(mM)
DW
(mg/ml)
Trp
(mM)
DW
(mg/ml)
Val
(mM)
DW
(mg/ml)
0 4.46c 0 4.46
c 0 4.46
c 0 4.46
c
0.38 4.39dc
0.38 4.84a 0.25 4.35
d 0.43 4.25
e
0.76 3.90g 0.76 4.89
a 0.49 4.65
bc 0.85 4.14
f
1.14 4.25e 1.14 4.73
b 0.75 3.99
g 1.28 4.55
c
Note:
Leu- leucine, Ile- isoleucine, Trp-tryptophan and Val- valine
Means with no common letters differ significantly from the control as estimated using LSD
(P<0.05).
The standard error of the means for this data was ± 0.02.
VITAMINS
PRODUCTION OF LACTIC ACID
Efficacy of the supplemented vitamins biotin, nicotinic acid, pantothenic acid and
riboflavin on the concentration of lactic acid produced in the brine was tested. Lactic acid
production by LAB was measured by titration method as illustrated in Figure 3.4. Biotin
supplemented brines were the only treatments which effectively increased the lactic acid
concentration throughout the observation period (24 days). This activity was evident first after 8
days of incubation and continued to develop rapidly until the fermentation was completed. The
final lactic acid concentration in the biotin supplemented treatment brines was 13.8% higher than
the control which was significant (P<0.05) (Figure 3.4 Biotin). No significant difference
(P>0.05) was observed on the lactic acid levels in pantothenic acid and nicotinic acid treated
brine in comparison with the control (Figure 3.4). Addition of riboflavin to the brine adversely
affected lactic acid production. The lactic acid levels in riboflavin treated brines were around
0.34 % by the end of fermentation which was three times lower than the lactic acid concentration

38
in the control which was significant (P<0.05). Although fermentation was completed in other
vitamin treatments and the control on day 24, conversion of sugars to lactic acid continued in
riboflavin treatments and fermentation did not cease in these treatments.
Lactic acid concentration in the treatments during fermentation was also measured using
HPLC on day 2, 8, 16 and 24 to confirm the lactic acid values determined using titration. Around
2.6 % higher lactic acid concentration values was observed from alkaline titrations which will
not be taken into consideration as the difference was not significant (P>0.05) (SEM: ±0.02).

39
Figure 3.4: Effect of biotin, nicotinic acid, pantothenic acid and riboflavin on lactic acid
concentration determined throughout cucumber juice fermentation
Note:
Arrow indicates the day when the live bacterial count in the treatment brines was
significantly different from the control as estimated using LSD (P<0.05).
Symbols of the treatment concentrations which significantly differ from the control are
indicated next to the arrow.
0
0.2
0.4
0.6
0.8
1
1.2
0 5 10 15 20 25
% L
act
ic a
cid
Day
Biotin
Control (◊)
205nM (▲)
409nM (O) 614nM (X)
X, O, ▲
0
0.2
0.4
0.6
0.8
1
1.2
0 5 10 15 20 25
% L
act
ic a
cid
Day
Nicotinic acid
Control (◊)
3µM (▲)
5µM (O) 8µM (X)
0
0.2
0.4
0.6
0.8
1
1.2
0 5 10 15 20 25
% L
act
ic a
cid
Day
Pantothenic acid
Control (◊)
4µM (▲),
8µM (O) 12µM (X).
0
0.2
0.4
0.6
0.8
1
1.2
0 5 10 15 20 25
% L
acti
c ac
id
Day
Riboflavin
Control (◊)
2µM (▲)
4µM (O) 6µM (X)
O, X, ▲

40
DEPLETION OF REDUCING SUGARS
The residual sugars in the vitamin supplemented brines are reported in Table 3.3. Biotin
and nicotinic acid promoted effective depletion of sugars. The final sugar concentration after
complete fermentation was the lowest in treatments of 205 nM and 5 µM biotin and nicotinic
acid respectively. Considerable utilization of sugars also took place in other biotin and nicotinic
acid treatments which had significantly lower (P<0.05) sugar content compared to the control.
From Table 3.3 it is evident that pantothenic acid treatments did not enhance sugar depletion and
contained the same amount of sugar at the end of fermentation as the control. The extent of
conversion of sugars to lactic acid was significantly lower (P<0.05) than the control in riboflavin
treatments (Table 3.3) which also reflected in the low lactic acid concentrations in riboflavin
treatment brines (Figure 3.4).
Table 3.3: Concentration of reducing sugar after complete fermentation in the treatments
supplemented with biotin, nicotinic acid, pantothenic acid and riboflavin
Bio
(nM)
RG*
(mM)
Nic
(µM)
RG*
(mM)
Pan
(µM)
RG*
(mM)
Rib
(µM)
RG*
(mM)
0 2.45d 0 2.45
d 0 2.45
d 0 2.45
d
205 1.34f 3 1.74
e 4 2.21
d 2 24.42
a
409 1.53e 5 1.42
ef 8 2.53
d 4 18.69
c
614 1.58e 8 1.68
e 12 2.45
d 6 21.82
b
Note:
RG* - Residual glucose
Bio- biotin, Nic- nicotinic acid, Pan- pantothenic acid and Rib- riboflavin
Means with no common letters differ significantly from the control as estimated using LSD
(P<0.05).
The standard error of the means for this data was ± 0.04.
The concentration of reducing sugars in unfermented sterilized cucumber juice and brine
mixture before inoculation was 28.19 mM.

41
PRODUCTION OF LACTIC ACID BACTERIA
NUMBER OF LIVE, DEAD AND TOTAL CELLS
The viable LAB numbers in treatment brines with biotin, nicotinic acid, pantothenic acid
and riboflavin are illustrated in Figure 3.5. Biotin increased the number of LAB in all three
concentrations tested. This activity was evident immediately after initial lag phase (6 days after
incubation) and continued to develop rapidly throughout the observation period (24 days). Biotin
treatments reached their maximum population within 13 days along with the control (Appendix:
Figure 4). The counts of viable LAB in the three biotin treatments of 205 nM, 409 nM and 614
nM when the maximum population was achieved in these treatments were 10.32, 10.06 and
10.22 log units/ml, respectively (Figure 3.5 Biotin). These counts were around 12% higher than
the maximum population count in the control, but during the death phase from day 16 until the
end of fermentation the number of LAB growing in all the treatments including the control were
comparable. The LAB count in nicotinic acid treatments was similar to the control. Nicotinic
acid treatments on day 5 had fewer LAB than the control; but from day 9 onwards all the
treatments had comparable LAB counts (Figure 3.5 Nicotinic acid). Similarly pantothenic acid
treatments of 8 µM and 12 µM promoted rapid increase in the number of viable LAB from day 5
through day 12, but from day 13 onwards a steady increase the LAB count similar to the control
was noticed. The reason behind the sudden boost in the LAB count for a short period in these
treatments was unknown. The number of viable LAB in nicotinic acid treatments of 8 µM and 12
µM when LAB reached its maximum population were 9.25 and 9.74 log units/ml, respectively
(Figure 3.5 Pantothenic acid). Maximum population in these treatments was comparable to the
control. There was a significant (P<0.05) inhibitory effect of riboflavin on LAB growth, which
was evident from day 2 and continued throughout the observation period (24 days). LAB growth

42
in the riboflavin treatments slowly increased even after fermentation was completed in the
control. The LAB count in the riboflavin treatments when the fermentation was completed in the
control (day 24) was around 4.48 logs units/ml (Figure 3.5 Riboflavin).
The total number of LAB cells (live and dead) in biotin, nicotinic acid, pantothenic acid
and riboflavin treated brines were also counted on the last day of observation (day 24) and the
counts are illustrated in Figure 3.6. Although the biotin treatments promoted growth of LAB all
through the log and stationary phase, the count of total LAB on the last day of observation was
not significantly different (P>0.05) from the control. Pantothenic acid and nicotinic acid
treatments were also comparable to the control in their total LAB count on day 24 of
fermentation. Such a trend was expected as the viable cell counts in these treatments were also
close to the viable cell counts of the control throughout the fermentation. The number of viable
cells in riboflavin treatments were significantly higher (P<0.05) than the control on day 24 but
the total number of bacterial cells were significantly lower (P<0.05).
To confirm the microscopic technique, samples were plated on day 3, 9, 17 and 24 of
fermentation. Viable LAB counts from the plating technique were 4.1% higher than the counts
from the microscopic technique with a standard error of (±0.032). The difference in the results
from the two techniques was not significant (P>0.05) confirming the results from the
microscopic technique.

43
Figure 3.5: Effect of biotin, nicotinic acid, pantothenic acid and riboflavin on the live lactic
acid bacteria microscopic count determined throughout cucumber juice fermentation
Note:
Arrow indicates the day when the live bacterial count in the treatment brines was
significantly different from the control as estimated using LSD (P<0.05).
Star indicates the day when the live bacterial count among the treatments was not
significantly different as estimated using LSD (P>0.05).
Symbols of the treatment concentrations which significantly differ from the control are
indicated next to the arrow and the star.
0.00
2.00
4.00
6.00
8.00
10.00
12.00
0 5 10 15 20 25
LA
B l
og
co
un
ts
Day
Biotin
▲, O, X
▲, O, X
0.00
2.00
4.00
6.00
8.00
10.00
12.00
0 5 10 15 20 25
LA
B l
og
co
un
ts
Day
Nicotinic acid
▲, X, O
▲, X, O
0.00
2.00
4.00
6.00
8.00
10.00
12.00
0 5 10 15 20 25
LA
B l
og
co
un
ts
Day
Pantothenic acid
▲, O, X
▲, O, X
0.00
2.00
4.00
6.00
8.00
10.00
12.00
0 5 10 15 20 25
LA
B l
og
co
un
ts
Day
Riboflavin
▲, O, X
Control (◊)
205nM (▲) 409nM (○)
614nM (x)
Control (◊)
3μM (▲) 5μM (○)
8μM (x)
Control (◊)
4 μM (▲)
8μM (○)
12μM (x)
Control (◊)
2μM (▲)
4μM (○) 6μM (x)

44
Figure 3.6: Effect of biotin, nicotinic acid, pantothenic acid and riboflavin on the total
number of lactic acid bacteria in fermented cucumber juice on the last day of fermentation
Note:
The standard error of the means for this data was ±0.01.
Bars with no common letter differ significantly from the control as estimated using LSD
(P<0.05)
LAB DRY WEIGHT
Dry weight of the total number of LAB taking part in the fermentation was measured and
the results from this assay are reported in Table 3.4. Although the total LAB count in the biotin
treatments was slightly but not statistically higher than the control, the dry weight of the
microbes in the treatment brine at the end of fermentation was significantly higher (P<0.05)
(Table 3.4). A significant increase in the total LAB number in treatment of 205 nM biotin was
observed which explains the higher LAB dry weight in this treatment in comparison to the other
treatments. Dry weight of LAB in pantothenic acid and nicotinic acid treatments was comparable
to the LAB dry weight in the control. Significantly lower (P<0.05) LAB dry weight in riboflavin
treatments was expected as riboflavin inhibited LAB growth.
0.00
2.00
4.00
6.00
8.00
10.00
12.00
14.00
16.00
LA
B l
og
co
un
ts
Vitamin treatments
205nM 409nM 614nM 3µM 5µM 8µM 4µM 8µM 12µM 2µM 4µM 6µM
Control Biotin Nicotinic acid Pantothenic acid Riboflavin
a a a
b b b
a a a
a a a a

45
Table 3.4: Dry weight (DW) of bacteria (live and dead together) measured after complete
fermentation in the treatment samples supplemented with biotin, nicotinic acid,
pantothenic acid, and riboflavin
Bio
(nM)
DW
(mg/ml)
Nic
(µM)
DW
(mg/ml)
Pan
(µM)
DW
(mg/ml)
Rib
(µM)
DW
(mg/ml)
0 1.21c 0 1.21
c 0 1.21
c 0 1.21
c
205 1.68a 3 1.27
c 4 1.10
dc 2 0.05
e
409 1.39b 5 1.02
d 8 1.08
d 4 0.03
e
614 1.42b 8 1.09
d 12 1.09
d 6 0.03
e
Note:
Bio- biotin, Nic- nicotinic acid, Pan- pantothenic acid and Rib- riboflavin
Means with no common letters differ significantly from the control as estimated using LSD
(P<0.05).
The standard error of the means for this data was ±0.01.
MINERAL
PRODUCTION OF LACTIC ACID
Lactic acid levels during fermentation in the treatment brines are plotted for each
treatment and the results are illustrated in Figure 3.7. From the graph it is clear that manganese
and magnesium cucumber juice treatments followed the same trend in lactic acid production as
the control during fermentation. A slight decrease in the lactic acid concentration of magnesium
treated brines was observed from day 13 of incubation and continued throughout the observation
period (23 days). However the change was not of any statistical importance. Fermentation in the
treatments were not completed within 23 days for fermentation but the number of LAB had
declined to 103 cells/ml therefore lactic acid assay had been stopped at that point.
Lactic acid concentration in the treatments during fermentation was also measured using
HPLC on day 2, 9, 16 and 23 and these concentrations were compared with the ones determined
using titration method to confirm the data collected using titration method. Lactic acid levels

46
reported from the titrations were 1.4% lower than the concentrations determined using HPLC.
The difference in the reported lactic acid levels determined using the two methods was not
significant (P>0.05) (SEM: ±0.02).
Figure 3.7: Effect of manganese and magnesium on lactic acid concentration determined
throughout cucumber juice fermentation
DEPLETION OF REDUCING SUGARS
Amount of residual sugars in the mineral supplemented brines at the end of fermentation
are reported in Table 3.5. Although there was no significant difference in the lactic acid
concentrations among the mineral treatments and the control, the amount of residual sugars was
statistically different for some treatments. Treatments of 415 mM and 1245 mM of manganese
and 380 mM magnesium caused lowering of residual sugar concentration to a higher extent,
although all treatments had low levels.
0.00
0.20
0.40
0.60
0.80
1.00
0 5 10 15 20 25
% L
act
ic a
cid
Day
Control (◊)
127μM (♦)
253μM (▲) 380μM (●)
Magnesium
0.00
0.20
0.40
0.60
0.80
1.00
0 5 10 15 20 25
% L
act
ic a
cid
Day
Control (◊)
415μM (x)
830μM (∆) 1245μM (O)
Manganese

47
Table 3.5: Concentration of reducing sugar after complete fermentation in the treatments
supplemented with manganese and magnesium
Mn (µM) RG* (mM) Mg (µM) RG* (mM)
0 1.74ab
0 1.74ab
415 1.17c 125 1.54
b
830 1.90a 253 1.57
b
1245 1.03c 380 1.24
c
Note:
Mn- manganese, Mg- magnesium
RG* - Residual glucose
Means with no common letters differ significantly from the control using LSD (P<0.05).
The standard error of the means for this data was ±0.04
The concentration of reducing sugars in unfermented sterilized cucumber juice and brine
mixture before inoculation was 31.41mM.
PRODUCTION OF LACTIC ACID BACTERIA
NUMBER OF LIVE, DEAD AND TOTAL CELLS
The number of viable LAB cells in fermentation brines supplemented with magnesium
and manganese individually are illustrated in Figure 3.8. Minerals added to the brine were
effective in increasing the number of viable LAB starting from the stationary phase through the
death phase which was different from the trend followed by the vitamin and amino acid
treatments where viable LAB cell count was higher than the log and stationary phase.
Manganese at a concentration of 1245μM increased the number of LAB from day 12 and
continued throughout the fermentation period until fermentation was completed on day 23
(Appendix: Figure 5) (Figure 3.8). Treatment brine with 1245µM of manganese had 12.98 log
units of LAB in its stationary phase when the viable LAB count in the control treatments was
only 9.72 log units. Treatments brines with 127μM and 253μM of magnesium increased LAB

48
starting from day 13 (stationary phase) and counts where consistently higher than the control
until day 23.
The total number of cells (live and dead together) in the mineral supplemented brines on
the final day of fermentation are illustrated in the Figure 3.9. As the viable LAB counts during
fermentation were higher than the control in 127μM and 253 μM manganese and 1245 μM
magnesium supplemented brines, the total LAB counts were also significantly higher in these
treatments. Total LAB counts in these treatments were around 9.3%, 8.3% (127μM, 253 μM
manganese) and 14.2% (1245 μM magnesium) greater than the control (Figure 3.9). Brine
supplemented with 380 μM of manganese was lower than the control in its total number of LAB
and all other manganese and magnesium treatments were comparable to the control.
Viable LAB cell counts from the microscopic technique were confirmed by comparing
the counts with the plate counts of the same samples on day 2, 8, 16 and 22. The difference in the
LAB count from the two techniques was around 2.6% which was not significantly different
(P>0.05), confirming the result from microscopic technique with standard error of the difference
(±0.03).

49
Figure 3.8: Effect of manganese and magnesium on the live lactic acid bacteria microscopic
count determined throughout cucumber juice fermentation
Note:
Arrow indicates the day when the live bacterial count in the treatment brines was
significantly different from the control as estimated using LSD (P<0.05).
Star indicates the day when the live bacterial count among the treatments was not
significantly different as estimated using LSD (P>0.05).
Symbols of the treatment concentrations which significantly differ from the control are
indicated next to the arrow and the star.
0
2
4
6
8
10
12
14
0 5 10 15 20 25 30
LA
B l
og
co
un
ts
Day
Control (◊)
127μM (♦)
253μM (▲) 506μM (●)
Magnesium
♦, ■ ♦, ■
0
2
4
6
8
10
12
14
0 5 10 15 20 25 30
LA
B l
og
co
un
ts
Day
Control (◊)
415μM (x)
830μM (∆) 1245μM (O)
Manganese
O
O

50
Figure 3.9: Effect of manganese and magnesium on the total number of lactic acid bacteria
in fermented cucumber juice on the last day of fermentation
Note:
The standard error of the means for this data was ±0.07.
Bars with no common letter differ significantly from the control as estimated using LSD
(P<0.05)
LAB DRY WEIGHT
Dry weight of the total (live and dead) LAB in the treatment brines at the end of
fermentation was determined to confirm the effect of the selected minerals on the yield of LAB
in cucumber juice fermentation. The results from this assay are reported in Table 3.6. Only
manganese treatments of 415µM and 1245µM were effective in increasing the dry weight of
LAB at the end of fermentation these treatments were significantly higher than the control
(P<0.05). All other treatments were comparable to the control.
0.00
2.00
4.00
6.00
8.00
10.00
12.00
14.00
16.00
LA
B l
og
Cou
nts
Mineral treatments
127µM 1245µM 830µM 415µM 380µM 253µM
Control Manganese Magnesium
a a
b b
c
b
a

51
Table 3.6: Dry weight (DW) of bacteria (live and dead together) measured after complete
fermentation in the treatment samples supplemented with manganese and magnesium
Mn (µM) DW (mg/ml) Mg (µM) DW (mg/ml)
0 0.28c 0 0.28
c
415 0.67b 127 0.34
c
830 0.21c 253 0.35
c
1245 1.35a 380 0.24
c
Note:
Mn- manganese, Mg- magnesium
Means with no common letters differ significantly from the control as estimated using LSD
(P<0.05).
The standard error of the means for this data is ±0.01.

52
CHAPTER IV
RESULTS
FURTHER EXAMINATION OF CONCENTRATIONS OF BIOTIN, ILE AND VAL THAT
ENHANCE LACTIC ACID BACTERIA FERMENTATION OF CUCUMBER JUICE
Three nutrient supplements Bio (biotin), Ile and Val were selected for further studies
based on their favorable response in objective 1 of promoting lactic acid production and the
number of LAB taking part in cucumber juice fermentation. It was important to find the lowest
yet, the most effective concentration of these nutrients that would enhance acid production and
LAB growth to a greater extent in LAB fermentation of cucumber juice. The concentrations
tested in this fermentation trial were decided based on the observation from objective 1. The
assays were conducted similar to the ones in objective 1. Each nutrient was used in five
concentrations and each concentration was considered a treatment, the concentration of the
nutrients in each treatment is defined in table 2.1. As all the concentrations in Bio and Ile
treatments were significantly different from the control, but not significantly different from each
other in their activity to enhance cucumber juice fermentation, two new concentrations were
added to the previous concentrations. Concentrations lower and higher than tested in previous
trials were added. Val treatments displayed an increasing trend in their activity, where their
intensity to enhance LAB fermentation increased with increasing concentration. Hence two new
higher concentrations were added as treatments.

53
RESULTS
PRODUCTION OF LACTIC ACID
Lactic acid concentration during fermentation of the treatment brines are plotted for each
treatment and the results are illustrated in Figure 4.1. Four concentrations of the Bio treatments
except 103 nM of Bio supported production of lactic acid in higher levels compared to the
control. This activity was evident from day 8 and continued through the last day of fermentation
(day 23). A rise on 7.8% was observed in the final lactic acid concentration of the Bio treatments
205 nM, 409 nM, 614 nM and 819 nM. These treatments reached their maximum lactic acid
concentration within 20 days of fermentation (Figure 4.1 Bio). Bio treatment 205nM supported
slight growth, but was not as effective as the treatments 409 nM, 614 nM and 819 nM in
increasing the lactic acid level of the brine. Conversion rate of sugar to lactic acid in Bio
treatment 103 nM was lower than rest of the Bio treatments. The response obtained in this
treatment was not different from the control.
Ile treatments were not effective in increasing lactic acid concentration until day 13 and
were close to the control in their lactic acid levels. Rapid production of lactic acid was observed
from day 13. Among all the Ile treatments the final lactic acid concentration of 0.76 mM, 1.14
mM and 1.52 mM Ile was higher than the control and the rest of the Ile treatments (Figure 4.1
Ile). The final lactic acid levels were 8.2% higher in these treatments in comparison with the
control, but they were not significantly (P>0.05) different from each other.
Val treatments followed the same trend as the Bio treatments. They promoted rapid
production of lactic acid from day 8 onwards (Figure 4.1 Val). As observed in objective 1 the
treatments 0.43 mM and 0.85 mM of Val had the same lactic acid levels as the control. But with
the increase in the Val concentration in the treatments the intensity to enhance acid levels also

54
increased in treatments 1.28 mM, 1.71 mM and 2.56 mM of Val. 8.4% increase in the final lactic
acid concentration was observed in these treatments as compared to the control.
HPLC was used on day 2, 8, 16 and 22 to determine concentration of lactic acid in the
brine on those days and the data was compared with the lactic acid concentrations from alkaline
titrations. The concentrations from the HPLC method were significantly higher (P<0.05) than the
data collected using titrations by 3.1% with a standard deviation of the means (±0.06).

55
Figure 4.1: Effect of biotin, isoleucine and valine on lactic acid concentration determined
throughout cucumber juice fermentation
Note:
Bio- biotin, Ile- isoleucine and Val- valine
Arrow indicates the day when the live bacterial count in the treatment brines was
significantly different from the control as estimated using LSD (P<0.05).
Star indicates the day when the live bacterial count among the significantly different
from the control as estimated using LSD (P>0.05).
Symbols of the treatment concentrations which significantly differ from the control are
indicated next to the arrow and the star.
0.00
0.20
0.40
0.60
0.80
1.00
1.20
0 5 10 15 20 25
% L
act
ic a
cid
Day
Bio
▲, X, +, ● O
0.00
0.20
0.40
0.60
0.80
1.00
1.20
0 5 10 15 20 25%
La
cti
c a
cid
Day
Ile
●, ▲, X, +, O O
0.00
0.20
0.40
0.60
0.80
1.00
1.20
0 5 10 15 20 25
% L
acti
c a
cid
Day
Val
X, +, ●
Control (◊) 103nM (O)
205nM (▲)
409nM (X) 614nM (+)
819nM (●)
Control (◊) 0.19mM (O)
0.38mM (▲)
0.76mM (X) 1.14mM (+)
1.52mM (●)
Control (◊) 0.43mM (O)
0.85mM (▲)
1.28mM (X) 1.71mM (+)
2.56mM (●)

56
DEPLETION OF REDUCING SUGARS
Treatments that increased lactic acid production (Figure 4.1) were also effective in
depleting sugar in cucumber juice. Also treatments 0.19 mM and 0.38 mM of Ile were effective
in depleting sugar which was not evident from the lactic acid concentration in these brines (Table
4.1).
Table 4.1: Concentration of reducing sugar after complete fermentation in the
treatments supplemented with biotin, isoleucine and valine
Bio (nM) RG* (mM) Ile (mM) RG* (mM) Val (mM) RG* (mM)
0 1.56a 0 1.56
a 0 1.56
a
103 1.54a 0.19 1.11
b 0.43 1.43
a
205 1.40a 0.38 0.99
c 0.85 1.31
a
409 1.23b 0.76 1.01
bc 1.28 1.17
b
614 1.11b 1.14 0.96
c 1.71 1.02
bc
819 1.11b 1.52 0.96
c 2.56 0.98
c
Note:
Bio- biotin, Ile- isoleucine and Val- valine
RG*- residual glucose
Means with no common letters differ significantly from the control as estimated using
LSD (P<0.05).
The standard error of the means for this data is ±0.03.
The concentration of reducing sugars in unfermented sterilized cucumber juice and
brine mixture before inoculation was 33.76 mM.
PRODUCTION OF LACTIC ACID BACTERIA
NUMBER OF LIVE, DEAD AND TOTAL CELLS
The three nutrients had proved to increase LAB number in objective 1. They were added
in five different concentrations in objective 2 to find out the most effective concentration that
could increase the number of LAB in cucumber fermentation. Once again from this study it was
confirmed that Bio, Ile and Val supported increase in LAB number. Treatments of 409 nM, 614

57
nM and 819 nM Bio were equally effective and proved to be active in increasing the viable cell
number from day 8 onwards. These treatments had significantly larger number of LAB growing
at any point of time in comparison with other Bio treatments and the control (Figure 4.2 Bio).
Treatments of 0.19 mM and 0.38 mM Ile reached their maximum population of LAB within 12
days of fermentation as compared to 15 days in the control (Appendix: Figure 6) (Figure 4.2
Bio). However the number of bacteria growing in these treatments throughout the fermentation
was similar to the control (Figure 4.3). Treatments of 0.76 mM, 1.14 mM and 2.56 mM Ile also
reached their maximum population of LAB within 10 days of fermentation and had significantly
higher (P<0.05) number of live bacteria from day 10 to day 16 (end of stationary phase) (Figure
4.2 Ile). In the death phase from day 16 onwards the viable LAB count in the control was
significantly higher (P<0.05) than the Ile treatments (Figure 4.2 Ile). Treatments of 1.71 mM and
2.56 mM Val supported rapid multiplication of LAB until day 16 (Figure 4.2 Val). The number
of viable LAB till day 16 were significantly higher (P<0.05) than the control in these Val
treatments. From day 18 onwards the number of viable LAB in the control was higher in
comparison with the Val treatments.
The total (live and dead) number of LAB in treatments of 614 nM and 819 nM Bio were
around 13.64 and 13.61 log units/ml respectively, which were higher than any other Bio
treatments (Figure 4.3 Bio). These Bio treatments were considered the most effective of all the
Bio treatments in increasing the total number of LAB. The total number of LAB in treatments of
0.76 mM, 1.14 mM and 2.56 mM Ile at the end of the fermentation were around 13.68, 13.93 and
13.95 log units/ml. On the final day of fermentation the total LAB in the control brine was
around 12.43 log units/ml (Figure 4.3), which was significantly lower (P<0.05) than in
treatments of 0.76 mM, 1.14 mM and 2.56 mM Ile. The total number of LAB in treatments of

58
1.28, 1.71mM and 2.56 mM Val were around 13.74, 13.86 and 13.94 log units/ml respectively
(Figure 4.2).
Viable LAB cells were quantified using plating technique at regular intervals to confirm
the viable cell results from the microscopic technique. Samples were plated on day 2, 9, 15 and
21 and compared to the observations on the viable cell count using microscopic technique on the
same days. Results for the two techniques were close, but a difference of 2.3% was observed.
The difference in the two techniques had a standard deviation of (± 0.27)

59
Figure 4.2: Effect of biotin, isoleucine and valine on the live lactic acid bacteria microscopic
count determined throughout cucumber juice fermentation
Note:
Bio- biotin, Ile- isoleucine and Val- valine
Arrow indicates the day when the live bacterial count in the treatment brines was
significantly different from the control as estimated using LSD (P<0.05).
Star indicates the day when the live bacterial count among the treatments was not
significantly different as estimated using LSD (P>0.05).
Symbols of the treatment concentrations which significantly differ from the control are
indicated next to the arrow and the star.
0.00
2.00
4.00
6.00
8.00
10.00
12.00
0 5 10 15 20 25 30
LA
B l
og
co
un
ts
Day
Bio
O, ▲, X, ■, ●
O, ▲, X, ■, ●
◊
◊
0.00
2.00
4.00
6.00
8.00
10.00
12.00
0 5 10 15 20 25 30
LA
B l
og
co
un
ts
Day
Ile
O, ▲, X, ■, ●
O, ▲, X, ■, ●
◊
◊
0.00
2.00
4.00
6.00
8.00
10.00
12.00
0 5 10 15 20 25 30
LA
B l
og
co
un
ts
Day
Val
X, ■, ●
X, ■, ●
◊
◊
Control (◊) 103nM (O)
205nM (▲)
409nM (x) 614nM (■)
819nM (●)
Control (◊) 0.19mM (O)
0.38mM (▲) 0.76mM (x)
1.14mM (■)
1.52mM (●)
Control (◊)
0.43mM (O) 0.85mM (▲)
1.28mM (x)
1.71mM (■) 2.56mM (●)

60
Figure 4.3: Effect of biotin, isoleucine and valine on the total number of lactic acid bacteria
in fermented cucumber juice on the last day of fermentation
Note:
Bio- biotin, Ile- isoleucine, Val- valine
The standard error of the means for this data is ±0.02.
Bars with no common letter differ significantly from the control as estimated using
LSD (P<0.05)
LAB DRY WEIGHT
LAB dry weight was measured on the final day of fermentation and reported in Table 4.2.
Treatments 103 nM of Bio, 1.14 mM and 2.56 mM of Val were estimated to be the most
effective among all the treatments in increasing LAB dry weight. Treatments 614 nM and 819
nM of Bio, 1.28 mM and 0.85 mM of Val closely followed. Some treatments which increased the
number of LAB as discussed earlier did not show a significant increase in the LAB dry weight as
compared to the control.
11.00
11.50
12.00
12.50
13.00
13.50
14.00
14.50
LA
B l
og c
ou
nts
Treatments
Control Val
103nM 2.56mM 1.71mM 1.28mM 0.85mM 0.43mM 1.52mM 1.14mM 0.76mM 0.38mM 0.19mM 819nM 614nM 409nM 205nM
a
Control Bio Ile
103nM 2.56mM 1.71mM 1.28mM 0.85mM 0.43mM 1.52mM 1.14mM 0.76mM 0.38mM 0.19mM 819nM 614nM 409nM 205nM
a a
b b
b
b
a a
a a
a a a
a
a

61
Table 4.2: Dry weight (DW) of bacteria (live and dead together) measured after complete
fermentation in the treatment samples supplemented with biotin, isoleucine and valine
Bio
(nM)
DW
(mg/ml) Ile (mM)
DW
(mg/ml)
Val
(mM)
DW
(mg/ml)
0 1.18 d 0 1.18
d 0 1.18
d
103 2.87a 0.19 1.48
c 0.43 1.52
c
205 1.53c 0.38 1.65
bc 0.85 1.63
bc
409 1.54c 0.76 1.09
d 1.28 1.80
b
614 1.89b 1.14 1.37
c 1.71 2.62
a
819 1.77b 1.52 1.07
d 2.56 2.12
a
Note:
Bio- biotin, Ile- isoleucine and Val- valine
Means with no common letter differ significantly from the control as estimated using
LSD (P<0.05).
The standard error of the means for this data is ±0.01.

62
CHAPTER V
RESULTS
EFFECT OF BIO, ILE AND VAL ALONE AND IN COMBINATIONS ON LACTIC ACID
BACTERIA FERMENTATION OF CUCUMBER JUICE
TREATMENTS
Lactic acid bacteria activity enhancing micronutrients were tested and selected for their
effect on cucumber juice fermentation in trial I through IV. Improved acid fermentation was
observed in Bio, Ile and Val treatments in their respective concentrations of 614 nM, 0.76 mM
and 1.71 mM. These treatments were successful in increasing the number of LAB taking part in
the fermentation. They also supported increased lactic acid levels in fermentation brine. Trial V
was conducted to determine the effect of these selected nutrients supplemented in combinations
in brine (Table 2.1) on the number of viable LAB cells and lactic acid production in cucumber
juice fermentation.
RESULTS
PRODUCTION OF LACTIC ACID
The effect of Bio, Ile and Val when used in combinations on lactic acid production by
LAB are illustrated in Figure 5.1. Treatments with Bio and Val in combination (Bio + Val) and
only Val increased lactic acid production in the brine which helped these brines reach their
maximum concentrations (1.02% and 1.00% respectively) faster than other treatments. These
treatments reached their maximum lactic acid concentration on day 18. Other nutrient
supplemented treatment also promoted higher lactic acid levels and their final lactic acid

63
concentration was around 0.97% on day 21 which was also significantly higher than the control
at 88% on day 23.
No notable difference was observed in the acidity values reported using the two
acidity determining methods. A rise of around 1.3% was observed in the values reported
using titration method which was not significant (P>0.05). Therefore the titration method
was proved to be efficient in this study with a standard error of (±.0.02).
Figure 5.1: Lactic acid concentration in cucumber juice treated with biotin, isoleucine and
valine in different combinations determined throughout fermentation
Note:
Bio- biotin, Ile- isoleucine and Val- valine
Arrow indicates the day when the live bacterial count in the treatment brines was
significantly different from the control as estimated using LSD (P<0.05).
Symbols of the treatment concentrations which significantly differ by LSD (P<0.05) from the
control are indicated next to the arrow.
0.00
0.20
0.40
0.60
0.80
1.00
1.20
0 5 10 15 20 25 30
% L
act
ic a
cid
Day
Control (◊)
Bio (▲)
Val (O)
Ile (x)
▲, O, X
0.00
0.20
0.40
0.60
0.80
1.00
1.20
0 5 10 15 20 25 30
% L
act
ic a
cid
Day
Control (◊)
Bio + Val (●)
Bio + Ile (■)
Val + Ile (∆)
Bio + Val + Ile (+)
(●, ■, ▲, +)

64
DEPLETION OF REDUCING SUGARS
The amount of residual sugars in the treatment brines is reported in Table 5.1. All
treatments proved to be effective in depleting higher concentrations of sugar in comparison to the
control. But the residual sugar concentration in treatment brines (Bio, Bio + Val, Val + Ile and
Bio + Ile + Val) was lower than the rest. Greater (P<0.05) utilization of sugar was observed in
these treatments in comparison to other treatments.
Table 5.1: Concentration of reducing sugar after complete fermentation in the treatments
supplemented with biotin, isoleucine and valine
Treatments Concentration RG* (mM)
Control 0 1.68a
Bio (nM) 614 1.06c
Val (mM) 0.76 1.19b
Ile (mM) 1.71 1.39b
Bio (nM) + Val (mM) 614 + 1.71 0.99c
Bio (nM) + Ile (mM) 614 + 0.76 1.24b
Val (mM) + Ile (mM) 1.71 + 0.76 1.16c
Bio (nM) + Val (mM) + Ile (mM) 614 + 1.71 + 0.76 1.10c
Note:
Bio- biotin, Ile- isoleucine and Val- valine
RG* - Residual glucose
Means with no common letters differ significantly from the control as estimated using
LSD (P<0.05).
The standard error of the means for this data is ±0.01.
The concentration of reducing sugars in unfermented sterilized cucumber juice and
brine mixture before inoculation was 27.76 mM.

65
LACTIC ACID BACTERIA PRODUCTION
LAB in cucumber juice fermentation rapidly multiplied in the presence of Bio, Val and
Ile and the results are illustrated in Figure 5.2. All treatment combinations boosted LAB numbers
but some were highly active compared to the others. Treatments (Bio + Val), (Bio), (Ile) and
(Val) increased LAB numbers. These treatments reached their maximum population within 12
days of inoculation (Appendix: Figure 6) with viable LAB numbers of 10.86 log units/ml, 10.37
log units/ml, 10.32 log units/ml and 10.21 log units/ml respectively. Control reached its
maximum LAB population on day 15 with viable LAB count of 8.81 log units/ml (Appendix:
Figure 6).
As the number of viable cells in the nutrient supplemented treatments was significantly
higher (P<0.05) than the control, the total (live and dead) number of LAB taking part in the
fermentation process in these treatments was also significantly higher. The results from the total
number of LAB on the final day of fermentation are illustrated in Figure 5.3. Although all the
treatments promoted LAB growth the total count on the final day of fermentation was the highest
in treatments (Val) and (Bio + Val) with maximum population of 13.43 log units/ml and 13.40
log units/ml respectively (Figure 5.3). Rest of the treatments were comparable to each other with
an average of 13.00 log units/ml, which was also significantly higher than the control with 10.88
log units/ml of total LAB on the final day of fermentation.
Viable LAB were quantified using two techniques (microscopic and plating) on day 2, 7,
14, 21. The results from the two techniques were compared to confirm the efficiency of the
microscopic technique. Viable number of LAB determined using the microscopic technique were
significantly lower (P<0.05) than those determined using plating technique by 7.5% on day 14

66
Appendix: Figure 8). The reason behind such this difference could be that the samples were
stained for more than 5 seconds before viewing them under the microscope.
Figure 5.2: Effect on the live lactic acid bacteria microscopic count in cucumber juice
treated with biotin, isoleucine and valine in different combinations determined throughout
fermentation
Note:
Bio- biotin, Ile- isoleucine and Val- valine
Arrow indicates the day when the live bacterial count in the treatment brines was
significantly different from the control as estimated using LSD (P<0.05).
Star indicates the day when the live bacterial count among the treatments was not
significantly different as estimated using LSD (P>0.05).
Symbols of the treatment concentrations which significantly differ from the control are
indicated next to the arrow and the star.
0.00
2.00
4.00
6.00
8.00
10.00
12.00
0 5 10 15 20 25 30
LA
B l
og
co
un
ts
Treatments
Control (◊)
Bio (▲)
Val (O)
Ile (x)
▲, O, X
▲, O, X
0.00
2.00
4.00
6.00
8.00
10.00
12.00
0 5 10 15 20 25 30
LA
B l
og
co
un
ts
Treatments
Control (◊)
Bio + Val (●)
Bio + Ile (■)
Val + Ile (∆)
Bio + Val + Ile (+)
●, ■, ∆, +
●, ■, ∆, +
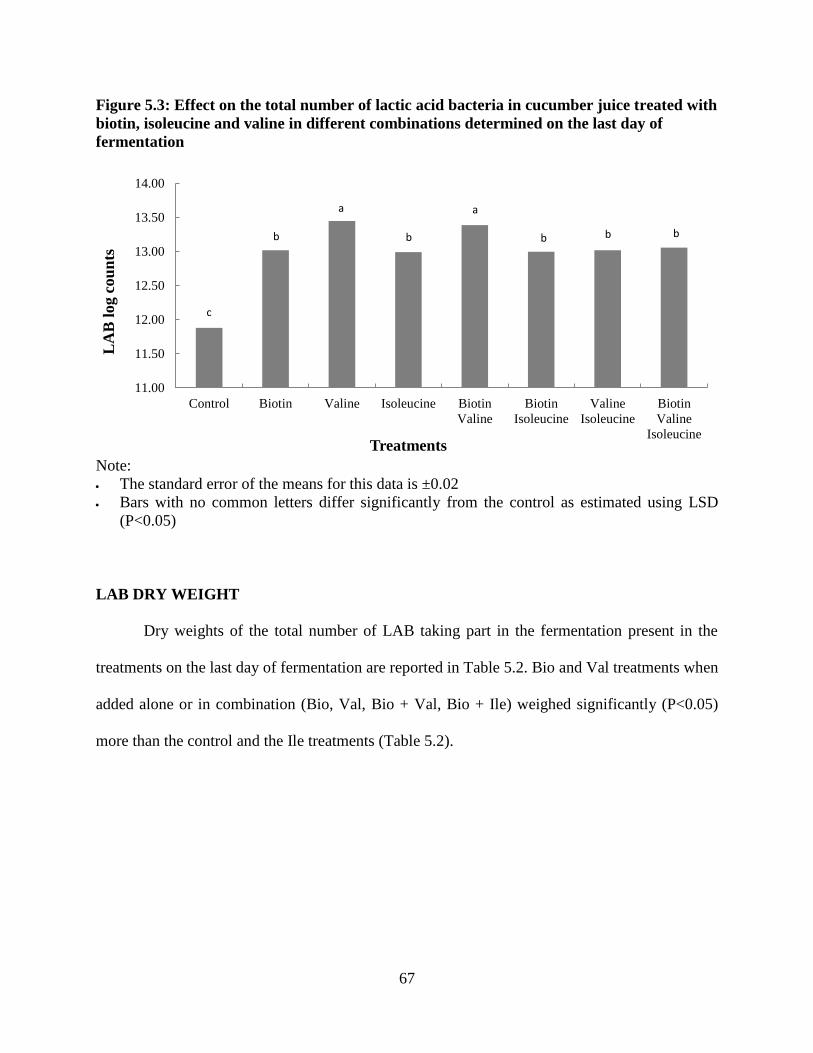
67
Figure 5.3: Effect on the total number of lactic acid bacteria in cucumber juice treated with
biotin, isoleucine and valine in different combinations determined on the last day of
fermentation
Note:
The standard error of the means for this data is ±0.02
Bars with no common letters differ significantly from the control as estimated using LSD
(P<0.05)
LAB DRY WEIGHT
Dry weights of the total number of LAB taking part in the fermentation present in the
treatments on the last day of fermentation are reported in Table 5.2. Bio and Val treatments when
added alone or in combination (Bio, Val, Bio + Val, Bio + Ile) weighed significantly (P<0.05)
more than the control and the Ile treatments (Table 5.2).
11.00
11.50
12.00
12.50
13.00
13.50
14.00
Control Biotin Valine Isoleucine Biotin
Valine
Biotin
Isoleucine
Valine
Isoleucine
Biotin
Valine
Isoleucine
LA
B l
og c
ou
nts
Treatments
a
b b
c
b b b
a

68
Table 5.2: Dry weight (DW) of bacteria (live and dead together) measured after complete
fermentation in the treatment samples supplemented with biotin, isoleucine and valine in
different combinations
Treatments Concentration Units DW (mg/ml)
Control 0 0 1.55b
Bio 614 nM 1.96a
Val 0.76 mM 1.85a
Ile 1.71 mM 1.69b
Bio + Val 614 + 1.71 nM + mM 1.91a
Bio + Ile 614 + 0.76 nM + mM 1.82a
Val + Ile 1.71 + 0.76 mM + mM 1.69b
Bio + Val + Ile 614 + 1.71 + 0.76 nM + mM + mM 1.66b
Note:
Bio- biotin, Ile- isoleucine and Val- valine
Means with no common letters differ significantly from the control as estimated using
LSD (P<0.05).
The standard error of the means for this data is ±0.07.

69
CHAPTER VI
DISCUSSION AND SUMMARY
DISCUSSION
In this investigation, the effect of adding fermentation brine with optimized concentration
of amino acids, vitamins and minerals during cucumber juice fermentation was analyzed. The
basis for use of selected concentrations was drawn from the literature on substrate consumption
by lactic acid bacteria during fermentation (Archibald 1986; Costilow and Fabian 1953b, c, d;
Fabiana and Nadra 2007; Ruiz-Barba and Jimenez-Diaz 1994; Ragheb and Fabian 1956).
Of the four amino acids Leu, Ile, Trp and Val considered to be essential for L. plantarum
growth (Costilow and Fabian 1953b, c; Saguir and Nadra 2007; Meretro and others 1998), only
Ile and Val were effective in increasing the number of LAB taking part in the fermentation and
the concentration of lactic acid in the brine. Addition of Leu and Trp showed no effect on the
titratable acidity and microbiological activity of cucumber juice fermentation. These results were
consistent with the findings of Costilow and Fabian (1953c), and the reason for such an
observation could be that the levels of native Leu and Trp from cucumber in the brine were
sufficient for LAB growth and added Trp may not be stimulating the conversion of sugar to
lactic acid (Ragheb and Fabian 1956). Therefore, providing them with higher levels of Leu and
Trp did not improve their growth.
L. plantarum used mainly the essential amino acid Ile and Val for their better
incorporation in cell material (Saguir and Nadra 2007, Costilow and Fabian 1953d). During the
preliminary screening all the three concentrations of Ile improved cucumber juice fermentation.
However, in case of Val, only the treatment with highest Val concentration (1.28 mM) had

70
higher LAB count than the control. Although the LAB count at 0.85 mM Val was higher than the
LAB count at 0.43 mM Val, these treatments increased the number of LAB growing but did not
differ significantly from the control. These results indicated that LAB growth improved with
increase in Val concentration, this trend was in agreement with earlier study (Moretro and others
1998). The initial amino acids levels in the brine during commercial cucumber fermentation may
be sufficient for initiation of lactic acid fermentation, but concentrations decline from the first
week of fermentation between 41 and 68% at the end of growth (Saguir and Nadra 2007).
Therefore these amino acids were tested to determine their smallest, yet the most effective
concentration for the increase in acid levels and LAB numbers. Treatment concentrations 0.76
mM Ile and 1.71 mM Val were selected to be used in combination in objective 3. Val is essential
for L. plantarum growth (Fabiana and Nadra 2007) and the carbon skeleton of the amino acids
Val and Ile can be converted to lactate or lipids (Kask and others 1999). This could be the reason
that only the final lactic acid concentration of Val treatments was higher than the control as it
promoted L. plantarum growth.
Previous investigations determined that biotin levels in the brine after one day of
fermentation were higher than those required by L. plantarum (Costilow and Fabian 1953b,c).
Biotin is required by LAB for the synthesis of aspartic acid and oleic acid, but when these
nutrients are present in required quantities then biotin is required in very small concentrations
(Broquist and Snell 1951). But in this study, fermentation brine showed considerable increase in
the number of LAB and lactic acid concentration when the brine was added with biotin. Biotin
enhanced LAB numbers, was effective in depleting sugars and yielded more lactic acid among
all the vitamin treatments. These results were slightly different from the results reported by
Rosen and Fabian (1953) who concluded that cucumber juice contained substances that could

71
substitute for biotin requirement in L. plantarum resulting in less biotin depletion. Studies
conducted by Ruiz-Barba and Jimenez-Diaz (1995) using green olives as fermentation substrate
reported that biotin, nicotinic acid and pantothenic acid were not considered growth limiting
factors of L. plantarum. Of all the concentrations tested, biotin treatment at 614 nM proved to be
most effective and was used in combination with Ile and Val in objective 3.
Though Scientists earlier (Snell and others 1939; Snell 1946) reported that supplementing
fermentation brine with nicotinic acid and pantothenic acid stimulated LAB growth, similar
effect was not observed in this study. However, the sugar content in the brines supplemented
with nicotinic acid was significantly lower than the control; leading to a conclusion that nicotinic
acid could aid the depletion of sugars to other fermentation products rather than lactic acid.
Insignificant differences in the number of LAB and lactic acid concentration in pantothenic acid
and nicotinic acid treatment brines could be because the cucumber juice immediately provided
LAB with 3 to 17% of nicotinic acid and pantothenic acid respectively (Costilow and Fabian
1953b; Rosen and Fabian 1953) which could be sufficient for their growth.
Riboflavin was in marked contrast to the behavior of the other vitamins examined; it can
be synthesized by certain species of LAB (Snell 1946) and was also toxic to the microorganisms
growing in the brine when supplemented synthetically. These findings were in accordance with
my results where LAB growth was inhibited and acid production was also suppressed.
Although the initial pool of nutrients should be provided to the microorganisms either
from the cucumber or supplemented in the brine, several authors reported an increase in the
vitamin content of vegetable and dairy products that had undergone LAB fermentation (Salih and
Dilleau 1990; McFeeters 1988). In most cases, the increase could be attributed to the activity of

72
LAB and different microorganisms which grow during fermentation (Costilow and Fabian
1953b; Rosen and Fabian 1953).
The fermentation brine supplemented with magnesium and manganese resulted in no
significant change in LAB numbers, or the conversion of reducing sugars to lactic acid. Although
magnesium showed minor increase in the acid levels during fermentation, the final concentration
of the acid was the same as in the control. A similar study conducted using cucumber juice
reported that addition of magnesium in higher concentrations than used in this study decreased
sugar utilization as it inhibited the enzymes involved in sugar transport and metabolism (Lu and
others 2002). Generally, cucumbers contain only 4% manganese of what is present in the MRS
basal for cultivation of LAB (USDA 2010). In studies conducted earlier (McDonalds and other
1990) addition of manganese in the cucumber media during fermentation greatly increased the
sugar utilization and lactic acid production. These results were not in accordance with the results
obtained in my study, which did not find any increase in lactic acid production. High
concentration of manganese has an inhibitory effect on the starter culture (Lu and others 2002).
Effective concentrations of biotin, Ile and Val were added in different combinations to
the fermentation brine to determine their effect on LAB numbers, dry LAB weight, lactic acid
concentrations and the final concentration of reducing sugar. Treatments with Bio and Val as
stand-alone or in combination (Bio, Val, Bio + Val) were the most effective. The results from all
the trials have indicated that Bio stimulated LAB growth and is a potential cucumber
fermentation enhancer (Costilow and Fabian 1953b, d; Rosen and Fabian 1953). Val and Ile are
closely related aliphatic amino acids but on comparing their activity (Kask and others 1999), Val
as a supplement promoted higher LAB numbers. This increase in the number of LAB increased
the concentration of sugar converted to lactic acid and hence increased the concentration of lactic

73
acid in cucumber juice fermentation (Costilow and Fabian 1953c). Although Ile in trial I and IV
proved to be effective in enhancing LAB fermentation in cucumber juice wasn’t equally
effective in combination with Bio and/or Val, for unknown reasons.
SUMMARY
The effects of supplementing cucumber juice fermentation brine with amino acids (Leu, Ile,
Trp and Val), vitamins (biotin, nicotinic acid, pantothenic acid and riboflavin) and minerals
(manganese and magnesium) on LAB growth and lactic acid production were investigated.
Bio, Ile and Val were determined to be the most effective nutrients among the nutrients
tested. The most effective concentration among the five concentrations tested for each
nutrient was determined.
Of all the nutrients tested in different concentrations, 614 nM Bio, 0.76 mM Ile and 1.71 mM
Val were the most effective in increasing the lactic acid levels and the number of LAB cells
in cucumber juice fermentation.
Riboflavin was the only nutrient, in this study, which inhibited the growth of LAB and
resulted in low lactic acid production.
When selected concentrations of Bio, Ile and Val were used in various combinations; it was
found that Bio and Val treatments, either separate or together, could be used as potential
supplements to enhance the LAB fermentation in cucumber juice. These treatments increased
the number of LAB, LAB dry weight and the lactic acid concentration in the brine.

74
REFERENCES
1. Archibald, F. 1986. Manganese: its acquisition by and function in the lactic acid bacteria.
C. Rev. Microbiol. 13: 63-109.
2. Archibald, FS, Fridovich, I. 1981a. Manganese and defense against oxygen toxicity in
Lactobacillus plantarum. J. Bacteriol. 145: 442-451.
3. Archibald, FS, Fridovich, I. 1981b. Manganese superoxide dismutase and oxygen
tolerance in some lactic acid bacteria. J. Bacteriol. 146: 928-936.
4. Axelsson L. 2004. Lactic acid bacteria: classification and physiology. In: Salminen, S,
Wright, A.V., Ouwehand, A, editors. Lactic acid bacteria microbiological and functional
aspects. 3rd
ed. New York: Marcel Dekker, Inc. 1-66.
5. Boyaval, P. 1989. Lactic acid bacteria and metal ions. Lait. 69: 87-113.
6. Breidt, JF, McFeeters, RF, Diaz-Muniz, I. 2007. Fermented vegetables. In: Doyle, MP,
Beuchat, LR, editors. Food Microbiology: Fundamentals and Frontiers. 3rd
ed.
Washington D.C: ASM Press. 155-167.
7. Caplice, E, Fitzgerald, GF. 1999. Food fermentation: role of microorganisms in food
production and preservation. Inter. J. Food. Microbiol. 50:131-149.
8. Broquist, HP, Snell, EE. 1951. Biotin and bacterial growth: relationship to aspartate,
oleate and carbon dioxide. J. Bio. Chem. 188:431-444.
9. Capozzi, V, Menga, V, Digesu, AM, De Vita, P, van Sinderen D, Cattivelli, L, Fares, C,
Spano, G. 2011. Biotechnological production of vitamin B2-enriched bread and pasta. J.
Agric. Food. Chem. 59: 8013-8020.
10. Costilow, RN, Coughlin, FM, Robach, DL, Ragheb, HS. 1956. A study of the acid-
forming bacteria from cucumber fermentations in Michigan. Food. Res. 21:27-33.
11. Costilow, RN, Fabian, FW. 1953a. Microbiological studies of cucumber fermentation.
App. Microbiol. 1:314-319.
12. Costilow, RN, Fabian, FW. 1953b. Effect of various microorganisms on the vitamin and
amino acid content of cucumber brines. App. Microbiol. 1:327-329.
13. Costilow, RN, Fabian, FW. 1953c. Availability of essential vitamins and amino acids for
Lactobacillus plantarum in cucumber fermentations. App. Microbiol. 1:320-326.
14. Costilow, RN, Fabian, FW. 1953d. Vitamins and amino acids requirements of
Lactobacillus plantarum from cucumber fermentations. App. Microbiol. 1:269-271.

75
15. Daeschel, MA, Fleming, HP, McFeeters, RF. 1988. Mixed fermentation of cucumber
juice with Lactobacillus plantarum and yeast. J. Food. Sci. 53: 862-888.
16. de Man, JC, Rogosa, M, Sharpe, ME. 1960. A medium for the cultivation of Lactobacilli.
J. Bacteriol. 23:130-142.
17. Dorfman, A, Koser, SA, Saunders, F. 1939. Effects of nicotinamide on respiration of
dysentery bacilli. Sci. 9: 544-545.
18. Etchells, JL, Costilow, RN, Anderson, TE, Bell, TA. 1964. Pure culture fermentation of
brined cucumbers. Appl. Microbiol. 12: 523-535.
19. Etchells, JL, Fleming, HP, Bell, TA. 1975. Factors influencing the growth of lactic acid
bacteria during the fermentation of brined cucumbers. In: Carr, JG, Cutting, CV, Whiting,
GC, editors. Lactic acid bacteria in beverages and food. New York: Academic press. 281-
284.
20. Etchells, JL, Hontz, LH. 1972. Suggestions for brining pickling cucumbers- the use of
equilibrated brine strengths, based on the average brine-cucumber-mass temperature.
Pickle. Pak. Sci. 2: 18-19.
21. Etchells, JL, Jones, ID. 1946. Characteristics of lactic acid bacteria from commercial
cucumber fermentations. J. Bacteriol. 52: 593-599.
22. Fabiana, MS, Nadra, MCM. 2007. Improvement of a chemically defined medium for the
sustained growth of Lactobacillus plantarum; Nutritional requirements. Curr. Microbiol.
54: 414-418.
23. Fleming, HP. 1984. Developments in cucumber fermentation. J. Chem. Technol.
Biotechnol. 34B: 241-252.
24. Fleming, HP, Kyung, KH, Breidt, F. 1995. Vegetable fermentations. In: Rehm, HJ, Reed,
G, editors. Biotechnology, Enzymes, biomass, food and feed. 9. New York: VCH
Publishers, INC. 629-661.
25. Fleming, HP, McFeeters, RF, Daeschel, MA, Humphries, EG, Thompson, RL. 1988.
Fermentation of cucumber in anaerobic tanks. J. Food. Sci. 53: 127-133.
26. Fleming, HP, McFeeters, RF, Thompson RL. 1987. Effects of sodium chloride
concentration on firmness retention of cucumbers fermented and stored with calcium
chloride. J. Food. Sci. 52: 653-657.
27. Fleming, HP, Thompson, RL, Bell, TA, Hontz, LH. 1978. Controlled fermentation of
sliced cucumbers. J. Food. Sci. 43: 888-891.

76
28. Font de Valdez, de Giori, G, Garro, M, Mozzi, F, Oliver G. 1990. Lactic acid bacteria
from naturally fermented vegetables. Microbiol. Alim. Nutr. 8: 175-179.
29. Ford, JE, Perry, KD, Briggs, CAE. 1958. Nutrition of lactic acid bacteria isolated from
rumen. J. Gen. Microbiol. 18: 273-284.
30. Freese, E, Sheu, CW, Galliers, E. 1973. Function of lipophilic acids as antimicrobial food
additives. Nature. 241:321-325.
31. Gates, K, Costilow, RN. 1981. Factors influencing softening of salt stock pickles in air
purged fermentations. J. Food. Sci. 46: 274-282.
32. Giraud, E, Lelong, B, Raimbault, M. 1991. Influence of pH and lactate concentration on
the growth of Lactobacillus plantarum. Appl. Microbiol. Biotechnol. 36: 96-99.
33. Gunsalus, IC, Horecker, BL, Wood, WA. 1955. Pathways of carbohydrate metabolism in
micro-organisms. Bacteriol. Rev. 19: 79-94.
34. Hammes, WP, Weiss, N, Holzapfel, W. 1991. The genera Lactobacillus and
Carnobacterium. In: The Prokaryotes. A handbook on the biology of bacteria:
Ecophysiology, Isolation, Identification and application. Balows, A, Truper, HG,
Dworkin, M, Harder, W, Schleifer, KH, editors. NewYork: Springer Verlag. 1535-1594.
35. Handley, LW, Pharr, DM, McFeeters, RF. 1983, Carbohydrate changes during
maturation of cucumber fruit: Implications for sugar metabolism and transport. Plant.
Physiol. 72: 498-502.
36. He´bert, EM, Raya, RR. De Giori, G. 2004. Evaluation of minimal nutritional
requirements of lactic acid bacteria used in functional foods. In: Spencer, JFT, Ragout de
Spencer, AL, editors. Environmental Microbiology. Series Methods in Biotechnology.
New Jersy: Humana Press Inc. 139-148.
37. Hendrix, JE. 1982. Sugar translocation in two members of the Curcurbitaceae. Plant. Sci.
Lett. 25: 1-7.
38. Hills, GM. 1943. Experiments on the function of pantothenate in bacterial metabolism.
Biochem. J. 37: 418-425.
39. Hofvendahl, K, Hahn-Hägerdal, B. 2000. Factors affecting the fermentative lactic acid
production from renewable resources. Enz. Micro. Tech. 26: 87-107.
40. Hunter, DR, Segel, IH. 1973. Effect of weak acids on amino acid transport by Penicillium
chrysogenum: evidence of a proton or charge gradient as the driving force. J. Bacterio.
113: 1184-1192.

77
41. Hutkins, RW, Nannen, NL. 1993. pH homeostasis in lactic acid bacteria. J. Dairy. Sci.
76: 2354-2365.
42. Kandler, O, Weiss, N. 1986. Genus lactobacillus Beijerinck, 1901, 212AL. In: Sneath,
PHA, Mair, NS, Sharpe, ME, Holt, JG, editors. Bergey's manual of systematic
bacteriology. 2nd
ed. Baltimore: The Williams and Wilkins Co. 1208-1234.
43. Kashket, ER. 1987. Bioenergetics of lactic acid bacteria: cytoplasmic pH and
osmotolerance. FEMS. Microbiol. Rev. 46: 233-244.
44. Kask, S, Laht, TM, Pall, T, Paalme, T. 1999. A study on growth chacrateristics and
nutrient consumption of Lactobacillus plantarum in a-stat culture. Ant. Van. Lee.
75:309-320.
45. Kemp, TL, Karim, MN, Linden, JC. 1989. Response surface optimization of
Lactobacillus plantarum batch growth. Biotechnol. Lett. 11: 817-820.
46. Klein, JR, Kamin, H. 1942. Inhibition of the d-amino acid oxidase by benzoic acid. J.
Biol. Chem. 138: 507-512.
47. Kligler, IJ, Grossowicz, N, Bergner, S. 1943a. Studies on the role of niacin and thiamine
in the metabolism of glucose by Staphylococcus aureus. J. Bacteriol. 46: 399-403.
48. Kligler, IJ, Grossowicz, N, Bergner, S. 1943b. Inhibition of bacterial growth by glucose
in media devoid of nicotinic acid. Proc. Soc. Exp. Biol. Med. 52: 332-334.
49. Koser, SA. 1968. Lactobacillus. In: Vitamin requirements of bacteria and yeasts.
Springfield, Illinois: Thomas, CC. 340-366.
50. Ledesma, OV, Holgado, APR, Oliver, G, de Giori, GS, Raibaud, P, Galpin, JV. 1977. A
synthetic medium for comparative nutritional studies of lactobacilli. J. Appl. Bacteriol.
42: 123-133.
51. Lees, R. 1971. Laboratory techniques. In: Lees, R, editor. Laboratory handbook of
methods of food analysis. 2nd
ed. Cleveland: CRC Press. 8-16.
52. Li, KY. 2006. Fermentation: principles of microorganisms. In: Hui, YH, editor.
Handbook of food science technology and engineering. 4th
ed. Florida: CRC Taylor and
Francis group. 6-7.
53. Liu, SQ, Holland, R, Crow, VL. 2003. The potential of dairy lactic acid bacteria to
metabolize amino acids via non-transaminating reactions and endogenous transamination.
Int. J. Food. Microbiol. 86: 257-269.
54. Lu, Z, Fleming, HP, McFeeters, RF, Yoon, SA. 2002. Effects of anions and cations on
sugar utilization in cucumber juice fermentation. J. Food. Sci. 67: 1155-1161.

78
55. Lu, Z, Fleming, HP. 2001. Differential glucose and fructose utilization during cucumber
juice fermentation. J. Food. Sci. 66: 162-166.
56. Lyman, CM, Moseley, O, Wood, S, Butler, B, Hale, F. 1947. Some chemical factors,
which influence the amino acid requirements of the lactic acid bacteria. J. Biol. Chem.
167: 177-187.
57. Macleod, RA, Snell, EE. 1947. Some mineral requirements of the lactic acid bacteria. J
Biol. Chem. 170: 351-365.
58. Maki, M. 2004. Lactic Acid Bacteria in Vegetable Fermentations. In: Salminen, S,
Wright, AV, Ouwehand, A, editors. Lactic acid bacteria Microbiological and functional
aspects. 3rd
ed. New York: Marcel Dekker. 419-430.
59. McCombs, CL, Sox, HN, Lower RL. 1976. Sugar and dry matter content of cucumber
fruits. Hort. Sci. 11: 245-247.
60. McDonald, LC, Fleming, HP, Hassan, HM. 1990. Acid tolerance of Leuconostoc
mesenteroides and Lactobacillus plantarum. App. Envi. Microbiol. 56: 2120-2124.
61. McFeeters, RF. 1988. Effects of fermentation on the nutritional properties of food. In:
Karmas, E, Harris, RS. Nutritional evaluation of food processing. New York: Van
Nostrand Reinhold Co. 423-446.
62. Morishita, T, Deguchi, Y, Yajima, M, Sakurai, T, Yura, T. 1981. Multiple nutritional
requirements of Lactobacilli: genetic lesions affecting amino acid biosynthetic pathways.
J. Bacteriol. 148: 64-71.
63. Moretro, T, Hagen, BF, Axelsson, L. 1998. A new, completely defined medium for meat
lactobacilli. J. Appl. Microbiol. 85: 715-722.
64. Mussato, S, Fernandes, M, Mancilha, IM, Roberto, IC. 2008. Effects of medium
supplementation and pH control on lactic acid production from brewer’s spent grain.
Biochem. Eng. J. 40: 437-444.
65. Mundt, JO. 1984. Enterococci. In: Sneath, PHA, Mair, NS, Sharpe, ME, Holt, JG, editors.
Bergey's manual of systematic bacteriology. 2nd
ed. Baltimore: The Williams and Wilkins
Co. 1063-1066.
66. Nelson, N. 1944. A photometric adaptation of the Somogyi method for the determination
of glucose. J. Biol. Chem. 153: 375-380.
67. Nilsson, R, Alm, F, Burstrom, D. 1942. Manganese as a substitute for magnesium in the
basal metabolism and anabolism of cells. Arch. Microbiol. 12: 353.

79
68. Nout, MJR, Rombouts. 1992. Fermentative preservation of plant foods. J. Appl.
Bacteriol. 73: 136S-147S.
69. Orla-Jensen, S. 1942. The Lactic acid bacteria. 2nd
ed. Copenhagen: Host and Son. 165-
196.
70. Passos, FV, Fleming, HP, Ollis, DF, Felder, RM, McFeeters, RF. 1994. Kinetics and
modeling of lactic acid production by Lactobacillus plantarum. Appl. Envi. Microbiol.
60: 2627-2636.
71. Pederson, CS, Albury, MN. 1950. Effect of temperature upon bacteriological and
chemical changes in fermenting cucumbers. New York State Agr. Expt. Sta. Tech. Bull.
169.
72. Pederson, CS, Albury, MN. 1969. The sauerkraut fermentation. New York State Agric.
Exp. Sta. Tech. Bull. No. 824. Geneva, NY.
73. Peterson, WH, Peterson, MS. 1945. Relation of bacteria to vitamins and other growth
factors. Bacteriol. Rev. 9: 49-109.
74. Raccach, M. 1982. Method of fermenting vegetables. US Patent 4 342 786.
75. Raccach, M. 1985. Manganese and lactic acid bacteria. J. Food. Prot. 48: 895-898.
76. Ragheb, HS, Fabian. FW. 1956. Addition of sugar, amino acids and corn steep liquor to
cucumber fermentation. App. Envi. Microbiol. 5:253-262.
77. Ragosa, M, Franklin JG, Perry KD. 1961. Correlation of the vitamin requirements with
cultural and biochemical characteristics of Lactobacillus sp. J. Gen. Microbiol. 25:473-
482.
78. Rosen, S, Fabian, FW. 1953. The importance of Bio, niacin and pantothenic acid in
cucumber fermentation. Food. Tech. 7:244-247.
79. Russell, C, Bhandari, RR, Walker, TK. 1954. Vitamin requirements of thirty-four lactic
acid bacteria associated with brewery products. J. Gen. Microbiol. 10: 371-376.
80. Ruiz-Barba, JL, Jimenez-Diaz, R. 1995. Availability of essential B-group vitamins to
Lactobacillus plantarum in green olive fermentation brines. App. Environ. Microbiol. 61:
1294-1297.
81. Saguir, FM, Nadra, MCM. 2007. Improvement of a chemically defined medium for the
sustained growth of Lactobacillus plantarum: Nutritional requirements. Curr. Microbiol.
54: 414-418.

80
82. Shankman, S, Camien, MN, Block, H, Merrifield, RB, Dunn, MS. 1947. Vitamin
requirements of lactic acid bacteria. J. Biol. Chem. 168: 23-32.
83. Salih, AG, Drilleau, JF. 1990. Les vegetaux fermentes, aliments potentials en France. Ind.
Aliment. Agric. 107:350-355.
84. Snell, EE. 1946. The nutritional requirements of the lactic acid bacteria and their
application to biochemical research. J. Bacteriol. 50: 373-382.
85. Snell, EE, Strong, FM. 1939. The effect of riboflavin and of certain synthetic flavins on
the growth of lactic acid bacteria. Enzymologia. 6: 186-193.
86. Snell, EE, Wright, LD. 1941. A microbiological method for the determination of
nicotinic acid. J. Biol. Chem. 139: 675-686.
87. Snell, EE, Strong, FM, Peterson, WH. 1939. Growth factors for bacteria VIII.
Pantothenic and nicotinic acids as essential growth factors for lactic and propionic acid
bacteria. J. Bacteriol. 38: 293-308.
88. Somogyi, M. 1952. Notes on sugar determination. J. Biol. Chem. 195: 19-23.
89. Stokes, JL, Gunness, M. 1943. Pyridoxamine and the synthesis of amonia acids by
lactobacilli. Sci. 101:43-45.
90. Thompson, J. 1987. Sugar transport in the lactic acid bacteria. In: Reizer, J, Petrofsky, A,
editors. Sugar transport and metabolism in gram-positive bacteria. Chichester: Ellis
Horwod Ltd. 13-38.
91. USDA National Nutrient Database for Standard Reference. Release 13. November 1999.
www.nal.usda.gov.
92. Weymarn, NV, Hujanen, M, Leisola, M. 2002. Production of D-mannitol by
heterofermentative lactic acid bacteria. Pross. Biochem. 37: 1207-1213.
93. Williams, AG, Noble, J, Banks, JM. 2001. Catabolism of amino acids by lactic acid
bacteria isolated from Cheddar cheese. Int. Dairy J. 11, 203-215.
94. Woolley, WD. 1941. Manganese and the growth of lactic acid bacteria. J. Biol. Chem.
140: 311-312.

81
APPENDIX
Table 1: Nutrient content of cucumber (raw and peeled, raw and unpeeled)
USDA National Nutrient Database for Standard References, Release 23 (2010)
Nutrient Units Value per 100g of edible portion
Proximates
Cucumber
with peel, raw
Cucumber
peeled, raw
Water g 95.23 96.73
Energy kcal 15.00 12.00
Energy kj 65.00 52.00
Protein g 0.65 0.59
Total lipid (fat) g 0.11 0.16
Ash g 0.38 0.36
Carbohydrate, by difference g 3.63 2.16
Fiber, total dietary g 0.50 0.70
Sugars, total g 1.67 1.38
Sucrose g 0.03 0.00
Glucose (dextrose) g 0.76 0.63
Fructose g 0.87 0.75
Lactose g 0.00 0.00
Maltose g 0.01 0.00
Galactose g 0.00 0.00
Starch g 0.83 0.08
Minerals
Calcium, Ca mg 16.000 14.000
Iron, Fe mg 0.280 0.220
Magnesium, Mg mg 13.000 12.000
Phosphorus, P mg 24.000 21.000
Potassium, K mg 147.000 136.000
Sodium, Na mg 2.000 2.000
Zinc, Zn mg 0.200 0.170
Copper, Cu mg 0.041 0.071
Manganese Mn mg 0.079 0.073
Fluoride, F mcg 1.300 1.300
Slenium, Se mcg 0.300 0.100
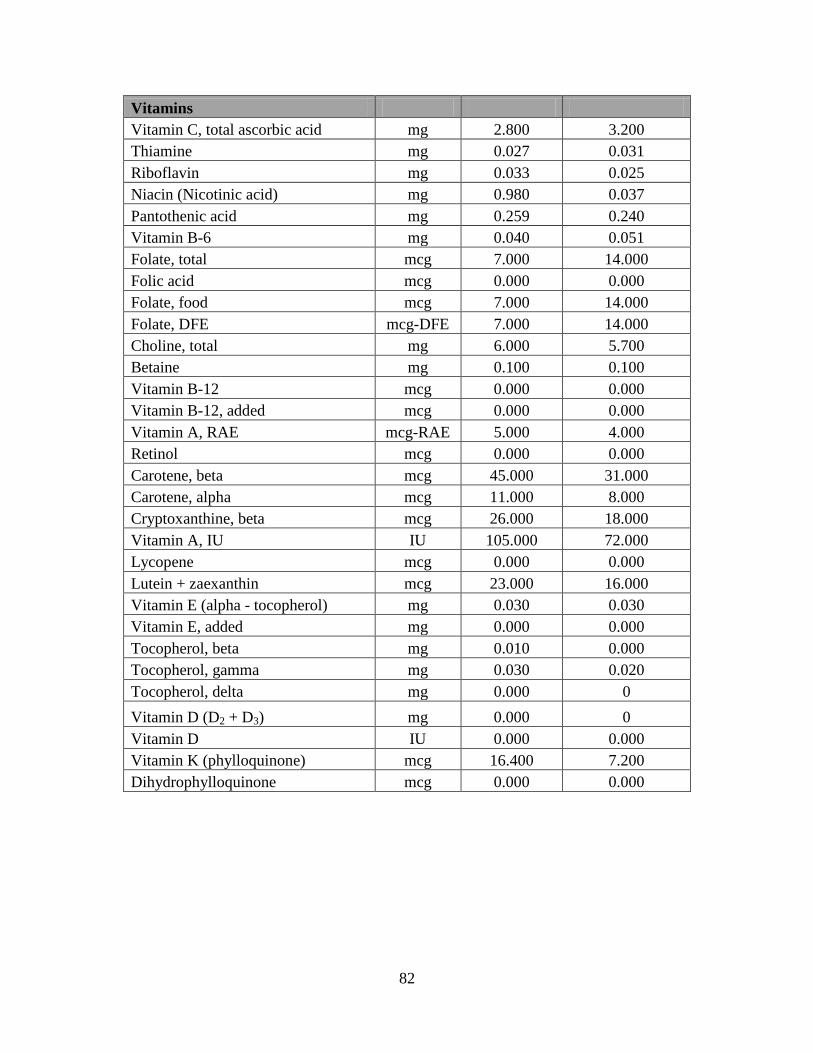
82
Vitamins
Vitamin C, total ascorbic acid mg 2.800 3.200
Thiamine mg 0.027 0.031
Riboflavin mg 0.033 0.025
Niacin (Nicotinic acid) mg 0.980 0.037
Pantothenic acid mg 0.259 0.240
Vitamin B-6 mg 0.040 0.051
Folate, total mcg 7.000 14.000
Folic acid mcg 0.000 0.000
Folate, food mcg 7.000 14.000
Folate, DFE mcg-DFE 7.000 14.000
Choline, total mg 6.000 5.700
Betaine mg 0.100 0.100
Vitamin B-12 mcg 0.000 0.000
Vitamin B-12, added mcg 0.000 0.000
Vitamin A, RAE mcg-RAE 5.000 4.000
Retinol mcg 0.000 0.000
Carotene, beta mcg 45.000 31.000
Carotene, alpha mcg 11.000 8.000
Cryptoxanthine, beta mcg 26.000 18.000
Vitamin A, IU IU 105.000 72.000
Lycopene mcg 0.000 0.000
Lutein + zaexanthin mcg 23.000 16.000
Vitamin E (alpha - tocopherol) mg 0.030 0.030
Vitamin E, added mg 0.000 0.000
Tocopherol, beta mg 0.010 0.000
Tocopherol, gamma mg 0.030 0.020
Tocopherol, delta mg 0.000 0
Vitamin D (D2 + D3) mg 0.000 0
Vitamin D IU 0.000 0.000
Vitamin K (phylloquinone) mcg 16.400 7.200
Dihydrophylloquinone mcg 0.000 0.000

83
Lipids
Fatty acids, total saturated g 0.037 0.013
4 : 0 g 0.000 0.000
6 : 0 g 0.000 0.000
8 : 0 g 0.000 0.000
10 : 0 g 0.000 0.000
12 : 0 g 0.000 0.000
14 : 0 g 0.005 0.002
15 : 0 g 0.000 0.000
16 : 0 g 0.028 0.010
17 : 0 g 0.000 0.000
18 : 0 g 0.005 0.002
20 : 0 g 0.000 0.000
22 : 0 g 0.000 0.000
24 : 0 g 0.000 0.000
Fatty acids, total monounsaturated g 0.005 0.002
14 : 1 g 0.000 0.000
15 : 1 g 0.000 0.000
16 : 1 Undifferentiated g 0.000 0.000
17 : 1 g 0.000 0.000
18 : 1 Undifferentiated g 0.005 0.002
20 : 1 g 0.000 0.000
22 : 1 Undifferentiated g 0.000 0.000
20 : 2 n-6 c, c g 0.000 0.000
Fatty acids, total polyunsaturated g 0.032 0.003
18 : 2 Undifferentiated g 0.028 0.002
18 : 3 Undifferentiated g 0.005 0.002
18 : 4 g 0.000 0.000
20 : 3 Undifferentiated g 0.000 0.000
20 : 5 n-3 (EPA) g 0.000 0.000
22 : 5 n-3 (DPA) g 0.000 0.000
22 : 6 n-3 (DHA) g 0.000 0.000
Cholesterol mg 0.000 0.000
Amino acids
Tryptophan g 0.005 0.007
Threonine g 0.019 0.012
Isoleucine g 0.021 0.012
Leucine g 0.029 0.025

84
Lysine g 0.029 0.025
Methionine g 0.006 0.012
Cystine g 0.004 0.007
Phenylalanine g 0.019 0.031
Tyrosine g 0.011 0.002
Valine g 0.022 0.012
Arginine g 0.044 0.031
Histidine g 0.010 0.002
Alanine g 0.024 0.031
Aspartic acid g 0.041 0.037
Glutamic acid g 0.196 0.204
Glycine g 0.024 0.025
Proline g 0.015 0.012
Serine g 0.020 0.025
Others
Alcohol, ethyl g 0 0
Caffeine mg 0 0
Theobromine mg 0 0

85
Table 2: Nutrient composition of MRS basal medium
(Fabiana and Nadra 2007)
Constituent
Concentration
(g/L)
Glucose 10
Potassium acetate 10
KH2PO4 2
Sodium thioglycollate 0.5
MgSO4.7H2O 0.15
MnSO4.4H2O 0.02
FeSO4.7H2O 0.01
Tween80 0.001
Adenine 0.05
Cytidylic acid 0.05
Deoxyguanosine 0.05
Guanine HCl 0.05
p-Aminobenzoic acid 0.00001
Vitamin B12 0.000001
Calcium pantothenate 0.001
D-Biotin 0.00001
Folic acid 0.0001
Nicotinic acid 0.001
Piridoxal ethyl acetal HCL 0.0005
Riboflavin 0.0005
Thiamine HCl 0.001
DL-Alanine 0.2
L-Arginine 0.005
L-Asparagine 0.2
L-Aspartic acid 0
L-Cysteine-HCl 0.2
L-Glutamic acid 0.15
L-Glycine 0
L-Histidine-HCl 0.05
L-Isoleucine 0.05
L-Leucine 0.06
L-Lysine-HCl 0.05
L-Methionine 0.05
L-Phenylalanine 0.04
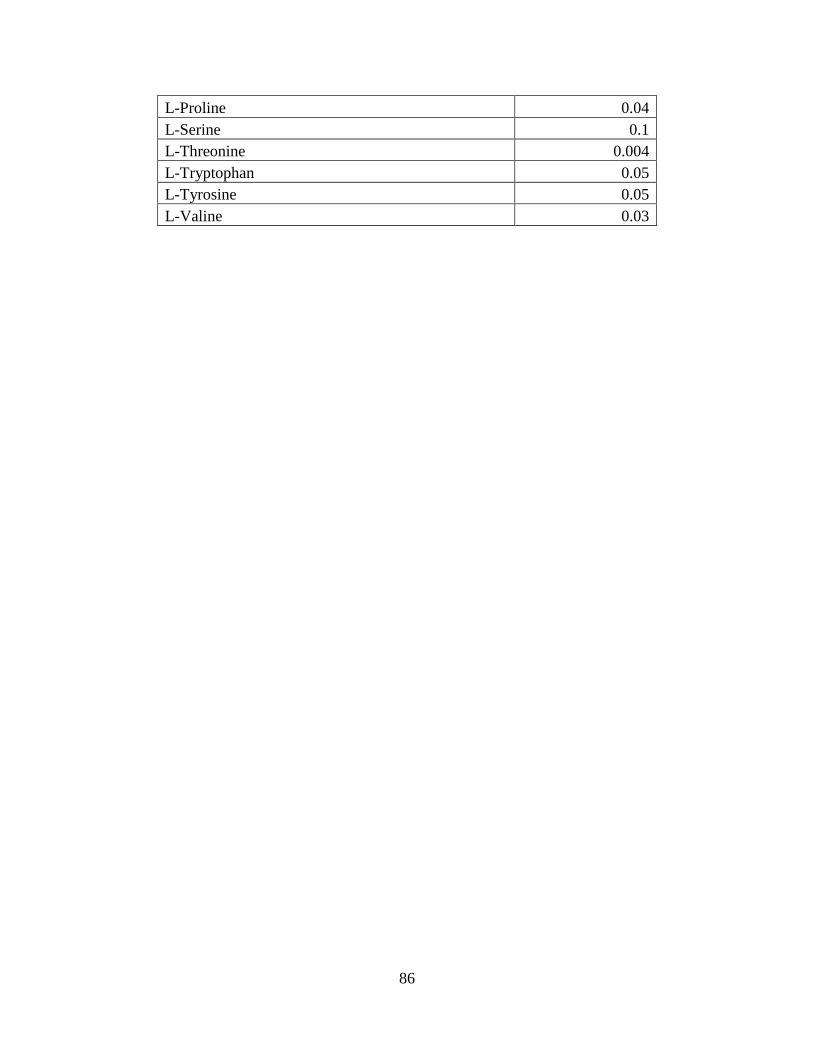
86
L-Proline 0.04
L-Serine 0.1
L-Threonine 0.004
L-Tryptophan 0.05
L-Tyrosine 0.05
L-Valine 0.03

87
Figure 3: Effect of Leu, Ile, Trp and Val on LAB maximum population
Note:
The logarithms of the viable LAB units were modeled as a function of time allowing the
regression coefficient to depend on nutrient types and concentration. The function consisted of
two segments, the first of which was a quadratic function of time and the second was a quadratic
or a horizontal line, depending on the nutrient and concentration. The estimated maximum log
units were determined from the fitted model.
0
2
4
6
8
10
12
14
16
Day
0 5 10 15 20 25 30
Concentration
Control0.38 nM0.76 nM1.14 nM
LA
B log c
ount
Isoleucine
0
2
4
6
8
10
12
14
16
Day
0 5 10 15 20 25 30
Concentration
Control0.38 nM0.76 nM1.14 nM
LA
B log c
ount
Leucine
0
2
4
6
8
10
12
14
16
Day
0 5 10 15 20 25 30
Concentration
Control0.25 nM0.49 nM0.75 nM
LA
B log c
ount
Trypotophane
0
2
4
6
8
10
12
14
16
Day
0 5 10 15 20 25 30
Concentration
Control0.43 nM0.85 nM1.28 nM
LA
B log c
ount
Valine
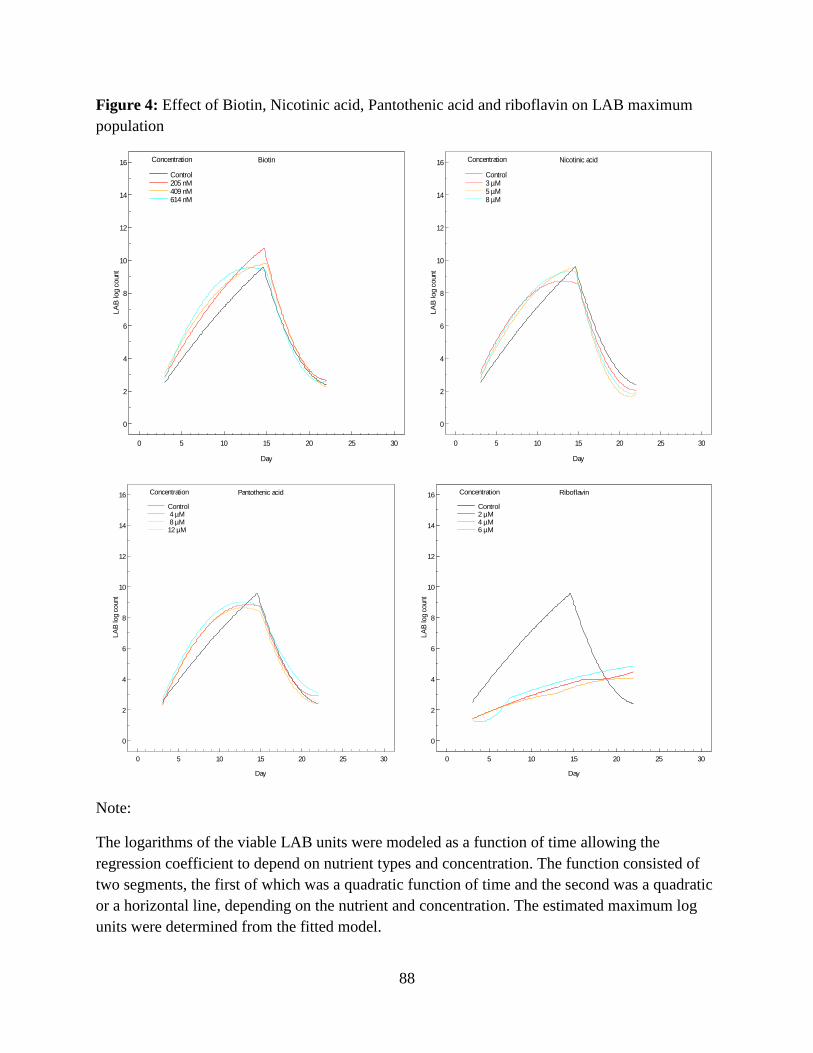
88
Figure 4: Effect of Biotin, Nicotinic acid, Pantothenic acid and riboflavin on LAB maximum
population
Note:
The logarithms of the viable LAB units were modeled as a function of time allowing the
regression coefficient to depend on nutrient types and concentration. The function consisted of
two segments, the first of which was a quadratic function of time and the second was a quadratic
or a horizontal line, depending on the nutrient and concentration. The estimated maximum log
units were determined from the fitted model.
0
2
4
6
8
10
12
14
16
Day
0 5 10 15 20 25 30
Concentration
Control205 nM409 nM614 nM
LA
B log c
ount
Biotin
0
2
4
6
8
10
12
14
16
Day
0 5 10 15 20 25 30
Concentration
Control3 µM5 µM8 µM
LA
B log c
ount
Nicotinic acid
0
2
4
6
8
10
12
14
16
Day
0 5 10 15 20 25 30
Concentration
Control 4 µM 8 µM12 µM
LA
B log c
ount
Pantothenic acid
0
2
4
6
8
10
12
14
16
Day
0 5 10 15 20 25 30
Concentration
Control2 µM4 µM6 µM
LA
B lo
g co
unt
Riboflavin

89
Figure 5: Effect of magnesium and manganese on LAB maximum population
Figure 6: Effect of Bio, Ile and Val used in combination on LAB maximum population
Note:
The logarithms of the viable LAB units were modeled as a function of time allowing the
regression coefficient to depend on nutrient types and concentration. The function consisted of
two segments, the first of which was a quadratic function of time and the second was a quadratic
or a horizontal line, depending on the nutrient and concentration. The estimated maximum log
units were determined from the fitted model.
0
2
4
6
8
10
12
14
16
Day
0 5 10 15 20 25 30
Concentration
Control127 µM253 µM380 µM
LA
B log c
ount
Magnesium
0
2
4
6
8
10
12
14
16
Day
0 5 10 15 20 25 30
Concentration
Control 415 µM 830 µM1245 µM
LA
B lo
g co
unt
Manganese
0
2
4
6
8
10
12
Day
0 5 10 15 20 25 30
Nutrient
ControlBiotinValineIsoleucineBiotin*ValineBiotin*IsoleucineValine*IsoleucineBiotin*Valine*Isoleucine
LA
B log c
ount

90
Figure 7: Effect of Bio, Ile and Val on LAB maximum population
Note:
The logarithms of the viable LAB units were modeled as a function of time allowing the
regression coefficient to depend on nutrient types and concentration. The function consisted of
two segments, the first of which was a quadratic function of time and the second was a quadratic
or a horizontal line, depending on the nutrient and concentration. The estimated maximum log
units were determined from the fitted model.
0
2
4
6
8
10
12
Day
0 5 10 15 20 25 30
Concentration
Control103 nM205 nM409 nM614 nM819 nM
LA
B log c
ount
Biotin
0
2
4
6
8
10
12
Day
0 5 10 15 20 25 30
Concentration
Control0.19 mM0.38 mM0.76 mM1.14 mM1.52 mM
LA
B log c
ount
Isoleucine
0
2
4
6
8
10
12
Day
0 5 10 15 20 25 30
Concentration
Control0.43 mM0.85 mM1.28 mM1.71 mM2.56 mM
LA
B log c
ount
Valine

91
Figure 8: Comparing data form microscopic count technique (MC) and plate count technique
(PC), the effect of Bio, Ile and Val on the total lactic acid bacteria count on complete
fermentation of cucumber juice.
0
2
4
6
8
10
12
Control Biotin Valine Isoleucine Biotin *
Valine
Biotin *
Isoleucine
Valine *
Isoleucine
Biotin *
Valine *Isoleucine
Lo
g c
fu/m
l
Treatments
Day-7 (MC)
Day-7 (PC)
Day-14 (MC)
Day-14 (PC)
Day-21 (MC)
Day-21 (PC)