Embed Size (px)
Citation preview

EFFECT OF OWNERSHIP, CAPITAL AND COST
STRUCTURES ON FINANCIAL PERFORMANCE OF
COMMERCIAL BANKS IN KENYA
BY
ELIUD KAGEMA MAINA
UNITED STATES INTERNATIONAL UNIVERSITY -
AFRICA
SUMMER 2017

EFFECT OF OWNERSHIP, CAPITAL AND COST
STRUCTURES ON FINANCIAL PERFORMANCE OF
COMMERCIAL BANKS IN KENYA
BY
ELIUD KAGEMA MAINA
A Research Report Submitted to the Chandaria Business School
of Business in partial Fulfilment of the Requirement for the
Degree of Masters in Business Administration (MBA)
UNITED STATES INTERNATIONAL UNIVERSITY -
AFRICA
SUMMER 2017

ii
STUDENT’S DECLARATION
I, the undersigned, declare that this is my original work and has not been submitted to any other
college, institution or university other than the United States International University in Nairobi
for academic credit.
Signed…………………………. Date……………………………….
Eliud Kagema Maina (646971)
This project has been presented for examination with my approval as the appointed supervisor.
Signed…………………………. Date………………………………..
Dr. Elizabeth Kalunda
Signed………………………….. Date……………………………….
Dean, Chandaria School of Business

iii
COPYRIGHT
All rights reserved. No part of this project may be produced or transmitted in any form or by any
means, electronic, mechanical, including photocopying, recording or any information storage
without prior written permission from the author.
©2017 by Eliud Kagema.

iv
ABSTRACT
Financial performance of commercial banks is very important since banks play an important
financial intermediation role in the economy. One of the determinants of commercial banks’
financial performance is the banks’ ownership structure, the capital structure, and the cost structure
and this was the focus of the study. The objective of the study sought to address the following
three research questions in the context of Kenya; How does the ownership structure of banks affect
financial performance? How does the capital structure of commercial banks affect the bank
performance, and finally, how does the cost structure of the bank affect financial performance?
ROA and ROE was used to assess financial performance. This research applied descriptive and
inferential statistics to determine the relationship between the independent variables and the
dependent variables of the three objectives. A descriptive research design was applied to a
population of forty two commercial banks operating in Kenya. Secondary data was used and was
collected from banks’ published annual reports and financial reports. Regression and correlation
analyses was used and based on the association among the variables. The software SPSS was the
analysis tool for this study. The study aimed to bridge the knowledge gap on some of the elements
influencing financial performance and profitability of commercial banks in Kenya and seeks to be
of benefit to the commercial banks, regulatory bodies, government, and investors. The study
findings indicated that ownership structure has a significant impact on both return on assets and
return on equity. Private-public ownership had a significant impact on financial performance but
foreign-local ownership did not have a significant impact on financial performance. Capital
structure also had a significant impact on both return on assets and return on equity, with debt-to-
total assets ratio having a significant effect on return on assets, but had no significant effect on
debt-to-total equity ratio. With regards to the third objective, the study found that cost structure
had a significant effect on both return on assets and return on equity, with loan loss-to-income
ratio the only variable having a significant effect on return on assets, while all the three variables,
had a significant effect on the return on equity. The study recommended that proper management
guidelines should be provided for both public and private commercial banks since private-
managed banks perform better than public-managed. Proper governance and use of Acts such as
the Sarbanes-Oxley Act and the Cadbury report are important for management of banks. The study
also recommended that individual banks should identify their optimal level of external debt by
analysing the costs and the benefits in order to maximize profitability. Finally, the study

v
recommended that operational costs should be minimized without interfering with the quality of
service, and proper vetting of loan applicant should be done to minimize loan losses.

vi
ACKNOWLEDGMENT
I am gratefully indebted to all those who have contributed to the success of this research project.
First and foremost I recognize and uphold my Almighty Lord who makes things beautiful at His
own time. My sincere gratitude goes to my supervisor, Dr Elizabeth Kalunda for tirelessly and
willingly sharing her scholarly experience and for making this dissertation a success undertaking.
She has been available for consultation, her professional guidance and supervision added value to
this work. I would also thank the Central Bank of Kenya staff for the support they gave me during
data collection. Their assistance in providing the secondary banking data relevant for the study
enabled the study to be what it is.

vii
DEDICATION
This project is dedicated to my wife Anne Kagema who has been a source of inspiration to me
throughout the research work, strong pillar she is. My daughter Eliana Kagema who occasionally
had to miss dad’s play time. My father Christopher Maina for encouragement, my mother Lucy
Wanjiru who taught me how to dream, the value of hard work and commitment and my lecturers
who have made this dream come true.

viii
TABLE OF CONTENTS
STUDENT’S DECLARATION .................................................................................................. II
COPYRIGHT .............................................................................................................................. III
ABSTRACT ................................................................................................................................. IV
ACKNOWLEDGMENT ............................................................................................................ VI
DEDICATION........................................................................................................................... VII
TABLE OF CONTENTS ........................................................................................................ VIII
LIST OF FIGURES .................................................................................................................... XI
LIST OF TABLES .................................................................................................................... XII
CHAPTER ONE ........................................................................................................................... 1
1.0 INTRODUCTION............................................................................................................. 1
1.1 Background of the Study ........................................................................................................ 1
1.2 Statement of the Problem ........................................................................................................ 4
1.3 General Objective ................................................................................................................... 5
1.4 Specific Research Objectives .................................................................................................. 5
1.5 Significance of the Study ........................................................................................................ 6
1.6 Scope of the Study .................................................................................................................. 6
1.7 Definition of Terms............................................................................................................. 7
1.8 Chapter Summary ............................................................................................................... 8
CHAPTER TWO .......................................................................................................................... 9
2.0 LITERATURE REVIEW ................................................................................................ 9
2.1 Introduction ............................................................................................................................. 9

ix
2.2 Ownership Structure and its Effects on Performance of Commercial Banks ......................... 9
2.3 Capital Structure and Its Effect on Financial Performance of Commercial Banks .............. 13
2.4 Cost Structure and its Effect on Performance of Commercial Banks ................................... 17
CHAPTER THREE .................................................................................................................... 23
3.0 RESEARCH METHODOLOGY .................................................................................. 23
3.1 Introduction ........................................................................................................................... 23
3.2 Research Design.................................................................................................................... 23
3.3 Population ............................................................................................................................. 23
3.4 Data Collection Methods .................................................................................................. 24
3.5 Data Analysis Methods ..................................................................................................... 25
3.6 Chapter Summary ............................................................................................................. 26
CHAPTER FOUR ....................................................................................................................... 27
4.0 RESULTS AND FINDINGS .......................................................................................... 27
4.1 Introduction ....................................................................................................................... 27
4.2 Descriptive Analysis ......................................................................................................... 27
4.3 Effect of Ownership Structure on Financial Performance ................................................ 35
4.4 Effect of Capital Structure on Financial Performance ...................................................... 41
4.5 Effect of Cost Structure on Financial Performance .......................................................... 44
4.6 Chapter Summary ............................................................................................................. 48
CHAPTER FIVE ........................................................................................................................ 49
5.0 DISCUSSION, CONCLUSIONS AND RECOMMENDATIONS ............................. 49
5.1 Introduction ....................................................................................................................... 49
5.2 Summary of the Study ...................................................................................................... 49
5.3 Discussion ......................................................................................................................... 50

x
5.4 Conclusions ....................................................................................................................... 54
5.5 Recommendations ............................................................................................................. 55
REFERENCES ............................................................................................................................ 57
APPENDIX I: DATA COLLECTION SHEET ....................................................................... 65
APPENDIX II: WORK PLAN .................................................................................................. 66
APPENDIX III: RESEARCH BUDGET .................................................................................. 67

xi
LIST OF FIGURES
Figure 4.1: Return on Assets and Return on Equity Trends ......................................................... 30
Figure 4.2: Capital Structure Trends ............................................................................................. 31
Figure 4.3: Cost Structure Trends ................................................................................................. 32
Figure 4.4: Loan loss to income ratio ........................................................................................... 32
xii
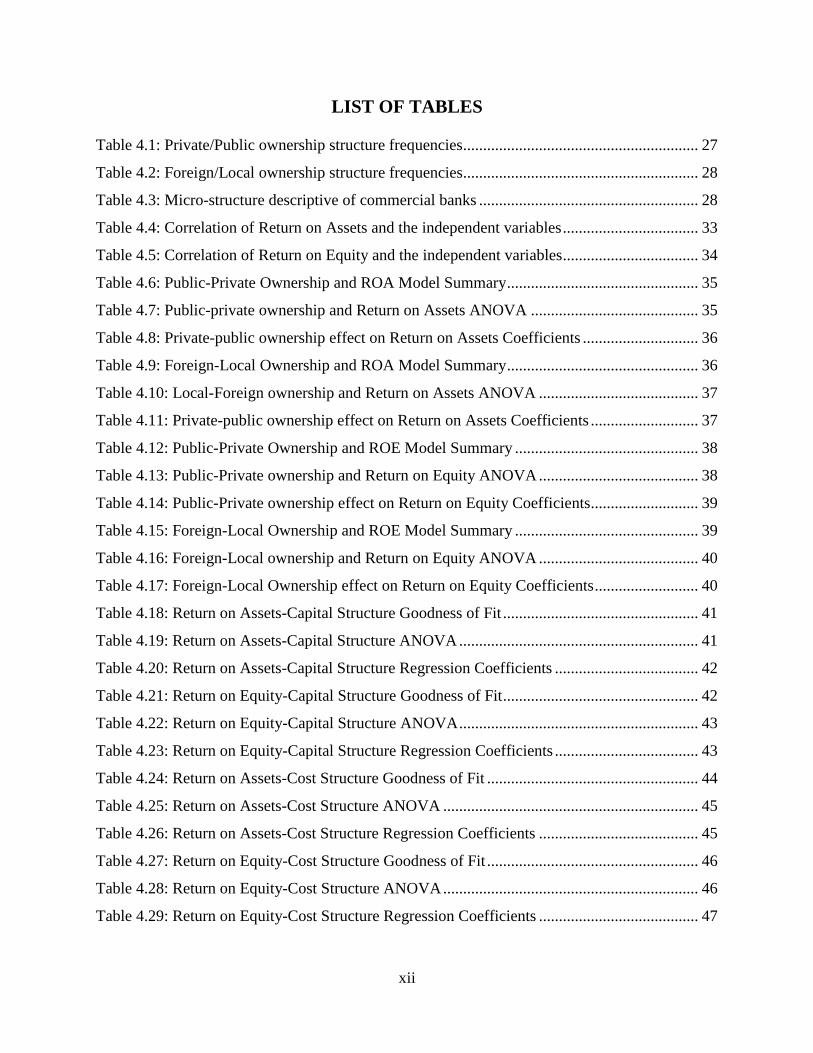
LIST OF TABLES
Table 4.1: Private/Public ownership structure frequencies........................................................... 27
Table 4.2: Foreign/Local ownership structure frequencies........................................................... 28
Table 4.3: Micro-structure descriptive of commercial banks ....................................................... 28
Table 4.4: Correlation of Return on Assets and the independent variables .................................. 33
Table 4.5: Correlation of Return on Equity and the independent variables .................................. 34
Table 4.6: Public-Private Ownership and ROA Model Summary ................................................ 35
Table 4.7: Public-private ownership and Return on Assets ANOVA .......................................... 35
Table 4.8: Private-public ownership effect on Return on Assets Coefficients ............................. 36
Table 4.9: Foreign-Local Ownership and ROA Model Summary ................................................ 36
Table 4.10: Local-Foreign ownership and Return on Assets ANOVA ........................................ 37
Table 4.11: Private-public ownership effect on Return on Assets Coefficients ........................... 37
Table 4.12: Public-Private Ownership and ROE Model Summary .............................................. 38
Table 4.13: Public-Private ownership and Return on Equity ANOVA ........................................ 38
Table 4.14: Public-Private ownership effect on Return on Equity Coefficients........................... 39
Table 4.15: Foreign-Local Ownership and ROE Model Summary .............................................. 39
Table 4.16: Foreign-Local ownership and Return on Equity ANOVA ........................................ 40
Table 4.17: Foreign-Local Ownership effect on Return on Equity Coefficients .......................... 40
Table 4.18: Return on Assets-Capital Structure Goodness of Fit ................................................. 41
Table 4.19: Return on Assets-Capital Structure ANOVA ............................................................ 41
Table 4.20: Return on Assets-Capital Structure Regression Coefficients .................................... 42
Table 4.21: Return on Equity-Capital Structure Goodness of Fit ................................................. 42
Table 4.22: Return on Equity-Capital Structure ANOVA ............................................................ 43
Table 4.23: Return on Equity-Capital Structure Regression Coefficients .................................... 43
Table 4.24: Return on Assets-Cost Structure Goodness of Fit ..................................................... 44
Table 4.25: Return on Assets-Cost Structure ANOVA ................................................................ 45
Table 4.26: Return on Assets-Cost Structure Regression Coefficients ........................................ 45
Table 4.27: Return on Equity-Cost Structure Goodness of Fit ..................................................... 46
Table 4.28: Return on Equity-Cost Structure ANOVA ................................................................ 46
Table 4.29: Return on Equity-Cost Structure Regression Coefficients ........................................ 47

1
CHAPTER ONE
1.0 INTRODUCTION
1.1 Background of the Study
Banks exist to intermediate the transactions between demanders and suppliers of money at a given
consideration and this provides valuable services to a country. To attain development there should
be a well-developed financial system to support not only the economy but also the society. A
commercial bank plays a vital role in the socio economic matters of the country. Some of the
important roles of banks in the development of a country are: promoting the saving habits of
people, capital formation and industry promotion, smoothing of trade and commerce functions,
generation of employment opportunity, support agricultural development, applying monetary
policy, and balancing of development (Singh, 2010). Earnings from these transactions form bank’s
traditional income generating activities (Teimet, Ochieng & Away, 2011). Shareholders therefore
invest money in a firm by buying shares and in return, they expect the firm to use the provided
capital in order to generate a return on the shareholder’s investment. In this context, Koller,
Goedhart and Wessels (2010) stated that the faster companies can increase their revenues and
deploy more capital at attractive rates of return, the more value they create. The combination of
growth and return on invested capital (ROIC) relative to its cost what drives value.
Banking institutions play a major part in the allocation of economic resources of countries. They
continuously facilitate smooth flow of money from depositors to investors. They are able to do so,
if they are in a position to generate enough income to cater for their operational expenses that they
incur in the course of their operations. In simpler terms, for intermediation function to be
sustainable, financial institutions must be profitable. Apart from financial intermediation, the
performance of banks financially has major impacts on countries economic growth (Teimet, et al.
2011).
Financial institutions with sound financial performance promote investment and accelerate growth
economically. Likewise, unsound financial institutions performance has a potential of causing
banking failure and crisis, which has adverse implications on growth of the economy (Madiwe,
2014). Therefore, as banks increasingly compete not only with one another but with other financial
firms both domestically and across national borders, it becomes incumbent upon them to make

2
every effort to operate efficiently. In those countries with relatively high figures for both
population per banking office and staff per banking office, efficiencies are frequently being gained
through office closings and staff reductions (Barth, Nolle & Rice, 1997).
Over the past twenty years research has indicated that banking industry in Sub-Saharan Africa
(SSA) is by far profitable compared to the rest of the countries world over. Banks in SSA have
been having an average Return on Assets (ROA) of 2% (Flamini, McDonald & Schumacher,
2009). Investment in risky businesses and ventures was among the prime reasons for the huge
returns in the area. The existence of a big gap between supply of bank service and the demand was
also a probable cause of a high profitability in banking business in SSA. This has lead into less
competition in the industry and charging of higher interest rates. This phenomenon is common in
East Africa where the few banks owned by the government take the biggest share of market.
External as well as internal aspects can influence commercial banks performance (Al-Tamimi,
2010; Aburine, 2005). These aspects can be categorized into macroeconomic variables and internal
(bank specific). The internal aspects are specific and unique company features, which influence
the bank’s operations and performance. These aspects can only be manipulated by individual
bank’s resolutions of board and management. The external aspects are factors beyond the firm’s
control; they affect all participants in the industry and have an impact on banks profitability.
Previous studies have shown that functioning of companies may as well be affected by the identity
of owners (Ongore, 2011).
The foreign and local categorization is centered on the environment of the prevailing major
ownership identity in Kenya. As stated by Central Bank of Kenya (2015) Supervision Report as
of December 2015 out of the 43 commercial banks 14 of them are foreign owned and 30 are owned
domestically. As of the year 2015, banks owned by foreigners accounted for about 31% of the
banking assets (CBK, 2015). The Kenyan financial industry is dominated by commercial banks.
In a country where commercial banks dominate the financial industry, any adversity in the industry
has a huge influence on that country’s economic growth. This is a consequence of the circumstance
that any insolvency that could occur in the industry has a greater potential of leading to bank crisis,
runs as well as triggering widespread financial predicament and monetary challenges (Kenya
Financial Sector Stability Report, 2015).
3
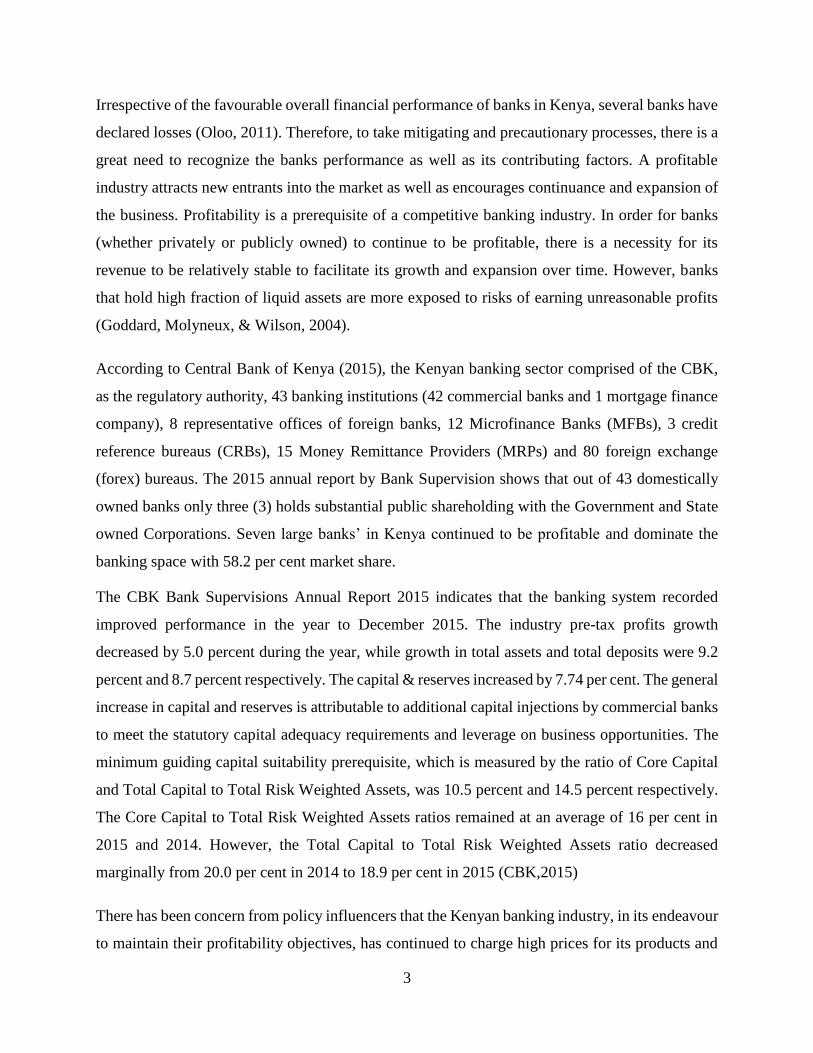
Irrespective of the favourable overall financial performance of banks in Kenya, several banks have
declared losses (Oloo, 2011). Therefore, to take mitigating and precautionary processes, there is a
great need to recognize the banks performance as well as its contributing factors. A profitable
industry attracts new entrants into the market as well as encourages continuance and expansion of
the business. Profitability is a prerequisite of a competitive banking industry. In order for banks
(whether privately or publicly owned) to continue to be profitable, there is a necessity for its
revenue to be relatively stable to facilitate its growth and expansion over time. However, banks
that hold high fraction of liquid assets are more exposed to risks of earning unreasonable profits
(Goddard, Molyneux, & Wilson, 2004).
According to Central Bank of Kenya (2015), the Kenyan banking sector comprised of the CBK,
as the regulatory authority, 43 banking institutions (42 commercial banks and 1 mortgage finance
company), 8 representative offices of foreign banks, 12 Microfinance Banks (MFBs), 3 credit
reference bureaus (CRBs), 15 Money Remittance Providers (MRPs) and 80 foreign exchange
(forex) bureaus. The 2015 annual report by Bank Supervision shows that out of 43 domestically
owned banks only three (3) holds substantial public shareholding with the Government and State
owned Corporations. Seven large banks’ in Kenya continued to be profitable and dominate the
banking space with 58.2 per cent market share.
The CBK Bank Supervisions Annual Report 2015 indicates that the banking system recorded
improved performance in the year to December 2015. The industry pre-tax profits growth
decreased by 5.0 percent during the year, while growth in total assets and total deposits were 9.2
percent and 8.7 percent respectively. The capital & reserves increased by 7.74 per cent. The general
increase in capital and reserves is attributable to additional capital injections by commercial banks
to meet the statutory capital adequacy requirements and leverage on business opportunities. The
minimum guiding capital suitability prerequisite, which is measured by the ratio of Core Capital
and Total Capital to Total Risk Weighted Assets, was 10.5 percent and 14.5 percent respectively.
The Core Capital to Total Risk Weighted Assets ratios remained at an average of 16 per cent in
2015 and 2014. However, the Total Capital to Total Risk Weighted Assets ratio decreased
marginally from 20.0 per cent in 2014 to 18.9 per cent in 2015 (CBK,2015)
There has been concern from policy influencers that the Kenyan banking industry, in its endeavour
to maintain their profitability objectives, has continued to charge high prices for its products and

4
services, and maintaining very high spreads, recording higher profitability growth rates than most
other sectors of the economy. This has witnessed several attempts in the last ten years to institute
controls in the industry. The enactment of interest capping law where interest on loans is capped
at CBR rate +4% and interest pay-out on interest earning accounts at 70% of CBR rate, has
presented another challenge to the banking industry profitability.
1.2 Statement of the Problem
The financial sector globally and locally is ever changing due to factors both micro and macro
factors where some are beyond its scope. With the growth in technology, banks have the need to
adapt in order to remain profitable and competitive. One of the ways in which they can adjust is
through adjusting/ managing their micro-structures. All over the world, there is keen interest in the
study of financial sector performance. Banks in Kenya are now facing a number of challenges such
as frequent changes in technology required for modern banking, increasing competition arising
from high customer and stakeholder expectations, increasing pressure on profitability, stringent
banking norms, worrying levels of non-performing loans, rising operating expenses (frauds and
other operational losses), shrinking size of spreads and so on. The reforms in the banking sector
have also brought profitability under pressure (Pricewaterhouse Coopers, 2014).
Previous literature on the banks profitability has largely focused on determinants of profitability
in developed economies, while little exists in emerging markets or low-income countries. The few
studies have investigated the moderating effect of ownership structure on the determining factors
of fiscal performance of banking industry in Kenya (Ongore, 2013). This study failed to address
other key variables that may influence banks’ profitability. Much of the existing empirical
evidence is on developed economies. A number of studies have been carried out on the Kenyan
banking sectors focusing on specific elements of external and internal factors affecting bank
profitability. These studies indicate a need for further investigation of the factors, which have
continued to determine profitability of the Kenyan banks. A study carried out on factors affecting
profitability of banks listed at the Nairobi Stock Exchange (NSE) by Kaneza (2016) concluded
that capital adequacy, asset quality and management efficiency all had a positive but non-
significant effect on profitability. However, the research focused on three CAMEL factors and was
limited to 10 banks listed at the NSE. This creates need for further study on other factors that affect
profitability and on higher sample size of banks.

5
Empirical underpinning shows that internal and external factors contribute largely in the
determination of banking sector profitability (Athanasoglou, Delis, & Staikouras, 2006; and
Panayiotis, Athanasoglou, Brissimis, & Mathaios, 2005). Yilmaz, (2013) suggested that the
ownership structure of the banking industry in Turkey to be less significant in explaining
profitability in this emerging markets. Ćuraka, et.al, (2012) using a dynamic panel data for a
sample of 16 commercial banks in Macedonian in the period of 2000-2005 indicated that external
characteristic (economic development, banking industry revolution and concentration) have a high
impact on profitability. Accordingly, the Structure-Conduct Performance stipulates that banks tend
to increase their profit portfolios in a concentrated market bank (Ćuraka, Poposkib, & Pepura,
2012). It is this research gap that motivated the study to formulate an objective of determining the
effects of ownership structure, capital structure and cost structure on financial performance of
commercial banks in Kenya.
1.3 General Objective
The purpose of the study was to analyse the effect of ownership, capital and cost structures on
financial performance of commercial banks in Kenya.
1.4 Specific Research Objectives
The specific objectives for the study are:
1.4.1 To evaluate the effect of ownership structure on financial performance of commercial
banks in Kenya.
1.4.2 To find out the effect of capital structure on financial performance of commercial banks in
Kenya.
1.4.3 To determine the effect of cost structure on financial performance of commercial banks in
Kenya.

6
1.5 Significance of the Study
The objective of this study is to investigate factors influencing financial performance of
commercial banks in Kenya. The observations will be of benefit to the following key stakeholders:
1.5.1 Regulatory Bodies and Government
The study will be of significance to the government and regulatory bodies to be able to formulate
proper policies that can assist in the banking structure. At the policy level, it will enable bank
supervisory authorities in Kenya define strategies and principles to be articulated and applied.
Regulatory bodies will also be able to come up with proper banking structures to safeguard
customers’ savings, and also for the banks to remain profitable and competitive. This is done
through laws, and banking regulations and framework.
1.5.2 Commercial Banks
The study is timely in view of the role of financial liberalization, technological advancements and
globalization, which are more likely to deepen financial services outreach. This study is therefore
of significance to commercial banks so that they can see how they can improve their structures so
that they are more efficient and profitable. Management can use the results of the research to
improve profitability of the institutions they manage though cost structure adjustment, debt to
equity structure maximization and balance sheet structure optimization.
1.5.3 Investors
The study will also be of great importance to the banking industry investors who want to own part
of the companies. They will be able to know structure aspects employed by banks and know how
it will affect their financial performance. They will be able to know how ownership structure,
capital structure and cost structure affect financial performance, which they can find from bank
publications.
1.6 Scope of the Study
The scope of the study will focus on all the commercial banks in Kenya. The paper will cover a
review of bank data for the years 2008 and 2015 to better develop a trend of performance, analyse
the ownership structure, capital structure, cost structures, and establish their impact on the financial
results. The study will use banks’ annual reports and bank supervision reports for relevant data.

7
1.7 Definition of Terms
1.7.1 Commercial Banks
According to the Central Bank of Kenya (2015), a commercial bank is one, which undertakes
banking business, that is, accepting money from the public and lending or investing money held.
1.7.2 Corporate Governance
According to OECD (1999) principles corporate governance is a system by which business
corporations are directed and controlled. It can also be defined as the ways in which suppliers of
capital to corporations assure themselves of getting a return on their investments (Shleifer &
Vishny, 1997).
1.7.3 Cost structure
This refers to the types and relative proportions of fixed and variable costs found within an
organization (Garisson, Noreen & Brewer, 2009).
1.7.4 Financial Performance
Measures used to evaluate how well a company is performing and its firm’s capacity to generate
new resources, from daily activities over a given period (Chen, 2006). Measure of Return on Assets
will be by calculated by dividing the profit before taxation by the bank’s asset value.
1.7.5 Financial Risk
Concerning a banking entity, this refers to the possibility that the consequence of an action or
decision could lead to an adversative impact. Such results have potential of causing a direct loss
of capital/earnings or result in imposition of limits on bank’s capacity to meet its business goals
(Echeboka et al., 2014).
1.7.6 Liquidity
It refers to the means by which a company ensures that it is capable of paying what it owes on
time, which is significant to confidence in it and to its survival as well (Ongore & Kusa, 2013).

8
1.7.7 Ownership Structure
Ownership structure can be defined on two aspects: first is ownership concentration, which means
whether a company is owned by one or few large owners/ concentrated, or owned by multiple
small holders/ dispersed/ diffused. Secondly, it can be defined through the percentage of foreign
or local ownership (Madiwe, 2014).
1.7.8 Organization Structure
This is an established pattern of relationships among the components of parts of company. It
formally defines framework of an organization’s task and authority relationships (Quangyen &
Yezhuang 2013).
1.8 Chapter Summary
The chapter provides a background overview of the study in line with the, with the concepts of the
research topic being discussed. The concepts highlighted were financial performance in banks,
Kenyan banking industry and its performance. Additionally, the chapter also highlighted problem
statement providing gaps from previous studies on factors affecting bank’s profitability, purpose
of the study, research questions, and scope of study and definition of terms. Chapter two discussed
literature review based on the study. Chapter three highlights research methodology that the
researcher used. Chapter four explore results and findings of the study. Chapter five provides
summaries and findings of the study.

9
CHAPTER TWO
2.0 LITERATURE REVIEW
2.1 Introduction
This chapter will explore the structures of commercial banks and its effects on financial
performance in Kenya. In addition, this chapter discusses literature review based on the following
specific objectives; effect of ownership structure on financial performance of commercial banks
in Kenya, effect of capital structure on financial performance of commercial banks in Kenya and
effect of cost structure on financial performance of commercial banks in Kenya.
2.2 Ownership Structure and its Effects on Performance of Commercial
Banks
2.2.1 Ownership Structure and Profitability
Bank ownership structure indicates who the shareholders of the banks are, or in what percentage
the shares are owned. This ownership structure can be classified in different ways: publicly owned
vs privately owned, locally owned vs foreign owned, institutionally owned vs individually owned,
high concentration ownership vs low concentration ownership. Ownership structure as a
determining factor for the financial performance of commercial banks compares public, privately
owned and foreign banks. Researchers observe that public banks are not as vibrant as private banks
(Nouili et al. 2015). However, Onuonga (2014) indicated that the influence of ownership structure
on performance of banks have offered contradicting outcomes.
Publicly owned financial institutions in Switzerland do not do better compared to private banks
(Dietrich & Wanzenried, 2011). However, the case may have changed due to financial crisis that
has been experienced globally making government owned banks to be more attractive because
they are considered to be safer which could make their performance better. According to Cornett,
Guo, Khaksari and Tehranian (2009), government-owned banks are less profitable compared to
private banks since they lend riskier loans which increase their credit risk.
Chege (2013) did a study analysing the relationship between ownership structure and financial
performance among commercial banks listed in the Nairobi securities exchange in Kenya. The
research design was descriptive survey study in nature since it focused on all investment firms in

10
Kenya. The population of the study was banks listed at the NSE. A four year secondary data was
collected from the 10 listed banks which were used to compile data on financial performance and
ownership structure. Data was analysed using both descriptive; mean and standard deviation and
inferential statistics - regression analysis. The study findings indicated a relationship between
profitability and ownership structure for both foreign and local shareholding.
Some scholars similarly note a variance in performance of foreign and domestic commercial
banks. Farazi et al., 2011, discussed that some scholars claim that foreign banks have a better
performance in terms of profitability unlike local banks. This is because of the fact that foreign
owned banks are considered to have applied management skills and expertise in other nations over
a period. Foreign firms usually adopt and use their systems of operations found effective at their
home countries (Ongore, 2011). In Thailand, North Africa and Middle East regions, it was found
that foreign firms perform better compared to locally owned banks (Azam & Siddiqui, 2012;
Chantapong, 2005; Farazi et al. 2011).
Chen (2012) conducted a study investigating the effect of ownership structure on firm performance
with evidence from Scandinavia. The study prepared twelve testable hypotheses for empirical
analyses. Simple statistics analysis and regression analysis were done: simple statistics analysis
allocated firms and their four performance ratios according to their owner identities/nationalities.
Regression analysis was also done to test the effect of ownership structure on firm performance,
based on the assumption that the relationship is linear and ownership structure is exogenous. The
study results showed that ownership concentration has a positive effect on firm profitability and
growth. However, the study had a negative effect on firm valuation and risk; divergence between
voting right and capital right has positive influence on firm valuation; and owner identities do
influence firm performance, especially with regard to profitability and growth.
2.2.2 Effects of Foreign Entry
Claessens et al. (1998) did a study on how foreign entry affects domestic banking markets in eighty
countries across the world using seven thousand nine hundred observations. Using regression
analysis they investigated how overhead, taxes, net interest margins, and profitability differ
between foreign and domestic banks. They used accounting data and macroeconomic data for the
period 1988-1995. The findings revealed that foreign owned banks are more profitable than the
11
domestic owned banks in developing countries but in well developed countries, the domestic banks
perform better than foreign banks.
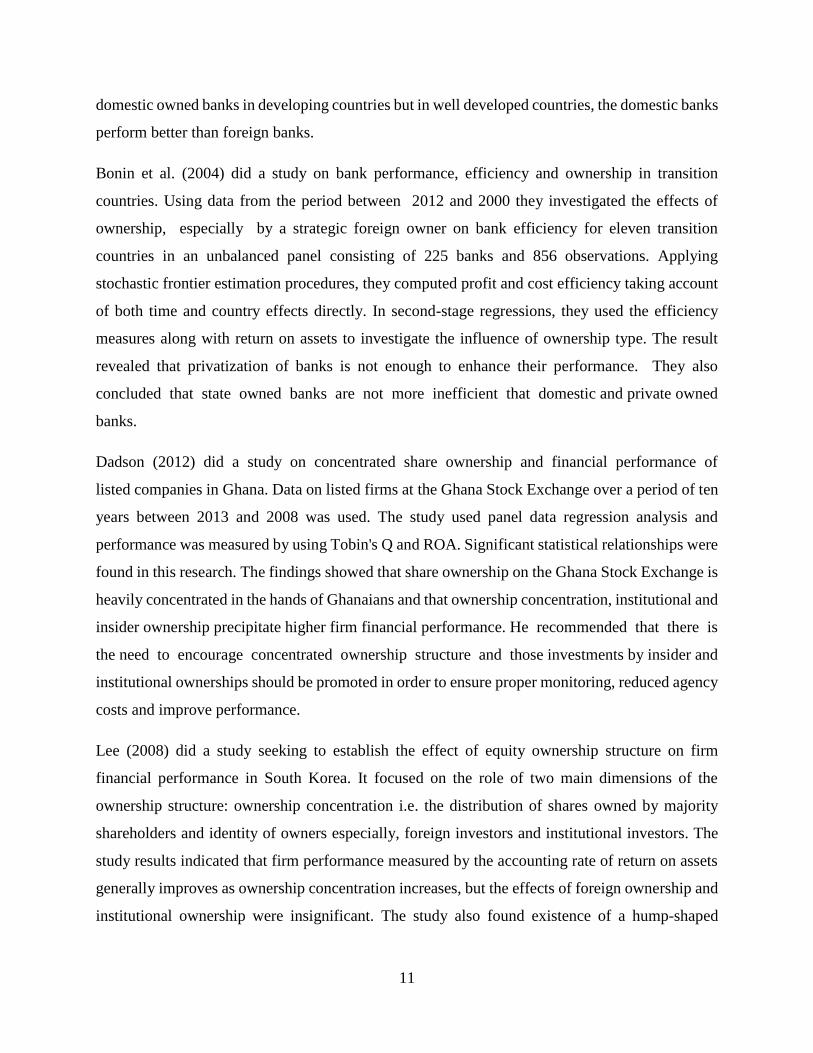
Bonin et al. (2004) did a study on bank performance, efficiency and ownership in transition
countries. Using data from the period between 2012 and 2000 they investigated the effects of
ownership, especially by a strategic foreign owner on bank efficiency for eleven transition
countries in an unbalanced panel consisting of 225 banks and 856 observations. Applying
stochastic frontier estimation procedures, they computed profit and cost efficiency taking account
of both time and country effects directly. In second-stage regressions, they used the efficiency
measures along with return on assets to investigate the influence of ownership type. The result
revealed that privatization of banks is not enough to enhance their performance. They also
concluded that state owned banks are not more inefficient that domestic and private owned
banks.
Dadson (2012) did a study on concentrated share ownership and financial performance of
listed companies in Ghana. Data on listed firms at the Ghana Stock Exchange over a period of ten
years between 2013 and 2008 was used. The study used panel data regression analysis and
performance was measured by using Tobin's Q and ROA. Significant statistical relationships were
found in this research. The findings showed that share ownership on the Ghana Stock Exchange is
heavily concentrated in the hands of Ghanaians and that ownership concentration, institutional and
insider ownership precipitate higher firm financial performance. He recommended that there is
the need to encourage concentrated ownership structure and those investments by insider and
institutional ownerships should be promoted in order to ensure proper monitoring, reduced agency
costs and improve performance.
Lee (2008) did a study seeking to establish the effect of equity ownership structure on firm
financial performance in South Korea. It focused on the role of two main dimensions of the
ownership structure: ownership concentration i.e. the distribution of shares owned by majority
shareholders and identity of owners especially, foreign investors and institutional investors. The
study results indicated that firm performance measured by the accounting rate of return on assets
generally improves as ownership concentration increases, but the effects of foreign ownership and
institutional ownership were insignificant. The study also found existence of a hump-shaped

12
relationship between ownership concentration and firm performance, in which firm performance
peaks at intermediate levels of ownership concentration.
Research has revealed that performance of banks can be influenced by internal and external
elements (Athanasoglou et al, 2005; Al-Tamimi, 2010; Aburine, 2005). The scale of the impact
will be influenced by the management decisions. The owners’ interests influence the decision by
the management (Ongore, 2011). The study attempts to investigate whether ownership structure
significantly influence the performance of banks in Kenya.
2.2.3 Private and State Owned Banks
Mwathi (2009) studied on the relationship between commercial banks’ financial performance and
their ownership structure. She categorized them as be private banks, government banks, foreign
banks, domestic banks. Using regression analysis, the study was centered on banks where the top
10 shareholders hold more than 50% of the shares for the period between 2004 and 2008 in Kenya.
Using ROA as the performance measure, the study revealed that bank ownership structure had a
fair positive influence on performance. The findings also showed that both private and state owned
banks had a negative correlation with performance. She underscored that both banks that are
foreign owned and those owned domestically had a positive correlation with performance. The
study hypothesized that commercial banks that are state owned perform dismally than the foreign
or domestic commercial banks. The study concluded that widely held banks perform well than
closely held ones.
Bwire (2012) did a correlation study to establish whether there are any differences between the
profitability of foreign and local banks listed at the NSE by examining the determinants of their
profitability. The sample involved 3 foreign commercial banks and 6 local commercial banks
listed at the NSE. Data was scrutinized using correlation analysis, descriptive analysis, and
regression analysis. The study showed that there were no significant differences between the
performance of foreign and domestic listed banks. The regression findings also revealed that
foreign ownership did not affect bank profitability. The study also found that none of the variables
had a significant influence on ROA or ROE. The study hypothesized that listed foreign banks in
Kenya do not outperform the domestic listed banks. Maina and Ondongo (2013) studied on the
effect of capital structure on financial performance of firms listed at the NSE from year 2002 to

13
2011 using their financial statements as the secondary data. They conducted their research using
Causal research design and Gretl statistical software to perform the panel regression analysis. Its
output will be significant to the management of quoted companies and government. The results
showed that debt and equity are the main determinants of financial performance of firms listed at
the NSE. The findings demonstrated a negative and significant relationship between capital
structure and performance implying that the more debt firms use as a financial source the more
likely they will perform dismally. The study also showed that firms listed at NSE used more short-
term debts than long term.
2.3 Capital Structure and Its Effect on Financial Performance of
Commercial Banks
2.3.1 Capital Structure and Value Maximization
Capital structure implies the way a firm finances its assets across the blend of debt, equity or hybrid
securities (Saad, 2010). Capital structure of the organization is very hard to determine and
managers are facing difficulties in precisely determining the optimal capital structure. Optimal
capital structure means with a minimum weighted average cost of capital and thus maximize the
value of organization. A business utilizes various kinds of financing to operate a company
efficiently. In analyzing the effects of capital structure on banks, different researchers have used
different techniques and methodologies which have provided different results.
Qamar, Masood and Khan (2016) conducted a study on the impact of capital structure on the
profitability of Pakistan commercial banks listed on Karachi Stock Exchange. Data was analyzed
by applying fixed and random effects on panel data regression of 15 listed Commercial Banks
from 2005 to 2014. The study results indicated that capital structure for both debt-to-asset and
debt-to-equity has negative impact on profit as increase in debt, increases the interest payments
thus decline in profitability.
Saeed, et al., (2013) did a study on the impact of capital structure on banking performance, with
specific reference to Pakistan. The study extended empirical work on capital structure determinants
of banks within country over a period of five years from 2007 to 2011. They utilized data of banks
listed at Karachi stock exchange. Multiple-regression model was used to estimate the relationship
between capital structure and banking performance. ROA, ROE and earnings per share was used

14
to measure performance. Determinants of capital structure were long-term debt to capital ratio,
short-term debt to capital ratio and total debt to capital ratio. The study findings indicated a positive
relationship between determinants of capital structure and performance of banking industry.
Siddik et al. (2016) in his study on the impact of capital structure on performance of bank in a
developing economy. The study used panel data of 22 banks for the period of 2005-2014, and
empirically examined the impact of capital structure on the performance of Bangladeshi banks
assessed by return on equity, return on assets and earnings per share. Study results from pooled
ordinary least square analysis indicated that there are inverse impacts of capital structure on bank’s
performance. According Zeitun and Tian (2007), capital structure is closely link to the financial
performance. Eldomiaty and Azim (2008) in their study on the dynamics of capital structure and
heterogeneous systematic risk classes in Egypt findings revealed that there is a positive
relationship between capital structure and financial performance.
Hadlock and James (2002) in their study titled, ‘Do banks provide financial slack?” Findings also
revealed that there was a positive relationship between capital structure and financial performance.
Saeedi and Mahmoodi (2011) in their study on capital structure and firm performance: evidence
from Iranian companies it was established that market measures of performance are positively
related to capital structure. However, a study done by Fama and French (2008) on testing trade off
and pecking predictions about dividends and debt findings revealed that there was a negative
relationship between capital structure and financial performance. Ebaid (2009) in his study on the
impact of capital-structure choice on firm performance: empirical evidence from Egypt findings
revealed that capital structure has little to no impact on a firm’s performance
2.3.2 Growth of Debt and Financial Performance
In a local study, Kanini (2016) did a study on the effect of capital structure and financial
performance of Kenya’s banking industry. The target population was the banking industry which
has 42 commercial banks, and it is from this population a census was conducted. Secondary data
was collected from the registered banks by the Central Bank of Kenya in Kenya and covered the
period between 2005 1nd 2014. Data analysis was done through regression analysis using SPSS
software. The study results indicated that growth in debt would affect financial performance
positively leading to improvement in profitability. The study also shows retained earnings having
15
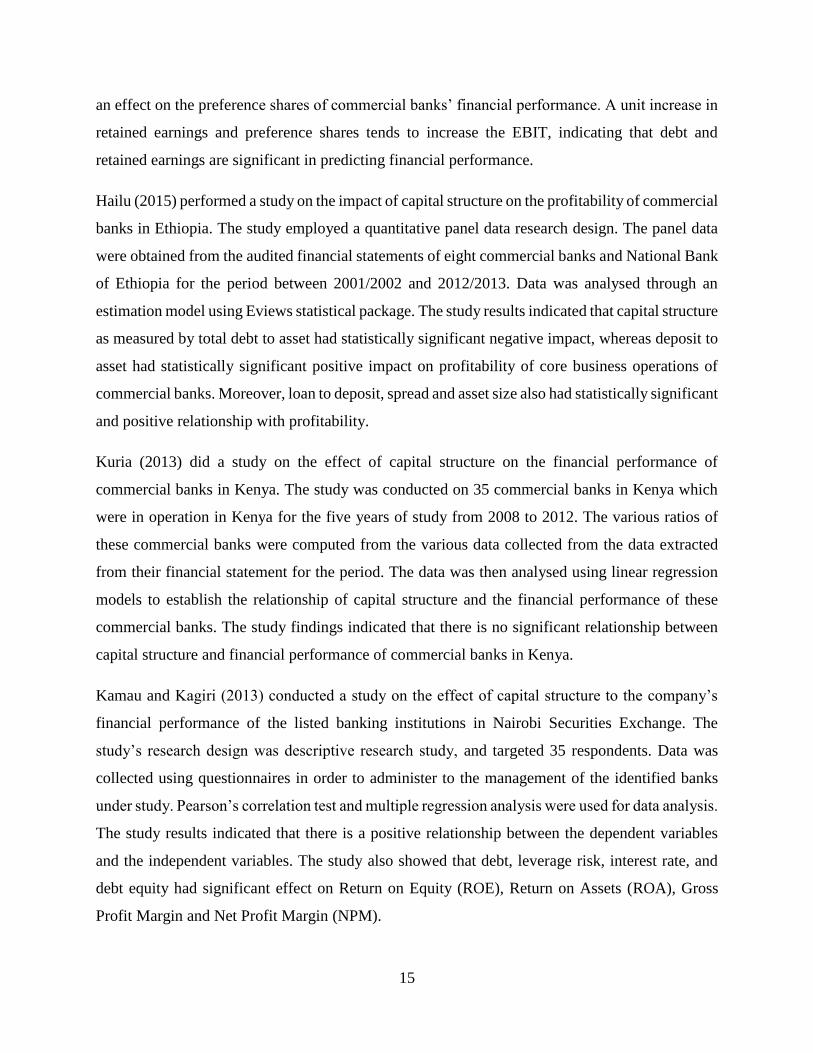
an effect on the preference shares of commercial banks’ financial performance. A unit increase in
retained earnings and preference shares tends to increase the EBIT, indicating that debt and
retained earnings are significant in predicting financial performance.
Hailu (2015) performed a study on the impact of capital structure on the profitability of commercial
banks in Ethiopia. The study employed a quantitative panel data research design. The panel data
were obtained from the audited financial statements of eight commercial banks and National Bank
of Ethiopia for the period between 2001/2002 and 2012/2013. Data was analysed through an
estimation model using Eviews statistical package. The study results indicated that capital structure
as measured by total debt to asset had statistically significant negative impact, whereas deposit to
asset had statistically significant positive impact on profitability of core business operations of
commercial banks. Moreover, loan to deposit, spread and asset size also had statistically significant
and positive relationship with profitability.
Kuria (2013) did a study on the effect of capital structure on the financial performance of
commercial banks in Kenya. The study was conducted on 35 commercial banks in Kenya which
were in operation in Kenya for the five years of study from 2008 to 2012. The various ratios of
these commercial banks were computed from the various data collected from the data extracted
from their financial statement for the period. The data was then analysed using linear regression
models to establish the relationship of capital structure and the financial performance of these
commercial banks. The study findings indicated that there is no significant relationship between
capital structure and financial performance of commercial banks in Kenya.
Kamau and Kagiri (2013) conducted a study on the effect of capital structure to the company’s
financial performance of the listed banking institutions in Nairobi Securities Exchange. The
study’s research design was descriptive research study, and targeted 35 respondents. Data was
collected using questionnaires in order to administer to the management of the identified banks
under study. Pearson’s correlation test and multiple regression analysis were used for data analysis.
The study results indicated that there is a positive relationship between the dependent variables
and the independent variables. The study also showed that debt, leverage risk, interest rate, and
debt equity had significant effect on Return on Equity (ROE), Return on Assets (ROA), Gross
Profit Margin and Net Profit Margin (NPM).

16
2.3.3 Inflation and Market Risk Factors on Financial Performance
Macroeconomic factors are applicable to a broad economy at national or regional level and affect
a large population and are key indicators of economic performance. There are three major
macroeconomic factors that affect bank profitability, namely GDP growth rate, inflation rate
and real interest rate. GDP growth is a measure of the total economic activity and it is adjusted for
inflation. It affects to the demand and supply for banks deposits and loans. A positive GDP growth
facilitates high demand for credit which in turn positively affects the bank’s profitability.
Conversely, demand for credit is low during recession periods which negatively affect the
profitability of financial institutions (Bikker & Hu, 2002).
Inflation indicates the general price level in the economy and is indicated by the inflation
rate. Inflation affects the real value of both costs and revenues. According to Perry (1992) the
relationship between the inflation and profitability can have a positive or negative effect on
profitability depending on whether inflation is anticipated or unanticipated. If an inflation rate is
anticipated, financial institutions adjust interest rate to ensure that the revenues are more that the
costs. Conversely, if inflation rate is not anticipated the costs increase more rapidly than revenues.
Real interest rate is the interest rate an investor expects to receive after allowing for inflation.
It is the purchasing power growth rate resulting from an investment. Purchasing power is
maintained constant by adjusting the nominal interest rate to compensate for inflation rate of
growth. The relationship between interest rates and banks performance is positive. As interest rates
rise bank profits tend to also increase (Samuelson, 2012). According to Linyiru (2006) most
studies have divided factors that determinants of performance of Commercial Banks into
Internal and External Factors. Internal factors are factors that have a direct influence on the
financial statement and external factors are factors that banks do not have control over. This
includes inflation, regulation, concentration, ownership, money supply, competition.
Market risk refers to risk of a change in the value of a financial position arising from changes in
the value of factors such as foreign exchange rates, commodity prices, stock prices and
bond prices. Market risk is measured as a likelihood of adverse changes in the value of
a position with the current market price as a standard, Dowd (2005). Desaro (2012) in her study
on the effect of macroeconomic factors on financial performance of commercial banks in

17
Kenya it was revealed that ROA was positively correlated with the GDP, money supply, lending
rate and inflation, and negatively correlated with exchange rate.
Sensitivity to Market risk reflects the extent to which changes in foreign exchange market rates,
commodity prices, interest rates or equity prices affect the financial position and earnings of a
financial institution. The sensitivity to market risk component focuses on the management ability
to detect and control market risk exposures, the characteristics of risk exposures of interest rates
occurring from non-trading positions and also characteristics of exposures of market risk occurring
from foreign and trading business activities. MakDonald and Koch (2006)
2.4 Cost Structure and its Effect on Performance of Commercial Banks
2.4.1 Operational Costs
Costs incurred by commercial banks generally results from normal banking operations. These costs
are referred to as operation costs. Operation costs are expenses that can be controlled by the
management. If utilized well, these costs have positive influence on the banks’ performance and
profitability (Frederick, 2014). Operation costs usually relate negatively with the performance of
banks and are commonly expressed in terms of percentage of income (Swarnapali, 2014). A study
by Obanyi (2013) concluded that operating costs negatively and significantly influence
profitability of commercial banks in Nigeria.
Rao and Lakew (2012) made similar conclusions in a study conducted on Ethiopia’s commercial
banks. Locally, no study has been done, which provides the opportunity for the study to analyse
how cost structure has an effect on financial performance of banks. Cost structure will be analysed
using operating ratio, staff cost to income ratio, and loan loss/impairment to income ratio.
Operational costs are the expenses which are related to the operation of a business, or to the
operation of a device, component and piece of equipment or facility. They are the cost of resources
used by an organization just to maintain its existence (Gupta, 2009). The operational costs to
income ratio shows how efficient a company is, and is determined by dividing total operating
expense by net sales.

18
The calculation is done as follows:
Operating ratio = (operating costs / net sales) x 100
For banks, however, net sales are provided by Net Interest Income and Non-Interest Income.
Therefore, the operating ratio is determined as:
Operating ratio = (operating costs / (net interest income + non-interest income)) x 100
The cost structure determines the overall operational costs whose ratio determines the banks’
efficiency in managing its costs. A high operating ratio indicates low efficiency in cost
management due to low profits.
Staff cost is part of the larger operating costs, and it is the total staff salaries, wages and other staff
expenses compared to the net sales. Again, this is an efficiency ratio which arises as a result of
bank structure in terms of number of employees and compensation structure. High staff cost to
income ratio indicates non-efficiency in a bank as employees cannot add value in terms of sales
compared to what they are being compensated (Trujillo-Ponce, 2012). Staff cost to income ratio
is calculated as:
Staff cost ratio = (staff costs/ (net interest income + non-interest income)) x 100
Loan loss/ impairment is when a loan is not able to be collected or considered probable that not all
of the related principle and interest payment will be collected. The loan loss/ impairment to income
ratio highlight the amount of loss compared to income, interest and non-interest. Loan loss is
mainly stated in percentage as non-performing loans (Financial Accounting Manual, 2017). A high
loan loss to income ratio implies reduced profitability as a result of bad loans. The cost structure
of allowable loan loss through provisions and stringent measures in issuance of loan affect the
amount of bad loans, hence affect profitability. The loan loss/ impairment to income ratio is
calculated as:
Loan loss/impairment to income = (bad loans + impaired loans)/ (net interest income + non-interest
income)
A study by Rezvanian and Mehdian (2002) examined the cost structure and production
performance of commercial banks in Singapore. The study used a parametric approach in the

19
framework of a translog cost function and a non-parametric approach in the framework of linear
programming to examine production performance and cost structure of a sample of Singaporean
commercial banks. The results of the parametric methodology indicated that the average cost curve
of the banks was U-shaped and there are economies of scale for small and medium-size banks.
Further analysis also provided evidence of economies of scope for all banks regardless of their
size.
In another study, Zhao, Casu and Ferrari (2010) did a study on the impact of financial sector
reforms on the cost structure characteristics and on the ownership-cost efficiency relationship in
Indian banking. The study employed a stochastic cost frontier approach on a balanced panel dataset
which includes public sector, domestic private and foreign banks continuously operating in India
throughout the period 1992-2004. The study also examined the impact of reforms on the dynamics
of competition in the lending market by estimating the persistence of the overcharge (the price-
marginal cost ratio) through a partial adjustment model. The study findings suggest that Indian
commercial banks have responded to the new regulatory environment by changing both the input
mix and the output composition.
2.4.2 Cost and Ownership Structure
It is envisaged that the findings of this research will document a new insight about the financial
environment in Kenya. This paper will focus on state and foreign membership structures and their
relationship on bank performance. On the basis of World Development Report of 2002, three
arguments are put forward to justify state over private ownership of banks. First private banks are
more susceptible to crisis. Second, too much private ownership may curtail access to credit to
many segments of sociality. Third the government is better placed to allocate capital to some
specific investment (Boubakri et al., 2001).Government ownership is also supported by two
theories; these are the development view and the political view.
According to development view government ownership is justified because financial institutions
are not well developed especially in law and middle income countries .This government ownership
can enhance synergy for economic growth and development .The political view asserts that there
is need for government to have control of investments and banks so as to create employment and
give handouts to political supporters for political gain though votes and related benefits. This is

20
compounded by the fact that in low income countries the financial system is generally
underdeveloped. Both views are founded on the assumption that governments finance public goods
that are socially desirable and cannot be financed privately (Laporta et al., 2001). There is
significance negative relationship between the share of sector assets in state banks and country‘s
per capital level of income. Enhanced government ownership of banks is linked to diminished
efficiency, reduce saving and borrowing, lowers productivity and slow economic growth (Barth et
al, 2001). Evidently, marginal government ownership is expected to have an effect on bank
performance (Littlechild, Boubakri et al., 2013). A substantial number of studies provide evidence
that private ownership of banks is associated with profound financial performance (Lang & So,
2002, Cornett et al., 2000).
Theoretically, the foregoing is consistent with the principal agency theory by Jensen and Meckling
(1976). Government ownership is considered inefficient because of lack of capital market
monitory which in the basis of agency theory would influence managers to forego enterprise
interest for the sake of their personal narrow interests. Conversely, private banks have close
monitoring of managers to ensure that they operate efficiently; otherwise there are anticipatable
serious consequences (Lang and So, 2002).
Based in the above findings regarding state named and private ownership structures government
named banks in Kenya are expected to be less efficient compared to private banks and hence
private banks have superior performance than government owned banks.
2.4.3 Macro-Economic Structure
Evidence from many studies in different countries suggests that foreign banks are generally less
efficient than domestic banks (DeYoung & Nolle, 2012, Hassan and Hunter Mahajan et al., 2012,
Chang et al., 1998). In a study of Spain, German, France, the US and the UK documented that
domestic banks have both higher cost efficiency and profit efficiency than foreign banks (Berger
et al., 2000).
However, these studies are focused on developed countries. Some studies concluded that foreign
banks have nearly the same mean efficiency as domestic banks (Vander, 2012, Hassan & Lozano
Vivas, 1998). Other studies conducted in developing and developed countries state that foreign
banks have lower interest margins, overhead expenses and profitability than domestic banks in
21
industrialized nations. The converse is true in developing countries (Claessens et al., 2000,
Demirguc-Kunt & Huizinga, 2013). In many developing countries for example, Indonesia, Egypt,
Argentina and Venezuela foreign banks have significantly higher interest margins compared to
domestic banks. In Latin America and Asia, foreign banks reported significantly higher net
profitability than domestic banks.
Lower performance of foreign owned banks compared with their domestic counterparts in
developing countries has been explained by different viewpoints. These include different
regulatory, competitive and markets conditions existing in and developed countries (Claessesns et
al., 2000). Local network take advantage of domestic banks (Clarke et al., 2001) and in the US
foreign owned banks are comparatively less profitable on the basis that they put more premium on
growth than profitability (DeYoung & Nolle, 2012).
In developing countries the views opened for the superior performance of the foreign as compared
to domestic banks exemption from credit allocation regulation and other restrictions, inefficiencies
in the financial market and retrogressive banking practices that allow foreign banks superior
performance (Claessesns, Demirguc-Kunt & Huizing 2000). Considering that Kenya is more likely
to have similar financial and economic environment to that of developing countries this study
expects that the performance of banks in Kenya mirrors those of developing countries in a similar
spectrum. A profound evidence suggest that extent and concentration of foreign banks will have
an impact on performance. A study by Boubakri et al. (2013) reported that the higher the
concentration by local shareholders the higher the net interest margin therefore the lower the banks
net effect to the economic efficiency. Conversely, the higher the concentration by foreign
shareholders, the lower the net interest margin and therefore the higher contribution to economic
efficiency. A study in Hungary found that the higher presence of foreign banks is associated with
a robust environment and have significant impact on performance of commercial banks resulting
in higher profit in all banks (Hassan and Marton (2003)
2.5 Chapter Summary
The chapter discussed theoretical and empirical literature on the banking structure and its effect
on financial performance of commercial banks in Kenya. The chapter outlined theories that
provided understanding to the study and were: portfolio theory, market power theory, and

22
efficiency structure theory. The empirical literature provided information with regards to
ownership structure, capital structure, and cost structure, together with relevant previous empirical
studies on the same. Empirical literature was provided where similar previous studies were done
with the outcomes. The study finalized by providing a conceptual framework to highlight the
operationalization and relationship of the variables.

23
CHAPTER THREE
3.0 RESEARCH METHODOLOGY
3.1 Introduction
In this chapter the study sought to exhaustively determine the relationship between internal and
external determinants over profitability and financial performance of commercial banks. The
empirical model under consideration also determined whether determinants of banking sector
profitability and financial performance were important in explaining the developments of
commercial banks in Kenya. The chapter also highlights research design, population, sampling
design, data collection methods, research procedures and data analysis methods that were used in
this study.
3.2 Research Design
Bryman and Bell (2007) described research design as a general plan that provides a framework for
the choice of data collection techniques and data analysis procedures. The study employed a
descriptive cross-sectional research design because it gave a good description of what, when and
how understanding of phenomenon under study. Descriptive study was used to describe or outline
a subject. Additionally, it helps to creating a profile of a group of issues, people or events whereas;
a cross-sectional study involves a one-time interaction with the unit being studied. The benefit of
the cross-sectional study design is that it allows researchers to compare many different variables
at the same time. The commercial banks were analysed at the same time; cross-sectional to analyse
the effect of banking structure on financial performance.
3.3 Population
3.3.1 Population
Population alludes to a complete set of objects or elements that have similar characteristics that
are of interest to the research. Cooper and Schindler (2014) noted that population refers to the
gathering of all elements about which the research wishes to make inferences. These characteristics
are determined through the criteria set by the researcher. From the Central Bank of Kenya website
(2015), there are currently 42 commercial banks operating in Kenya as at the end of 2015 which

24
comprised the study population. The study dealt with the banks that have been in existence since
2006 to 2015.
3.3.2 Sampling Design
These are the set of rules or specifications for the drawing of a sample in an unequivocal manner;
a way by which a study provides information on the target and final sample sizes, strata definitions
and the sample selection methodology (Dodge, 2003). This study did not apply sampling design
as all banks that existed over study period were considered.
3.3.2.1 Sampling Frame
According to Zikmund and Babin, (2012), sampling frame is the source material from which a
sample is drawn. It represents a list of all items or elements within a population which can be
sampled. The sampling frame for this study was banks that have been in existence since 2008 to
2015 as obtained from Central Bank of Kenya website.
3.3.2.2 Sampling Technique
Mugenda and Mugenda (2009) sampling is the process to selecting respondents from a population.
Sampling technique is used because it determines a true representation of the entire population
(Cooper & Schindler, 2014). The study used census since the population of banks that have been
in existence since the population of banks that have been existence since 2006 to 2015 is less than
100. A census is a complete number of a population or groups (Sunders, Lewis, & Thornhill,
2015).
3.3.2.3 Sample Size
According to Bryman (2012), a sample is the segment or subset of the population that is selected
for research. This study focussed on all the banks that were in existence over the period 2006 to
2015. The data was obtained from central Bank of Kenya website.
3.4 Data Collection Methods
Creswell (2002) defines data collection as means by which information is obtained from the
selected subjects of an investigation. Data collection stage shows what type of data is collected,

25
whether primary or secondary, the instrument of data collection used, and the period of which the
data is collected. The study used secondary collection tools to gather data for analysis. Secondary
data collection instruments were used to answer the research objectives to collect data on bank
foreign-local ownership, public-private ownership, and relevant financial ratios. Banks listed with
Nairobi Stock Exchange and banks with government shareholding were considered public owned.
Banks with foreign parent company were considered foreign owned. The financial ratios were
calculated from data including profit before tax, total assets, total equity, net interest income,
operating costs, short-term debt, staff costs, loan loss, impaired loans, and ownership. The relevant
data for each commercial bank in Kenya was filled in the data collection sheet so that the ratios
can be calculated for analysis.
The data was picked from banks published annual reports; bank supervision reports from CBK
and company websites and from these raw data, the ratios were calculated. The ratios calculated
were return on assets, return on equity, operating ratio, debt-to-total assets, debt-to-total equity,
staff cost-to-income ratio, and loan loss-to-income ratio.
3.5 Data Analysis Methods
In data analysis stage, the collected data was processed, cleaned and tabulated for analysis. The
study used descriptive research which included; mean standard deviation and median. Multivariate
analysis technique was used to analyse the data and this was done using multiple linear regression.
For the regression analysis variables, the dependent variable financial performance was measured
using both return on assets and return on equity. The independent variable ownership structure was
measured using either public-private ownership or foreign-local ownership. Banks that had any
percentage of foreign ownership were classified as foreign banks, while banks that had government
ownership and/or listed at the Nairobi Securities Exchange were classified as public. Capital
structure variable was measured using debt-equity ratio and debt-asset ratio. The cost structure
variable was measured using operating ratio, staff cost-to-income ratio, and loan loss/impairment-
to-income ratio. With these measurement values, Statistical Package for Social Scientists (SPSS)
v.21 software was used to conduct the multiple regression analysis. The multiple linear regression
model was formed to determine the effect of independent variables on the dependent variables.
The dependent variable was measured to determine if and how much it varied as the independent
variables vary.
26
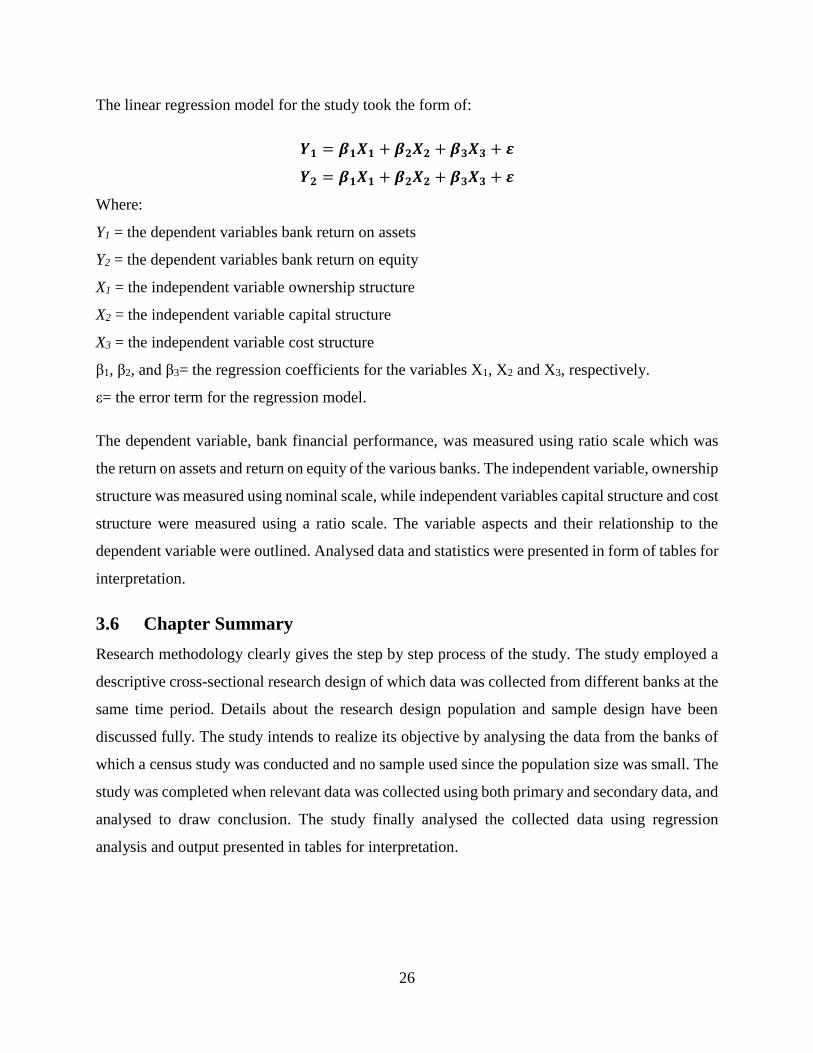
The linear regression model for the study took the form of:
𝒀𝟏 = 𝜷𝟏𝑿𝟏 + 𝜷𝟐𝑿𝟐 + 𝜷𝟑𝑿𝟑 + 𝜺
𝒀𝟐 = 𝜷𝟏𝑿𝟏 + 𝜷𝟐𝑿𝟐 + 𝜷𝟑𝑿𝟑 + 𝜺
Where:
Y1 = the dependent variables bank return on assets
Y2 = the dependent variables bank return on equity
X1 = the independent variable ownership structure
X2 = the independent variable capital structure
X3 = the independent variable cost structure
β1, β2, and β3= the regression coefficients for the variables X1, X2 and X3, respectively.
ε= the error term for the regression model.
The dependent variable, bank financial performance, was measured using ratio scale which was
the return on assets and return on equity of the various banks. The independent variable, ownership
structure was measured using nominal scale, while independent variables capital structure and cost
structure were measured using a ratio scale. The variable aspects and their relationship to the
dependent variable were outlined. Analysed data and statistics were presented in form of tables for
interpretation.
3.6 Chapter Summary
Research methodology clearly gives the step by step process of the study. The study employed a
descriptive cross-sectional research design of which data was collected from different banks at the
same time period. Details about the research design population and sample design have been
discussed fully. The study intends to realize its objective by analysing the data from the banks of
which a census study was conducted and no sample used since the population size was small. The
study was completed when relevant data was collected using both primary and secondary data, and
analysed to draw conclusion. The study finally analysed the collected data using regression
analysis and output presented in tables for interpretation.

27
CHAPTER FOUR
4.0 RESULTS AND FINDINGS
4.1 Introduction
This chapter presents results and findings of the study as obtained from the information collected
and analysed within the study. The objective of the study was to analyse the effect of banks’ micro
structure on financial performance of Kenya’s commercial banks. This chapter contained the
inferential statistics on ownership structure and financial performance in section 4.2, capital
structure and financial performance which is highlighted in section 4.3, and finally cost structure
and financial performance which is outlined in chapter 4.4. The chapter summary was highlighted
in section 4.5.
4.2 Descriptive Analysis
4.2.1 Ownership Structure of Banks
Table 4.1: Private/ Public Ownership Structure Frequencies
Frequency Percent Valid Percent Cumulative Percent
Valid Private 30 71.4 71.4 71.4
Public 12 28.6 28.6 100.0
Total 42 100.0 100.0
Table 4.1 highlights the frequency distribution of ownership structure based on whether they are
public-owned or private-owned. Publicly-owned banks are those which the government has more
than 50 percent of the shareholding, while privately-owned banks are those which the government
owns less than 50 percent of the shareholding. From the table, majority of the banks are privately
owned with the findings indicating that 71.4% (N=30) of the banks are privately owned and the
other 28.6% (N=12) being publicly-owned.

28
Table 4.2: Foreign/ Local Ownership Structure Frequencies
Frequency Percent Valid Percent Cumulative Percent
Valid Foreign 12 28.6 28.6 28.6
Local 30 71.4 71.4 100.0
Total 42 100.0 100.0
Table 4.2 presented the findings of the frequencies of the foreign/ local ownership of commercial
banks in Kenya. The study findings indicated that majority of the banks are locally owned with
71.4% (N=30) of the banks being locally-owned and the other 28.6% (N=12) being foreign-owned.
4.2.2 Micro-Structure of Banks
Table 4.3: Micro-Structure Descriptive of Commercial Banks
Total
Average
Public
bank
average
Private
bank
average
Local
bank
average
Foreign
bank
average
Return on assets 0.0265 0.0422 0.0202 0.0281 0.0226
Return on equity 0.1697 0.2522 0.1366 0.1766 0.1524
Operating ratio 0.7748 0.6090 0.8411 0.7640 0.8019
Staff costs to income ratio 0.3320 0.2803 0.3527 0.3186 0.3655
Loan loss to income ratio 0.7813 0.5903 0.8578 0.8687 0.5629
Debt-to-total assets 0.0900 0.1070 0.0832 0.0916 0.0858
Debt-to-total equity 0.6372 0.7238 0.6026 0.6518 0.6008
The micro-structure of commercial banks in Kenya consisted of the variables that were used for
the study. The descriptive statistics analysed was the mean and was provided for the dependent
and dependent variables as provided in Table 4.3. The analysis was broken down based on the
mean for all the banks, mean for publicly-owned banks, privately-owned banks, locally-owned
banks, and foreign-owned banks and this was for the period of the study which was 2008 to 2015.
The return on assets had a mean of 2.65% for all the banks, a mean of 4.22 percent for publicly
owned banks, a mean of 2.02% for publicly-owned banks, mean of 2.81% for locally-owned banks,
and a mean of ROA of 2.26% for foreign-owned banks. The findings show there is a significant
difference in return on assets average between publicly-owned banks and privately-owned banks,
but not much difference on local and foreign-owned banks. The return on equity had a mean of

29
16.97% for all the banks, a mean of 25.22% for publicly owned banks, a mean of 13.66% for
publicly-owned banks, mean of 17.66% for locally-owned banks, and a mean of ROE of 15.24%
for foreign owned banks.
With regards to operating ratio which is a cost structure variable item, the study indicated a mean
of 77.48% for all the banks, a mean of 60.91% for publicly owned banks, a mean of 84.12% for
publicly-owned banks, a mean of 76.4% for locally-owned banks, and a mean of 80.19% for
foreign owned banks. The findings also show a significant difference in the operating ratio
percentages between public-owned banks and privately owned banks. The staff costs-to-income
ratio which is also a cost structure variable item had a mean of 33.2% for all the banks, a mean of
28.03% for publicly owned banks, a mean of 35.27% for publicly-owned banks, a mean of 31.86%
for locally-owned banks, and a mean of 36.55% for foreign owned banks. The percentages show
a significant difference in the staff costs between publicly-owned banks and privately-owned
banks, and also locally-owned banks and foreign-owned banks. The loan loss to income ratio had
a mean of 78.13% for all the banks, a mean of 59.03% for publicly owned banks, a mean of 85.78%
for publicly-owned banks, a mean of 86.87% for locally-owned banks, and a mean of 56.29% for
foreign owned banks. These findings indicated a significant difference in the loan loss to income
ratio between publicly-owned banks and privately-owned banks, and also locally-owned banks
and foreign-owned banks.
The debt to total assets ratio which is a capital structure variable item had a mean of 9.0% for all
the banks, a mean of 10.7% for publicly owned banks, a mean of 8.32% for publicly-owned banks,
a mean of 9.16% for locally-owned banks, and a mean of 8.58% for foreign owned banks. The
findings also show there is no huge difference in the debt-to-total assets ratio between public-
owned banks, privately owned banks, local banks and foreign banks. Finally, the debt-to-total
equity ratio as a capital structure item had a mean of 63.72% for all the banks, a mean of 72.38%
for publicly owned banks, a mean of 60.26% for publicly-owned banks, a mean of 65.18% for
locally-owned banks, and a mean of 60.08% for foreign owned banks.

30
4.2.3 Ratio Trends
i) Dependent Variables: Return on Assets and Return on Equity
The dependent variables ratio trends show the trend for average return on assets and return on
equity of all commercial banks in Kenya from year 2008 to the year 2015. Figure 4.1 below shows
the return on assets had slight variance between 2008 and 2015 with the average ROA for
commercial banks in Kenya was 1.83% in 2008 while it had an ROA of 2.15% in 2015.
Figure 4.1: Return on Assets and Return on Equity Trends
The return on equity was higher than the return on assets, and had greater variability between the
years 2008 and 2015. The average ROE for the commercial banks in Kenya was 15.18% in 2008,
20.86% in 2010, 15.47% in 2012, 20.11% in 2013 and 12.43% in 2015. The variance is much
higher than that of return on assets.
0.00%
5.00%
10.00%
15.00%
20.00%
25.00%
2008 2009 2010 2011 2012 2013 2014 2015
Return On Assets Return on equity

31
ii) Independent Variables
Figure 4.2: Capital Structure Trends
Figure 4.2 highlights the capital structure trends indicating the average debt-to-total assets and
debt-to-total equity ratios for the commercial banks in Kenya between the years 2008 and 2015.
Debt-to-total assets had a rather stagnant rate between the years 2008 and 2015 with little
variability of value of 0.09 in 2008 and 0.11 in 2015. However, the debt-to-total equity had a higher
variability compared to debt-to-total assets in the same period, ranging between 0.50 and 0.80.
0.00
0.10
0.20
0.30
0.40
0.50
0.60
0.70
0.80
0.90
2008 2009 2010 2011 2012 2013 2014 2015
Debt-to-total equity Debt-to-total assets
0.00
20.00
40.00
60.00
80.00
100.00
120.00
140.00
2008 2009 2010 2011 2012 2013 2014 2015
Operating ratio Staff costs to income ratio Loan loss to income ratio

32
Figure 4.3: Loan Loss to Income Ratio
Figure 4.4: Cost Structure Trends
Figure 4.3 indicated the average cost structure trends for all the commercial banks in Kenya
between the year 2008 and 2015 while Figure 4.4 specifically indicated loan loss-to-income ratio
for commercial banks in the periods 2008 to 2015. The operating ratio indicated a reducing ratio
of 125.31 in 2008 to 73.33 in 2015. The staff costs-to-income ratio also had a reduction in the
period from a value of 54.47 in 2008 to 29.79 in 2015. Loan loss-to-income ratio had a reduction
from year 2008 to 2011, and then went up until the year 2015 with a value of 1.12.
0.00
0.20
0.40
0.60
0.80
1.00
1.20
2008 2009 2010 2011 2012 2013 2014 2015
Loan loss to income ratio
Loan loss to income ratio

33
4.2.3 Correlation Test
a) Return on Assets
Table 4.4: Correlation of Return on Assets and the Independent Variables
ROA
Operating
ratio
Debt-to-total
assets
Debt-to-total
equity
Staff costs to
income ratio
Loan loss to
income ratio
Return On Assets Pearson Correlation 1 -.760** -.162 -.203 -.707** -.431**
Sig. (2-tailed) .000 .305 .198 .000 .004
Operating ratio Pearson Correlation -.760** 1 .065 .063 .967** .186
Sig. (2-tailed) .000 .684 .692 .000 .237
Debt-to-total assets Pearson Correlation -.162 .065 1 .898** .041 .101
Sig. (2-tailed) .305 .684 .000 .796 .525
Debt-to-total
equity
Pearson Correlation -.203 .063 .898** 1 .007 .122
Sig. (2-tailed) .198 .692 .000 .966 .440
Staff costs to
income ratio
Pearson Correlation -.707** .967** .041 .007 1 .028
Sig. (2-tailed) .000 .000 .796 .966 .860
Loan loss to
income ratio
Pearson Correlation -.431** .186 .101 .122 .028 1
Sig. (2-tailed) .004 .237 .525 .440 .860
**. Correlation is significant at the 0.01 level (2-tailed).
The correlation test shows the relationship between the variables, the dependent variable, return
on assets, and independent variables, and among the independent variables. The study conducted
a Pearson’s correlation test, and the findings as indicated in Table 4.4 indicated that return on
assets had a negative and significant relationship with operating ratio (-0.76), a negative but non-
significant value of -0.162 with debt-to-total assets, a negative but non-significant relationship
with debt-to-total equity (-0.203), a negative and significant relationship (-0.707) with staff costs-
to-income ratio, and a negative and moderate relationship (-0.431) with loan loss-to-income ratio.
The significance values showed that return on assets had significant values of less than 0.05 with
operating ratio, staff costs-to-income ratio, and loan loss-to-income ratio, while had no significant
relationships with debt-to-total assets and debt-to-total equity which had significance values of
0.305 and 0.198 respectively.

34
b) Return on Equity
Table 4.5: Correlation of Return on Equity and the Independent Variables
Return on
equity
Operating
ratio
Debt-to-total
assets
Debt-to-total
equity
Staff costs to
income ratio
Loan loss to
income ratio
Return on equity Pearson Correlation 1 -.707** -.155 -.170 -.618** -.591**
Sig. (2-tailed) .000 .328 .280 .000 .000
Operating ratio Pearson Correlation -.707** 1 .065 .063 .967** .186
Sig. (2-tailed) .000 .684 .692 .000 .237
Debt-to-total assets Pearson Correlation -.155 .065 1 .898** .041 .101
Sig. (2-tailed) .328 .684 .000 .796 .525
Debt-to-total equity Pearson Correlation -.170 .063 .898** 1 .007 .122
Sig. (2-tailed) .280 .692 .000 .966 .440
Staff costs to income
ratio
Pearson Correlation -.618** .967** .041 .007 1 .028
Sig. (2-tailed) .000 .000 .796 .966 .860
Loan loss to income
ratio
Pearson Correlation -.591** .186 .101 .122 .028 1
Sig. (2-tailed) .000 .237 .525 .440 .860
**. Correlation is significant at the 0.01 level (2-tailed).
The relationship between return on equity and the independent variables as provided in Table 4.5
above showed that ROE had a negative and significant relationship (-0.707) with operating ratio,
a negative but non-significant relationship (-0.155) with debt-to-total assets, a negative but non-
significant relationship (-0.170) with debt-to-total equity, a negative and significant relationship (-
0.618) with staff costs-to-income ratio, and a negative but moderate relationship (-0.591) with loan
loss-to-income ratio. The significance values showed that return on equity had significant values
of less than 0.05 with operating ratio, staff costs-to-income ratio, and loan loss-to-income ratio,
while had no significant relationships with debt-to-total assets and debt-to-total equity which had
significance values of 0.328 and 0.280 respectively.
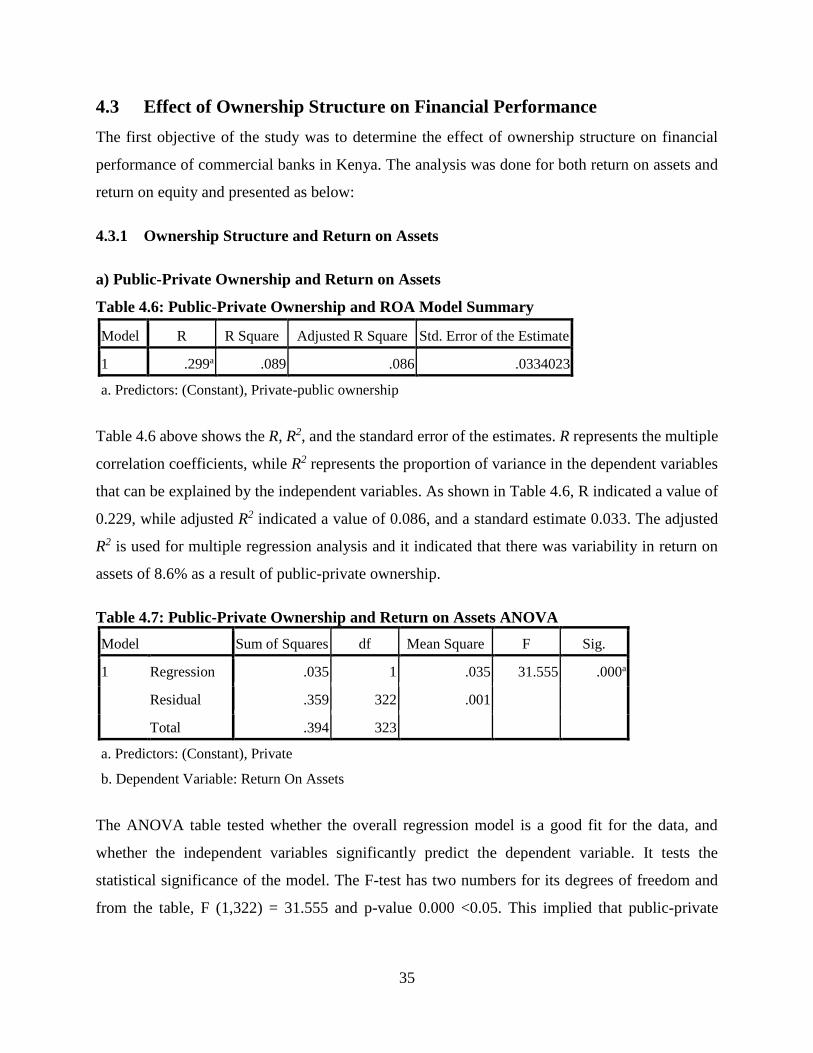
35
4.3 Effect of Ownership Structure on Financial Performance
The first objective of the study was to determine the effect of ownership structure on financial
performance of commercial banks in Kenya. The analysis was done for both return on assets and
return on equity and presented as below:
4.3.1 Ownership Structure and Return on Assets
a) Public-Private Ownership and Return on Assets
Table 4.6: Public-Private Ownership and ROA Model Summary
Model R R Square Adjusted R Square Std. Error of the Estimate
1 .299a .089 .086 .0334023
a. Predictors: (Constant), Private-public ownership
Table 4.6 above shows the R, R2, and the standard error of the estimates. R represents the multiple
correlation coefficients, while R2 represents the proportion of variance in the dependent variables
that can be explained by the independent variables. As shown in Table 4.6, R indicated a value of
0.229, while adjusted R2 indicated a value of 0.086, and a standard estimate 0.033. The adjusted
R2 is used for multiple regression analysis and it indicated that there was variability in return on
assets of 8.6% as a result of public-private ownership.
Table 4.7: Public-Private Ownership and Return on Assets ANOVA
Model Sum of Squares df Mean Square F Sig.
1 Regression .035 1 .035 31.555 .000a
Residual .359 322 .001
Total .394 323
a. Predictors: (Constant), Private
b. Dependent Variable: Return On Assets
The ANOVA table tested whether the overall regression model is a good fit for the data, and
whether the independent variables significantly predict the dependent variable. It tests the
statistical significance of the model. The F-test has two numbers for its degrees of freedom and
from the table, F (1,322) = 31.555 and p-value 0.000 <0.05. This implied that public-private

36
ownership structure regression model is statistically significant in predicting the return on assets
of commercial banks in Kenya.
Table 4.8: Private-Public Ownership Effect on Return on Assets Coefficients
Model
Unstandardized Coefficients
Standardized
Coefficients
t Sig. B Std. Error Beta
1 (Constant) .020 .002 9.031 .000
Private .023 .004 .299 5.617 .000
The regression coefficients table indicates the slope of both the unstandardized and standardized
coefficients of the variables. The analysis coded the public-private ownership variable into two
dichotomous values: private ownership had a value of 1 and public ownership had a value of 0.
The study later analysed them as dummy variables so as to analyse the impact of private or public
ownership on financial performance. From the analysis as indicated in Table 4.8, private
ownership had a value of 0.023. This value implied that private ownership had a significant effect
on Return on Assets with a significant value of 0.00 and a positive coefficient of 0.023 above that
of public ownership towards return on assets. This finding indicated that private-public ownership
is a significant predictor of return on assets of commercial banks in Kenya at 5 percent significance
level.
b) Foreign-Local Ownership and Return on Assets
Table 4.9: Foreign-Local Ownership and ROA Model Summary
Model R R Square Adjusted R Square Std. Error of the Estimate
1 .056a .003 .000 .0349455
a. Predictors: (Constant), Local
Table 4.9 above shows the R, R2, and the standard error of the estimates. As shown in the table, R
indicated a value of 0.056, while adjusted R2 indicated a value of 0.003, and a standard estimate
0.034. The adjusted R2 is used for multiple regression analysis and it indicated that there was no
variability in return on assets as a result of foreign-local ownership.

37
Table 4.10: Local-Foreign Ownership and Return on Assets ANOVA
Model Sum of Squares df Mean Square F Sig.
1 Regression .001 1 .001 1.018 .314a
Residual .393 322 .001
Total .394 323
a. Predictors: (Constant), Local-foreign ownership
b. Dependent Variable: Return On Assets
The ANOVA table tested whether the overall regression model for local-foreign ownership is a
good fit for the data, and also whether the independent variables significantly predict the dependent
variable. It tested the statistical significance of the model. The F-test had two numbers for its
degrees of freedom and from the table, F (1,322) = 1.018 and p-value 0.314 >0.05. This implied
that foreign-local ownership structure regression model is not statistically significant in predicting
the return on assets of commercial banks in Kenya.
Table 4.11: Private-Public Ownership Effect on Return on Assets Coefficients
Model
Unstandardized Coefficients
Standardized
Coefficients
t Sig. B Std. Error Beta
1 (Constant) .028 .002 12.013 .000
Local -.004 .004 -.056 -1.009 .314
a. Dependent Variable: Return On Assets
The regression coefficients table indicated the slope of both the unstandardized and standardized
coefficients of the variables. The analysis coded the local-foreign ownership variable into two
dichotomous values: private ownership had a value of 1 and public ownership had a value of 0.
The study analysed them as dummy variables so as to analyse the impact of local or foreign
ownership on financial performance. From the analysis as indicated in Table 4.4 above local
ownership had a value of -0.004 and a significant value of 0.314. This value implied that local
ownership had no significant effect on Return on Assets with a significant value of 0.314 and a
coefficient value of -0.04 below that of foreign ownership towards return on assets. This finding
indicated that local-foreign ownership is not a significant predictor of return on assets of
commercial banks in Kenya at 5 percent significance level.

38
4.3.2 Ownership Structure and Return on Equity
a) Public-Private Ownership and Return on Equity
Table 4.12: Public-Private Ownership and ROE Model Summary
Model R R Square Adjusted R Square Std. Error of the Estimate
1 .293a .086 .083 .1802059
a. Predictors: (Constant), Private
Table 4.12 above shows the R, R2, and the standard error of the estimates. As shown in the table,
R indicated a value of 0.293, while adjusted R2 indicated a value of 0.083, and a standard estimate
0.180. The adjusted R2 is used for multiple regression analysis and it indicated that there was
variability in return on assets of 8.3% as a result of public-private ownership.
Table 4.13: Public-Private Ownership and Return on Equity ANOVA
Model Sum of Squares df Mean Square F Sig.
1 Regression .986 1 .986 30.348 .000a
Residual 10.457 322 .032
Total 11.442 323
a. Predictors: (Constant), Private
b. Dependent Variable: Return on equity
The ANOVA table as indicated in Table 4.13 analysed whether the overall regression model for
public-private ownership is a good fit for the data, and whether the independent variables (public-
private ownership) significantly predict Return on Equity for Commercial Banks. The F-test has
two numbers for its degrees of freedom and from the table, F (1,322) = 30.348 and p-value 0.000
<0.05. This implied that public-private ownership structure regression model is statistically
significant in predicting the return on equity of commercial banks in Kenya.

39
Table 4.14: Public-Private Ownership Effect on Return on Equity Coefficients
Model
Unstandardized Coefficients
Standardized
Coefficients
t Sig. B Std. Error Beta
1 (Constant) .135 .012 11.396 .000
Private .123 .022 .293 5.509 .000
a. Dependent Variable: Return on equity
The regression coefficients table indicated the slope of both the unstandardized and standardized
coefficients of the variables. The analysis coded the local-foreign ownership variable into two
dichotomous values: private ownership had a value of 1 and public ownership had a value of 0.
The study analysed them as dummy variables so as to analyse the impact of private or public
ownership on financial performance. From the analysis as indicated in Table 4.14, private-public
ownership had a coefficient value of 0.123 and a significant value of 0.00. The values implied that
private ownership had a significant effect on Return on Equity towards return on assets and 0.123
units more than public ownership.
b) Foreign-Local Ownership and Return on Equity
Table 4.15: Foreign-Local Ownership and ROE Model Summary
Model R R Square
Adjusted R
Square Std. Error of the Estimate
1 .039a .002 .002 .1883609
a. Predictors: (Constant), Local
Table 4.15 above shows the R, R2, and the standard error of the estimates. As shown in the table,
R indicated a value of 0.039, while adjusted R2 indicated a value of 0.002, and a standard estimate
0.188. The adjusted R2 is used for multiple regression analysis and it indicated that there was
variability in return on assets of 2.0% as a result of foreign-local ownership.

40
Table 4.16: Foreign-Local Ownership and Return on Equity ANOVA
Model Sum of Squares df Mean Square F Sig.
1 Regression .018 1 .018 .499 .480a
Residual 11.425 322 .035
Total 11.442 323
a. Predictors: (Constant), Local
b. Dependent Variable: Return on equity
The ANOVA table tested whether the overall regression model is a good fit for the data, and
whether the independent variables (foreign-local ownership) significantly predict the dependent
variable. It tests the statistical significance of the model. The F-test had two numbers for its degrees
of freedom and from the table, F (2,322) = 0.499 and p-value 0.48>0.05. A p-value greater than
0.05 implied that the foreign-local ownership regression model is not statistically significant in
predicting the return on equity of commercial banks in Kenya.
Table 4.17: Foreign-Local Ownership Effect on Return on Equity Coefficients
Model
Unstandardized Coefficients
Standardized
Coefficients
t Sig. B Std. Error Beta
1 (Constant) .174 .012 14.070 .000
Local -.016 .023 -.039 -.706 .480
a. Dependent Variable: Return on equity
The regression coefficients table indicated the slope of both the unstandardized and standardized
coefficients of the variables. The analysis coded the local-foreign ownership variable into two
dichotomous values: local ownership had a value of 1 and private ownership had a value of 0. The
study analysed them as dummy variables so as to analyse the impact of local or foreign ownership
on financial performance. From the analysis as indicated in Table 4.17, local ownership had a
coefficient value of -0.016 and a significant value of 0.48. The values implied that local ownership
had no significant effect on Return on Equity but 0.016 units less than foreign ownership.

41
4.4 Effect of Capital Structure on Financial Performance
The objective of the study was to determine the effect of capital structure on financial performance
of commercial banks in Kenya. The analysis was done for both return on assets and return on
equity and presented as below:
4.4.1 Return on Assets and Capital Structure
Table 4.18: Return on Assets-Capital Structure Goodness of Fit
Model R R Square Adjusted R Square Std. Error of the Estimate
1 .228a .052 .046 .0341286
a. Predictors: (Constant), Debt-to-total equity, Debt-to-total assets
Table 4.18 above shows the R, R2, and the standard error of the estimates. R represents the multiple
correlation coefficients, while R2 represents the proportion of variance in the dependent variables
that can be explained by the independent variables. As shown in Table 4.18, R indicated a value
of 0.228, while adjusted R2 indicated a value of 0.052, and a standard estimate 0.034. The adjusted
R2 is used for multiple regression analysis and it indicated that there was variability in return on
assets of 5.2% as a result of capital structure, i.e. debt-to-total equity and debt-to-total assets. The
table also indicated an overall correlation coefficient of 0.228 indicating that there is no significant
relationship between the dependent variable, return on assets, and independent variables, debt-to-
total equity and debt-to-total assets.
Table 4.19: Return on Assets-Capital Structure ANOVA
Model Sum of Squares df Mean Square F Sig.
1 Regression .021 2 .010 8.834 .000a
Residual .374 321 .001
Total .394 323
a. Predictors: (Constant), Debt-to-total equity, Debt-to-total assets
b. Dependent Variable: Return On Assets
The ANOVA table tested whether the overall regression model is a good fit for the data, and
whether the independent variables significantly predict the dependent variable. It tests the
statistical significance of the model. The F-test has two numbers for its degrees of freedom and

42
from the table, F (2,321) = 8.834 and p-value 0.000 <0.05. A p-value less than 0.05 implied that
the capital structure regression model is statistically significant in predicting the return on assets
of commercial banks in Kenya.
Table 4.20: Return on Assets-Capital Structure Regression Coefficients
Model
Unstandardized Coefficients
Standardized
Coefficients
t Sig. B Std. Error Beta
1 (Constant) .027 .003 8.820 .000
Debt-to-total assets .144 .047 .302 3.082 .002
Debt-to-total equity -.021 .005 -.406 -4.150 .000
a. Dependent Variable: Return On Assets
The regression coefficients table indicates the slope of both the unstandardized and standardized
coefficients of the variables. Table 4.20 above indicated unstandardized coefficients for the
variables: Debt-to-total assets had a standardized beta coefficient of 0.302, while debt-to-total
equity had a standardized beta coefficient of -0.406. The significant values from the table are 0.00
for the regression constant, a value of 0.02 for debt-to-total assets variable, and a value of 0.00 for
debt-to-total equity variable. This finding indicated that debt-to-total assets and debt-to-total equity
variables and the constant are reliable predictors of financial performance of commercial banks in
Kenya at 5 percent significance level. The regression was indicated as:
𝑅𝑂𝐴 = 0.027 + 0.144𝑥1 − 0.021𝑥2
The equation implies that with regards to capital structure only, ROA would have a constant of
0.027 and a unit increase in debt-to-total assets ratio would increase the ROA by 0.144, and a unit
increase in debt-to-equity assets ratio would reduce ROA by 0.021.
4.4.2 Return on Equity and Capital Structure
Table 4.21: Return on Equity-Capital Structure Goodness of Fit
Model R R Square Adjusted R Square Std. Error of the Estimate
1 .165a .027 .021 .1861999
a. Predictors: (Constant), Debt-to-total equity, Debt-to-total assets

43
Table 4.21 above shows the R, R2, and the standard error of the estimates. R represents the multiple
correlation coefficients, while R2 represents the proportion of variance in the dependent variables
that can be explained by the independent variables. As shown in Table 4.21, R indicated a value
of 0.165, while adjusted R2 indicated a value of 0.021, and a standard estimate 0.186. The adjusted
R2 is used for multiple regression analysis and it indicated that there was variability in return on
equity of 2.1% as a result of both debt-to-total assets and debt-to-total equity. The table also
indicated an overall correlation coefficient of 0.165 indicating that there is a low relationship
between the dependent variable, return on equity, and independent variables, debt-to-total assets
and debt-to-total equity.
Table 4.22: Return on Equity-Capital Structure ANOVA
Model Sum of Squares df Mean Square F Sig.
1 Regression .313 2 .157 4.514 .012a
Residual 11.129 321 .035
Total 11.442 323
a. Predictors: (Constant), Debt-to-total equity, Debt-to-total assets
b. Dependent Variable: Return on equity
The ANOVA table provided results on whether the overall regression model is a good fit for the
data, and whether the independent variables significantly predict the dependent variable. The F-
test has two numbers for its degrees of freedom and the table indicated, F (2,321) = 4.514 and p
value 0.012<0.05. This indicated that capital structure regression model is statistically significant
in predicting the return on equity of commercial banks in Kenya.
Table 4.23: Return on Equity-Capital Structure Regression Coefficients
Model
Unstandardized Coefficients
Standardized
Coefficients
t Sig. B Std. Error Beta
1 (Constant) .200 .016 12.148 .000
Debt-to-total assets -.064 .254 -.025 -.253 .801
Debt-to-total equity -.040 .027 -.144 -1.452 .147
a. Dependent Variable: Return on equity

44
The regression coefficients table indicates the slope of both the unstandardized and standardized
coefficients of the variables. Table 4.23 above indicated unstandardized coefficients for the
variables: Debt-to-total assets had an unstandardized beta coefficient of -0.064, while debt-to-total
equity had an unstandardized beta coefficient of -0.040. The significant values from the table are
0.00 for the regression constant, a value of 0.801 for debt-to-total assets variable, and a value of
0.147 for debt-to-total equity variable. This implied that debt-to-total assets and debt-to-total
equity had no significant impact on the return on equity of banks in Kenya. The regression was
indicated as:
𝑅𝑂𝐸 = 0.2 − 0.064𝑥1 − 0.04𝑥2
The equation implies that with regards to capital structure only, ROE would have a constant of 0.2
and a unit increase in debt-to-total assets ratio would decrease the ROE by 0.064, and a unit
increase in debt-to-equity assets ratio would reduce ROE by 0.04.
4.5 Effect of Cost Structure on Financial Performance
The third and final objective of the study was to determine the effect of cost structure on financial
performance of commercial banks in Kenya. The analysis was done for both return on assets and
return on equity and presented as below:
4.5.1 Return on Assets and Cost Structure
Table 4.24: Return on Assets-Cost Structure Goodness of Fit
Model R R Square Adjusted R Square Std. Error of the Estimate
1 .563a .317 .310 .0290231
a. Predictors: (Constant), Operating ratio, Loan loss to income ratio, Staff costs
to income ratio
Table 4.24 above shows the R, R2, and the standard error of the estimates. R represents the multiple
correlation coefficients, while R2 represents the proportion of variance in the dependent variables
that can be explained by the independent variables. As shown in Table 4.24, R indicated a value
of 0.563, while adjusted R2 indicated a value of 0.310, and a standard error of the estimate 0.029.
The adjusted R2 is used for multiple regression analysis and it indicated that there was variability
in return on assets of 31.0% as a result of operating ratio, loan loss-to-income ratio, and staff costs-

45
to-income ratio. The table also indicated an overall correlation coefficient of 0.563 indicating that
there is a mild relationship between the dependent variable, return on assets, and independent
variables, operating ratio, loan loss-to-income ratio, and staff costs-to-income ratio.
Table 4.25: Return on Assets-Cost Structure ANOVA
Model Sum of Squares df Mean Square F Sig.
1 Regression .125 3 .042 49.433 .000a
Residual .270 320 .001
Total .394 323
a. Predictors: (Constant), Operating ratio, Loan loss to income ratio, Staff costs to
income ratio
b. Dependent Variable: Return On Assets
The ANOVA table tested whether the overall regression model is a good fit for the data, and
whether the independent variables significantly predict the dependent variable. It tests the
statistical significance of the model. The F-test has two numbers for its degrees of freedom and
from the table, F (3,320) = 49.433 and p-value 0.00 <0.05. This indicated that cost structure
regression model is statistically significant in predicting financial performance (return on assets)
of commercial banks in Kenya.
Table 4.26: Return on Assets-Cost Structure Regression Coefficients
Model
Unstandardized Coefficients
Standardized
Coefficients
t Sig. B Std. Error Beta
1 (Constant) .147 .002 19.324 .000
Staff costs to income ratio .000 .000 -.241 -.787 .432
Loan loss to income ratio -.011 .002 -.301 -5.808 .000
Operating ratio -7.193E-5 .000 -.223 -.725 .469
a. Dependent Variable: Return On Assets
The regression coefficients as indicated in Table 4.26 indicated the slope of both the
unstandardized and standardized coefficients of the variables. The table indicated the
unstandardized coefficients for the variables: Staff costs to income ratio had a standardized beta
coefficient of -0.241, loan loss to income ratio had a standardized beta coefficient of -0.301, and

46
operating ratio had a standardized beta coefficient of -0.223. The significant values from the table
are 0.00 for the regression constant, a value of 0.432 for staff costs to income ratio variable, a value
of 0.00 for loan loss to income ratio variable, and a value of 0.469 for operating ratio variable. This
indicates that staff costs to income ratio and operating ratio variables are not significant predictors
of return on assets of commercial banks in Kenya, while the regression constant and loan loss to
income ratio are good predictors of return on assets (financial performance) of commercial banks
in Kenya at 5 percent significance. The regression was indicated as:
𝑅𝑂𝐴 = 0.147 − 0.011𝑥2 − 0.00072𝑥3
The equation implies that with regards to cost structure only, ROA would have a constant of 0.147
and would have no change with change in staff costs-to-income ratio but increases in the two
variables loan loss-to-income ratio, and operating ratio. A unit increase in loan loss-to-income
ratio would reduce ROA by 0.011, and a unit increase in operating ratio reduced ROA by 0.00072.
4.5.2 Return on Equity and Cost Structure
Table 4.27: Return on Equity-Cost Structure Goodness of Fit
Model R R Square Adjusted R Square Std. Error of the Estimate
1 .632a .400 .394 .1465157
a. Predictors: (Constant), Operating ratio, Loan loss to income ratio, Staff costs to
income ratio
Table 4.27 above shows the R, R2, and the standard error of the estimates. R represents the multiple
correlation coefficients, while R2 represents the proportion of variance in the dependent variables
that can be explained by the independent variables. As the table shows, R indicated a value of
0.632, while adjusted R2 indicated a value of 0.394, and a standard estimate 0.146. The adjusted
R2 is used for multiple regression analysis and it indicated that there was variability in return on
equity of 39.4% as a result of operating ratio, loan loss-to-income ratio, and staff cost-to-income
ratio. The table also indicated an overall correlation coefficient of 0.632 indicating that there was
a strong relationship between the dependent variable, return on equity, and independent variables,
operating ratio, loan loss-to-income ratio, and staff cost-to-income ratio.
Table 4.28: Return on Equity-Cost Structure ANOVA
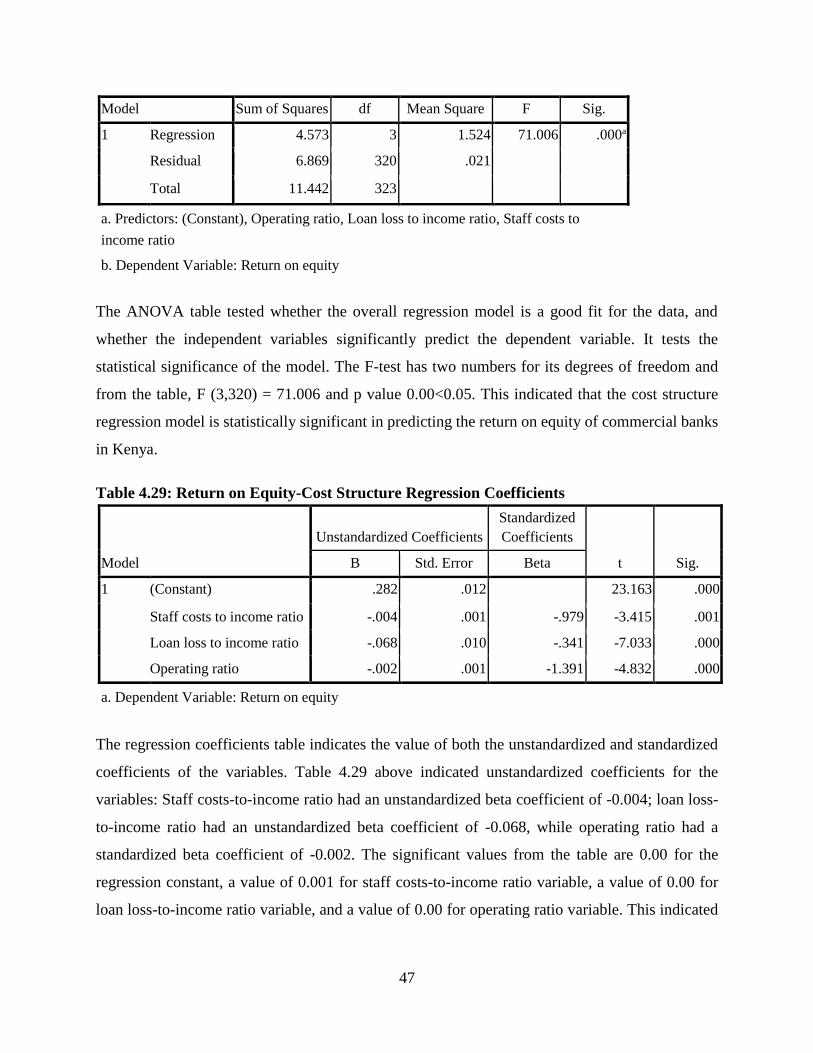
47
Model Sum of Squares df Mean Square F Sig.
1 Regression 4.573 3 1.524 71.006 .000a
Residual 6.869 320 .021
Total 11.442 323
a. Predictors: (Constant), Operating ratio, Loan loss to income ratio, Staff costs to
income ratio
b. Dependent Variable: Return on equity
The ANOVA table tested whether the overall regression model is a good fit for the data, and
whether the independent variables significantly predict the dependent variable. It tests the
statistical significance of the model. The F-test has two numbers for its degrees of freedom and
from the table, F (3,320) = 71.006 and p value 0.00<0.05. This indicated that the cost structure
regression model is statistically significant in predicting the return on equity of commercial banks
in Kenya.
Table 4.29: Return on Equity-Cost Structure Regression Coefficients
Model
Unstandardized Coefficients
Standardized
Coefficients
t Sig. B Std. Error Beta
1 (Constant) .282 .012 23.163 .000
Staff costs to income ratio -.004 .001 -.979 -3.415 .001
Loan loss to income ratio -.068 .010 -.341 -7.033 .000
Operating ratio -.002 .001 -1.391 -4.832 .000
a. Dependent Variable: Return on equity
The regression coefficients table indicates the value of both the unstandardized and standardized
coefficients of the variables. Table 4.29 above indicated unstandardized coefficients for the
variables: Staff costs-to-income ratio had an unstandardized beta coefficient of -0.004; loan loss-
to-income ratio had an unstandardized beta coefficient of -0.068, while operating ratio had a
standardized beta coefficient of -0.002. The significant values from the table are 0.00 for the
regression constant, a value of 0.001 for staff costs-to-income ratio variable, a value of 0.00 for
loan loss-to-income ratio variable, and a value of 0.00 for operating ratio variable. This indicated

48
that staff costs-to-income ratio, loan loss-to-income ratio, and operating ratio were significant in
the prediction of return on equity at 5 percent significance level. The regression was indicated as:
𝑅𝑂𝐸 = 0.282 − 0.004𝑥1 − 0.068𝑥2 − 0.002𝑥3
The equation implies that with regards to cost structure only, ROE would have a constant of 0.282
and would decrease with increases in the three variables staff costs-to-income ratio, loan loss-to-
income ratio, and operating ratio. Therefore, a unit increase in staff cost-to-income ratio would
reduce the ROE by 0.004, a unit increase in loan loss-to-income ratio would reduce ROE by 0.068,
and a unit increase in operating ratio reduced ROE by 0.002.
4.6 Chapter Summary
The chapter presented the analysis findings whose technique was done using multiple regression
analysis. The dependent variable in the analysis was financial performance which was measured
using return on assets and return on equity. The independent variables were ownership structure,
capital structure, and cost structure. With regards to ownership structure, the results indicated that
ownership structure is a good predictor of both return on assets and return on equity despite the
low correlations. The findings also indicated that capital structure is a good predictor of both return
on assets and return on equity of commercial banks in Kenya at 5 percent significance. However,
there was also low correlation between financial performance and capital structure. Finally, the
study results indicated that cost structure is not only a good predictor of both return on assets and
return on equity at 5 percent confidence level but also had significant correlation.

49
CHAPTER FIVE
5.0 DISCUSSION, CONCLUSIONS AND RECOMMENDATIONS
5.1 Introduction
This chapter contains the summary and conclusion of the study with regards to the effect of bank’s
micro structure on financial performance of Kenya’s commercial banks. The chapter looked at the
summary of the study, presented the conclusion of the study based on the results of the analysis,
and finally gave the study recommendations.
5.2 Summary of the Study
The study was guided by three specific research objectives which were analysed and presented in
tables for interpretation. The objectives of the study were; to determine the effect of ownership
structure on financial performance of commercial banks in Kenya; to determine the effects of
capital structure on financial performance of commercial banks of Kenya; and to analyse the effect
of cost structure on financial performance of commercial banks in Kenya. The study employed a
descriptive cross-sectional research design as it analysed all the commercial banks in Kenya at the
same time points to determine the research objective. The study’s population consisted of all the
commercial banks and since they were 42 in number, there was no sampling and therefore census
applied. The study utilised secondary data to collect data on bank foreign ownership, public
ownership, and relevant financial ratios. The data was selected from banks published annual
reports, bank supervision reports from CBK and company websites. Data analysis was done using
multiple regression analysis where the dependent variable was the financial performance of
commercial banks which was measured using the return on assets and return on equity. The
independent variables were the ownership structure, capital structure, and cost structure.
Ownership structure was measured using public-private ownership of banks and foreign-local
ownership of the banks; capital structure was measured using the debt-equity ratio and debt-assets
ratio; and cost structure was measured using the operating ratio, staff cost-to-income ratio, and
loan loss-to-income ratio.
The study findings indicated that the first independent variable ownership structure has a
significant impact on return on assets and return on equity. In particular, private-public ownership
had a significant impact on both return on assets and return on equity while foreign-local

50
ownership had no significant impact on both return on assets and return on equity. The study
indicated that with regards to the second variable, capital structure, it had a significant impact on
both return on assets and return on equity. The debt-to-total assets and debt-to-total equity both
had a significant impact on return on assets but, however, had no significant impact on return on
equity at 5 percent confidence level.
The results based on the third objective indicated that cost structure has a significant effect on
return on assets and return on equity. With regards to return on assets, the study indicated that loan
loss-to-income ratio has a significant effect on ROA while staff costs-to-income ratio and
operating ratio have no significant effect on ROA at 5 percent significant rate. With regards to
return on equity, the study results indicated that all the variables, staff costs-to-income ratio, loan
loss-to-income ratio, and operating ratio have a significant effect on ROE.
5.3 Discussion
5.3.1 Ownership Structure and Financial Performance of Commercial Banks in Kenya
The first objective of the study was to determine the effects of ownership structure on financial
performance of Kenya’s commercial banks. Ownership structure in the study was operationalized
by public-private ownership and foreign-local ownership. Public-private ownership analysed
whether public ownership or private ownership of banks affect their financial performance and
were denoted by assigning them binomial values where publicly-owned banks were denoted using
a 0 while privately-owned banks were denoted using a 1. Foreign-local ownership analysed
whether the banks were owned by foreigners or by local citizens and were also denoted using
binomial values where foreign-owned banks were denoted using a 0 and locally-owned banks were
denoted using a 1. The study’s ANOVA table with regards to effect of ownership structure on
return on assets indicated a p-value of 0.000 which implied that the ownership structure regression
model was a good predictor of return on assets since the value is less than the significance level of
0.05. The variable private-public ownership had a significance value of 0.00 and coefficient value
of 0.023 while foreign-local ownership had a significance value of 0.314 and a coefficient value
of -0.04 less than that of foreign ownership. This meant that private-public ownership had an
impact on return on asset while foreign-local ownership had no significant impact on return on
assets at 5 percent significance value.

51
With regards to effect of ownership structure on return on equity, the study’s ANOVA table on
return on equity indicated a p value of 0.00 which implied that the private-public ownership
structure regression model was a good predictor of return on equity since the value is less than the
significance level of 0.05. This meant that ownership structure has an impact on return on equity.
The variable private-public variable had a significance value of 0.00 and coefficient value of 0.123
while foreign-local ownership had a significance value of 0.480 and local ownership coefficient
value of -0.016 less than that of foreign ownership. This meant that private-public ownership had
an impact on return on equity while foreign-local ownership had no significant impact on return
on equity at 5 percent significance value.
In general, it was noted that ownership structure has significant impact on financial performance
of commercial banks in Kenya since the significance values were less than 0.05 for both return on
assets and return on equity. The study results are consistent with that of Dietrich & Wanzenried
(2011), and Farazi et al (2011) whose studies indicated that privately-owned financial institutions
perform better compared to publicly-owned banks. This could have been due to the fact that foreign
owned banks are considered to have applied management skills and expertise in other nations over
a period. Also, the study is consistent with that of Cornett, Guo, Khaksari and Tehranian (2009)
who indicated that government-owned banks are less profitable compared to private banks since
they lend riskier loans which increase their credit risk.
5.3.2 Capital Structure and Financial Performance of Commercial Banks in Kenya
The second objective of the study was to analyse the effect of capital structure on financial
performance of commercial banks in Kenya. Capital structure was measured in two ways, namely,
debt-equity ratio and debt-assets ratio. The three ratio scale variables were calculated for the
commercial banks in Kenya over the period between 2008 and 2015.From the results, the study
indicated that capital structure had an R value of 0.228 implying a low relationship between capital
structure and return on assets, an adjusted R2 value of 0.046 implying that the variables debt-equity
ratio and debt-asset ratio account for 4.6% of ROA variability. The study’s ANOVA table with
regards to effect of capital structure on return on assets indicated a p value of 0.000 which implied
that the capital structure regression model was a good predictor of return on assets since the value
is less than the significance level of 0.05. The variable debt-equity ratio had a significance value

52
of 0.002 and coefficient value of 0.302 while debt-assets ratio had a significance value of 0.000
and a coefficient value of -0.406. This meant that both debt-equity ratio and debt-assets ratio had
an impact on return on assets at 5 percent significance value.
With regards to effect of capital structure on return on equity, the study indicated an R value of
0.165 indicating that there is a low relationship between a bank’s capital structure and return on
equity. The results also indicated an R2 value of 0.021 which implied that the variables debt-equity
ratio and debt-asset ratio account for 2.1% of ROE variability. The study’s ANOVA table with
regards to effect of capital structure on return on equity indicated a p value of 0.012 which implied
that the capital structure regression model was a good predictor of return on equity since the value
is less than the significance level of 0.005. The variable debt-equity ratio had a significance value
of 0.801 and coefficient value of -0.253 while debt-assets variable had a significance value of
0.147 and a coefficient value of -1.452. This meant that debt-equity ratio and debt-assets ratio had
no significant impact on return on equity at 5 percent significance value.
In overall, it was noted that capital structure has an impact on financial performance of commercial
banks in Kenya since the significance values were less than 0.05 for both return on assets and
return on equity. This study’s results were consistent with the study done by Saeed et al (2013)
who indicated a positive relationship between determinants of capital structure and performance
(return on assets, return on equity, and earnings per share) of banking industry. However, the study
results were in contrast to the study done by Siddik et al (2016) who indicated that there is a
negative impact of capital structure on bank’s performance, and also that done by Kuria (2013)
who indicated that there is no significant relationship between capital structure and financial
performance of commercial banks in Kenya.
5.3.3 Cost Structure and Financial Performance of Commercial Banks in Kenya
The third and final objective of the study was to analyse the effect of cost structure on financial
performance of commercial banks in Kenya. Cost structure was operationalized using staff cost-
income ratio, loan loss/impairment-income ratio, and the operating ratio for commercial banks in
Kenya between 2008 and 2015. From the results, the study indicated that cost structure had an R
value of 0.563 implying a moderate relationship between cost structure and return on assets, an
adjusted R2 value of 0.310 implying that the variables staff costs-income ratio, loan

53
loss/impairment-income ratio, and operating ratio account for 31.0% of return on assets variability.
The study’s ANOVA table with regards to effect of cost structure on return on assets indicated a
p value of 0.000 which implied that the capital structure regression model was a good predictor of
return on assets since the value is less than the significance level of 0.05. The variable staff cost-
income ratio had a significance value of 0.432 and coefficient value of -0.241; loan
loss/impairment-income ratio had a significance value of 0.000 and a coefficient value of -0.301,
while the operating ratio had a significance value of 0.469 and a coefficient value of -0.223. This
meant that loan loss/ impairment-income ratio had an impact on return on assets while staff cost-
income ratio and operating ratio had no significant impact on return on assets at 5 percent
significance value.
With regards to effect of cost structure on return on equity, the study indicated an R value of 0.632
indicating that there is a moderate relationship between a bank’s cost structure and return on equity.
The results also indicated an R2 value of 0.394 which implied that the variables staff costs-income
ratio, loan loss/impairment-income ratio, and operating ratio account for 39.4% of ROE variability.
The study’s ANOVA table with regards to effect of cost structure on return on equity indicated a
p value of 0.000 which implied that the cost structure regression model was a good predictor of
return on equity since the value is less than the significance level of 0.005. The variable staff cost-
income ratio had a significance value of 0.001 and coefficient value of 0.979, loan
loss/impairment-income ratio had a significance value of 0.000 and a coefficient value of -0.341,
while operating ratio had a significance value of 0.000 and a coefficient value of -1.391. This
meant that all the three variables had a significant impact on return on equity at 5 percent
significance value.
In overall, it was noted that cost structure had an impact on financial performance of commercial
banks in Kenya since the significance values were less than 0.05 for both return on assets and
return on equity. This study’s results were consistent with the study done by Obanyi (2013) and
that also done by Rao & Lakew (2012) who indicated that operating costs negatively and
significantly influence profitability of commercial banks in Nigeria and Ethiopia respectively.
54
5.4 Conclusions
5.4.1 Ownership Structure and Financial Performance in Banks
From the analysis of data provided and the findings, the study indicated that ownership structure
has a significant impact on financial performance. This was however the case with private-public
ownership of banks which had significant effects on return on asset and return on equity. This was
seen with a negative coefficient of private-public ownership on financial performance. The
findings led to the conclusion that ownership structure has an effect on financial performance with
privately-owned companies performing better than publicly-owned companies. Commercial bank
managers would therefore want to work in privately-owned banks since they would earn more
especially when there is profitability-related compensation. The study also concludes that there is
no significant difference in financial performance of commercial banks, whether locally-owned or
foreign-owned due to the small difference in performance between them.
5.4.2 Capital Structure and Financial Performance in Banks
The study analysed capital structure and its effect on financial performance in commercial banks
in Kenya and from the findings, it can be concluded that capital structure is important in financial
performance of commercial banks in Kenya. The value of assets and how they have been financed
is important and every individual bank should identify a ratio that would positively impact their
financial performance by reducing their debt-to asset and debt-to-equity ratios. Since the income
for commercial banks varies from time to time, there is no optimal value of assets and equity, but
they should however strive have reasonable balance in their debt and equity values.
5.4.3 Cost Structure and Financial Performance in Banks
After the analysis was done and findings presented, the study concluded that cost management
through the structure has a huge impact on financial performance of commercial banks in Kenya.
From the three ratios that were analysed, loan loss to income ratio has a huge impact on return on
assets compared to the other variables, operating ratio and staff cost-to-income ratio. For return on
equity, however, operating ratio has the biggest impact, followed by staff cost-to-income ratio,
then loan loss-to-income ratio. This means that for commercial banks to improve their profitability,
they need to reduce their operating ratio as much as possible, which means that operational

55
expenses should be greatly managed. Also, other costs such as staff costs and loan losses should
be minimized.
5.5 Recommendations
5.5.1 Recommendations for Improvement
5.5.1.1 Ownership structure and Financial Performance in Banks
The study recommends that proper management guidelines should be outlined in both public and
private banks since the difference in performance could be as a result of management and
governance issues. Proper governance would ensure that there is transparency, accountability, and
responsiveness to the banks’ affairs to minimize risks. Previous financial scandals in the banking
sectors have made the banking sector to implement stringent governance rules and laws to be
followed. The central bank of Kenya should ensure that ownership structure is constituted in a way
that it boosts governance and eventually the financial performance.
5.5.1.2 Capital Structure and Financial Performance in Banks
The study recommends that banks should identify their optimal capital structure which improves
their financial performance. Cost of debt and its impact on financial performance should be
analysed by individual banks, with the analysis of benefits, challenges and costs helping in
decision making of whether to take up external financing, and to what amount. The commercial
banks should also monitor the amount of assets that they have since they are used for revenue
generation, and therefore in conjunction with the return on assets ratio, they can identify the
optimal assets value to have. There is also the Central Bank of Kenya requirements that outline
the recommended capital structure ratios so that the banks do not end up being thinly capitalized.
5.5.1.3 Cost Structure and Financial Performance in Banks
Cost structure is mainly an internal management issue and the study recommends that commercial
banks should analyse their costs well, especially due to competitiveness in the industry.
Technological advances have paved way for new business models which reduce their costs and
improve efficiency. Commercial banks should therefore strive to adopt technologies that give them
competitive advantage but not lead to reduction in quality of service such as drastic reduction in

56
employee number without adequate backup. Loan losses and impairment should also be minimized
through proper vetting of loan applicants, including the applicants’ loan history and the credit
reference bureau. This would reduce the loan losses which currently average around 4-5 percent
of total loans issued.
5.5.2 Recommendations for Further Studies
The study analysed the effect of micro structure on financial performance of Kenya’s commercial
banks. The banking sector is an important one in the economy, which indicates that the sector’s
profitability is important. The study however recommends that other industries such as
manufacturing or commercial to be analysed and comparison with that of the banking industry
made. The study also recommends that future studies should analyse other factors, both micro and
macro, that affect financial performance of companies in all sectors.

57
REFERENCES
Aburime, U. (2005). Determinants of Bank Profitability: Company-Level Evidence from
Nigeria.
Alexandru, C., Genu, G., Romanescu, M.L. (2008). The Assessment of Banking Performances.
Athanasoglou, P.P, Brissimis, S.N and Delis, M.D., (2008).Bank-specific, Industry-Specific
and Macroeconomic Determinants of Bank Profitability. Journal of International
Financial Markets, Institutions and Money. 18, 12.
Awino, Z.B. (2015). Organizational structure and performance of large manufacturing firms
in Kenya: An empirical investigation. Journal of Business and Economics, 6(11), 1883-
1891.
Aziz, A., Ibrahim, I. & Isa, M. (2009). The impact of nonperforming loans (NPL) towards
profitability performance (ROA, ROE, & NPM). Institute of Research, Development
and Commercialization.
Barth, A.R., Nolle, D. & Rice, T. (1997). Commercial banking structure, regulation and
performance: An international comparison. Office of the comptroller of the currency,
Economics working paper.
Berger, A.N. & Humphrey, D.B. (1997). Efficiency of financial institutions: international
survey and directions for future research. European Journal of Operational Research,
98, 175-212.
Berger, A., DeYoung, R., Flannery, M., Lee, D. & Oztekin, O. (2008). How Do Large Banking
Organizations Manage Their Capital Ratios? Journal of Financial Services Research,
34 (2008), 123-49.
Borg, W.R. & Gall, M.D. (1989). Educational research: An Introduction. 5th Edition. New
York: Longman.

58
Bryman, A. & Bell, E. (2007). Business Research Method. 2nd Edition. Oxford: Oxford
University Press.
Bryman, A., & Bell, E. (2011). Business Research Methods (3rd ed.). New York: Oxford
University Press.
Caruntu, G.A. & Romanescu, M.L. (2008). Indicators of Performance in Bank Area. MPRA
Paper No. 11600.
Central Bank of Kenya (2015). Bank Supervision Annual Report 2015.
https://www.centralbank.go.ke/
CBK. (2015). Performance and developments in the Kenyan banking sector for the quarter
ended 30 June 2015. Retrieved from:
https://www.centralbank.go.ke/images/docs/Bank%20Supervision%20Reports/Qu
arterly%20Performance%20Reports/Quarter2of2015.pdf
Chege, J.W. (2013). Relationship between ownership structure and financial performance
among commercial banks listed in the Nairobi Securities Exchange in Kenya.
Unpublished, University of Nairobi.
Chen, W. (2006). Formation and prevention of corporate financial risks. Contemporary
Manager, 5, 56-57.
Cooper, D. R. & Schindler, P. S. (2014). Business research methods. 12th Edition, New York:
McGraw-Hill/Irwin.
Creswell W. J. (2003). Research Design, Qualitative, Quantitative and Mixed methods
approaches. 2nd Edition, Sage Publications.
Danso, A., & Adomako, S. (2014). The financing behaviour of firms and financial crisis.
Managerial Finance, 40(12), 1159–1174.
Desaro, A. I.,(2012)The effect of macroeconomic factors on financial performance of
commercial banks in Kenya. Unpublished thesis submitted to University of Nairobi

59
Dietrich, A. & Wanzenried, G. (2014). The determinants of commercial banking profitability
in low-, middle-, and high-income countries. The Quarterly Review of Economics and
Finance, 22, 1-18.
Dietrich, A. & Wanzenried, G. (2011). Determinants of bank profitability before and during
the crisis: evidence from Switzerland. Journal of International Financial Markets,
Institutions and Money, 21 (3), 307-327.
Dodge, Y. (2003). The Oxford Dictionary of Statistical Terms: For The International Statistical
Institute. Retrieved from https://stats.oecd.org/glossary/detail.asp?ID=3852 on 8th
February, 2017.
Ebaid, E. I. (2009). The impact of capital-structure choice on firm performance: empirical
evidence from Egypt. The Journal of Risk Finance, 10 (5): 477-487.
Echeboka, F.N.,Egbunike, C.F.& Ezu, G.K.(2014).Determinants of bank profitability in
Nigeria: Using Camel Rating Model (2001–2010). IOSR Journal of Business and
Management, 16(9), 44-50.
Eldomiaty, T. I., & Azim, M. H. (2008). The dynamics of capital structure and heterogeneous
systematic risk classes in Egypt. International Journal of Emerging Markets, 3(1), 7-3
Farazi, S., Erik, F., Roberto, R. (2011). Bank Ownership and Performance in the Middle East
and North Africa Region. . The World Bank Middle East and North Africa Region
Financial and Private Sector Development Unit & Financial and Private Sector.
Farma,E. & French, K.(2002).Testing Trade off and Pecking Predictions about Dividends and
Debt, Review of financial studies, 15(7): 1-3
Financial Accounting Manual (2017). Retrieved from https://www.federalreserve.gov /federal-
reserve-banks/fam/chapter-8-special-topics.htm#xsubsection-13-8325d2ab on 24th
March 2017.
Flamini, V., McDonald, C. & Schumacher, L. (2009). The determinants of commercial bank
profitability in Sub-Saharan Africa. IMF Working Paper, WP/09/15.

60
Frederick, N. K. (2014). Factors affecting performance of commercial banks in Uganda: A
case for domestic commercial banks. Proceedings of 25th International Business
Research Conference, 1-19.
Garbarino, S. & Holland, J. (2009). Quantitative and qualitative methods in impact evaluation
and measuring results. Issue paper, Governance and Social Development Resource
Centre.
Garisson, R., Noreen, E. & Brewer, P. (2009). Managerial Accounting. 11th Edition, Tata
McGraw-Hill.
Goddard, J., Molyneux, P., & Wilson, J. O. (2004). The profitability of European banks: a
cross‐sectional and dynamic panel analysis. The Manchester School, 72(3), 363-381.
Graham, J. & Harvey, C. (2001). The theory and practice of corporate finance: evidence from
the field. Journal of Financial Economics, (60).
Gupta, K.P (2009). Cost Management: Measuring, Monitoring and Motivating Performance.
Global India Publications Pvt Limited, New Delhi.
Hailu, A. (2015). The impact of capital structure on profitability of commercial banks in
Ethiopia. Unpublished, University of Addis Ababa.
Hadlock, C. and James, C. (2002). Do banks provide financial slack? Journal of Finance,
57,(9):34-20
Jacobson T., Lindé, J. & Roszbach, K. (2005). Exploring Interactions between Real Activity
and the Financial Stance. Journal of Financial Stability, l(1), 308-341.
Jahanzeb, A., Bajuri, N. H., Karami, M., & Ahmadimousaabad, A. (2014). Trade-Off Theory,
Pecking Order Theory and Market Timing Theory: A Comprehensive Review of Capital
Structure Theories. International Journal of Management and Commerce Innovations,
1(1), 11–18.

61
Kamau, A. & Were, M. (2013). What drives banking sector performance in Kenya? Global
Business and Economics Research Journal, 2(4): 45-59
Kamau, M. & Kagiri, A.W. (2013). Effect of capital structure on financial performance of
banking institutions listed in Nairobi Securities Exchange. International Journal of
Science and Research, 4(7), 924-930.
Kaneza C, (2016). Factors Affecting the Financial Performance of Commercial Banks Listed
On the Nairobi Securities Exchange. Unpublished, University of Nairobi.
Kanini, D. (2016). Effects of capital structure on financial performance of Commercial Banks
in Kenya. Unpublished, South Eastern Kenya University.
Kenya Financial Sector Stability Report (2015). The Kenya Sector Stability Report, August
2015, Issue 6.
Kenya Financial Sector Stability Report (2016). The Kenya Sector Stability Report, August
2016, Issue 7.
Khrawish, H.A. (2011) Determinants of Commercial Banks Performance: Evidence from
Jordan. International Research Journal of Finance and Economics, 5(5), 19-45.
Koller, T., Goedhart, M., & Wessels, D. (2010). Valuation: measuring and managing the value
of companies (Vol. 499). john Wiley and sons.
Kothari, C.R. (2004). Research Methodology: Methods and Techniques. 2nd Edition, New Age
International Ltd, Publishers.
Kuria, F. B. (2013). The effect of capital structure on the financial performance of commercial
banks in Kenya. Unpublished, University of Nairobi.
Laeven L. & Majoni G., (2003). Loan Loss Provisioning and Economic Slowdowns: Too
Much, Too Late? Journal of Financial Intermediation, 12 (2), 178-197.
Linyiru, B. M. (2006). Survey of Corporate Governance Practices in Banks in Kenya.
Unpublished MBA project, University of Nairobi.

62
Madiwe, J. (2014). Ownership structure, inside ownership and firm performance. University
of Twente.
Mishkin, F.S. (2007). The economics of money, banking, and financial markets. 8th edition,
Pearson Addison-Wesley.
Modigliani, F., Miller, M.H. (1958). The cost of capital, corporation finance and the theory of
investment. American Economic Review, 48(3), 261-97.
Mugenda, M.O. & Mugenda, A. (2009), Research methods: Qualitative and quantitative
Approaches, Nairobi, KE : Africa Centre for technology studies
Myers, S.C. (1999). Financial architecture. European financial management, 55(3), 133-141.
OECD (1999). OECD Principles of Corporate Governance, Organization for Economic Co-
operation and Development Paris.
Oloo, O. (2010). Banking Survey Report, The best banks this decade 2000-2009, Think
Business Limited, Kenya, www.bankingsurvey.co.ke.
Olweny, T. & Shipho, T.M. (2011). Effects of Banking Sectoral Factors on the Profitability of
Commercial Banks in Kenya. Economics and Finance Review, 1(5), 1-30.
Ongore, V.O. (2011). The relationship between ownership structure and firm performance: An
empirical analysis of listed companies in Kenya. African Journal of Business
Management, 5(6), 2120-2128.
Ongore, V.O. & Kusa, G.B. (2013). Determinants of financial performance of commercial
banks in Kenya. International Journal of Economics and Financial Issues, 2(1), 33-40.
Pricewaterhouse Coopers (2014). Retail banking in Kenya: Evolution or Revolution?
Quangyen, T. & Yezhuang, T. (2013). Organizational Structure: Influencing Factors and
Impact on a Firm. American Journal of Industrial and Business Management, 3(2).

63
Rengasamy, D. (2012). The need to evaluate bank performance. Retrieved from
http://www.theborneopost.com/2012/11/06/the-need-to-evaluate-bank-performance/ on
10th April 2017.
Rezvanian, R. & Mehdian, S. (2002). An examination of cost structure and production
performance of commercial banks in Singapore. Journal of Banking and Finance, 26(1),
79-98.
Saeed, M.M., Gull, A.A. & Rasheed, M.Y. (2013). Impact of capital structure on banking
performance: A case study of Pakistan. Interdisciplinary journal of contemporary research
in business, 4(10), 393-403.
Saeedi ,A. & Mahmoodi,I. (2011). Capital Structure and Firm Performance: Evidence
fromIranian Companies. International Research Journal of Finance and Economics,
70(7):20-29
Sangmi, M. & Nazir, T. (2010). Analyzing financial performance of commercial banks in
India: Application of CAMEL model. Pak. J. Commer. Soc. Sci, 4 (1), 40-55.
Saunders, M,. Lewis, P., & Thornhill., A (2015). Research Methods for Business Students.
7th ed. New York, New York. Pearson Education
Shleifer A. & R.W. Vishny (1997). A Survey of Corporate Governance. Journal of Finance,
52, 737-83.
Siddik, N., Kabiraj, S. & Joghee, S. (2016). Impact of capital structure on performance of
banks in a developing economy: Evidence from Bangladesh.
Singh, P. (2010). Role of commercial banks in economic development: Indian perspective.
Tactful Management Research Journal, 7(29).
Teimet, P. R., Ochieng, D. O., & Away, S. (2011). Income source diversification and financial
performance of commercial banks in Kenya. International journal of business and
public management, 11(1), 26-3

64
Tran, Q. & Tian, Y. (2013). Organizational Structure: influencing factors and impact on a firm.
American Journal of Industrial and Business Management, 3(2), 229-336.
Trujillo-Ponce, A. (2012). What determines the profitability of banks? Evidence from Spain.
Unpublished, Pablo de Olavide University.
Zeitun, R. andTian, G. (2007). Capital Structure and Corporate Performance: Evidence From
Jordan. Australasian Accounting Business and Finance Journal, 1(7): 40-53
Zikmund, W. G., Babin, B. J., Carr, J. C., & Griffin, M. (2013). Business research methods.
o7th ed. New York, New York: Cengage Learning
Zhang, Y., Feng, Z., & Yang, Y. (2008b). New theory of 3d financial risks early-warning mode
and index early-warning matrix. Accounting Communications, 2, 25–29.
Zhao, T., Casu, B. & Ferrari, A. (2010). The impact of regulatory reforms on cost structure,
ownership and competition in Indian banking. Journal of Banking and Finance, 34(1),
246-254.

65
APPENDIX I: DATA COLLECTION SHEET
2006 2007 2008 2009 2010 2011 2012 2013 2014 2015
Source Kes ‘000 Kes ‘000 Kes ‘000 Kes ‘000 Kes ‘000 Kes ‘000 Kes ‘000 Kes ‘000 Kes ‘000 Kes ‘000
Profit after tax F.S
Total assets
Return on assets
Total equity
Return on equity
Net interest income
Non-interest income
Total operating costs
Operating ratio
Short-term debt
Total assets
Total equity
Debt to total assets
Debt to total equity
Staff costs
Staff costs to income ratio
Loan loss
Impaired loans
Loan loss/impairment to income ratio
Bank Ownership
Foreign - 0
Local - 1
Key:
F.S = financial statements
0,1 = dummy variables

66
APPENDIX II: WORK PLAN
Month
Activity
December
2016 –
January 2017
January -
March 2017
March-
May 2016
June
2017
July –
August 2017
Concept paper
development &
approval of topic
✔
Proposal
development
✔
Data Collection ✔
Data Analysis &
Conclusion
✔
Project submission ✔

67
APPENDIX III: RESEARCH BUDGET
Expenses Ksh
1 Proposal Development
Materials 2,000
Printing 2,000
Photocopying 2,000
2 Data Collect (Fieldwork)
Photocopying 4,000
Travelling 5,000
Research Assistant 10,000
3 Data Analysis & Interpretation
Data Analysis 10,000
4 Report Writing & Dissemination
Report Writing 5,000
Binding & Dissemination 2,000
5 Miscellaneous 10,000
TOTAL 52,000