Embed Size (px)
Citation preview
* Corresponding author's E-mail address:
Advanced Journal of Chemistry-Section A, 2019, 2(4), 296-315
Research Article http://ajchem-a.com
Effect of Partial Substitution of Raw Gypsum with Thermally Treated Phosphogypsum on the Properties of Portland Pozzolanic Cement
Mahmoud Ahmed Taher a, Adel Mohamed Amine b, Bassam Khalaf Damarany c,*
a Chemistry Department, Faculty of Science, Al-Azhar University, Assiut, Egypt b Housing and Building National Research Center, Cairo, Egypt c Manaseer Cement and Mining Company, Amman, Jordan
A R T I C L E I N F O A B S T R A C T
Received: 26 February 2019
Revised: 11 April 2019
Accepted: 02 May 2019
Available online: 04 May 2019
DOI: 10.33945/SAMI/AJCA.2019.4.4
K E Y W O R D S
Long years of production of phosphate fertilizer at very large amounts of phosphogypsum (PG) occupied large area, causing chemical and radiological environmental substances. The use of PG in building materials represents a good method for lowering the cost of cement production and dispose of phosphogypsum as chemical and radioactive waste. Fresh wet hemihydrate phosphogypsum, cement and pozzolana additive were mechanically activated together and from mixing Portland pozzolanic cement (PPC) with PG, these mixes were prepared at different replacements (by weight) of raw gypsum (RG) with purified PG ranging from 1–5%. The purified PG was obtained by calcining PG at temperatures of 200, 400, 600, 800 and 1000 ᵒC. The compressive strength, bulk density, total porosity, combined water and free lime of different hardened mortars were obtained following 3, 7, 28 and 90 days of curing. In addition, the setting time of cement pastes. The highest percentage increase in strength was found to be for PG calcined at temperatures of 800 and 1000 ᵒC. The incorporation of PG in the cement paste has dramatically increased its initial and final setting times. FTIR spectroscopic analysis and scanning electron microscopy (SEM) were used to investigate the change in structure of mortars after curing and change in morphology and microstructure of some hardened pastes.
Phosphogypsum
Clinker
Pozzolanic cement
G R A P H I C A L A B S T R A C T
Micrographs of mixes (PPV) contain thermally treatment PG at 600 oC after 3(a), 28 (b) and
90 (c) days curing

Effect of Partial Substitution of Raw…
297 Adv J Chem A 2019, 2(4), 296-315
Introduction
The quantity of PG produced is very large:
for each 1 ton of phosphate (P2O5) produced,
there is a coproduction of 5 tons of calcium
sulfate (PG). The annual world production of
this material is up to 180 million tons and is
expected to reach up to 300 million tons by
the year 2000 [1]. Only 15% of the PG is
utilized by the cement and gypsum industries
as a setting moderator for cement and for
making gypsum plaster. The impurities in PG
have been found to delay the setting time and
reduce the rate of early strength development
of cement to a greater extent than pure
gypsum, although strengths at later ages are
not affected. Fortunately, either chemical
processing or heat treatment can reduce these
impurities. The remaining 85% of PG is not
used, causing an environmental problem and
creating need for large areas for disposal.
Therefore, attempts were made to use PG in
applications such as road and rail works fills,
stabilization of base course, and building
constructions. In addition, the potential for
using PG in making roller-compacted concrete
[2–9]. Smadi, Haddad and Akour studied
utilization of phosphogypsum as cement (OPC
and PPC) replacement agents in mortars and
found decrease in compressive strength. The
incorporation of phosphogypsum in the
cement has drastically increased its initial
strength. Also, this strength development was
attributed to formation of anhydrate at higher
temperatures [10]. Treated phosphogypsum
can be used as an ingredient of plaster [11-
13]. The most important and motivating use of
phosphogypsum could be in the construction
industry. In the manufacturing process of
cement, phosphogypsum could be used as a
replacement of natural gypsum which plays
the role of a set retarder [14,15] on the other
hand. Bagade et al., studied the partial
replacement of cement by various percentage
of phosphogypsum gave good result with
concrete specimens [16]. Researches [17,18]
on the basic engineering properties of
phosphogypsum-based concrete mixtures
concluded that the unique properties of
dehydrate phosphogypsum under
compaction-consolidation can significantly
contribute to the compressive strength of
concrete mixes. However, with higher
percentage of phosphogypsum, the strength
of concrete mixtures is affected by the
moisture at the time of testing. Better
compressive strength attained with calcined
phosphogypsum [19]. Reddya et al., studied
the replacement cement by phosphogypsum
and they have found the replacement at 10%
act optimum [20]. At present,
phosphogypsum is mainly used in building
materials industry, including cement retarder,
building gypsum powder, gypsum board,
exterior gypsum board, fiber plaster board,
mine filling agent and road bed material [21].
However, prospective processes for large-
scale utilization of phosphogypsum are still
under investigation. The utilization of
phosphogypsum is realistically a significant
problem in phosphoric acid industry [22]. Al-
Jabbari et al., [8] adopted a physical method
for the purification of PG prior to using it as a
building material. The method consists of
washing PG with water using sieve no. 100 µ,
burning the PG at different temperatures (low
and high), and adding some accelerators (such
as calcium hydroxide) to the calcined PG in
order to improve the setting time and the
compressive strength of the produced
material. The purified PG was analyzed
chemically and tested physically. The results
indicated that the best and cheapest method
for the purification of PG was through
washing with water, then neutralizing with
calcium hydroxide. Roy et al., [23] studied the
potential of using a by-product slag, produced
by sulfur-recovery process from PG, as an
aggregate in Portland cement concrete. The
phase composition and microstructure of two
different samples of produced slag were
studied. The study showed that although both

M. A. Taher et al.
298 Adv J Chem A 2019, 2(4), 296-315
slags have different microstructure,
mineralogically both are suitable as
aggregate in concrete as long as the amount
of sulfate is not too high (4.5%).
Experimental
Materials
In this study, the clinker used in the
present experimental study has been
obtained from Manaseer Cement Company
(Jordan), The Clinker was procured from
local market. Phosphogypsum (PG) are
produced as by-products of phosphoric
acid manufacture process in Jordan Abyad
Fertilizers and Chemicals Company
(Jordan). Millions tons from PG wastes are
stockpiled over open areas. Major negative
environmental impacts are highly expected
due to dissolution of various hazardous
chemicals the stockpiled contains. Its
chemical composition and mineralogical
constituents are illustrated in Table 1. Raw
Gypsum (RG) is one of the non-metallic
minerals, composed mainly of hydrated
calcium sulfate. It is usually formed by
precipitation of CaSO4.2H2O due to
evaporation of solution with high content of
SO42- and Ca2+ ions. Finally, Pozzolana (Pz)
Tuff as pozzolanic material was obtained from
Tal-Hassan which is located about 120 km
northeast of Jordan. Portland Pozzolanic
Cement (PPC) was prepared by mixing 70%
from clinker, 25% pozzolana and 5% from
raw gypsum. Several pastes were made in this
investigation by partial substitution of raw
gypsum with thermally treated phospho-
gypsum at different temperatures 200, 400,
600, 800 and 1000 °C at different proportions
Table 2. The initial water/solid ratio used in
this study were varied from 0.3-0.5 according
to the amount of replaced thermally treated
phosphogypsum.
Table 1. The chemical compositions (%) of the raw materials
Contents PCC PG before
Firing
PG at
200 ᵒC
PG at
400 ᵒC
PG at
600 ᵒC
PG at
800 ᵒC
PG at
1000 ᵒC
RG Pz
CaO % 64.48 35 35.12 35.8 36.71 37.5 40.53 39.82 10.61
SiO2 % 21.32 8.32 8.48 8.56 9.07 9.50 10.52 6.81 41.23
AL2O3 % 5.32 0.15 0.16 0.33 0.56 0.29 0.25 1.1 12.15
Fe2O3 % 3.78 0.17 0.15 0.2 0.16 0.16 0.15 0.56 15.41
MgO % 2.08 0.42 0.42 0.45 0.47 0.482 0.2 1.59 8.78
K2O % 0.58 0.04 0.04 0.04 0.036 0.043 0.003 0.35 2.07
Na2O % 0.58 …. 0.1 ….. ….. ….. 0.74 0.01 4.62
SO3 % 0.89 42.06 39 35.32 33.63 36.21 33.1 22.18 0.098
P2O5 % 0.33 6.79 6.44 3.94 3.77 2.55 2.35 0.39 0.74
CL % 0.002 ….. 0.01 …. 0.28 0.34 0.43 0.02 0.003
LOI % 0.00 10.1 9.63 7.43 3.6 1.01 0.82 31.04 0.96
Cr2O3 % 0.011 …. …. ….. …. … … ….. 0.087
TiO2 % 0.56 0.054 0.056 0.054 0.052 0.047 0.052 0.12 4.14
Mn2O3 % 0.022 … …… …. …. … … ……. 0.27
ZnO % 0.000 0.045 0.015 0.045 0.048 0.037 0.018 0.008 0.025
SrO % 0.045 0.46 0.29 0.52 0.55 0.47 0.333 0.35 …..

Effect of Partial Substitution of Raw…
299 Adv J Chem A 2019, 2(4), 296-315
Table 2. The mix composition of PPC pastes made by partial substitution of RG with thermally treated PG at different temperatures
Mix No Composition of Mixes
PPC 70% clinker + 5% RG + 25% Pz
PPI 70% clinker + 4% RG + 1% PG + 25% Pz
PPII 70% clinker + 3% RG +2% PG + 25% Pz
PPIII 70% clinker + 2% RG + 3% PG + 25% Pz
PPIV 70% clinker + 1% RG + 4% PG + 25% Pz
PPV 70% clinker + 5% PG + 25% Pz
Pz: Pozzolana RG: Raw Gypsum PG: Phosphogypsum
Methods and Instruments
The mixes (PPI-PPV) were prepared by
mixing thermally treated phosphogypsum
at different temperatures 200, 400, 600, 800
and 1000 ᵒC at different portions with
clinker and raw gypsum. The thermal
treated of PG has been done by heating 2 h
(10 ᵒC/min) in muffle furnace for the
required temperatures. PG was cooled in
room temperature after every calcined
temperature then crushed and ground in
jaw crusher machine. The chemical
composition and mineralogical constituents
of Portland Cement Clinker (PCC),
Phosphogypsum (PG), and Raw Gypsum
(RG), are illustrated in Table 1 by XRF 9900,
all these material were separately crushed
and ground in the jaw crusher machine. The
ingredients of each mix blended in the lab
ball mill for 2h to insure complete
homogeneity. Specimens were cast into
mold of (2.54*2.54 cm), then the specimens
in the mold were stored curing in humidity
chamber at 20±1 ᵒC for 24 h. then demolded
and immersed in tap water until tested.
After the predetermined curing time 3, 7, 28
and 90 days, groups of three specimens
were used to determine the residual
compressive strength. Setting times of
cement mixed by mixing different
proportions were measured by Vicat
apparatus according to EN-196-3 [24]. Bulk
density and total porosity were determined
after any time of hydration as described
elsewhere [25]. The hydration of cement
pastes were stopped by employing alcohol–
ether method [26]. The samples were dried
at 105 ᵒC for 1 h and then collated in
polyethylene bags; sealed and stored in
desiccators for analysis. The degree of
hydration was followed by determination of
free lime [26] and chemically combined
water content [27]. On the other hand, the
raw materials characterized by XRF
(Fluorescence (XRF Thermo Scientific ARL
9900 Total Cement Analyzer) and the
change in structure of mortars after curing
characterize by FTIR spectroscopic (a
Perkin-Elmer System 2000 FTIR
spectrometer) and scanning electron
microscopy SEM (JEOL JSM-840 SEM) were
used for investigate and change in
morphology and microstructure of some
hardened pastes, finally the compressive
strength of hardened pastes determined by
the digital compressive strength machine
(Toni/ technik).
Results and Discussion
Setting time and water consistency
Normal setting of cement is associated
with the hydration of Alite (impure C3S) and
formation of the calcium silicate hydrate
(CSH) phase. On the contract, the initial and
final setting time pasts PPC- PG treated at
200, 400, 600, 800 and 1000 ᵒC increases

M. A. Taher et al.
300 Adv J Chem A 2019, 2(4), 296-315
with increasing the substitution of RG with
PG and decreased by increasing treatment
temperature of PG, the reasons of all these
results are attributed to thermal treatment
of PG which decrease the pronounced effect
of water soluble P2O5 and present
phosphorus, sulfate, fluoride, and organic
impurities contained in PG interfere in an
unpredictable way to delay the setting time
in PG [11]. Form protective coating as by the
impurities on the surface of cement grains
during the gauging of cement with water
and thus suppression of the hydration of
cement temporarily [30]. In general, the
setting time decreasing with increasing
temperature, hence, OPC containing PG
treated at 800 ᵒC and 1000 ᵒC have lowest
setting time. The water/cement ratio W/C of
hardened specimens made from PPC-PG
with treatment at 200 ᵒC decreases by
increasing the amount of PG gradually from
24.4 % (PPI) to 23.4 % (PPV) respectively,
by increasing firing temperature of PG the
water/cement ratio W/C decreases this may
be anhydrite higher water demand. The
specimens from PPC-PG fired at 800 ᵒC and
1000 ᵒC possess the lowest water of
consistency value 23%. Hence, by increasing
firing temperature the water/cement ratio
decreases.
Compressive strength
The compressive strength of cement
mortar is considered to be one of the most
important aspects of Pozzolanic Portland
cement. Five representative mixes were
chosen to study the influence of the
replacement PG (at different temperatures)
on the compressive strength. Figures 1-5
showed the relation between compressive
strength and curing time at different
percentage of PG, the trend of the strength
increases by curing time, therefore, the
pastes of hardened made from PPC and PG
treated at 1000 ᵒC have strength at 3, 7, 28,
90 days higher than blank sample. It was
clear that, compressive strength values
increased by increase the firing
temperature, this is due to calcinations of
lime presence in PG at 1000 ᵒC which causes
development in the strength and the
strength depends primarily on the
formation of hydrated calcium silicate as the
main hydration product, which is
precipitated into the water filled spaces to
form a more compact body. This is mainly
attributed to crystallization of the initially
formed hydrates, having strong binding
forces and/or their transformation into
other hydration products having weaker
binding forces. Finally, Mix PPV containing
5% thermally treated PG at 1000 °C
possesses the highest compressive strength
value after 90 days curing.
Table 3. Setting time from mixes (PPC-PPV) containing thermally treated PG at different temperature
Mix
200 ᵒC 400 ᵒC 600 ᵒC 800 ᵒC 100 ᵒC
Initial
(min)
Final
(min)
Initial
(min)
Final
(min)
Initial
(min)
Final
(min)
Initial
(min)
Final
(min)
Initial
(min)
Final
(min)
PPI 335 425 350 430 330 440 200 285 180 265
PPII 460 600 560 640 610 730 205 290 190 270
PPIII 720 840 630 720 740 810 220 310 200 270
PPIV 780 860 680 740 750 815 215 275 205 280
PPV 730 810 715 830 605 700 210 300 200 265
PPC 185 255

Effect of Partial Substitution of Raw…
301 Adv J Chem A 2019, 2(4), 296-315
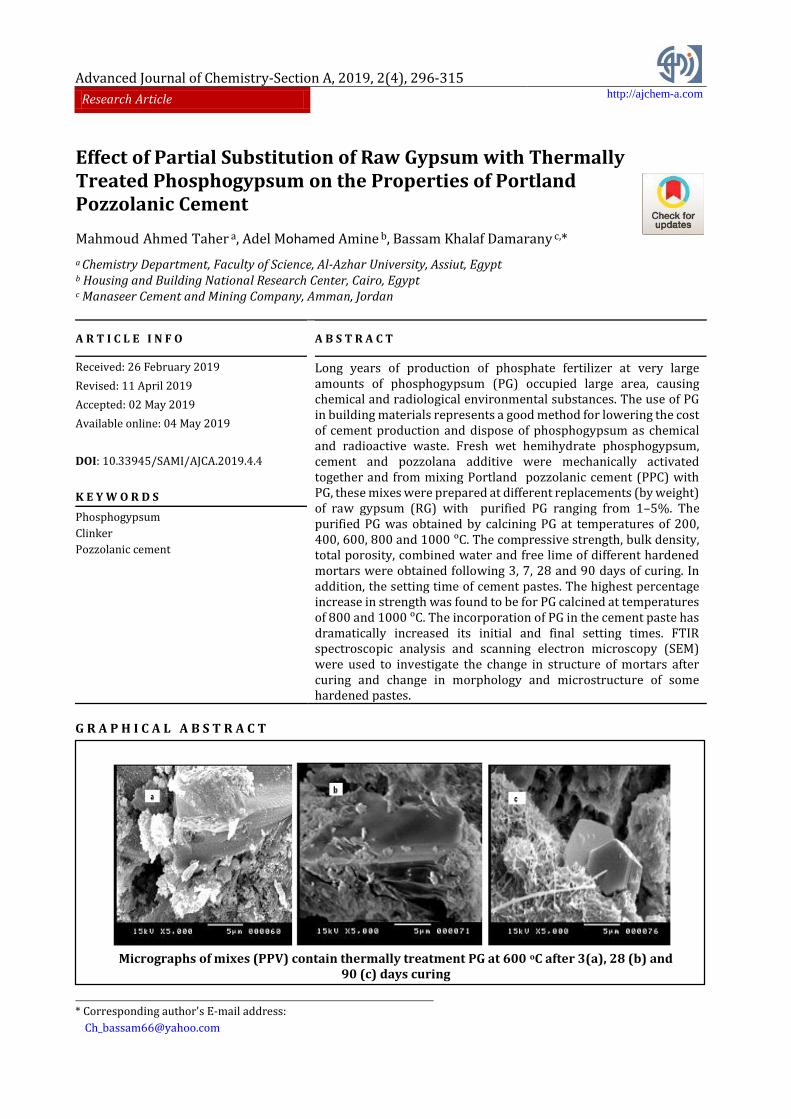
Bulk density and total porosity
Figures 6-10 illustrated the bulk density of
the hardened pastes containing calcined PG at
different temperatures as a function of curing
time. Clearly, at different temperature the
bulk density increases with longer hydration
time for all samples, so the results of the bulk
density progress at 90 days it’s highest. On the
contract, the compressive strength increases
with decreases the total porosity, so when the
compressive strength increases the total
porosity decreases [28] and increases the
bulk density this is due to hydration products
fill parts of the total pore volumes. Porosity
can govern the properties of the materials,
especially affecting material strength. High
porosity will result in low material strength,
whereas decreasing porosity can enhance
material strength [29]. The results in Figures
11-15 indicate that the total porosity for all
samples PPC contain firing PG at different
temperature decrease gradually for long time,
the results for all samples possess higher
porosity at 3 days, on the other hand the
lowest total porosity at 90 days [30].
Generally, the results show that for all pastes
at all ages, the porosity decreased as the
curing age increased, this is due to the filling
up of a part of the available pore volume with
the hydration products, as the hydration
proceeds.
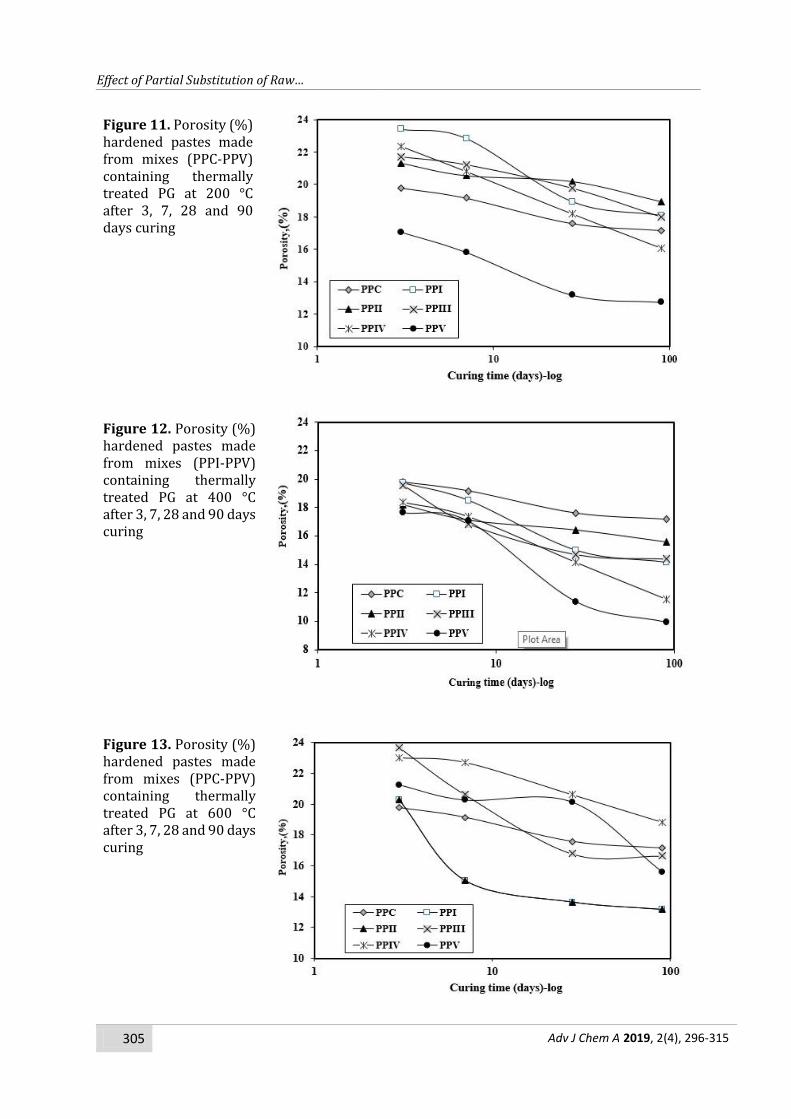
Chemically combined water content (%)
According to Figures 16-20 the chemically
combined water content of hardened
specimens made from PPC which contain PG
treated at 200, 400, 600, 800 and 1000 ᵒC
increases by increasing curing time, the
results of hydration kinetics indicated that
chemically-combined water contents
increases with increasing age of hydration for
all types of hardened PPC-PG pastes. Mix PPI
(70% PCC: 25% Poz: 4% RG: 1% PG treated at
200 ᵒC) possesses higher combined water
content values, while mixes PPIV and PPV
(which contain PG treated at 1000 ᵒC)
possesses the lowest values. These results are
in harmony with that obtained with respect to
the compressive strength, bulk density and
porosity results which indicated that mixes
PPIV and PPV at 1000 ᵒC have the highest
values.
Figure 1. Compressive strength of hardened pastes made from mixes (PPC-PPV) containing thermally treated PG at 200 °C after 3, 7, 28 and 90 days curing

M. A. Taher et al.
302 Adv J Chem A 2019, 2(4), 296-315
Figure 2. Compressive strength of hardened pastes made from mixes (PPC-PPV) containing thermally treated PG at 400 °C after 3, 7, 28 and 90 days curing
Figure 3. Compressive strength of hardened pastes made from mixes (PPC-PPV) containing thermally treated PG at 600 °C after 3, 7, 28 and 90 days curing
Figure 4. Compressive strength of hardened pastes made from mixes (PPC-PPV) containing thermally treated PG at 800 °C after 3, 7, 28 and 90 days curing

Effect of Partial Substitution of Raw…
303 Adv J Chem A 2019, 2(4), 296-315
Figure 5. Compressive strength of hardened pastes made from mixes (PPC-PPV) containing
thermally treated PG at 1000 °C after 3, 7, 28 and 90 days curing
Figure 6. Bulk density (g/cm3) hardened pastes made from mixes (PPC-PPV) containing
thermally treated PG at 200 °C after 3, 7, 28 and 90 days curing
Figure 7. Bulk density (g/cm3) hardened pastes made from mixes (PPC-PPV) containing thermally
treated PG at 400 °C after 3, 7, 28 and 90 days curing

M. A. Taher et al.
304 Adv J Chem A 2019, 2(4), 296-315
Figure 8. Bulk density (g/cm3) hardened pastes made from mixes (PPC-PPV) containing thermally
treated PG at 600 °C after 3, 7, 28 and 90 days curing
Figure 9. Bulk density (g/cm3) hardened pastes made from mixes (PPC-PPV) containing thermally treated PG at 800 °C after 3, 7, 28 and 90 days curing
Figure 10. Bulk density (g/cm3) hardened pastes made from mixes (PPC-PPV) containing thermally treated PG at 1000 °C after 3, 7, 28 and 90 days curing
Effect of Partial Substitution of Raw…
305 Adv J Chem A 2019, 2(4), 296-315
Figure 11. Porosity (%) hardened pastes made from mixes (PPC-PPV) containing thermally treated PG at 200 °C after 3, 7, 28 and 90 days curing
Figure 12. Porosity (%) hardened pastes made from mixes (PPI-PPV) containing thermally treated PG at 400 °C after 3, 7, 28 and 90 days curing
Figure 13. Porosity (%) hardened pastes made from mixes (PPC-PPV) containing thermally treated PG at 600 °C after 3, 7, 28 and 90 days curing

M. A. Taher et al.
306 Adv J Chem A 2019, 2(4), 296-315
Figure 14. Porosity (%) hardened pastes made from mixes (PPC-PPV) containing thermally treated PG at 800 °C after 3, 7, 28 and 90 days curing
Figure 15. Porosity (%) hardened pastes made from mixes (PPC-PPV) containing thermally treated PG at 1000 °C after 3, 7, 28 and 90 days curing
Figure 16. Chemically-combined water contents (Wn %) hardened pastes made from mixes (PPC-PPV) containing thermally treated PG at 200 °C after 3, 7, 28 and 90 days curing

Effect of Partial Substitution of Raw…
307 Adv J Chem A 2019, 2(4), 296-315
Figure 17. Chemically-combined water contents (Wn %) hardened pastes made from mixes (PPC-PPV) containing thermally treated PG at 400 °C after 3, 7, 28 and 90 days curing
Figure 18. Chemically-combined water contents (Wn %) hardened pastes made from mixes (PPC-PPV) containing thermally treated PG at 600 °C after 3, 7, 28 and 90 days curing
Figure 19. Chemically-combined water contents (Wn %) hardened pastes made from mixes (PPC-PPV) containing thermally treated PG at 800 °C after 3, 7, 28 and 90 days curing
M. A. Taher et al.
308 Adv J Chem A 2019, 2(4), 296-315
Figure 20. Chemically-combined water contents (Wn %) hardened pastes made from mixes (PPC-PPV) containing thermally treated PG at 1000 °C after 3, 7, 28 and 90 days curing
Free lime (CaO %)
The results of free lime contents indicated
that the free lime was consumed gradually
with increasing age of hydration for all types
of the hardened PPC-PG pastes. The free lime
increased with increasing PG contents in PPC-
PG pastes. Free lime content increases by
increasing thermal treatment of PG also
increasing by PG content, so mix PPV (70%
PCC: 25% Poz: 5% PG treated at 1000 ᵒC)
possesses the higher free lime values at all
pastes and all time of curing and mix PPIII
(70% PCC:25% Poz: 2% RG: 3% PG treated at
800 ᵒC) possess the lowest free lime values
this is due to PG containing % of P2O5 (6.79%:
2.35%) respectively, this lead to completely
decomposition clinker phases especially C3S
phase into α`H-C2S and free lime content
phases [30].
FTIR analysis
Figure 26 showed the IR analysis of
hardened pastes made from PPC-RG after 3,
28 and 90 days curing to identify the phases
coexisting during hydration process. It is clear
that, there is a sharp band at 3646 cm-1 and
1460 cm-1 due to formation of C2S
accompanied by liberation of lime [31], weak
bands at 1650 cm-1 and 875 this is due to
partial carbonate of unreacted lime, broad
band at 970 cm-1 (vibration of SiO4- groups)
[32] and the weak intensity band at 470 cm-1
is attributed to Si-O bending mode [33]. Figure
27 illustrated the IR spectra of hardened
pastes of mix PPV contain PG thermally
treated at 200 ᵒC after 3, 28 and 90 days
curing. As hydration progresses, the following
bands are observed the intensity of the band
at 3650 cm-1 increases indicating liberation of
more Ca (OH) 2 the broad band at 3420 cm-1
are intensified with hydration, indicating that
the increase of hydrated products associated
with water and the strong asymmetric
stretching Si-O band (ν 3) is shifted to high
frequencies centered at 970 cm-1 with
hydration indicates that the formation of C-S-
H [34]. The decrease and increase in
intensities of the out-of-plane and in-plane Si-
O bending vibrations are occur in significant
changes with hydration and it indicates SiO4-
units in cement at 510 cm-1. The IR analysis of
hardened pastes of mix PV contain PG treated
at 600 ᵒC after 3, 28 and 90 days curing are
shown in Figure 28 shows a sharp band at
3645 cm-1 associated to O-H stretching
vibrations of portlandite (Ca(OH)2) and the
peaks at 3420 and 1640 cm-1 are correspond
to stretching and bending modes of water of
crystallization particularly. The carbonates
peak at 1470 cm-1 and 876 cm-1 are observed
due to the reactions of atmospheric CO2 with
calcium hydroxide. The broad band at 976 cm-
1 is due to Si-O asymmetric stretching

Effect of Partial Substitution of Raw…
309 Adv J Chem A 2019, 2(4), 296-315
vibration of C3S and/or C2S and very weak
band at 465 cm-1 is attributed to Si-O bending
mode [35]. As far as we are aware,
spectroscopic of hardened pastes of mix PPV
contain PG thermally treated at 1000 ᵒC after
3, 28 and 90 days curing. Different bands
appear at intensities 3644, 3460, 1655, 1455,
967, 874 and 466 cm-1 which were illustrated
before.
Figure 21. Free lime contents (CaO %) hardened pastes made from mixes (PPI-PPV) containing thermally treated PG at 200 °C after 3, 7, 28 and 90 days curing
Figure 22. Free lime contents (CaO %) hardened pastes made from mixes (PPI-PPV) containing thermally treated PG at 400 °C after 3, 7, 28 and 90 days curing
Figure 23. Free lime contents (CaO %) hardened pastes made from mixes (PPI-PPV) containing thermally treated PG at 600 °C after 3, 7, 28 and 90 days curing

M. A. Taher et al.
310 Adv J Chem A 2019, 2(4), 296-315
Figure 24. Free lime contents (CaO %) hardened pastes made from mixes (PPI-PPV) containing thermally treated PG at 800 °C after 3, 7, 28 and 90 days curing
Figure 25. Free lime contents (CaO %) hardened pastes made from mixes (PPI-PPV) containing thermally treated PG at 1000 °C after 3, 7, 28 and 90 days curing
Figure 26. IR spectra of hardened pastes of PPC with RG after 3, 28 and 90 days curing
4000 3500 3000 2500 2000 1500 1000 500
Tra
nsm
itta
nce
Wave numbers cm-1
90 days
28 days
3 days
3646 cm-1
3425 cm-1
1650 cm-1
1460 cm-1
970 cm-1
870 cm-1
470 cm-1

Effect of Partial Substitution of Raw…
311 Adv J Chem A 2019, 2(4), 296-315
Figure 27. IR spectra of hardened pastes of mix PPC contain PG treated at 200 ᵒC after 3, 28 and 90 days curing
4000 3500 3000 2500 2000 1500 1000 500
Tra
nsm
ittan
ce
Wave numbers cm-1
90 days
28 days
3 days
3650 cm-1
3420 cm-1
1640 cm-1
1470 cm-1
970 cm-1
865 cm-1
510 cm-1
Figure 28. IR spectra of hardened pastes of mix PPC contain PG treated at 600 ᵒC after 3, 28 and 90 days curing
4000 3500 3000 2500 2000 1500 1000 500
Tra
nsm
itta
nce
Wave numbers cm-1
90 days
28 days
3 days
3645 cm-1
3420 cm-1
1640 cm-1
1470 cm-1
976 cm-1
876 cm-1
468 cm-1
Figure 29. IR spectra of hardened pastes of mix PPC contain PG treated at 1000 ᵒC after 3, 28 and 90 days curing
4000 3500 3000 2500 2000 1500 1000 500
Wave numbers cm-1
90 days
28 days
3 days
3644 cm-1
3460 cm-1
1655 cm-1
1455 cm-1
967 cm-1
874 cm-1
465 cm-1
M. A. Taher et al.
312 Adv J Chem A 2019, 2(4), 296-315
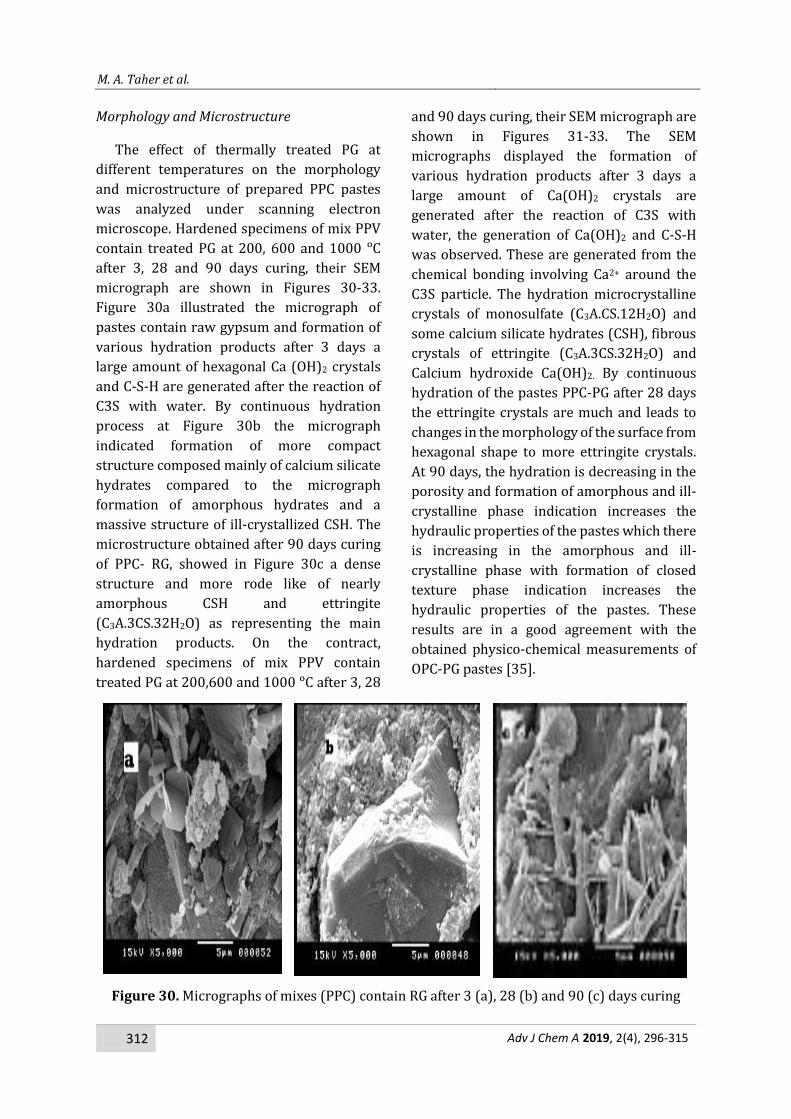
Morphology and Microstructure
The effect of thermally treated PG at
different temperatures on the morphology
and microstructure of prepared PPC pastes
was analyzed under scanning electron
microscope. Hardened specimens of mix PPV
contain treated PG at 200, 600 and 1000 ᵒC
after 3, 28 and 90 days curing, their SEM
micrograph are shown in Figures 30-33.
Figure 30a illustrated the micrograph of
pastes contain raw gypsum and formation of
various hydration products after 3 days a
large amount of hexagonal Ca (OH)2 crystals
and C-S-H are generated after the reaction of
C3S with water. By continuous hydration
process at Figure 30b the micrograph
indicated formation of more compact
structure composed mainly of calcium silicate
hydrates compared to the micrograph
formation of amorphous hydrates and a
massive structure of ill-crystallized CSH. The
microstructure obtained after 90 days curing
of PPC- RG, showed in Figure 30c a dense
structure and more rode like of nearly
amorphous CSH and ettringite
(C3A.3CS.32H2O) as representing the main
hydration products. On the contract,
hardened specimens of mix PPV contain
treated PG at 200,600 and 1000 ᵒC after 3, 28
and 90 days curing, their SEM micrograph are
shown in Figures 31-33. The SEM
micrographs displayed the formation of
various hydration products after 3 days a
large amount of Ca(OH)2 crystals are
generated after the reaction of C3S with
water, the generation of Ca(OH)2 and C-S-H
was observed. These are generated from the
chemical bonding involving Ca2+ around the
C3S particle. The hydration microcrystalline
crystals of monosulfate (C3A.CS.12H2O) and
some calcium silicate hydrates (CSH), fibrous
crystals of ettringite (C3A.3CS.32H2O) and
Calcium hydroxide Ca(OH)2. By continuous
hydration of the pastes PPC-PG after 28 days
the ettringite crystals are much and leads to
changes in the morphology of the surface from
hexagonal shape to more ettringite crystals.
At 90 days, the hydration is decreasing in the
porosity and formation of amorphous and ill-
crystalline phase indication increases the
hydraulic properties of the pastes which there
is increasing in the amorphous and ill-
crystalline phase with formation of closed
texture phase indication increases the
hydraulic properties of the pastes. These
results are in a good agreement with the
obtained physico-chemical measurements of
OPC-PG pastes [35].
Figure 30. Micrographs of mixes (PPC) contain RG after 3 (a), 28 (b) and 90 (c) days curing

Effect of Partial Substitution of Raw…
313 Adv J Chem A 2019, 2(4), 296-315
Figure 31. Micrographs of mixes (PPV) contain thermally treatment PG at 200 oC after 3(a), 28 (b) and 90 (c) days curing
Figure 32. Micrographs of mixes (PPV) contain thermally treatment PG at 600 oC after 3 (a), 28 (b) and 90 (c) days curing
Figure 33. Micrographs of mixes (PPV) contain thermally treatment PG at 1000 oC after 3 (a), 28 (b) and 90 (c) days curing
M. A. Taher et al.
314 Adv J Chem A 2019, 2(4), 296-315
Conclusion
As a measure to save resources and energy
and reuse industrial byproducts in the cement
industry, this study evaluated the basic
properties of PPC using industrial byproducts.
The results are as follows:
1- Phosphogypsum can be economically used
up to five percent as an ingredient in
Ordinary Portland cement, This will
eliminate a serious environmental source of
pollution; besides, it will decrease the cost
of cement production. It is also
recommended that further investigations
be executed to explore the possibility of
extracting gypsum from PG that can be used
directly in cement industry.
2- The addition of treated PG at different
temperature leading to improvement of
physio-chemical properties.
3- The present study revealed a good
efficiency of PG as a set retarder in
Pozzolanic Portland Cement, utilization
calcined PG at 800 and 1000 ᵒC causes the
setting time improvement.
4- The purified phosphogypsum can be used
for the production of gypsum in cement
manufactory due to solve the serious
negative environmental impacts caused by
the dispersion of the harmful chemicals
contained in PG into surrounding
environment.
Acknowledgment
Thanks are due to the Manaseer Cement Factory for the execution of these experiments.
References
[1]. K. Friedhelm, K. Juergen, B. Marcel,
Seminar on the utilization of phosphogypsum
to produce cement and sulphuric acid, in:
Proceedings, National Bureau and Veb
Industrie-Consult Berlin, Istanbul – Turkey,
1987, p. 17.
[2]. A. Nanni, W.F. Chang, Concrete Int., 1989,
11, 48-53.
[3]. E. Erdem, H. Ölmez, Cem. Concr. Res.,
1993, 23, 115-121.
[4]. J. Bijen, E. Niël, Cem. Concr. Res., 1981, 11,
307-322.
[5]. H. Ölmez, E. Erdem, Cem. Concr. Res., 1989,
19, 377-384.
[6]. H. Ölmez, V.T. Yilmaz, Cem. Concr. Res.,
1988, 18, 449-454
[7]. D.K. Dutta, P.C. Borthakur, Cem. Concr.
Res., 1990, 20, 711-722.
[8]. S. Al-Jabbari, F. Faisal, S. Ali, S. Nasir, J.
Build. Res. Sci. Res. Council Baghdad, 1988, 7,
49-69.
[9]. H.F.W. Taylor, Cement Chemistry. Thomas
Telford Edition, London, 1997, pp. 480.
[10]. M.M. Smadi, R.H. Haddad, A.M. Akour,
Potential use of phosphogypsum in concrete”,
Cem. Concr. Res., 1999, 29, 1419 - 1425.
[11]. S. Manjit, Cem. Concr. Res., 2002, 32,
1033-1038.
[12]. S. Manjit. Cem. Concr. Res., 2003, 33,
1363-1369.
[13]. S. Manjit. Role of phosphogypsum
impurities on strength and microstructure of
selenite plaster." Construct. Build. Mater.,
2005, 19, 480-486.
[14]. J.H. Potgieter, S.S. Potgieter, R.I.
McCrindle, C.A. Strydom, Cem. Concr. Res.,
2003, 33, 1223-1227.
[15]. L. Kacimi, A. Simon-Masseron, Z.
Derriche, J. hazard. Mater., 2006, 137, 129-
137.
[16]. M.A. Bagade, S.R. Satone, Int. J. Eng. Res.
Appl., 2012, 2, 785-787.
[17]. N. Ghafoori, W.F. Chang. J. Mater. Civil
Eng., 1993, 5, 249-264.
[18]. K.T. Lin, W.F. Chang, Strength properties
of compacted phosphogypsum–based
mixtures, Volume II. In proceedings of the
second International symposium on
phosphogypsum, University of Miami, Florida
Institute of Phosphate Research, Bartow,
Florida, 1988, pp. 239-254.
[19]. M.A. Taher, Resources, Conservat. Recycl.,
Effect of Partial Substitution of Raw…
315 Adv J Chem A 2019, 2(4), 296-315
2007, 52, 28-38.
[20]. T. Reddya, D. Siva Sankar, R. Kumarb, H.
Sudarsana Raoc. Asian J. Civil Eng., 2010, 11,
411-420.
[21]. Z. M. Lan, X. J. Lin & F. Wang & H. Zhang
& C. R. Chen, Biol. Fertil. Soils, 2012, 48, 579–
588.
[22]. P.Y., Han, X.L., Jiao, Wang, L.G., Dong,
E.W., J.S Wang, Chin. J. Eco Agric. 2010, 18,
482-485.
[23]. A. Roy, G.P. Byerly, R.K. Seals. J. Mater.
Civil Eng., ASCE 6, 1994, 4, 439-445
[24]. British European Standard BS EN-196-3:
Methods of testing cement. Determination of
setting times and soundness, 2005.
[25]. M. Abd El Aziz, S. Abd El Aleem, M. Heikal,
H. El Dizdamony, Cem. Concr. Res., 2005, 35,
1592–1600.
[26]. M.A.E. Aziz, S.A.E. Aleem, M. Heikal, H.E.
Didamony, Cem. Concr. Res., 2005, 35, 1592-
1600.
[27]. M.P. Javellana, I. Jawed. Cem. Concr. Res.,
1982, 12, 399–403.
[28]. Z. Mingkai, S. Weiguo, W. Shaopeng, Z.
Qinglin, Adv. Build. Technol., 2002, 1, 929-934.
[29]. I.A. Altun, Y. Sert. Cem. Concr. Res., 2004,
34, 677–80.
[30]. M.N. De Noirfontaine, S. Tusseau-Nenez,
M. Signes-Frehel, G. Gasecki, C. Girod-
Labianca. J. Am. Ceramic Soc., 2009, 92, 2337-
2344.
[31]. F.A. Rodrigues P.J.M. Monteiro, J. Mater.
Sci. Lett., 1999, 18, 1551–1552
[32]. W. Eitel, Silicate Science, Volume I:
Silicate Structures, Academic Press, New York,
NY, 1964, USA.
[33]. Y.M., Mollah, A., Palta, T.R., Hess, R.K.,
Vempati, D.L. Cocke, Cem. Concr. Res., 1995,
25, 671-682.
[34]. D. Govindarajan, R. Gopalakrishnan.
Front. Sci., 2011, 1, 21-27
[35]. P. Meredith, A.M. Donald, N.Meller, C.
Hall, J. Mater. Sci., 2004, 39, 997-100.
How to cite this manuscript:
Mahmoud. A. Taher, Adel. M. Amine,
Bassam Kh. Damarany*. Effect of Partial
Substitution of Raw Gypsum with
Thermally Treated Phosphogypsum on
the Properties of Portland Pozzolanic
Cement, Adv. J. Chem. A, 2019, 2(4), 296-
315.