Embed Size (px)
Citation preview
HAL Id: emse-00500589https://hal-emse.ccsd.cnrs.fr/emse-00500589
Submitted on 5 Sep 2018
HAL is a multi-disciplinary open accessarchive for the deposit and dissemination of sci-entific research documents, whether they are pub-lished or not. The documents may come fromteaching and research institutions in France orabroad, or from public or private research centers.
L’archive ouverte pluridisciplinaire HAL, estdestinée au dépôt et à la diffusion de documentsscientifiques de niveau recherche, publiés ou non,émanant des établissements d’enseignement et derecherche français ou étrangers, des laboratoirespublics ou privés.
Effect of precipitation conditions on the morphology ofstrontium molybdate agglomerates
Ana Cameirão, René David, Fabienne Espitalier, Frédéric Gruy
To cite this version:Ana Cameirão, René David, Fabienne Espitalier, Frédéric Gruy. Effect of precipitation conditions onthe morphology of strontium molybdate agglomerates. Journal of Crystal Growth, Elsevier, 2008, 310(18), pp.4152-4162. �10.1016/j.jcrysgro.2008.06.024�. �emse-00500589�
Effect of precipitation conditions on the morphology of strontiummolybdate agglomerates
A. Cameirao b,!, R. David a, F. Espitalier a, F. Gruy b
a RAPSODEE Research Center/UMR CNRS 2392 Campus de Jarlard, 81013 Albi Cedex 09, Franceb LPMG-UMR 5148, Ecole des Mines de St. Etienne, 158 Cours Fauriel, F-42023 Saint-Etienne Cedex 2, France
Keywords:A1. Supersaturated solutionsA1. Crystal morphologyA2. Industrial CrystallizationA1. RougheningA2. Growth from solutionsB1. Oxides
a b s t r a c t
Preliminary experimental results about precipitation of strontium molybdate particles show that theyhave morphology as hierarchical agglomerates [A. Cameirao, R. David, F. Espitalier, F. Gruy, Multipleagglomeration in strontium molybdate precipitation, 16th ISIC, 2005, pp. 355–360]. The precipitation ofstrontium molybdate was studied and monitored in a batch reactor. The precipitation parameters, i.e.initial concentration of strontium molybdate, temperature and stirring rate, have an effect on theparticles and agglomerates morphology. The shapes of the crystals were observed by SEM, and the PSDwas measured at the end of precipitation by laser diffraction. The powders were also analysed by XRD,surface area (BET) and porosity measurements. Finally, a model of agglomeration was designed in orderto predict the morphology of the observed agglomerates.
1. Introduction
Many industrial compounds obtained by precipitation, namelycatalysts and pigments, present a structure of agglomeratedcrystals bonded by crystalline solid bridges. The commonstructure consists of crystallites with sizes between a few nmand 1mm, which generate agglomerates of about 10mm (firstdegree of agglomeration), which in turn agglomerate to the finalagglomerate sizes of about 100mm or sometimes up to 1 mm(second degree of agglomeration) (Fig. 1).
Strontium molybdate particles seem to have such morphology.Sohnel and Mullin [1] have observed that SrMoO4 precipitates arewell-defined very compact crystals with neither formation ofcomplexes in solution nor amorphous phase formation. The formingcrystals quickly agglomerate during the entire crystallisation process.
The induction time of precipitation is determined visually andit increases between 2 and 400 s at 25 1C for decreasingconcentrations of both reactants after mixing between 70 and15 mol m!3. At the end of the induction time crystals are spherical.After 1 min, they show an ellipsoidal shape of 8mm size and are allagglomerated after 30 min [1].
Sohnel and Mullin have concluded that increasing concentra-tion increases the final size of particles; increasing stirring ratediminishes the size and induction time. Spheres seem to continueto grow after agglomeration. The final PSDs show sizes between10 and 100mm [1].
This work presents the experimental results in order tounderstand and to model the dynamics of its precipitation. Wehave enlarged the work made by Sohnel and Mullin to a largerextent of concentrations and stirring rates, and we haveintroduced the study of the effect of temperature on the strontiummolybdate precipitation. We have monitored the concentrationduring all precipitations in a way to model growth and nucleationand have characterised the most likely particles size distributionsto understand and model the agglomeration process.
! Corresponding author.E-mail addresses: [email protected] (A. Cameirao), [email protected]
(R. David), [email protected] (F. Espitalier), [email protected] (F. Gruy).
2. Experimental procedure
2.1. Materials
In order to obtain SrMoO4, solutions of Na2MoO4 and SrCl2(Sigma-Aldrichs) were used. The precipitation obeys the chemicalreaction
SrCl2ðaqÞ þNa2MoO4ðaqÞ ! SrMoO4ðsÞkþ NaClðaqÞ
The solutions were prepared by dissolving the required amountof the analytical-grade chemicals, SrCl2 and Na2MoO4, in 1 L ofdeionised water. The precipitation was considered as completed2 h after addition of reactants.
2.2. Experimental apparatus
The mixing of equimolar solutions of Na2MoO4 and SrCl2 wasachieved in a 2 L glass crystalliser diameter (15 cm) with doublejacket equipped with a three-bladed paddle stirrer [2] and fourbaffles, at a controlled temperature ranging between 10 and 80 1C.Initial concentration of strontium molybdate was varied between4 and 100 mol m!3.
The MixelsTT stirrer has a diameter of 50 mm and generatesaxial flow; the paddles are located at 1201 and inclined at 451. It ispowered by a motor Bioblock Scientific Digital 2000. The stirrerwas placed at a clearance of 1
3 of the height of the reactor from itsbottom. A Rushton turbine was also used, which generates radialflow and higher turbulence in the discharge stream.
All experiments with changing concentration and temperaturewere made with the MixelsTT. The calculated energy dissipationrate of the stirrer per unit mass ranged between 9%10!4 and1.5 W kg!1 (60–700 rpm). The stirrer Reynolds number wasbetween 103 and 106, indicating mainly turbulent mixing regime.
2.3. Procedures and methods
2.3.1. Characterisation of solution and particlesThe particle size distributions were measured by laser
diffraction with a Malvern Master Sizer 2000 at the end ofprecipitation. We have observed that these measurements werereproducible when direct sampling of reactor suspension wasmade. Agglomerates were observed by SEM with a JSM6400—Scanning Microscope after filtration of the suspensionand drying at 40 1C.
Measurements of conductivity were also achieved on-line byusing a conductometer (Consort 831, Bioblock). We verified that ifthe volume fraction of solids in suspension is lower than 0.5%particles do not interfere with conductivity measurements.Concentration of strontium molybdate was calculated fromconductivity values [5].
The crystallite size was estimated by X-ray diffraction in aSiemens diffractometer D5000 Kristalloflex; the Hg-porosity was
achieved in a Micromeritics—Auto Pore IV and the surface areameasured by BET analysis in a Micromeritics—ASAP 2000.
2.4. Preliminary studies
We have made a preliminary study to settle the experimentalprotocol. We started with determining the minimum stirrer rateto suspend the particles. We have calculated this value byZwietering’s correlation [4] with a constant power number Npequal to 6 for a Rushton and 0.7 for a Mixel TT with a variableparticle diameter dp and a volume fraction of solid fvs, g is thegravity; Dr is the difference between the solid and the liquiddensity, n is cinematic viscosity of the solution [4]. The minimalstirring rate depends on particles’ concentration and size. Fromeach experiment we measure the maximum size of particles.Thus, we can calculate Nms for each particle size by Zwietering [4]correlation.
We can deduce that the minimal stirring rate which fulfils thesuspended solids condition is 350 rpm for the Mixel stirrer and125 rpm for the Rushton.
Also, we have estimated the micromixing effects. Therefore, wehave analysed the influence of the way of addition of the secondreactive in the first one. We have concluded that there isnegligible influence of micromixing in nucleation of strontiummolybdate [2].
Each precipitation experiment was realised three times withthe same operating conditions. The results for concentrationagainst time and for final PSD were compared. The concentrationvalues were equal within 15% error. The maximal error on volumepercentage in each class of PSD is 1%.
2.5. Kolmogoroff and Batchelor microscales
The Kolmogoroff microscale defined as
lK ¼n3
!
! "1=4
(1)
denotes the limit between laminar and turbulent regimes for fluideddies.
The Batchelor microscale is the limit between the Brownianand laminar regimes for fluid eddies:
lB ¼uD2
AB
!
!1=4
(2)
where DAB is the diffusivity of a particle.
3. Results
3.1. Change of supersaturation during precipitation
The evolution of supersaturation ratio (C=C') during precipita-tion is shown in Fig. 2 for several initial concentrations of SrMoO4
between 4 and 50 mol m!3. The solubility of SrMoO4 wasmeasured by means of dissolution experiments at differenttemperatures and its expression was approximated by C' ¼10!5T2 þ 0:0015T þ 0:0676 [5].
The desupersaturation versus time is shown in Fig. 3 fortemperatures between 25 and 50 1C.
The desupersaturation versus time is plotted in Fig. 4 forvarious stirring rates and stirrer geometries. Note that thedesupersaturation curve is very different between the two typesof stirrers, which generate, even at the same energy dissipationrates, different patterns of flow and shear stresses.
Crystallite Primary Agglomerate Secondary Agglomerate
Fig. 1. Agglomeration degrees.
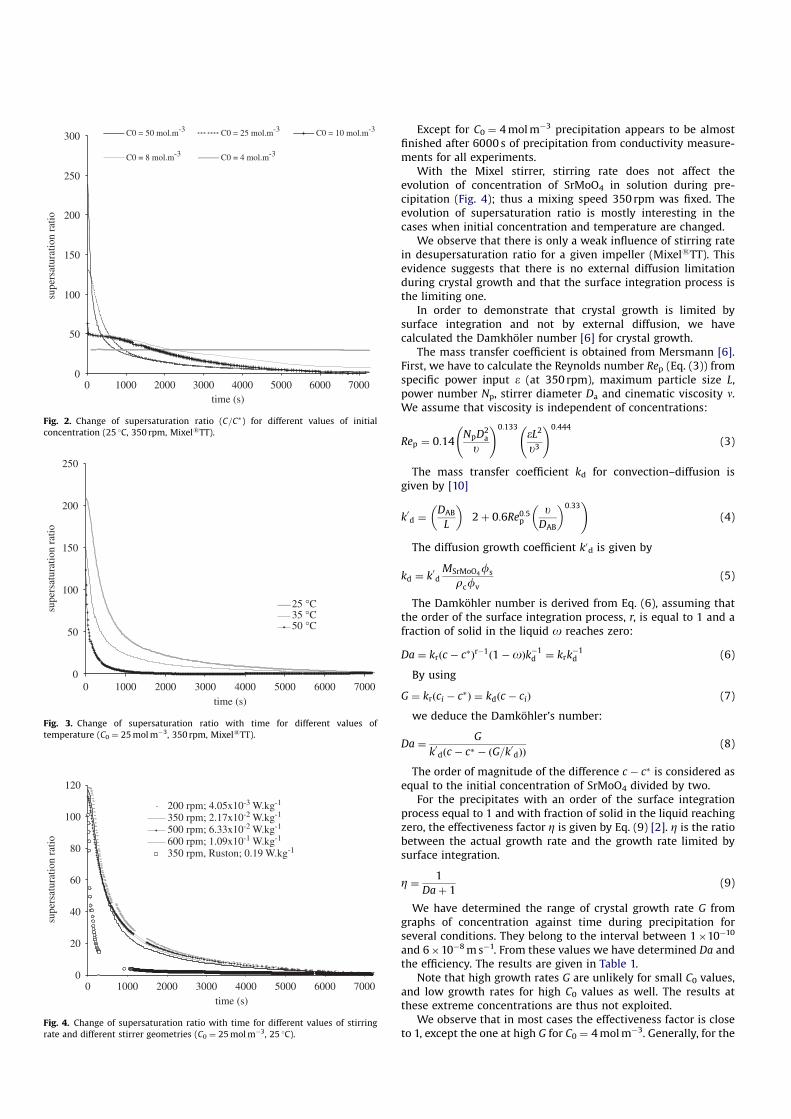
Except for C0 ¼ 4 mol m!3 precipitation appears to be almostfinished after 6000 s of precipitation from conductivity measure-ments for all experiments.
With the Mixel stirrer, stirring rate does not affect theevolution of concentration of SrMoO4 in solution during pre-cipitation (Fig. 4); thus a mixing speed 350 rpm was fixed. Theevolution of supersaturation ratio is mostly interesting in thecases when initial concentration and temperature are changed.
We observe that there is only a weak influence of stirring ratein desupersaturation ratio for a given impeller (MixelsTT). Thisevidence suggests that there is no external diffusion limitationduring crystal growth and that the surface integration process isthe limiting one.
In order to demonstrate that crystal growth is limited bysurface integration and not by external diffusion, we havecalculated the Damkholer number [6] for crystal growth.
The mass transfer coefficient is obtained from Mersmann [6].First, we have to calculate the Reynolds number Rep (Eq. (3)) fromspecific power input e (at 350 rpm), maximum particle size L,power number Np, stirrer diameter Da and cinematic viscosity n.We assume that viscosity is independent of concentrations:
Rep ¼ 0:14NpD2
a
u
!0:133!L2
u3
!0:444
(3)
The mass transfer coefficient kd for convection–diffusion isgiven by [10]
k0d ¼DAB
L
! "2þ 0:6Re0:5
pu
DAB
! "0:33!
(4)
The diffusion growth coefficient k0d is given by
kd ¼ k0dMSrMoO4
fs
rcfv(5)
The Damkohler number is derived from Eq. (6), assuming thatthe order of the surface integration process, r, is equal to 1 and afraction of solid in the liquid o reaches zero:
Da ¼ krðc ! c'Þr!1ð1!oÞk!1d ¼ krk
!1d (6)
By using
G ¼ krðci ! c'Þ ¼ kdðc ! ciÞ (7)
we deduce the Damkohler’s number:
Da ¼G
k0dðc ! c' ! ðG=k0dÞÞ(8)
The order of magnitude of the difference c ! c' is considered asequal to the initial concentration of SrMoO4 divided by two.
For the precipitates with an order of the surface integrationprocess equal to 1 and with fraction of solid in the liquid reachingzero, the effectiveness factor Z is given by Eq. (9) [2]. Z is the ratiobetween the actual growth rate and the growth rate limited bysurface integration.
Z ¼ 1Daþ 1
(9)
We have determined the range of crystal growth rate G fromgraphs of concentration against time during precipitation forseveral conditions. They belong to the interval between 1%10!10
and 6%10!8 m s!1. From these values we have determined Da andthe efficiency. The results are given in Table 1.
Note that high growth rates G are unlikely for small C0 values,and low growth rates for high C0 values as well. The results atthese extreme concentrations are thus not exploited.
We observe that in most cases the effectiveness factor is closeto 1, except the one at high G for C0 ¼ 4 mol m!3. Generally, for the
0
50
100
150
200
250
300
0 1000 2000 3000 4000 5000 6000 7000time (s)
C0 = 50 mol.m-3 C0 = 25 mol.m-3 C0 = 10 mol.m-3
C0 = 8 mol.m-3 C0 = 4 mol.m-3
supe
rsat
urat
ion
ratio
Fig. 2. Change of supersaturation ratio (C=C') for different values of initialconcentration (25 1C, 350 rpm, MixelsTT).
0
50
100
150
200
250
0 1000 2000 3000 4000 5000 6000 7000time (s)
supe
rsat
urat
ion
ratio
25 °C35 °C50 °C
Fig. 3. Change of supersaturation ratio with time for different values oftemperature (C0 ¼ 25 mol m!3, 350 rpm, MixelsTT).
0
20
40
60
80
100
120
0 1000 2000 3000 4000 5000 6000 7000time (s)
supe
rsat
urat
ion
ratio
200 rpm; 4.05x10⁻³ W.kg-1
350 rpm; 2.17x10⁻² W.kg-1
500 rpm; 6.33x10⁻² W.kg-1
600 rpm; 1.09x10⁻¹ W.kg-1
350 rpm, Ruston; 0.19 W.kg-1
Fig. 4. Change of supersaturation ratio with time for different values of stirringrate and different stirrer geometries (C0 ¼ 25 mol m!3, 25 1C).
case of strontium molybdate precipitation we conclude thatgrowth mainly is surface integration controlled.
3.2. SrMoO4 powder characterisation
3.2.1. Morphology of particles by SEMThe SrMoO4 particles obtained by precipitation were analysed
in a way as to determine their agglomerate structure and sizes,their surface area and porosity.
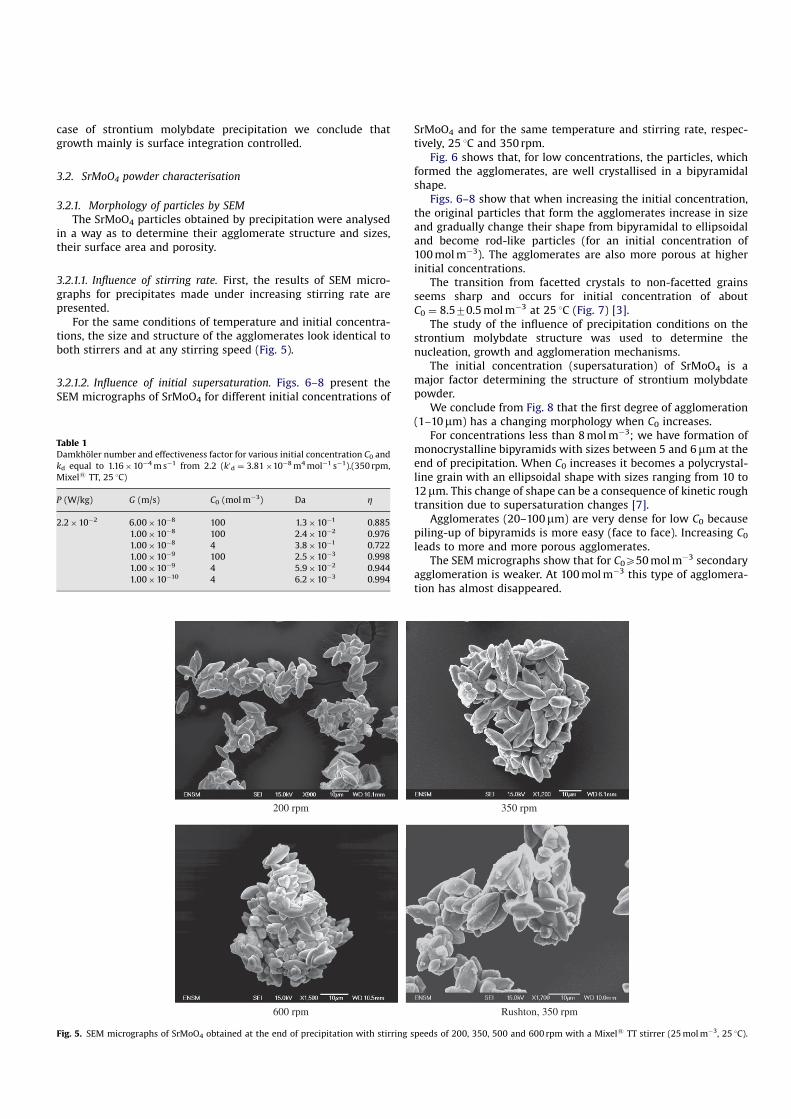
3.2.1.1. Influence of stirring rate. First, the results of SEM micro-graphs for precipitates made under increasing stirring rate arepresented.
For the same conditions of temperature and initial concentra-tions, the size and structure of the agglomerates look identical toboth stirrers and at any stirring speed (Fig. 5).
3.2.1.2. Influence of initial supersaturation. Figs. 6–8 present theSEM micrographs of SrMoO4 for different initial concentrations of
SrMoO4 and for the same temperature and stirring rate, respec-tively, 25 1C and 350 rpm.
Fig. 6 shows that, for low concentrations, the particles, whichformed the agglomerates, are well crystallised in a bipyramidalshape.
Figs. 6–8 show that when increasing the initial concentration,the original particles that form the agglomerates increase in sizeand gradually change their shape from bipyramidal to ellipsoidaland become rod-like particles (for an initial concentration of100 mol m!3). The agglomerates are also more porous at higherinitial concentrations.
The transition from facetted crystals to non-facetted grainsseems sharp and occurs for initial concentration of aboutC0 ¼ 8.570.5 mol m!3 at 25 1C (Fig. 7) [3].
The study of the influence of precipitation conditions on thestrontium molybdate structure was used to determine thenucleation, growth and agglomeration mechanisms.
The initial concentration (supersaturation) of SrMoO4 is amajor factor determining the structure of strontium molybdatepowder.
We conclude from Fig. 8 that the first degree of agglomeration(1–10mm) has a changing morphology when C0 increases.
For concentrations less than 8 mol m!3; we have formation ofmonocrystalline bipyramids with sizes between 5 and 6mm at theend of precipitation. When C0 increases it becomes a polycrystal-line grain with an ellipsoidal shape with sizes ranging from 10 to12mm. This change of shape can be a consequence of kinetic roughtransition due to supersaturation changes [7].
Agglomerates (20–100mm) are very dense for low C0 becausepiling-up of bipyramids is more easy (face to face). Increasing C0
leads to more and more porous agglomerates.The SEM micrographs show that for C0X50 mol m!3 secondary
agglomeration is weaker. At 100 mol m!3 this type of agglomera-tion has almost disappeared.
Table 1Damkholer number and effectiveness factor for various initial concentration C0 andkd equal to 1.16%10!4 m s!1 from 2.2 (k0d ¼ 3.81%10!8 m4 mol!1 s!1).(350 rpm,Mixels TT, 25 1C)
P (W/kg) G (m/s) C0 (mol m!3) Da Z
2.2%10!2 6.00%10!8 100 1.3%10!1 0.8851.00%10!8 100 2.4%10!2 0.9761.00%10!8 4 3.8%10!1 0.7221.00%10!9 100 2.5%10!3 0.9981.00%10!9 4 5.9%10!2 0.9441.00%10!10 4 6.2%10!3 0.994
200 rpm 350 rpm
600 rpm Rushton, 350 rpm
Fig. 5. SEM micrographs of SrMoO4 obtained at the end of precipitation with stirring speeds of 200, 350, 500 and 600 rpm with a Mixels TT stirrer (25 mol m!3, 25 1C).
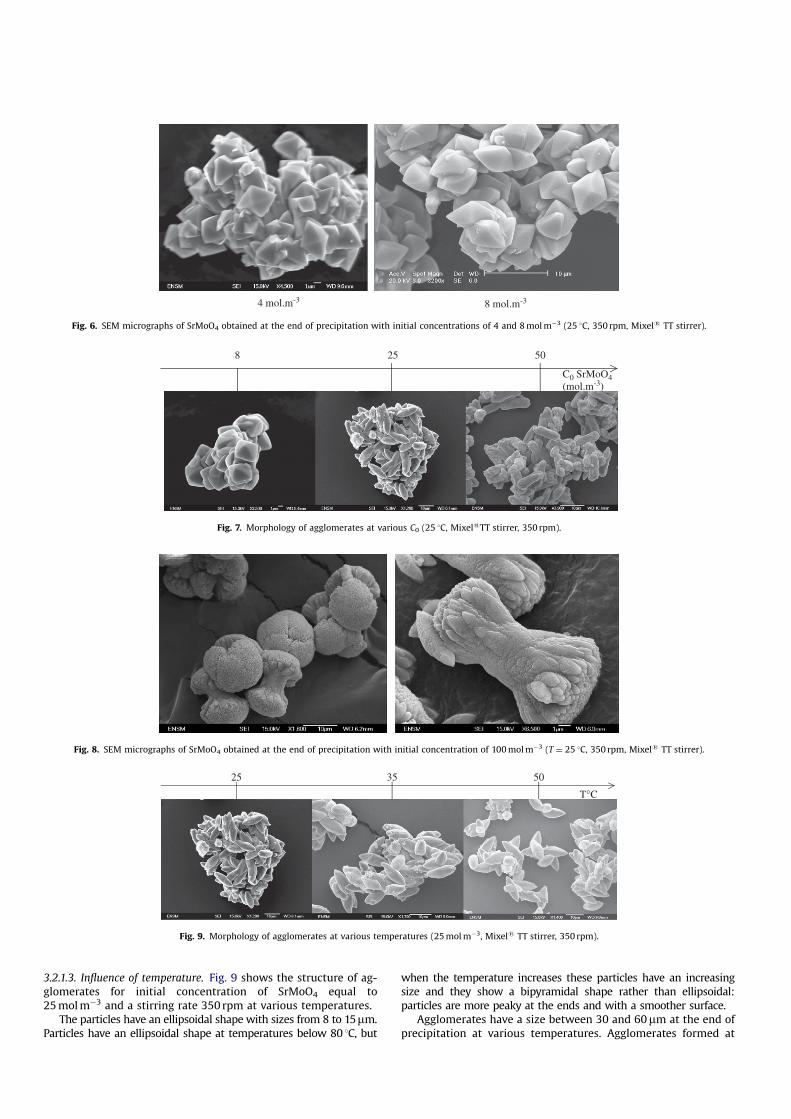
3.2.1.3. Influence of temperature. Fig. 9 shows the structure of ag-glomerates for initial concentration of SrMoO4 equal to25 mol m!3 and a stirring rate 350 rpm at various temperatures.
The particles have an ellipsoidal shape with sizes from 8 to 15mm.Particles have an ellipsoidal shape at temperatures below 80 1C, but
when the temperature increases these particles have an increasingsize and they show a bipyramidal shape rather than ellipsoidal:particles are more peaky at the ends and with a smoother surface.
Agglomerates have a size between 30 and 60mm at the end ofprecipitation at various temperatures. Agglomerates formed at
4 mol.m-3 8 mol.m-3
Fig. 6. SEM micrographs of SrMoO4 obtained at the end of precipitation with initial concentrations of 4 and 8 mol m!3 (25 1C, 350 rpm, Mixels TT stirrer).
8 25 50
C0 SrMoO4(mol.m-3)
Fig. 7. Morphology of agglomerates at various C0 (25 1C, MixelsTT stirrer, 350 rpm).
Fig. 8. SEM micrographs of SrMoO4 obtained at the end of precipitation with initial concentration of 100 mol m!3 (T ¼ 25 1C, 350 rpm, Mixels TT stirrer).
25 35 50
T°C
Fig. 9. Morphology of agglomerates at various temperatures (25 mol m!3, Mixels TT stirrer, 350 rpm).
low temperature are denser than those formed at low super-saturation (higher temperature) even if their shape is different: theagglomeration degree is enhanced by low temperatures (Fig. 9).
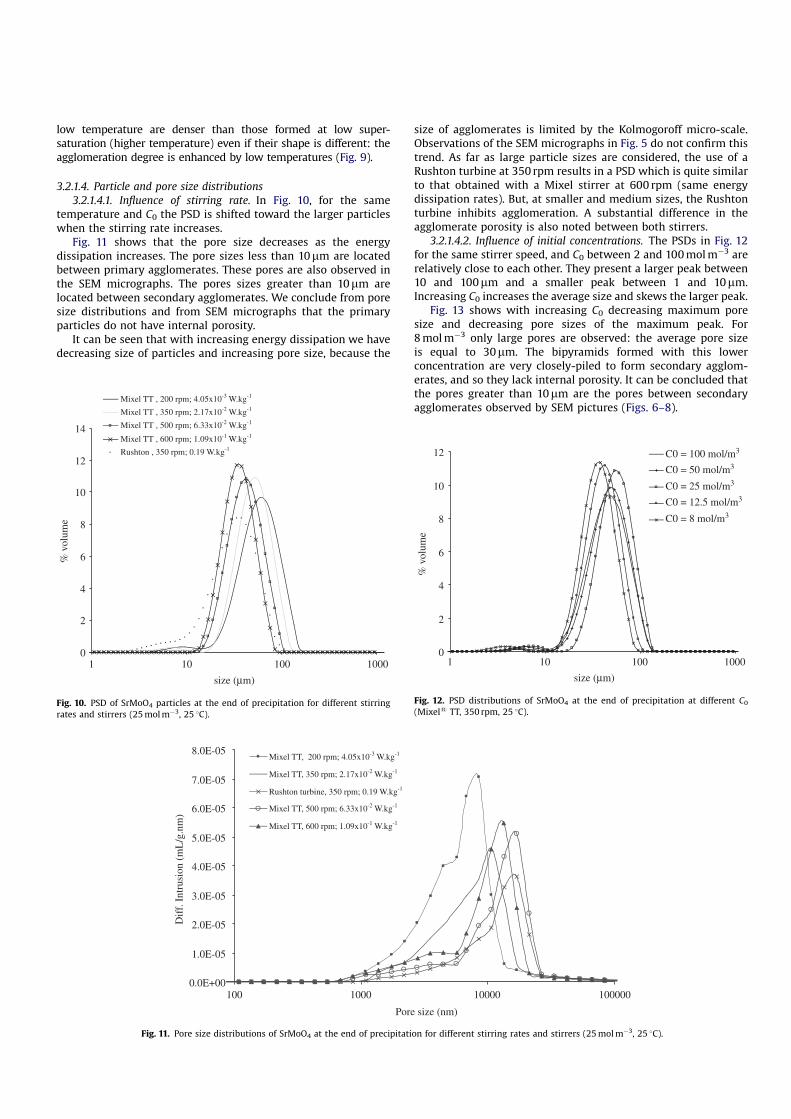
3.2.1.4. Particle and pore size distributions3.2.1.4.1. Influence of stirring rate. In Fig. 10, for the same
temperature and C0 the PSD is shifted toward the larger particleswhen the stirring rate increases.
Fig. 11 shows that the pore size decreases as the energydissipation increases. The pore sizes less than 10mm are locatedbetween primary agglomerates. These pores are also observed inthe SEM micrographs. The pores sizes greater than 10mm arelocated between secondary agglomerates. We conclude from poresize distributions and from SEM micrographs that the primaryparticles do not have internal porosity.
It can be seen that with increasing energy dissipation we havedecreasing size of particles and increasing pore size, because the
size of agglomerates is limited by the Kolmogoroff micro-scale.Observations of the SEM micrographs in Fig. 5 do not confirm thistrend. As far as large particle sizes are considered, the use of aRushton turbine at 350 rpm results in a PSD which is quite similarto that obtained with a Mixel stirrer at 600 rpm (same energydissipation rates). But, at smaller and medium sizes, the Rushtonturbine inhibits agglomeration. A substantial difference in theagglomerate porosity is also noted between both stirrers.
3.2.1.4.2. Influence of initial concentrations. The PSDs in Fig. 12for the same stirrer speed, and C0 between 2 and 100 mol m!3 arerelatively close to each other. They present a larger peak between10 and 100mm and a smaller peak between 1 and 10mm.Increasing C0 increases the average size and skews the larger peak.
Fig. 13 shows with increasing C0 decreasing maximum poresize and decreasing pore sizes of the maximum peak. For8 mol m!3 only large pores are observed: the average pore sizeis equal to 30mm. The bipyramids formed with this lowerconcentration are very closely-piled to form secondary agglom-erates, and so they lack internal porosity. It can be concluded thatthe pores greater than 10mm are the pores between secondaryagglomerates observed by SEM pictures (Figs. 6–8).
0
2
4
6
8
10
12
14
1 10 100 1000
% v
olum
e
Mixel TT , 200 rpm; 4.05x10⁻³ W.kg-1
Mixel TT , 350 rpm; 2.17x10⁻² W.kg-1
Mixel TT , 500 rpm; 6.33x10⁻² W.kg-1
Mixel TT , 600 rpm; 1.09x10⁻¹ W.kg-1
Rushton , 350 rpm; 0.19 W.kg-1
size (µm)
Fig. 10. PSD of SrMoO4 particles at the end of precipitation for different stirringrates and stirrers (25 mol m!3, 25 1C).
0.0E+00
1.0E-05
2.0E-05
3.0E-05
4.0E-05
5.0E-05
6.0E-05
7.0E-05
8.0E-05
100 1000 10000 100000
Pore size (nm)
Diff
. Int
rusi
on (m
L/g
.nm
)
Mixel TT, 200 rpm; 4.05x10⁻³ W.kg-1
Mixel TT, 350 rpm; 2.17x10⁻² W.kg-1
Rushton turbine, 350 rpm; 0.19 W.kg-1
Mixel TT, 500 rpm; 6.33x10⁻² W.kg-1
Mixel TT, 600 rpm; 1.09x10⁻¹ W.kg-1
Fig. 11. Pore size distributions of SrMoO4 at the end of precipitation for different stirring rates and stirrers (25 mol m!3, 25 1C).
0
2
4
6
8
10
12
1 10 100 1000
% v
olum
e
C0 = 100 mol/m3
C0 = 50 mol/m3
C0 = 25 mol/m3
C0 = 12.5 mol/m3
C0 = 8 mol/m3
size (µm)
Fig. 12. PSD distributions of SrMoO4 at the end of precipitation at different C0
(Mixels TT, 350 rpm, 25 1C).
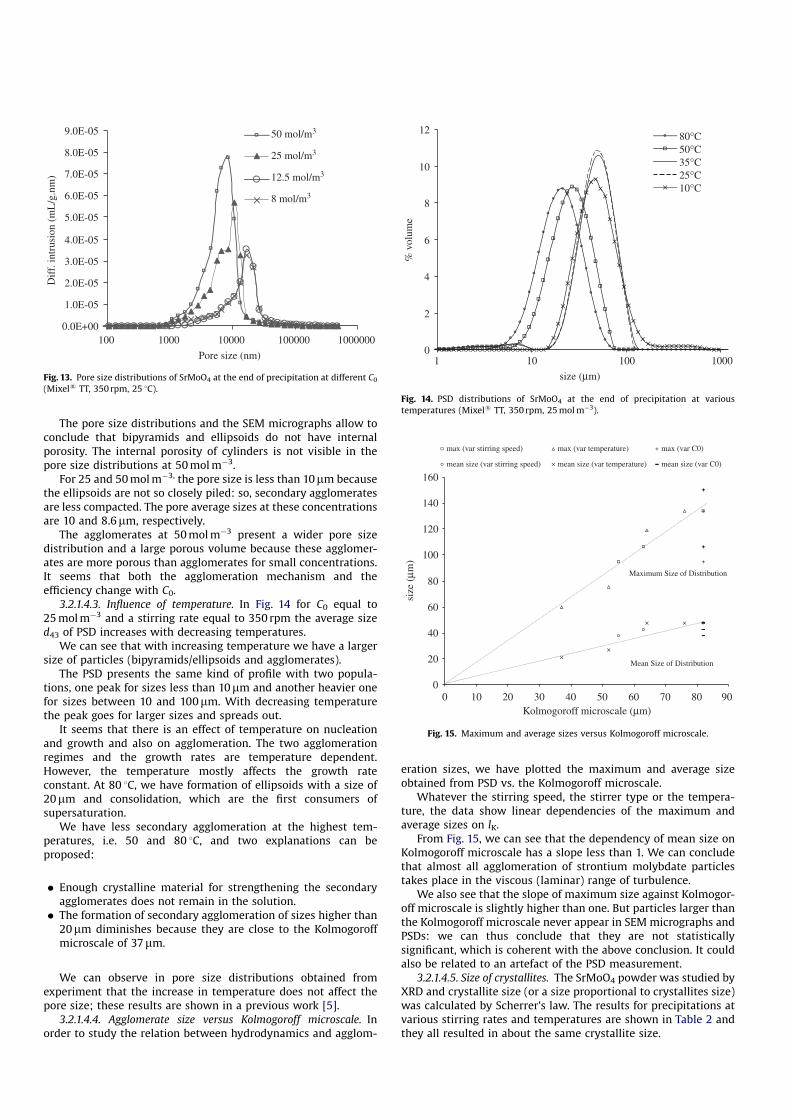
The pore size distributions and the SEM micrographs allow toconclude that bipyramids and ellipsoids do not have internalporosity. The internal porosity of cylinders is not visible in thepore size distributions at 50 mol m!3.
For 25 and 50 mol m!3, the pore size is less than 10mm becausethe ellipsoids are not so closely piled: so, secondary agglomeratesare less compacted. The pore average sizes at these concentrationsare 10 and 8.6mm, respectively.
The agglomerates at 50 mol m!3 present a wider pore sizedistribution and a large porous volume because these agglomer-ates are more porous than agglomerates for small concentrations.It seems that both the agglomeration mechanism and theefficiency change with C0.
3.2.1.4.3. Influence of temperature. In Fig. 14 for C0 equal to25 mol m!3 and a stirring rate equal to 350 rpm the average sized43 of PSD increases with decreasing temperatures.
We can see that with increasing temperature we have a largersize of particles (bipyramids/ellipsoids and agglomerates).
The PSD presents the same kind of profile with two popula-tions, one peak for sizes less than 10mm and another heavier onefor sizes between 10 and 100mm. With decreasing temperaturethe peak goes for larger sizes and spreads out.
It seems that there is an effect of temperature on nucleationand growth and also on agglomeration. The two agglomerationregimes and the growth rates are temperature dependent.However, the temperature mostly affects the growth rateconstant. At 80 1C, we have formation of ellipsoids with a size of20mm and consolidation, which are the first consumers ofsupersaturation.
We have less secondary agglomeration at the highest tem-peratures, i.e. 50 and 80 1C, and two explanations can beproposed:
( Enough crystalline material for strengthening the secondaryagglomerates does not remain in the solution.( The formation of secondary agglomeration of sizes higher than
20mm diminishes because they are close to the Kolmogoroffmicroscale of 37mm.
We can observe in pore size distributions obtained fromexperiment that the increase in temperature does not affect thepore size; these results are shown in a previous work [5].
3.2.1.4.4. Agglomerate size versus Kolmogoroff microscale. Inorder to study the relation between hydrodynamics and agglom-
eration sizes, we have plotted the maximum and average sizeobtained from PSD vs. the Kolmogoroff microscale.
Whatever the stirring speed, the stirrer type or the tempera-ture, the data show linear dependencies of the maximum andaverage sizes on lK.
From Fig. 15, we can see that the dependency of mean size onKolmogoroff microscale has a slope less than 1. We can concludethat almost all agglomeration of strontium molybdate particlestakes place in the viscous (laminar) range of turbulence.
We also see that the slope of maximum size against Kolmogor-off microscale is slightly higher than one. But particles larger thanthe Kolmogoroff microscale never appear in SEM micrographs andPSDs: we can thus conclude that they are not statisticallysignificant, which is coherent with the above conclusion. It couldalso be related to an artefact of the PSD measurement.
3.2.1.4.5. Size of crystallites. The SrMoO4 powder was studied byXRD and crystallite size (or a size proportional to crystallites size)was calculated by Scherrer’s law. The results for precipitations atvarious stirring rates and temperatures are shown in Table 2 andthey all resulted in about the same crystallite size.
0.0E+00
1.0E-05
2.0E-05
3.0E-05
4.0E-05
5.0E-05
6.0E-05
7.0E-05
8.0E-05
9.0E-05
100 1000 10000 100000 1000000Pore size (nm)
Diff
. int
rusi
on (m
L/g
.nm
)
50 mol/m3
25 mol/m3
12.5 mol/m3
8 mol/m3
Fig. 13. Pore size distributions of SrMoO4 at the end of precipitation at different C0
(Mixels TT, 350 rpm, 25 1C).
0
2
4
6
8
10
12
1 10 100 1000
% v
olum
e
80°C50°C35°C25°C10°C
size (µm)
Fig. 14. PSD distributions of SrMoO4 at the end of precipitation at varioustemperatures (Mixels TT, 350 rpm, 25 mol m!3).
0
20
40
60
80
100
120
140
160
0 10 20 30 40 50 60 70 80 90Kolmogoroff microscale (µm)
size
(µm
)
max (var stirring speed) max (var temperature) max (var C0)
mean size (var stirring speed) mean size (var temperature) mean size (var C0)
Maximum Size of Distribution
Mean Size of Distribution
Fig. 15. Maximum and average sizes versus Kolmogoroff microscale.
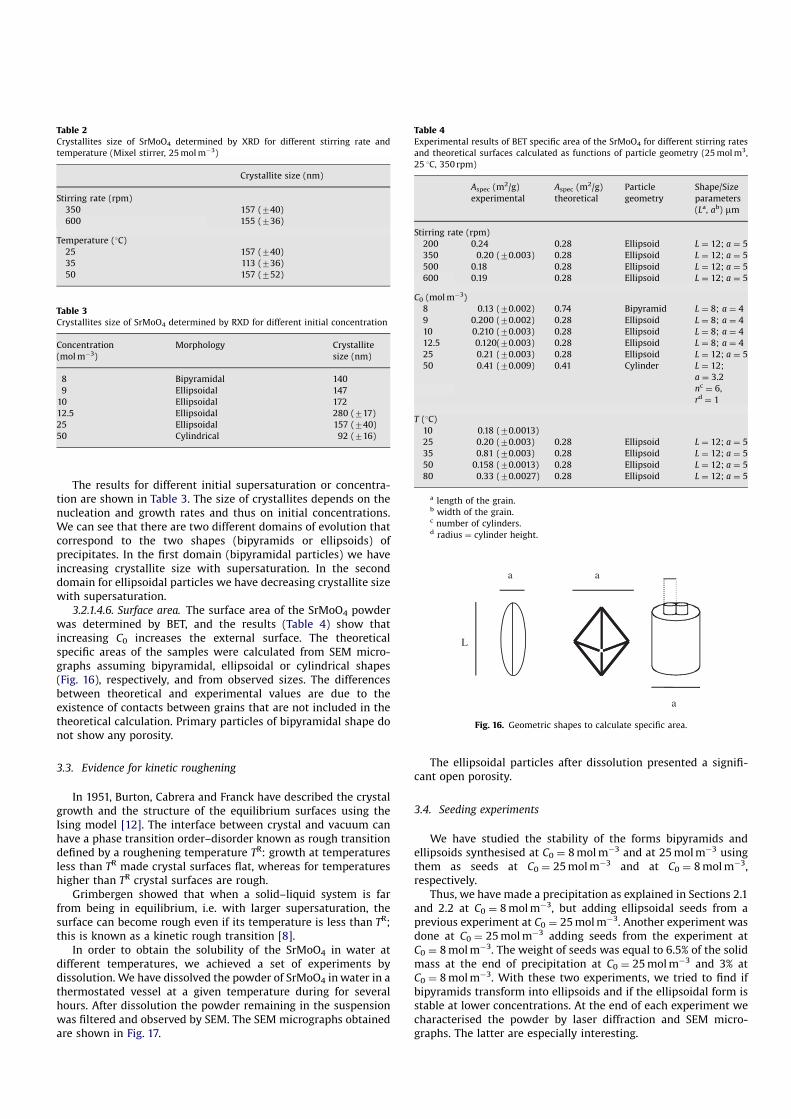
The results for different initial supersaturation or concentra-tion are shown in Table 3. The size of crystallites depends on thenucleation and growth rates and thus on initial concentrations.We can see that there are two different domains of evolution thatcorrespond to the two shapes (bipyramids or ellipsoids) ofprecipitates. In the first domain (bipyramidal particles) we haveincreasing crystallite size with supersaturation. In the seconddomain for ellipsoidal particles we have decreasing crystallite sizewith supersaturation.
3.2.1.4.6. Surface area. The surface area of the SrMoO4 powderwas determined by BET, and the results (Table 4) show thatincreasing C0 increases the external surface. The theoreticalspecific areas of the samples were calculated from SEM micro-graphs assuming bipyramidal, ellipsoidal or cylindrical shapes(Fig. 16), respectively, and from observed sizes. The differencesbetween theoretical and experimental values are due to theexistence of contacts between grains that are not included in thetheoretical calculation. Primary particles of bipyramidal shape donot show any porosity.
3.3. Evidence for kinetic roughening
In 1951, Burton, Cabrera and Franck have described the crystalgrowth and the structure of the equilibrium surfaces using theIsing model [12]. The interface between crystal and vacuum canhave a phase transition order–disorder known as rough transitiondefined by a roughening temperature TR: growth at temperaturesless than TR made crystal surfaces flat, whereas for temperatureshigher than TR crystal surfaces are rough.
Grimbergen showed that when a solid–liquid system is farfrom being in equilibrium, i.e. with larger supersaturation, thesurface can become rough even if its temperature is less than TR;this is known as a kinetic rough transition [8].
In order to obtain the solubility of the SrMoO4 in water atdifferent temperatures, we achieved a set of experiments bydissolution. We have dissolved the powder of SrMoO4 in water in athermostated vessel at a given temperature during for severalhours. After dissolution the powder remaining in the suspensionwas filtered and observed by SEM. The SEM micrographs obtainedare shown in Fig. 17.
The ellipsoidal particles after dissolution presented a signifi-cant open porosity.
3.4. Seeding experiments
We have studied the stability of the forms bipyramids andellipsoids synthesised at C0 ¼ 8 mol m!3 and at 25 mol m!3 usingthem as seeds at C0 ¼ 25 mol m!3 and at C0 ¼ 8 mol m!3,respectively.
Thus, we have made a precipitation as explained in Sections 2.1and 2.2 at C0 ¼ 8 mol m!3, but adding ellipsoidal seeds from aprevious experiment at C0 ¼ 25 mol m!3. Another experiment wasdone at C0 ¼ 25 mol m!3 adding seeds from the experiment atC0 ¼ 8 mol m!3. The weight of seeds was equal to 6.5% of the solidmass at the end of precipitation at C0 ¼ 25 mol m!3 and 3% atC0 ¼ 8 mol m!3. With these two experiments, we tried to find ifbipyramids transform into ellipsoids and if the ellipsoidal form isstable at lower concentrations. At the end of each experiment wecharacterised the powder by laser diffraction and SEM micro-graphs. The latter are especially interesting.
Table 2Crystallites size of SrMoO4 determined by XRD for different stirring rate andtemperature (Mixel stirrer, 25 mol m!3)
Crystallite size (nm)
Stirring rate (rpm)350 157 (740)600 155 (736)
Temperature (1C)25 157 (740)35 113 (736)50 157 (752)
Table 3Crystallites size of SrMoO4 determined by RXD for different initial concentration
Concentration(mol m!3)
Morphology Crystallitesize (nm)
8 Bipyramidal 1409 Ellipsoidal 147
10 Ellipsoidal 17212.5 Ellipsoidal 280 (717)25 Ellipsoidal 157 (740)50 Cylindrical 92 (716)
Table 4Experimental results of BET specific area of the SrMoO4 for different stirring ratesand theoretical surfaces calculated as functions of particle geometry (25 mol m3,25 1C, 350 rpm)
Aspec (m2/g)experimental
Aspec (m2/g)theoretical
Particlegeometry
Shape/Sizeparameters(La, ab) mm
Stirring rate (rpm)200 0.24 0.28 Ellipsoid L ¼ 12; a ¼ 5350 0.20 (70.003) 0.28 Ellipsoid L ¼ 12; a ¼ 5500 0.18 0.28 Ellipsoid L ¼ 12; a ¼ 5600 0.19 0.28 Ellipsoid L ¼ 12; a ¼ 5
C0 (mol m!3)8 0.13 (70.002) 0.74 Bipyramid L ¼ 8; a ¼ 49 0.200 (70.002) 0.28 Ellipsoid L ¼ 8; a ¼ 410 0.210 (70.003) 0.28 Ellipsoid L ¼ 8; a ¼ 412.5 0.120(70.003) 0.28 Ellipsoid L ¼ 8; a ¼ 425 0.21 (70.003) 0.28 Ellipsoid L ¼ 12; a ¼ 550 0.41 (70.009) 0.41 Cylinder L ¼ 12;
a ¼ 3.2nc ¼ 6,rd ¼ 1
T (1C)10 0.18 (70.0013)25 0.20 (70.003) 0.28 Ellipsoid L ¼ 12; a ¼ 535 0.81 (70.003) 0.28 Ellipsoid L ¼ 12; a ¼ 550 0.158 (70.0013) 0.28 Ellipsoid L ¼ 12; a ¼ 580 0.33 (70.0027) 0.28 Ellipsoid L ¼ 12; a ¼ 5
a length of the grain.b width of the grain.c number of cylinders.d radius ¼ cylinder height.
L
a a
a
Fig. 16. Geometric shapes to calculate specific area.
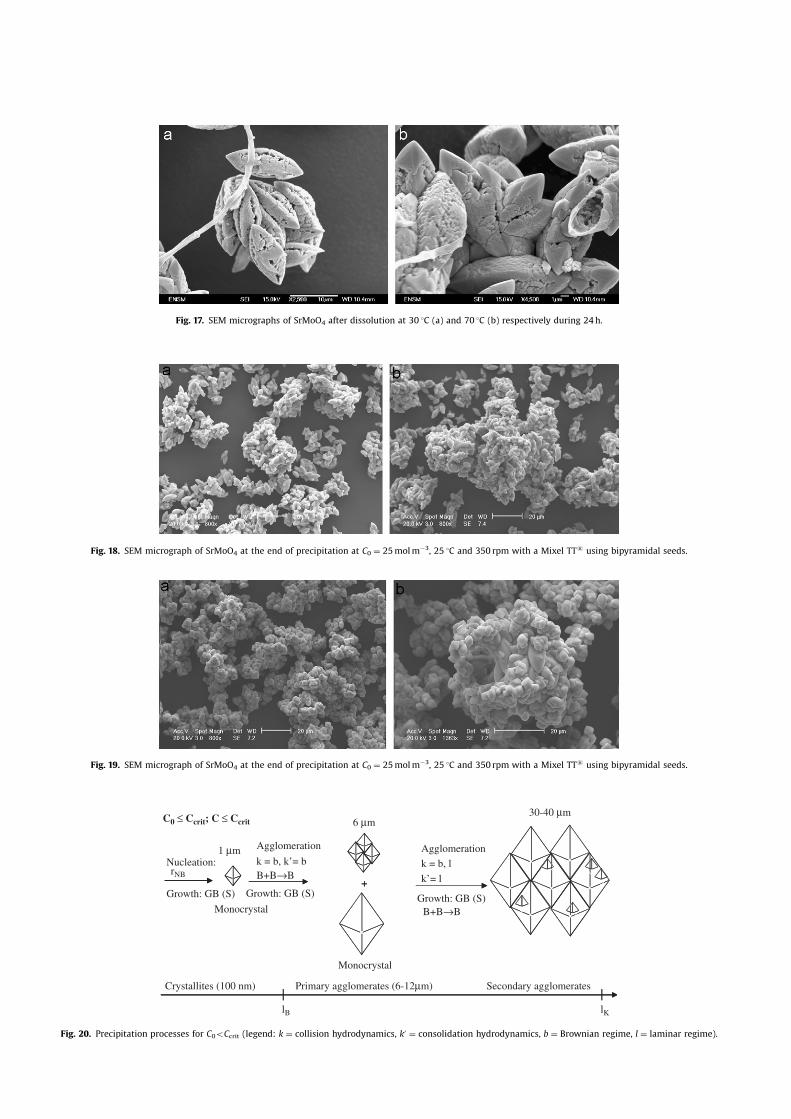
Fig. 17. SEM micrographs of SrMoO4 after dissolution at 30 1C (a) and 70 1C (b) respectively during 24 h.
Fig. 18. SEM micrograph of SrMoO4 at the end of precipitation at C0 ¼ 25 mol m!3, 25 1C and 350 rpm with a Mixel TTs using bipyramidal seeds.
Fig. 19. SEM micrograph of SrMoO4 at the end of precipitation at C0 ¼ 25 mol m!3, 25 1C and 350 rpm with a Mixel TTs using bipyramidal seeds.
Monocrystal
1 µm
Growth: GB (S)
Monocrystal
6 µm
Agglomerationk = b, lk’= l
Nucleation:rNB
Growth: GB (S)Growth: GB (S)
30-40 µm
Agglomerationk = b, k’= bB+B→B
+
B+B→B
C0 ≤ Ccrit; C ≤ Ccrit
Crystallites (100 nm) Primary agglomerates (6-12µm) Secondary agglomerates
lB lK
+
Fig. 20. Precipitation processes for C0oCcrit (legend: k ¼ collision hydrodynamics, k0 ¼ consolidation hydrodynamics, b ¼ Brownian regime, l ¼ laminar regime).
The precipitations using bipyramidal seeds at C0 ¼ 25 mol m!3
show (Fig. 18a) the same mechanism of nucleation, growth andagglomeration of ellipsoids that we have observed with this initialconcentration but without seeds. However, we observed (Fig. 18b)some secondary agglomerates with sizes about 100mm thatprobably correspond to the seeds of agglomerates of bipyramidsthat have been transformed in agglomerates of ellipsoids bygrowth. On the surface of these large agglomerates of seed, we canalso observe the ellipsoids nucleated in the precipitation and seethe difference of sizes between them (Fig. 18b). We can concludethat for concentrations higher than 8 mol m!3 we cannot have thepresence of bipyramids in a stable form.
The morphology of agglomerates is the same as observed inexperiments at C0 ¼ 8 mol m!3 without seeding (Fig. 19a). We alsoobserve that bigger agglomerates are formed (Fig. 19b) due to thepresence of ellipsoidal seeds that stay with the same size andmorphology as initially. There are just some bipyramids thatadhere to their surfaces. So, we can conclude that for concentra-tions less than 8 mol m!3 the morphology and size of ellipsoidsare still the same.
Seeding does not seem to change the mechanisms ofnucleation, growth and agglomeration of bipyramids and ellip-soids. Therefore, we conclude that for a given concentration wecannot observe a morphology that usually is formed at a lower
Primary agglomerates (6-12 µm) Secondary agglomerates
lB lK
6-12 µmAgglomeration
k = b, l; k’= l
E + E→E
Agglomeration:k = k’= bE + E→E
100-200 nm
Nucleation: rNE = rNE
Growth: GE (S)Growth: GE (S)Growth: GE (S)
C0 > Ccrit; C > Ccrit
:
Crystallites (100 nm) Primary agglomerates (6-12µm) Secondary agglomerates
lB lK
Monocrystal
Nucleation 1µm
Growth GB (S)
Pop. E:Agglomeration
Pop. BE
Pop. B:
Agglomeration
Pop. BE
E + E→E k = b, lk’= l
E + BE→BE k = b, lk’= l
rA, B, B, B ≤ rA, B, E, BE
Growth GB (S)
B + E→BE k = b, lk’= l
AgglomerationB + B→Bk = b, lk’= l
AgglomerationB + BE→BE k = b, lk’= l
AgglomerationB + BE→BE k = b, lk’= l
k = k’= b
rB (S)
AgglomerationAgglomeration
C0 >Ccrit; C ≤ Ccrit
k’= l
crystallite
crystallite
100-200 nm
Growth GE (S)6-12µm
Growth GE (S)
Growth GE (S)
(40-80µm)
GBE = max (GB, GE)
Growth GBE (S)
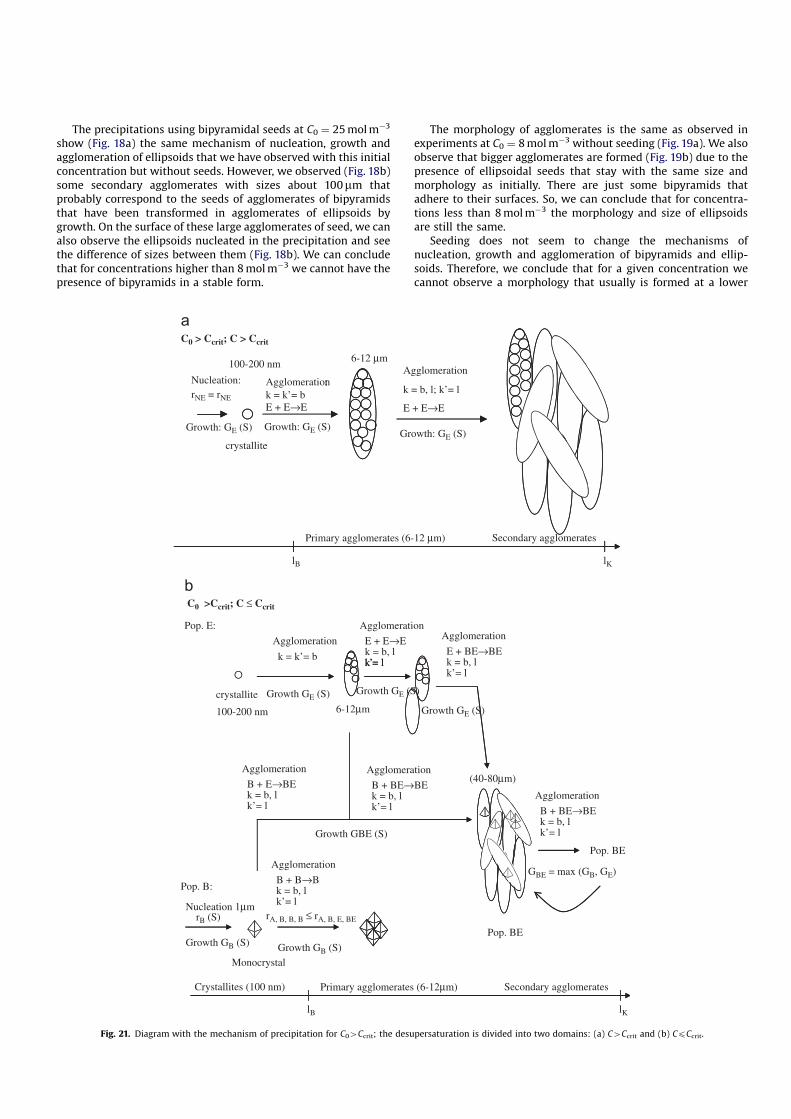
Fig. 21. Diagram with the mechanism of precipitation for C04Ccrit; the desupersaturation is divided into two domains: (a) C4Ccrit and (b) CpCcrit.
concentration: the bipyramidal seeds are growing in the mor-phology corresponding to the domain of higher concentrations,i.e. as ellipsoids. On the contrary, a morphology formed at a higherconcentration can survive at lower concentrations.
3.5. Mechanisms of nucleation, growth and agglomeration of theSrMoO4
Strontium molybdate obviously presents two domains ofprecipitation: [Ceq, Ccrit] and [4Ccrit]. Ccrit is the critical concen-tration (equal to about 8.5 mol m!3 at 25 1C) corresponding to thekinetic roughening transition. The mechanisms of nucleation,growth and agglomeration of these two domains are presented inthe next diagrams. The collision hydrodynamics regime noted as kcan be either Brownian (b) or laminar (l). The hydrodynamics ofthe agglomerate consolidation regime k0 can be either (b) or (l)too. The consolidation regime is the one where the aggregateformed by collision consolidates by growth of a crystalline bridgebetween the colliding particles [9].
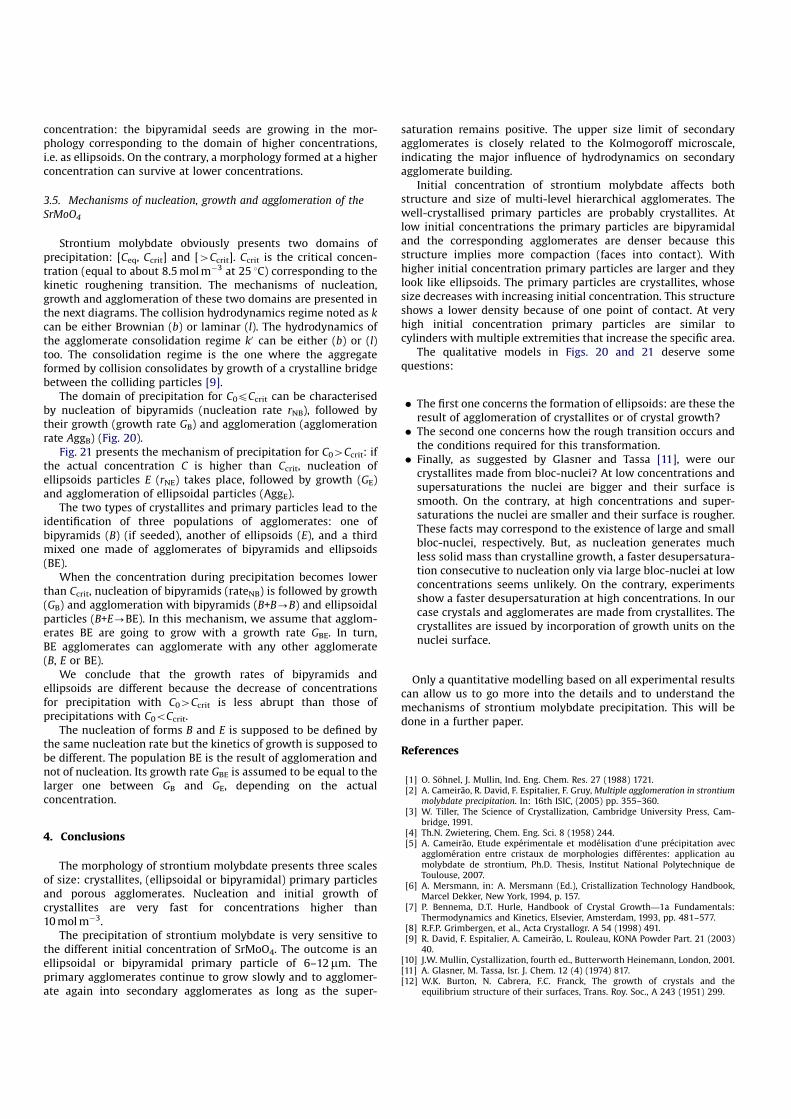
The domain of precipitation for C0pCcrit can be characterisedby nucleation of bipyramids (nucleation rate rNB), followed bytheir growth (growth rate GB) and agglomeration (agglomerationrate AggB) (Fig. 20).
Fig. 21 presents the mechanism of precipitation for C04Ccrit: ifthe actual concentration C is higher than Ccrit, nucleation ofellipsoids particles E (rNE) takes place, followed by growth (GE)and agglomeration of ellipsoidal particles (AggE).
The two types of crystallites and primary particles lead to theidentification of three populations of agglomerates: one ofbipyramids (B) (if seeded), another of ellipsoids (E), and a thirdmixed one made of agglomerates of bipyramids and ellipsoids(BE).
When the concentration during precipitation becomes lowerthan Ccrit, nucleation of bipyramids (rateNB) is followed by growth(GB) and agglomeration with bipyramids (B+B-B) and ellipsoidalparticles (B+E-BE). In this mechanism, we assume that agglom-erates BE are going to grow with a growth rate GBE. In turn,BE agglomerates can agglomerate with any other agglomerate(B, E or BE).
We conclude that the growth rates of bipyramids andellipsoids are different because the decrease of concentrationsfor precipitation with C04Ccrit is less abrupt than those ofprecipitations with C0oCcrit.
The nucleation of forms B and E is supposed to be defined bythe same nucleation rate but the kinetics of growth is supposed tobe different. The population BE is the result of agglomeration andnot of nucleation. Its growth rate GBE is assumed to be equal to thelarger one between GB and GE, depending on the actualconcentration.
4. Conclusions
The morphology of strontium molybdate presents three scalesof size: crystallites, (ellipsoidal or bipyramidal) primary particlesand porous agglomerates. Nucleation and initial growth ofcrystallites are very fast for concentrations higher than10 mol m!3.
The precipitation of strontium molybdate is very sensitive tothe different initial concentration of SrMoO4. The outcome is anellipsoidal or bipyramidal primary particle of 6–12mm. Theprimary agglomerates continue to grow slowly and to agglomer-ate again into secondary agglomerates as long as the super-
saturation remains positive. The upper size limit of secondaryagglomerates is closely related to the Kolmogoroff microscale,indicating the major influence of hydrodynamics on secondaryagglomerate building.
Initial concentration of strontium molybdate affects bothstructure and size of multi-level hierarchical agglomerates. Thewell-crystallised primary particles are probably crystallites. Atlow initial concentrations the primary particles are bipyramidaland the corresponding agglomerates are denser because thisstructure implies more compaction (faces into contact). Withhigher initial concentration primary particles are larger and theylook like ellipsoids. The primary particles are crystallites, whosesize decreases with increasing initial concentration. This structureshows a lower density because of one point of contact. At veryhigh initial concentration primary particles are similar tocylinders with multiple extremities that increase the specific area.
The qualitative models in Figs. 20 and 21 deserve somequestions:
( The first one concerns the formation of ellipsoids: are these theresult of agglomeration of crystallites or of crystal growth?( The second one concerns how the rough transition occurs and
the conditions required for this transformation.( Finally, as suggested by Glasner and Tassa [11], were our
crystallites made from bloc-nuclei? At low concentrations andsupersaturations the nuclei are bigger and their surface issmooth. On the contrary, at high concentrations and super-saturations the nuclei are smaller and their surface is rougher.These facts may correspond to the existence of large and smallbloc-nuclei, respectively. But, as nucleation generates muchless solid mass than crystalline growth, a faster desupersatura-tion consecutive to nucleation only via large bloc-nuclei at lowconcentrations seems unlikely. On the contrary, experimentsshow a faster desupersaturation at high concentrations. In ourcase crystals and agglomerates are made from crystallites. Thecrystallites are issued by incorporation of growth units on thenuclei surface.
Only a quantitative modelling based on all experimental resultscan allow us to go more into the details and to understand themechanisms of strontium molybdate precipitation. This will bedone in a further paper.
References
[1] O. Sohnel, J. Mullin, Ind. Eng. Chem. Res. 27 (1988) 1721.[2] A. Cameirao, R. David, F. Espitalier, F. Gruy, Multiple agglomeration in strontium
molybdate precipitation. In: 16th ISIC, (2005) pp. 355–360.[3] W. Tiller, The Science of Crystallization, Cambridge University Press, Cam-
bridge, 1991.[4] Th.N. Zwietering, Chem. Eng. Sci. 8 (1958) 244.[5] A. Cameirao, Etude experimentale et modelisation d’une precipitation avec
agglomeration entre cristaux de morphologies differentes: application aumolybdate de strontium, Ph.D. Thesis, Institut National Polytechnique deToulouse, 2007.
[6] A. Mersmann, in: A. Mersmann (Ed.), Cristallization Technology Handbook,Marcel Dekker, New York, 1994, p. 157.
[7] P. Bennema, D.T. Hurle, Handbook of Crystal Growth—1a Fundamentals:Thermodynamics and Kinetics, Elsevier, Amsterdam, 1993, pp. 481–577.
[8] R.F.P. Grimbergen, et al., Acta Crystallogr. A 54 (1998) 491.[9] R. David, F. Espitalier, A. Cameirao, L. Rouleau, KONA Powder Part. 21 (2003)
40.[10] J.W. Mullin, Cystallization, fourth ed., Butterworth Heinemann, London, 2001.[11] A. Glasner, M. Tassa, Isr. J. Chem. 12 (4) (1974) 817.[12] W.K. Burton, N. Cabrera, F.C. Franck, The growth of crystals and the
equilibrium structure of their surfaces, Trans. Roy. Soc., A 243 (1951) 299.