Embed Size (px)
Citation preview
ISSN 2348-3156 (Print)
International Journal of Social Science and Humanities Research ISSN 2348-3164 (online) Vol. 5, Issue 2, pp: (564-578), Month: April - June 2017, Available at: www.researchpublish.com
Page | 564 Research Publish Journals
Effect of Reverse Logistics on Operational
Performance of Bata Shoe Company
1ELIAZAR KINYANJUI NJUGUNA,
2DR ASSUMPTAH KAGIRI
1Master of Science in Procurement & logistics Jomo Kenyatta University of agriculture and technology, Kenya
2Lecturer, Jomo Kenyatta University of agriculture and technology, Kenya
Abstract: In today’s world reverse logistics has been gaining more interest than ever to overcome government
regulations and generate profit-making opportunities. Reverse logistics also includes processing of returned
merchandise due to damage, seasonal inventory, restock, salvage, recalls and hazardous material programs,
obsolete equipment disposition, and asset recovery. Kenya being a developing country faces a problem of dumping
especially from the international companies. Most international electronic companies have a tendency to see the
end-of-life products in developing countries as a waste stream not required to be managed. In this regard, this
study seeks to determine the effect of adoption of reverse logistics on the operational performance of Bata Shoe
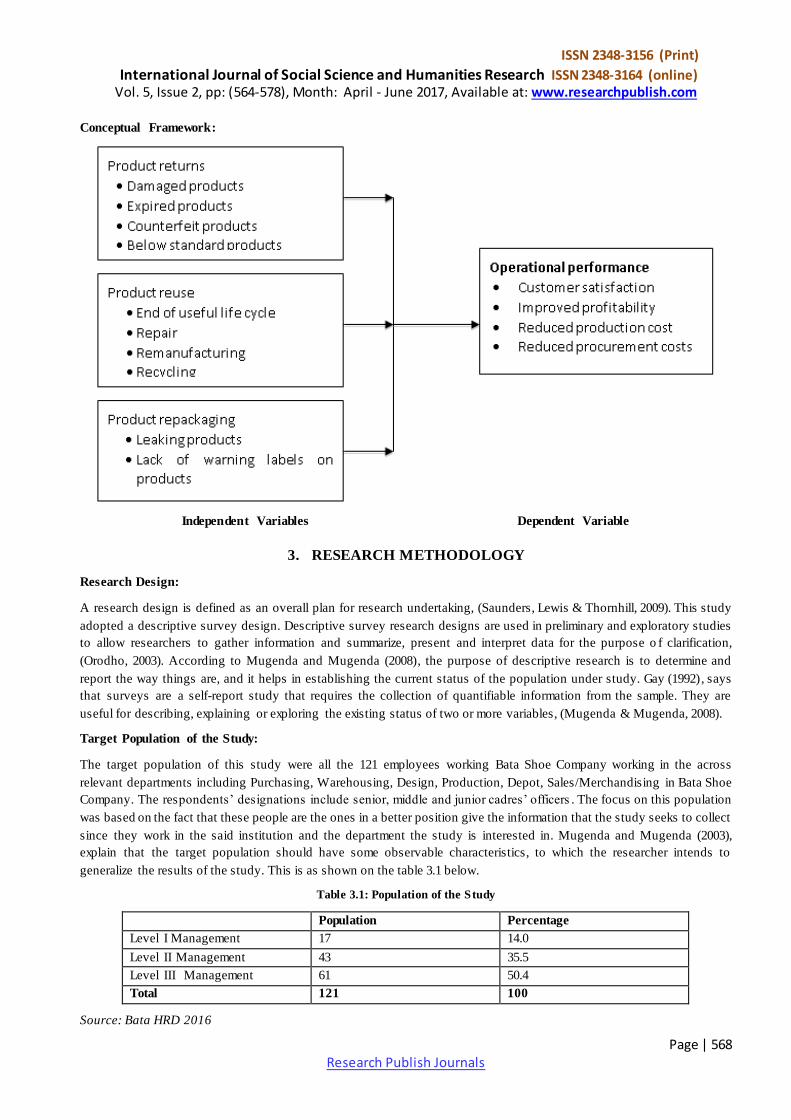
Company. Specifically, the study sought to establish the effect of product returns, product reuse, and product
repackaging as reverse logistics practices on operational performance of Bata Shoe Company. This study was
based on institutional theory and the Resource-based theory. This study adopted a descriptive survey design. The
target population were be the all the employees working at Bata Shoe Company. The study used a stratified
sampling technique to select 61 employees in logistics, procurement and supply chain department in Bata Shoe
Company. The study used primary data. Primary data was collected using a close-ended questionnaire. A drop
and pick later method was employed to collect data. To ensure reliability and validity of the instrument, a pilot
study was conducted. The researcher will edit the completed questionnaires for completeness and consistency. The
data was then be analyzed using descriptive statistics. The descriptive statistical tools (SPSS Version 20 and Excel)
helped the researcher to describe the data. Inferential statistics (Correlation and regression) were employed for
analysis to test for a relationship between variables. The study concluded product returns, product reuse and
product repackaging influenced operational performance of Bata Shoe Company to a very great extent. In
addition, the correlation analysis showed that three variables; product returns, product reuse and product
repackaging were highly correlated and therefore had the most significant influence on operational performance
both independently and as a result of their interaction.
Keywords: Effects, Operational and Performance.
1. BACKGROUND OF THE STUDY
Purchasing has for a long time been considered primarily as an operational function without any strategic importance,
(Baily, Farmer Jessop & Jones, 2010). However, a good reverse logistics strategy is needed to cope with this return to
gain the most benefits. Reverse logistics involves redesigning packaging to use less material, or reducing the energy and
pollution from transportation are important activities, but they might be secondary to the real importanc e of overall
reverse logistics, (Reverse Logistics Magazine, 2006). Reverse logistics also includes processing returned merchandise
due to damage, seasonal inventory, restock salvage, recalls and hazardous material programs, obsolete equipment
disposition, and asset recovery.
In today‟s world reverse logistics has been gaining more interest than ever to overcome gov ernment regulations and
generate profit-making opportunities. An effective and standardized reverse logistics process can give a firm the
ISSN 2348-3156 (Print)
International Journal of Social Science and Humanities Research ISSN 2348-3164 (online) Vol. 5, Issue 2, pp: (564-578), Month: April - June 2017, Available at: www.researchpublish.com
Page | 565 Research Publish Journals
necessary competitive advantage to move above peers and competitors, and possibly capture larger market share within
their industry because of their superior process and being able to meet the demands of the customers , (El-Nakib, 2012).
Reverse logistics is the term often used to refer to the role of logistics in recycling, waste disposal, and management of
hazardous materials; a broader perspective includes all issues relating to logistics activities to be carried out in source
reduction, recycling, substitution, reuse of materials and disposal. Increased competition due to globalization and
technological advancement has driven organizations to make efforts to improve efficiency in their supply chain ,
(Huscroft, 2010). This has led to an increasing efficiency of reverse logistics processes as the way in which firms attempt
to maintain and increase competitiveness and market share.
CONCEPT OF REVERS E LOGISTICS:
The term reverse logistics has attained many definitions. American Production and Inventory Control Society (APICS)
currently called Association for Operations Management Dictionary, (2005) defines Reverse Logistics as: “A complete
supply chain dedicated to the reverse flow of products and materials for the purpose of returns, repair, remanufacture, and
recycling.” Reverse logistics has also been defined by Greeff and Ghoshal (2004), in commercial terms as the process of
moving products from their usual final destination to another point, with the objective of capturing value otherwise
unavailable, or for the appropriate disposal of the products.
2003 saw the formation of the Reverse Logistics Association whose main function was to help the industry focus on
returns and recycling of materials and transform reverse logistics processes into a profit making venture . The association
defined Reverse Logistics as all the activities that are associated with a service or a product after its sold with the ultimate
goal of optimizing the efficiency of aftermarket activity and therefore saving money and environmental resources. The
president of the Association succinctly defines Reverse Logistics as, “… anytime money taken from a company's
Warranty Reserve or Service Logistics budget that is a Reverse Logistics operation"
MANUFACTURING INDUSTRY IN KENYA:
According to the KIPPRA report (2013), manufacturing sector makes an important contribution to the Kenyan
economy and currently employs 277,900 people, which represents 13% of labour force in the formal sector with an
additional 1.6 million people employed in the informal side of the industry. Nearly 50% of manufacturing firms in
Kenya employ 50 or more workers. The sector comprises of about 3,700 manufacturing units and is divided into
several broad sub-sectors. KAM has classified manufacturing sector into categories identified as: Building, Construction
& Mining, Chemical & Allied, Electrical & Electronics, Food Beverages & Tobacco, Leather & Footwear,
Metal & Allied, Motor Vehicle & Accessories, Paper & Board, Pharmaceutical & Medical Equipment, Plastics
& Rubber, Textiles & Apparels, Timber, Wood Products & Furniture, Consultancy & Industrial Services and SME
Focal Point (KAM, 2014) The sector is mainly agro-based and characterized by relatively low value addition,
employment, and capacity utilization and export volumes partly due to weak linkages to other sectors. The top three
manufacturing subsectors account for 50% of the sector GDP, 50% of exports, and 60% of formal employment. Overall,
manufacturing contributes 10% to GDP. The bulk of Kenya‟s manufactured goods (95%) are basic product s such as food,
beverages, building materials and basic chemicals. Only 5% of manufactured items, such as pharmaceuticals, are in skill-
intensive activities (KIPPRA, 2013).
BATA SHOE COMPANY:
Bata Shoe Company was established in Limuru in 1940 as a branch of Bata Limited (Canada). The company was
originally based in Czechs Republic before it moved to Canada after the nation was taken over by communism.
Currently,Bata intenational has reverted its headquaters back to Czechs Republic in a town known as Zling. The annual
production of the company is around 31 million pairs of shoes which range from injected plastic, DIP closed, cemented
shoes for school and Safari, and thongs. The installation of new machines and expansion of the sales network has
increased market participation significantly, and annual production increased by 2.5 times in the last decade.
The supply chain of products in the company involves both forward and reverse logistics. The forward logistics involves
the goods passing through the supply channels until they are in the shelves ready to be purchased. However, the reverse
logistics in the company involve the return of shoes that overstayed on the shelves to factory for disposition through
special discount outlets / mini prices . Gumboots and plastic shoes which have lost value through wear and tear are
recycled to make new products. The leather left after the shoes are made is not disposed but reused to make interior cover
ISSN 2348-3156 (Print)
International Journal of Social Science and Humanities Research ISSN 2348-3164 (online) Vol. 5, Issue 2, pp: (564-578), Month: April - June 2017, Available at: www.researchpublish.com
Page | 566 Research Publish Journals
for motor vehicle. The company management of waste has been cited as a constant threat that lowers the mark for its
support for green logistics. Although, the tannery effluents have been controlled and are no longer a threat, the other by -
products of the plant need to also be appropriately managed. The current trend that the company is experiencing is in sub-
contracting the production of its production to labour efficient plants who have intensively invested in new production
technology. In addition, the company is aligning its production to be environmentally sustainable.
STATEMENT OF THE PROBLEM:
According to Pollock (2010), organizations have traditionally focused on improving their forward logistics activities;
most have not treated the reverse logistics process with the same care and diligence afforded to traditional areas of
logistics.Achieng (2011) indicated that most firms in Kenya often focus on forward logistics and as a result, they tend to
overlook the importance of reverse logistics activities and its potential of improving the firm‟s and supply chain‟s
performance.
The main challenge facing the manufacturing industry in Kenya is the lack of a legal framework for waste management
vis-à-vis reverse logistics. Furthermore, manufacturers in Kenya have to cope with all kinds of returns, from apparel that
just didn't suit the customer needs and expectations, to expired products that are no longer saleable, to recalls that
endanger public safety. Also, the manufacturing industry business has to deal with damaged, unwanted, outmoded,
leaking, spoiled, or counterfeit merchandise which accounts to 40 to 60 percent of the returns. It is up to manufacture‟s
reverse logistics operations to separate the wheat from the chafe, performing triage and processing it all to reduce costs
and mitigate loss, (Business Daily, 2015). The manufacturers are the worst hit as they account for 75% of the goods
handled by retailers in the market. It is approximated that the manufacturing spends millions of shillings as holding cost
in the event of returned products.
study on how to recover lost profit through reverse logistics . In Kenya, Kimani (2011), did a study to establish how green
supply chain practices are integrated into the manufacturing sector in Kenya. Therefore, despite the massive inquiry into
areas of procurements and reverse logistics , none of these studies has been conducted to assess the effect of product
returns, product reuse, and product repackaging on operational performance in the manufacturing industry in Kenya.
Based on these, there was sufficient evidence that a knowledge gap exists that needs to be filled through research. The
study sought to help bridge this gap by determining the effect of reverse logistics on operational performance of Bata
Shoe Company.
2. LITERATURE REVIEW
Institutional Theory:
The cradle of this theory can be traced to studies in political science. Initially at its advent the theory trained a lot of focus
on aspects of legalism, structuralism, historical inklings, and holism and was hinged on a normative analysis , (Peters,
2005). The theory is based on the dictations of law and governance; it examined a firm's system as a whole entity,
borrowed heavily from systems that were present at the time and was defined by operational values and facts that were to
be adhered to. However, in the current age of bus iness the theory and nature of organizational operations have
transformed, in an organization, for instance, the institutional environment is defined as a separate entity that lies outside
the operational parameters of the organization. The environment primarily affects the organizational outcomes by
imposing constraints on firms‟ operational processes and demanding adaptation of firms‟ processes in order to survive.
Yang and Sheu (2011), point out that institutional theory is recognized through the pressures of the social, cultural,
political, and legal sector as a main factor influencing the operation of organizations. Furusten (2013) indicated that
according to the institutional approach under the organizational field, there are three mechanisms of pressures by which
imitations (isomorphism) in structure and processes between organizations are motivated: coercive, mimetic, and
normative. Coercive isomorphism derives from formal and informal pressures carried out on organizations by other
organizations upon which they depend on. Such forces can be exerted through persuasion, an invitation to join shared
behavioral models, laws and regulations, and government mandates. Coercive forces are typically given to governmental
authorities by issuing laws and regulations. Mimetic isomorphism is a firm‟s standard response to environmental
uncertainty by imitating themselves as other organizations, e.g. using lean or agile manufacturing in production, Just -In-
Time in sourcing, and Efficient Customer Response in distribution. Normative isomorphism arises from the high degree
ISSN 2348-3156 (Print)
International Journal of Social Science and Humanities Research ISSN 2348-3164 (online) Vol. 5, Issue 2, pp: (564-578), Month: April - June 2017, Available at: www.researchpublish.com
Page | 567 Research Publish Journals
of socialization and interaction that often occurs between members of the same organizational environment. When these
members interact, they reinforce and spread norms of behavior among themselves, (Miles, 2012).
The transformation of the theory has seen operations of institutions now being designed to conform to the formal and
informal structure of the society, environment, and policy. The theory purports that external factors play a major role in
influencing the organizational strategies associated with supply chain management. On the same note, factors such as
customer satisfaction and retention will influence the adoption of effective reverse logistics processes which will
subsequently impact the operational performance of the organization (Ketchen & Giunipero, 2004). According to the
institution theory, supply management should strive to monitor the environment for opportunities and identify emerging
best practices, like reverse logistics, which affect organizational operations if it is to continue to make improvements
(Scott, 2003; Movahedi et at., 2009).
RESOURCE-BAS ED THEORY:
The theory seeks to provide more insight into discerning the value systems in an organization by emphasizing the
imperativeness of knowledge as a factor of production in an organization. There are two main schools of thoughts that
have been identified; the classical and modern school of thought (Lavassani et al., 2009). The classical school champions
for the acquisition of economic resources as an avenue of achieving competitive advantage in the market. These
sentiments are traced back to opinions held by David Racardo (1817) on his works about the rent advantage of production
factors. Edith Penroses (1959), is credited for commencing the conceptualization of the modern school of thought that
calls for the organisation to assess the internal organization processes that lead to organizational growth as a tool to attain
competitive advantage, (Rugman & Verbeke, 2002).
The Resource-based View (RBV) is considered as one of the most influential theories concerned with the economic
aspect of operations in an organization. The term „„resource‟‟ is broad in nature, in that it refers to not only physical
(tangible) assets, such as equipment, plants, and location, but also to intangible assets, such as management skill,
knowledge, and organizational assets , (Dietrich & Krafft, 2012). Resource-based theory views the firm as a bundle of
idiosyncratic resources and assets, which emphasizes the use of the rate, valuable, inimitable and un-substitutable
resources to gain sustainable competitive advantage. Sehgal (2010), noted that resource-based view investigates the
importance of internal resources in determining firm actions to create and main tain a competitive advantage and improve
performance.
Firms that are able to correctly match resources to specific programs and events or to environmental opportunities are
more likely to develop capabilities that result in better performance, (Sehgal, 2010). There are always problems with the
lack of management information that does not provide a complete view of resources of a firm to make allocation and
exploitation. The effective and efficient allocations and management of resources are asserted to be a key factor
influencing firm performance, (Zacharia et al., 2011).
Capabilities are complex bundles of skills, assets, and accumulated knowledge exercised through organizational
processes, which enable firms to coordinate activities and make use of their resources. During the past decade, more
attention has been paid to the application of resource-based view in organizational supply chain management. Morash and
Lynch (2002), employed resource-based view in their study of global supply chain capability and performance. In another
study Wu, Yeniyurt, Kim and Cavusgil (2005), illustrated the application of resource-based view in the impact of IT on
organizational supply chain capabilities and performance. Gold, Seuring, and Beske (2009) extended the application of
resource-based view to inter-organizational relations of businesses. The application of the theory to this study will be to
assess the impacts or reverse logistics as organization operations that have the potential to influence an important metric
of performance highlighted by organizational growth.
In relation to the study, a firm should develop logistics strategy among its core competencies in order to reduce costs and
maximize the value they offer, ( ong Karia, 2010; Ram rez orales es s, 2011). Reverse logistics strategy is of
critical importance in managing the reverse direction in supply chains –from consumer to producer. The volume of return
goods is hard to predict, therefore a reverse logistics strategy needs to dictate return policies and procedures and integrate
them with forward logistics operations. Manufacturers in Kenya thus strive to ensure that they have an elaborate return
policy to ensure that they win confidence of the customers for enhanced performance.
ISSN 2348-3156 (Print)
International Journal of Social Science and Humanities Research ISSN 2348-3164 (online) Vol. 5, Issue 2, pp: (564-578), Month: April - June 2017, Available at: www.researchpublish.com
Page | 568 Research Publish Journals
Conceptual Framework:
Independent Variables Dependent Variable
3. RESEARCH METHODOLOGY
Research Design:
A research design is defined as an overall plan for research undertaking, (Saunders, Lewis & Thornhill, 2009). This study
adopted a descriptive survey design. Descriptive survey research designs are used in preliminary and exploratory studies
to allow researchers to gather information and summarize, present and interpret data for the purpose o f clarification,
(Orodho, 2003). According to Mugenda and Mugenda (2008), the purpose of descriptive research is to determine and
report the way things are, and it helps in establishing the current status of the population under study. Gay (1992), says
that surveys are a self-report study that requires the collection of quantifiable information from the sample. They are
useful for describing, explaining or exploring the existing status of two or more variables, (Mugenda & Mugenda, 2008).
Target Population of the Study:
The target population of this study were all the 121 employees working Bata Shoe Company working in the across
relevant departments including Purchasing, Warehousing, Design, Production, Depot, Sales/Merchandising in Bata Shoe
Company. The respondents‟ designations include senior, middle and junior cadres‟ officers . The focus on this population
was based on the fact that these people are the ones in a better position give the information that the study seeks to collect
since they work in the said institution and the department the study is interested in. Mugenda and Mugenda (2003),
explain that the target population should have some observable characteristics, to which the researcher intends to
generalize the results of the study. This is as shown on the table 3.1 below.
Table 3.1: Population of the Study
Population Percentage
Level I Management 17 14.0
Level II Management 43 35.5
Level III Management 61 50.4
Total 121 100
Source: Bata HRD 2016
ISSN 2348-3156 (Print)
International Journal of Social Science and Humanities Research ISSN 2348-3164 (online) Vol. 5, Issue 2, pp: (564-578), Month: April - June 2017, Available at: www.researchpublish.com
Page | 569 Research Publish Journals
Sampling Technique:
From the population 121 employees, the study picked a sample through stratified random sampling technique. According
to Cooper and Schindler (2003), stratified random sampling frequently minimizes the sampling error in the population. In
stratified random sampling, each item or element of the population has an equal chance of being chosen at each draw.
While the study targeted all the registrars, a sample of teaching staff in the private universities was taken. To determine
the sample size of the teaching staff, the researcher used formula by Saunders, Lewis, and Thornhill (2012) for sample
size determination (See Appendix IV for sample size determination table). The sample size was 92 respondents . The
respondents were picked from each stratum proportionately.
Where:
n = required sample size
N = the given population size from the sampling frame
P = Population proportion, assumed to be 0.50
2 = the degree of accuracy;value is 0.05
2 = Table value of chi-square for one degree of
freedom, which is 3.841
Sample Size:
Population Ratio Sample
Level I Management 16 0.76 12
Level II Management 44 0.76 34
Level III Management 61 0.76 46
Total 121 0.76 92
Source: Author 201
4. DATA ANALYSIS, PRESENTATION AND INTERPRETATION
Response Rate:
The research target sample size was 92 respondents to be drawn from projects managers and project officers of the
organization. The study gave out 92 questionnaires to the respondents, however, only 87 questionnaires were returned
duly filled. This translated to 95.6% response rate. This response rate was adequate for data analysis and conformed to
ugenda and ugenda‟s (2003) stipulation that a response rate of 50% is adequate for analysis and reporting; a rate of
60% is good and a response rate of 70% and over is excellent.
GENDER CATEGORY
The study sought to establish the gender of the respondents. The results are shown in the table below:
TABLE GENDER OF THE RESPONDENTS
Gender Frequency Percentage
Male 37 42.1
Female 50 57.9
Total 87 100
According to the table above, majority of the respondents (42.1 %) were male. Also, 57.9% of the respondents were
females.
AGE DISTRIBUTION OF THE RESPONDENTS:
The study also sought to establish the age of the respondents. The results are shown in the table below:
ISSN 2348-3156 (Print)
International Journal of Social Science and Humanities Research ISSN 2348-3164 (online) Vol. 5, Issue 2, pp: (564-578), Month: April - June 2017, Available at: www.researchpublish.com
Page | 570 Research Publish Journals
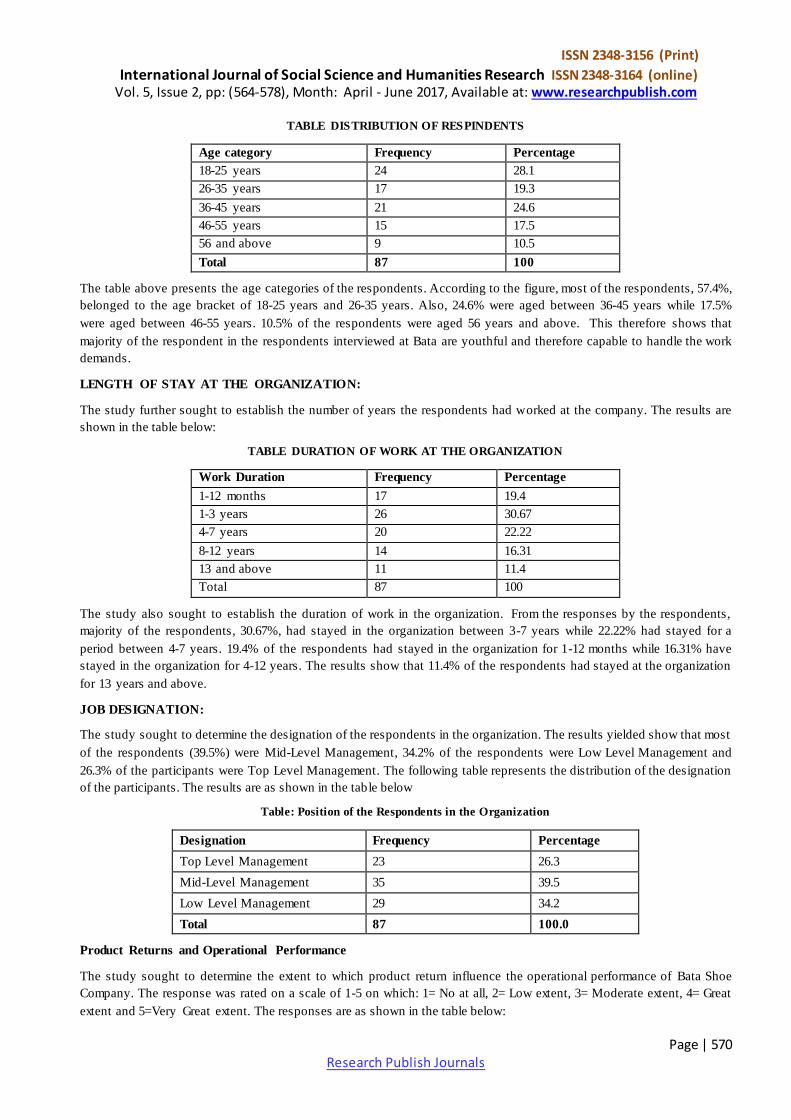
TABLE DISTRIBUTION OF RESPINDENTS
Age category Frequency Percentage
18-25 years 24 28.1
26-35 years 17 19.3
36-45 years 21 24.6
46-55 years 15 17.5
56 and above 9 10.5
Total 87 100
The table above presents the age categories of the respondents. According to the figure, most of the respondents, 57.4%,
belonged to the age bracket of 18-25 years and 26-35 years. Also, 24.6% were aged between 36-45 years while 17.5%
were aged between 46-55 years. 10.5% of the respondents were aged 56 years and above. This therefore shows that
majority of the respondent in the respondents interviewed at Bata are youthful and therefore capable to handle the work
demands.
LENGTH OF STAY AT THE ORGANIZATION:
The study further sought to establish the number of years the respondents had worked at the company. The results are
shown in the table below:
TABLE DURATION OF WORK AT THE ORGANIZATION
Work Duration Frequency Percentage
1-12 months 17 19.4
1-3 years 26 30.67
4-7 years 20 22.22
8-12 years 14 16.31
13 and above 11 11.4
Total 87 100
The study also sought to establish the duration of work in the organization. From the responses by the respondents,
majority of the respondents, 30.67%, had stayed in the organization between 3-7 years while 22.22% had stayed for a
period between 4-7 years. 19.4% of the respondents had stayed in the organization for 1-12 months while 16.31% have
stayed in the organization for 4-12 years. The results show that 11.4% of the respondents had stayed at the organization
for 13 years and above.
JOB DESIGNATION:
The study sought to determine the designation of the respondents in the organization. The results yielded show that most
of the respondents (39.5%) were Mid-Level Management, 34.2% of the respondents were Low Level Management and
26.3% of the participants were Top Level Management. The following table represents the distribution of the designation
of the participants. The results are as shown in the table below
Table: Position of the Respondents in the Organization
Designation Frequency Percentage
Top Level Management 23 26.3
Mid-Level Management 35 39.5
Low Level Management 29 34.2
Total 87 100.0
Product Returns and Operational Performance
The study sought to determine the extent to which product return influence the operational performance of Bata Shoe
Company. The response was rated on a scale of 1-5 on which: 1= No at all, 2= Low extent, 3= Moderate extent, 4= Great
extent and 5=Very Great extent. The responses are as shown in the table below:
ISSN 2348-3156 (Print)
International Journal of Social Science and Humanities Research ISSN 2348-3164 (online) Vol. 5, Issue 2, pp: (564-578), Month: April - June 2017, Available at: www.researchpublish.com
Page | 571 Research Publish Journals
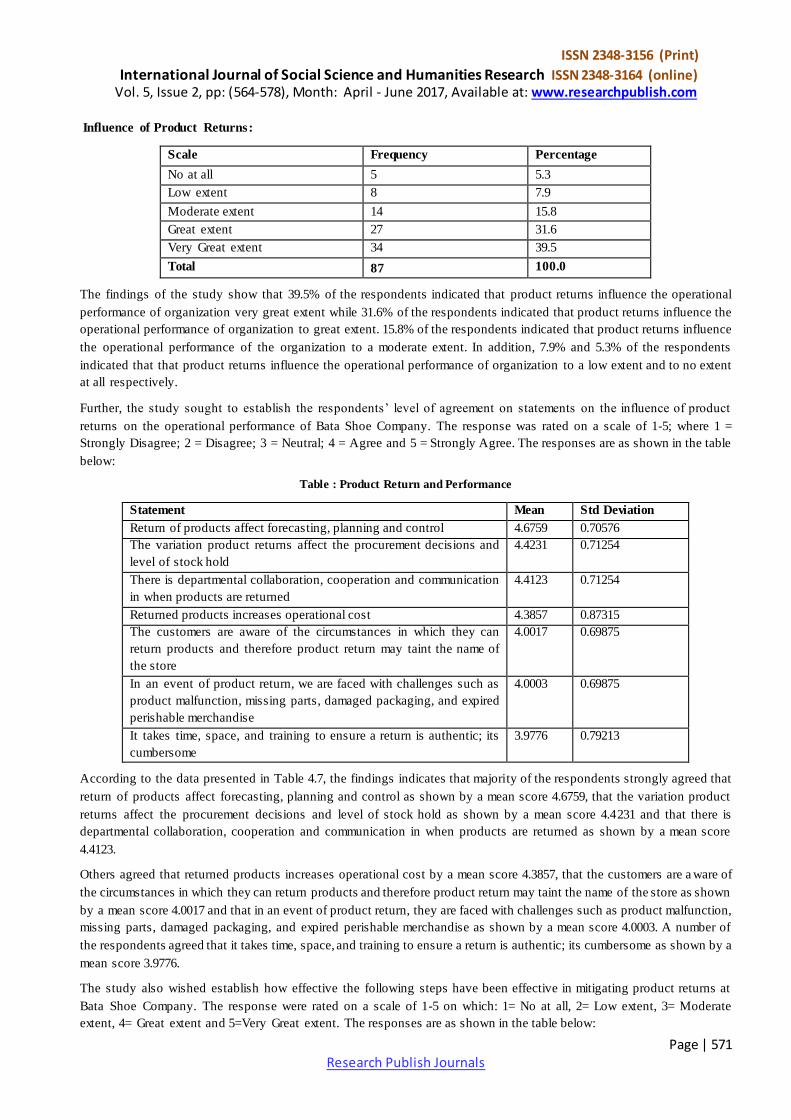
Influence of Product Returns:
Scale Frequency Percentage
No at all 5 5.3
Low extent 8 7.9
Moderate extent 14 15.8
Great extent 27 31.6
Very Great extent 34 39.5
Total 87 100.0
The findings of the study show that 39.5% of the respondents indicated that product returns influence the operational
performance of organization very great extent while 31.6% of the respondents indicated that product returns influence the
operational performance of organization to great extent. 15.8% of the respondents indicated that product returns influence
the operational performance of the organization to a moderate extent. In addition, 7.9% and 5.3% of the respondents
indicated that that product returns influence the operational performance of organization to a low extent and to no extent
at all respectively.
Further, the study sought to establish the respondents‟ level of agreement on statements on the influence of product
returns on the operational performance of Bata Shoe Company. The response was rated on a scale of 1-5; where 1 =
Strongly Disagree; 2 = Disagree; 3 = Neutral; 4 = Agree and 5 = Strongly Agree. The responses are as shown in the table
below:
Table : Product Return and Performance
Statement Mean Std Deviation
Return of products affect forecasting, planning and control 4.6759 0.70576
The variation product returns affect the procurement decisions and
level of stock hold
4.4231 0.71254
There is departmental collaboration, cooperation and communication
in when products are returned
4.4123 0.71254
Returned products increases operational cost 4.3857 0.87315
The customers are aware of the circumstances in which they can
return products and therefore product return may taint the name of
the store
4.0017 0.69875
In an event of product return, we are faced with challenges such as
product malfunction, missing parts, damaged packaging, and expired
perishable merchandise
4.0003 0.69875
It takes time, space, and training to ensure a return is authentic; its
cumbersome
3.9776 0.79213
According to the data presented in Table 4.7, the findings indicates that majority of the respondents strongly agreed that
return of products affect forecasting, planning and control as shown by a mean score 4.6759, that the variation product
returns affect the procurement decisions and level of stock hold as shown by a mean score 4.4231 and that there is
departmental collaboration, cooperation and communication in when products are returned as shown by a mean score
4.4123.
Others agreed that returned products increases operational cost by a mean score 4.3857, that the customers are a ware of
the circumstances in which they can return products and therefore product return may taint the name of the store as shown
by a mean score 4.0017 and that in an event of product return, they are faced with challenges such as product malfunction,
missing parts, damaged packaging, and expired perishable merchandise as shown by a mean score 4.0003. A number of
the respondents agreed that it takes time, space, and training to ensure a return is authentic; its cumbersome as shown by a
mean score 3.9776.
The study also wished establish how effective the following steps have been effective in mitigating product returns at
Bata Shoe Company. The response were rated on a scale of 1-5 on which: 1= No at all, 2= Low extent, 3= Moderate
extent, 4= Great extent and 5=Very Great extent. The responses are as shown in the table below:
ISSN 2348-3156 (Print)
International Journal of Social Science and Humanities Research ISSN 2348-3164 (online) Vol. 5, Issue 2, pp: (564-578), Month: April - June 2017, Available at: www.researchpublish.com
Page | 572 Research Publish Journals
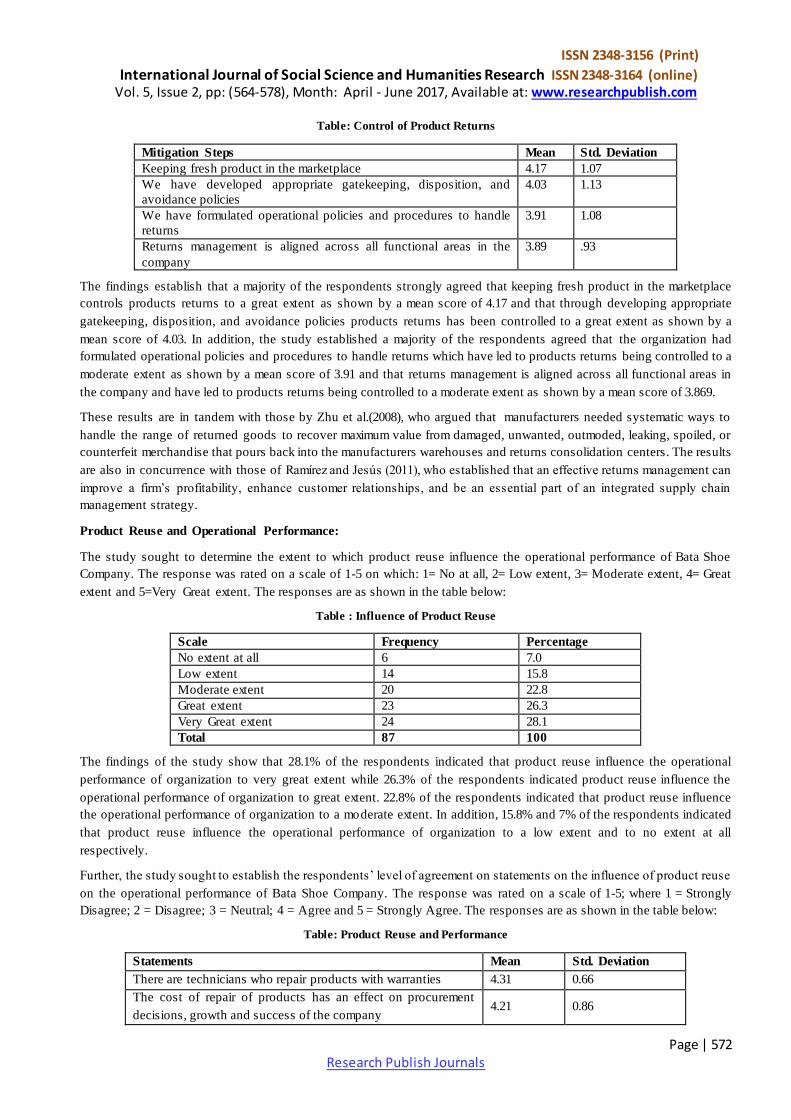
Table: Control of Product Returns
Mitigation Steps Mean Std. Deviation
Keeping fresh product in the marketplace 4.17 1.07
We have developed appropriate gatekeeping, disposition, and
avoidance policies
4.03 1.13
We have formulated operational policies and procedures to handle
returns
3.91 1.08
Returns management is aligned across all functional areas in the
company
3.89 .93
The findings establish that a majority of the respondents strongly agreed that keeping fresh product in the marketplace
controls products returns to a great extent as shown by a mean score of 4.17 and that through developing appropriate
gatekeeping, disposition, and avoidance policies products returns has been controlled to a great extent as shown by a
mean score of 4.03. In addition, the study established a majority of the respondents agreed that the organization had
formulated operational policies and procedures to handle returns which have led to products returns being controlled to a
moderate extent as shown by a mean score of 3.91 and that returns management is aligned across all functional areas in
the company and have led to products returns being controlled to a moderate extent as shown by a mean score of 3.869.
These results are in tandem with those by Zhu et al.(2008), who argued that manufacturers needed systematic ways to
handle the range of returned goods to recover maximum value from damaged, unwanted, outmoded, leaking, spoiled, or
counterfeit merchandise that pours back into the manufacturers warehouses and returns consolidation centers. The results
are also in concurrence with those of Ram rez and es s (2011), who established that an effective returns management can
improve a firm‟s profitability, enhance customer relationships, and be an essential part of an integrated supply chain
management strategy.
Product Reuse and Operational Performance:
The study sought to determine the extent to which product reuse influence the operational performance of Bata Shoe
Company. The response was rated on a scale of 1-5 on which: 1= No at all, 2= Low extent, 3= Moderate extent, 4= Great
extent and 5=Very Great extent. The responses are as shown in the table below:
Table : Influence of Product Reuse
Scale Frequency Percentage
No extent at all 6 7.0
Low extent 14 15.8
Moderate extent 20 22.8
Great extent 23 26.3
Very Great extent 24 28.1
Total 87 100
The findings of the study show that 28.1% of the respondents indicated that product reuse influence the operational
performance of organization to very great extent while 26.3% of the respondents indicated product reuse influence the
operational performance of organization to great extent. 22.8% of the respondents indicated that product reuse influence
the operational performance of organization to a moderate extent. In addition, 15.8% and 7% of the respondents indicated
that product reuse influence the operational performance of organization to a low extent and to no extent at all
respectively.
Further, the study sought to establish the respondents‟ level of agreement on statements on the influence of product reuse
on the operational performance of Bata Shoe Company. The response was rated on a scale of 1-5; where 1 = Strongly
Disagree; 2 = Disagree; 3 = Neutral; 4 = Agree and 5 = Strongly Agree. The responses are as shown in the table below:
Table: Product Reuse and Performance
Statements Mean Std. Deviation
There are technicians who repair products with warranties 4.31 0.66
The cost of repair of products has an effect on procurement
decisions, growth and success of the company 4.21 0.86
ISSN 2348-3156 (Print)
International Journal of Social Science and Humanities Research ISSN 2348-3164 (online) Vol. 5, Issue 2, pp: (564-578), Month: April - June 2017, Available at: www.researchpublish.com
Page | 573 Research Publish Journals
Product return for repair has an effect on the costs of products
and customer service standards 4.17 .89
Faulty goods are sent back to local manufacturers for
remanufacturing 4.00 0.96
There exists adequate institutional policies supporting recycling
of products 3.86 0.79
We have a policy for products return when they reach their end
of useful life 3.76 0.74
The findings establish that a majority of the respondents strongly agreed with the statement that there are technicians who
repair products with warranties as shown by a mean score of 4.31, that the cost of repair of products has an effect on
procurement decisions, growth and success of the of the company as shown by a mean score of 4.21 and that product
reuse for repair has an effect on the costs of products and customer service standards as shown by a mean s core of 4.17.
In addition, the study established that a majority of the respondents agreed most of the faulty goods are sent back to local
manufacturers for remanufacturing as shown by a mean score of 4.00 and that there exists adequate institutional policies
supporting recycling of products as shown by a mean score of 3.79. Moreover, a majority of the respondents were n eutral
about the statement that the company having established policy for products return when they reach their end of useful
life as shown by a mean score of 3.76.
The results yielded from the study are in line with those obtained from a study by Byrne and Deeb (2007) who established
that the need to recycle post-consumer materials requires manufacturers to understand reverse logistics or the
management of the logistics of return flows from the user to a recovery facility and finally into the production of a usable
product. The results validate the finding of Melnyk et al.(2009), who suggest that firms may be motivated employ product
reuse because of their own environmental awareness or because of governmental and consumer pressure. The study also
found that effective product reuse techniques have an impact on increasing mix production efficiency and product route
efficiency which will meet customer demands and enhance the brand image of the firm.
Product Repackaging and Operational Performance:
The study sought to determine the extent to which product repackaging influence the operational performance of Bata
Shoe Company. The response was rated on a scale of 1-5 on which: 1= No at all, 2= Low extent, 3= Moderate extent, 4=
Great extent and 5=Very Great extent. The responses are as shown in the table below:
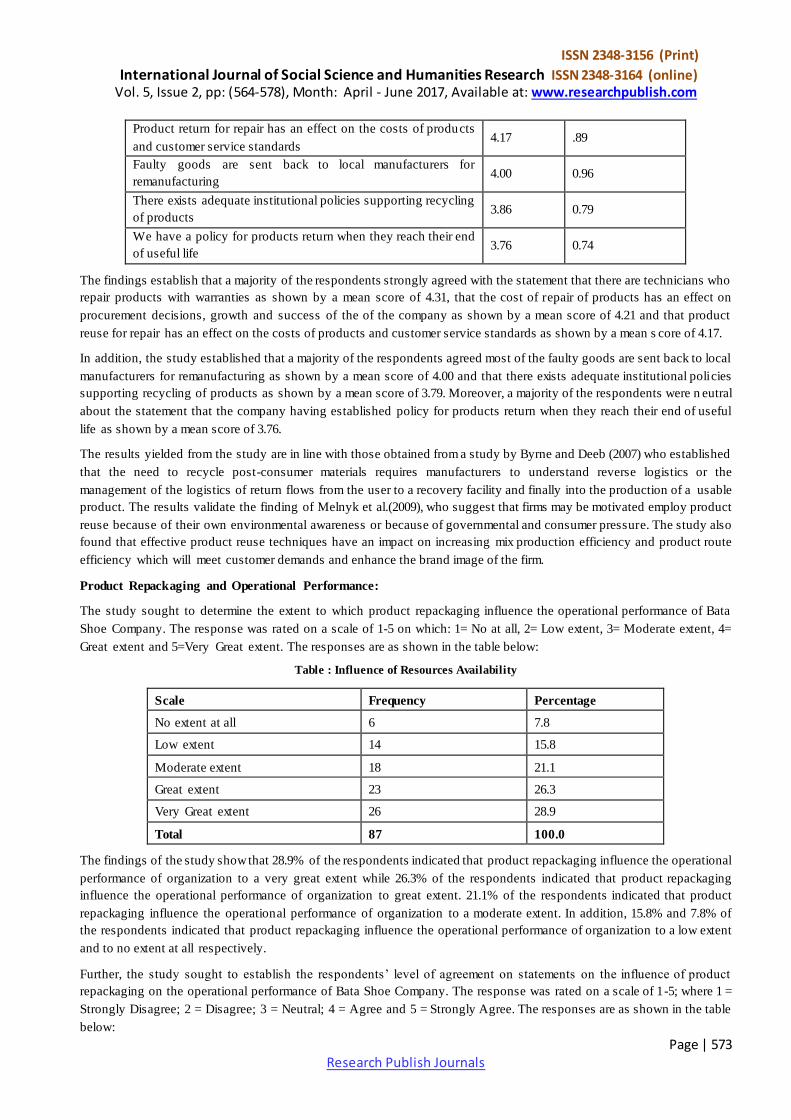
Table : Influence of Resources Availability
Scale Frequency Percentage
No extent at all 6 7.8
Low extent 14 15.8
Moderate extent 18 21.1
Great extent 23 26.3
Very Great extent 26 28.9
Total 87 100.0
The findings of the study show that 28.9% of the respondents indicated that product repackaging influence the operational
performance of organization to a very great extent while 26.3% of the respondents indicated that product repackaging
influence the operational performance of organization to great extent. 21.1% of the respondents indicated that product
repackaging influence the operational performance of organization to a moderate extent. In addition, 15.8% and 7.8% of
the respondents indicated that product repackaging influence the operational performance of organization to a low extent
and to no extent at all respectively.
Further, the study sought to establish the respondents‟ level of agreement on statements on the influence of product
repackaging on the operational performance of Bata Shoe Company. The response was rated on a scale of 1-5; where 1 =
Strongly Disagree; 2 = Disagree; 3 = Neutral; 4 = Agree and 5 = Strongly Agree. The responses are as shown in the table
below:
ISSN 2348-3156 (Print)
International Journal of Social Science and Humanities Research ISSN 2348-3164 (online) Vol. 5, Issue 2, pp: (564-578), Month: April - June 2017, Available at: www.researchpublish.com
Page | 574 Research Publish Journals
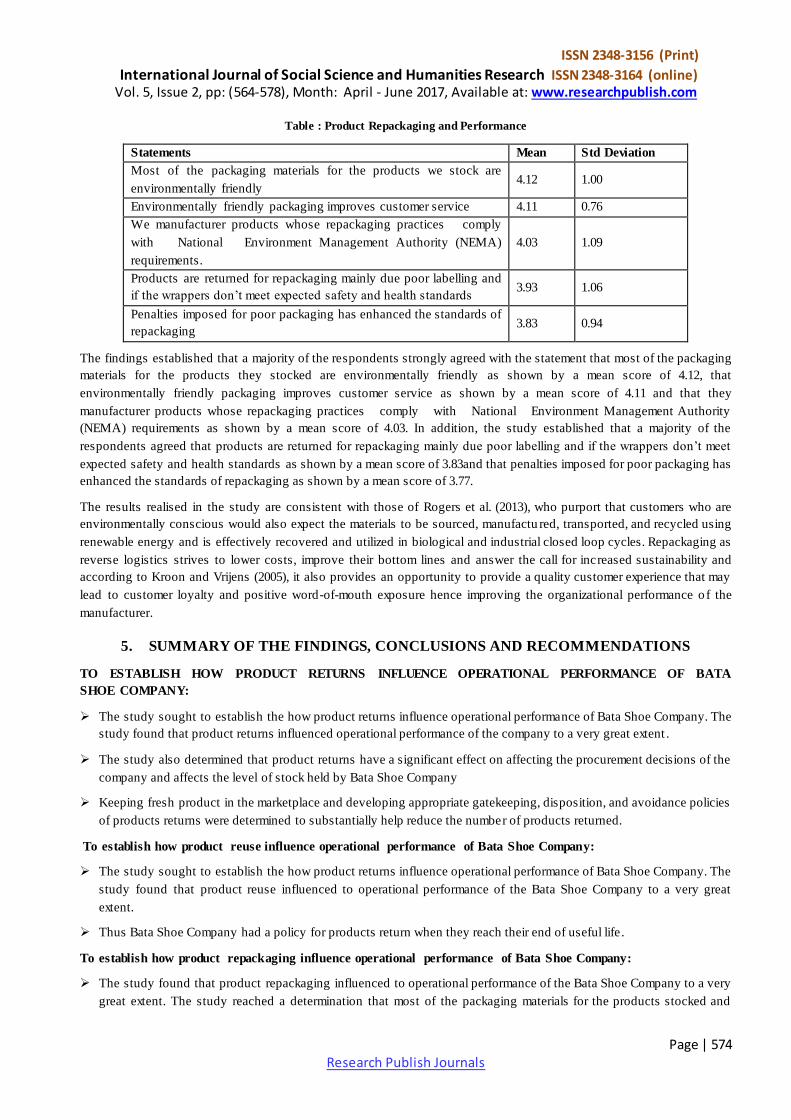
Table : Product Repackaging and Performance
Statements Mean Std Deviation
Most of the packaging materials for the products we stock are
environmentally friendly 4.12 1.00
Environmentally friendly packaging improves customer service 4.11 0.76
We manufacturer products whose repackaging practices comply
with National Environment Management Authority (NEMA)
requirements.
4.03 1.09
Products are returned for repackaging mainly due poor labelling and
if the wrappers don‟t meet expected safety and health standards 3.93 1.06
Penalties imposed for poor packaging has enhanced the standards of
repackaging 3.83 0.94
The findings established that a majority of the respondents strongly agreed with the statement that most of the packaging
materials for the products they stocked are environmentally friendly as shown by a mean score of 4.12, that
environmentally friendly packaging improves customer service as shown by a mean score of 4.11 and that they
manufacturer products whose repackaging practices comply with National Environment Management Authority
(NEMA) requirements as shown by a mean score of 4.03. In addition, the study established that a majority of the
respondents agreed that products are returned for repackaging mainly due poor labelling and if the wrappers don‟t meet
expected safety and health standards as shown by a mean score of 3.83and that penalties imposed for poor packaging has
enhanced the standards of repackaging as shown by a mean score of 3.77.
The results realised in the study are consistent with those of Rogers et al. (2013), who purport that customers who are
environmentally conscious would also expect the materials to be sourced, manufactu red, transported, and recycled using
renewable energy and is effectively recovered and utilized in biological and industrial closed loop cycles. Repackaging as
reverse logistics strives to lower costs, improve their bottom lines and answer the call for increased sustainability and
according to Kroon and Vrijens (2005), it also provides an opportunity to provide a quality customer experience that may
lead to customer loyalty and positive word-of-mouth exposure hence improving the organizational performance o f the
manufacturer.
5. SUMMARY OF THE FINDINGS, CONCLUSIONS AND RECOMMENDATIONS
TO ESTABLISH HOW PRODUCT RETURNS INFLUENCE OPERATIONAL PERFORMANCE OF BATA
SHOE COMPANY:
The study sought to establish the how product returns influence operational performance of Bata Shoe Company. The
study found that product returns influenced operational performance of the company to a very great extent .
The study also determined that product returns have a significant effect on affecting the procurement decisions of the
company and affects the level of stock held by Bata Shoe Company
Keeping fresh product in the marketplace and developing appropriate gatekeeping, disposition, and avoidance policies
of products returns were determined to substantially help reduce the number of products returned.
To establish how product reuse influence operational performance of Bata Shoe Company:
The study sought to establish the how product returns influence operational performance of Bata Shoe Company. The
study found that product reuse influenced to operational performance of the Bata Shoe Company to a very great
extent.
Thus Bata Shoe Company had a policy for products return when they reach their end of useful life.
To establish how product repackaging influence operational performance of Bata Shoe Company:
The study found that product repackaging influenced to operational performance of the Bata Shoe Company to a very
great extent. The study reached a determination that most of the packaging materials for the products stocked and
ISSN 2348-3156 (Print)
International Journal of Social Science and Humanities Research ISSN 2348-3164 (online) Vol. 5, Issue 2, pp: (564-578), Month: April - June 2017, Available at: www.researchpublish.com
Page | 575 Research Publish Journals
manufactured were environmentally friendly and that environmentally friendly packaging serves to improve customer
service.
Bata Shoe Company was found to manufacturer products whose repackaging practices comply with National
Environment Management Authority (NEMA) requirements.
CONCLUSIONS:
To this objective the study concludes product returns influence operational performance of Bata Shoe Company to a
very great extent.
The study also concluded that Bata Shoe Company needed to encourage departmental collaboration, cooperation and
communication in order to create an environment where products returns influence on its operations can be
minimized.
Moreover, the study concluded that as show of good faith more information about the right of a customer to return
products should be fashioned out to consumers of Bata Shoe Company products.
Further, the study sought to investigate the influence of product reuse on the operational performance of Bata Shoe
Company.
To this objective the study concludes product reuse influence operational performance of Bata Shoe Company to a
very great extent. The study reached a conclusion that the cost of repair products so that they can be used as parts of
other new products had a substantive effect on procurement decisions, growth and success of the company
In addition, the study concluded that most of products of Bata Shoe Company that are returned as faulty goods, are
often sent back to for remanufacturing.
The study also concluded that the institutional policies supporting recycling and re using of products was inadequate
and needed to be bolstered.
The study concluded that Bata Shoe Company packaging policies are environmentally friendly and most of the
packaging materials for their products are environmentally friendly . Environmentally friendly packaging was
established in the study to contribute to better customer service. Another important conclusion reached by the study
was that repackaging practices of Bata Shoe Company comply with National Environment Management Authority
(NEMA) requirements
RECOMMENDATIONS:
The way an organization handles reverse logistics process is also important not only in determining the success of the
adoption but also its influence in the supply chain. As such firms should try as much as possible to tailor make their
processes to best suit their unique needs, they should address reverse logistics issues preferably with technologies they
have developed and create their own systems and procedures to handle returns considering an overlap bet ween the
consumers‟ needs and those of the organization.
The study also recommend that, Bata Shoe Company should establish lines for return of old and used products
especially the recyclable. For the recyclable, the company will ensure that it reduces dumping and thus serve to
conserve the environment. Also these lines will allow in extending the useful life of the products through repair that
restores product functionality
From the research findings it was established that that reverse logistics has a sign ificant impact on operational
performance of an organization; whether this impact is positive or negative depends on the success of its adoption and
implementation. The respective organizations should therefore continually assess their reverse logistics ap proaches
periodically and make the necessary corrective measures to ensure that they reap the maximum benefits of its adoption
RECOMMENDATION FOR FURTHER STUDIES:
This study sought to establish the relationship that exists between reverse logistics and o perational performance of
Bata Shoe Company in Nairobi, Kenya.
ISSN 2348-3156 (Print)
International Journal of Social Science and Humanities Research ISSN 2348-3164 (online) Vol. 5, Issue 2, pp: (564-578), Month: April - June 2017, Available at: www.researchpublish.com
Page | 576 Research Publish Journals
The study establishes that reverse logistics is adopted haphazardly and therefore the company has not achieved the full
benefits. The researcher suggests that a similar study be conducted on o ther forms of business in different sectors for
comparison of results.
The study should also cover a larger scope as this study only concentrated on Nairobi County only.
REFERENCES
[1] Achieng, O. S. (2011). Information Integration on Supply Chain Management: A Case Study of Food Processing
Firms in Kenya. (Unpublished Doctoral dissertation), School Of Business, University Of Nairobi, Nairobi.
[2] Badenhorst, A. (2013). A framework for prioritising practices to overcome cost-related problems in reverse logistics.
Journal Of Transport And Supply Chain Management , 7(1), 56 – 78.
[3] Baxter, P., & Jack, S. (2008). Qualitative case study methodology: Study design and implementation for novice
researchers. The qualitative report, 13(4), 544-559.
[4] Bowersox, D. J., Closs, D. J., & Cooper, M. B. (2002). Supply chain logistics management (2nd
Ed.). New York,
NY: McGraw-Hill.
[5] Bridget, S., & Lewin, C. (2005). Research methods in the social sciences. New Delhi: McGraw-Hill.
[6] Brito, M., & Dekker, R. (2003). A Framework for Reverse Logistics. ERIM Report Series Research in Management ,
(ERS-2003-045-LIS).
[7] Byrne, P. M., & Deeb, A. (2003). Logistics must meet the "Green" challenge. Transportation & Distribution , 6(1),
67 – 79.
[8] Chaves, G. L. D., & Alcântara, R. L. C. (2006). Reverse logistics and the relation between industry and retail in the
after-sale reverse flow management. In Third International Conference on Production Research-Americas’ Region
(1-14).
[9] Cooper, D. R., Schindler, P. S., & Sun, J. (2003). Business research methods. New York, NY: McGraw-Hill.
[10] Cronbach, L. J., & Thorndike, R. L. (1971). Educational measurement. Test validation. New York, NY: Wiley.
[11] David, K. G., & Shalle, N. (2014). An Assessment of the Effects of Reverse Logistics Adoption on Supply Chain
Performance in the Manufacturing Sector in Kenya: A Caseof Hewlett-Packard Kenya. European Journal of
Business Management, 2(1), 161-173.
[12] David, K. G., & Shalle, N. (2014). An assessment of the effects of reverse logistics adoption on supply chain
performance in the manufacturing sector in Kenya: A Case of Hewlett-Packard Kenya. European Journal of
Business Management, 2(1), 161-173.
[13] Dekker, R., Fleischmann, M., Inderfurth, K., & van Wassenhove, L. N. (Eds.). (2013). Reverse logistics:
Quantitative models for closed-loop supply chains. Springer Science & Business Media.
[14] Dictionary, A. P. I. C. S. (2005). American production and inventory control society. Falls Church, VA.
[15] Dietrich, M., & Krafft, J. (Eds.). (2012). Handbook on the economics and theory of the firm. New York: Edward
Elgar Publishing.
[16] Doug, P. E. (2010). Effective operations performance management. Strategic Framework for Success. 8(1), 23-46.
[17] El-Nakib, I. (2012, March). Reverse logistics: A comparison of electronic waste recycling between Switzerland and
Egypt. In Global Conference on Operations and Supply Chain Management -GCOM.
[18] Elmas, G., Erdoğmuş, F. (2011). The importance of reverse logistics. International Journal of business and
management studies, 3(1), 165-169.
[19] Eltayeb, T. K., Zailani, S., & Ramayah, T. (2011). Green supply chain initiatives among certified companies in
Malaysia and environmental sustainability: Investigating the outcomes . Resources, Conservation and Recycling,
55(5), 495-506.
ISSN 2348-3156 (Print)
International Journal of Social Science and Humanities Research ISSN 2348-3164 (online) Vol. 5, Issue 2, pp: (564-578), Month: April - June 2017, Available at: www.researchpublish.com
Page | 577 Research Publish Journals
[20] Fernández, I., & Kekäle, T. (2005). The influence of modularity and industry clockspeed on reverse logistics
strategy: implications for the purchasing function. Journal of Purchasing and Supply Management , 11(4), 193-205.
[21] Fleischmann, M., Bloemhof-Ruwaard, J. M., Dekker, R., Van der Laan, E., Van Nunen, J. A., & Van Wassenhove,
L. N. (2007). Quantitative models for reverse logistics: A review. European journal of operational research , 103(1),
1-17.
[22] Frederick, F. R., & Thomas, T. E. A. L. (2006). The loyalty effect: the hidden force behind growth, profits, and
lasting value. Boston, Massachusetts: Harvard Business School Press.
[23] Gold, S., Seuring, S., & Beske, P. (2010). Sustainable supply chain management and inter‐organizational resources:
a literature review. Corporate social responsibility and environmental management , 17(4), 230-245.
[24] Greeff, G., & Ghoshal, R. (2004). Practical E-manufacturing and supply chain management . Amsterdam: Newnes.
[25] Greve, C., & Davis, J. (2012). Recovering lost profits by improving reverse logistics. White paper, 1-17.
[26] Huscroft, K., (2010). The Reverse Logistics Process in the Supply Chain and Managing Its Implementation .
(Unpublished doctoral dissertation) Auburn University: Auburn, Alabama.
[27] Jack, E. P., Powers, T. L., & Skinner, L. (2010). Reverse logistics capabilities: antecedents and cost savings.
International Journal of Physical Distribution & Logistics Management , 40(3), 228-246.
[28] Kenya Association of Manufacturers. (2014). Kenya Manufacturers and Exporters Directory (10th
ed.).
Nairobi, Kenya: Adafric Communications Limited.
[29] Ketchen, D. J., & Giunipero, L. C. (2004). The intersection of strategic management and supply chain
management. Industrial Marketing Management, 33(1), 51-56.
[30] Khor, K. & Udin, Z. (2012). Impact of Reverse Logistics Product Disposition towards Business Performance in
Malaysian E&E Companies. JSCCRM, 1-19
[31] Kimani, D. (2011). Green Supply Chain Practices in the Retail Sector in Kenya . (Unpublished master‟s
dissertation), Daystar University: Nairobi.
[32] Lamming, R. (2005). Strategic procurement management in the 1990s: Concepts and Cases . Stamford, CT:
Earlsgate Press.
[33] Laosirihongthong, T., Adebanjo, D. & Tan, K. C. (2013). Green supply chain management pract ices and
performance. Industrial Management & Data Systems, 113(8), 1088- 1109.
[34] Lee, J., Gen, M., & Rhee, K. (2009). Network model and optimization of reverse logistics by hybrid genetic
algorithm. Computers & Industrial Engineering , 56(3), 951-964.
[35] Mageto, J. N. (2009). Relationship between Supply Chain Performance and Supply Chain Responsiveness: A Survey
of Supermarkets in Nairobi, Kenya . (Unpublished MBA project) University of Nairobi: Nairobi.
[36] Miri-Lavassani, K., Movahedi, B., & Kumar, V. (2009). Developments in theories of supply chain management: The
case of B2B electronic marketplace adoption. International Journal of Knowledge, Culture and Change
Management, 9(6), 85-98.
[37] Morash, E. A., & Lynch, D. F. (2002). Public policy and global supply chain cap abilities and performance: a
resource-based view. Journal of International Marketing , 10(1), 25-51.
[38] Mugenda, O. M. (1999). Research methods: Quantitative and qualitative approaches . Nairobi: African Centre for
Technology Studies.
[39] Mugenda, O. M., & Mugenda, A. G (2003). Research Methods, Quantitative & Qualitative Approaches. Nairobi:
Acts Press.
[40] Muma, B. O., Nyaoga, R. B., Matwere, R. B., & Nyambega, E. (2014). Green supply chain management and
environmental performance among tea processing firms in Kericho County-Kenya. International Journal of
Economics, Finance and Management Sciences, 2(5), 270-276.
ISSN 2348-3156 (Print)
International Journal of Social Science and Humanities Research ISSN 2348-3164 (online) Vol. 5, Issue 2, pp: (564-578), Month: April - June 2017, Available at: www.researchpublish.com
Page | 578 Research Publish Journals
[41] Neven, D., & Reardon, T. (2004). The rise of Kenyan supermarkets and the evolution of their horticulture product
procurement systems. Development policy review, 22(6), 669-699.
[42] Ninlawan, C., Seksan, P., Tossapol, K., & Pilada, W. (2010, March). The implementation of green supply chain
management practices in electronics industry. In Proceedings of the international multiconference of engineers and
computer scientists, 3, 17-19.
[43] Omonge, W. O. (2012). Green supply chain management practices and competitiveness of commercial banks in
Kenya.(Unpublished doctoral dissertation) University of Nairobi. Nairobi.
[44] Orodho, A. J., & Kombo, D. K. (2002). Research methods. Nairobi: Kenyatta University Press.
[45] Orodho, J. A. (2009). Principles of Research Methods. Nairobi: Acts Press.
[46] Oso, W. K. & Onen, D. (2011): A General guide to writing research proposals and report. (2nd
ed.). Kampala:
Makerere University.
[47] Partida, B. (2011). Leaders show power of reverse logistics. Supply Chain Management Review, 15(6), 62-64.
[48] Pollock, W. K. (2007). Using Reverse Logistics to Enhance Customer Service and Competitive
Performance. Reverse Logistics Magazine, 1(5), 12-16.
[49] Price Water House Coopers (2008). How to realize an agile and efficient reverse chain within the Consumer
Electronics Industry. Price Water House Coopers.
[50] Reardon, T., Timmer, C.P., Barrett, C.B., & Berdegue, J. (2003). The Rise of Supermarkets in Africa, Asia, and
Latin America. American Journal of Agricultural Economics, 85 (5), 1140-1146.
[51] Rogers, D. S., & Tibben-Lembke, R. S. (1999). Going backwards: reverse logistics trends and practices (2nd
Ed.).
Pittsburgh, PA: Reverse Logistics Executive Council.
[52] Rogers, D. S., Rogers, Z. S., & Lembke, R. (2010). Creating value through product stewardship and take-
back. Sustainability Accounting, Management and Policy Journal , 1(2), 133-160.
[53] Rugman, A. M., & Verbeke, A. (2002). Edith Penrose's contribution to the resource ‐based view of strategic
management. Strategic management journal, 23(8), 769-780.
[54] Saunders, M. L. (1987). P. & Thornhill, A. (2009). (2009) Journal of Marketing Management , 25 (9-10) , pp. 927-
939
[55] Taylor, E. W., & Cranton, P. (2012). The handbook of transformative learning: Theory, research, and practice. San
Fransisco, CA: John Wiley & Sons.
[56] Turrisi, M., Bruccoleri, M., Cannella, S. (2013). Impact of reverse logistics on supply chain performance.
International Journal of Physical Distribution , 43, 45-98.
[57] Wang, P., Zhou, G., & Ren, J. (2010). Research on structure of reverse logistics network. In International
Conference of Logistics Engineering and Management 2010 (336-362).
[58] Wei, S., Tang, O., & Sundin, E. (2015). Core (product) Acquisition Management for remanufacturing: a review.
Journal Of Remanufacturing, 5(1), 45- 61.
[59] Wirtz, B. W., Pelz, R., & Ullrich, S. (2011). Marketing competencies of publishers and ad sales success: An
empirical analysis. Journal of Media Business Studies, 8(1), 23-46.
[60] Wu, F., Yeniyurt, S., Kim, D., & Cavusgil, S. T. (2006). The impact of information technology on supply chain
capabilities and firm performance: A resource-based view. Industrial Marketing Management, 35(4), 493-504.
[61] Zhu, Q., Sarkis, J., Cordeiro, J.J.& Lai, K. (2008b), Firm level correlates of emergent green supply chain
management practices in the Chinese context, Omega – The International Journal of Management Science, 36(4),
577-91.