Embed Size (px)
Citation preview

Effect of Selection Pressure with Temozolomide on Cripto-1 Expression in Glioblastoma In Vitro Models
Cansu Yener 9th and 10th Semester - Master Thesis
Biomedicine, Department of Health and Science & Technology Aalborg University, Spring 2018

Page 2 of 46
Title: Effect of Selection Pressure with Temozolomide on Cripto-1 Expression in
Glioblastoma In Vitro Models
Project group: 9044
Semester: 9th and 10th Semester Master Thesis – Biomedicine, Aalborg University
Project period: September 2017 – May 2018
Author:
Supervisor: Linda Pilgaard Associate Professor
Pages: 42 pages
Appendix: 4 pages
Medicine with Industrial Specialization - Biomedicine Department of Health Science and Technology
Aalborg University - Frederik Bajers Vej 7 9220 Aalborg Denmark
Page 3 of 46
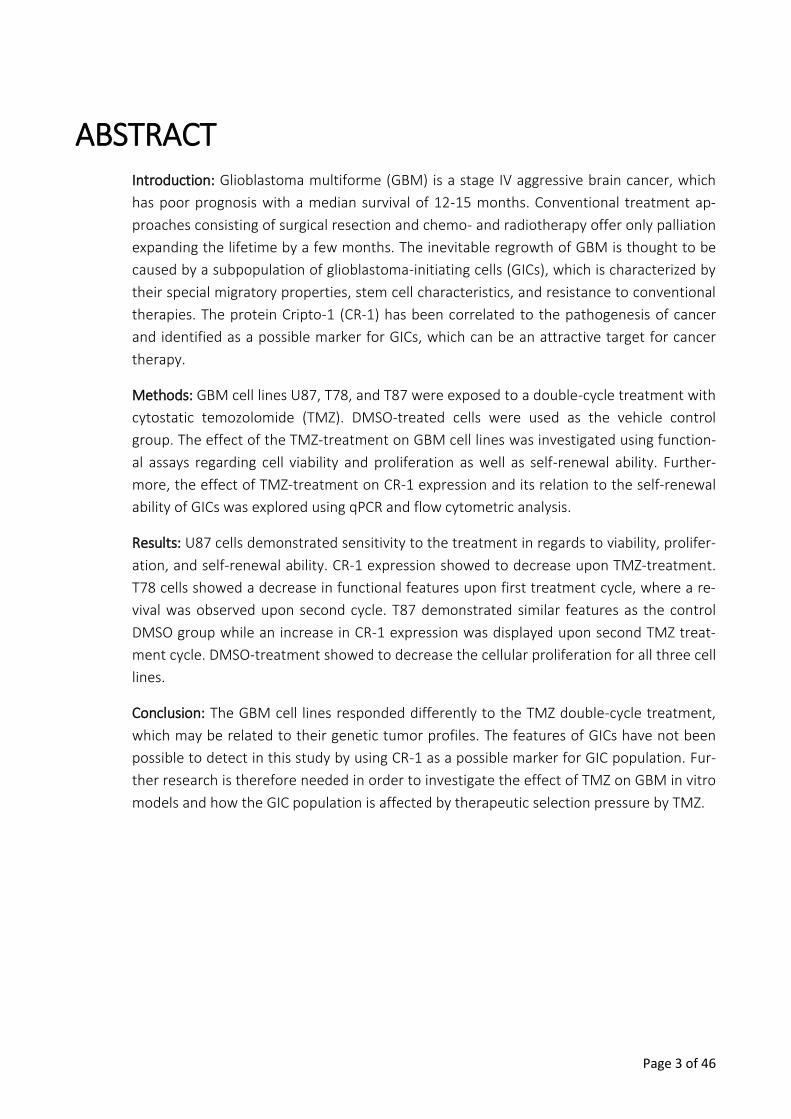
ABSTRACT Introduction: Glioblastoma multiforme (GBM) is a stage IV aggressive brain cancer, which
has poor prognosis with a median survival of 12-15 months. Conventional treatment ap-
proaches consisting of surgical resection and chemo- and radiotherapy offer only palliation
expanding the lifetime by a few months. The inevitable regrowth of GBM is thought to be
caused by a subpopulation of glioblastoma-initiating cells (GICs), which is characterized by
their special migratory properties, stem cell characteristics, and resistance to conventional
therapies. The protein Cripto-1 (CR-1) has been correlated to the pathogenesis of cancer
and identified as a possible marker for GICs, which can be an attractive target for cancer
therapy.
Methods: GBM cell lines U87, T78, and T87 were exposed to a double-cycle treatment with
cytostatic temozolomide (TMZ). DMSO-treated cells were used as the vehicle control
group. The effect of the TMZ-treatment on GBM cell lines was investigated using function-
al assays regarding cell viability and proliferation as well as self-renewal ability. Further-
more, the effect of TMZ-treatment on CR-1 expression and its relation to the self-renewal
ability of GICs was explored using qPCR and flow cytometric analysis.
Results: U87 cells demonstrated sensitivity to the treatment in regards to viability, prolifer-
ation, and self-renewal ability. CR-1 expression showed to decrease upon TMZ-treatment.
T78 cells showed a decrease in functional features upon first treatment cycle, where a re-
vival was observed upon second cycle. T87 demonstrated similar features as the control
DMSO group while an increase in CR-1 expression was displayed upon second TMZ treat-
ment cycle. DMSO-treatment showed to decrease the cellular proliferation for all three cell
lines.
Conclusion: The GBM cell lines responded differently to the TMZ double-cycle treatment,
which may be related to their genetic tumor profiles. The features of GICs have not been
possible to detect in this study by using CR-1 as a possible marker for GIC population. Fur-
ther research is therefore needed in order to investigate the effect of TMZ on GBM in vitro
models and how the GIC population is affected by therapeutic selection pressure by TMZ.
Page 4 of 46
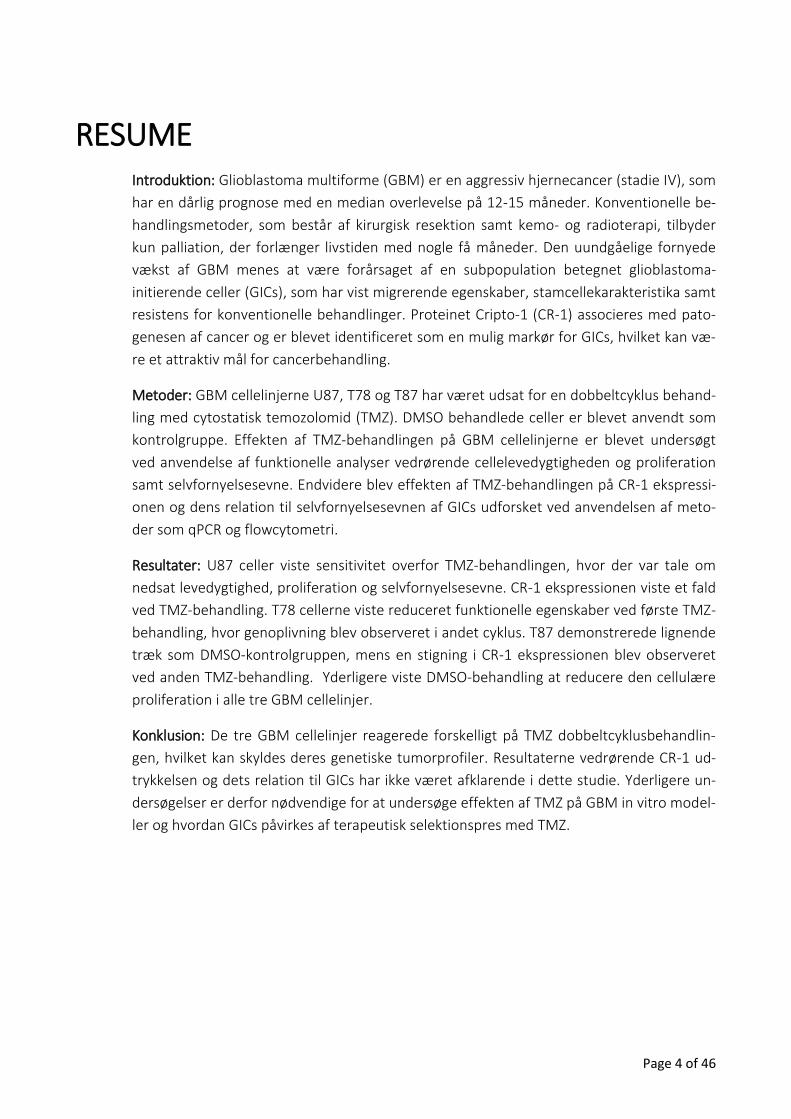
RESUME Introduktion: Glioblastoma multiforme (GBM) er en aggressiv hjernecancer (stadie IV), som
har en dårlig prognose med en median overlevelse på 12-15 måneder. Konventionelle be-
handlingsmetoder, som består af kirurgisk resektion samt kemo- og radioterapi, tilbyder
kun palliation, der forlænger livstiden med nogle få måneder. Den uundgåelige fornyede
vækst af GBM menes at være forårsaget af en subpopulation betegnet glioblastoma-
initierende celler (GICs), som har vist migrerende egenskaber, stamcellekarakteristika samt
resistens for konventionelle behandlinger. Proteinet Cripto-1 (CR-1) associeres med pato-
genesen af cancer og er blevet identificeret som en mulig markør for GICs, hvilket kan væ-
re et attraktiv mål for cancerbehandling.
Metoder: GBM cellelinjerne U87, T78 og T87 har været udsat for en dobbeltcyklus behand-
ling med cytostatisk temozolomid (TMZ). DMSO behandlede celler er blevet anvendt som
kontrolgruppe. Effekten af TMZ-behandlingen på GBM cellelinjerne er blevet undersøgt
ved anvendelse af funktionelle analyser vedrørende cellelevedygtigheden og proliferation
samt selvfornyelsesevne. Endvidere blev effekten af TMZ-behandlingen på CR-1 ekspressi-
onen og dens relation til selvfornyelsesevnen af GICs udforsket ved anvendelsen af meto-
der som qPCR og flowcytometri.
Resultater: U87 celler viste sensitivitet overfor TMZ-behandlingen, hvor der var tale om
nedsat levedygtighed, proliferation og selvfornyelsesevne. CR-1 ekspressionen viste et fald
ved TMZ-behandling. T78 cellerne viste reduceret funktionelle egenskaber ved første TMZ-
behandling, hvor genoplivning blev observeret i andet cyklus. T87 demonstrerede lignende
træk som DMSO-kontrolgruppen, mens en stigning i CR-1 ekspressionen blev observeret
ved anden TMZ-behandling. Yderligere viste DMSO-behandling at reducere den cellulære
proliferation i alle tre GBM cellelinjer.
Konklusion: De tre GBM cellelinjer reagerede forskelligt på TMZ dobbeltcyklusbehandlin-
gen, hvilket kan skyldes deres genetiske tumorprofiler. Resultaterne vedrørende CR-1 ud-
trykkelsen og dets relation til GICs har ikke været afklarende i dette studie. Yderligere un-
dersøgelser er derfor nødvendige for at undersøge effekten af TMZ på GBM in vitro model-
ler og hvordan GICs påvirkes af terapeutisk selektionspres med TMZ.
Page 5 of 46
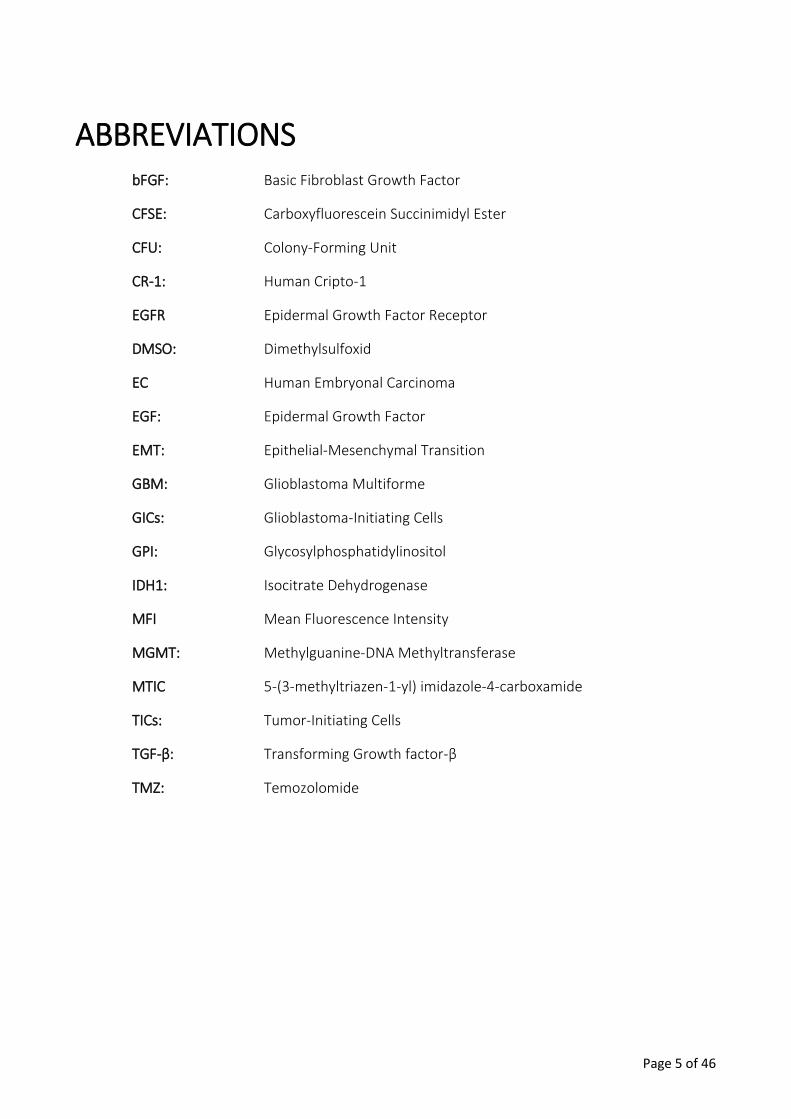
ABBREVIATIONS bFGF: Basic Fibroblast Growth Factor
CFSE: Carboxyfluorescein Succinimidyl Ester
CFU: Colony-Forming Unit
CR-1: Human Cripto-1
EGFR Epidermal Growth Factor Receptor
DMSO: Dimethylsulfoxid
EC Human Embryonal Carcinoma
EGF: Epidermal Growth Factor
EMT: Epithelial-Mesenchymal Transition
GBM: Glioblastoma Multiforme
GICs: Glioblastoma-Initiating Cells
GPI: Glycosylphosphatidylinositol
IDH1: Isocitrate Dehydrogenase
MFI Mean Fluorescence Intensity
MGMT: Methylguanine-DNA Methyltransferase
MTIC 5-(3-methyltriazen-1-yl) imidazole-4-carboxamide
TICs: Tumor-Initiating Cells
TGF-β: Transforming Growth factor-β
TMZ: Temozolomide

Page 6 of 46
TABLE OF CONTENTS 1 – INTRODUCTION ............................................................................................................................................ 7
1.1 – GLIOBLASTOMA MULTIFORME .............................................................................................................. 7
1.2 – TEMOZOLOMIDE ................................................................................................................................... 8
1.3 – GLIOBLASTOMA-INITIATING CELLS AND THE CHEMORESISTANCE THEORY ........................................... 9
1.4 – HUMAN CRIPTO-1 ................................................................................................................................ 10
1.4.1 ROLE OF CRIPTO-1 IN EMBRYONIC DEVELOPMENT ........................................................................ 11
1.4.2 ROLE OF CRIPTO-1 IN ONCOGENIC TRANSFORMATION ................................................................. 12
1.4.3 CRIPTO-1 AS A MARKER FOR GLIOBLASTOMA-INITIATING CELLS ................................................... 13
2 – PURPOSE OF THE STUDY ............................................................................................................................. 14
3 – MATERIALS AND METHODS ........................................................................................................................ 15
3.1 – GBM CELL LINES ................................................................................................................................... 15
3.2 – CELL CULTURE AND TEMOZOLOMIDE TREATMENT ................................................................................ 15
3.3 – GENERATION OF PROLIFERATION CURVES .......................................................................................... 16
3.4 – COLONY-FORMING UNIT ASSAY........................................................................................................... 16
3.5 – DETECTION OF TRANSCRIPTIONAL ACTIVITY ....................................................................................... 17
3.6 – DETECTION OF CELL PROLIFERATION AND CR-1 EXPRESSION .............................................................. 18
3.6.1 – CFSE CELL PROLIFERATION TRACKING ......................................................................................... 18
3.6.2 – DETECTION OF CR-1 EXPRESSION ................................................................................................ 19
3.7 – STATISTICAL ANALYSIS ......................................................................................................................... 19
4 – RESULTS ...................................................................................................................................................... 20
4.1 – MORPHOLOGICAL ANALYSIS OF PRIMARY AND MODEL GBM CELL LINES EXPOSED TO TMZ DOUBLE-
CYCLE TREATMENT ....................................................................................................................................... 20
4.2 – CELL VIABILITY AND PROLIFERATION FOLLOWING TMZ DOUBLE-CYCLE TREATMENT ......................... 22
4.3 – COLONY-FORMING ABILITY OF GBM CELL LINES .................................................................................. 26
4.4 – TRANSCRIPTIONAL ACTIVITY OF THE GENES CCND2, GADD45G, AND CRIPTO-1 AFTER TMZ DOUBLE-
CYCLE TREATMENT ....................................................................................................................................... 28
4.5 – CELL PROLIFERATION TRACKING AND CRIPTO-1 EXPRESSION AFTER TMZ-TREATMENT ..................... 30
5 – DISCUSSION ................................................................................................................................................ 32
6 – CONCLUSION .............................................................................................................................................. 36
7 – FUTURE APPLICATIONS ............................................................................................................................... 37
BIBLIOGRAPHY .................................................................................................................................................. 38
APPENDIX ......................................................................................................................................................... 43
APPENDIX 1 – COLONY-FORMING UNIT (CFU) ASSAY PLATE SETUP ............................................................. 43
APPENDIX 2 – QPCR DATA OUTPUT .............................................................................................................. 44
APPENDIX 3 – FLOW CYTOMETRY DATA OUTPUT ......................................................................................... 46

Page 7 of 46
1 – INTRODUCTION
1.1 – GLIOBLASTOMA MULTIFORME
Glioblastoma multiforme (GBM) is a stage IV aggressive brain cancer, which is the most
common malignant brain tumor of the central nervous system (CNS) (1) . GBM accounts
for approximately 60% of all brain tumors with a median age of 64 and a higher incidence
for men (2,3). The prognosis for GBM is poor with a median survival of 12-15 months. Less
than 5% of the patients survive within 5 years (4).
GBM is characterized by infiltrating surrounding brain tissues leading to tumor growth and
extensive tumor vascularization. Additional GBM characteristics are the presence of ne-
crotic regions surrounded by palisading cells. The grading of GBM is based on pathological
features, which include mitotic activity, nuclear atypia, vascular proliferation, necrosis, and
proliferation potential as well as clinical and treatment outcomes. (3,5) GBM is further cat-
egorized into clinical and molecular subtypes. Clinical subtypes comprise primary and sec-
ondary GBM, where the most common type is primary subtype, which accounts for ap-
proximately 95% of GBM cases. It develops de novo in older patients within 3-6 months. In
contrast to the primary subtype, secondary GBM is seen dominantly in younger patients
and develops over 10-15 years from prior low-grade astrocytomas. The two groups
demonstrate certain differences in gene expressions; however, the outcome is similar as
the affected signaling pathways for both subtypes result in abnormal regulation of cellular
systems including cell cycle and growth factor mediated signaling pathways. (3,6)
The Cancer Genome Atlas (TCGA) has described a gene expression-based molecular classi-
fication, which comprises the classical, mesenchymal, proneural, and neural subtype (7,8).
Tabel 1.1 demonstrates a detailed overview of the common alterations for the four GBM
subtypes. The classical subtype is described to express atypically high levels of epidermal
growth factor receptor (EGFR), which is a protein functioning in cell growth. Occurrence of
the abnormality in EGFR levels is lower in the other GBM subtypes. The mesenchymal sub-
type is associated with the most frequent numbers of mutations in the tumor suppressor
gene NF1 as well as mutation in the tumor suppressor genes PTEN and TP53. Proneural
tumors are characterized by the most frequent mutations in the isocitrate dehydrogenase
1 (IDH1) gene, which contributes to abnormal cell growth, as well as a significant mutation
in the tumor suppressor gene TP53. Neural GBM subgroup contains mutations in the same
genes as listed above. (7) Genes involved in the classical and mesenchymal subtype have
shown correlation to shorter overall survival time compared to the other subtypes (9). Fur-
thermore, GBM patients belonging to the mesenchymal profile is associated with epitheli-
al-mesenchymal transition (EMT) due to high tumor invasiveness (10,11). The subtype has

Page 8 of 46
Tabel 1.1 Characteristic alterations in GBM subtypes (7)
s
also showed to expresses mesenchymal markers as CHI3L1 and MET (Table 1.1). EMT is
further described in later sections. The subtypes have demonstrated different responses to
the treatments, however, the clinical significance of the GBM subtypes still remains un-
clear (12).
Current treatment approaches for GBM patients include maximal safe surgical resection
followed by combined radio- and chemotherapy treatment. However, these approaches
offer only palliation extending the lifespan of patients by few months (13). Maximal surgi-
cal resection relieves the tumor-associated symptoms and gives a confirmation of the di-
agnosis pathologically (14,15). The chemotherapy treatment of first choice for newly diag-
nosed GBM is the alkylating agent temozolomide (13,16).
1.2 - TEMOZOLOMIDE
Temozolomide (Temodar®, Temodal®, TMZ) is an orally administrated monofunctional al-
kylating agent, which is approved for use in treatment of newly diagnosed adult GBM in
2005. Due to the lipophilic properties, it has the ability to cross the blood-brain barrier.
(17,18)
Recommended treatment schedule for newly diagnosed GBM patients includes a daily
dose of 75 mg/m2 for 42 days concomitantly with radiotherapy. This treatment is followed
by six weeks of treatment cycles, where the patients daily are given 150 mg/m2 of TMZ for
consecutive 5 days followed by a rest period with no treatment for 23 days prior to next
treatment cycle. Intravenous administration is also possible, where TMZ is injected over 90
minutes with the same dose administrated orally. (17,19) The common side effects of TMZ
Subtype Characteristic alterations Survival
Classical EGFR, Nestin, NOTCH3, JAG1, and LFNG
CDKN2A
Poor
Mesenchymal Mutated NFI, PTEN, and p53
CHI3L1 (also known as YKL40), MET, CD44, and MERTK
Poor
Proneural Mutated IDH1 and TP53
PDGFRA, OLIG2, TCF-3, DCX, and DLL3
Better
Neural Neuronal markers such as NEFL, GABRA1, SYT1, and SLC12A5
Poor

Page 9 of 46
Figure 1.1 Chemoresistance theory of GICs. GBM is composed of a heterogeneous group of
cancer cells. Gliobastoma-initiating cells (GICs) is a subpopulation, which have shown stem
cell characteristics as maintained proliferation, self-renewal ability, and resistance to con-
ventional therapy. GICs are suggested to be responsible for regrowth following conventional
therapy.
are among others fatigue, headache, nausea, vomiting, hair loss, anaemia, loss of appetite,
viral infection, and insomnia (20).
TMZ is stable at acidic pH (<5), but in case of neutral and alkaline pH (>7) it is rapidly hy-
drolysed to 5-(3-methyltriazen-1-yl) imidazole-4-carboxamide (MTIC) (17,18). The reaction
of MTIC with water leads to the release of 5-aminoimidazole-4-carboxamide (AIC) and the
reactive methyldiazonium cation. Methyldiazonium cation methylates DNA at N7 and O6
positions of guanine (N7-MeG and O6-MeG) and O3 of adenine (O3-MeA), which elicit the
cytotoxicity of TMZ. O6-MeG induces cell death through double-strand breaks and base
mispairing. However, a direct repair mechanism for this lesion is present. (16) O6-MeG can
be directly repaired by the enzyme methylguanine-DNA methyltransferase (MGMT), which
is able to remove the methyl adduct and thereby repair the TMZ-induced DNA damage
(4,21). Consequently, the intracellular level of MGMT is associated with chemoresistance.
Methylation of the MGMT gene promoter is seen in about 50% of GBM, which results in si-
lencing of the enzyme and thereby increases the sensitivity to TMZ treatment. (21,22)
1.3- GLIOBLASTOMA-INITIATING CELLS AND THE CHEMO-
RESISTANCE THEORY
An additional chemoresistance theory is based on a subpopulation designated tumor-
initiating cells (TICs). The ability of GBM cells to escape chemo-and radiotherapy leading to
inevitable tumor regrowth is mainly believed to be caused by the small subpopulation TICs.
This subpopulation has demonstrated stem cell characteristics, which implies maintained
proliferation, self-renewal and differentiation ability as well as resistance to chemo- and
radiotherapy (23). TICs have been identified in the hematopoietic system as well as in solid
tumors including those arising from the brain, lung, breast, colon, head and neck, and pan-
creas (24). TICs isolated from GBM are also known as glioblastoma-initiating cells (GICs)
and are found to be located in hypoxic areas of GBM.
Page 10 of 46
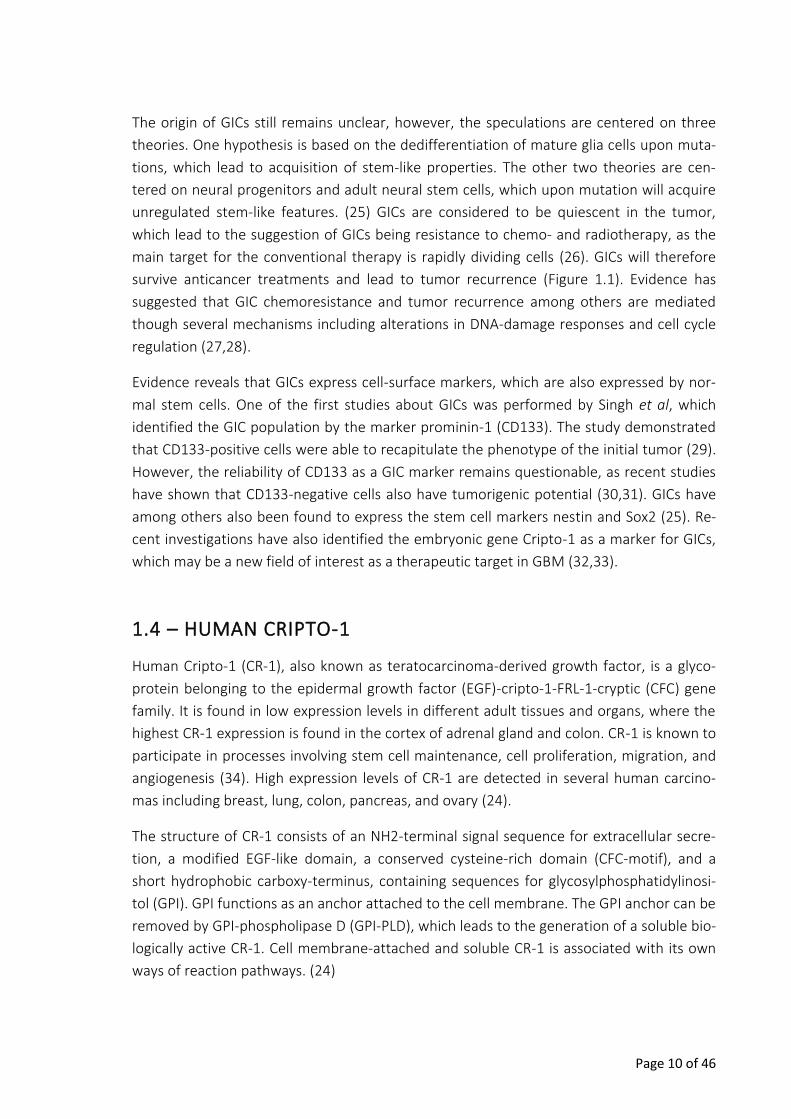
The origin of GICs still remains unclear, however, the speculations are centered on three
theories. One hypothesis is based on the dedifferentiation of mature glia cells upon muta-
tions, which lead to acquisition of stem-like properties. The other two theories are cen-
tered on neural progenitors and adult neural stem cells, which upon mutation will acquire
unregulated stem-like features. (25) GICs are considered to be quiescent in the tumor,
which lead to the suggestion of GICs being resistance to chemo- and radiotherapy, as the
main target for the conventional therapy is rapidly dividing cells (26). GICs will therefore
survive anticancer treatments and lead to tumor recurrence (Figure 1.1). Evidence has
suggested that GIC chemoresistance and tumor recurrence among others are mediated
though several mechanisms including alterations in DNA-damage responses and cell cycle
regulation (27,28).
Evidence reveals that GICs express cell-surface markers, which are also expressed by nor-
mal stem cells. One of the first studies about GICs was performed by Singh et al, which
identified the GIC population by the marker prominin-1 (CD133). The study demonstrated
that CD133-positive cells were able to recapitulate the phenotype of the initial tumor (29).
However, the reliability of CD133 as a GIC marker remains questionable, as recent studies
have shown that CD133-negative cells also have tumorigenic potential (30,31). GICs have
among others also been found to express the stem cell markers nestin and Sox2 (25). Re-
cent investigations have also identified the embryonic gene Cripto-1 as a marker for GICs,
which may be a new field of interest as a therapeutic target in GBM (32,33).
1.4 – HUMAN CRIPTO-1
Human Cripto-1 (CR-1), also known as teratocarcinoma-derived growth factor, is a glyco-
protein belonging to the epidermal growth factor (EGF)-cripto-1-FRL-1-cryptic (CFC) gene
family. It is found in low expression levels in different adult tissues and organs, where the
highest CR-1 expression is found in the cortex of adrenal gland and colon. CR-1 is known to
participate in processes involving stem cell maintenance, cell proliferation, migration, and
angiogenesis (34). High expression levels of CR-1 are detected in several human carcino-
mas including breast, lung, colon, pancreas, and ovary (24).
The structure of CR-1 consists of an NH2-terminal signal sequence for extracellular secre-
tion, a modified EGF-like domain, a conserved cysteine-rich domain (CFC-motif), and a
short hydrophobic carboxy-terminus, containing sequences for glycosylphosphatidylinosi-
tol (GPI). GPI functions as an anchor attached to the cell membrane. The GPI anchor can be
removed by GPI-phospholipase D (GPI-PLD), which leads to the generation of a soluble bio-
logically active CR-1. Cell membrane-attached and soluble CR-1 is associated with its own
ways of reaction pathways. (24)

Page 11 of 46
Figure 1.2 Composition of Cripto-1 (CR-1) glycoprotein. CR-1 is composed of an NH2-terminal signal sequence for extracellular secretion, a modified EGF-like domain, a conserved cysteine-rich domain (CFC-motif), and a short hydrophobic carboxy-terminus, containing sequences for glycosylphosphatidylinositol (GPI). (37)
CR-1 is known to be involved in several signaling pathways; the main CR-1-activated path-
ways consist of the Nodal/ALK4/ALK7/Smad-2 signaling pathway and the Glypocan-1/c-
Src/MAPK/AKT signaling pathway.
1.4.1 ROLE OF CRIPTO-1 IN EMBRYONIC DEVELOPMENT
Cell membrane-attached CR-1 functions as a co-receptor for the transforming growth fac-
tor-β (TGF-β)-related peptides Nodal and Growth and differentiation factor 1 and 3 (GDF1
and GDF3). This occurs through a complex composed of type I (ALK4 or ALK7) and type II
(ActRII or ActIIB) Activin serine-threonine kinase receptors. Activation of ALK4 leads to
phosphorylation of receptor-regulated proteins Smad-2 and Smad-3, which subsequently
bind to Smad-4, also known as the common partner Smad (co-Smad), and form a transcrip-
tional complex. The complex translocates to the nucleus and leads to transcriptional up-
regulation of specific target genes. (35,36)
Independently from CR-1, Nodal is able to bind directly to Alk7, while Alk4 signaling is de-
pendent on the interaction with CR-1. CR-1/Nodal signaling pathway is involved in several
events during the embryonic development; this includes the formation of the primitive
streak, development of the anterior-posterior axis, specification of mesoderm and endo-
derm during gastrulation, and formation of left-right asymmetry of developing organs. (24)

Page 12 of 46
Figure 1.3 CR-1 and its involvement in the Nodal/ALK4/ALK7/Smad-2 signaling path-way and the Glypocan-1/c-Src/MAPK/AKT signaling pathway. Adapted from Bianco et al (24)
1.4.2 ROLE OF CRIPTO-1 IN ONCOGENIC TRANSFORMATION
Besides functioning as a co-receptor for Nodal/GDF1/GDF3, CR-1 has the ability to bind to
Glypican-1, which is a GPI-anchored heparin sulphate proteoglycan (HSPG) (33,35). The
binding leads to phosphorylation of cytoplasmic tyrosine kinase c-Src, which results in the
activation of mitogen-activated protein kinase (MAPK)/phosphatidylinositol 3’kinase
(PI3K)/Protein kinase B (Akt) signalling pathways, which are involved in regulation of cell
proliferation, survival, and motility. Due to the activation of these signaling pathways,
which occurs independently of Nodal and ALK4, CR-1 is known to participate in the patho-
genesis of cancer. (35,37) CR-1 also interacts with the Wnt/β-catenin signalling pathway,
which can lead to the regulation of processes including cell migration and invasion (38).
CR-1 has also demonstrated a significant role in the regulation of EMT (39). EMT is a bio-
logical process, where epithelial cells loose their characteristics and acquire invasive and
migratory mesenchymal features (40,41). In a study by Strizzi et al, Transgenic HC-11

Page 13 of 46
mouse mammary epithelial cells overexpressing CR-1 demonstrated expression alterations
in markers, which are known to characterize the EMT process. Expression of E-cadherin, a
transmembrane glycoprotein responsible for linking epithelial cells, was significantly de-
creased, whereas a significant increase in the markers N-cadherin and Vimentin was de-
tected. N-cadherin and Vimentin are mesenchymal markers contributing with transient
adhesive properties. (39,42) A study by Ebert et al used CR-1 overexpressed human cervi-
cal carcinoma cells, which showed an increase in the expression of Vimentin. The same
cells demonstrated an increase in migratory and invasive properties, which was observed
by using matrix-coated membranes; due to this result, CR-1 was suggested to contribute to
the aggressive tumor progression of cervical carcinoma. (34)
1.4.3 CRIPTO-1 AS A MARKER FOR GLIOBLASTOMA-INITIATING CELLS
A study has detected a heterogeneous expression of CR-1 in a subpopulation of TICs in
human embryonal carcinoma (EC). The subpopulation was further separated in two groups
representing EC cells with high (CR-1High) and low (CR-1Low) CR-1 expression pattern. Re-
sults obtained from the segregation demonstrated different gene expressions and tumor-
igenic capacity. CR-1High generated tumor spheres in serum-free culture conditions more
efficiently compared to CR-1Low. Additionally, subcutaneous injection gave rise to larger
tumors formed by CR-1High demonstrated in a shorter latancy period in contrast to CR-1Low.
(32,43) CR-1 positive cells have also been seen in a small subpopulation of cells with stem-
like characteristics in human malignant melanoma. Compared to parental melanoma cells,
CR-1 positive subpopulation was observed to have an increase in stem cell markers Oct4
and SUZ-14. (43,44)
A study by Tysnes et al showed that high CR-1 expression was associated with shorter sur-
vival of GBM patients (45). CR-1 has been identified in different areas of GBM tissue, which
comprise perivascular tumor cells and endothelial cells. Based on the knowledge that
GBM cells grow near blood vessels and thereby form a hypoxic niche as the tumor grows,
CR-1 expression may indicate the presence of GICs (46). These findings support that CR-1 is
a possible marker for GICs and that this could be a candidate target for cancer therapy

Page 14 of 46
2 – PURPOSE OF THE STUDY In this study, the effect of selection pressure with the cytostatic TMZ on GBM in vitro
models will be investigated regarding functional features. Furthermore, the effect of TMZ
treatments on the expression level of CR-1 and its relation to the self-renewal capabilities
of GICs will be explored.
For this purpose, the GBM cell lines U87, T78, and T87 will be cultured as neurospheres
and exposed to TMZ double-cycle treatment in order to mimic the therapy, which the pa-
tients receive in the clinic. DMSO-treated cells will be used as the vehicle control. Follow-
ing the cycle treatments, the GBM cell lines will be characterized using functional assays
regarding cell viability and proliferation, and self-renewal ability. Additionally, the effect of
the TMZ double-cycle treatment on cell proliferation, DNA repair mechanisms, and CR-1
expression will be investigated using quantitative methods.

Page 15 of 46
Figure 3.1 Overview of TMZ double-cycle treatment for one cell line, where DMSO-treatment was used as vehicle control group
3 – MATERIALS AND METHODS
3.1 – GBM CELL LINES
The cell lines used in this study consisted of the model GBM cell line U87 and the two pri-
mary GBM cell lines T78 and T87. U87 cell line is commonly used in GBM research and de-
rives from grade IV GBM obtained from a 44 year-old female patient. The cell lines T78 and
T87 are newly established in Odense and obtained from primary GBM tissue (47). Charac-
terization of T78 and T87 reveals that T78 belong to the mesenchymal GBM subtype,
whereas T87 belongs to the proneural subtype. Both cell lines are reported to have a
methylated MGMT promoter (48). Three other cell lines were used as positive controls as
they were known to express CR-1. The cell lines included U87 overexpressing CR-1, which
is generated at Aalborg University, NTERA2/D1 deriving from EC, and T10, which is a pri-
mary cell line acquired from Danish Cancer Society.
3.2 - CELL CULTURE AND TEMOZOLOMIDE TREATMENT
The cell lines were cultured in serum-free medium as neurospheres, which consisted of
Neurobasal Medium (Gibco), 1% B27 supplement (50X; Gibco), 1% 200 mM L-glutamine,
1% Penicillin/Streptomycin (Gibco), 20 ng/mL EGF (Sigma), and bFGF (Peprotech). The cells
were incubated in a humidified atmosphere at 37°C containing 20% O2 and 5% CO2. The
cells were passaged before necrosis developed in the spheres. The cells were exposed to
treatment with the cytostatic TMZ (Sigma-Aldrich) in a concentration of 50 μmol/L; the
treatment comprised a double-cycle, where one cycle consisted of three days treatment
with TMZ followed by three days rest period without treatment (Figure 3.1). Dimethyl-
sulfoxid (DMSO; Sigma-Aldrich) treated cells were used as the control group. The cells
were seeded in culture flasks (CellStar; Greiner Bio-One) with a seeding density of 20.000
cells/mL and grown for four days prior to treatment.

Page 16 of 46
Phase-contrast images were captured prior to treatment and during the double-cycle
treatment. The images were acquired using phase-contrast microscopy 4x objective (Pri-
moVert; Zeiss) and analysed using the software ImageJ. On figure 3.1, an overview of the
double-cycle treatment for one cell line can be seen; this was the fundamental setup used
for further analysis, which is described in the following sections.
3.3 - GENERATION OF PROLIFERATION CURVES
In order to detect the effect of the TMZ treatment cycles on cell viability and growth, via-
bility and proliferation curves were generated using the cell counting method. Viability and
proliferation curves were generated after each ended rest period. Following dissociation of
the neurospheres, the cells were seeded in five 6-well plates (Costar; Corning) as triplicates
with appropriate medium in a seeding density of 50.000 cells/well (~ 5000 cells/cm2). Cell
viability was assessed by staining with trypan blue (Gibco). Counting was performed using
a haemocytometer (Bürker-Türk), where the cells were counted for five consecutive days.
Data was plotted in the software GraphPad Prism 7 and thereby an exponential graph was
obtained for the proliferation curves. The estimated curves were used for the determina-
tion of the doubling times.
3.4 – COLONY-FORMING UNIT ASSAY
Colony-forming unit (CFU) assay was performed to investigate the self-renewal ability and
colony formation of the cells after exposing to the treatment cycles. The assay was per-
formed after each ended rest period. After breaking the neurospheres, the cells were
counted and resuspended at a concentration of 500 cells/mL. A 2-fold dilution was per-
formed and the cells were seeded in 96-well plates (Costar; Corning) accordingly to ap-
pendix 1. The cells were cultured for 10 day and afterwards the fractions of wells without
colony formation for each dilution series were estimated. The number of colony-forming
units (CFUs) per well was calculated using Poisson distribution. The equation used for the
calculation was as follows: u= -ln (F0) where F0 is the fraction of empty wells.

Page 17 of 46
Table 3.1 Overview of the primer sequences used for qPCR
3.5 – DETECTION OF TRANSCRIPTIONAL ACTIVITY
Alterations in transcriptional activity after TMZ double-cycle treatment were investigated
using real-time quantitative PCR (qPCR). Transcriptional levels of the genes Cyclin D2
(CCND2), Growth arrest and DNA-damage inducible gene (GADD45G), and CR-1 were in-
vestigated. CCND2 functions as a cell-cycle regulator controlling G1 phase progression; the
gene is known to be overexpressed in many cancer types (49). The gene GADD45G is de-
tected to increase due to treatment with DNA damaging agents leading to cell cycle arrest
and apoptosis (50). YWHAZ was used as the housekeeping gene.
Cells from T25 flasks were lysed with a lysis solution containing 1% β-mercaptoethanol (Bi-
oRad) and 70% ethanol. RNA harvesting was performed using Aurum Total RNA mini kit
(Bio-Rad) according to manufacturers instructions. Quantification of RNA concentration
and purity was measured using a spectrophotometer (Nanodrop ND-1000). cDNA synthesis
were performed according to manufactures instructions (Bio-Rad) with 1 μg total RNA in-
put. The samples were run in a thermal cycler (Prime) using the thermal program: 5 min at
25°C, 30 min at 42°C and 5 min at 85°C.
qPCR was performed using a reaction mix containing SYBR Green PCR Master Mix (Applied
Biosystems), milli-Q water, forward and reverse primer, and samples diluted in 1:50 (1:200
for two samples). Samples and no template controls (NTC) were loaded into 96-well pcr
plates (AriaMx, Agilent Technologies) as duplicates. AriaMx Real-Time PCR system (Agilent
Technologies) was used to run the PCR. The qPCR data was further analysed using the
software AriaMX and the fold changes were calculated using the Pfafll-method.
The thermal profile was as the following settings - 1x: 95°C for 5 min (initial activation
step); 40x: 95°C for 30 sec, 55°C (CR-1) - 60°C (GADD45G and YWHAZ) - 63°C (CCND2) for 30
sec, 72°C for 30 sec.
Forward Primer Reverse Primer CCND2 TGGTATCTGGCGTTCTTTGG TGTCTGAGGAATGTTGTGATGG
GADD45G CAATGTGACCTTCTGTGTGC CCTGGATCAGCGTAAAATGG
CR-1 GATACAGCACAGTAAGGAGC TAGTTCTGGAGTCCTGGAAG
YWHAZ ACGCTGGGGTCCTTTTGTGCC T GGGCACAGACCCACAGTTCTCTTT

Page 18 of 46
FIGURE 3.3 Experimental setup for CFSE-staining. CFSE-staining was performed after end second treat-ments for all flasks. This is designated CFSE D0, where harvesting and analysis of undifferentiated CFSE-labelled cells took place. One flask from both treatment and control group with CFSE-labelled cells went through the second rest period and was afterwards harvested and analysed. This was designated CFSE D3.
3.6 – DETECTION OF CELL PROLIFERATION AND CR-1 EXPRESSION
In order to investigate the effect of TMZ double-cycle treatment on cell proliferation and
CR-1 expression, flow cytometric analysis was performed.
3.6.1 – CFSE CELL PROLIFERATION TRACKING
Cell proliferation was detected using CellTraceTM CFSE cell Proliferation Kit (Molecular
Probes, Life Technologies, Denmark) containing the fluorescent cell staining dye carbox-
yfluorescein succinimidyl ester (CFSE). The CFSE precursor, carboxyfluorescein diacetate
succinimidyl ester (CFDA-SE), is able to passively diffuse into cells where the acetate group
will be cleaved by intracellular esterases; this will lead to fluorescent CFSE. CFSE labeling is
inherited by cells though cell divisions where the fluorescence intensity will be half of the
parent cell.
In this study, CFSE was diluted in PBS in a concentration of 10 µM and used the same day.
The neurospheres were separated to single cells before CFSE use to ensure uniform label-
ing. Initially, cells were incubated in PBS+CFSE for 15 minutes at 37°C followed by centrifu-
gation. A second incubation was performed for 30 minutes at 37°C where the CFSE under-
went acetate hydrolysis. The cells were fixed in 3.7% formaldehyde (Merck) and resus-
pended in cold PBS before flow cytometry analysis. The samples were run using the flow
cytometer CytoFLEX S (Bechman Coulter) and analysed with the software FlowJo (Version
10.4.2).

Page 19 of 46
3.6.2 – DETECTION OF CR-1 EXPRESSION
CR-1 expression of cells exposed to TMZ double-cycle treatment was detected by perform-
ing a double staining on cells stained with CFSE. Staining took place at the end of the sec-
ond rest period. The cells were transferred to falcon tubes and washed twice in PBS. Af-
terwards, they were treated with trypLE in order to get single cell suspensions. Before
staining, the cells were fixed in 3.7% formaldehyde and resuspended in PBS. The cells were
transferred to FACS clear polystyrene tubes (BD Falcon) and the antibodies PE-conjugated
mouse monoclonal anti-human Cripto-1 (Cat#FAB2772P, R&D Systems) and PE Mouse
IgG1, κ isotype control (BD 555749, BD Biosciences) were added. The cells were incubated
for 30-45 min in dark at 4°C and subsequently washed twice in PBS. The samples were run
using the flow cytometer CytoFLEX S (Bechman Coulter) and analysed with the software
FlowJo (Version 10.4.2).
3.7 – STATISTICAL ANALYSIS
Statistical analysis was performed on PCR results as well as viability and proliferation
curves, where the standard error of the mean (SEM) for all measurements was calculated.
The calculations were performed using Microsoft Excel and GraphPad Prism 7. Further-
more, statistical significant differences were calculated using t-test analysis in Microsoft
Excel and One-way ANOVA in the software SPSS (Version 23). Statistical significance level
was set to 0,05.

Page 20 of 46
Figure 4.1 Phase-contrast images of untreated GBM cells A) U87 neurospheres B) T78 neuro-spheres C) T87 neurospheres. Images were taken with 4x magnification. Scale bar, 200 μm
A B C
4 – RESULTS
4.1- MORPHOLOGICAL ANALYSIS OF PRIMARY AND MODEL GBM CELL LINES EXPOSED TO TMZ DOUBLE-CYCLE TREATMENT
The morphological changes of GBM cell lines exposed to TMZ double-cycle treatment and
the DMSO-treatment were observed using phase-contrast microscopy. Images of untreat-
ed cells for the three cell lines were acquired prior to drug treatment. U87 cells grown as
neurospheres appeared as non-adherent small clusters without a sharp defined edge (Fig-
ure 4.1A) when compared to T78 neurospheres (Figure 4.1B). T78 neurospheres were ob-
served to be larger and more defined compared to the other two cell lines. In contrast to
U87 and T78, which were non-adherent, T87 cells formed both spheres and appeared to
be adherent to the plastic surface even though it was cultured in serum-free medium (Fig-
ure 4.1C).
U87 cells exposed to the first TMZ-treatment were observed to contain smaller neuro-
spheres (Figure 4.2A) compared to the control cells, which received first DMSO-treatment
(Figure 4.2E). During the first rest period after treatment, it was observed that the cells
formed larger spheres but still had small cell clusters (Figure 4.2B) compared to the control
cells (Figure 4.2F). After second treatment, the cells preserved the formation of neuro-
spheres although several small cell clusters were present (Figure 4.2C). Following the sec-
ond rest period, U87 neurospheres were observed to be larger than after the first TMZ-
treatment (Figure 4.2D). The control cells, receiving second DMSO-treatment and the final
rest period, appeared to attach to the culture flasks both as spheres and cells with a spin-
dle-shaped morphology (Figure 4.2G-H).

Page 21 of 46
Figure 4.2 Phase-contrast images of U87 cells exposure to TMZ double-cycle treatment and DMSO treatment as vehicle control. A-D) U87 cells exposed to TMZ double-cycle treatment E-H) U87 cells exposed to DMSO double-cycle treatment. Images were taken with 4x magnification. Scale bar, 200 μm
Figure 4.3 Phase-contrast images of T78 cells exposure to TMZ double-cycle treatment and DMSO treatment as vehicle control. A-D) T78 cells exposed to TMZ double-cycle treatment E-H) T78 cells exposed to DMSO double-cycle treatment. Images were taken with 4x magnification. Scale bar, 200 μm
First TMZ-treatment of T78 cells showed that the sharp defined neurospheres were de-
stroyed into smaller cell clusters as well as clusters, which have lost the circular-shape
(Figure 4.3A) compared to the control group (Figure 4.3E). Following the first rest period,
the cells obtained the circular neurosphere formation again with the presence of smaller
floating cells. After second TMZ-treatment and the rest period, the cells were observed to
adhere to the culture flask (Figure 4.3C-D)

Page 22 of 46
Figure 4.4 Phase-contrast images of T87 cells exposure to TMZ double-cycle treatment and DMSO treatment as vehicle control. A-D) T87 cells exposed to TMZ double-cycle treatment E-H) T87 cells exposed to DMSO double-cycle treatment. Images were taken with 4x magnification. Scale bar, 200 μm
T87 cells appeared different than the two other cell lines. The double-cycle treatment with
TMZ and DMSO demonstrated morphological similarities, which were displayed as adher-
ent cells forming spheres. No difference between the treatment and the control group as
well as difference between first and second cycle was observed (Figure 4.4A-H).
4.2 - CELL VIABILITY AND PROLIFERATION FOLLOWING TMZ DOUBLE-CYCLE TREATMENT
To investigate the health and proliferation of the cells following TMZ double-cycle treat-
ment, viability and proliferation curves were acquired after each rest period.
U87 cells exposed to TMZ-treatments demonstrated a decreased viability compared to un-
treated cells and the DMSO group. After receiving first TMZ-treatment, the cells showed a
lower viability compared to untreated cells and the DMSO treatments while the second
TMZ-treatment showed the lowest viability, which was observed to increase after day 2.
Furthermore, the viability of untreated cells and cells that received first DMSO-treatment
appeared similar; the second DMSO-treatment showed to decrease in the beginning and
afterwards started to increase. (Figure 4.5A)

Page 23 of 46
Figure 4.5 Viability and proliferation curves of U87 cell line exposed to TMZ double-cycle treatment and DMSO treatments as the control group. A) % Viability of the cells measured for five consecutive days B) Proliferation curves assessed from cell counting for consecutive five days. All measurements were obtained from triplicate samples. Error bars for both graphs display the standard error of the mean (SEM)
The viability of first and second TMZ-treatment of T78 cells was observed to differ from
each other. At day 1, cells receiving first TMZ-treatment showed a viability of 40% where a
decrease was observed at day 2. At Day 3-4, the curve showed to ascend where a minor
decrease was observed at day 5. Second TMZ-treatment presented a viability of approxi-
mately 66% at day 1, which was almost similar to day 1 for the first and second DMSO-
treated cells. Furthermore, an ascending curve was observed for day 2 and 3 whereas a
decrease was seen at day 4, which ended with a minor increase at day 5. A difference be-
tween the viability of untreated and DMSO-treated cells was observed as untreated cells
showed a higher viability compared to cells receiving both first and second DMSO-
treatment. (Figure 4.6A)
First TMZ-treatment for T87 cells showed viability similar to first DMSO-treatment at day 1,
following a decrease and an increase at day 2 and 3, respectively (Figure 4.7A). Day 4 and 5
showed a further decrease. At day 1, second TMZ-treatment demonstrated the lowest via-
bility, which was approximately 58%. After the first day, the viability was increased to a
level close to the viability of cells, which received the first DMSO-treatment and the sec-
ond. Second DMSO-treatment started with a viability of nearly 65% and showed an in-
crease in the following four days. Untreated cells demonstrated the highest viability for all
five days. (Figure 4.7A)

Page 24 of 46
Figure 4.6 Viability and proliferation curves of T78 cell line exposed to TMZ double-cycle treatment and DMSO treatments as the control group. A) % Viability of the cells measured for five consecutive days B) Proliferation curves assessed from cell counting for consecutive five days. All measurements were obtained from triplicate samples. Error bars for both graphs display the standard error of the mean (SEM)
Figure 4.7 Viability and proliferation curves of T87 cell line exposed to TMZ double-cycle treatment and DMSO treatments as the control group. A) % Viability of the cells measured for five consecutive days B) Proliferation curves assessed from cell counting for consecutive five days. All measurements were obtained from triplicate samples. Error bars for both graphs display the standard error of the mean (SEM)

Page 25 of 46
Proliferation curves for TMZ-treated U87 cells demonstrated an almost straight curve
compared to untreated and DMSO-treated cells. A minor increase was seen for the cells
after the first TMZ-treatment whereas no proliferation was detected for cells after second
TMZ-treatment (Figure 4.5B). The doubling time was calculated to be 3.21 days and 72.96
days for first and second TMZ-treatment, respectively, which was slower compared to the
DMSO-treated cells (Figure 4.8A). Both first and second DMSO-treatment showed to slow
the proliferation of the cells, which was indicated by the slower doubling time compared
to untreated cells (Figure 4.8A).
First TMZ-treatment of T78 cells showed to have a stronger effect on the cell proliferation
compared to the second treatment, as the total cell number of the cells for the first treat-
ment is lower compared to the second treatment (Figure 4.6B). After a slight decrease at
day 2, the curve showed an ascending tendency at day 3-5. Second TMZ-treatment
showed an increasing curve for all five days. Moreover, second TMZ-treatment showed to
cross with first DMSO treated cells at day 2 where it also was seen to have a higher cell
number at day 3 compared to first DMSO treatment (Figure 4.6B). Doubling times for TMZ-
treated cells was found to be faster than both untreated and DMSO-treated cells. Fur-
thermore, the first TMZ-treatment presented a faster doubling time compared to the sec-
ond treatment. (Figure 4.8B)
First and second TMZ-treatment of T87 cells presented similar proliferation curves and
were also similar to both DMSO-treatments (Figure 4.7B). A slight increase in cell number
was observed for second TMZ- and DMSO-treatment at day 3 where the number of cells
also was seen to increase at day 4 for the TMZ-treated cells. Untreated cells presented the
highest number of cells for all five days (Figure 4.7B). Doubling times for both TMZ-
treatments showed a minor difference compared to the corresponding DMSO-treatments,
where the TMZ treated cells had a faster doubling time. Furthermore, second TMZ treated
cells presented a faster doubling time than the cells receiving the first treatment. (Figure
4.8C).
Additionally, an ANOVA test was performed for proliferation curves in order to compare
the TMZ-treatments for all three GBM cell line. A statistically significant difference was ob-
tained for the three GBM cell lines (p= 0.000353).

Page 26 of 46
Figure 4.8 Doubling times for GBM cell lines upon double-cycle treatment with TMZ and DMSO A) Doubling times for U87 B) Doubling times for T78 C) Doubling times for T87
B
C
A

Page 27 of 46
Figure 4.9 Yield of colony-forming unit (CFU) of U87 cells exposed to TMZ double-cycle treatment and DMSO as the control.
4.3 – COLONY-FORMING ABILITY OF GBM CELL LINES
To determine the self-renewal ability of GICs after TMZ and DMSO double-cycle treatment,
colony-forming unit (CFU) was performed after each rest period. Interestingly, the U87
cells receiving first DMSO-treatment had the highest yield of CFUs and the lowest yield was
observed for the cells exposed to second TMZ-treatment (Figure 4.9). Both second TMZ-
and DMSO-treatment showed a lower yield compared to the first treatments. The cell lines
T78 and T87 only revealed CFU’s for one treatment group; T78 cells receiving first DMSO-
treatment showed 66.57% whereas T87 cells receiving second TMZ-treatment showed
37.12%.

Page 28 of 46
4.4 – TRANSCRIPTIONAL ACTIVITY OF THE GENES CCND2, GADD45G, AND CRIPTO-1 AFTER TMZ DOUBLE-CYCLE TREAT-MENT
qPCR was used to investigate the transcriptional activity of CCND2, GADD45G and CR-1 in
GBM cells exposed to TMZ double-cycle treatment.
Figure 4.10 represents the fold changes of the different treatments where the untreated
cells were used as controls. The only statistical significant transcriptional activity for U87
cells was present for the first and second DMSO-treatment, where a down regulation of
CCND2 occurred (Figure 4.10A). As the CT value was unavailable for CR-1 untreated cells
and first TMZ-treatment, the first DMSO-treatment was used as control for second DMSO-
and TMZ-treatment (Figure 4.10C). However, no statistical significant difference was seen
for these cells too.
T78 cells showed three statistical significant differences; first and second DMSO-treatment
showed a down regulation of CCND2 gene (Figure 4.10A) and a minor upregulation of CR-1
for cells receiving second TMZ-treatment (Figure 4.10C). The CT values for T87 untreated
cells for all three genes were unavailable, which resulted in the use of first DMSO-
treatment groups as controls. No CT value was acquired for the gene CCND2 in first DMSO-
treatment leading to the use of second treatment group as the control; this resulted in a
elevated statistical significant upregulation of the gene CCND2 for cells receiving first TMZ-
treatment, displaying a fold change of 9.8 (Figure 4.10A). Furthermore, a statistical signifi-
cant downregulation was displayed of the gene GADD45G for cells receiving first and sec-
ond DMSO-treatment (Figure 4.10CB).

Page 29 of 46
FIGURE 4.10 – Bar charts displaying transcriptional activity of the genes CCND2, GADD45G, and CR-1 for the GBM cell lines U87, T78, and T87 receiving TMZ double-cycle treatment and DMSO-treatment. Untreated samples are used as controls. As no measurements were obtained for T87 untreated samples, the 1. DMSO-treatment was used as the control. Error bars display the standard error of the mean (SEM).
A
B
C

Page 30 of 46
Figure 4.11 Histograms presenting the proliferation activity through fluorescence intensity of CFSE-labeled cells, which received TMZ double-cycle treatment and DMSO treatment as the control group. The dark red and blue coloured histograms represent the undivided cells for TMZ- and DMSO-treated cells, respectively, designated CFSE D0. The lighter red and blue colours represent the CFSE-labeled TMZ- and DMSO-treated cells, harvested after three days of incubation.
Table 4.1 MFI values for undivided CFSE-labelled cells (CFSE D0) and CFSE-labelled cells incubated for three days (CFSE D3).
4.5 – CELL PROLIFERATION TRACKING AND CRIPTO-1 EXPRES-SION AFTER TMZ-TREATMENT
Flow cytometry was performed in order to track the cell proliferation by CFSE labeling and
to investigate the expression of CR-1 after TMZ and DMSO double-cycle treatment.
Figure 4.11 illustrates overlaid graphs for the CFSE-labeled undivided cells and the divided
cells three days after CFSE-staining. To analyze the cell proliferation after TMZ- and DMSO
treatment, mean fluorescence intensity (MFI) values were acquired using the software
FlowJo. MFI values for the cell lines T78 and T87 indicated that the cells did proliferate,
when compared to the undivided cell groups (Table 4.1). U87 showed the slowest prolifer-
ation among the cell lines. Furthermore, U87 TMZ-treated cells presented a somewhat
higher MFI for the undivided cells compared the undivided DMSO group.
U87 T78 T87 DMSO – CFSE D0 375091 276.362 370.710 DMSO – CFSE D3 30.625 3172 10.210 TMZ – CFSE D0 1.250.000 247176 395.455 TMZ – CFSE D3 720.000 6533 9078
Page 31 of 46
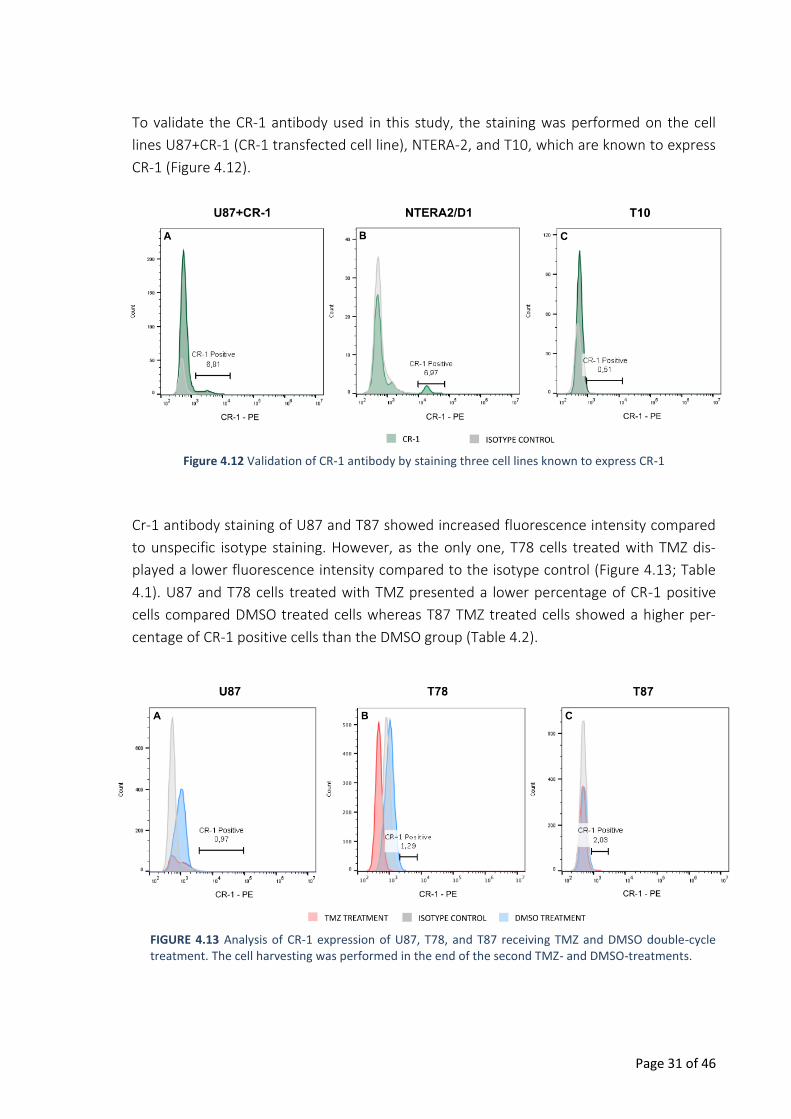
Figure 4.12 Validation of CR-1 antibody by staining three cell lines known to express CR-1
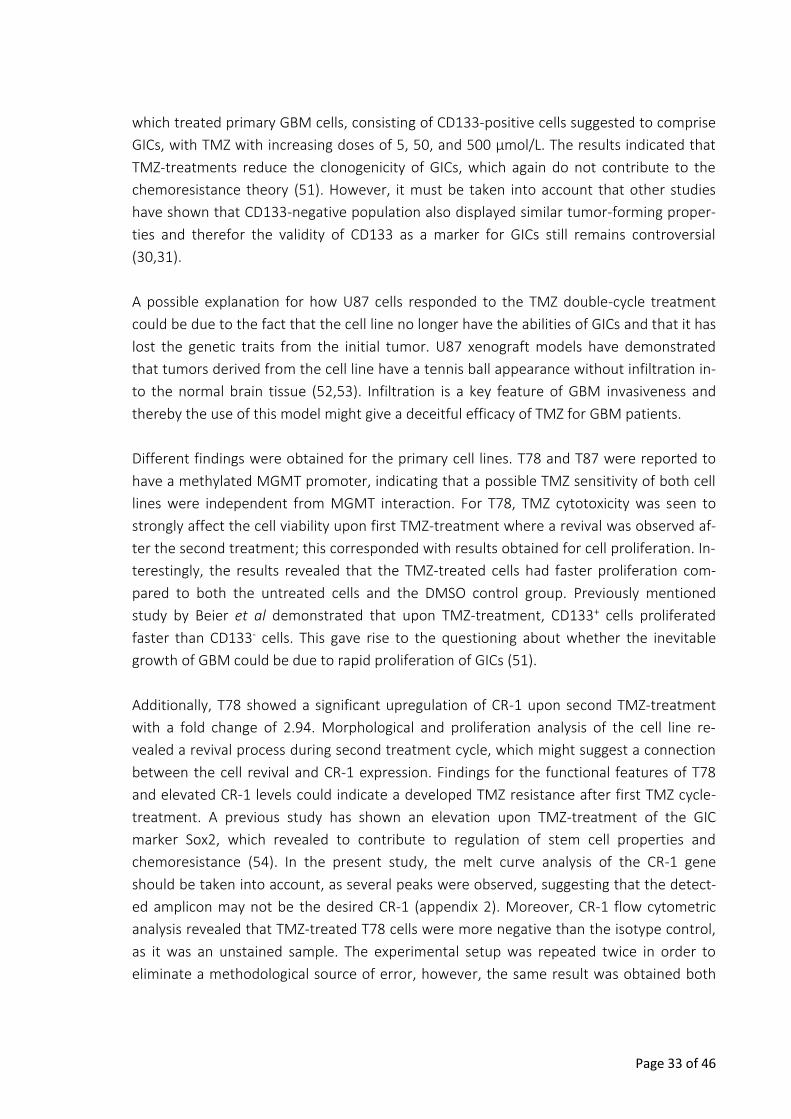
FIGURE 4.13 Analysis of CR-1 expression of U87, T78, and T87 receiving TMZ and DMSO double-cycle treatment. The cell harvesting was performed in the end of the second TMZ- and DMSO-treatments.
To validate the CR-1 antibody used in this study, the staining was performed on the cell
lines U87+CR-1 (CR-1 transfected cell line), NTERA-2, and T10, which are known to express
CR-1 (Figure 4.12).
Cr-1 antibody staining of U87 and T87 showed increased fluorescence intensity compared
to unspecific isotype staining. However, as the only one, T78 cells treated with TMZ dis-
played a lower fluorescence intensity compared to the isotype control (Figure 4.13; Table
4.1). U87 and T78 cells treated with TMZ presented a lower percentage of CR-1 positive
cells compared DMSO treated cells whereas T87 TMZ treated cells showed a higher per-
centage of CR-1 positive cells than the DMSO group (Table 4.2).

Page 32 of 46
TABLE 4.2 – Percentage of CR-1 positive cells after double-cycle treatments
5 – DISCUSSION In this study, three GBM cell lines were exposed to the cytostatic TMZ, where the treat-
ment comprised a double cycle including periods with and without treatment. DMSO-
treated cells were used as the vehicle control group. The cells were analyzed after both
first and second treatment cycles in regards to the effect of TMZ on cell viability and pro-
liferation, self-renewal ability, DNA-damage repair mechanism, and CR-1 expression. Re-
sults obtained from the present study are discussed below.
The three GBM cell lines U87, T78, and T87 responded differently to TMZ double-cycle
treatment, which was confirmed by statistical analysis. U87 demonstrated to be the most
TMZ sensitive cell line compared to the two primary cell lines. Cell viability was decreased
upon both TMZ-treatments, where the lowest viability was detected after second treat-
ment. Inhibition of cancer cell proliferation is known to be crucial for ascertaining the suc-
cess of the treatment. Assays regarding U87 cell proliferation revealed that the cells were
severely affected by the second TMZ-treatment as almost no cell proliferation occurred. As
the only cell line, TMZ double-cycle treatment has also shown to affect the self-renewal
ability of U87 cells, which may indicate an effect of TMZ on GICs as well. However, the
DMSO-treated cells showed a higher clonogenicity compared to the TMZ-treated group.
The expectation was that GICs would survive therapeutic selection pressure by TMZ so the
CFU assays showing increased clonogenicity of DMSO-treated cells and decreased clono-
genicity for TMZ-treated cells are inexplicable results.
The effect of TMZ on CR-1 expression levels was investigated in order to explore its rela-
tion to the self-renewal capacity of GICs. Although no statistically significant differences
were obtained from the transcriptional activity of the gene, TMZ double-cycle treatment
showed to reduce the CR-1 expression for the cell line U87. Inhibition of the self-renewal
ability and proliferation of U87 cells upon TMZ treatment could suggest a correlation be-
tween the known self-renewal ability of GICs and CR-1 expression levels. Assumed that CR-
1 is a marker for GICs, the findings for the cell line U87 contradicts with the theory of GICs
being resistance to chemotherapy. Similar results were obtained for a study by Beier et al,
TMZ TREATMENT DMSO TREATMENT U87 0,64% 1,19% T78 1,15% 1,29% T87 2,42% 1,98%
Page 33 of 46
which treated primary GBM cells, consisting of CD133-positive cells suggested to comprise
GICs, with TMZ with increasing doses of 5, 50, and 500 μmol/L. The results indicated that
TMZ-treatments reduce the clonogenicity of GICs, which again do not contribute to the
chemoresistance theory (51). However, it must be taken into account that other studies
have shown that CD133-negative population also displayed similar tumor-forming proper-
ties and therefor the validity of CD133 as a marker for GICs still remains controversial
(30,31).
A possible explanation for how U87 cells responded to the TMZ double-cycle treatment
could be due to the fact that the cell line no longer have the abilities of GICs and that it has
lost the genetic traits from the initial tumor. U87 xenograft models have demonstrated
that tumors derived from the cell line have a tennis ball appearance without infiltration in-
to the normal brain tissue (52,53). Infiltration is a key feature of GBM invasiveness and
thereby the use of this model might give a deceitful efficacy of TMZ for GBM patients.
Different findings were obtained for the primary cell lines. T78 and T87 were reported to
have a methylated MGMT promoter, indicating that a possible TMZ sensitivity of both cell
lines were independent from MGMT interaction. For T78, TMZ cytotoxicity was seen to
strongly affect the cell viability upon first TMZ-treatment where a revival was observed af-
ter the second treatment; this corresponded with results obtained for cell proliferation. In-
terestingly, the results revealed that the TMZ-treated cells had faster proliferation com-
pared to both the untreated cells and the DMSO control group. Previously mentioned
study by Beier et al demonstrated that upon TMZ-treatment, CD133+ cells proliferated
faster than CD133- cells. This gave rise to the questioning about whether the inevitable
growth of GBM could be due to rapid proliferation of GICs (51).
Additionally, T78 showed a significant upregulation of CR-1 upon second TMZ-treatment
with a fold change of 2.94. Morphological and proliferation analysis of the cell line re-
vealed a revival process during second treatment cycle, which might suggest a connection
between the cell revival and CR-1 expression. Findings for the functional features of T78
and elevated CR-1 levels could indicate a developed TMZ resistance after first TMZ cycle-
treatment. A previous study has shown an elevation upon TMZ-treatment of the GIC
marker Sox2, which revealed to contribute to regulation of stem cell properties and
chemoresistance (54). In the present study, the melt curve analysis of the CR-1 gene
should be taken into account, as several peaks were observed, suggesting that the detect-
ed amplicon may not be the desired CR-1 (appendix 2). Moreover, CR-1 flow cytometric
analysis revealed that TMZ-treated T78 cells were more negative than the isotype control,
as it was an unstained sample. The experimental setup was repeated twice in order to
eliminate a methodological source of error, however, the same result was obtained both

Page 34 of 46
times. Unfortunately, it has not been possible to find an answer for why the cells respond-
ed differently to CR-1 antibody staining in the literature.
T78 cell line has been identified as a mesenchymal GBM subtype, which is known to dis-
play a shorter overall survival time. The findings obtained in this study supports the associ-
ation of mesenchymal subtype being one of the aggressive GBM subtypes. However, a
study by Verhaak et al, showed that the mesenchymal group significantly reduced mortali-
ty upon aggressive treatment comprising chemo- and radiationtherapy, which is incon-
sistent with the known aggressiveness of the subtype (7). In the present study, the T78
cells showed resistance to TMZ upon second treatment cycle and therefore additional TMZ
treatment-cycles might be needed to observe how T78 cells respond to further treatment.
The difference in behavior upon first and second TMZ treatment cycle could be due to the
link between the mesenchymal group and EMT process, which is associated with higher
degree of tumor invasiveness. Further investigations are, however, required to investigate
this linkage.
The effect of TMZ-treatment on T87 showed to be different than the other two cell lines.
The cell line demonstrated the same features as the DMSO control group regarding mor-
phology, cell proliferation, and doubling time. However, inhibition of the colony-formation
was shown after second TMZ-treatment, which did not correlate with the other findings.
The overall findings may be associated with which GBM subtype the cell line belongs to. A
former characterization of T87 performed by Jensen et al. identified the cell line as a pro-
neural subtype. The same study identified the proneural T87 as the most invasive com-
pared to the cell lines T78 and T87, which belong to the mesenchymal and classical sub-
type, respectively. The results in the present study contradict with the assumption that the
proneural subtype has a better prognosis compared to the other subtype, as the cell line
did not respond to the treatment.
No statistically significant results were obtained for the transcriptional activity of CR-1,
however, as the only cell line, the percentage of CR-1 positive cells were increased upon
TMZ treatment. The increased CR-1 expression and the decreased self-renewal ability ob-
served for T87 upon second TMZ treatment contradicts with the probable correlation of
CR-1 and GICs. The reliability of the CFU assays may have an influence on this result, as the
assays only have been performed once.
Remarkably, the control DMSO-treatment also showed to exert an effect on all three cell
lines when compared to untreated cells. A statistical significant downregulation of the pro-
liferation gene CCND2 for U87, T78, and T87 upon both first and second DMSO-treatment
were showed, which correlated with the findings obtained from proliferation curves.
DMSO is widely used as a solvent for TMZ, which is not soluble in water, and as vehicle

Page 35 of 46
control groups. However, there are different opinions concerning concentration due to
toxicity. Final concentration ranging from 0.5-1.5% is reported to be used for cell culture
and in vivo experiments (55). Other studies have demonstrated that different cell types
have different DMSO thresholds, which may affect the cell viability and growth. Chinese
hamster ovary (CHO) cells have for example demonstrated a threshold dose of 0.5%,
where it was reported to be 1% for choriocapillary endothelial cells. (56–58)
In the present study, 0.4% DMSO was applied and inhibition of cellular proliferation was
detected for all GBM cell lines. This gives rise to questioning about whether it is the solvent
DMSO that exerts the effect on the cells or TMZ. For the cell line T87, it was clear that the
variation of TMZ-treated cells from the untreated cells was due to DMSO. Interestingly for
T87 cells, the gene GADD45G, which was used as an indicator for DNA damage, was signifi-
cantly downregulated upon second TMZ- and DMSO-treatment compared to the first
DMSO-treatment. Transcriptional levels of GADD45G are known to increase following
treatment with DNA-damaging agents as the gene is known to be involved in inhibition of
cell proliferation and increased apoptosis in response to drug treatment (50,59). A down-
regulation will lead to increased cell proliferation, which also corresponded with the re-
sults for proliferation curves for the cell line.

Page 36 of 46
6 – CONCLUSION The present study investigated the effect of selection pressure with the cytostatic TMZ on
functional features in GBM in vitro models. Furthermore, the effect of TMZ treatment on
CR-1 expression and its relation to the self-renewal ability of GICs was explored. A TMZ
double-cycle treatment was applied in order to mimic the treatment cycles patients re-
ceive in the clinic.
A statistical significant difference in response to TMZ-treatments was obtained for all three
GBM cell lines. The model GBM cell line U87 demonstrated to be TMZ-sensitive upon dou-
ble-cycle treatment. Decrease in cell viability, proliferation, and self-renewal ability as well
as CR-1 expression were observed suggesting that GICs may be TMZ-sensitive, which con-
tradicts with the hypothesis of GICs ability to escape chemotherapy. Otherwise, the cell
line could have lost the abilities of GICs and therefore respond severely to TMZ-treatment.
MGMT-methylated primary cell line T78 did not respond to TMZ-treatment upon second
treatment and a significant upregulation was detected for CR-1 transcriptional activity; this
suggested a correlation between the possible GIC marker CR-1 and chemoresistance. T87
did not respond to both first and second TMZ treatment cycle regarding functional fea-
tures. However, CR-1 positive cells were shown to increase upon second TMZ-treatment
for T87. Furthermore, the control DMSO-treatment showed to exert a cytotoxic effect on
all cell lines resulting in doubts about the actual effect of TMZ.
Overall, the three GBM cell lines responded differently to the TMZ double-cycle treatment,
which may be related to their genetic tumor profiles. The results obtained in this study
were inconclusive in order to detect GICs ability of escaping chemotherapy by the use of
CR-1 as a marker for the population. Further studies are therefore required in order to in-
vestigate the effect of TMZ on GBM in vitro models and how the GIC population is affected
by the TMZ-treatment.

Page 37 of 46
7 – FUTURE APPLICATIONS In the present study, the results obtained for primary cell lines T78 and T87 showed thera-
py resistance to TMZ in a concentration of 50 μmol/L. Other studies have used this concen-
tration as one of the lowest concentrations, which could suggest that an experimental set-
up with higher doses of TMZ could be performed. It would be interesting to investigate
how the cells would react to stronger treatment to see if they still preserve their resistance
to TMZ. Additionally, it could be relevant to include further cycle treatments, especially for
the mesenchymal T78, which showed to react differently upon first and second TMZ-
treatment. Further functional assays as for example migration assay could also be included
to investigate the migratory abilities of the cell lines following TMZ-treatment.
It could be speculated that the effect of TMZ on GIC population could be investigated
through a combination of different GIC markers both to compare how CR-1 expression is
affected compared to the other markers and to obtain a better understanding of GBM
subtype variation. As the mesenchymal subtype is linked to the EMT process, investigating
different EMT markers would provide a better understanding to why T78 cells react differ-
ently upon first and second TMZ-treatment.

Page 38 of 46
BIBLIOGRAPHY 1. Wilson T, Karajannis M, Harter D. Glioblastoma multiforme: State of the art and future therapeutics.
Surg Neurol Int [Internet]. 2014;5(1):64. Available from: http://surgicalneurologyint.com/surgicalint-articles/glioblastoma-multiforme-state-of-the-art-and-future-therapeutics/
2. Hanif F, Muzaffar K, Perveen K, Malhi SM, Simjee SU. Glioblastoma Multiforme: A Review of its Epidemiology and Pathogenesis through Clinical Presentation and Treatment. Asian Pac J Cancer Prev [Internet]. 2017;18(1):3–9. Available from: http://www.ncbi.nlm.nih.gov/pubmed/28239999%0Ahttp://www.pubmedcentral.nih.gov/articlerender.fcgi?artid=PMC5563115
3. Alifieris C, Trafalis DT. Glioblastoma multiforme: Pathogenesis and treatment. Pharmacol Ther. 2015;152:63–82.
4. Carlsson SK, Brothers SP, Wahlestedt C. Emerging treatment strategies for glioblastoma multiforme. EMBO Mol Med [Internet]. 2014;6(11):1359–70. Available from: http://embomolmed.embopress.org/cgi/doi/10.15252/emmm.201302627
5. Louis DN, Ohgaki H, Wiestler OD, Cavenee WK, Burger PC, Jouvet A, et al. The 2007 WHO classification of tumours of the central nervous system. Acta Neuropathol. 2007;114(2):97–109.
6. Davis ME. Glioblastoma: Overview of Disease and Treatment. Clin J Oncol Nurs. 2016;20(5):1–14.
7. Verhaak RGW, Hoadley KA, Purdom E, Wang V, Qi Y, Wilkerson MD, et al. An integrated genomic analysis identifies clinically relevant subtypes of glioblastoma characterized by abnormalities in PDGFRA, IDH1, EGFR and NF1. Cancer Cell [Internet]. 2010;19(1):1–25. Available from: http://www.pubmedcentral.nih.gov/articlerender.fcgi?artid=2886992&tool=pmcentrez&rendertype=abstract
8. Lin N, Yan W, Gao K, Wang Y, Zhang J, You Y. Prevalence and clinicopathologic characteristics of the molecular subtypes in malignant glioma: A multi-institutional analysis of 941 cases. PLoS One. 2014;9(4):1–5.
9. Phillips HS, Kharbanda S, Chen R, Forrest WF, Soriano RH, Wu TD, et al. Molecular subclasses of high-grade glioma predict prognosis, delineate a pattern of disease progression, and resemble stages in neurogenesis. Cancer Cell. 2006;9(3):157–73.
10. Elias MC, Tozer KR, Silber JR, Mikheeva S, Deng M, Morrison RS, et al. TWIST is expressed in human gliomas and promotes invasion. Neoplasia [Internet]. 2005;7(9):824–37. Available from: http://www.ncbi.nlm.nih.gov/pubmed/16229805%5Cnhttp://www.pubmedcentral.nih.gov/articlerender.fcgi?artid=PMC1501937
11. Tso C-L, Shintaku P, Chen J, Liu Q, Liu J, Chen Z, et al. Primary Glioblastomas Express Mesenchymal Stem-Like Properties. Mol Cancer Res [Internet]. 2006;4(9):607–19. Available from: http://mcr.aacrjournals.org/cgi/doi/10.1158/1541-7786.MCR-06-0005
12. Jackson M, Hassiotou F, Nowak A. Glioblastoma stem-like cells: At the root of tumor recurrence and a therapeutic target. Carcinogenesis. 2014;36(2):177–85.
13. Minniti G, Muni R, Lanzetta G, Marchetti P, Maurizi Enrici R. Chemotherapy for glioblastoma: Current

Page 39 of 46
treatment and future perspectives for cytotoxic and targeted agents. Anticancer Res. 2009;29(12):5171–84.
14. Mallick S, Benson R, Hakim A, Rath GK. Management of glioblastoma after recurrence: A changing paradigm. J Egypt Natl Canc Inst [Internet]. National Cancer Institute, Cairo University; 2016;28(4):199–210. Available from: http://dx.doi.org/10.1016/j.jnci.2016.07.001
15. Yong RL, Lonser RR. Surgery for glioblastoma multiforme: striking a balance. 2011;1–5.
16. Zhang J, F.G. Stevens M, D. Bradshaw T. Temozolomide: Mechanisms of Action, Repair and Resistance. Curr Mol Pharmacol [Internet]. 2012;5(1):102–14. Available from: http://www.eurekaselect.com/openurl/content.php?genre=article&issn=1874-4672&volume=5&issue=1&spage=102
17. Lee SY. Temozolomide resistance in glioblastoma multiforme. Genes Dis. Elsevier Ltd; 2016;3(3):198–210.
18. Barciszewska AM, Gurda D, Głodowicz P, Nowak S, Naskręt-Barciszewska MZ. A new epigenetic mechanism of temozolomide action in glioma cells. PLoS One. 2015;10(8).
19. Stupp R, Mason W, Bent M van den, Weller M, Fisher B, Taphoorn M, et al. Radiotherapy plus concomitant and adjuvant temozolomide for globlastoma. N Engl J Med. 2005;352:987–96.
20. Side effects of temozolomide (Temodal) [Internet]. Cancer Research UK. [cited 2018 May 26]. Available from: http://www.cancerresearchuk.org/about-cancer/cancer-in-general/treatment/cancer-drugs/drugs/temozolomide/side-effects
21. Thon N, Kreth S, Kreth F-W. Personalized treatment strategies in glioblastoma: MGMT promoter methylation status. Onco Targets Ther [Internet]. 2013;6:1363–72. Available from: http://www.ncbi.nlm.nih.gov/pubmed/24109190%5Cnhttp://www.pubmedcentral.nih.gov/articlerender.fcgi?artid=PMC3792931
22. Dresemann G. Temozolomide in malignant glioma. Onco Targets Ther. 2010;3:139–46.
23. Cheng L, Wu Q, Guryanova OA, Huang Z, Huang Q, Rich JN, et al. Elevated invasive potential of glioblastoma stem cells. Biochem Biophys Res Commun [Internet]. Elsevier Inc.; 2011;406(4):643–8. Available from: http://dx.doi.org/10.1016/j.bbrc.2011.02.123
24. Bianco C, Rangel MC, Castro NP, Nagaoka T, Rollman K, Gonzales M, et al. Role of Cripto-1 in stem cell maintenance and malignant progression. Am J Pathol. 2010;177(2):532–40.
25. Agnihotri S, Munoz D, Zadeh G, Guha A. Brain tumor-initiating cells and cells of origin in glioblastoma. Transl Neurosci. 2011;2(4):331–8.
26. Ahmed AU, Auffinger B, Lesniak MS. Understanding glioma stem cells: rationale, clinical relevance and therapeutic strategies. Expert Rev Neurother. 2015;13(5):545–55.
27. Auffinger B, Spencer D, Pytel P, Ahmed AU, Lesniak MS. The role of glioma stem cells in chemotherapy resistance and glioblastoma multiforme recurrence. Expert Rev Neurother. 2016;15(7):741–52.
28. Liebelt BD, Shingu T, Zhou X, Ren J, Shin SA, Hu J. Glioma Stem Cells: Signaling, Microenvironment, and Therapy. Stem Cells Int. 2016;2016.

Page 40 of 46
29. Singh SK, Climate B, Dyck V, Phylogenies TF, Compare EP, Hawkins C, et al. Identification of human brain tumour initiating cells. Nature [Internet]. 2004;432(November):396–401. Available from: http://dx.doi.org/10.1038/nature03128
30. Clément V, Dutoit V, Marino D, Dietrich PY, Radovanovic I. Limits of CD133 as a marker of glioma self-renewing cells. Int J Cancer. 2009;125(1):244–8.
31. Sergey V. Shmelkov, Jason M. Butler, Andrea T. Hooper, Adilia Hormigo, Jared Kushner, Till Milde, Ryan St. Clair, Muhamed Baljevic, Ian White, David K. Jin, Amy Chadburn, Andrew J. Murphy, David M. Valenzuela, Nicholas W. Gale, Gavin Thurston, George D. Y SR. CD133 expression is not restricted to metastatic colon cancer cells initiate tumors. J Clin Invest [Internet]. 2008;118(6):2111–20. Available from: www.jci.org/articles/view/34401
32. Watanabe K, Meyer MJ, Strizzi L, Lee JM, Bianco C, Nagaoka T, et al. Cripto-1 Is a Cell Surface Marker for a Tumorigenic, Undifferentiated Subpopulation in Human Embryonal Carcinoma Cells. 2010;28(8):1303–14.
33. Klauzinska M, Castro NP, Rangel MC, Spike BT, Gray PC, Bertolette D, et al. The multifaceted role of the embryonic gene Cripto-1 in cancer, stem cells and epithelial-mesenchymal transition. Semin Cancer Biol [Internet]. Elsevier Ltd; 2014;29(C):51–8. Available from: http://dx.doi.org/10.1016/j.semcancer.2014.08.003
34. Ebert AD, Wechselberger C, Nees M, Clair T, Schaller G, Martinez-Lacaci I, et al. Cripto-1-induced increase in vimentin expression is associated with enhanced migration of human Caski cervical carcinoma cells. Exp Cell Res. 2000;257(1):223–9.
35. Bianco C, Salomon DS. Targeting the embryonic gene Cripto-1 in cancer and beyond. 2010;20(12):1739–49.
36. Pauklin S, Vallier L. Activin/Nodal signalling in stem cells. Development [Internet]. 2015;142(4):607–19. Available from: http://dev.biologists.org/cgi/doi/10.1242/dev.091769
37. Strizzi L, Bianco C, Normanno N, Salomon D. Cripto-1: A multifunctional modulator during embryogenesis and oncogenesis. Oncogene. 2005;24(37):5731–41.
38. Mahmoudian RA, Abbaszadegan MR, Forghanifard MM, Moghbeli M, Moghbeli F, Chamani J, et al. Biological and Clinicopathological Significance of Cripto-1 Expression in the Progression of Human ESCC. Reports Biochem Mol Biol [Internet]. 2017;5(2):83–90. Available from: http://www.ncbi.nlm.nih.gov/pubmed/28367468
39. Strizzi L, Bianco C, Normanno N, Seno M, Wechselberger C, Wallace-Jones B, et al. Epithelial mesenchymal transition is a characteristic of hyperplasias and tumors in mammary gland from MMTV-Cripto-1 transgenic mice. J Cell Physiol. 2004;201(2):266–76.
40. Rangel MC, Karasawa H, Castro NP, Nagaoka T, Salomon DS, Bianco C. Role of Cripto-1 during epithelial-to-mesenchymal transition in development and cancer. Am J Pathol [Internet]. Elsevier Inc.; 2012;180(6):2188–200. Available from: http://dx.doi.org/10.1016/j.ajpath.2012.02.031
41. Larue L, Bellacosa A. Epithelial-mesenchymal transition in development and cancer: Role of phosphatidylinositol 3′ kinase/AKT pathways. Oncogene. 2005;24(50):7443–54.
42. Zeisberg M, Neilson EG. Biomarkers for epithelial-mesenchymal transitions. 2009;119(6):1429–37.

Page 41 of 46
43. Castro Pereira N, Rangel MC, Nagaoka T, Karasawa H, Salomon DS, Bianco C. Cripto-1: At the Crossroads of Embryonic Stem Cells and Cancer. Basic Biol to Bioeng [Internet]. 2011; Available from: http://dx.doi.org/10.5772/22800%5CnDO
44. Strizzi L, Postovit L-M, Marganyan N V., Seftor EA, Abbott DE, Seftor RE., et al. Emerging Roles of Nodal and Cripto-1: From Embryogenesis to Breast Cancer Progression. 2008;1–21.
45. Tysnes BB, Sætran HA, Mørk SJ, Margaryan N V., Eide GE, Petersen K, et al. Age-Dependent Association between Protein Expression of the Embryonic Stem Cell Marker Cripto-1 and Survival of Glioblastoma Patients. Transl Oncol [Internet]. 2013;6(6):732-IN33. Available from: http://linkinghub.elsevier.com/retrieve/pii/S1936523313800137
46. Pilgaard L, Mortensen JH, Henriksen M, Olesen P, Sørensen P, Laursen R, et al. Cripto-1 expression in glioblastoma multiforme. Brain Pathol. 2014;24(4):360–70.
47. Jensen SS, Aaberg-Jessen C, Andersen C, Schrøder HD, Kristensen BW. Glioma spheroids obtained via ultrasonic aspiration are viable and express stem cell markers: A new tissue resource for glioma research. Neurosurgery. 2013;73(5):868–86.
48. Jensen SS, Meyer M, Petterson SA, Halle B, Rosager AM, Aaberg-Jessen C, et al. Establishment and characterization of a tumor stem cell-based glioblastoma invasion model. PLoS One [Internet]. 2016;11(7). Available from: http://dx.doi.org/10.1371/journal.pone.0159746
49. Smith D, Mann D, Yong K. Cyclin D type does not influence cell cycle response to DNA damage caused by ionizing radiation in multiple myeloma tumours. Br J Haematol. 2016;173(5):693–704.
50. Tamura RE, Vasconcellos JF de, Sarkar D, Libermann TA, Fisher PB, Zerbini LF. GADD45 proteins: central players in tumorigenesis. 2012;1–31.
51. Beier D, Röhrl S, Pillai DR, Schwarz S, Kunz-Schughart LA, Leukel P, et al. Temozolomide preferentially depletes cancer stem cells in glioblastoma. Cancer Res. 2008;68(14):5706–15.
52. Radaelli E, Ceruti R, Patton V, Russo M, Degrassi A, Croci V, et al. Immunohistopathological and neuroimaging characterization of murine orthotopic xenograft models of glioblastoma multiforme recapitulating the most salient features of human disease. 2009;879–91.
53. de Vries NA, Beijnen JH, van Tellingen O. High-grade glioma mouse models and their applicability for preclinical testing. Cancer Treat Rev [Internet]. Elsevier Ltd; 2009;35(8):714–23. Available from: http://dx.doi.org/10.1016/j.ctrv.2009.08.011
54. Garros-Regulez L, Aldaz P, Arrizabalaga O, Moncho-Amor V, Carrasco-Garcia E, Manterola L, et al. mTOR inhibition decreases SOX2-SOX9 mediated glioma stem cell activity and temozolomide resistance. Expert Opin Ther Targets [Internet]. Taylor & Francis; 2016;20(4):393–405. Available from: http://www.tandfonline.com/doi/full/10.1517/14728222.2016.1151002
55. Yuan C, Gao J, Guo J, Bai L, Marshall C, Cai Z, et al. Dimethyl sulfoxide damages mitochondrial integrity and membrane potential in cultured astrocytes. PLoS One. 2014;9(9).
56. Zhang C, Deng Y, Dai H, Zhou W, Tian J, Bing G, et al. Effects of dimethyl sulfoxide on the morphology and viability of primary cultured neurons and astrocytes. Brain Res Bull [Internet]. Elsevier Inc.; 2017;128:34–9. Available from: http://dx.doi.org/10.1016/j.brainresbull.2016.11.004
57. Liu C-H, Chen L-H. Promotion of recombinant macrophage colony stimulating factor production by

Page 42 of 46
dimethyl sulfoxide addition in Chinese hamster ovary cells. J Biosci Bioeng [Internet]. 2007;103(1):45–9. Available from: http://linkinghub.elsevier.com/retrieve/pii/S1389172307700233
58. Eter N, Spitznas M. DMSO mimics inhibitory effect of thalidomide on choriocapillary endothelial cell proliferation in culture. Br J Ophthalmol. 2002;86(11):1303–5.
59. NCBI. GADD45G growth arrest and DNA damage inducible gamma [ Homo sapiens (human) ] [Internet]. [cited 2018 May 28]. Available from: https://www.ncbi.nlm.nih.gov/gene/10912

Page 43 of 46
APPENDIX
APPENDIX 1 – COLONY-FORMING UNIT (CFU) ASSAY PLATE SETUP
1 2 3 4 5 6 7 8 9 10 11 12
A 100 100 50 50 25 25 12.5 12.5 6,25 6,25 3.125 3.125
B 100 100 50 50 25 25 12.5 12.5 6,25 6,25 3.125 3.125
C 100 100 50 50 25 25 12.5 12.5 6,25 6,25 3.125 3.125
D 100 100 50 50 25 25 12.5 12.5 6,25 6,25 3.125 3.125
E 100 100 50 50 25 25 12.5 12.5 6,25 6,25 3.125 3.125
F 100 100 50 50 25 25 12.5 12.5 6,25 6,25 3.125 3.125
G 100 100 50 50 25 25 12.5 12.5 6,25 6,25 3.125 3.125
H 100 100 50 50 25 25 12.5 12.5 6,25 6,25 3.125 3.125

Page 44 of 46
CCND2 GADD45G
CR-1 YWHAZ
APPENDIX 2 – QPCR DATA OUTPUT
Standard curves:

Page 45 of 46
CCND2 GADD45G
CR-1 YWHAZ
CCND2 GADD45G
CR-1 YWHAZ
Amplification curves:
Melt curves:

Page 46 of 46
APPENDIX 3 – FLOW CYTOMETRY DATA OUTPUT
Side scatter (SSC) plotted against forward scatter (FSC) for the three GBM cell lines exposed to dou-
ble-cycle treatment with TMZ and DMSO.
U87 TMZ CFSE D0 U87 TMZ CFSE D3 U87 DMSO CFSE D0 U87 DMSO CFSE D3
T78 TMZ CFSE D0 T78 TMZ CFSE D3 T78 DMSO CFSE D0 T78 DMSO CFSE D3
T87 TMZ CFSE D0 T87 TMZ CFSE D3 T87 DMSO CFSE D0 T87 DMSO CFSE D3