Embed Size (px)
Citation preview
Etiology
Effect of Simulated Saline Cooling TowerDrift on Tree Foliage
B. A. Francis and C. R. Curtis
Former graduate research assistant, Department of Botany, University of Maryland, College Park, 20742; and professor, Department ofPlant Science, University of Delaware, Newark, 19711.
We thank J. Ayton, T. L. Lauver, L. Douglass, C. L. Mulchi, J. H. Hoyert, R. L. Green, and R. S. Nietubicz for assistance. Wealso thankstaff members of the Potomac Electric Power Company for cooperation and assistance.
Portion of a thesis submitted by the senior author to the Graduate School of the University of Maryland in partial fulfillment of therequirements for the M.S. degree.
Supported by the State of Maryland, Department of Natural Resources, Energy and Coastal Zone Administration, Power Plant SitingProgram. Additonal support was provided by the Water Resources Reserch Center, University of Maryland.
Accepted for publication 27 September 1978.
ABSTRACT
FRANCIS, B. A., and C. R. CURTIS. 1979. Effect of simulated saline cooling tower drift on tree foliage. Phytopathology 69:349-353.
Wet cooling towers used by industries and utilities to dissipate waste heat leaves showed significant injury. The intensity of tip and marginal necrosisoften release a saline aerosol drift into the surrounding atmosphere. To and Na÷ and Cl- concentrations increased with the number of sprays persimulate saline drift, water from a cooling tower basin was sprayed season. The CF concentration ranged from 3,145 to 9,000)#g/g dry weightrepeatedly during the growing season on small trees of Virginia pine (Pinus (dw) for mild to severe foliar necrosis, respectively. Corresponding Na*virginiana), tulip tree (Liriodendron tulipifera), California privet concentrations ranged from 167 to 1,418 mg/gdw. Injury was not related to(Ligustrum ovalifolium), Norway spruce (Picea abies), white ash (Fraxinus K+ or Ca*+ concentrations. Dogwood may be a useful bioindicator of salineamericana), and flowering dogwood (Cornus florida). Only dogwood drift.
Additional key words: air pollution.
Large amounts of industrial waste heat may be dissipated by These species were planted randomly within the four rows of eachtransferring it directly to the atmosphere by means of a wet cooling plot. An exception was one plot, designated l X, which containedtower. If brackish water or sea water are used for cooling purposes, 11 ash, 11 spruce, 10 tulip, and 8 dogwood trees.a wet cooling tower will release a saline aerosol known as drift All plots were weeded mechanically three times each season.which disperses downwind and eventually is intercepted by various Carbaryl insecticide was applied twice in 1975 to control Japanesesurfaces including the foliage of vegetation. Even though several beetles. Before the trees in older plots were sprayed in May 1976reports (2,20,30-33,37) on this environmental hazard have been they were pruned to a uniform height of 50 cm.published, the long term consequences of saline drift deposition on Simulated drift. Cooling tower basin water (CTBW) wasvegetation in a non-saline habitat still are not well understood. collected from the basin of a large natural draft, hyperbolic tower
One set of cooling tower models (24) predicted that the heaviest located at Chalk Point, MD, along the brackish Patuxent River.deposition of drift will occur downwind closest to the tower and Design and operating characteristics of this tower have beenthat the amount of salt deposited per unit area will decrease summarized elsewhere (9). Two collections of CTBW were made ininversely as the distance from the tower. Presumably, vegetation 1975 and only one in 1976. Chemical analyses of CTBW (Table I)closest to the emission source may be the most affected by drift, were performed by the University of Maryland Soils LaboratoryBernstein (3) suggested that the effects of changes in soil salinity (1).usually would be minor compared to that of foliar salt deposition. Cooling tower drift was simulated by spraying CTBW over the
The purposes of this study were to determine the symptoms trees with a hand-pushed sprayer which consisted of a reservoircaused by simulated saline drift on tree foliage under field tank pressurized by a CO 2 cylinder. The CTBW was forced throughconditions, and to determine the ion concentrations associated four TLX-SS I Conejet nozzles (Spraying Systems Co., Wheaton,with foliar injury. A preliminary report has been published (16). IL 60187) at 2.72 atm. The median droplet diameter size under
these conditions was about 100 vm which is within the range ofMATERIALS AND METHODS droplets expected to emanate from the Chalk Point cooling tower
(24). A pair of nozzles was mounted on a horizontal bar on eachField test plots. In March 1975, six field plots were established at side of the sprayer. The two bars were spaced 1.22 m apart and
the University of Maryland Tobacco Experimental Farm near positioned over the tree row. The two nozzles on each bar were 0.30Upper Marlboro, MD. Each plot measured 4.9 X II.0 m and m apart and each bar was oriented parallel to the direction of travel.contained four rows of 10 trees. The rows were spaced In this way, two tree rows were sprayed simultaneously as theapproximately 1.2 m apart with 1.8 m between plots. Each row sprayer passed between the rows.contained either 2-yr-old Virginia pines (Pinus virginiana Mill.) or Treatments. The amount of simulated cooling tower drift was1-yr-old flowering dogwoods (Cornus florida L.), tulip trees regulated by timed spray passes over trees. Prior to spraying,(Liriodendron tulipifera L.), or California privets (Ligustrum plastic fences were erected to reduce drift contamination betweenovalifolium Hassek.). adjacent plots. Since the salinity of CTBW changed according to
In March 1976, six additional plots were prepared. These the composition of the Patuxent River and cooling tower operatingcontained Norway spruce (Picea abies L. Karst.), white ash conditions, two separate samples of CTBW designated CTBW-I(Fraxinus americana L.), flowering dogwood, and tulip trees. and CTBW-2 were collected at different times for use in 1975. The
first sample, CTBW-I, was used to spray trees for the first five spray
00031-949X/79/000064$03.00/0 treatments from 7 July to 17 July 1975, and contained 8,685 ppm©1979 The American Phytopathological Society total soluble salts (TSS). The second sample, CTBW-2, was used 25
Vol. 69, No. 4,1979 349
times from 18 July until spraying was terminated on 22 Aug. 1975 Leaf collection and analyses. At the end of each season, leavesand contained 13,888 ppm TSS. The CTBW used in 1976 contained were collected for ion analyses. Plastic gloves always were worn10,200 ppm TSS in addition to other ions (Table 1). when handling leaves to prevent contamination. In 1975, 20 leaves
Initially spray nozzles were set 45 cm above ground level, were collected randomly from each dogwood tree in each plot. HalfHowever, to compensate for tree growth the nozzles were raised of each sample was submerged under about 6 L distilled water,to 109 cm prior to the 22nd spraying 1 1 Aug. in 1975. They re- gently shaken, then transferred to two other containers successivelymained at this height for the rest of 1975 and all of 1976. for similar washings. The remainder of the sample was not washed.
Spray was deposited on two rows per pass by pushing the sprayer In 1976, 40 leaves were collected from each dogwood and ash tree.the length of the plot in 13 sec. This treatment was designated 1X All of these samples were washed three times with distilled water asand covered all trees in the plot once. described. Samples were dried at 90 C for 48 hr, ground in a Wiley
In 1975 six treatments were applied: a no-spray (NS) control; a mill fitted with a 0.97-mm (20-mesh) screen and stored in glass vialstap water (Tap) control (two passes with tap water); and one (IX), until analyzed.two (2X), three (3X), and four (4X) passes with CTBW. Sprays Chloride (C1-) was determined by a chloride electrode andwere applied in the morning starting 7 July and 30 times thereafter modification of the potentiometric titration technique of LaCroix,through 22 Aug. et al (26). A 0.25 g leaf sample was shaken with 0. 1 N HNO 3 (50 ml)
In 1976 the NS, Tap, lX, and 2X plots prepared in 1975 for 15 minand then titratedwhilestirringwith0.01 N AgNO 3:0.1 N(designated old plots) were given the same treatments as in 1975. HNO 3. The end-point was the millivolt reading of a sample of theThe 3X and 4X plots of 1975 were not sprayed during the 1976 nitric acid used for extraction. Chloride standards were titrated atseason but were kept for observations of plant recovery from the beginning of each test series and a standard curve wasinjury. The NS, Tap, l X, and 2X treatments were repeated on four calculated by regression analysis. Two replications of each sampleof the six plots prepared in 1976 (designated new plots). The were analyzed. Results are reported in mg CE- per g leaf dry weightremaining two new plots received a 1/2X treatment by reducing (gdw).spray time, or a 1/ OX treatment by diluting one part CTBW with Analysis of cations in leaves. Because of the limited amount ofnine parts tap water. The 43 sprays began on 7 July 1976 and leaf tissue, cation analyses were carried out on bulked samples.continued through 3 Sept. 1976. Samples from each of the 10 trees of each species from each plot
Calculation of salt deposition. In 1975 an experiment was were placed randomly into two subgroups representing five trees.performed to estimate the rate of simulated drift deposition (17). One-half g samples of dried leaf tissue from each tree in a subgroupWith CTBW-2, one pass was approximately equal to 1.89 g were mixed together for a total of 2.5 g. These combined samplesTSS/plot. Assuming even distribution over the plot, this was were analyzed by atomic absorption. Samples were ashed at 495 Cequivalent to 0.353 kg TSS/ha. However, at a nozzle height of 109 for 12 hr, dissolved in 5 ml 20% (v/v) HCI and heated to boiling.cm, the spray pattern in calm air was 40 cm wide at ground level. This mixture was filtered through Whatman No. 40 ashless filterAssuming this pattern with a moving sprayer then only 17.6 m2 of paper and the filtrate was diluted to 100 ml with distilled water. Anthe plot received spray, at a rate equivalent to 1.074 kg TSS/ ha for additional 1 / 10 dilution of all samples was made. Samples for Na÷one pass. These estimates indicated a deposition range from 0.353 and K÷ analysis were diluted with distilled water and samples forto 1.074 kg TSS/ha for one pass (IX). Ca++ analysis were diluted with a 1% (w/v) SrCl 2 solution to
To obtain another estimate of salt deposition the following tests suppress interference. Two replicates of each sample for eachwere conducted on a relatively calm day. Seven-centimeter cation were analyzed.diameter disks of filter paper backed with Parafilm were placed in Soil analysis. Soil from each plot was sampled in 1976 before andI -cm diameter petri dishes. Five dishes were placed at each height after the spray season. Six random samples per plot were taken to aat ground level, 50 cm, and 100 cm in a plot along the tree rows and depth of 25 cm. These were bulked, mixed thoroughly, andsprayed with two passes of CTBW-2. Each filter paper disk and the analyzed for total soluble salts (1).rinse water from the upper Parafilm surface were placed in a flaskand analyzed for C1-. Average depositions calculated for CTBW-2 RESULTSper pass for 0, 50, and 100 cm were 0.100, 0.176, and 0.587 kgTSS/ha, respectively. These results, and similar calculations for Dogwood. In 1975, marginal and tip necrosis first appeared onother CTBW samples, indicated that the range for one pass was the leaves of trees that had received the two heaviest sprayabout 0.1 to 1.0 kg TSS/ha depending upon the calculation treatments (3X and 4X) after the seventh spraying. In 1976 leafmethod, height of receptor surface, and wind conditions. At the 50 necrosis first appeared on trees that had received the most severecm height, the depositions of CTBW-2 and CTBW collected in 1976 treatment (2X) after the eleventh spraying. Leaf wrinkling andwere about 0.176 and 0.129 kg TSS/ha for one pass, respectively, curling were observed on all trees with foliar necrosis. Typically,
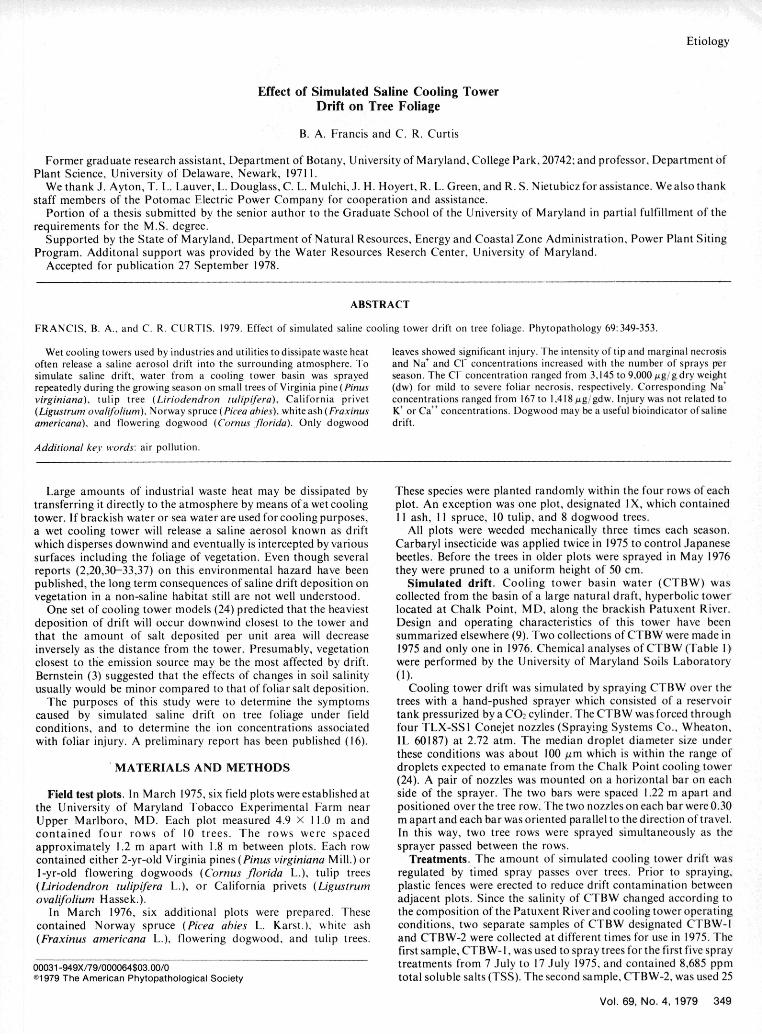
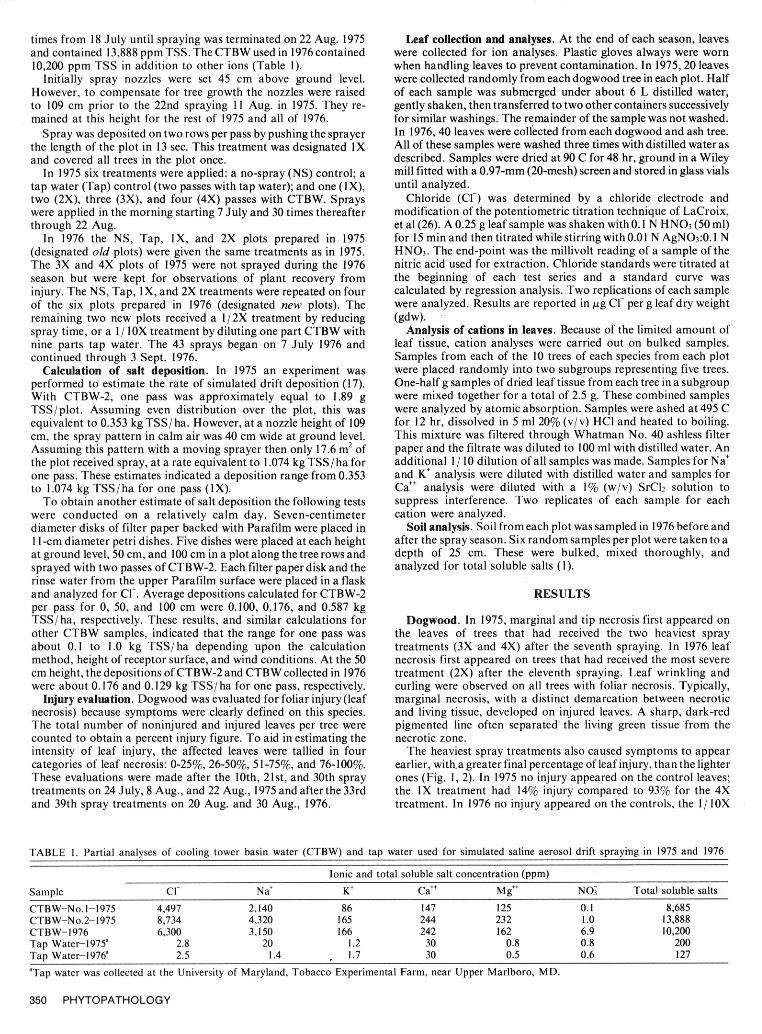
Injury evaluation. Dogwood was evaluated for foliar injury (leaf marginal necrosis, with a distinct demarcation between necroticnecrosis) because symptoms were clearly defined on this species. and living tissue, developed on injured leaves. A sharp, dark-redThe total number of noninjured and injured leaves per tree were pigmented line often separated the living green tissue from thecounted to obtain a percent injury figure. To aid in estimating the necrotic zone.intensity of leaf injury, the affected leaves were tallied in four The heaviest spray treatments also caused symptoms to appearcategories of leaf necrosis: 0-25%, 26-50%, 51-75%, and 76-100%. earlier, witha greater final percentage of leaf injury, than the lighterThese evaluations were made after the 10th, 21st, and 30th spray ones (Fig. 1, 2). In 1975 no injury appeared on the control leaves;treatments on 24 July, 8 Aug., and 22 Aug., 1975 and after the 33rd the IX treatment had 14% injury compared to 93% for the 4Xand 39th spray treatments on 20 Aug. and 30 Aug., 1976. treatment. In 1976 no injury appeared on the controls, the 1/ lOX
TABLE i. Partial analyses of cooling tower basin water (CTBW) and tap water used for simulated saline aerosol drift spraying in 1975 and 1976
Ionic and total soluble salt concentration (ppm)
Sample C1- Na+ K÷ Ca++ Mg9+ N03 Total soluble salts.
CTBW-No.1-1975 4,497 2,140 86 147 125 0.1 8,685CTBW-No.2-1975 8,734 4,320 165 244 232 1.0 13,888CTBW-1976 6,300 3,150 166 242 162 6.9 10,200Tap Water-1975' 2.8 20 1.2 30 0.8 0.8 200Tap Water-1976a 2.5 1.4 1.7 30 0.5 0.6 127aTap water was collected at the University of Maryland, Tobacco Experimental Farm, near Upper Marlboro, MD.
350 PHYTOPATHOLOGY
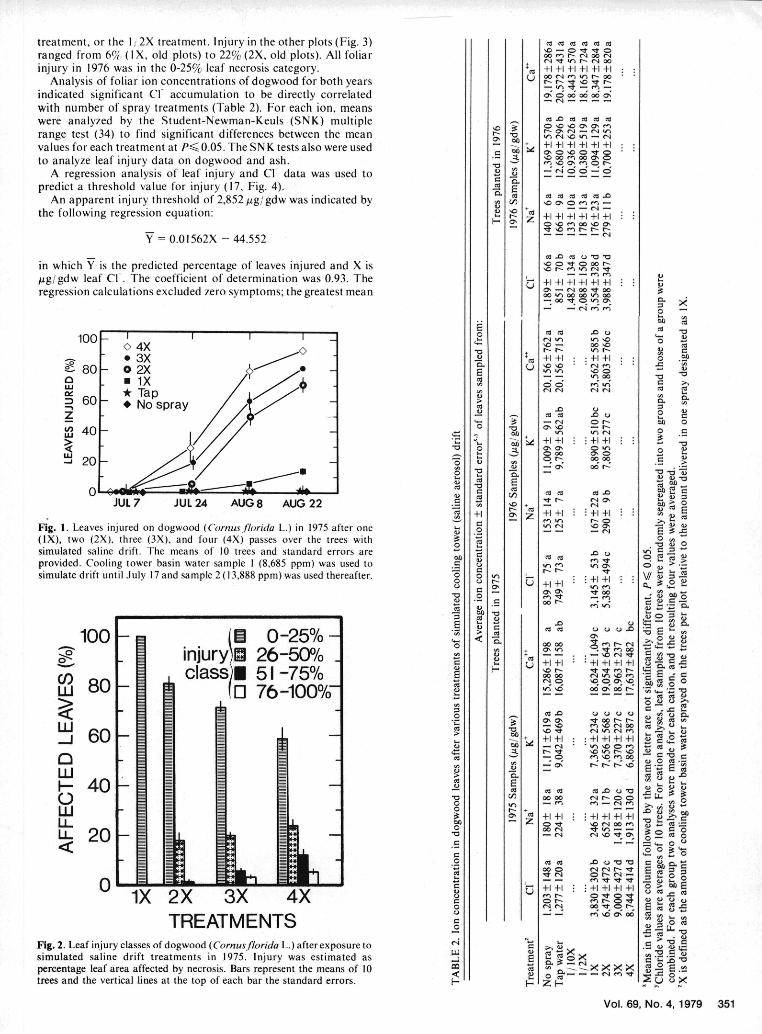
treatment, or the I 2X treatment. Injury in the other plots (Fig. 3) co Uc U t ,Cranged from 6% (I X, old plots) to 22% (2X, old plots). All foliar 0 C 0 C4injury in 1976 was in the 0-25% leaf necrosis category. + +1 +1 +1 +1 +1+1
Analysis of foliar ion concentrations of dogwood for both years ý_• t : -,r r-indicated significant cr accumulation to be directly correlated a, 0 00 00 cowith number of spray treatments (Table 2). For each ion, meanswere analyzed by the Student-Newman-Keuls (SNK) multiple M 0 , ,range test (34) to find significant differences between the mean W, " ý, I-values for each treatment at P,< 0.05. The SN K tests also were used .+ + + on +1 +1 +1to analyze leaf injury data on dogwood and ash. 0n ,cý C, n o r-
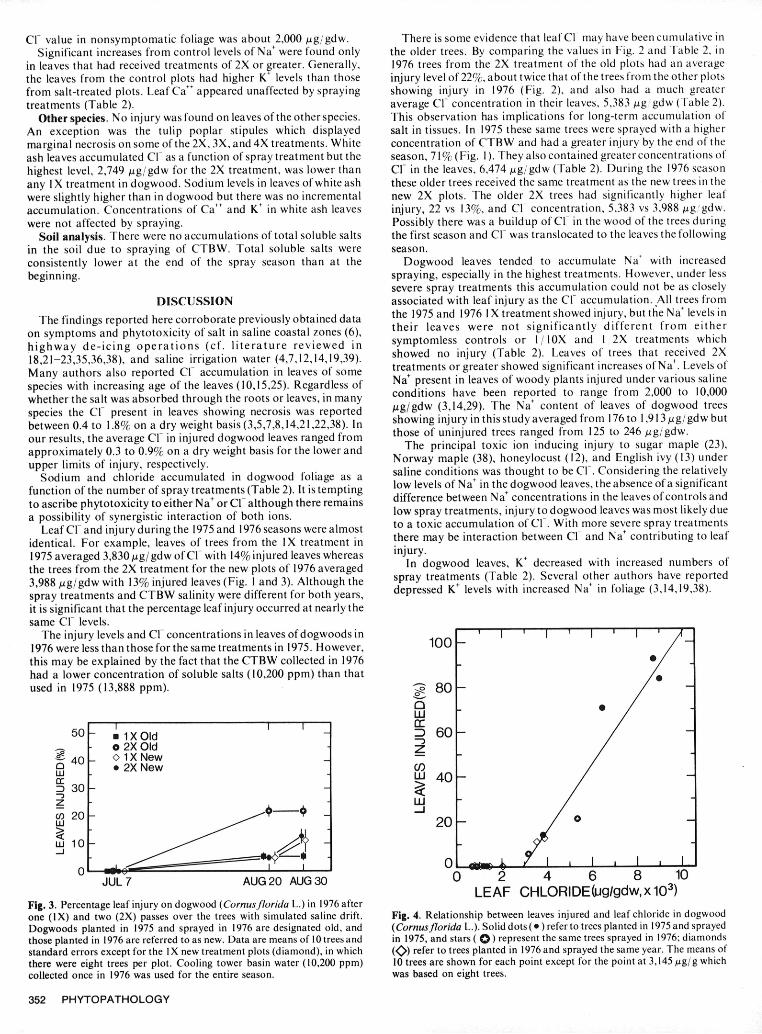
A regression analysis of leaf injury and CI- data was used to 2 " "predict a threshold value for injury (17, Fig. 4).
An apparent injury threshold of 2,852 Mg/lgdw was indicated by , o o one_"the following regression equation: +1+1 +1 +1 +1 +1
- 0 ID en 0c0 ID a
Y 0.01562X -44.552
MU.0 MU O"O 0in which Y is the predicted percentage of leaves injured and X is C 0 - 0 00 r-pg/gdw leaf Cl-. The coefficient of determination was 0.93. The + +regression calculations excluded zero symptoms; the greatest mean a - " 0 o1* 0,
.-:o, o -, • ;
100 - W), ao
-- ,•60t.O sra /X • 0 .•
~-80 2X C CU
mi xO-0 *T••ap0 00 IC
0 UL e U2 3XG AU 2 + 1 +1~ : +t+1 0
0 . 1. Le0e Cnjre ondgod(onsioide.nn17 fe ne". . .•I =a
zn 0-N rr- PIN0
" ,-o. ,2O
6"20 - >
y-l 2 50% •, : .
in No spa .. Z ,+ ,+ ,+Z 0
d CU &E
Ff --- "0 0
provided. Cooingury towsserbasingwater(sampleflr(8,68.)ppm)rwasp toON i 0,
simulatedsln drift unitJlr7enatmpent 2(197888 ppm)r was uedstherafter.a a r- ;r- " -
CU 0 r; 1C f)
a, l 69, No , 99 5
0.C C.)..
CU CUC rA Od
(IX, CUo QX) the (3),an ou (X psssovr h tee it 0
W CU +1H4 en CU t CU.0 0W0 r- - --:
Ii cc CU +1+ U++ + '.0u~20 -(N ON\ 0
inuy0 2 -0 - - ~ac +1 +1 74-I+1I+'1+'1~c1. r')- -- e t- 0 0
as or- -e r- u U U
U 00ý14 - in"0 en - .0
perenag lefae fetdbEerss asrpeettemaso 0C CU0C,
Z 00 2:tree an the verica line at the to ofec a hesadr ror.H.zVol 69, No. 0,9 351
CI- value in nonsymptomatic foliage was about 2,000 mg/gdw. There is some evidence that leaf Cl- may have been cumulative inSignificant increases from control levels of Na' were found only the older trees. By comparing the values in Fig. 2 and Table 2, in
in leaves that had received treatments of 2X or greater. Generally, 1976 trees from the 2X treatment of the old plots had an averagethe leaves from the control plots had higher K" levels than those injury level of 22%, about twice that of the trees from the other plotsfrom salt-treated plots. Leaf Ca"+ appeared unaffected by spraying showing injury in 1976 (Fig. 2), and also had a much greatertreatments (Table 2). average CI- concentration in their leaves, 5,383 mg'gdw (Table 2).
Other species. No injury was found on leaves of the other species. This observation has implications for long-term accumulation ofAn exception was the tulip poplar stipules which displayed salt in tissues. In 1975 these same trees were sprayed with a highermarginal necrosis on some of the 2X, 3X, and 4X treatments. White concentration of CTBW and had a greater injury by the end of theash leaves accumulated CI- as a function of spray treatment but the season, 71% (Fig. I). They also contained greater concentrations ofhighest level, 2,749 mg/gdw for the 2X treatment, was lower than CF in the leaves, 6,474 yg/gdw (Table 2). During the 1976 seasonany IX treatment in dogwood. Sodium levels in leaves of white ash these older trees received the same treatment as the new trees in thewere slightly higher than in dogwood but there was no incremental new 2X plots. The older 2X trees had significantly higher leafaccumulation. Concentrations of Ca"+ and K+ in white ash leaves injury, 22 vs 13%, and CF- concentration, 5,383 vs 3,988 ugigdw.were not affected by spraying. Possibly there was a buildup of Cl- in the wood of the trees during
Soil analysis. There were no accumulations of total soluble salts the first season and CF- was translocated to the leaves the followingin the soil due to spraying of CTBW. Total soluble salts were season.consistently lower at the end of the spray season than at the Dogwood leaves tended to accumulate Na' with increasedbeginning, spraying, especially in the highest treatments. However, under less
severe spray treatments this accumulation could not be as closelyDISCUSSION associated with leaf injury as the CF- accumulation. All trees from
The findings reported here corroborate previously obtained data the 1975 and 1976 1X treatment showed injury, but the Na& levels in
on symptoms and phytotoxicity of salt in saline coastal zones (6), their leaves were not significantly different from either
highway de-icing operations (cf. literature reviewed in symptomless controls or I/lOX and I 2X treatments which
18,21-23,35,36,38), and saline irrigation water (4,7,12,14,19,39). showed no injury (Table 2). Leaves of trees that received 2X
Many authors also reported CI- accumulation in leaves of some treatments or greater showed significant increases of Na'. Levels of
species with increasing age of the leaves (10,15,25). Regardless of Na+ present in leaves of woody plants injured under various saline
whether the salt was absorbed through the roots or leaves, in many conditions have been reported to range from 2,000 to 10,000
species the CF- present in leaves showing necrosis was reported 4g/gdw (3,14,29). The Na÷ content of leaves of dogwood trees
between 0.4 to 1.8% on a dry weight basis (3,5,7,8,14,21,22,38). In showing injury in this study averaged from 176to 1,913ug/gdw but
our results, the average C1- in injured dogwood leaves ranged from those of uninjured trees ranged from 125 to 246 mg/gdw.
approximately 0.3 to 0.9% on a dry weight basis for the lower and The principal toxic ion inducing injury to sugar maple (23),
upper limits of injury, respectively. Norway maple (38), honeylocust (12), and English ivy (13) under
Sodium and chloride accumulated in dogwood foliage as a saline conditions was thought to be Cl. Considering the relatively
function of the number of spray treatments (Table 2). It is tempting low levels of Na+ in the dogwood leaves, the absence of a significantto ascribe phytotoxicity to either Na÷ or CI- although there remains difference between Na÷ concentrations in the leaves of controls anda possibility of synergistic interaction of both ions. low spray treatments, injury to dogwood leaves was most likely due
Leaf CF- and injury during the 1975 and 1976 seasons were almost to a toxic accumulation of CI. With more severe spray treatmentsidentical. For example, leaves of trees from the IX treatment in there may be interaction between Cy. and Na contributing to leaf1975 averaged 3,830 Ag/gdw of CF- with 14% injured leaves whereas injury.the trees from the 2X treatment for the new plots of 1976 averaged In dogwood leaves, K( decreased with increased numbers of3,988 tg/gdw with 13% injured leaves (Fig. I and 3). Although the spray treatments (Table 2). Several other authors have reportedspray treatments and CTBW salinity were different for both years, depressed K+ levels with increased Na÷ in foliage (3,14,19,38).it is significant that the percentage leaf injury occurred at nearly thesame CF- levels.
The injury levels and CF- concentrations in leaves of dogwoods in1976 were less than those for the same treatments in 1975. However, 100-
this may be explained by the fact that the CTBW collected in 1976 0
had a lower concentration of soluble salts (10,200 ppm) than thatused in 1975 (13,888 ppm). 80 -
0
50 1 X Old D 60o 2X Old -
3. 40- 0 1 X New ZO 9 2X New CITW W 40-
30 -z wcn20 -J _.1wJ 20 0
L 10 -01 0 "-M 0_. ___.. 1 1 1 1 , I_, I0
JUL 7 AUG 20 AUG 30 0 2 4 6 8 10LEAF CHLORIDE(,ug/gdw, x 103)
Fig. 3. Percentage leaf injury on dogwood (Cornusflorida L.) in 1976 afterone (IX) and two (2X) passes over the trees with simulated saline drift. Fig. 4. Relationship between leaves injured and leaf chloride in dogwoodDogwoods planted in 1975 and sprayed in 1976 are designated old, and (Cornusflorida L.). Solid dots (e ) refer to trees planted in 1975 and sprayedthose planted in 1976 are referred to as new. Data are means of 10 trees and in 1975, and stars ( 0) represent the same trees sprayed in 1976; diamonds
standard errors except for the IX new treatment plots (diamond), in which (0) refer to trees planted in 1976 and sprayed the same year. The means ofthere were eight trees per plot. Cooling tower basin water (10,200 ppm) 10 trees are shown for each point except for the point at 3,145 Ag/g whichcollected once in 1976 was used for the entire season. was based on eight trees.
352 PHYTOPATHOLOGY
Natural levels of Ca++ in dogwood leaves are relatively high, ing tower drift on dogwood foliage. (Abstr.). Proc. Am. Phytopathol.ranging from 1.72 to 2.90% (27,28). Concentrations measured in Soc. 3:324-325.this study (1.53 to 2.58%) were consistent with this natural range. 17. FRANCIS, B. A. 1977. Effects of simulated saline cooling tower driftNo association between Ca'~ concentrations and leaf injury was on woody species. M. S. Thesis, University of Maryland, College Park,
found. Leaf injury due to salinity is not often associated with high MD. 69 pp.
Caf n levels (14,19,38). 18. HANES, R. E., L. W. ZELAZNY, and R. E. BLASET. 1970. Effectsof de-icing salts on water quality and biota. Nat. Coop. Highway Res.
Slight leaf injury appeared on only a few ash trees. Levels of C1- Program Rep. 91. Highway Research Board, National Academy ofin ash leaves were less than those of similarly treated dogwoods. Sciences, Washington, D. C. 70 pp.The treatments and Ag/gdw CI levels in ash leaveswereasfollows: 19. HARDING, R. B., M. P. MILLER, and M. FIREMAN. 1958.no spray, 324; tap water spray, 290; 1/OX, 437; 1/2X, 922; IX, Absorption of salts by citrus leaves during sprinkling with water1,443; 2X, 2,749. The no-spray and tap water spray were not suitable for surface irrigation. Proc. Am. Soc. Hortic. Sci. 71:248-256.significantly different but all other treatments were different as 20. HINDAWI, I. J., L. C. RANIERE, and J. A. REA. 1976. Ecological
indicated by the SNK test. A few leaves from two trees of the 2X effects of aerosol drift from a saltwater cooling system. U.S. Environ-texhibited marginal necrosis but no injury was apparent mental Protection Agency. Ecological Research Series, EPA-600 3-
treatment In a si stut n der g rent 76-078. NTIS. 102 pp.on any other treatment. In a similar study under greenhouse 21. HOFSTRA, G., and R. HALL. 1971. Injury on roadside trees: leafconditions, white ash was reported to be slightly more susceptible injury on pine and white cedarin relation to foliar levels of sodium andthan dogwood to injury induced by saline aerosols (30). Field chloride. Can. J. Bot. 49:613-622.conditions used in our study probably moderated the response of 22. HOLMES, F. W. 1961. Salt injury to trees. Phytopathology 51:712-ash trees to saline aerosol. The accumulation of C1- and Na' by 718.dogwood foliage and subsequent injury beyond certain levels 23. HOLMES, F. W., and J. H. BAKER. 1966. Salt injury to trees. I1.suggest that dogwood species may serve as an excellent salt drift Sodium and chloride in roadside sugar maples in Massachusetts.
bioindicator in field studies (11). Phytopathology 56:633-636.24. ISRAEL, G. W., and T. J. OVERCAMP. 1974. Driftdeposition model
for natural draft cooling towers. Pages 614-628 in S. R. Hanna and J.
LITERATURE CITED Pell, eds. Cooling Tower Environment-1974. E. R. D. A. CONF-740302. NTIS. 638 pp.
1. BANDEL, V. A., and C. E. RIVARD. 1975. Soil testing methods, 25. KOFRANEK, A. M., H. C. KOHL, JR., and 0. R. LUNT. 1958.University of Maryland soil testing laboratory. Univ. Md. Agron. Effects of excess salinity and boron on geraniums. Proc. Am. Soc.Mimeo No. 37. Hortic. Sci. 71:516-521.
2. BARTLIT, J. R., and M. D. WILLIAMS. 1975. Environmental 26. LaCROIX, R. L., D. R. KEENEY, and L. M. WALSH. 1970. Poten-impact of cooling towers. Materials Performance 14:39-41. tiometric titration of chloride in plant tissue extracts using the chloride
3. BERNSTEIN, L. 1975. Effects of salinity and sodicity on plant growth. ion electrode. Soil Sci. Plant Anal. 1:1-6.Annu. Rev. Phytopathol. 13:295-312. 27. LAY, D. W. 1957. Browse quality and the effects of prescribed burning
4. BERNSTEIN, L., and L. E. FRANCOIS. 1973. Comparisons of drip in southern pine forests. J. For. 55:342-347.furrow, and sprinkler irrigation. Soil Sci. 115:73-86. 28. LESSER, W. A., and J. D. WISTENDAHL. 1974. Dogwoods. Pages
5. BERNSTEIN, L., and H. E. HAYWARD. 1958. Physiology of salt 32-41 in J. D. Gill and W. M. Healy, eds. Shrubs and Vines for North-tolerance. Annu. Rev. Plant Physiol. 9:25-46. eastern Wildlife. U.S. Dep. Agric. Forest Serv. Gen. Tech. Rep. NE-9.
6. BOYCE, S. G. 1954. The salt spray community. Ecolog. Monogr. 180 pp.24:29-67. 29. LUNT, 0. R. 1966. Sodium. Pages 409-432 in H. D. Chapman, ed.
7. BROWN, J. W., C. H. WADLEIGH, and H. E. HAYWARD. 1953. Diagnostic Criteria for Plants and Soils. University of CaliforniaFoliar analysis of stone-fruit and almond trees on saline substrates. Division of Agricultural Sciences, Berkeley. 793 pp.Proc. Am. Soc. Hortic. Sci. 61:49-55. 30. McCUNE, D. C., D. H. SILBERMAN, R. H. MANDL, L. H.
8. COOPER, W. C., B. S. GORTON, and E. 0. OLSON. 1952. Ionic WEINSTEIN, P. C. FRUEDENTHAL, and P. S. GIARDINA. 1976.accumulation in citrus, as influenced by rootstock and scion and con- Studies on the effects of saline aerosols of cooling tower origin oncentration of salts and boron in the substrate. Plant Physiol. 27:i91-203. plants. J. Air Pollut. Contr. Assoc. 27:319-324.
9. CURTIS, C. R., T. L. LAUVER, and B. A. FRANCIS. 1976. Cooling 31. MULCHI, C. L., D. C. WOLF, J. E. FOSS, and J. A. ARM-tower effects on native perennial vegetation. Pre-operational report. BRUSTER. 1976. Cooling tower effects on crops and soils. Pre-Water Resources Research Center, Spec. Report No. 2. PPSP- operational report. Water Resources Research Center, Spec. Rep. No.CPCTP-7. University of Maryland, College Park, MD. 51 pp. 1. PPSP-CPCTP-6. University of Maryland, College Park, MD. 99 pp.
10. CURTIS, C. R., T. L. LAUVER, and B. A. FRANCIS. 1977. Foliar 32. NICHOLAS, G. W., and P. M. SOPOCY. 1974. Evaluation of coolingsodium and chloride in trees: seasonal variations. Environ. Pollut. tower environmental effects. Combustion 46:34-41.14:69-80. 33. PARR, P. D., F. G. TAYLOR, JR., and J. J. BEAUCHAMP. 1976.
11. CURTIS, C. R., B. A. FRANCIS, and T. L. LAUVER. 1978. Dog- Sensitivity of tobacco to chromium from mechanical-draft coolingwood as a bioindicator species for saline drift. Ch. I, pages. 65-75 in tower drift. Atmos. Environ. 10:421-423.Cooling Tower Environment-1978. PPSP-CPCTP-22, WRRC Spec. 34. SOKAL, R. R., and F. J. ROHILF. 1969. Biometry. W. H. FreemanRep. No. 9, Water Resources Research Center, University of Maryland. and Co., San Francisco. 776 pp.College Park, MD. 455 pp. 35. SMITH, W. H. 1973. Metal contamination of urban woody plants.
12. DIRR, M. A. 1974. Tolerance of honeylocust seedlings to soil-applied Environ. Sci. Technol. 7:631-636.salts. Hortscience 9:53-54. 36. SUCOFF, E. 1975. Effects of de-icing salts on woody vegetation along
13. DIRR, M. A. 1975. Effects of saltsand application methods on English Minnesota roads. Minn. Agric. Exp. Stn. Bull. 303.49 pp.ivy. Hortscience 10:132-184. 37. TAYLOR, F. G., JR., L. K. MANN, R. C. DAHLMAN, and F. L.
14. EHLIG, C. F., and L. BERNSTEIN. 1959. Foliar absorption of MILLER. 1975. Environmental effects of chromium and zinc insodium and chloride as a factor in sprinkler irrigation. Proc. Am. Soc. cooling-water drift. Pages 408-426 in S. Hanna and J. Pell, eds. CoolingHortic. Sci. 74:661-670. Tower Environment-1974. E. R. D. A. Symposium Series, CONF-
15. EMBLETON, T. W., W. W. JONES, J. D. KIRKPATRICK, and D. 740302. Technical Information Center, Oak Ridge, TN. 638 pp.GREGORY-ALLEN. 1958. Influence of sampling date, season, and 38. WALTON, G. S. 1969. Phytotoxicity of NaCI and CaCI2 to Norwayfertilization on macronutrients in Fuerte avocado leaves. Proc. Am. maples. Phytopathology 59:1412-1415.Soc. Hortic. Sci. 72:309-320. 39. WOODHAM, R. C. 1956. The chloride status of the irrigated Sultana
16. FRANCIS, B. A., and C. R. CURTIS. 1976. Effects of simulated cool- vine and its relation to vine health. Austr. J. Agric. Res. 7:414-427.
Vol. 69, No. 4,1979 353