Embed Size (px)
Citation preview
Effect of slabs on the seismic response of a three dimensional wall-type building structure
*Han Seon Lee1) and Kyung Ran Hwang2)
1), 2) School of Civil, Environmental, and Architectural Engineering, Korea University,
Seoul 136-713, Korea. 1) [email protected]
ABSTRACT
This study presents the result of analytical simulation of shake-table responses of a 1:5 scale 10-story reinforced concrete residential building model by using the inelastic analysis program, PERFORM-3D (Computers & Structures, Inc. 2006). The following conclusions are drawn from analytical results: (1) In the model, which ignores the flexural rigidity of the slab and coupling beam, the natural period, initial stiffness, and maximum strength representing the global responses are considerably lower than those of the models with slab and coupling beam elements. And, (2) the membrane action in tension and compression due to combined effect of strong wall-to-wall and wall-to-slab interaction can increase significantly the capacity of the overturning moment. 1. INTRODUCTION The number of apartment dwelling units (8,576,013) is more than 58.4% of the total number (14,677,419) in Korea (Korea National Statistical Office, KNSO 2010). These residential apartment buildings such as shown in Fig. 1 generally consist of high-rise reinforced concrete (RC) wall structures. The style of these RC structures is unique around the world and the seismic performance of these structures has been investigated with due interest, neither in Korea nor abroad, except a few studies. In 1999 Turkey earthquake, the RC box-type wall buildings, constructed by using tunnel form techniques, were found to perform well under the earthquake. Balkaya and Kalkan (2003, 2004) investigated the seismic performance of these RC box-type structures by conducting three-dimensional (3D) finite element pushover analysis to evaluate the influence of the different size and location of openings and the wall-to-wall and wall-to-slab interactions. The interaction effects of the slabs and transverse walls increased the overall capacity of the pierced shear walls in spite of the door openings introducing a strong disruption of the shear flow between walls. Yuksel and Kalkan (2007, 2008) performed the experimental and analytical researches on the seismic behavior of the box-type building using two 1:5 scale 4-story specimens under quasi-static cyclic lateral
1) Professor 2) Graduate Student
2630
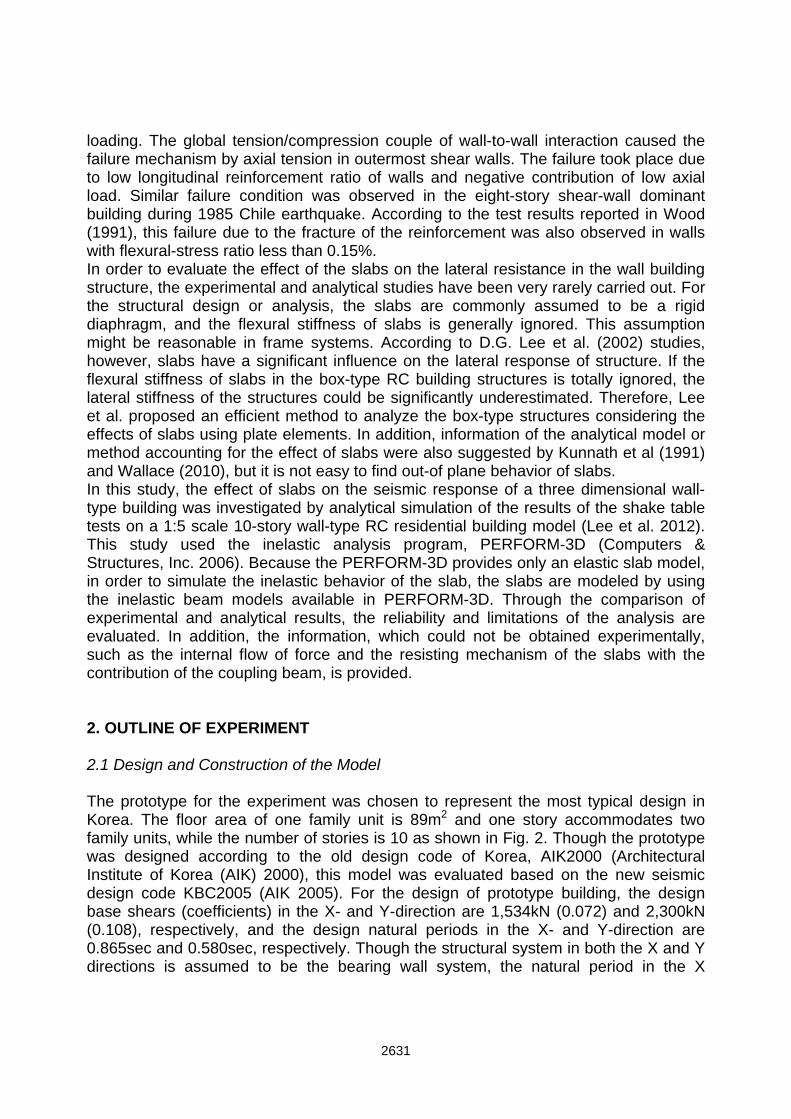
loading. The global tension/compression couple of wall-to-wall interaction caused the failure mechanism by axial tension in outermost shear walls. The failure took place due to low longitudinal reinforcement ratio of walls and negative contribution of low axial load. Similar failure condition was observed in the eight-story shear-wall dominant building during 1985 Chile earthquake. According to the test results reported in Wood (1991), this failure due to the fracture of the reinforcement was also observed in walls with flexural-stress ratio less than 0.15%. In order to evaluate the effect of the slabs on the lateral resistance in the wall building structure, the experimental and analytical studies have been very rarely carried out. For the structural design or analysis, the slabs are commonly assumed to be a rigid diaphragm, and the flexural stiffness of slabs is generally ignored. This assumption might be reasonable in frame systems. According to D.G. Lee et al. (2002) studies, however, slabs have a significant influence on the lateral response of structure. If the flexural stiffness of slabs in the box-type RC building structures is totally ignored, the lateral stiffness of the structures could be significantly underestimated. Therefore, Lee et al. proposed an efficient method to analyze the box-type structures considering the effects of slabs using plate elements. In addition, information of the analytical model or method accounting for the effect of slabs were also suggested by Kunnath et al (1991) and Wallace (2010), but it is not easy to find out-of plane behavior of slabs. In this study, the effect of slabs on the seismic response of a three dimensional wall-type building was investigated by analytical simulation of the results of the shake table tests on a 1:5 scale 10-story wall-type RC residential building model (Lee et al. 2012). This study used the inelastic analysis program, PERFORM-3D (Computers & Structures, Inc. 2006). Because the PERFORM-3D provides only an elastic slab model, in order to simulate the inelastic behavior of the slab, the slabs are modeled by using the inelastic beam models available in PERFORM-3D. Through the comparison of experimental and analytical results, the reliability and limitations of the analysis are evaluated. In addition, the information, which could not be obtained experimentally, such as the internal flow of force and the resisting mechanism of the slabs with the contribution of the coupling beam, is provided. 2. OUTLINE OF EXPERIMENT 2.1 Design and Construction of the Model The prototype for the experiment was chosen to represent the most typical design in Korea. The floor area of one family unit is 89m2 and one story accommodates two family units, while the number of stories is 10 as shown in Fig. 2. Though the prototype was designed according to the old design code of Korea, AIK2000 (Architectural Institute of Korea (AIK) 2000), this model was evaluated based on the new seismic design code KBC2005 (AIK 2005). For the design of prototype building, the design base shears (coefficients) in the X- and Y-direction are 1,534kN (0.072) and 2,300kN (0.108), respectively, and the design natural periods in the X- and Y-direction are 0.865sec and 0.580sec, respectively. Though the structural system in both the X and Y directions is assumed to be the bearing wall system, the natural period in the X
2631
direction was estimated by assuming a RC moment frame with that in the Y-direction obtained by using the equation for “other structures”. Because the amount of the walls in the X-directional frames are nearly 40% of than those in the Y-directional frames, the X-directional periods obtained by using “other structures” could be considerably underestimated.
(a) Elevation (b) Plan
Fig. 1 RC residential buildings in Korea
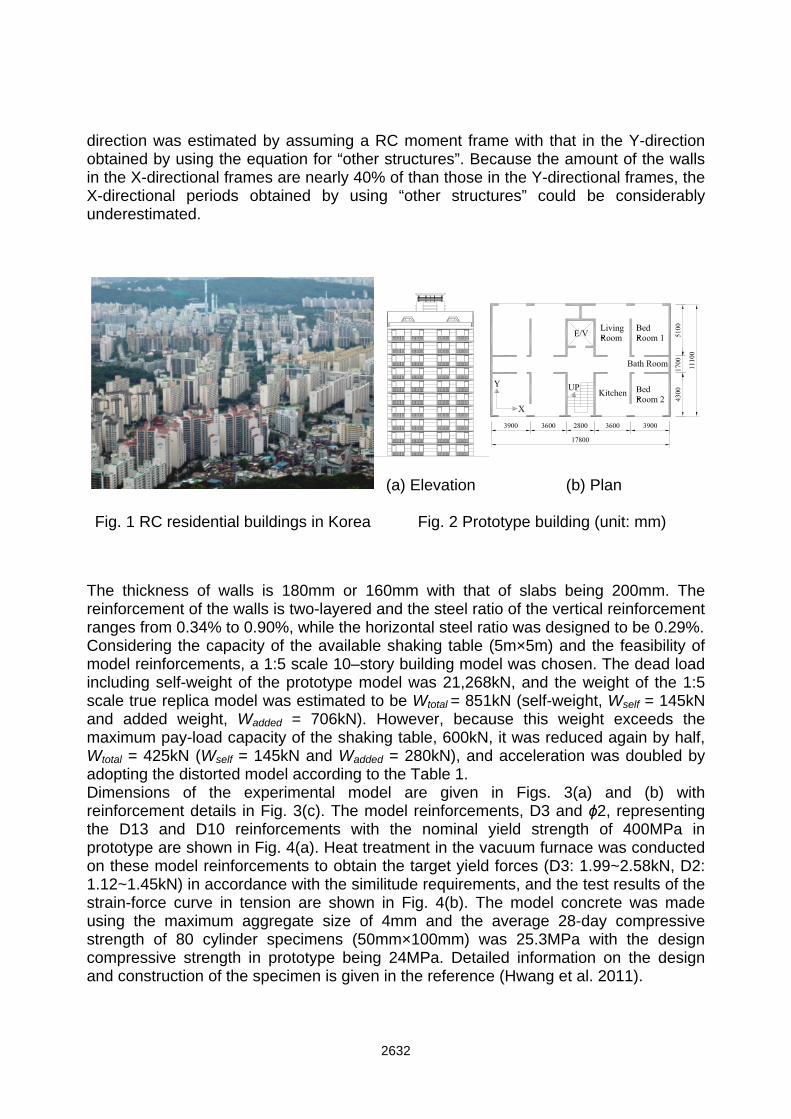
Fig. 2 Prototype building (unit: mm) The thickness of walls is 180mm or 160mm with that of slabs being 200mm. The reinforcement of the walls is two-layered and the steel ratio of the vertical reinforcement ranges from 0.34% to 0.90%, while the horizontal steel ratio was designed to be 0.29%. Considering the capacity of the available shaking table (5m×5m) and the feasibility of model reinforcements, a 1:5 scale 10–story building model was chosen. The dead load including self-weight of the prototype model was 21,268kN, and the weight of the 1:5 scale true replica model was estimated to be Wtotal = 851kN (self-weight, Wself = 145kN and added weight, Wadded = 706kN). However, because this weight exceeds the maximum pay-load capacity of the shaking table, 600kN, it was reduced again by half, Wtotal = 425kN (Wself = 145kN and Wadded = 280kN), and acceleration was doubled by adopting the distorted model according to the Table 1. Dimensions of the experimental model are given in Figs. 3(a) and (b) with reinforcement details in Fig. 3(c). The model reinforcements, D3 and ϕ2, representing the D13 and D10 reinforcements with the nominal yield strength of 400MPa in prototype are shown in Fig. 4(a). Heat treatment in the vacuum furnace was conducted on these model reinforcements to obtain the target yield forces (D3: 1.99~2.58kN, D2: 1.12~1.45kN) in accordance with the similitude requirements, and the test results of the strain-force curve in tension are shown in Fig. 4(b). The model concrete was made using the maximum aggregate size of 4mm and the average 28-day compressive strength of 80 cylinder specimens (50mm×100mm) was 25.3MPa with the design compressive strength in prototype being 24MPa. Detailed information on the design and construction of the specimen is given in the reference (Hwang et al. 2011).
2632
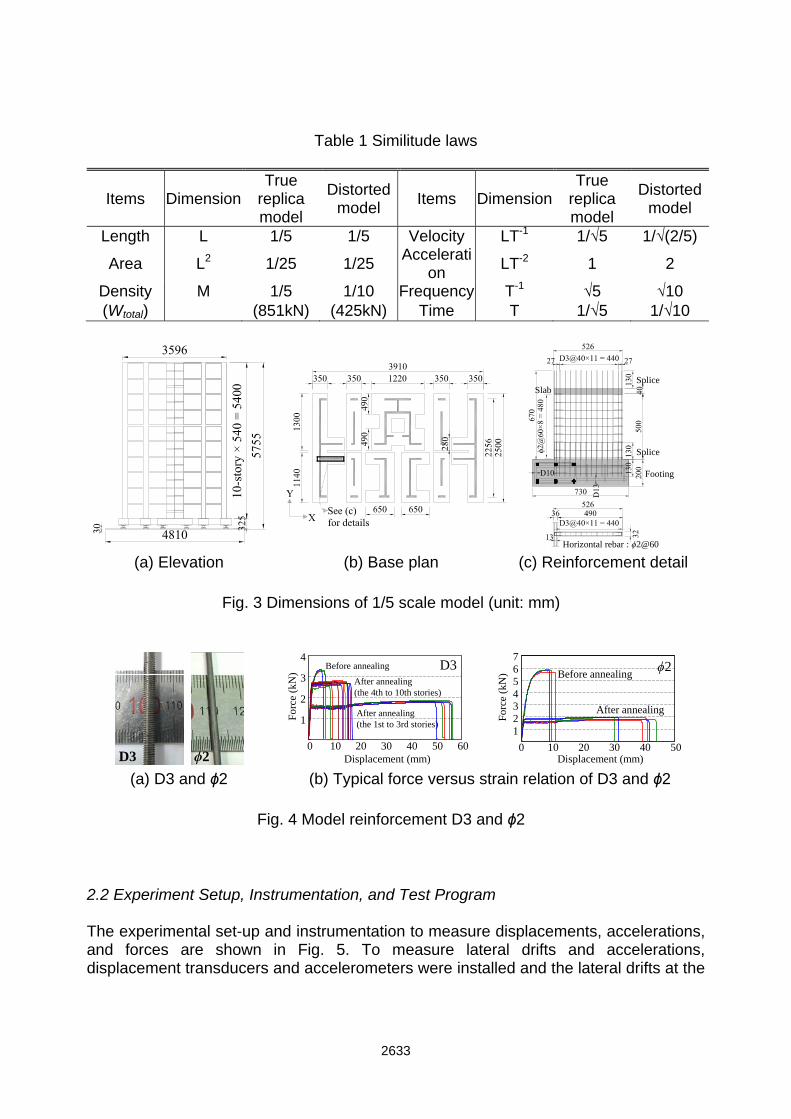
Table 1 Similitude laws
Items DimensionTrue
replica model
Distorted model
Items DimensionTrue
replica model
Distorted model
Length L 1/5 1/5 Velocity LT-1 1/√5 1/√(2/5)
Area L2 1/25 1/25 Accelerati
on LT-2 1 2
Density M 1/5 1/10 Frequency T-1 √5 √10 (Wtotal) (851kN) (425kN) Time T 1/√5 1/√10
(a) Elevation (b) Base plan (c) Reinforcement detail
Fig. 3 Dimensions of 1/5 scale model (unit: mm)
(a) D3 and ϕ2 (b) Typical force versus strain relation of D3 and ϕ2
Fig. 4 Model reinforcement D3 and ϕ2 2.2 Experiment Setup, Instrumentation, and Test Program The experimental set-up and instrumentation to measure displacements, accelerations, and forces are shown in Fig. 5. To measure lateral drifts and accelerations, displacement transducers and accelerometers were installed and the lateral drifts at the
Splice
Splice
Slab
Footing
Horizontal rebar : ϕ2@60
D3 ϕ2
1
2
3
4
Forc
e (k
N)
0 10 20 30 40 50 60Displacement (mm)
Before annealing
After annealing(the 4th to 10th stories)
After annealing(the 1st to 3rd stories)
D3
Displacement (mm)
1234567
For
ce (
kN)
0 10 20 30 40 50
ϕ2Before annealing
After annealing
2633
top and bottom of an independent post were measured at the corner of the shaking table to check the overturning movement of the shaking table itself in Fig. 5(a). Instrumentation to measure shear and flexural deformations was devised at the first and second stories. In addition, the normal strain distributions in the plastic hinge regions of the walls were measured. Also, the displacement transducers (potentiometers) were installed to measure the flexural out-of-plane deformation of the slab. Load cells were installed beneath the footings to measure the two orthogonal directional shear forces and the axial force. (Fig. 5(b))
(a) Displacement transducers and accelerometers (b) Footings and load cells at baseFig. 5 Instrumentations
Table 2 Test Program (X-Taft N21E, Y-Taft S69E)
Test Peak Ground Acceleration (PGA) (unit: g) Return Periods in
Korea (years)
Input Output X-dir Y-dir X-dir Y-dir
0.035XY 0.035 0.040 0.070 0.070 0.070X 0.070 – 0.089 – 0.070Y – 0.080 – 0.104
0.070XY 0.070 0.080 0.068 0.110 0.140X 0.140 – 0.172 –
50 0.140Y – 0.161 – 0.152 0.140XY 0.140 0.161 0.137 0.142 0.308X 0.308 – 0.275 –
500 0.308XY 0.308 0.352 0.237 0.311 0.374X 0.374 – 0.292 – Design Earthquake
(DE) 0.374XY 0.374 0.431 0.316 0.450 0.60X 0.60 – 0.523 – 2400 (Maximum
Considered Earthquake, MCE)
0.60XY 0.60 0.691 0.525 0.643
Shaking Table
Steel blocks
Reference Frame
LVDTs
Accelerometer
A2A1
A4A3
A6A5
A8A7
A10A9
A12A11
D15,D16,D29
D17,D18
D19,D20
D21,D22,D27
D23,D24
D25,D26
D28
D30
Independent PostShaking Table
Reference FrameIndependent Post
D1, D2
D3, D4
D5, D6
D7, D8
D9, D10
D11, D12
D14
D13
A13 A14
A15 A16
A17 A18
A19 A20
A21 A22
A23 A24
LVDTsSteel blocks
View A View B
Loadcell
2634
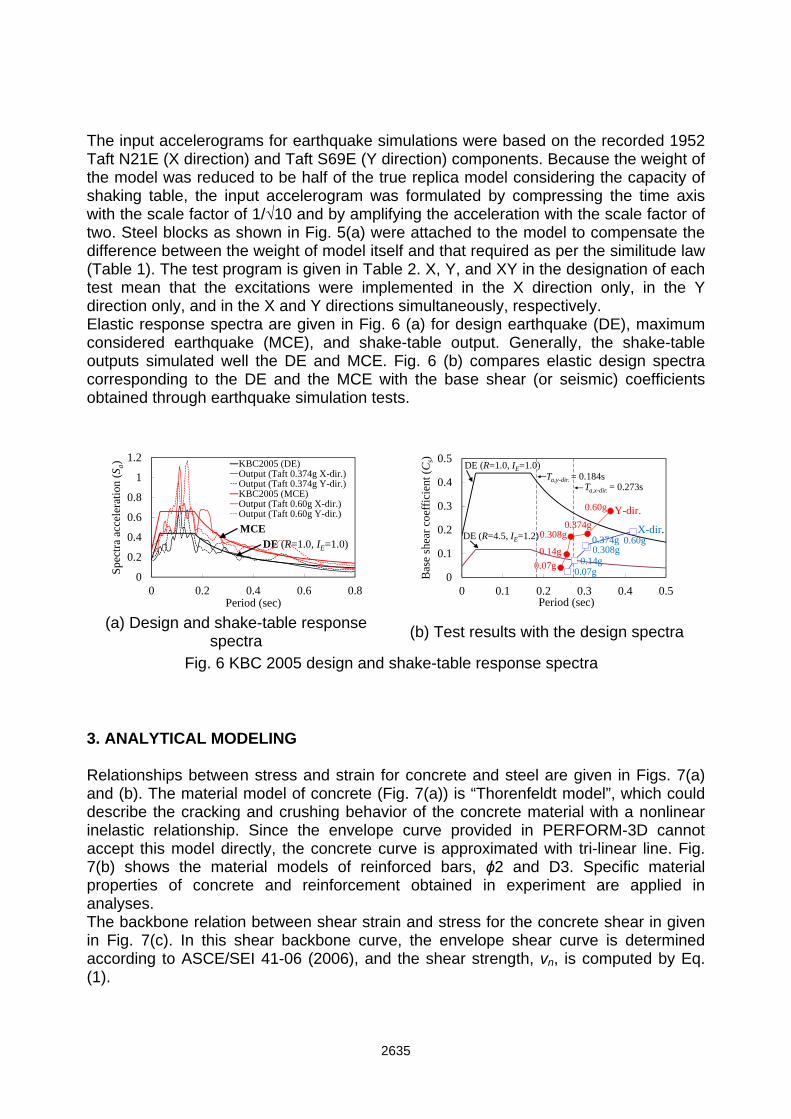
The input accelerograms for earthquake simulations were based on the recorded 1952 Taft N21E (X direction) and Taft S69E (Y direction) components. Because the weight of the model was reduced to be half of the true replica model considering the capacity of shaking table, the input accelerogram was formulated by compressing the time axis with the scale factor of 1/√10 and by amplifying the acceleration with the scale factor of two. Steel blocks as shown in Fig. 5(a) were attached to the model to compensate the difference between the weight of model itself and that required as per the similitude law (Table 1). The test program is given in Table 2. X, Y, and XY in the designation of each test mean that the excitations were implemented in the X direction only, in the Y direction only, and in the X and Y directions simultaneously, respectively. Elastic response spectra are given in Fig. 6 (a) for design earthquake (DE), maximum considered earthquake (MCE), and shake-table output. Generally, the shake-table outputs simulated well the DE and MCE. Fig. 6 (b) compares elastic design spectra corresponding to the DE and the MCE with the base shear (or seismic) coefficients obtained through earthquake simulation tests.
(a) Design and shake-table response spectra
(b) Test results with the design spectra
Fig. 6 KBC 2005 design and shake-table response spectra 3. ANALYTICAL MODELING Relationships between stress and strain for concrete and steel are given in Figs. 7(a) and (b). The material model of concrete (Fig. 7(a)) is “Thorenfeldt model”, which could describe the cracking and crushing behavior of the concrete material with a nonlinear inelastic relationship. Since the envelope curve provided in PERFORM-3D cannot accept this model directly, the concrete curve is approximated with tri-linear line. Fig. 7(b) shows the material models of reinforced bars, ϕ2 and D3. Specific material properties of concrete and reinforcement obtained in experiment are applied in analyses. The backbone relation between shear strain and stress for the concrete shear in given in Fig. 7(c). In this shear backbone curve, the envelope shear curve is determined according to ASCE/SEI 41-06 (2006), and the shear strength, vn, is computed by Eq. (1).
0
0.2
0.4
0.6
0.8
1
1.2
0 0.2 0.4 0.6 0.8
Spe
ctra
acc
eler
atio
n (S
a)
Period (sec)
KBC2005 (DE)Output (Taft 0.374g X-dir.)Output (Taft 0.374g Y-dir.)KBC2005 (MCE)Output (Taft 0.60g X-dir.)Output (Taft 0.60g Y-dir.)
MCE
DE (R=1.0, IE=1.0)
0
0.1
0.2
0.3
0.4
0.5
0 0.1 0.2 0.3 0.4 0.5
Bas
e sh
ear
coef
fici
ent (
Cs)
Period (sec)
0.07g
0.14g
0.308g0.374g
0.60g
0.07g0.14g
0.308g0.374g 0.60g
Y-dir.
X-dir.
DE (R=1.0, IE=1.0)
DE (R=4.5, IE=1.2)
Ta,y-dir. = 0.184s Ta,x-dir. = 0.273s
2635
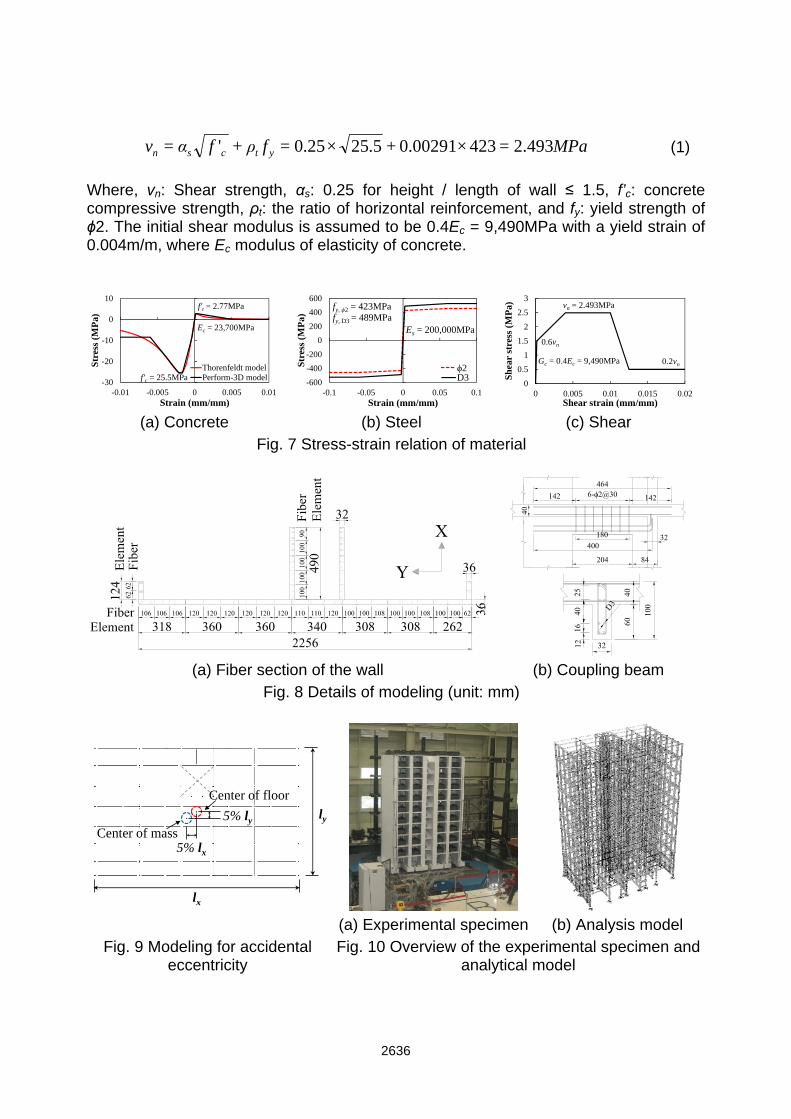
MPafρfαv ytcsn 493.2=423×00291.0+5.25×25.0=+'=
(1)
Where, vn: Shear strength, αs: 0.25 for height / length of wall ≤ 1.5, f’c: concrete compressive strength, ρt: the ratio of horizontal reinforcement, and fy: yield strength of ϕ2. The initial shear modulus is assumed to be 0.4Ec = 9,490MPa with a yield strain of 0.004m/m, where Ec modulus of elasticity of concrete.
(a) Concrete (b) Steel (c) Shear
Fig. 7 Stress-strain relation of material
(a) Fiber section of the wall (b) Coupling beam Fig. 8 Details of modeling (unit: mm)
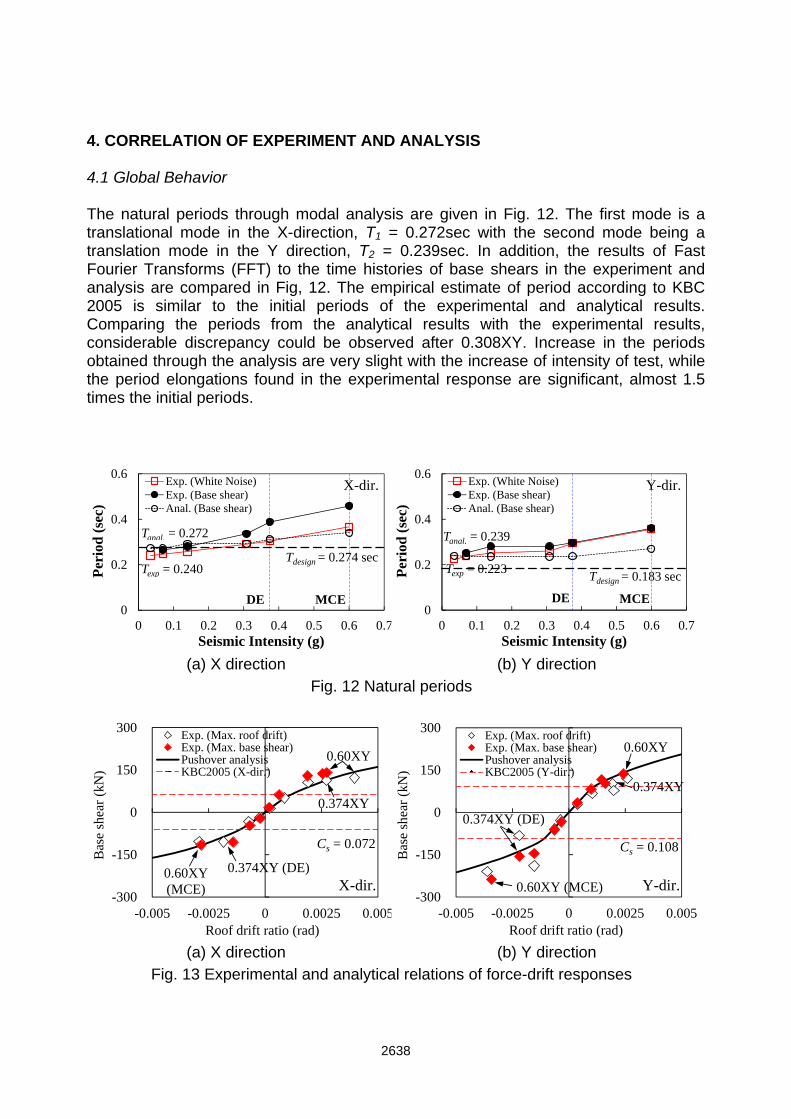
(a) Experimental specimen (b) Analysis model Fig. 9 Modeling for accidental
eccentricity Fig. 10 Overview of the experimental specimen and
analytical model
-30
-20
-10
0
10
-0.01 -0.005 0 0.005 0.01
Str
ess
(MP
a)
Strain (mm/mm)
Thorenfeldt modelPerform-3D model
Ec = 23,700MPa
f'c = 25.5MPa
f't = 2.77MPa
-600
-400
-200
0
200
400
600
-0.1 -0.05 0 0.05 0.1
Stre
ss (
MP
a)
Strain (mm/mm)
ϕ2D3
Es = 200,000MPa
fy, ϕ2 = 423MPafy, D3 = 489MPa
0
0.5
1
1.5
2
2.5
3
0 0.005 0.01 0.015 0.02
She
ar s
tres
s (M
Pa)
Shear strain (mm/mm)
vn = 2.493MPa
0.6vn
Gc = 0.4Ec = 9,490MPa 0.2vn
ly
lx
Center of floor
Center of mass5% ly
5% lx
2636
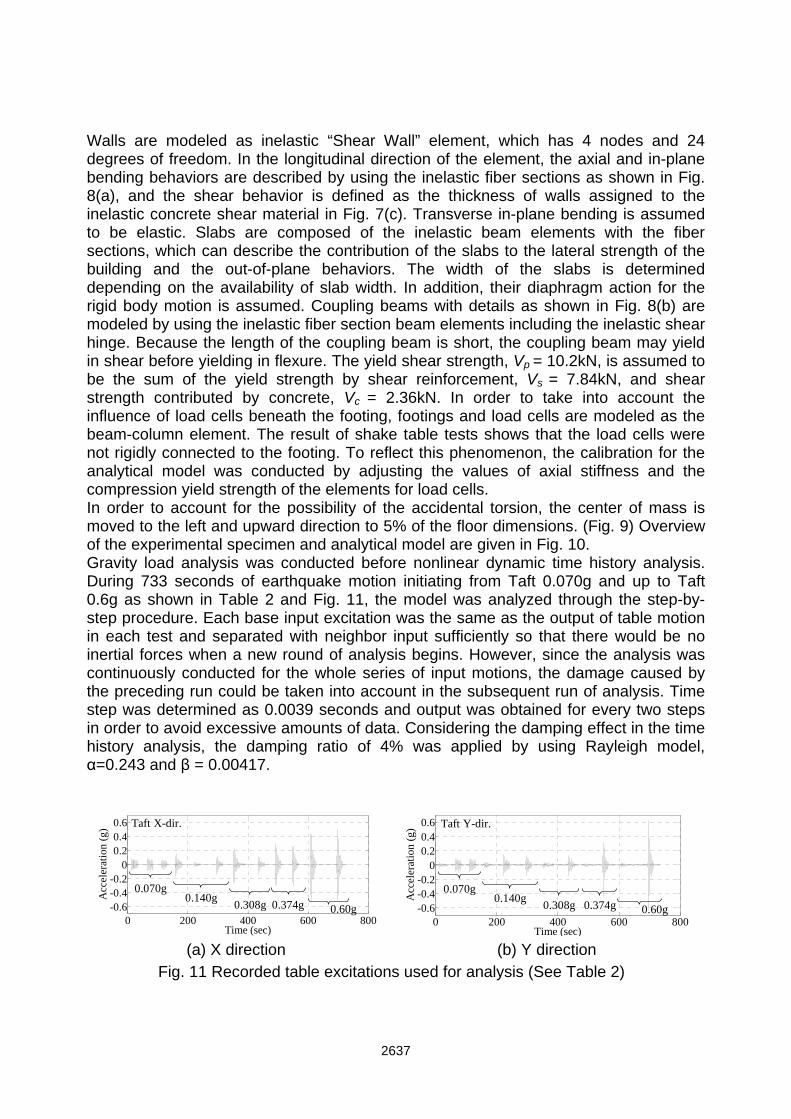
Walls are modeled as inelastic “Shear Wall” element, which has 4 nodes and 24 degrees of freedom. In the longitudinal direction of the element, the axial and in-plane bending behaviors are described by using the inelastic fiber sections as shown in Fig. 8(a), and the shear behavior is defined as the thickness of walls assigned to the inelastic concrete shear material in Fig. 7(c). Transverse in-plane bending is assumed to be elastic. Slabs are composed of the inelastic beam elements with the fiber sections, which can describe the contribution of the slabs to the lateral strength of the building and the out-of-plane behaviors. The width of the slabs is determined depending on the availability of slab width. In addition, their diaphragm action for the rigid body motion is assumed. Coupling beams with details as shown in Fig. 8(b) are modeled by using the inelastic fiber section beam elements including the inelastic shear hinge. Because the length of the coupling beam is short, the coupling beam may yield in shear before yielding in flexure. The yield shear strength, Vp = 10.2kN, is assumed to be the sum of the yield strength by shear reinforcement, Vs = 7.84kN, and shear strength contributed by concrete, Vc = 2.36kN. In order to take into account the influence of load cells beneath the footing, footings and load cells are modeled as the beam-column element. The result of shake table tests shows that the load cells were not rigidly connected to the footing. To reflect this phenomenon, the calibration for the analytical model was conducted by adjusting the values of axial stiffness and the compression yield strength of the elements for load cells. In order to account for the possibility of the accidental torsion, the center of mass is moved to the left and upward direction to 5% of the floor dimensions. (Fig. 9) Overview of the experimental specimen and analytical model are given in Fig. 10. Gravity load analysis was conducted before nonlinear dynamic time history analysis. During 733 seconds of earthquake motion initiating from Taft 0.070g and up to Taft 0.6g as shown in Table 2 and Fig. 11, the model was analyzed through the step-by-step procedure. Each base input excitation was the same as the output of table motion in each test and separated with neighbor input sufficiently so that there would be no inertial forces when a new round of analysis begins. However, since the analysis was continuously conducted for the whole series of input motions, the damage caused by the preceding run could be taken into account in the subsequent run of analysis. Time step was determined as 0.0039 seconds and output was obtained for every two steps in order to avoid excessive amounts of data. Considering the damping effect in the time history analysis, the damping ratio of 4% was applied by using Rayleigh model, α=0.243 and β = 0.00417.
(a) X direction (b) Y direction Fig. 11 Recorded table excitations used for analysis (See Table 2)
0 200 400 600 800-0.6-0.4-0.2
00.20.40.6
Time (sec)
Acc
eler
atio
n (g
)
0.070g0.140g
0.308g 0.374g 0.60g
Taft X-dir.
0 200 400 600 800-0.6-0.4-0.2
00.20.40.6
Time (sec)
Acc
eler
atio
n (g
)
0.070g0.140g
0.308g 0.374g 0.60g
Taft Y-dir.
2637
4. CORRELATION OF EXPERIMENT AND ANALYSIS 4.1 Global Behavior The natural periods through modal analysis are given in Fig. 12. The first mode is a translational mode in the X-direction, T1 = 0.272sec with the second mode being a translation mode in the Y direction, T2 = 0.239sec. In addition, the results of Fast Fourier Transforms (FFT) to the time histories of base shears in the experiment and analysis are compared in Fig, 12. The empirical estimate of period according to KBC 2005 is similar to the initial periods of the experimental and analytical results. Comparing the periods from the analytical results with the experimental results, considerable discrepancy could be observed after 0.308XY. Increase in the periods obtained through the analysis are very slight with the increase of intensity of test, while the period elongations found in the experimental response are significant, almost 1.5 times the initial periods.
(a) X direction (b) Y direction Fig. 12 Natural periods
(a) X direction (b) Y direction Fig. 13 Experimental and analytical relations of force-drift responses
Texp = 0.240
Tanal. = 0.272
0
0.2
0.4
0.6
0 0.1 0.2 0.3 0.4 0.5 0.6 0.7
Per
iod
(se
c)
Seismic Intensity (g)
Exp. (White Noise)Exp. (Base shear)Anal. (Base shear)
Tdesign = 0.274 sec
X-dir.
DE MCE
Texp = 0.223
Tanal. = 0.239
0
0.2
0.4
0.6
0 0.1 0.2 0.3 0.4 0.5 0.6 0.7
Per
iod
(se
c)
Seismic Intensity (g)
Exp. (White Noise)Exp. (Base shear)Anal. (Base shear)
Tdesign = 0.183 sec
Y-dir.
DE MCE
-300
-150
0
150
300
-0.005 -0.0025 0 0.0025 0.005
Bas
e sh
ear
(kN
)
Roof drift ratio (rad)
Exp. (Max. roof drift)Exp. (Max. base shear)Pushover analysisKBC2005 (X-dir.)
X-dir.
Cs = 0.072
0.60XY
0.374XY
0.374XY (DE)0.60XY(MCE)
-300
-150
0
150
300
-0.005 -0.0025 0 0.0025 0.005
Bas
e sh
ear
(kN
)
Roof drift ratio (rad)
Exp. (Max. roof drift)Exp. (Max. base shear)Pushover analysisKBC2005 (Y-dir.)
Y-dir.
Cs = 0.108
0.60XY
0.374XY
0.374XY (DE)
0.60XY (MCE)
2638
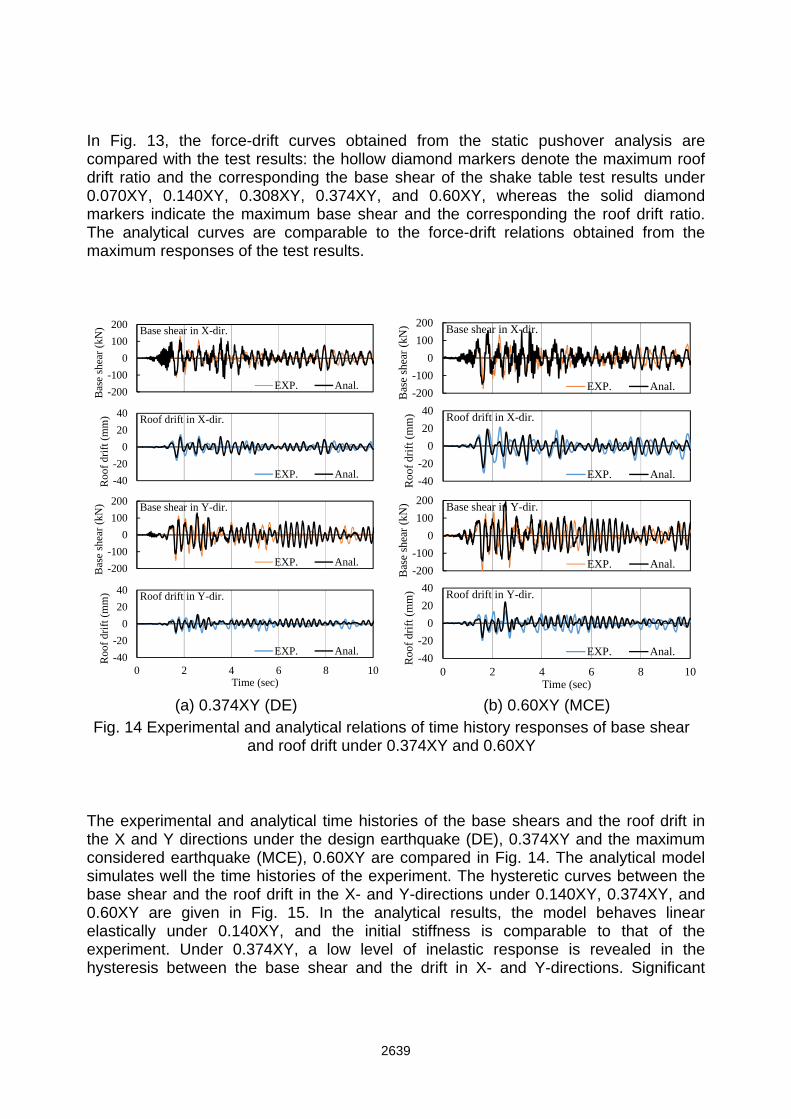
In Fig. 13, the force-drift curves obtained from the static pushover analysis are compared with the test results: the hollow diamond markers denote the maximum roof drift ratio and the corresponding the base shear of the shake table test results under 0.070XY, 0.140XY, 0.308XY, 0.374XY, and 0.60XY, whereas the solid diamond markers indicate the maximum base shear and the corresponding the roof drift ratio. The analytical curves are comparable to the force-drift relations obtained from the maximum responses of the test results.
(a) 0.374XY (DE) (b) 0.60XY (MCE) Fig. 14 Experimental and analytical relations of time history responses of base shear
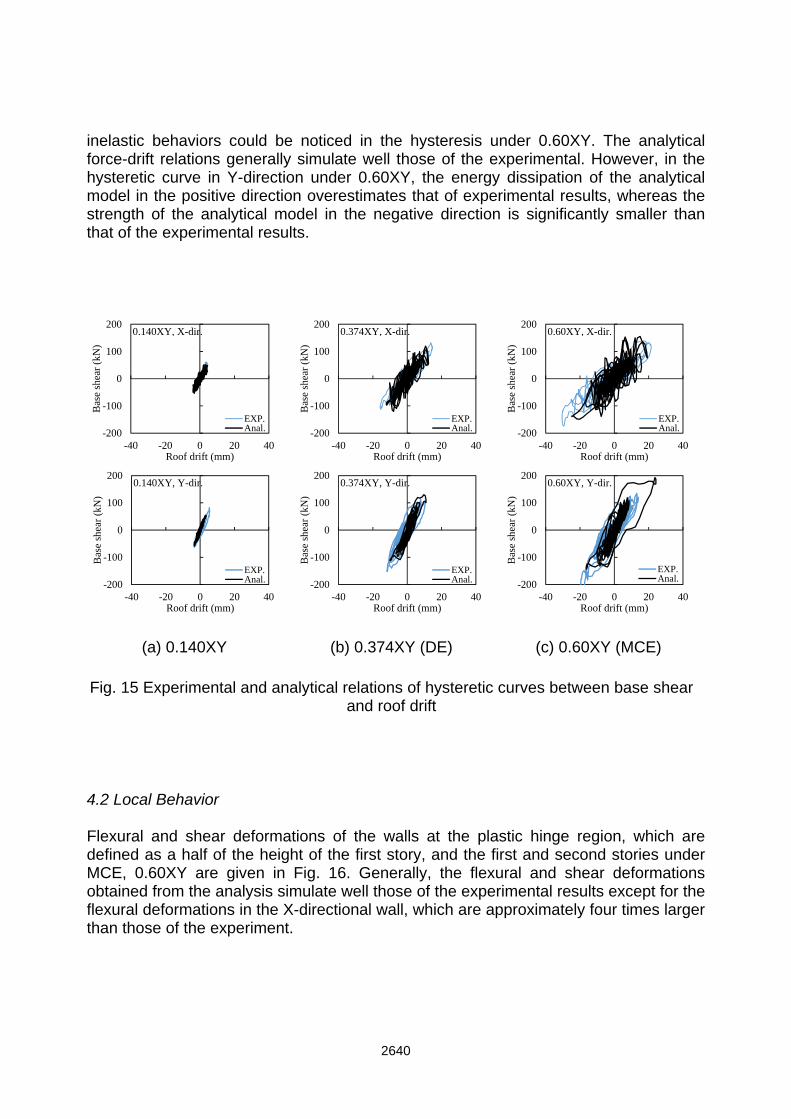
and roof drift under 0.374XY and 0.60XY The experimental and analytical time histories of the base shears and the roof drift in the X and Y directions under the design earthquake (DE), 0.374XY and the maximum considered earthquake (MCE), 0.60XY are compared in Fig. 14. The analytical model simulates well the time histories of the experiment. The hysteretic curves between the base shear and the roof drift in the X- and Y-directions under 0.140XY, 0.374XY, and 0.60XY are given in Fig. 15. In the analytical results, the model behaves linear elastically under 0.140XY, and the initial stiffness is comparable to that of the experiment. Under 0.374XY, a low level of inelastic response is revealed in the hysteresis between the base shear and the drift in X- and Y-directions. Significant
-200
-100
0
100
200
Bas
e sh
ear
(kN
)
EXP. Anal.
Base shear in X-dir.
-200
-100
0
100
200
Bas
e sh
ear
(kN
)EXP. Anal.
Base shear in X-dir.
-40
-20
0
20
40
Roo
f dr
ift (
mm
)
EXP. Anal.
Roof drift in X-dir.
-40
-20
0
20
40R
oof
drif
t (m
m)
EXP. Anal.
Roof drift in X-dir.
-200
-100
0
100
200
Bas
e sh
ear
(kN
)
EXP. Anal.
Base shear in Y-dir.
-200
-100
0
100
200
Bas
e sh
ear
(kN
)
EXP. Anal.
Base shear in Y-dir.
-40
-20
0
20
40
0 2 4 6 8 10
Roo
f dr
ift (
mm
)
Time (sec)
EXP. Anal.
Roof drift in Y-dir.
-40
-20
0
20
40
0 2 4 6 8 10
Roo
f dr
ift (
mm
)
Time (sec)
EXP. Anal.
Roof drift in Y-dir.
2639
inelastic behaviors could be noticed in the hysteresis under 0.60XY. The analytical force-drift relations generally simulate well those of the experimental. However, in the hysteretic curve in Y-direction under 0.60XY, the energy dissipation of the analytical model in the positive direction overestimates that of experimental results, whereas the strength of the analytical model in the negative direction is significantly smaller than that of the experimental results.
(a) 0.140XY
(b) 0.374XY (DE)
(c) 0.60XY (MCE)
Fig. 15 Experimental and analytical relations of hysteretic curves between base shear and roof drift
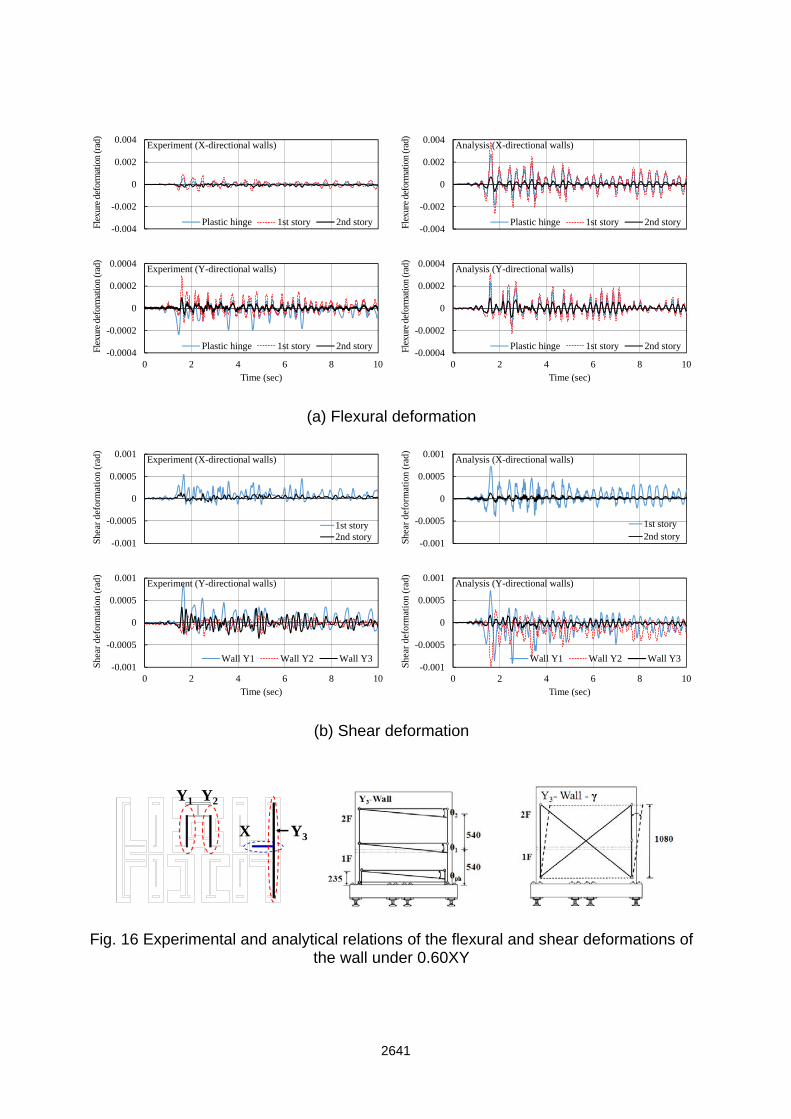
4.2 Local Behavior Flexural and shear deformations of the walls at the plastic hinge region, which are defined as a half of the height of the first story, and the first and second stories under MCE, 0.60XY are given in Fig. 16. Generally, the flexural and shear deformations obtained from the analysis simulate well those of the experimental results except for the flexural deformations in the X-directional wall, which are approximately four times larger than those of the experiment.
-200
-100
0
100
200
-40 -20 0 20 40
Bas
e sh
ear
(kN
)
Roof drift (mm)
EXP.Anal.
0.140XY, X-dir.
-200
-100
0
100
200
-40 -20 0 20 40
Bas
e sh
ear
(kN
)
Roof drift (mm)
EXP.Anal.
0.374XY, X-dir.
-200
-100
0
100
200
-40 -20 0 20 40
Bas
e sh
ear
(kN
)
Roof drift (mm)
EXP.Anal.
0.60XY, X-dir.
-200
-100
0
100
200
-40 -20 0 20 40
Bas
e sh
ear
(kN
)
Roof drift (mm)
EXP.Anal.
0.140XY, Y-dir.
-200
-100
0
100
200
-40 -20 0 20 40
Bas
e sh
ear
(kN
)
Roof drift (mm)
EXP.Anal.
0.374XY, Y-dir.
-200
-100
0
100
200
-40 -20 0 20 40
Bas
e sh
ear
(kN
)
Roof drift (mm)
EXP.Anal.
0.60XY, Y-dir.
2640
(a) Flexural deformation
(b) Shear deformation
Fig. 16 Experimental and analytical relations of the flexural and shear deformations of the wall under 0.60XY
-0.004
-0.002
0
0.002
0.004
Flex
ure
defo
rmat
ion
(rad
)
Plastic hinge 1st story 2nd story
Experiment (X-directional walls)
-0.004
-0.002
0
0.002
0.004
Flex
ure
defo
rmat
ion
(rad
)
Plastic hinge 1st story 2nd story
Analysis (X-directional walls)
-0.0004
-0.0002
0
0.0002
0.0004
0 2 4 6 8 10
Flex
ure
defo
rmat
ion
(rad
)
Time (sec)
Plastic hinge 1st story 2nd story
Experiment (Y-directional walls)
-0.0004
-0.0002
0
0.0002
0.0004
0 2 4 6 8 10
Flex
ure
defo
rmat
ion
(rad
)
Time (sec)
Plastic hinge 1st story 2nd story
Analysis (Y-directional walls)
-0.001
-0.0005
0
0.0005
0.001
She
ar d
efor
mat
ion
(rad
)
1st story2nd story
Experiment (X-directional walls)
-0.001
-0.0005
0
0.0005
0.001
Shea
r de
form
atio
n (r
ad)
1st story2nd story
Analysis (X-directional walls)
-0.001
-0.0005
0
0.0005
0.001
0 2 4 6 8 10
She
ar d
efor
mat
ion
(rad
)
Time (sec)
Wall Y1 Wall Y2 Wall Y3
Experiment (Y-directional walls)
-0.001
-0.0005
0
0.0005
0.001
0 2 4 6 8 10
She
ar d
efor
mat
ion
(rad
)
Time (sec)
Wall Y1 Wall Y2 Wall Y3
Analysis (Y-directional walls)
Y1 Y2
Y3X
2641
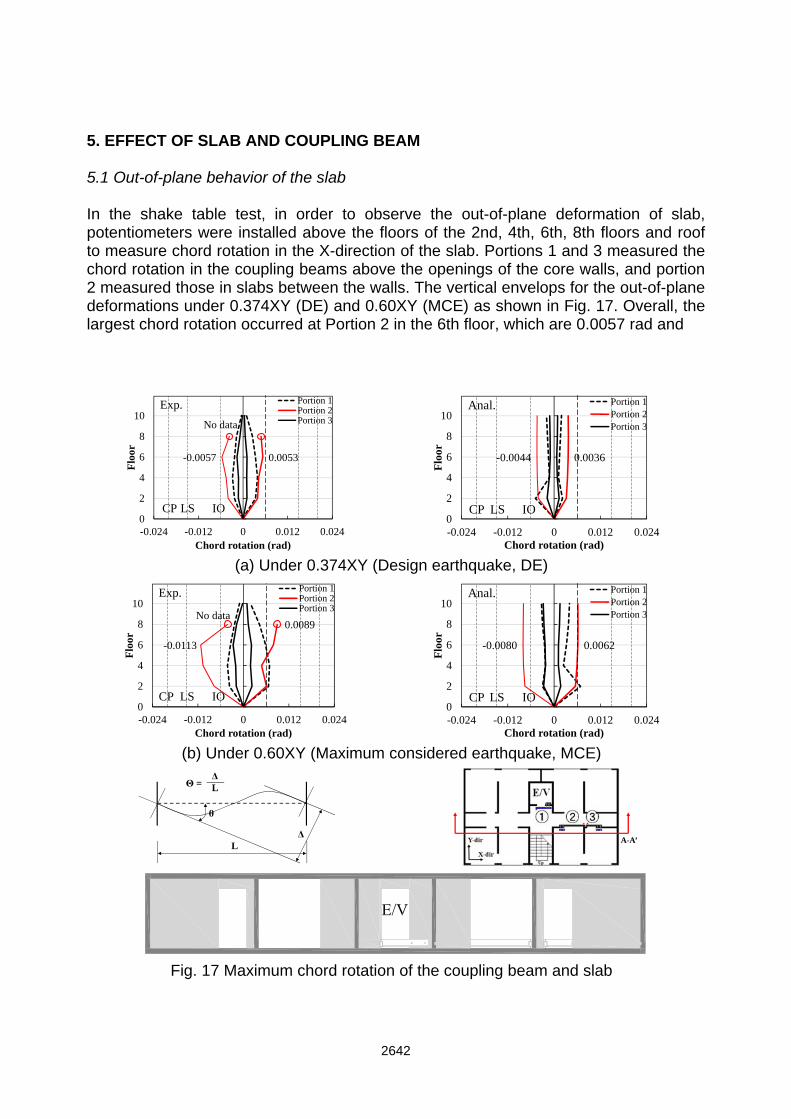
5. EFFECT OF SLAB AND COUPLING BEAM 5.1 Out-of-plane behavior of the slab In the shake table test, in order to observe the out-of-plane deformation of slab, potentiometers were installed above the floors of the 2nd, 4th, 6th, 8th floors and roof to measure chord rotation in the X-direction of the slab. Portions 1 and 3 measured the chord rotation in the coupling beams above the openings of the core walls, and portion 2 measured those in slabs between the walls. The vertical envelops for the out-of-plane deformations under 0.374XY (DE) and 0.60XY (MCE) as shown in Fig. 17. Overall, the largest chord rotation occurred at Portion 2 in the 6th floor, which are 0.0057 rad and
(a) Under 0.374XY (Design earthquake, DE)
(b) Under 0.60XY (Maximum considered earthquake, MCE)
Fig. 17 Maximum chord rotation of the coupling beam and slab
0.0053 -0.0057
0
2
4
6
8
10
-0.024 -0.012 0 0.012 0.024
Flo
or
Chord rotation (rad)
Portion 1Portion 2Portion 3
Exp.
IOLSCP
No data
0.0036 -0.0044
0
2
4
6
8
10
-0.024 -0.012 0 0.012 0.024
Flo
or
Chord rotation (rad)
Portion 1Portion 2Portion 3
Anal.
IOLSCP
0.0089
-0.0113
0
2
4
6
8
10
-0.024 -0.012 0 0.012 0.024
Flo
or
Chord rotation (rad)
Portion 1Portion 2Portion 3
Exp.
IOLSCP
No data
0.0062 -0.0080
0
2
4
6
8
10
-0.024 -0.012 0 0.012 0.024
Flo
or
Chord rotation (rad)
Portion 1Portion 2Portion 3
Anal.
IOLSCP
LΔ
θ
Θ =ΔL
A-A’
2642
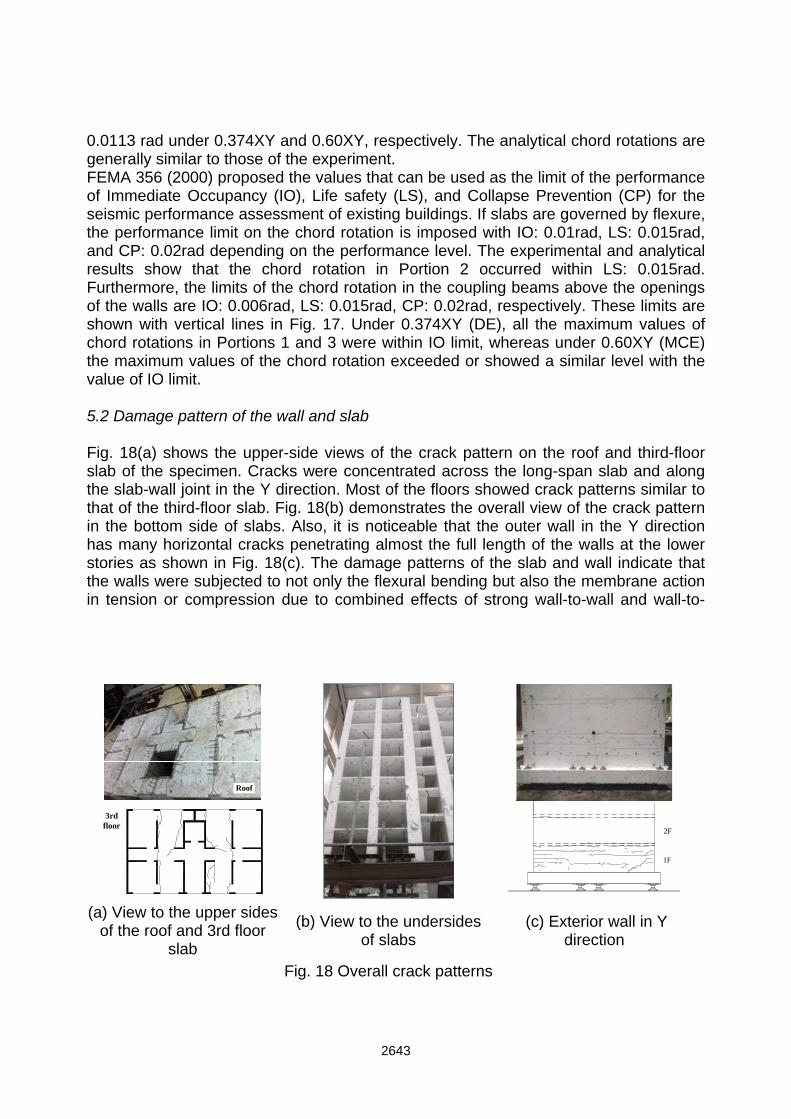
0.0113 rad under 0.374XY and 0.60XY, respectively. The analytical chord rotations are generally similar to those of the experiment. FEMA 356 (2000) proposed the values that can be used as the limit of the performance of Immediate Occupancy (IO), Life safety (LS), and Collapse Prevention (CP) for the seismic performance assessment of existing buildings. If slabs are governed by flexure, the performance limit on the chord rotation is imposed with IO: 0.01rad, LS: 0.015rad, and CP: 0.02rad depending on the performance level. The experimental and analytical results show that the chord rotation in Portion 2 occurred within LS: 0.015rad. Furthermore, the limits of the chord rotation in the coupling beams above the openings of the walls are IO: 0.006rad, LS: 0.015rad, CP: 0.02rad, respectively. These limits are shown with vertical lines in Fig. 17. Under 0.374XY (DE), all the maximum values of chord rotations in Portions 1 and 3 were within IO limit, whereas under 0.60XY (MCE) the maximum values of the chord rotation exceeded or showed a similar level with the value of IO limit. 5.2 Damage pattern of the wall and slab Fig. 18(a) shows the upper-side views of the crack pattern on the roof and third-floor slab of the specimen. Cracks were concentrated across the long-span slab and along the slab-wall joint in the Y direction. Most of the floors showed crack patterns similar to that of the third-floor slab. Fig. 18(b) demonstrates the overall view of the crack pattern in the bottom side of slabs. Also, it is noticeable that the outer wall in the Y direction has many horizontal cracks penetrating almost the full length of the walls at the lower stories as shown in Fig. 18(c). The damage patterns of the slab and wall indicate that the walls were subjected to not only the flexural bending but also the membrane action in tension or compression due to combined effects of strong wall-to-wall and wall-to-
(a) View to the upper sides
of the roof and 3rd floor slab
(b) View to the undersides of slabs
(c) Exterior wall in Y direction
Fig. 18 Overall crack patterns
Roof
3rdfloor
1F
2F
2643

slab interactions. (Kalkan and Yüksel 2008) Particularly, the outer walls in the Y-direction perpendicular to lateral loading in the X-direction, act as flanges when subjected to the overturning moment and resist this in overturning moment primarily in tension and compression. This will be observed in more detail in the flowing section. 5.3 Effect of slab and coupling beam on the membrane action In order to investigate the influence of the slab and coupling beam, the 10-story wall-type RC building without slabs or coupling beams are also modeled. Model SB has both slabs and coupling beams, described already in section 3. Model NS has only coupling beams without slabs, and Model NSB does not have any slabs and coupling beams. The slabs of Model NS and Model NSB are modeled by using rigid diaphragm, and the flexural rigidity of slabs is ignored. Table 3 compares the natural periods of the Model SB, NS, and NSB obtained from modal analyses. The natural periods of Model SB including the flexural stiffness of the slabs and coupling beams are shorter than those of Model NS and NSB. The first mode of the Model SB is the translational mode in the X direction, 0.272sec, while those of the Model NS and NSB are 0.303sec and 0.339sec, respectively.
Table 3. Natural periods obtained from modal analysis Model SB Model NS Model NSB
1st mode (X direction) 0.272 sec 0.303 sec 0.339 sec 2nd mode (Y direction) 0.239 sec 0.261 sec 0.262 sec
Fig. 19 shows the capacity curves obtained from pushover analyses. The lateral loads pattern is the first modal shape. When models with and without slabs (Model SB and NS) are compared, the initial stiffness and the strength of Model SB are considerably larger than those of the Model NS. At the 0.5% roof drift in the X- and Y-directions, the strength of Model SB are also approximately 1.5 times larger than those of Model NS, respectively. The effect of coupling beams in the X-direction is particularly noticeable in the strength. The strength of model without coupling beams, Model NSB, at the 0.5% roof drift is approximately 25% lower than that of Model NS. However, the strengths and stiffness in the Y-direction of Model NS and NSB do not reveal the significant influence of coupling beams. Damage limit states of flexural and shear behaviors of the walls and shear behavior of coupling beams corresponding to different performance levels, Immediate Occupancy (IO), Life safety (LS), and Collapse Prevention (CP), are shown in Fig. 19. In FEMA 356 (2000), the acceptance criteria for flexural behaviors of the wall are defined in terms of the plastic hinge rotation, and the limit values are 0.002 rad (IO), 0.004 rad (LS), and 0.008 rad (CP), which are denoted by circular markers in Fig. 19. For shear behaviors of the walls, the acceptable total drift are indicated by 0.4% (IO), 0.6% (LS), and 0.75% (CP), which are denoted by rectangular markers. In addition, the acceptance criteria for the shear behavior of the coupling beam are defined in terms of the chord rotation, and the limit values are 0.006 rad (IO), 0.015 rad (LS), and 0.02 rad (CP), which are
2644
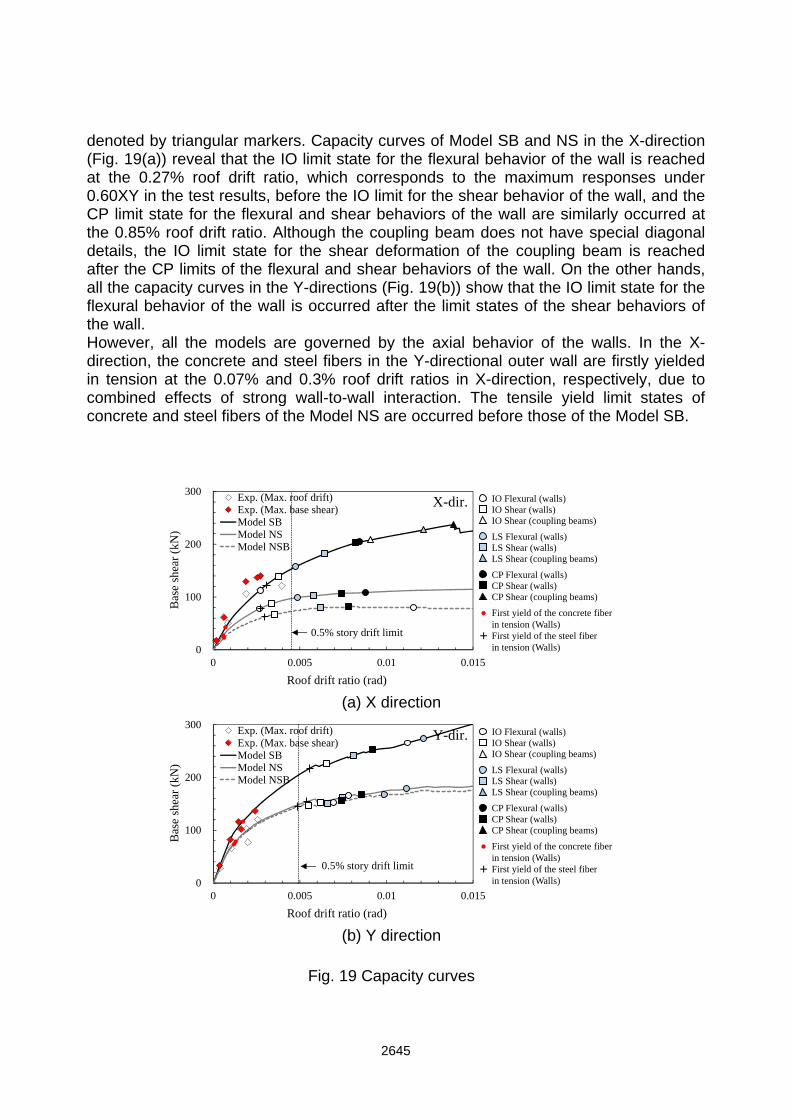
denoted by triangular markers. Capacity curves of Model SB and NS in the X-direction (Fig. 19(a)) reveal that the IO limit state for the flexural behavior of the wall is reached at the 0.27% roof drift ratio, which corresponds to the maximum responses under 0.60XY in the test results, before the IO limit for the shear behavior of the wall, and the CP limit state for the flexural and shear behaviors of the wall are similarly occurred at the 0.85% roof drift ratio. Although the coupling beam does not have special diagonal details, the IO limit state for the shear deformation of the coupling beam is reached after the CP limits of the flexural and shear behaviors of the wall. On the other hands, all the capacity curves in the Y-directions (Fig. 19(b)) show that the IO limit state for the flexural behavior of the wall is occurred after the limit states of the shear behaviors of the wall. However, all the models are governed by the axial behavior of the walls. In the X-direction, the concrete and steel fibers in the Y-directional outer wall are firstly yielded in tension at the 0.07% and 0.3% roof drift ratios in X-direction, respectively, due to combined effects of strong wall-to-wall interaction. The tensile yield limit states of concrete and steel fibers of the Model NS are occurred before those of the Model SB.
(a) X direction
(b) Y direction
Fig. 19 Capacity curves
0
100
200
300
0 0.005 0.01 0.015
Bas
e sh
ear
(kN
)
Roof drift ratio (rad)
Exp. (Max. roof drift)Exp. (Max. base shear)Model SBModel NSModel NSB
0.5% story drift limit
X-dir. IO Flexural (walls)IO Shear (walls)IO Shear (coupling beams)
LS Flexural (walls)LS Shear (walls)LS Shear (coupling beams)
CP Flexural (walls)CP Shear (walls)CP Shear (coupling beams)
First yield of the steel fiber in tension (Walls)
+
First yield of the concrete fiber in tension (Walls)
0
100
200
300
0 0.005 0.01 0.015
Bas
e sh
ear
(kN
)
Roof drift ratio (rad)
Exp. (Max. roof drift)Exp. (Max. base shear)Model SBModel NSModel NSB
0.5% story drift limit
Y-dir. IO Flexural (walls)IO Shear (walls)IO Shear (coupling beams)
LS Flexural (walls)LS Shear (walls)LS Shear (coupling beams)
CP Flexural (walls)CP Shear (walls)CP Shear (coupling beams)
First yield of the steel fiber in tension (Walls)
+
First yield of the concrete fiber in tension (Walls)
2645
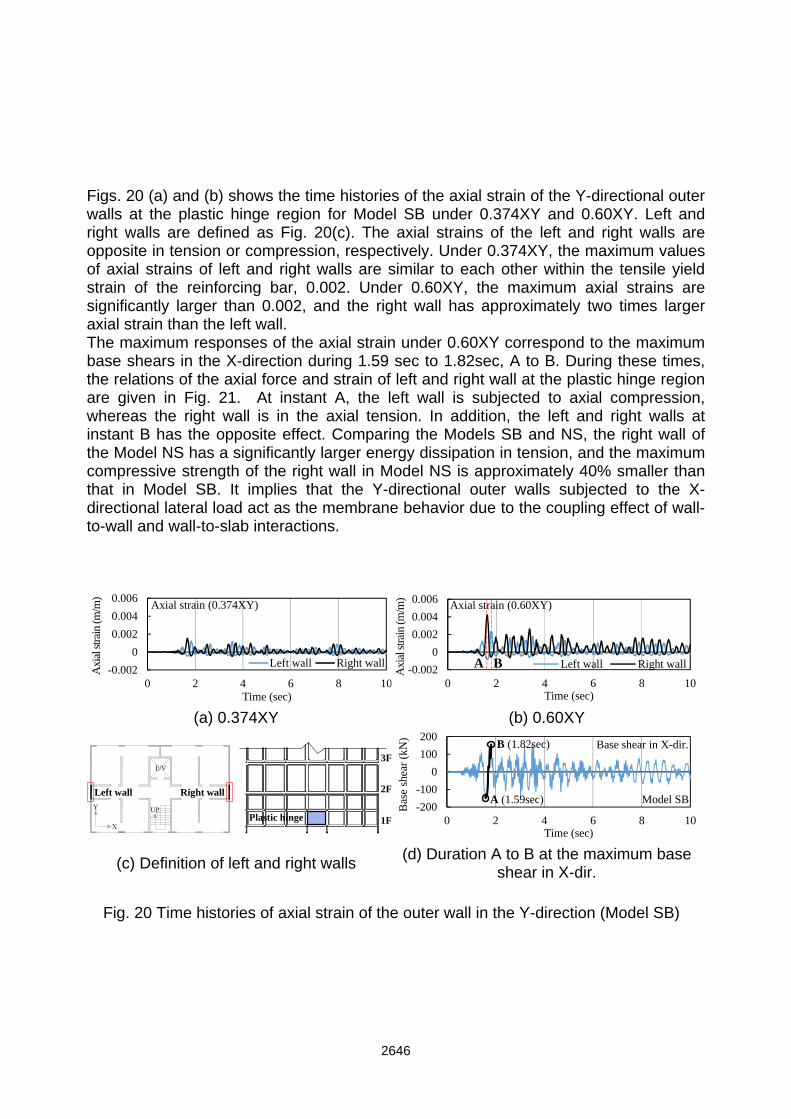
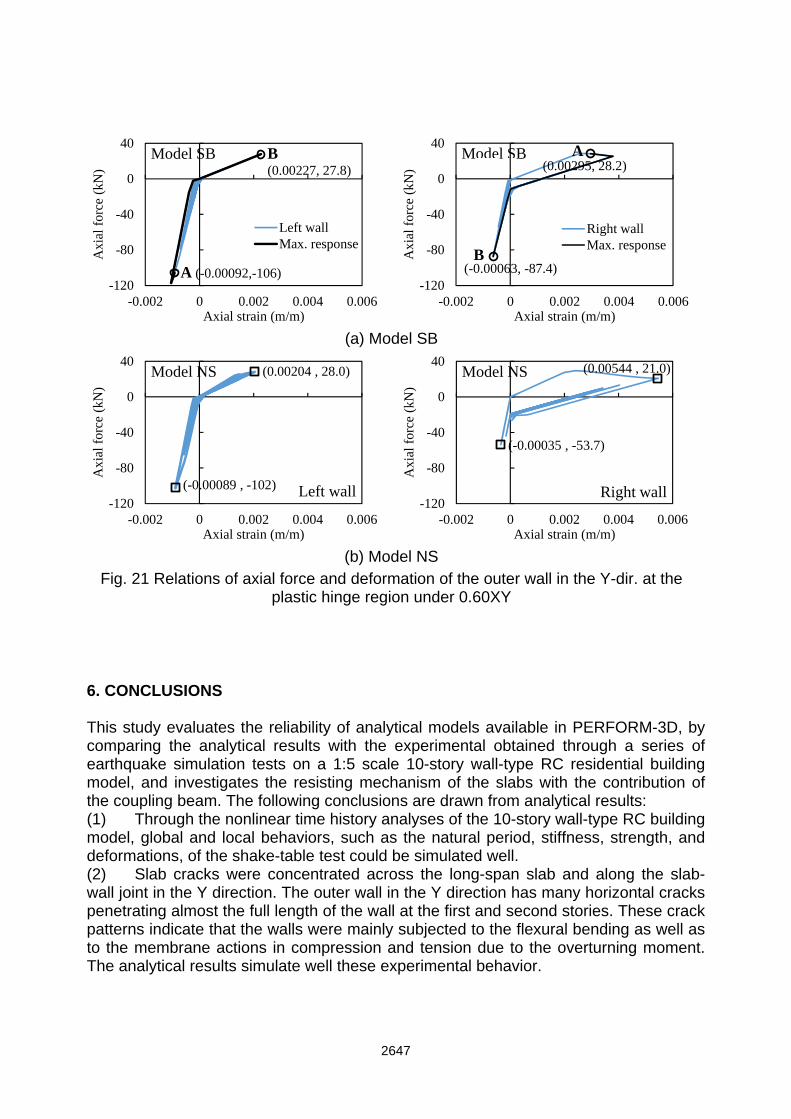
Figs. 20 (a) and (b) shows the time histories of the axial strain of the Y-directional outer walls at the plastic hinge region for Model SB under 0.374XY and 0.60XY. Left and right walls are defined as Fig. 20(c). The axial strains of the left and right walls are opposite in tension or compression, respectively. Under 0.374XY, the maximum values of axial strains of left and right walls are similar to each other within the tensile yield strain of the reinforcing bar, 0.002. Under 0.60XY, the maximum axial strains are significantly larger than 0.002, and the right wall has approximately two times larger axial strain than the left wall. The maximum responses of the axial strain under 0.60XY correspond to the maximum base shears in the X-direction during 1.59 sec to 1.82sec, A to B. During these times, the relations of the axial force and strain of left and right wall at the plastic hinge region are given in Fig. 21. At instant A, the left wall is subjected to axial compression, whereas the right wall is in the axial tension. In addition, the left and right walls at instant B has the opposite effect. Comparing the Models SB and NS, the right wall of the Model NS has a significantly larger energy dissipation in tension, and the maximum compressive strength of the right wall in Model NS is approximately 40% smaller than that in Model SB. It implies that the Y-directional outer walls subjected to the X-directional lateral load act as the membrane behavior due to the coupling effect of wall-to-wall and wall-to-slab interactions.
(a) 0.374XY (b) 0.60XY
(c) Definition of left and right walls (d) Duration A to B at the maximum base
shear in X-dir.
Fig. 20 Time histories of axial strain of the outer wall in the Y-direction (Model SB)
-0.002
0
0.002
0.004
0.006
0 2 4 6 8 10
Axi
al st
rain
(m/m
)
Time (sec)
Left wall Right wall
Axial strain (0.374XY)
-0.002
0
0.002
0.004
0.006
0 2 4 6 8 10
Axi
al st
rain
(m/m
)
Time (sec)
Left wall Right wall
Axial strain (0.60XY)
A B
Left wall Right wall
Plastic hinge
2F
3F
1F-200
-100
0
100
200
0 2 4 6 8 10
Bas
e sh
ear
(kN
)
Time (sec)
Base shear in X-dir.
A (1.59sec) Model SB
B (1.82sec)
2646
(a) Model SB
(b) Model NS Fig. 21 Relations of axial force and deformation of the outer wall in the Y-dir. at the
plastic hinge region under 0.60XY 6. CONCLUSIONS This study evaluates the reliability of analytical models available in PERFORM-3D, by comparing the analytical results with the experimental obtained through a series of earthquake simulation tests on a 1:5 scale 10-story wall-type RC residential building model, and investigates the resisting mechanism of the slabs with the contribution of the coupling beam. The following conclusions are drawn from analytical results: (1) Through the nonlinear time history analyses of the 10-story wall-type RC building model, global and local behaviors, such as the natural period, stiffness, strength, and deformations, of the shake-table test could be simulated well. (2) Slab cracks were concentrated across the long-span slab and along the slab-wall joint in the Y direction. The outer wall in the Y direction has many horizontal cracks penetrating almost the full length of the wall at the first and second stories. These crack patterns indicate that the walls were mainly subjected to the flexural bending as well as to the membrane actions in compression and tension due to the overturning moment. The analytical results simulate well these experimental behavior.
-120
-80
-40
0
40
-0.002 0 0.002 0.004 0.006
Axi
al f
orce
(kN
)
Axial strain (m/m)
Left wallMax. response
Model SB
A (-0.00092,-106)
B (0.00227, 27.8)
-120
-80
-40
0
40
-0.002 0 0.002 0.004 0.006
Axi
al f
orce
(kN
)
Axial strain (m/m)
Right wallMax. response
Model SB
B
A(0.00295, 28.2)
(-0.00063, -87.4)
(-0.00089 , -102)
(0.00204 , 28.0)
-120
-80
-40
0
40
-0.002 0 0.002 0.004 0.006
Axi
al f
orce
(kN
)
Axial strain (m/m)
Model NS
Left wall
(-0.00035 , -53.7)
(0.00544 , 21.0)
-120
-80
-40
0
40
-0.002 0 0.002 0.004 0.006
Axi
al f
orce
(kN
)
Axial strain (m/m)
Model NS
Right wall
2647
(3) In the models without slab and coupling elements, the natural period, initial stiffness, and maximum strength representing the global responses are considerably lower than those of the model with slab and coupling beam elements. For the design, therefore, the analytical model of the box-type wall building structure ignoring the flexural rigidity of the slab and coupling beam could provide the erroneous information for design. (4) Models with and without slab elements are governed by the membrane actions due to the coupling effect of the web wall to the flange wall. Moreover, the membrane action of the model with slabs are higher than that of the model without slabs. Therefore, the wall-to-wall and wall-to-slab interaction can increase significantly the capacity of the overturning moment. ACKNOWLEDGEMENTS The research presented herein was supported by the National Research Foundation of Korea, through the contracts No. 2009-0078771. The writers are grateful for this support. REFERENCES American Society of Civil Engineers (ASCE) (2006), Seismic rehabilitation of existing
buildings, ASCE/SEI 41-06 Supplement #1, Reston, VA. Architectural Institute of Korea (2001), AIK2000, Seoul, Korea. (in Korean) Architectural Institute of Korea (2005), Korean Building Code (KBC2005), Seoul, Korea.
(in Korean) Balkaya, C., & Kalkan, E. (2003), “Estimation of fundamental periods of shear‐wall
dominant building structures”, Earthquake engineering & structural dynamics, 32(7), 985-998.
Balkaya, C., & Kalkan, E. (2004), “Seismic vulnerability, behavior and design of tunnel form building structures”, Engineering structures, 26(14), 2081-2099.
Computers & Structures, Inc. (2006), PERFORM Components and Elements for PERFORM 3D and PERFORM-Collapse Ver. 4, CSI, Berkeley, CA.
FEMA (2000), Prestandard and Commentary for the Seismic Rehabilitation of Buildings, FEMA 356, Federal Emergency Management Agency.
Hwang, S. J., Lee, K. B., Kang, C. B., Lee, H. S., Lee, S. H., and Oh, S. H. (2011), “Design and Construction of a 1:5 Scale 10-Story R.C. Apartment Building Model for Earthquake Simulation Tests”, Journal of the Earthquake Engineering Society of Korea (in Korean), 15(6), 67-80.
Korea National Statistical Office (2010), Population and Housing Census 2010. (in Korean)
Kalkan, E., & Yüksel, S. B. (2008), “Pros and cons of multistory RC tunnel‐form (box‐type) buildings”, The Structural Design of Tall and Special Buildings, 17(3), 601-
2648
617. Kunnath, S. K., Panahshahi, N., &Reinhorn, A. M. (1991), “Seismic response of RC
buildings with inelastic floor diaphragms”, Journal of Structural Engineering, 117(4), 1218-1237.
Lee, D. G., Kim, H. S., & Hah C. M. (2002), “Efficient seismic analysis of high-rise building structures with the effects of floor slabs”, Engineering structures, 24(5), 613-623.
Lee, H. S., Hwang, S. J., Lee, K. B., Kang, C. B., Lee, S. H., and Oh, S. H. (2012), “Earthquake Simulation Tests on a 1:5 Scale 10 - Story RC Residential Building Model”, Proceedings of 15th World Conference on Earthquake Engineering, Lisbon, Portugal.
Wallace, J. W. (2010), “Performance-Based Design of Tall Reinforced Concrete Core Wall Buildings”, Earthquake Engineering in Europe, Springer, Netherlands, 279-307.
Wood, S. L., Stark, R., & Greer, S. A. (1991), “Collapse of eight-story RC building during 1985 Chile earthquake”, Journal of Structural Engineering, 117(2), 600-619.
Yuksel, S. B., & Kalkan, E. (2007), “Behavior of tunnel form buildings under quasi-static cyclic lateral loading”, Structural Engineering and Mechanics, 27(1), 99-115.
2649