Embed Size (px)
Citation preview

54
EFFECT OF SOIL ACIDITY AMELIORATION ON MAIZE YIELD AND NUTRIENT INTERRELATIONSHIPS IN SOIL AND PLANTS USING STEPWISE REGRESSION AND NUTRIENT VECTOR ANALYSIS
5.1 INTRODUCTION
Soil acidity is as a major constraint to crop production throughout the world (Sumner & Noble,
2003). Venter et al. (2001) reported that although the extent of man-made topsoil acidity in
South-Africa is difficult to quantify, it is estimated that 37% of the cropped area in the summer
rainfall region, west of the Drakensberg, is acidified to some extent. In the winter rainfall region
60% of soil analyses indicated an acidity problem (Venter et al., 2001). Furthermore, vast areas
in South Africa occupied by resource poor rural communities in the higher rainfall areas are
characterized by acid soils, and commonly deficient in Ca, Mg, Mo and P (Beukes, 1995). The
fertility of acid soils is limited by two fundamental factors; the presence of phytotoxic substances
(e.g. soluble Al and Mn) and nutrient deficiencies (e.g. P, Ca, and Mg). Aluminium toxicity limits
nutrient use efficiency and crop production through reducing root growth which greatly restricts
the ability of the plant to explore the soil volume for nutrients and water. This also leads to
restricted uptake of P, Ca, and Mg by plant roots and deficiencies of these nutrients are common
in plants suffering from Al toxicity (Foy & Fleming, 1978; Foy, 1984; Haynes, 2001).
Aluminium toxicity interferes with active ion uptake processes functioning across the root-cell
plasma membrane (Wright, 1989; Haynes, 2001). Toxic concentrations of Al have been shown
to reduce P and Ca uptake by crops. The mechanism of Al/P interactions is proposed to be an
adsorption/precipitation reaction between Al and P at the root surface or in the root free space
(McCormick & Borden, 1974; Tan & Keltjens, 1990; Haynes, 2001). Aluminium toxicity also
results in inhibition of Ca and Mg uptake by plants. Mengel and Kirkby (1987) reported that Al
(probably AlOH2+) specifically depressed Mg uptake in oats whereas the uptake of Ca and K was
little affected. Foy (1992), also, reported antagonistic effects between Ca and Al in soil. These
effects include decreased susceptibility to Al toxicity at increased Ca levels, and reduced uptake
and translocation of Ca as solution Al3+ is increased (Haynes, 2001). On acidic soils, excessive
levels of soluble Mn can induce Fe deficiency in some plants, thereby causing the development
of Mn toxicity symptoms on older leaves and Fe deficiency symptoms on younger leaves
(Grundon et al., 1997; Thibaud & Farina, 2006). Sometimes excessive Mn can induce deficiency
5

55
of Mg, and Ca as well. In the case of Mn induced Ca deficiency (“crinkle leaf”), reported in cotton
and beans, the transportation of Ca in the growing points is affected (Mengel & Kirkby, 1987).
The present study was undertaken to investigate the effect of lime application on maize yield and
nutrient interrelationships in soils and plants. The study area is characterized by acidic soils that
could lead to toxic levels of Al and Mn detrimental to maize growth. Although it is generally
accepted that liming effectively reduces elevated concentrations of Al and Mn in soil, it could
decrease the availability of B, Zn and Cu in soil (see Chapter 4). It is therefore also necessary to
study nutrient interactions as affected by soil acidity in order to understand the potential soil and
leaf nutrient imbalances that may arise from lime application. The objectives of the study were
therefore to (i) determine the interrelationships between maize grain yield, soil and leaf nutrient
contents and (ii) evaluate possible lime induced nutrient interactions by means of nutrient vector
analyses.
5.2 MATERIAL AND METHODS
5.2.1 Experimental procedure
Two field trials, which were discussed in Chapter 2, were used to evaluate interrelationships
between soil and leaf nutrients. Some physical and chemical topsoil (0-250 mm) characteristics
of the experimental soils are summarized in Tables 2.1 and 4.1.
5.2.2 Soil and maize plant sampling and analysis
Topsoil samples (0 - 250 mm) were collected annually in February/March at flowering. Eight sub
samples were taken within each plot between the rows and bulked as a composite sample, air-
dried and ground to pass through a 2 mm sieve prior to analysis.
Soil pH (H2O) was determined in a 1:2.5 (soil:water) suspension (Reeuwijk, 2002). Extractable
acidity (H + Al) and Al were determined in a 1 M potassium chloride (KCl) extraction and titration
with 0.1 M NaOH. Extractable Al was determined in the same extract by complexing it by adding
10 cm3 NaF to the titrate, and titrating again to an end point. (The Non-Affiliated Soil Analysis
Work Committee, 1990). Acid saturation was determined as the ratio of extractable acidity (Al +
H) to the sum of extractable Ca, Mg, K and extractable acidity (Al + H), expressed as a
percentage. Extractable P was determined according to the Bray-1 extraction method (Bray &
Kurtz, 1945). The P concentrations of the extracts were determined on a continuous flow
analyzer (Bray & Kurtz, 1945). The NH4OAc (1 M, pH 7) method was used to determine the
extractable cations Ca, Mg and K. The cations in solution were determined on an atomic

56
absorption spectrophotometer (Thomas, 1982). A 0.02 M di-ammonium EDTA ((NH4)2EDTA)
extract (The Non-Affiliated Soil Analysis Work Committee, 1990) was used to extract Cu, Zn, Co,
and Mo were determined by ICP-MS. Water soluble B was determined by the hot water
extraction method (The Non-Affiliated Soil Analysis Work Committee, 1990).
Maize leaf samples, immediately opposite and below the first ear were annually collected at
flowering (end of February, beginning of March), 8 to 10 weeks after planting. The leaf samples
were washed in deionized water, dried at 70ºC and milled. Nitrogen was determined by dry
oxidation (Bellomonte et al., 1987) using a Carlo-Erba CNS instrument. For the determination of
P, K, Ca, Mg, K, Fe, Mn, Al, Cu, Zn and B, 1 g samples were wet-digested on a block digester
with 1:3 (HNO3 and HClO4) and analyzed using an ICP-OES (Zasoski & Burau, 1977). For the
determination of Mo, 0.5 g leaf samples were wet-digested with HNO3 and analysed using an
ICP-MS (Chao-Yong & Schulte, 1985). Above-ground dry matter biomass was determined at
flowering by cutting the above-ground plant parts at the soil surface. The plant parts were dried
at 65˚C to constant mass at which time they were weighed.
5.2.3 Statistical analysis and data interpretation
The values that will be discussed are annual replicate means per lime application level and
replicated means per lime application level over years. Pearson's correlations were calculated
between all variates measured. Forward selection stepwise regression was used to determine
those soil properties most responsible for the variation found in maize grain yield (Genstat, 2003).
To facilitate interpretation, yield data and the chemical composition of leaf samples was
interpreted using a graphical vector nutrient diagnostic technique (Timmer & Stone, 1978;
Timmer & Teng, 1999, Ströhmenger, 2001). Nutrient vector analysis involves graphical
representation of the relative changes in biomass, leaf nutrient contents and concentrations in
leaves in response to nutrient treatments (Grundon et al., 1997). The relationship (Figure 5.1) is
examined by comparing growth and nutrient status of crops in a nomogram that plots biomass (z)
on the upper axis, leaf nutrient content (x) on the lower axis, and corresponding nutrient
concentration (y) on the vertical axis.
When relative yield is normalized to 100% at a specified reference sample (i.e. the 5 tonnes lime
ha-1 application in this study), differences are depicted as vectors because of shifts in both
direction and magnitude (Timmer & Teng, 1999). The dashed diagonals are isopleths
representing change of y on x, where z remains unchanged (Ströhmenger, 2001). Diagnosis is
based on vector direction of individual nutrients, identifying occurrence of dilution (A), sufficiency
(B), deficiency (C), luxury consumption (D), toxicity (E) and antagonism (F), as depicted in Figure

57
5.1. Vector magnitude reflects the extent or severity of specific diagnoses, and facilitates relative
ranking and prioritizing (Temmer & Teng, 1999).
Vector shift
Change in relative
Nutritional effect
Nutrient status
Possible diagnosis
z x y
A
B
C
D
E
F
+
+
+
0
-
-
+
+
+
+
-, +
-
-
0
+
+
+
-
Dilution
Accumulation
Accumulation
Accumulation
Concentration
Antagonism
Non-limiting
Non-limiting
Limiting
Non-limiting
Excess
Limiting
Growth dilution
Sufficiency, steady-state
Deficiency response
Luxury consumption
Toxic accumulation
Induced deficiency by E
Figure 5.1 Nutrient vector analysis. Interpretation of directional changes in relative biomass
and nutrient status of plants contrasting in growth (Timmer & Teng, 1999).
5.2 RESULTS AND DISCUSSIONS
5.3.1 Interrelationship between maize grain yield, soil and leaf nutrients Linear interrelationships between maize grain yield and selected soil and leaf nutrients are
presented in Tables 5.1 and 5.2.
R
F
E D
C
A
B
Nutrient content (x)
Biomass (z) N
utrie
nt c
once
ntra
tion
(y)

58
Table 5.1 Correlation matrix for the relationship between maize grain yield, soil and leaf nutrients for the Hutton soil form
Soil Leaf Al P Ca Mg K Zn Mo Cu B N Ca Mg P K Fe Al Mn Zn Cu B
Soil P 0.11
Soil Ca -0.48** 0.08
Soil Mg -0.42* -0.13 0.95***
Soil K -0.16 -0.190 -0.08 -0.02
Soil Zn -0.18 0.28 0.60*** 0.60*** 0.17
Soil Mo -0.09 0.62*** 0.13 -0.06 -0.18 0.05
Soil Cu -0.24 0.03 0.36 0.46* 0.23 0.64*** 0.12
Soil B 0.17 -0.65*** 0.06 0.27 0.17 0.10 -0.76*** 0.10
Leaf N -0.18 0.10 -0.03 -0.08 -0.04 0.02 -0.35 -0.02 -0.10
Leaf Ca -0.24 0.19 0.19 0.02 -0.01 -0.04 0.04 -0.48** -0.29 0.32
Leaf Mg -0.41* -0.14 0.70*** 0.74*** -0.04 0.50** 0.15 0.43* 0.13 -0.21 0.06
Leaf P -0.15 0.32 0.14 0.06 -0.07 0.26 -0.11 0.15 -0.04 0.85*** 0.26 0.01
Leaf K 0.04 0.17 -0.06 -0.10 -0.39 -0.31 0.23 -0.19 -0.38* -0.14 -0.07 -0.23 -0.07
Leaf Fe -0.14 -0.27 -0.25 -0.11 -0.06 -0.131 -0.22 0.20 0.05 -0.03 -0.32 -0.09 -0.32 0.31
Leaf Al 0.05 -0.35 -0.09 0.12 -0.04 -0.12 -0.42* 0.12 0.44* -0.04 -0.44* 0.11 0.06 0.10 0.63***
Leaf Mn 0.26 -0.32 0.31 0.41* -0.12 0.34 -0.48** 0.07 0.63*** 0.21 0.08 0.22 0.21 -0.30 -0.14 0.07
Leaf Zn -0.19 -0.24 0.12 0.29 -0.05 0.16 -0.38* 0.42* 0.35 0.13 -0.14 0.24 0.10 -0.13 0.56** 0.51** 0.27
Leaf Cu -0.06 -0.08 0.34 0.34 -0.12 0.31 -0.37* 0.10 0.36 0.44* 0.26 0.22 0.34 -0.37* -0.16 -0.05 0.62*** 0.44*
Leaf B -0.22 -0.21 0.20 0.34 0.05 0.31 -0.34 0.36 0.34 0.35 0.01 0.27 0.40* -0.07 0.23 0.37* 0.28 0.47* 0.14
Yield -0.28 -0.01 0.14 0.03 0.22 0.22 -0.18 -0.01 0.05 0.46* 0.46* -0.06 0.30 -0.24 0.38* -0.54** 0.20 -0.10 0.35 0.17
* P<0.05, **P<0.01 & ***P<0.001

59
Table 5.2 Correlation matrix for relationship between maize grain yield, soil and leaf nutrients for the Oakleaf soil form
Soil Leaf
Al P Ca Mg K Zn Mo Cu B N Ca Mg P K Fe Mn Zn Cu B
Soil P 0.14
Soil Ca -0.95*** -0.09
Soil Mg -0.94*** -0.04 0.99***
Soil K -0.24 -0.01 0.45* 0.46*
Soil Zn 0.07 0.24 0.05 0.09 0.45*
Soil Mo 0.35 0.04 -0.24 -0.26 0.15 0.43*
Soil Cu 0.57** 0.12 -0.57** -0.59*** 0.09 0.31 0.19
Soil B 0.53** 0.10 -0.41* -0.42* 0.07 0.62*** 0.70*** 0.19
Leaf N 0.16 0.34 -0.22 -0.20 -0.09 -0.32 -0.09 0.15 -0.34
Leaf Ca -0.36 0.23 0.34 0.39* 0.09 -0.27 -0.37* -0.01 -0.69*** 0.66***
Leaf Mg -0.76*** 0.15 0.79*** 0.81*** 0.20 -0.06 -0.34 -
0 48**
-0.62*** 0.04 0.54**
Leaf P 0.19 0.09 -0.29 -0.30 -0.34 -0.58*** 0.14 -0.26 -0.25 0.70*** 0.18 -0.05
Leaf K 0.15 0.12 -0.14 -0.07 -0.06 0.37 -0.12 0.16 0.17 -0.19 -0.02 -0.22 -0.27
Leaf Fe 0.21 -0.02 -0.19 -0.14 -0.02 0.28 0.23 -0.18 0.43* 0.15 0.01 -0.19 0.15 0.10
Leaf Mn 0.51** 0.25 -0.36 -0.35 0.12 0.03 0.23 -0.08 0.38* 0.36 -0.01 -0.40* 0.46** 0.16 0.49**
Leaf Zn -0.40 0.38* 0.40* 0.43* 0.01 -0.17 0.18 -0.16 -0.56** 0.62*** 0.83*** 0.69*** 0.28 -0.16 -0.12 -0.05
Leaf Cu 0.31 0.23 -0.34 -0.32 -0.09 -0.23 0.11 0.08 -0.10 0.88*** 0.48** -0.15 0.66*** -0.22 0.47** 0.56** 0.40*
Leaf B 0.01 0.21 -0.10 -0.10 -0.25 -0.11 0.13 0.27 -0.26 0.08 0.23 0.22 -0.13 -0.42* -0.02 -0.44* 0.15 0.10
Yield -0.54** 0.24 0.49** 0.53** 0.15 -0.06 0.37* -0.01 -0.66*** 0.51** 0.92*** 0.67*** 0.04 -0.10 0.02 -0.20 0.79*** 0.34 0.36
*P<0.05, **P<0.01 & ***P<0.001

60
Hutton soil form: Table 5.1 shows a strong relationship (P<0.001) between soil P and soil Mo
(r=0.62). Increased P status of the soil has been found to greatly increase the absorption of Mo
by plants (Podzolkin, 1967; Gupta & Munro, 1969; Blamey & Nathanson, 1975; Barnard, 1978;
Thibaud & Farina, 2006). Although P and Mo are chemically similar, the size of the H2PO4- anion
fits better than H2MO4- in the fixation sites and therefore the preferred H2PO4
- fixation results in
the release of Mo. Leaf P concentrations tended to increase with increasing leaf N. A negative
correlation (P<0.01) was obtained between maize grain yield and leaf Al (r=-0.54), but significant
(P<0.05) positive correlations were observed between maize grain yield and leaf N (r=0.46), leaf
Ca (r=0.46) and leaf Fe (r=0.38), respectively.
Further analysis using stepwise regression (Table 5.3) revealed that, of these factors, leaf Fe
was the most important, accounting for 33.7% of the variation in maize grain yield. Progressive
addition of the variables leaf Ca, Zn, and Mg increased the explained variation to 56.2%.
Table 5.3 Summary of the forward stepwise regression analysis for yield for the two
experimental soils
Variables in model Hutton
Variance accounted for (%) F
Leaf Fe 33.70 13.04***
+ leaf Ca 47.7 12.63***
+ leaf Zn 52.3 12.19*
+ soil Mg 56.2 11.90*
Yield = -0.19 – 0.00719 leaf Fe + 8.22 leaf Ca – 0.0176 leaf Zn – 0.03402 soil Mg
Oakleaf
Leaf Ca 83.10 84.37***
+ soil Al 87.60 6.87*
+ leaf B 93.00 3.50ns
Yield = -1.062 + 10.388 leaf Ca – 0.461 soil Al + 0.1735 leaf B
Oakleaf soil form: Strong negative correlations (P<0.001) were observed between soil Al and
soil Ca (r=-0.95), soil Mg (r=-0.94) and leaf Mg (r=-0.76), respectively (Table 5.2). These results
indicated that the high levels of Al observed in this soil were accompanied by low concentrations
of Ca and Mg in soil and leaf tissues.
Improved plant growth due to an increase in leaf N resulted in increased uptake of leaf P (r=0.70),
leaf Ca (r=0.66), leaf Zn (r=0.62), and leaf Cu (r=0.88), respectively. In many soils, N is the main
limiting factor of growth and yield. Therefore, crops often respond to the applied nutrients, e.g.

61
Zn and N together, but not to Zn alone (Alloway, 2004). Strong positive correlations (Table 5.2)
were found between leaf Zn and leaf Ca (r=0.83), as well as with leaf Mg (r=0.69). These
somewhat contradictory results are difficult to explain because it is well-known that Ca and Mg
inhibit the absorption of Zn by plant roots through their influence on soil pH when applied as
calcitic or dolomitic lime (Mengel & Kirkby, 1987; Alloway, 2004).
Acidic conditions in soil often enhance the solubility of heavy metals such as Cu. Table 5.2
shows that an increase in soil Mg, accompanied with an increase in soil pH, resulted in a
significant decrease in soil Cu (r=-0.59). Strong (P<0.001) negative relationships between soil B
and leaf Ca (r=-0.62), and leaf Mg (r=-0.69), were found (Table 5.2). Previous studies have
shown a sharp decrease in available B with liming (Gupta & MacLeod, 1981; Dwivedi et al.,
1992), ascribed to increased soil pH rather that to the amount of Ca added through lime.
Significant positive correlations (P<0.001) were obtained between maize grain yield vs. leaf Ca
(r=0.92), as well as with leaf Zn (r=0.79), leaf Mg (r=0.69), and soil B (r=0.66), respectively.
Stepwise regression (Table 5.3) revealed that, of these factors, leaf Ca was the most important
accounting for 83% of the variation in maize grain yield. Progressive addition of the variables soil
Al and leaf B increased the explained variation to 93%.
5.3.2 Nutrient uptake interactions
Evidence exists to the effect that the plant’s internal requirement for some nutrients, and hence
its critical concentration for deficiency diagnosis, varies with the supply of other nutrients
(Grundon et al., 1997). Figure 5.2 (a & b) shows the vector analysis for 0 and 10 tonnes lime ha-
1 treatments on the Hutton and Oakleaf soils relative to the 5 tonnes lime ha-1 treatment for the
Hutton soil form, whose status was normalized to 100% to allow comparison on a common base.
Hutton soil form: The nomogram shows downward, left-pointing vectors associated with Ca and
Mg, and the largest, upward right-pointing vectors associated with Fe, Al and Mn respectively, in
the 0 tonnes lime ha-1 treatment (Figure 5.2 (a)). As indicated by Timmer and Teng (1999), the
vector length increases with reduced plant biomass or the severity of decline. The results from
Figure 5.2 (a) indicate that toxic build-up of Fe, followed by Al, and to a lesser extent by Mn,
inhibited the uptake of Ca and Mg in the 0 lime ha-1 treatment. Aluminium toxicity is frequently
accompanied by high levels of Fe and Mn and low concentrations of Ca and Mg in plant tissue.
This is to be expected, since Al toxicity is associated with acid soil conditions where the
availability of both Fe and Mn is high and where the levels of Ca and Mg are often low because
of leaching. The nomogram in Figure 5.2 (a) indicates an increased uptake of Ca and Mg, and
decreased uptake of Al, Mn and Fe.

62
Figure 5.2 Relative response in nutrient concentration, content and dry mass of maize plants
grown at differential lime rates in the (a) Hutton and (b) Oakleaf soil forms.
Calcium and Mg deficiency was corrected by the application of dolomitic lime application, which
antagonistically reduced Al, Mn and Fe uptake and availability. The uptake of B was also
markedly lower in the 0 lime ha-1 treatment (Figure 5.2 (a)) presumably due to elevated Fe, Al
and Mn leaf concentrations associated with acid soils. One of the consequences of soil acidity
0
50
100
150
200
250
300
0 50 100 150
Relative nutrient content (%)
Rel
ativ
e nu
trien
t con
cent
ratio
n (%
)
N P K Ca Mg Mn Fe Zn Cu B Al
Relative plant biomass (%) 36 50
55
0
50
100
150
0 50 100 150
Relative nutrient content (%)
Rel
ativ
e nu
trien
t con
cent
ratio
n (%
)
N P K Ca Mg Mn Al Fe Zn Cu B Mo
Relative plant biomass (%) 85100101
(a)
(b)

63
may be the leaching of soil B. Boron in soil occurs mainly as H2BO3, a weak acid whose the
dissociation is reduced under low pH conditions, resulting in the leaching of H2BO3 (Fölscher,
1978). An increased accumulation of leaf Zn, Mg, P, Ca, N, and to a lesser extent B, Mo, Cu and
K, without any gain in maize biomass, was observed in the 10 tonnes lime ha-1 treatment (Figure
5.2 (a)). This indicated a non-limiting luxury consumption of Zn, Mg, P, Ca, N, B, Mo, Cu and K
by the maize plants treated with 10 tonnes lime ha-1.
Oakleaf soil form: The nomogram shows downward, left-pointing vectors associated with Ca and
Mg, and the largest, upward left-pointing vectors associated with Fe, Al and Mn, respectively, in
the 0 and 10 tonnes lime ha-1 treatments (Figure 5.2 (b)). Results in Figure 5.2 (b) show that soil
Al, followed by Mn and Fe, markedly reduced the uptake of Ca and Mg. Effective liming, i.e. 10
tonnes lime ha-1 treatment, alleviated the problem of Fe, Al and Mn toxicity as shown in Figure
5.2 (b). According to Haynes (2001) several mechanisms explain the antagonistic effect of Al on
Ca and Mg uptake. Firstly, Ca2+ and Mg2+ in the root apoplasm are thought to be replaced by
Al3+ and this reduces the amount of Ca2+ and Mg2+ in the vicinity of the plasma membrane,
reducing their rate of uptake. It has also been reported that Al3+ blocks Ca2+ channels in the
plasma membrane and that Al3+ blocks binding sites for Mg2+ on transport proteins at the plasma
membrane (Rengel & Robinson, 1989; Haynes, 2001). Antagonistic reduction of B uptake due to
Al, Mn, and to a lesser extent Fe, toxicity was not observed in the Oakleaf soil.
Figure 5.2 (b) shows a right-pointing vector that was associated with high Al, and to a lesser
extent Mn and a downward, left-pointing vector associated with K in all treatments (0, 5 and 10
tonnes lime ha-1). This indicated that the problems associated with soil acidity were not
alleviated with 5 and 10 tonnes lime applications. The predominant constraints resulting from
increasing soil acidity is a severe chemical imbalance caused by toxic levels of Al, and Mn ions
coupled with a parallel critical deficiency in available N, P, K, Ca, Mg, Mo, and sometimes, Zn
(Fageria & Baligar, 2003). Furthermore, at low pH levels cell membranes are impaired and
become more permeable. This results in a leakage of plant nutrients and particularly of K, which
diffuses out of the root cells into the soil solution. This detrimental effect of high H+
concentrations on biological membranes can be counterbalanced by Ca applied as lime (Mengel
& Kirkby, 1987).
5.3 CONCLUSIONS
Nutrient vector analyses showed a toxic build-up of Fe, followed by Al, and to a lesser extent by
Mn. The toxic elements depressed the uptake of and Mg in the Hutton soil. In the Oakleaf soil,
Al-toxicity, followed by high levels of Mn and Fe markedly reduced the uptake of Ca and Mg.
Antagonistically reduced B uptake due to Fe, Mn, and Al toxicity was observed in the Hutton soil.

64
Toxic levels of Al, Mn and Fe antagonistically depressed the uptake of K in the Oakleaf soil.
Generally the results indicated that soil acidity had a confounding influence on soil fertility, leaf
nutrient uptake and maize growth. Aluminium-, Mn- and Fe-toxicity, respectively, and deficient
levels of Ca and Mg were the factors that most adversely affected nutrient uptake and maize
grain yields in the study area. The highest yields were associated with low leaf Al, Fe and Mn
levels. It was also found that the uptake of leaf K and leaf B levels was decreased extensively
under severe leaf Al, Mn and Fe toxicity.

65
RELATIONSHIPS BETWEEN SOIL BUFFER CAPACITY AND SELECTED SOIL PROPERTIES
6.1 INTRODUCTION
One of the main problems with soil acidity is the relationship between the total acidity of the
system (i.e. the nature and amounts of proton donors in the solid phase) and the intensity of
acidity (i.e. the activity of hydrogen ions in the soil solution). This relationship is defined as the
soil buffer capacity (Bache, 1988). The determination of soil buffer capacity (soil BC) has long
been of interest to soil chemists and crop scientists. The reason is that many crops respond
positively to the addition of lime to acid soils, but because of the differences in soil BC, soils of
similar pH may require vastly different quantities of lime to yield the same increase in pH. A
soil’s BC is furthermore also needed to understand the rate of natural soil weathering as well as
the rate of soil acidification from acid-forming nitrogen fertilizers, acid rain, and acid mine waste
(Bloom, 2000).
Laboratory measurement of soil BC by titration techniques is used to directly determine lime
requirement (McLean et al., 1966; Follett & Follett, 1983), to calibrate rapid lime requirement
tests and to ascertain soil BC in acidification studies enabling calculation of acidification rates
(Helyar & Porter, 1989; van Breemen, 1991; Aitken & Moody, 1994). The general factors
responsible for soil BC and pH buffering in soils, include the amount of organic matter (OM) and
the type of clay minerals present (Magdoff et al., 1987). Soil buffering caused by the protonation
and deprotonation of minerals and organic materials reduces the change in soil pH when acids or
bases are added to the soil. In most soils, the general pH range of buffering by soil components
is from 4.0 to 8.0. Acid buffering mechanisms include aluminosilicate dissolution at low pH and
CaCO3 dissolution in the upper pH range. Buffering at intermediate pH (5.0 to 7.5), which is of
more interest in agriculture, is mainly by cation exchange reactions in which functional groups
associated primarily with variable-charge minerals and soil organic matter act as sinks for H+ and
OH- ions. The buffering that occurs because of organic matter is from the weakly acidic
carboxylic and phenolic functional groups (Neilsen et al., 1995; Curtin et al., 1996; Curtin &
Ukrainetz, 1997, Weaver et al., 2004).
Currently limited information is available on the soil properties that govern the soil BC of South
African soils. Steinke et al. (2004) found in a study of 35 surface soils of rural and community
farmers in the Eastern Cape Province of South Africa, that the soil BC was related primarily to
6

66
soil organic carbon, extractable acidity (Al + H) and goethite. In the United Kingdom, soil texture
and organic matter content have been used to derive buffer capacity (Bache, 1988; Aitken et al.,
1990), with soil BC increasing as clay and organic matter increase. Although the effect of liming
on soil BC on two lime-amended soils in the study area was evaluated in Chapter 3, the relative
importance of soil properties in determining the soil BC of soils in the Mpumalanga Province of
South Africa has yet to be ascertained. Therefore, in order to assist in the prediction of
management strategies (e.g. maintenance lime requirements, acidification rates) the project was
extended to other soils outside the experimental plots. In this study the relationships between
soil properties and soil BCs for 80 acidic soils from the Mlondozi district of Mpumalanga were
investigated. The objectives of the study were to (i) determine soil BC, and (ii) examine the
relationships between soil BC and selected soil properties.
6.2 MATERIAL AND METHODS
6.2.1 Soils
The data used in this study were collected from a total of 80 topsoil (0-250 mm) samples in the
Mlondozi district. The soils represented the most dominant soil forms, namely Clovelly (Xantic
Ferralsols) and Magwa (Humic Ferralsols), with the Hutton (Rhodic Ferralsols) and Inanda
(Humic Umbrisols; FAO-ISS-ISRIC, 1998) soil forms subdominant (Booyens et al., 2000).
6.2.2 Soil analysis
Topsoil samples were air-dried and ground to pass through a 2 mm sieve. A particle size
analysis was performed on the <2 mm soil fraction using the pipette method (Gee & Bauder,
1986). The cation exchange capacity (CEC) was determined with 1 mol dm-3 ammonium acetate
(NH4OAc) extraction at pH 7. The Walkley-Black method was used for the determination of
organic carbon (Walkley & Black, 1934). Extractable acidity (H + Al) and Al were determined in a
1 mol dm-3 potassium chloride (KCl) extraction and titration with 0.1 M NaOH. Extractable Al was
determined in the same extract by complexing it by adding 10 cm3 NaF to the titrate, and titrating
again to an end point. Soil pH (H2O) and pH (KCl) were determined in 2:5 (soil:water) and (KCl)
suspension, respectively, using a combined calomel reference glass electrode and pH meter
(Reeuwijk, 2002). Free oxides of iron, aluminium and manganese in soils were determined by
heating 4 g of soil in a water-bath at 77 ˚C in a Na-citrate/Na-bicarbonate/Na-dithionite solution
(CBD-method) and the amount of Fe, Al and Mn recorded by atomic absorption (The Non-
Affiliated Soil Analysis Work Committee, 1990).
67
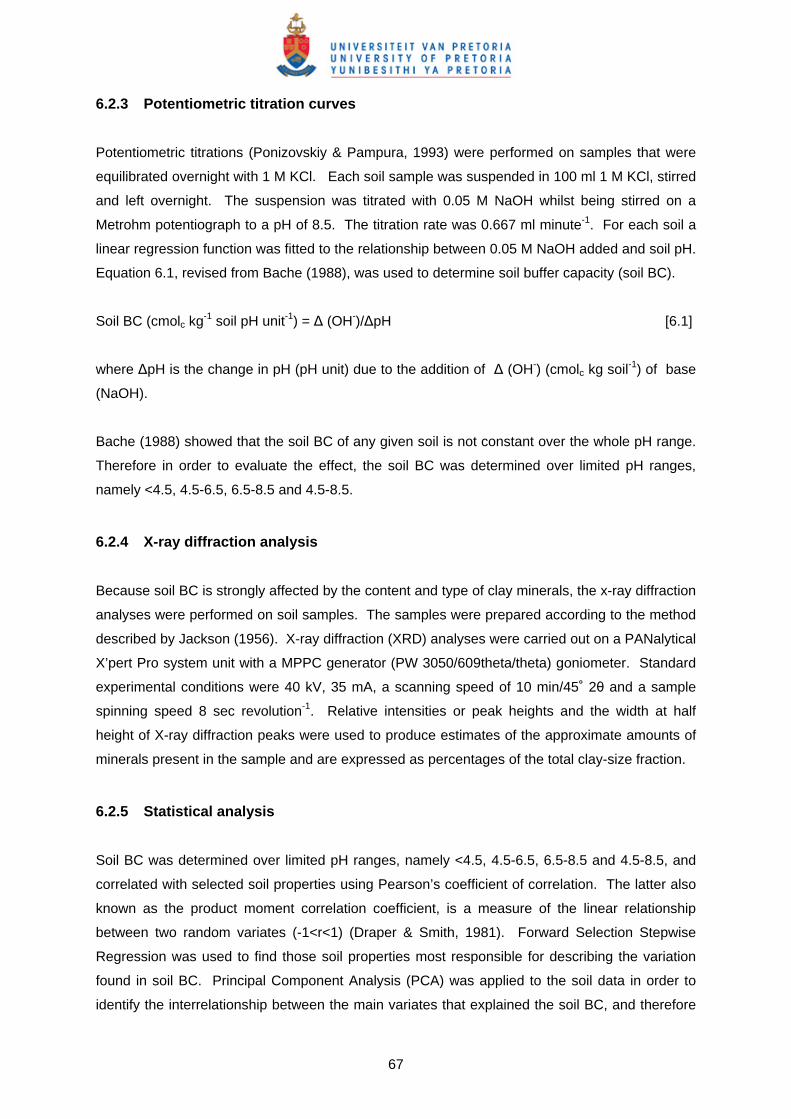
6.2.3 Potentiometric titration curves
Potentiometric titrations (Ponizovskiy & Pampura, 1993) were performed on samples that were
equilibrated overnight with 1 M KCl. Each soil sample was suspended in 100 ml 1 M KCl, stirred
and left overnight. The suspension was titrated with 0.05 M NaOH whilst being stirred on a
Metrohm potentiograph to a pH of 8.5. The titration rate was 0.667 ml minute-1. For each soil a
linear regression function was fitted to the relationship between 0.05 M NaOH added and soil pH.
Equation 6.1, revised from Bache (1988), was used to determine soil buffer capacity (soil BC).
Soil BC (cmolc kg-1 soil pH unit-1) = Δ (OH-)/ΔpH [6.1]
where ΔpH is the change in pH (pH unit) due to the addition of Δ (OH-) (cmolc kg soil-1) of base
(NaOH).
Bache (1988) showed that the soil BC of any given soil is not constant over the whole pH range.
Therefore in order to evaluate the effect, the soil BC was determined over limited pH ranges,
namely <4.5, 4.5-6.5, 6.5-8.5 and 4.5-8.5.
6.2.4 X-ray diffraction analysis
Because soil BC is strongly affected by the content and type of clay minerals, the x-ray diffraction
analyses were performed on soil samples. The samples were prepared according to the method
described by Jackson (1956). X-ray diffraction (XRD) analyses were carried out on a PANalytical
X’pert Pro system unit with a MPPC generator (PW 3050/609theta/theta) goniometer. Standard
experimental conditions were 40 kV, 35 mA, a scanning speed of 10 min/45˚ 2θ and a sample
spinning speed 8 sec revolution-1. Relative intensities or peak heights and the width at half
height of X-ray diffraction peaks were used to produce estimates of the approximate amounts of
minerals present in the sample and are expressed as percentages of the total clay-size fraction.
6.2.5 Statistical analysis
Soil BC was determined over limited pH ranges, namely <4.5, 4.5-6.5, 6.5-8.5 and 4.5-8.5, and
correlated with selected soil properties using Pearson’s coefficient of correlation. The latter also
known as the product moment correlation coefficient, is a measure of the linear relationship
between two random variates (-1<r<1) (Draper & Smith, 1981). Forward Selection Stepwise
Regression was used to find those soil properties most responsible for describing the variation
found in soil BC. Principal Component Analysis (PCA) was applied to the soil data in order to
identify the interrelationship between the main variates that explained the soil BC, and therefore
68
to simplify the interpretation of the soil characteristic data. All statistical analyses were done
using GenStat (2003).
6.3 RESULTS AND DISCUSSION
6.3.1 Soil characteristics
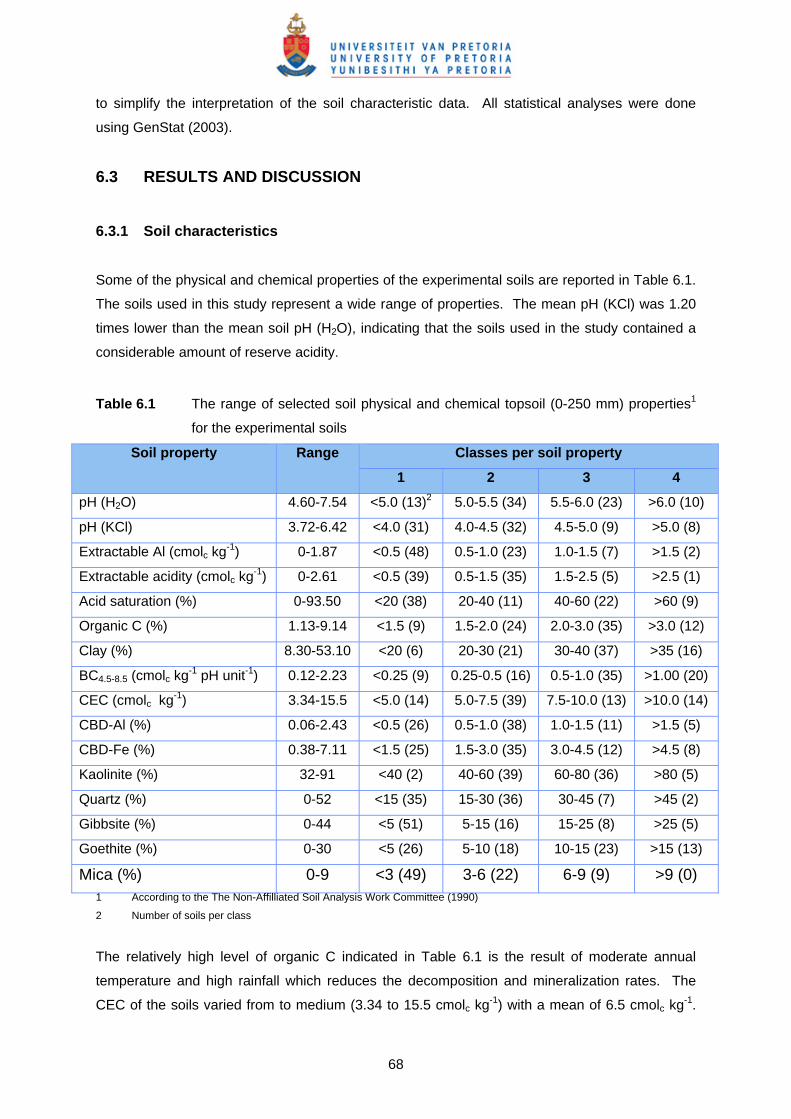
Some of the physical and chemical properties of the experimental soils are reported in Table 6.1.
The soils used in this study represent a wide range of properties. The mean pH (KCl) was 1.20
times lower than the mean soil pH (H2O), indicating that the soils used in the study contained a
considerable amount of reserve acidity.
Table 6.1 The range of selected soil physical and chemical topsoil (0-250 mm) properties1
for the experimental soils
Soil property Range Classes per soil property
1 2 3 4
pH (H2O) 4.60-7.54 <5.0 (13)2 5.0-5.5 (34) 5.5-6.0 (23) >6.0 (10)
pH (KCl) 3.72-6.42 <4.0 (31) 4.0-4.5 (32) 4.5-5.0 (9) >5.0 (8)
Extractable Al (cmolc kg-1) 0-1.87 <0.5 (48) 0.5-1.0 (23) 1.0-1.5 (7) >1.5 (2)
Extractable acidity (cmolc kg-1) 0-2.61 <0.5 (39) 0.5-1.5 (35) 1.5-2.5 (5) >2.5 (1)
Acid saturation (%) 0-93.50 <20 (38) 20-40 (11) 40-60 (22) >60 (9)
Organic C (%) 1.13-9.14 <1.5 (9) 1.5-2.0 (24) 2.0-3.0 (35) >3.0 (12)
Clay (%) 8.30-53.10 <20 (6) 20-30 (21) 30-40 (37) >35 (16)
BC4.5-8.5 (cmolc kg-1 pH unit-1) 0.12-2.23 <0.25 (9) 0.25-0.5 (16) 0.5-1.0 (35) >1.00 (20)
CEC (cmolc kg-1) 3.34-15.5 <5.0 (14) 5.0-7.5 (39) 7.5-10.0 (13) >10.0 (14)
CBD-Al (%) 0.06-2.43 <0.5 (26) 0.5-1.0 (38) 1.0-1.5 (11) >1.5 (5)
CBD-Fe (%) 0.38-7.11 <1.5 (25) 1.5-3.0 (35) 3.0-4.5 (12) >4.5 (8)
Kaolinite (%) 32-91 <40 (2) 40-60 (39) 60-80 (36) >80 (5)
Quartz (%) 0-52 <15 (35) 15-30 (36) 30-45 (7) >45 (2)
Gibbsite (%) 0-44 <5 (51) 5-15 (16) 15-25 (8) >25 (5)
Goethite (%) 0-30 <5 (26) 5-10 (18) 10-15 (23) >15 (13)
Mica (%) 0-9 <3 (49) 3-6 (22) 6-9 (9) >9 (0) 1 According to the The Non-Affilliated Soil Analysis Work Committee (1990)
2 Number of soils per class
The relatively high level of organic C indicated in Table 6.1 is the result of moderate annual
temperature and high rainfall which reduces the decomposition and mineralization rates. The
CEC of the soils varied from to medium (3.34 to 15.5 cmolc kg-1) with a mean of 6.5 cmolc kg-1.

69
The dominant clay mineral was kaolinite. Kaolinite is a low activity clay which has little or no
permanent charge and therefore little capacity to buffer soil pH (Bloom, 2000). Soil BC data
shown in Table 6.1 are comparable with the normal range found in the literature (0.38-1.34; De
Sá Mendonça et al., 2005).
6.3.2 Potentiometric titration curves
Figure 6.1 illustrates combined data titration curves for the main soil forms found in the study
area. Titration curves followed the same general pattern as reported for surface soil horizons
(Magdoff et al., 1987; Steinke et al., 2004).
3.5
4.0
4.5
5.0
5.5
6.0
6.5
7.0
7.5
8.0
8.5
0 1 2 3 4 5 6
cmol (OH-) kg soil-1
pH in
sol
utio
n
Clovelly Hutton Magwa Inanda
Figure 6.1 Combined titration curves for the dominant soil types.
The Hutton, Magwa and Inanda soils tended to be relatively moderately buffered in the midrange
(pH 5.25-7.50) with no clear lower asymptotes and an upper asymptote up to pH 8.5. The
Clovelly soil forms tended to be very poorly buffered by comparison. Similar results were found
by Magdoff et al. (1987) for B and E horizons which tended to be moderately buffered to
unbuffered in the midrange, compared to O horizons which tended to be strongly buffered in the
midrange. The Inanda soils showed a tendency to be well buffered (Figure 6.1). Steinke et al.
(2004) ascribed the differences in soil BC to the organic C content of the soils, where sites with
poor buffering had a mean organic C content of 3.3% compared to 10.9% for well-buffered soils.
However, in this study the organic C content varied over a relatively small range (Table 6.2). The
differences in the titration curves and resultant soil BC can probably be ascribed to a combination

70
of different factors, of which the differences in extractable acidity (0.34 vs 1.07 cmolc kg-1) and Al
(0.25 vs 0.77 cmolc kg-1) that were observed between the soil forms, could make substantial
contributions.
Table 6.2 Mean values of selected soil physical and chemical topsoil (0-250 mm)
properties1 for the dominant soil forms
Soil property Soil form
Clovelly Hutton Magwa Inanda
pH (H2O) 5.68 5.55 5.19 5.13
pH (KCl) 4.41 4.40 3.99 4.03
Extractable Al (cmolc kg-1) 0.25 0.39 0.62 0.77
Extractable acidity (cmolc kg-1) 0.34 0.42 0.94 1.07
Acid saturation (%) 18.45 20.14 46.98 43.90
Organic C (%) 1.90 1.81 2.38 2.60
Clay (%) 29.41 30.36 33.97 40.56
BC4.5-8.5 (cmolc kg-1 pH unit-1) 0.53 0.68 0.86 1.13
CEC (cmolc kg-1) 6.32 5.86 7.86 9.19
CBD-Al (%) 0.58 0.62 0.77 0.89
CBD-Fe (%) 1.77 3.15 3.81 2.12
CBD-Mn (%) 0.005 0.009 0.004 0.012
Kaolinite (%)2 64.18 54.00 61.95 61.30
Quartz (%)2 19.50 16.43 16.57 12.00
Gibbsite (%)2 2.86 0.00 8.90 10.20
Goethite (%)2 10.11 14.71 6.43 10.40
Mica (%)2 2.32 2.57 2.33 2.00 1 According to the The Non-Affilliated Soil Analysis Work Committee (1990)
2 % of total clay
6.3.3 Soil buffer capacity over limited pH ranges vs soil properties
The relationships between soil BC for different soil pH ranges and selected soil properties are
presented in Table 6.3. It was found that all soil BCs were highly significantly (P<0.001)
correlated with clay content, log organic C content, extractable Al and acidity, log CBD-Al and Fe,
and CEC, and to a lesser extent with pH (H2O & KCl), CBD-Mn and gibbsite.
However, the soil BC of any given soil is not constant over the whole pH range (Bache, 1988;
see Chapter 3). The buffer capacity reactions in soils include proton desorption and adsorption
reactions by mineral and organic minerals, as well as ion exchange, dissolution and precipitation

71
reactions. Some of the soil components are effective in buffering over a wide range of pH values,
while others are effective over a limited pH range (Bloom, 2000). Therefore, the relationship of
soil BC, over limited pH ranges, with selected soil properties needed to be further evaluated.
Soil BC (pH<4.5): The correlation matrix (Table 6.3) reveals that extractable acidity and Al was
the best correlated with soil BC(pH<4.5), followed by organic C and clay content (all P < 0.001).
Previous studies showed that the soil BC increases as pH drops below 4.5. This is mainly due to
Al buffering, proton adsorption by clays and hydrous oxides (Bache, 1988; Bloom, 2000; Kauppi
et al., 1986). The significant correlation of organic C and clay content with soil BC(pH<4.5) is
consistent with previous studies which showed that both of these parameters buffer pH over a
wide range of pH values (Bloom, 2000; Magdoff et al., 1987; Weaver et al., 2004). In acid
mineral soils, many of the –COOH sites in soil organic matter are taken up by Al3+ and this
strongly bound Al has a large effect on buffering.
Soil BC (pH4.5-6.5): Soil properties found to correlate highly significantly (P<0.001) with soil
BC(pH4.5-6.5), were extractable acidity and Al, which can be regarded as the primary buffering
mechanism, followed by clay, CBD-Al, organic C and CBD-Fe. This is somewhat contradictory
to the statement of Bache (1988) who reported that for most surface soils, pH-dependent charge
associated with organic matter is the main buffering mechanism over the pH range 4.5-6.5.

72
Table 6.3 Correlation matrix for the relationship between soil BC and selected soil properties
BC4.5-8.5
BC<4.5
BC 4.5-6.5
BC6.5-8.5
pH(H2O)
pH KCl
Extr acid
Extr Al
L Ca L org. C
Clay CEC L CBD-Al
L CBD-Fe
L CBD-Mn
Qt Kt Go
BC <4.5 0.65***
BC 4.5-6.5 0.86*** 0.77***
BC 6.5-8.5 0.94*** 0.48*** 0.64***
pH (H2O) -0.55*** -0.55*** -0.74*** -0.42***
pH KCl -0.47*** -0.58*** -0.65*** -0.35** 0.92***
Extr acid 0.65*** 0.82*** 0.86*** 0.48*** -0.75*** -0.66***
Extr Al 0.68*** 0.83*** 0.87*** 0.51*** -0.76*** -0.65*** 0.98***
Log Ca -0.21 -0.33* -0.47*** -0.04 -0.70*** 0.64*** -0.72*** -0.69***
Log org. C 0.69*** 0.65*** 0.58*** 0.69*** 0.15 -0.12 0.38*** 0.38*** 0.03
Clay 0.74*** 0.63*** 0.62*** 0.77*** -0.17 -0.10 0.32** 0.32** 0.05 0.55***
CEC 0.60*** 0.49*** 0.44*** 0.61*** -0.08 -0.09 0.26* 0.23** 0.15 0.48*** 0.73***
Log CBDa-Al 0.68*** 0.62***` 0.60*** 0.68*** -0.25* -0.15 0.36** 0.38*** -0.11 0.66*** 0.64*** 0.39***
Log CBDa-Fe 0.66*** 0.52*** 0.50*** 0.71*** -0.17 -0.09 0.18 0.19 0.13 0.53*** 0.70*** 0.56*** 0.85***
Log CBDa-Mn 0.38*** 0.23 0.25* 0.45*** -0.01 0.03 0.02 0.035 0.26* 0.15 0.46*** -0.58*** 0.38*** 0.68***
Quartz -0.23* -0.26 -0.28* -0.18 0.31** 0.17 -0.23* -0.21 0.18 -0.08 -0.21 -0.03 -0.29** -0.24* -0.01
Kaolinte -0.20 -0.11 -0.09 -0.23* -0.13 -0.04 -0.07 -0.04 -0.10 -0.28 -0.17 -0.31** -0.13 -0.16 -0.09 -0.55***
Goethite 0.22 0.11 0.04 0.30** 0.11 0.17 -0.19 -0.16 0.30** 0.13 0.30** 0.08 0.33** 0.41*** 0.21 -0.10 -0.14
Gibbsite 0.38*** 0.35* 0.40*** 0.32** -0.23* -0.20 0.43*** 0.38*** -0.24 0.38*** 0.26* 0.29** 0.35** 0.25* -0.01 -0.19 -0.56*** -0.18
a Sodium-citrate-bicarbonate- dithionite
* P<0.05, **P<0.01 & ***P<0.001

73
Forward stepwise regression analysis shows (Table 6.4) that extractable Al, clay, pH (KCl),
organic C and CBD-Fe are significantly related with soil BC, with extractable Al being the most
important variable, accounting for 75.2% of the variation in soil BC(pH4.5-6.5). Progressive addition
of the variables clay, pH (KCl), organic C content and CBD-Fe increased the explained variation
to 92.2%.
Soil BC (pH6.5-8.5): Clay content was found to have the highest correlation with soil BC(pH6.5-8.5),
followed by CBD-Fe, organic C and CBD-Al (Table 6.3). Forward stepwise regression analysis
showed that clay, organic C, pH (H2O), CBD-Mn, and Ca were significantly correlated with soil
BC(pH6.5-8.5). Clay content and organic C accounted for 68.5% of the variation in soil BC(pH6.5-8.5)
(Table 6.4).
Table 6.4 Summary of the forward stepwise regression analysis for soil BC at different pH
ranges
Soil buffer capacity pH range
Variables in model Variance accounted for (%)
F
Soil BCpH<4.5 Extractable Al 69.00 114.64***
+ Clay 74.00 10.65**
Soil BCpH4.5-6.5 Extractable Al 75.2 225.73***
+ Clay 88.0 78.59***
+ pH (KCl) 89.9 14.67***
+ log Organic C 91.4 13.41***
+ log CBD-Fe 92.2 8.29**
Soil BCpH6.5-8.5 Clay 59.1 110.65***
+ log Organic C 68.5 3.61***
+ pH (H2O) 75.4 21.64***
+ log CBD-Mn 78.2 10.19**
+ log Ca 79.4 5.47*
Soil BCpH4.5-8.5 Extractable Al 80.1 299.43***
+ log Fe-CBD 88.4 53.07***
+ Clay 89.4 8.55** *P<0.05, **P<0.01 and ***P<0.001
Soil BC (pH4.5-8.5): In most soils, the general pH range of buffering by soil components is from
4.0 to 8.0 (Weaver et al., 2004). Clay content was the best related with soil BC(pH4.5-8.5), followed
by organic C, extractable Al, CBD-Al and CBD-Fe (Table 6.3). Bloom (2000) showed that some
soil components, such as soil organic matter, oxides and hydroxides of Fe and Al, allophone,
imogolite and silicate clay edges are effective in buffering over a wide range of pH values.

74
Organic matter is a very important component of pH buffering in surface soils, even in typical
upland soils that contain very little soil organic matter (Bloom, 2000). Carboxylic acids found in
soils appear to have a range of pKa values, and so contribute to buffering over the pH range from
2.0 to 7.0. The similar relationship between soil BC(pH4.5-8.5) and clay content (r = 0.74) and
between soil BC(4.5-8.5) and organic C (r = 0.69) was surprising. Previous studies showed that
organic matter may have a buffer capacity >300 times that of kaolinite clays (Bache, 1988; Aitken
et al., 1990).
Gibbsite, although not one of the primary soil properties related to soil BC(pH4.5-8.5), correlated
significantly with soil BC(pH4.5-8.5) (Table 6.3). Oxides and hydroxides that accumulate in soils
upon weathering are important mechanisms in the pH buffering of soils, particularly in highly
weathered soils (Uehara & Gillman, 1982). The most common Al hydroxide mineral in highly
weathered soils is gibbsite, [Al(OH)3] (Bloom, 2000).
Multiple regression shows (Table 6.4) that extractable Al accounted for 80.1% of the variation in
soil BC(pH4.5-8.5). Progressive addition of the variables Fe-CBD and clay content increased the
explained variation to 89.4%.
6.3.4 Interrelationships between soil properties contributing to soil BC
Principal component analysis (PCA) was used to examine the interrelationships between the
major soil properties contributing to soil BC(pH4.5-8.5). The first axis, score [1] (SC [1]), explained
50.35% of the variation in the entire dataset, and the second axis, score [2] (SC [2]), explained
29.54% of the remaining variation. Axis 3, score [3] (SC [3]), only explained 9.68%. Table 6.5
shows which soil properties contribute to which axis. Soil BC, pH (H2O), pH (KCl), extractable
acidity and Al, acid saturation, log Ca and Mg were the strongest correlated with SC [1] and to a
lesser extent correlated to SC [2] and SC [3], and will therefore contribute to SC [1] as indicated
in Figure 6.2 (a-c). Similarly clay, CEC, log CBD-Fe and CBD-Mn were the strongest correlated
with SC [2] and therefore will contribute to SC [2] (Figure 6.2 (a-c)).
The first axis (SC [1], x) was found to be positively related to buffer capacity, extractable acidity
and Al, and acid saturation, and negatively related to pH (H2O), pH (KCl), log Ca and Mg (Table
6.5). Axis 2 (SC [2], y), on the other hand, is positively related to mostly log C, clay, CEC, log
CBD-Al, log CBD-Fe, and log CBD-Mn. The third axis (SC [3], y) is positively related to quartz
and negatively related to kaolinite.

75
Table 6.5 Correlation matrix obtained from principal component analyses between the
variables and some scores
Variable Score 1 SC [1]
Score 2 SC [2]
Score 3 SC [3]
Soil buffer capacity 0.918 0.232 0.093
pH (H2O) -0.833 0.243 0.142
pH (KCl) -0.786 0.269 0.044
Extractable Al 0.940 -0.065 0.167
Extractable acidity 0.948 -0.076 0.186
Acid saturation 0.914 -0.299 0.108
Log Ca -0.733 0.527 -0.048
Log Mg -0.735 0.533 -0.071
Log C 0.398 0.608 0.199
Clay 0.416 0.758 -0.056
CEC 0.271 0.758 0.113
Log CBD-Al 0.511 0.636 -0.145
Log CBD-Fe 0.344 0.815 -0.255
Log CBD-Mn 0.076 0.699 -0.191
Quartz -0.407 0.003 0.772
Kaolinite 0.064 -0.359 -0.823
Figure 6.2 (a-c) shows a diagrammatic representation of the PCA to portray the interrelationship
of clay, organic C and extractable Al, with soil BC and other selected soil properties. In order to
ease interpretation of the plotted diagram, each variant (clay, organic C and extractable Al) was
ascribed to three classes, namely low, medium and high values as shown in Table 6.6.
Table 6.6 Low, medium and high class values for clay, organic C and extractable Al used in
the diagrammatic representation of PCA in Figure 6.2
Soil property Class
Low Medium High
Clay (%) < 20 20-40 > 40
Organic C (%) < 2 2-4 > 4
Extractable Al (cmolc kg-1) < 0.29 0.29-0.59 > 0.59

76
Figure 6.2 PCA evaluating the interrelationships between (a) clay content, (b) carbon
content, and (c) extractable Al with soil BC and other soil properties.
-6
-4
-2
0
2
4
6
-6 -4 -2 0 2 4 6
First PC scores (SC [1])
Seco
nd P
C s
core
s (S
C[2
])
Low Medium High
High Soil buffer capacity LowAcid saturation
Extractable acidityExtractable Al
Low Soil pH (H2O & KCl) HighMgCa
Low
C
lay
H
igh
CE
C
CB
D-F
e C
BD
-Mn
-6
-4
-2
0
2
4
6
-6 -4 -2 0 2 4 6First PC scores (SC [1])
Sec
ond
PC s
core
s (C
S [2
])
Low Medium High
High Soil buffer capacity LowAcid saturation Extractable Al
Extractable acidity
Low Soil pH (H2O & KCl) HighMgCa
Low
Cla
y
Hig
hC
EC
CB
D-F
e C
BD
-Mn
-6
-4
-2
0
2
4
6
-6 -4 -2 0 2 4 6First PC scores (SC [1])
Seco
nd P
C s
core
s (S
C [2
])
Low Medium High
Low
Cla
y
H
igh
CE
CC
BD
-Fe
CB
D-M
n
High Soil buffer capacity LowAcid saturation Extractable Al
Extractable acidity
Low Soil pH (H2O & KCl) HighMgCa
(c)
(b)
(a)

77
Clay content: Figure 6.2 (a) shows no clear patterns with clay classes and SC [1] components.
Clay content classes (low, medium and high) ranged from one extreme to the other (e.g. low soil
BC to high BC) on the first score axis (SC [1]). This shows that no clear distinction could be
made between clay content and first score components (e.g. soil BC, extractable acidity and Al),
indicating that high clay contents could be associated with either low or high soil BC. However, a
trend between clay classes and SC [2] components (e.g. log C, clay, CEC, log CBD-Al) was
found (Figure 6.2 (a)) showing that soils with a low clay content (<20%) were associated with low
CEC, CBD-Fe and CBD-Mn contents and soils with a high clay content (>40%) had high CEC,
CBD-Fe and CBD-Mn values.
Organic C: No clear patterns between low, medium and high organic C content and both of the
SC [1] and SC [2] components were observed in the studied soils (Figure 6.2 (b)).
Extractable Al: Figure 6.2 (c) shows that the low extractable Al class (<0.29 cmolc kg-1) is
associated with low soil BC, extractable acidity and acid saturation values, and high pH (H2O &
KCl), Ca and Mg values. As the extractable Al increased, shown by the class high in extractable
Al (>0.59 cmolc kg-1), the soil BC increased and the soil pH, Ca and Mg contents decreased.
This shows that no clear distinction could be made between extractable Al and SC [2]
components (Figure 6.2 (c)).
6.3.5 Relationship between dominant soil forms and selected soil properties
Figure 6.3 shows the interrelationship of dominant soil forms in the study area and selected soil
properties. Although no clear clusters were observed, trends with soil type and soil properties
were observed. It was found that Clovelly and Hutton soils tended to have lower soil BC,
extractable Al (or acidity) and acid saturation values, and higher pH (H2O & KCl), Ca and Mg
values. Magwa and Inanda soil forms had higher soil BC, higher extractable Al (or acidity) and
acid saturation values, and lower pH (H2O & KCl), Ca and Mg values.
Figure 6.3 further shows that Clovelly soils tended to have lower clay, CBD-Fe and CBD-Mn
contents, while Hutton soils tended to be higher in clay, CBD-Fe and CBD-Mn. No clear clusters
were evident from the SC [2] components in Figure 6.3 for Magwa and Inanda soils, with clay,
CBD-Fe and CBD-Mn contents extending from low to high values in the Magwa and Inanda soils.

78
-6
-4
-2
0
2
4
6
-6 -4 -2 0 2 4 6
First PC scores (SC [1])
Seco
nd P
C s
core
s (S
C [2
])
Clovelly Hutton Inanda Magwa
High Soil buffer capacity LowAcid saturation Extractable Al
Extractable acidity
Low Soil pH (H2O & KCl) HighMgCa
Hig
h
Cla
y
Low
CC
EC
CB
D-A
lC
BD
-Fe
CB
D-M
n
Figure 6.3 PCA evaluating the interrelationships between dominant soil forms, soil BC and
other selected soil properties
The PCA results indicate that, although the Hutton and Clovelly soil forms will have the initial
benefit of lower soil acidity levels and therefore a lower risk for agricultural crop production, the
long-term acidification risk will be higher than that of the Magwa and Inanda soils. This is due to
the lower soil BC associated with the Hutton and Clovelly soils, which means that smaller
amounts of lime amelioration will be needed in these soils than in the Magwa and Inanda soils to
maintain or reach a recommended soil acidity level.
6.4 CONCLUSIONS Typical soil BCs over the general pH range 4.5 to 8.5 varied from 0.12 to 2.23 cmolc kg-1 pH unit-1.
Composite titration curves for dominant soil forms exhibited a wide range of buffering to base
(OH-) addition. Inanda soils showed a tendency of good buffering, while Clovelly soils revealed
poor buffering. Maximum buffering for the experimental soils occurred at both pH <5.5 and >7.5,
with general poor buffering between pH 5.5 to 7.5. Principal component analysis furthermore
showed that Clovelly and Hutton soils tended to have lower soil BC, extractable acidity, Al and
acid saturation values, and higher pH, Ca and Mg contents. Magwa and Inanda soils had higher
soil BCs, extractable Al (acidity) and acid saturation, and lower pH, extractable Ca and Mg values.

79
It can be concluded that the more strongly buffered Magwa and Inanda soils would require more
lime to neutralize soil acidity as compared to the Clovelly and Hutton soils with lower soil BC.
The current knowledge of the soils in the study area indicates that there is considerable diversity
in the dominant soils. Poor crop growth on Magwa and Inanda soils could be expected due to
low pH and Al toxicity. It is a well-known fact that liming and adequate rates of fertilizer
application are the most effective management strategies to overcome acidity and soil fertility
constraints to crop production. Unfortunately, due to the high soil BC values of these soils, huge
amounts of lime would be necessary to alleviate soil acidity. However, the Hutton and Clovelly
soils will be more prone to soil acidification than the Magwa and Inanda soils due to the lower soil
BCs of the former.