Embed Size (px)
Citation preview
UNIVERSITY OF
COPENHAGEN
Master’s thesis
Lekka Eleni
Effect of some traditional processing methods on the
protein content of legumes from Ghana
FACULTY OF SCIENCE
DEPARTMENT OF FOOD SCIENCE
Academic supervisors:
Mette Holse (PhD)
Birthe Møller Jespersen (Associate professor)
COPENHAGEN
AUGUST, 2014


I
ACKNOWLEDGEMENTS
The completion of this project was done in the implementation of the Master’s program “Gastronomy and
Health”, which was co-funded by the Act “Scholarship program of the National Scholarship Foundation of
Greece IKY”, with the resources of the Operational Program “Education and Lifelong Learning” of the
European Social Fund (ESF) and the National Strategic Reference Freamework (NSRF) 2007 – 2013.
I would like to thank my supervisors, Mette Holse (PhD) and Assosciate Professor Birthe Møller Jespersen for
trusting me with this project. I strongly appreciate their guidance, advice and comments, as well as their positive
perspective through any adversities that came up during this project. Their valuable knowledge and friendly
attitude helped me finish the present project.
A special thanks to the trainee lab technician Trine Ann–Mirll Lilla Pedersen for her insightful
recommendations and her patience in providing all the technical support.
I would also like to thank Associate Professor Thomas Skov for his assistance during the result analysis, and
Associate Professor Dennis Sandris Nielsen for his for his guidance in developing and delivering the
fermentation process.
Last but not least, I would like to dedicate this project to my parents and brother in Greece, while expressing
my utter love and gratitude to them. Without their support, love and motivation I wouldn’t have made it so far.
II
ABSTRACT
Malnutrition is a major problem in developing countries. The diets of people lack animal protein
sources and consist mainly of starchy roots, cereals and a few legumes. The present trend in
population growth indicates that the protein gap may continue to expand, unless measures are taken.
Alternative sources of protein need to be found, and attention should be directed to plant proteins.
Legumes are a good source of protein, essential amino acids, polyunsaturated fatty acids, minerals
and calories. They also contain, however, anti-nutritional factors that are known to lower the
nutritional quality of legumes. Germination and fermentation are two traditional processing methods
that are believed to reduce the anti-nutritional factors and improve the nutritional composition of the
legumes overall.
In the present study the effect of germination and fermentation on the protein content of legumes
collected in Ghana was examined. Six different legumes, namely soybean, cowpea (two cultivars),
jack bean, velvet bean and bambara groundnut were subjected to germination for 48-72h at 30oC,
and fermentation at 30oC and 37
oC for 48h. The crude protein content of the raw and processed
legumes was determined. Furthermore, the overall composition was assessed using spectroscopic
methods (FT-IR, NIR).
All six legumes showed a notable increase in their crude protein content. The increase was, in most
cases, more pronounced in the fermented samples. Regarding the increase in protein content,
germination for 72h seemed to yield better results than for 48h; however, no conclusive evidence on
the superiority of one temperature over the other was found in the fermented samples. As far as the
overall composition is concerned, both FT-IR and NIR pointed out soybean as the most
differentiated samples with regards to protein, lipid and carbohydrate content.
III
LIST OF ABBREVIATIONS
ANF Anti-Nutritional Factor
CHO Carbohydrates
CVD Cardiovascular Disease
EEA Essential Amino Acids
FAO Food an Agriculture Organization
FR-IR Fourier- Transform infrared
IR Infrared
IVPD In vitro Protein Digestibility
MDGs Millenium Development Goals
MI Myocardial Infraction
NIR Near - infrared
PC Principal Component
PCA Principal Component Analysis
PUFA Polyunsaturated Fatty Acids
RS Resistant Starch
USDA U.S. Department of Agriculture
WHO World Health Organization
IV
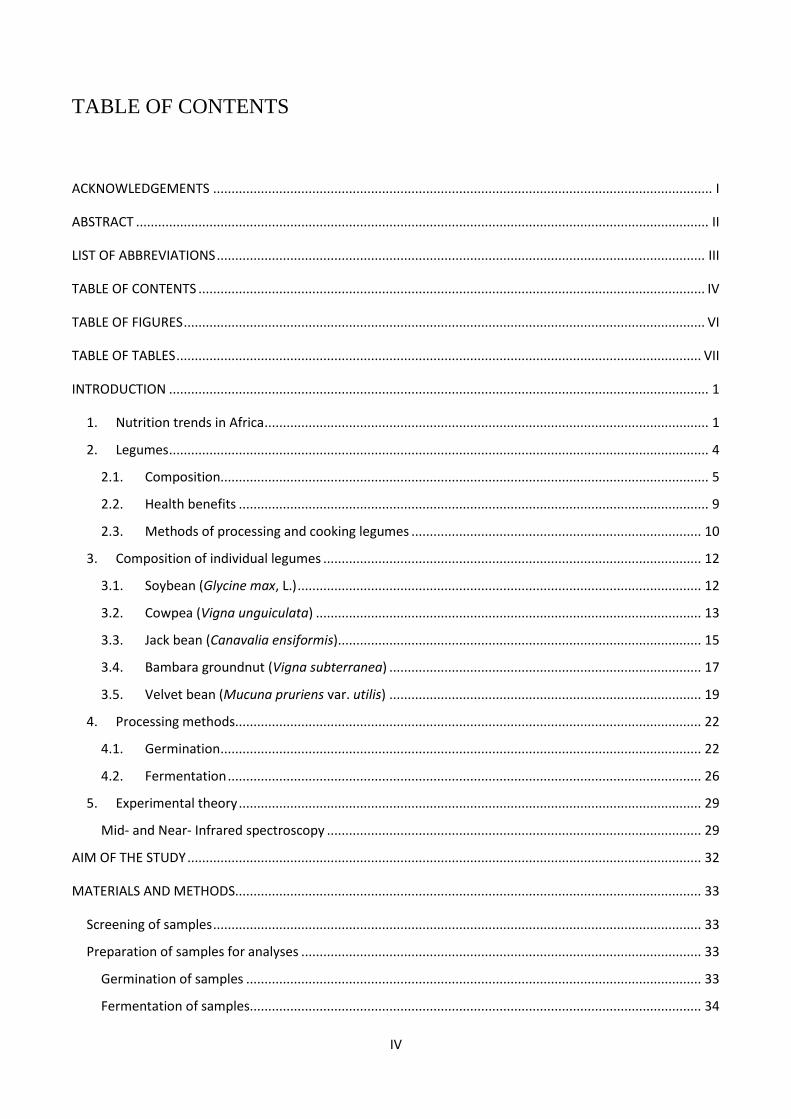
TABLE OF CONTENTS
Περιεχόμενα ACKNOWLEDGEMENTS ........................................................................................................................................ I
ABSTRACT ............................................................................................................................................................ II
LIST OF ABBREVIATIONS ..................................................................................................................................... III
TABLE OF CONTENTS .......................................................................................................................................... IV
TABLE OF FIGURES .............................................................................................................................................. VI
TABLE OF TABLES ............................................................................................................................................... VII
INTRODUCTION ................................................................................................................................................... 1
1. Nutrition trends in Africa ......................................................................................................................... 1
2. Legumes ................................................................................................................................................... 4
2.1. Composition..................................................................................................................................... 5
2.2. Health benefits ................................................................................................................................ 9
2.3. Methods of processing and cooking legumes ............................................................................... 10
3. Composition of individual legumes ....................................................................................................... 12
3.1. Soybean (Glycine max, L.) .............................................................................................................. 12
3.2. Cowpea (Vigna unguiculata) ......................................................................................................... 13
3.3. Jack bean (Canavalia ensiformis) ................................................................................................... 15
3.4. Bambara groundnut (Vigna subterranea) ..................................................................................... 17
3.5. Velvet bean (Mucuna pruriens var. utilis) ..................................................................................... 19
4. Processing methods............................................................................................................................... 22
4.1. Germination ................................................................................................................................... 22
4.2. Fermentation ................................................................................................................................. 26
5. Experimental theory .............................................................................................................................. 29
Mid- and Near- Infrared spectroscopy ...................................................................................................... 29
AIM OF THE STUDY ............................................................................................................................................ 32
MATERIALS AND METHODS............................................................................................................................... 33
Screening of samples ..................................................................................................................................... 33
Preparation of samples for analyses ............................................................................................................. 33
Germination of samples ............................................................................................................................ 33
Fermentation of samples........................................................................................................................... 34
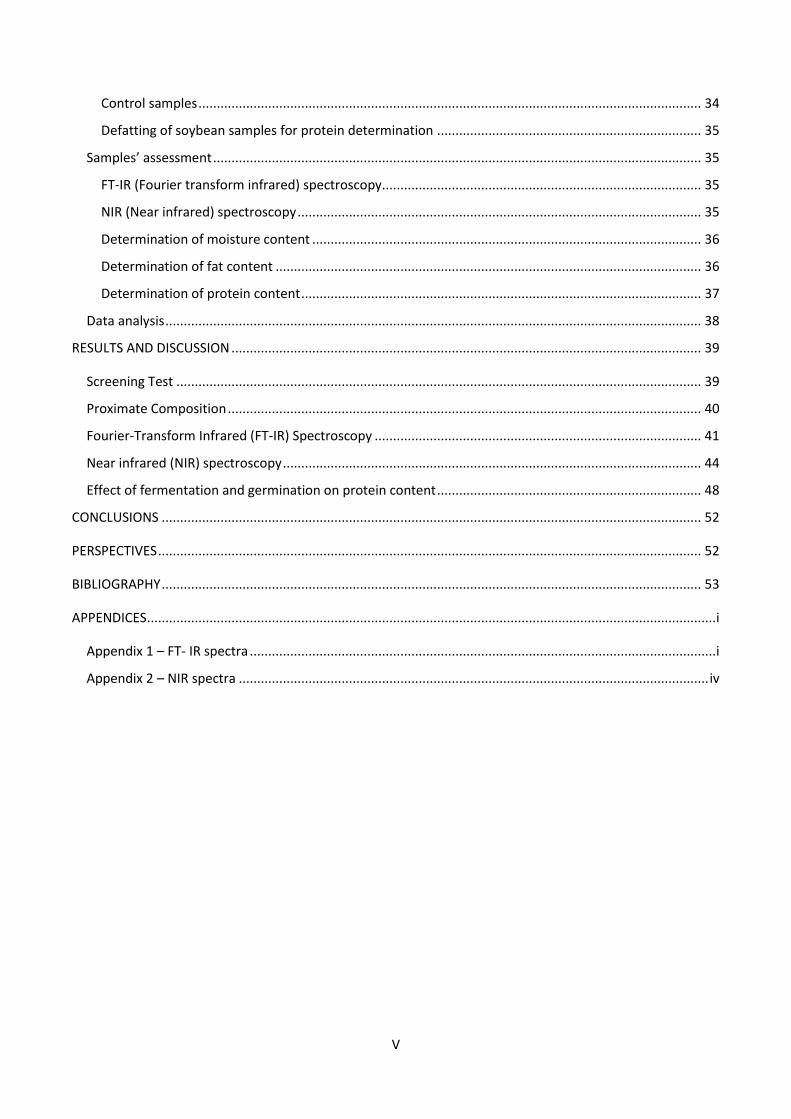
V
Control samples ......................................................................................................................................... 34
Defatting of soybean samples for protein determination ........................................................................ 35
Samples’ assessment ..................................................................................................................................... 35
FT-IR (Fourier transform infrared) spectroscopy ....................................................................................... 35
NIR (Near infrared) spectroscopy .............................................................................................................. 35
Determination of moisture content .......................................................................................................... 36
Determination of fat content .................................................................................................................... 36
Determination of protein content ............................................................................................................. 37
Data analysis .................................................................................................................................................. 38
RESULTS AND DISCUSSION ................................................................................................................................ 39
Screening Test ............................................................................................................................................... 39
Proximate Composition ................................................................................................................................. 40
Fourier-Transform Infrared (FT-IR) Spectroscopy ......................................................................................... 41
Near infrared (NIR) spectroscopy .................................................................................................................. 44
Effect of fermentation and germination on protein content ........................................................................ 48
CONCLUSIONS ................................................................................................................................................... 52
PERSPECTIVES .................................................................................................................................................... 52
BIBLIOGRAPHY ................................................................................................................................................... 53
APPENDICES ........................................................................................................................................................... i
Appendix 1 – FT- IR spectra ............................................................................................................................... i
Appendix 2 – NIR spectra ................................................................................................................................ iv
VI
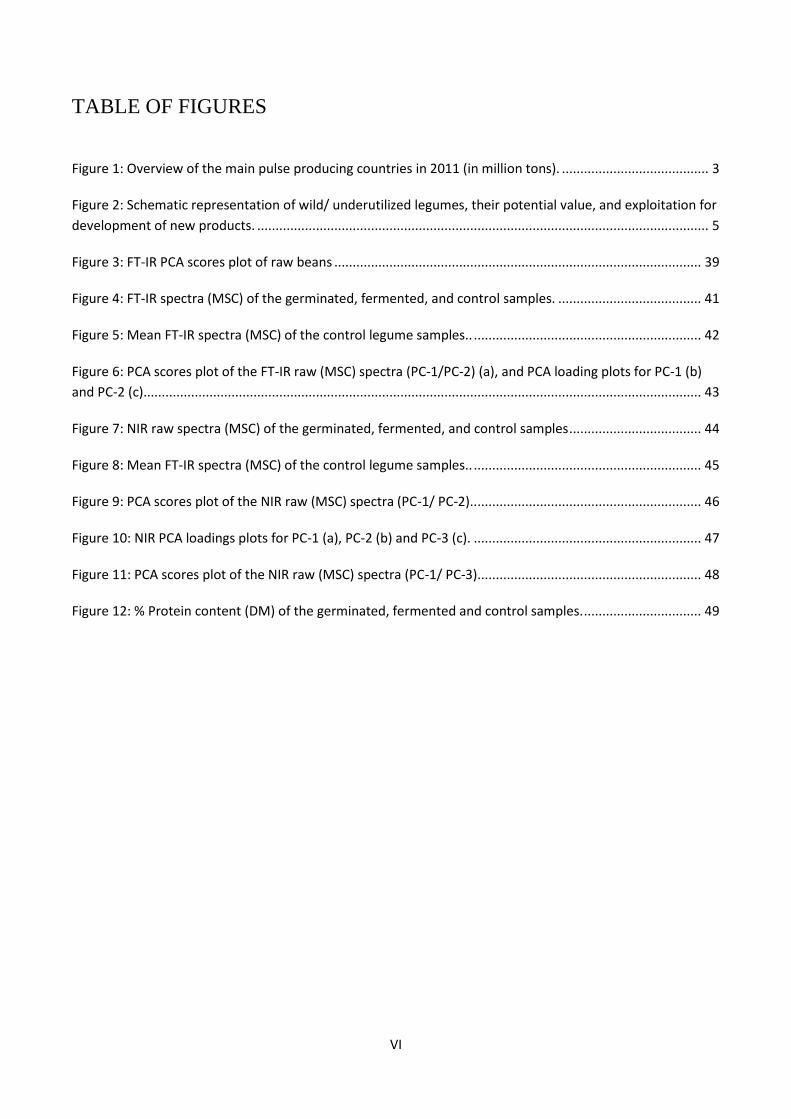
TABLE OF FIGURES
Figure 1: Overview of the main pulse producing countries in 2011 (in million tons). ........................................ 3
Figure 2: Schematic representation of wild/ underutilized legumes, their potential value, and exploitation for
development of new products. ........................................................................................................................... 5
Figure 3: FT-IR PCA scores plot of raw beans .................................................................................................... 39
Figure 4: FT-IR spectra (MSC) of the germinated, fermented, and control samples. ....................................... 41
Figure 5: Mean FT-IR spectra (MSC) of the control legume samples.. .............................................................. 42
Figure 6: PCA scores plot of the FT-IR raw (MSC) spectra (PC-1/PC-2) (a), and PCA loading plots for PC-1 (b)
and PC-2 (c)........................................................................................................................................................ 43
Figure 7: NIR raw spectra (MSC) of the germinated, fermented, and control samples .................................... 44
Figure 8: Mean FT-IR spectra (MSC) of the control legume samples.. .............................................................. 45
Figure 9: PCA scores plot of the NIR raw (MSC) spectra (PC-1/ PC-2).. ............................................................. 46
Figure 10: NIR PCA loadings plots for PC-1 (a), PC-2 (b) and PC-3 (c). .............................................................. 47
Figure 11: PCA scores plot of the NIR raw (MSC) spectra (PC-1/ PC-3).. ........................................................... 48
Figure 12: % Protein content (DM) of the germinated, fermented and control samples. ................................ 49
VII
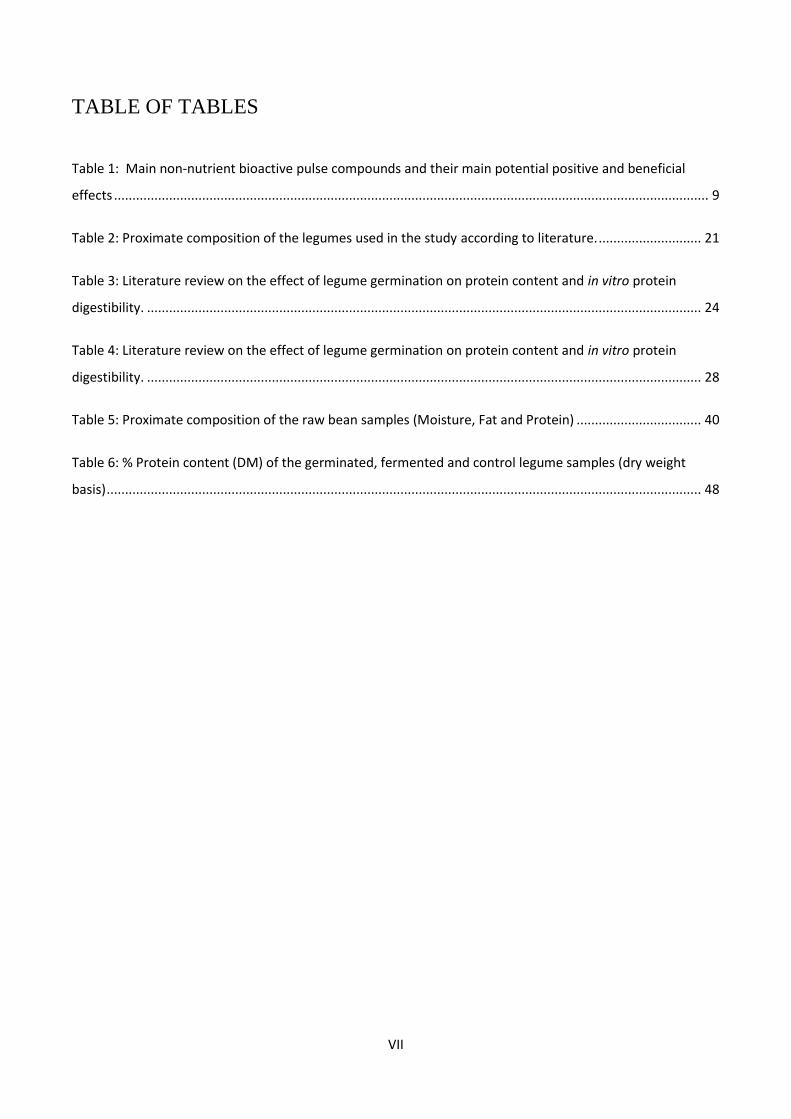
TABLE OF TABLES
Table 1: Main non-nutrient bioactive pulse compounds and their main potential positive and beneficial
effects .................................................................................................................................................................. 9
Table 2: Proximate composition of the legumes used in the study according to literature. ............................ 21
Table 3: Literature review on the effect of legume germination on protein content and in vitro protein
digestibility. ....................................................................................................................................................... 24
Table 4: Literature review on the effect of legume germination on protein content and in vitro protein
digestibility. ....................................................................................................................................................... 28
Table 5: Proximate composition of the raw bean samples (Moisture, Fat and Protein) .................................. 40
Table 6: % Protein content (DM) of the germinated, fermented and control legume samples (dry weight
basis) .................................................................................................................................................................. 48
1
INTRODUCTION
1. Nutrition trends in Africa
Over the past 20 years the number of undernourished persons in the developing world slowly
decreased from one billion in 1990-1992 to 842 million in 2011-13, which is a reduction of 200
million persons. Still, the reduction is too low, if the goal of 500 million undernourished by the year
2015 as envisaged by the Millennium Development Goals (MDGs) is to be achieved. The percentage
of undernourished persons in developing countries dropped from 23,6% in 1990-92 to 14,3% in
2011-13, which is a reduction of 10%. However, for the same time period in the African region, the
drop was from 32,8% in 1990-92 to 24,8% in 2011-13. So, according to the above results Africa
remains the region with the highest proportion of undernourished people compared to the other
developing countries, and this proportion also declined more slowly (FAO, 2014). Furthermore, in
West Africa, one third of children under five years of age are stunted, and 5-15% are wasted.
Micronutrient deficiencies, particularly lack of vitamin A, iron and iodine, affect mainly women and
children and contribute to some of the highest rates of child mortality in the world (Lopriore &
Muehlhoff, 2003).
However, undernourishment is not the only problem African people face. Within the past generation,
diets have changed, with increased energy and fat intake, but decreased fiber intake (Bourne et al.,
1993). Overweight and obesity are emerging problems in some urban populations, associated with
rising prevalence of the nutrition-related diseases (Lopriore & Muehlhoff, 2003). Thus, major
increases have been observed in obesity in women, hypertension and diabetes in both sexes and
cerebrovascular disease (Walker & Segal, 1997; Walker, 1996).
The causes of malnutrition and food insecurity are not a one-dimensional matter and they include the
agro-ecological, socio-economic and demographic characteristics of the region. Rising incomes,
continuous increase in population principally in urban areas, desertification, as well as HIV/AIDS
have an effect on the food system. Changes in diets and lifestyles, especially in urban areas, include a
shift from the consumption of traditional staples to imported cereals (wheat and rice). Although food
availability has generally improved in the region, the dietary energy and protein supplies are still
inadequate, eminently in Sahelian countries (Lopriore & Muehlhoff, 2003; Perumal Siddhuraju,
2
Vijayakumari, & Janardhanan, 1996). Apart from this, high prices of available staple foods, and
policies constricting food imports are also contributing factors that have been aggravating the food
situation in the developing countries (Weaver, 1994).
The diets of people in many developing countries lack animal sources of proteins, because they are
expensive and out of reach for low-income families, and instead consist mainly of starchy roots,
cereals and a few legumes (Obatolu, Augustine, & Iken, 2007). Honfoga & van den Boom (2003)
attribute the high prevalence of protein inadequacy in the coastal countries to the role of root crops in
the southern diets and their relative absence in those of the north. The lessening role of pulses and
animal products – both eminent sources of protein and micronutrients – indicates that the quality of
the diet in the region has decreased as a result of both deficient supplies and an uneven distribution
of the different groups of food. Furthermore, there are data indicating the growing dominance of
cereals as sources of dietary protein compared with legumes and animal products, particularly in the
coastal countries of West Africa. Cereals and tubers contribute 45% and 25% respectively of the
dietary protein in the coastal zone, whereas animal proteins (including meat, poultry, dairy products,
eggs, etc.) account only for 16% (Lopriore & Muehlhoff, 2003). Alexandratos (1995) points out that
many of the developing world‘s poorest producers and most undernourished households depend on
roots and tubers as a contributing, if not principal, source of food and nutrition. Also, in Nigeria,
cassava was found to be a major national food and cash crop, according to the statistics on cassava
production and consumption (Kolapo, 2011). Between 1990 and 2011, there was an increase in the
share of energy supply derived from cereals, roots and tubers in Central Africa, and East Africa.
Southern Africa experienced no growth, while North Africa and West Africa recorded a slight drop
(FAO, 2014).
Taking all the above into consideration, and counting in the present trend in population growth, it is
believed that the protein gap will continue to increase in the future unless well-planned measures are
taken. Since provision of adequate proteins of animal origin is difficult and expensive, plant proteins
could be a good alternative for improving the nutritional status of the people. Grain legumes are used
in combination with cereals, as they enhance the protein content of cereal-based diets and may
improve their nutritional status (Iqbal, Khalil, Ateeq, & Sayyar Khan, 2006). In Nigeria for example,
popular legumes, such as cowpeas, beans, and groundnuts, are commonly consumed with grains
(rice, maize) and tubers (cassava and yam) to complement their low protein content (Yusuf, Ayedun,
& Sanni, 2008). Legumes could also constitute an affordable and convenient supplement to
commonly used foods for weaning-age, since the nutritional value of complementary foods for
young children is a priority (Lopriore & Muehlhoff, 2003).
3
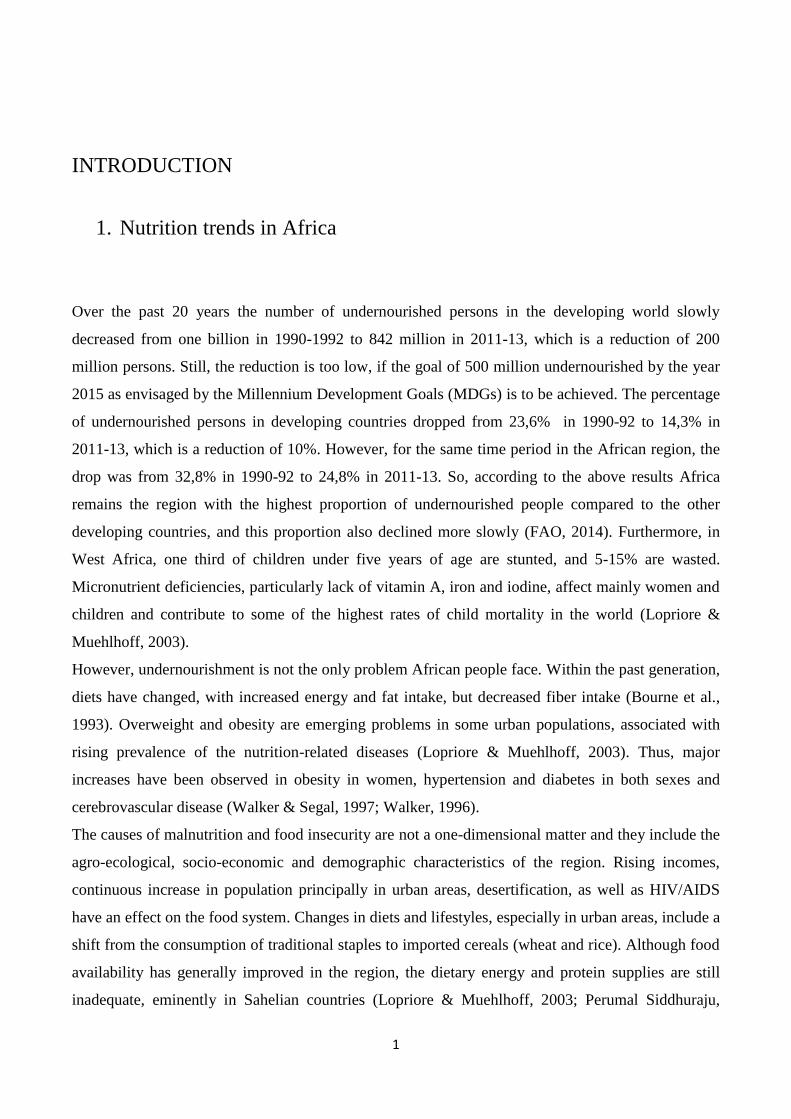
In 2010-2011 Africa was, in terms of volume, the second largest producer of pulses after Asia. In
general, pulse production in West Africa grew at an annual rate of 6,6% over the years 2000-2010
due to expansion of area (FAO, 2014). An overview of the main legume producing countries of
Africa can be seen on Figure 1.
Figure 1: Overview of the main pulse producing countries in 2011 (in million tons). (Lopriore & Muehlhoff, 2003)
4
2. Legumes
Legumes belong to the Leguminosae (or Fabaceae) family, which is the third largest family among
flowering plants, comprising of approximately 650 genera and 20.000 species (Doyle, 1994). All
members of the Leguminosae have the characteristic of bearing pods, but the plants range in size
from the tiny wild vetches of the temperate zones to large tropical trees. The family is divided into
three sub-families: Papilionoideae, Mimosoideae and Caesalpinioideae. Members of the
Papilionoideae are mainly herbaceous, often annual plants, which grow throughout the world, from
the tropics to high mountainous and cool regions. Most of the important legumes in human diets
belong to this sub-family, which amounts to about two-thirds of the Leguminosae species.
Mimosoideae consist of mainly small trees and shrubs of the semi-arid tropics and subtropical
regions, whereas Caesalpinioideae are mainly trees of tropical regions. Generally, the species of
these two sub-families are not cultivated for human consumption; yet the pods and seeds may be
gathered as food in some places of the world, as in the case of Parkia spp. (Caesalpinioideae).
(Aykroyd & Doughty, 1982)
Legumes cultivation history goes back to Neolithic times. They were among the earliest food crops
to be cultivated, when man was transitioning from hunting and food-gathering into the food-
producing stage of human development (Aykroyd & Doughty, 1982). Starchy legumes are known to
be consumed by humans since the earliest practice of agriculture, and medicinal, cultural, as well as
nutritional roles have been attributed to them (Phillips & McWatters, 1991). Legumes have
historically been part of inexpensive meals throughout the world, due to their important role in the
fight against malnutrition (Bamshaiye, Adegbola, & Bamishaiye, 2011)
According to the Food and Agriculture Organization (FAO) statistics for 2001, 274 million metric
tons of grain legumes were produced across the world, compared with 2 trillion metric tons of
cereals. 177 million of them were soybeans (Glycine max; one-half of which were produced in the
U.S.) (FAO, cited from Wang et al., 2003).
Legumes are an important element in the diet of both human and other animals and they constitute
the main protein source in some developing countries (Wang et al., 2003). Although many common
protein-rich edible legumes are available on the market, in many cases the production rate fails to
fulfill the ever-growing demand (Ali & Kumar, 2000). Furthermore, the swift, by a considerable part
of the world‘s population, to a protein-rich vegetarian-based diet has created and unjustified shortage
of plant resources. In this respect, legumes have been pointed out as a good alternative to animal
5
protein, which is at the same time cost effective (Famurewa & Raji, 2005). Taking the above into
consideration, it is crucial that governments, food scientists and nutritionists search for cheap,
reliable, and safe plant-based resources to meet the growing demand for protein-rich foods. Wild and
underutilized legumes, that are unexplored, underutilized or utilized only in specific regions, are a
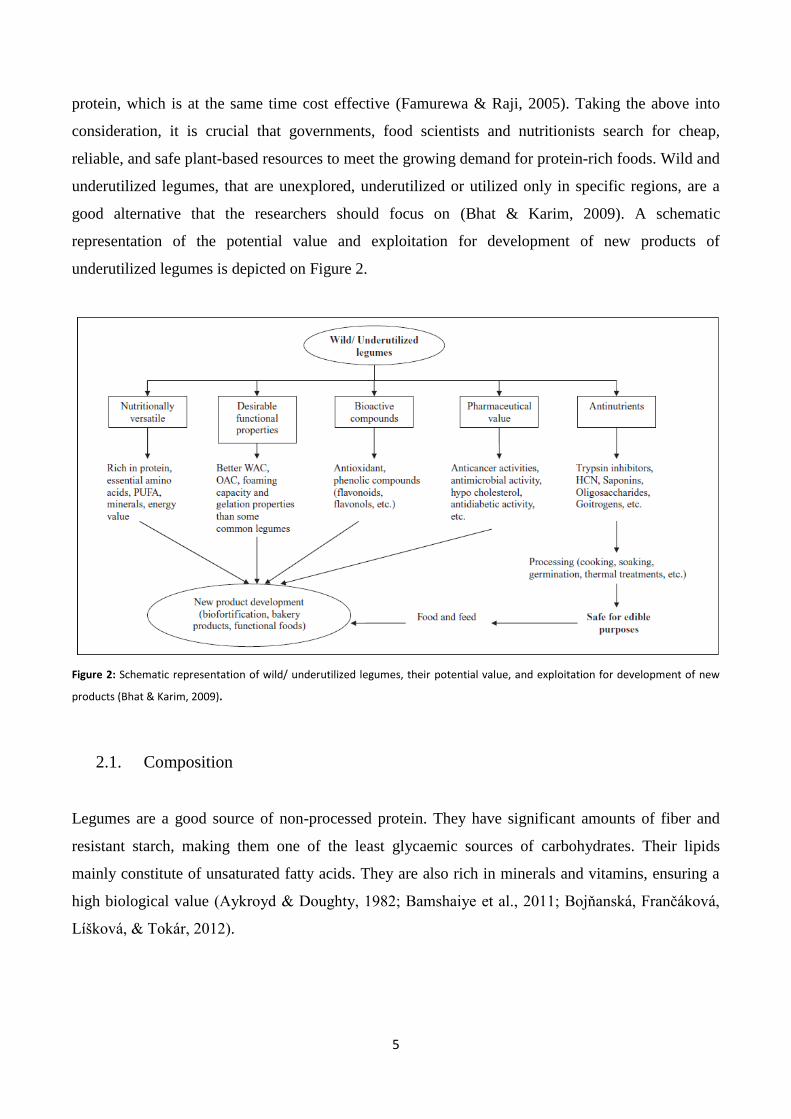
good alternative that the researchers should focus on (Bhat & Karim, 2009). A schematic
representation of the potential value and exploitation for development of new products of
underutilized legumes is depicted on Figure 2.
Figure 2: Schematic representation of wild/ underutilized legumes, their potential value, and exploitation for development of new
products (Bhat & Karim, 2009).
2.1. Composition
Legumes are a good source of non-processed protein. They have significant amounts of fiber and
resistant starch, making them one of the least glycaemic sources of carbohydrates. Their lipids
mainly constitute of unsaturated fatty acids. They are also rich in minerals and vitamins, ensuring a
high biological value (Aykroyd & Doughty, 1982; Bamshaiye et al., 2011; Bojňanská, Frančáková,
Líšková, & Tokár, 2012).
6
2.1.1. Carbohydrates – Dietary Fiber
Carbohydrates constitute the main fraction of legumes (50–60%, dry basis). The most predominant
components are starch (22–45%, dry basis) and non-starch polysaccharides dietary fiber. Legumes
also contain a small but significant amount of oligosaccharides, especially the rafinose family of
oligosaccharides (Utrilla-Coello, Osorio-Diaz, & Bello-Perez, 2007; Wang et al., 2003).
Starch is used as the main carbon reservoir in many grain legumes (e.g. pea), however a lack of
starch has been reported in some seeds, such as leguminous oilseeds or those containing gum (Wang
et al., 2003; Aykroyd & Doughty, 1982). There is much genetic variation for both the total seed
content and the composition of starch (Wang, Bogracheva, & Hedley, 1998). The starch granule is
composed of a mixture of amylose and amylopectin. Legume starch provides less energy than the
cereal one, due to its almost double amylose content and the properties of the granules. High amylose
content results in delayed starch gelatinization, thus affecting normal cooking properties (Aykroyd &
Doughty, 1982; Wang et al., 2003). Compared to other foods such as cereals, tubers and unripe
foods, raw and processed legumes contain significant amounts of ‗resistant starch‘ (RS) (Utrilla-
Coello et al., 2007) It is known that the formation of RS is at least partially dependent on the content
of amylose in the starch (Tharanathan & Mahadevamma, 2003). RS contributes to the total
unavailable carbohydrates that are considered to be important in fighting certain forms of cancer
(Aranda et al., 2001).
Legumes exhibit a higher sugar content compared to cereals. The major sugar in legumes is sucrose
and they also contain substantial amounts of oligosaccharides. Legumes also contain small quantities
of sucrose (Aykroyd & Doughty, 1982). The oligosaccharides, comprising part of the legumes‘
dietary fiber, are indigestible to the mammalian enzymes and their degradation occurs in the lower
bowel, where they are fermented by the gut microflora, producing flatus that causes discomfort in
humans and diarrhea in animals (Aykroyd & Doughty, 1982; Wang et al., 2003).
Legumes dietary fiber also includes a heterogenous mixture of several types of polysaccharides.
Hulls are typically composed mainly of cellulose, varying levels of hemicelluloses and lignin, which
serve as cell wall structure modifiers, whereas cotyledon fibers typically consist of nonstructural
polysaccharides such as hemicelluloses, pectins and gums. The physiological benefits of high fiber
intake are increased fecal bulk and moisture, reduced plasma cholesterol, and positive influence on
blood glucose and insulin concentration (Dalgetty & Baik, 2003; Sridhar & Seena, 2006;
Tharanathan & Mahadevamma, 2003).
7
2.1.2. Lipids
Most legumes contain only minor amounts of fat (less than 3%), of which oleic and linoleic acids are
the main unsaturated ones, and palmitic acid the saturated. Linoleic acid is an essential fatty acid for
human nutrition. In general, oils from temperate-zone legumes tend to have more unsaturated fatty
acids compared to those of the tropics. Moreover, some legume species contain a considerable
proportion of linolenic acid (Aykroyd & Doughty, 1982).
Of all edible oils, that from soybeans is the most important, with an estimated world production in
1980 of about 15 million metric tons (Aykroyd & Doughty, 1982).
2.1.3. Protein
Legumes are rich in proteins (18–25%). Even the ones with the lowest protein contents, like
Bambara groundnuts, chickpeas and Lima beans, have a protein content about three times higher
than rice (6,4%). Soya bean is unique in containing about 35–43% proteins (Aykroyd & Doughty,
1982; Tharanathan & Mahadevamma, 2003). Compared to meat, our main source of protein,
legumes are deficient in sulfur-containing amino acids (methionine, cystine and cysteine). However,
except for groundnut, they contain adequate amounts of lysine, thus being an appropriate
supplement to cereals, in which lysine is limiting (Aykroyd & Doughty, 1982; Farzana & Khalil,
1999; Phillips et al., 2003; Wang et al., 2003).
The protein of legumes can be classified into two groups: storage proteins and non-storage proteins.
Storage proteins constitute 70-80% of the total legume proteins and are present mainly in the protein
bodies. They are the primary components of the mature seeds and are mostly globulins. They are few
in number and have large molecular weights. Storage proteins are the ones hydrolyzed during
germination to provide nitrogen and carbon skeletons for the developing seedling. Non-storage
proteins are structural components (in membranes and cell walls) and functional components (e.g.
enzymes) of the cell. They account for the rest 20-30% of the legumes‘ protein content and, in
contrast to storage proteins, they are predominantly albumins and glutelins. Most legume protein
contains about 70% globulin, 10-20% albumin and 10-20% glutelin. Other proteins that may be
present in considerable amounts and may have an effect on the overall amino acid composition are
urease, hemagglutinins and trypsin inhibitors (Aykroyd & Doughty, 1982; Sridhar & Seena, 2006;
Wang et al., 2003).
8
2.1.4. Other nutrients
Legumes supplement cereals not only for protein but also for minerals and vitamins of the B
complex. This is of great importance when refined cereals such as milled rice or white wheat flour
are used in a poor diet with few supplementary foods (Aykroyd & Doughty, 1982).
As far as water-soluble vitamins are concerned, legumes have a thiamin content equal or slightly
higher than that of whole cereals (0.3-1.6 mg/ 100g). They contain low quantities of rivoflavin (0.1-
0.4 mg/ 100) and they have a lower content of pantothenic acid, compared to cereals. They are
however, a fairly good source of nicotinic acid (2mg/100g on average) and they have significant
amounts of folic acid, higher than that of most of the common foods. Furthermore, legumes as
consumed are almost devoid of ascorbic acid, with germinated seeds being an exception. Regarding
the fat-soluble vitamins, only vitamin A and vitamin E in legumes have received much attention.
Legumes contain only small amounts of carotenoids (provitamin A) (Aykroyd & Doughty, 1982;
Phillips et al., 2003).
Legume seeds have a potential of providing all 15 of the essential minerals required by man,
although their concentrations depend on both genetic and environmental factors (Grusak, 2002;
Wang et al., 2003). Legumes have a substantially higher calcium content than most cereals (typical
value 100mg/100g); yet, the absorption and utilization of their calcium may be compromised due to
the considerable amounts of phytic acid in legumes. Legumes are also moderately good sources of
iron (7 mg/100g on average) (Aykroyd & Doughty, 1982).
2.1.5. Anti-nutritional factors
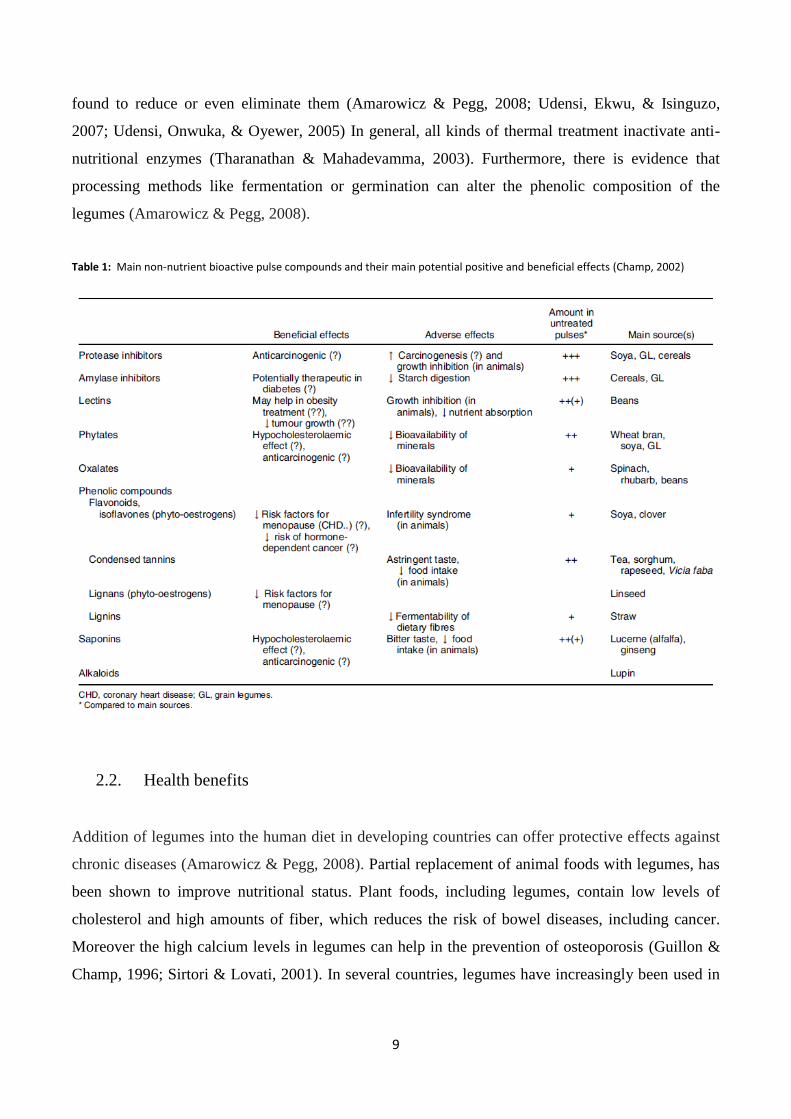
Legumes contain a number of bioactive substances (Table 1), which wield metabolic effects on
humans and animals consuming them. Upon regular consumption of pulses, these substances may
have positive, negative or both effects. Most of these bioactive substances have been labeled as ‗anti-
nutritional factors‘ (ANFs) (Champ, 2002). Some of the ANFs such a protease inhibitors, lectins,
tannins, goitrogens, cyanogens, amylase inhibitors and anti-vitamin factors are heat-labile; Whereas
others such as toxic ammo acids, alkaloids, cyanogenic glucosides, saponins, flavones and
isoflavones, and pyrimidine glucosides are heat-stable (Mohan & Janardhanan, 1995). In many cases,
the contents of ANFs in legumes may range depending on the variety and/ or cultivar, climatic
conditions, location, irrigation conditions, types of soil and year during which they are grown
(Fasoyiro, Ajibade, Omole, Adeniyan, & Farinde, 2006) .
The presence of ANFs can affect the protein digestibility of the pulses (Adebowale, Adeyemi, &
Oshodi, 2005). Nevertheless, processing methods such as soaking, boiling and autoclaving have been
9
found to reduce or even eliminate them (Amarowicz & Pegg, 2008; Udensi, Ekwu, & Isinguzo,
2007; Udensi, Onwuka, & Oyewer, 2005) In general, all kinds of thermal treatment inactivate anti-
nutritional enzymes (Tharanathan & Mahadevamma, 2003). Furthermore, there is evidence that
processing methods like fermentation or germination can alter the phenolic composition of the
legumes (Amarowicz & Pegg, 2008).
Table 1: Main non-nutrient bioactive pulse compounds and their main potential positive and beneficial effects (Champ, 2002)
2.2. Health benefits
Addition of legumes into the human diet in developing countries can offer protective effects against
chronic diseases (Amarowicz & Pegg, 2008). Partial replacement of animal foods with legumes, has
been shown to improve nutritional status. Plant foods, including legumes, contain low levels of
cholesterol and high amounts of fiber, which reduces the risk of bowel diseases, including cancer.
Moreover the high calcium levels in legumes can help in the prevention of osteoporosis (Guillon &
Champ, 1996; Sirtori & Lovati, 2001). In several countries, legumes have increasingly been used in
10
dietetic formulations for the prevention of diabetes mellitus, coronary diseases, colon cancer and to
lower blood cholesterol levels (Tharanathan & Mahadevamma, 2003; Utrilla-Coello et al., 2007).
Legumes may protect against cardiovascular disease (CVD) through various mechanisms.
Consumption of legume protein has been shown to reduce plasma low density lipoprotein
(Kabagambe, Baylin, Ruiz-Narvarez, Siles, & Campos, 2005; Phillips et al., 2003). Kabagambe et al.
(2005) found that consumption of one serving of beans per day resulted in a 38% reduction in the
risk of myocardial infarction (MI), independently of other dietary and non-dietary risk factors for MI.
Furthermore, pulses have a relatively low glycaemic index (about one-half that of white bread). Their
starch is digested more slowly than that of cereals and tubers, thus resulting in less abrupt
postprandial blood glucose and insulin response. For this reason, incorporation of legumes in the diet
of people with insulin-dependent diabetes (Type II) can be beneficial (Phillips et al., 2003; Wang et
al., 2003).
2.3. Methods of processing and cooking legumes
Legumes are usually consumed after processing. Appropriate processing of legumes is really
important, not only because it improves palatability of foods but also because it reduces the levels of
anti-nutrients and toxins and results in an increased bioavailability of nutrients (Aykroyd & Doughty,
1982; Tharanathan & Mahadevamma, 2003). The most common processing methods for legumes are
briefly described below.
Dehulling
Whole legumes with intact hulls need a long cooking time to reach a soft consistency. This is
especially true for legumes with tough seed-coats like bambara groundnuts and velvet beans.
Dehulling of the seeds and splitting the cotyledons to form a ‗dhal‘ reduces cooking time and
eliminates tannins that lower protein digestibility, while at the same time the total protein content and
amino acid composition stay almost intact (Aykroyd & Doughty, 1982; Bressani & Elfas, 1980).
Soaking
Soaking is a preliminary step, prior to cooking, common to almost all methods of preparing legumes.
It helps in the removal of the seed-coat, in moistening and softening the seed so as to shorten the
cooking time, and in reducing the legumes‘ toxin content (Aykroyd & Doughty, 1982; Tharanathan
& Mahadevamma, 2003).
11
Germination and Sprouting
Soaking legume seeds to start the process of germination (malting) is common practice in many parts
of the world and especially Asia, already from the ancient times. The seed- coat splits during the
germination process and is removed by washing. A short period of malting gives a more readily
digested product. The seeds may often be roasted and eaten as whole or ground and used in soups or
side dishes (Aykroyd & Doughty, 1982).
The germination process may be extended by spreading presoaked seeds on damp cloth for up to 48
hours, when the length of the sprouts reaches about 1 cm. The sprouted grains can be eaten raw (with
salt), parched or mixed with flavorings and fried or boiled. In India, China and many parts of Asia
longer sprouts are used raw or cooked as vegetables (Aykroyd & Doughty, 1982).
Cooking: Boiling and Steaming
Heat treatment of all kinds inactivates enzymes and enhances the flavor as well as the nutritional
value of legumes (Aykroyd & Doughty, 1982).
Roasting, parching, toasting and frying
Dry heat is used to cook whole legume seeds in many countries. They may be eaten whole as snacks
or pounded (Aykroyd & Doughty, 1982).
Fermentation
Fermentation is probably one of the oldest processing methods of legumes. The naturally-occurring
fermenting organism may be bacteria or fungi. It is particularly useful for hard beans (e.g. locust
beans and sword beans), for legumes with high toxin content (velvet beans) and for soybeans which
combine a high toxin level with an unpleasant flavor, because it overbears the disadvantage of
cooking time, reduces some toxic components such as flatulence-producing factors and leads to a
better digestible product. The process duration may range from a few hours to months or even years,
for some soy sauces (Aykroyd & Doughty, 1982).
12
3. Composition of individual legumes
3.1. Soybean (Glycine max, L.)
Soybean (Glycine max L.) is a leguminous plant of the family Leguminosae, that grows in tropical,
subtropical and temperate climates (Kolapo, 2011; Onwueme & Sinha, 1991). It is not known when
soybeans were first cultivated in China, but the legume is mentioned in a book dated back to 2800
B.C. (Aykroyd & Doughty, 1982). Today soybean is cultivated throughout East and South Asia,
Africa and America (Kolapo, 2011).
Soybean seeds contain an average amount of 36,5–41,0 % protein on a dry weight basis (Medic,
Atkinson, & Hurburgh, 2014; USDA, 2013). Storage proteins account for 65–80 % of the total
protein in the seed. The major legume storage proteins are the globulins legumin and vicilin, which
in soybeans are called glycinin and b-conglycinin, respectively. Soybean proteins are well-balanced
in the essential amino acids. They have a high lysine content, but they are slightly deficient in sulfur-
containing amino acids (methionine and cysteine) and threonine (Bau, Villaume, Nicolas, & Mejean,
1997; Medic et al., 2014)
Globally, soybean is one of the largest sources of vegetable seed oil (Kayembe & Van Rensburg,
2013. The seeds lipid content accounts for 8,1-24,0% (Medic et al., 2014). Soybeans are high in
polyunsaturated fatty acids (PUFA) (85% of the lipid fraction), and contain no cholesterol (Kolapo,
2011). The most abundant fatty acid is linoleic acid, followed by oleic, palmitic, linolenic, and
stearic acids (Medic et al., 2014).
Due to their high protein and lipid content, soybeans contain only moderate amounts of
carbohydrates (29,0-35,0%) (Atiim, 2011; Medic et al., 2014). Structural carbohydrates in soybeans
include cell-wall polysaccharides (cellulose, hemicellulose, and pectins), while non-structural
carbohydrates involve starch and different mono-, di-, and oligosaccharides. The most abundant
soluble sugars in soybeans are sucrose, raffinose and stachyose. In general, approximately half of the
total carbohydrates in soybean seeds are structural carbohydrates, and the other half are non-
structural (Medic et al., 2014).
Soybeans contain around 9,3% dietary fibers (USDA, 2013); they are very rich in hemicellulose and
cellulose, but exhibit low levels of lignin (Bau et al., 1997). Vitamins present in the seed include
thiamin, niacin, riboflavin, cholin, vitamins E and K (Kolapo, 2011), and ascorbic acid (Kayembe &
Van Rensburg, 2013). Soybeans are also a source of calcium, iron, zinc, copper and manganese (Bau
13
et al., 1997). The antinutritional factors in soybeans include α-galactosides, trypsin inhibitors, phytic
acid, lectins (haemagglutinins) and lipase inhibitors (Medic et al., 2014).
Consumption of soybeans has been linked with many beneficial effects. The proportion of potassium
to sodium (3:1-11:1) is believed to prevent high blood sugar level and help keeping blood sugar
levels under control in diabetic patients. Soy protein can also help diabetic patients in preventing
kidney diseases and improving the cholesterol profile. Furthermore, soybean isoflavones have been
associated with lower prevalence of coronary heart disease through controlling cholesterol, blood
pressure, vascular function and direct effects on the cells of the artery wall. They are also related to
reduction of bone loss that typically occurs after menopause, and can help women with low bone
mineral content prevent hip fractures in post menopausal years. Additionally, in areas of the world
with regular soybean consumption, lower rates of colon cancer, as well as some other cancers,
including breast cancer, are observed (Kolapo, 2011).
The nutrient composition of soybean has influenced its history, as far as food preparations are
concerned. The ancient Chinese evolved methods for food preparations – curd, cheese, sauce, paste –
which they used to flavor and enrich their staple diet of cereals. They also used the sprouts of the
seeds as a vegetable, while some evidence also exists that methods of expressing the oil were
evolved about the 4th
century A.D. (Aykroyd & Doughty, 1982). Soybeans have also been used
extensively in fermentation applications, including soy sauce, natto (whole soybean product), soy
pastes and fermented tofu (Hui, 2012). In Africa soybeans are used in many household preparations,
as they are considered an inexpensive source of dietary protein, mineral, and vitamin for both rural
and urban dwellers (Atiim, 2011). These preparations include dawadawa, soups, porridge, fortified
gari and tapioca and weaning food. Furthermore, soymilk and its derived products (soy-coconut milk
based yoghurt, soy-cow milk based yoghurt, soy-corn milk) are becoming more and more popular
due to the health benefits credited to soybeans (Atiim, 2011; Kolapo & Oladimeji, 2008; Kolapo &
Sanni, 2009; Kolapo, 2011). Last but not least, soybeans are also used for biodiesel production
(Salvagiotti et al., 2008)
3.2. Cowpea (Vigna unguiculata)
Cowpea (also known as black-eyed pea) is botanically called Vigna unguiculata sub-species
sesquipedalis. It belongs to the legume family Leguminosae and sub-family Papilionoideae (Mishili
et al., 2009; Udensi et al., 2007). The seeds vary in size, shape, color and texture. They may be erect,
14
crescent shaped or coiled. Usually they are yellow when ripe, but brown and purple color varieties
also exist (Gómez, 2004).
Cowpea is the second most important legume in Africa after groundnut (Arachis hypogaea) (Mishili
et al., 2009). It is one of the most ancient crops cultivated by man and it is probably a native of West
Africa, although today it is widely grown throughout the world (Aykroyd & Doughty, 1982; Gómez,
2004). Cowpeas are a low input crop and they are heat and drought tolerant (Nell, Siebrits, & Hayes,
1992).
The average crude protein content of cowpeas is 22,0 – 25,6% (Antova, Stoilova, & Ivanova, 2014;
Gómez, 2004), although higher contents have also been reported (Nell et al., 1992). The protein itself
is of good nutritional quality, consisting of 90% water-insoluble globulins and 10% water-soluble
albumins (National Research Counsil, 2006a). Cowpeas are rich in glutamic and aspartic acid, and a
good source of the essential amino acids (EAAs) leucine, arginine, methionine and phenylalanine,
whereas tryptophan is the limiting amino acid (Iqbal et al., 2006; Rangel et al., 2004) Cowpea
proteins contain adequate amounts of most EAAs for pre-school children and all EAAs for adults
(Rangel et al., 2004). According to Phillips et al. (2003) the protein digestibility of raw cowpea flour
is 57%.
The lipid content of cowpeas is relatively low (1,3 – 1,9%) (Antova et al., 2014); yet, contents up to
4,8% have been reported (Iqbal et al., 2006). No matter how low the lipid content might be, it has an
extremely high content of biologically active compounds (tocopherols, sterols, and phospholipids).
The predominant fatty acids in the seeds‘ oil are palmitic and linoleic acid, followed by linolenic and
oleic acid (Antova et al., 2014).
Carbohydrates are in the range of 56,0-66,0% (Gómez, 2004). The starch content in the seed is 28,3
– 36,2% (Antova et al., 2014), whereas the indigestible oligosaccharides, raffinose, stachyose, and
verbascose are also present (Phillips et al., 2003). The fiber and ash contents of cowpeas are 1,7 –
3,8% (Antova et al., 2014; Uppal & Bains, 2012) and 3,2 – 4,2% (Antova et al., 2014; Iqbal et al.,
2006), respectively. Cowpeas are a good source of phosphorous, calcium and iron (Gómez, 2004).
The main ANFs in cowpeas, phytate and trypsin inhibitors, can be minimized by processing
methods, like boiling, roasting and autoclaving (Udensi et al., 2007).
Cowpeas are often call the ―poor man‘s meat‖. They are used in food preparations at home, as well
as for production of street foods (Mishili et al., 2009). The seeds are consumed in grain, split and
ground forms. The ground form has traditionally been a favorite of rural households in Northern
Ghana, because cowpea flour is resistant to post-harvest pest damage, and as it can be used in many
different dishes (Gómez, 2004) In home preparations, cowpeas are often added to sauces and stews.
In the street food sector, cowpeas are commonly used in ―kosai‖ (cowpea fritters) in some inland
15
areas and ―akara‖ (popular West African finger food made from soaked, decorticated, wet-milled
cowpeas) in many coastal countries (Mishili et al., 2009). Other preparations with cowpea flour
include baking applications (muffins, cake-type buttermilk doughnuts, tortillas, tortilla and corn
chips), extruded snacks, weaning foods and fortified traditional foods (Phillips et al., 2003).
Furthermore, in industrialized countries such as the United States and Australia, varieties of cowpea
types are cooked, canned or frozen to make them ready to serve (Quinn, 1999).
3.3. Jack bean (Canavalia ensiformis)
The genus Canavalia (Fabaceae) consists of 4 subgenera with 51 reported species (Smartt, 1990).
Canavalia seeds are large and structurally similar, but vary in size, shape, color and thickness of the
seed coat (Sridhar & Seena, 2006). Generally, the plants belonging to this species display desirable
agronomic features enabling them to grow well in tropical conditions such as high cultivation
temperatures and drought, and they are resistant to pests and diseases (P Siddhuraju & Becker,
2001). They are used as manure, soil binders, as well as an ornamental plant (Bhat & Karim, 2009).
Canavalia ensiformis (Synonym: Dolichos ensiformis L.), commonly known as jack bean, is a New
World pulse that originated in South America and is grown in the tropics and subtropics (Smartt,
1990; Sridhar & Seena, 2006). It is cultivated in drought-prone areas of Arizona and Mexico and
used as high protein food and forage crop (in Southwestern United States, Mexico, Central American
countries, Brazil, Peru, Ecuador and West Indies). In Nigeria, it is used as an ornamental plant,
grown near houses and allowed to trail on walls and trees (Udedibie, 1990). Jack bean is considered
one of the few pulses that grow well on the highly nutrient-deficient lowland tropical soils, because it
can grow relatively easily and produce high yields in the regions of low altitude, and high
temperature and relative humidity (Vadivel & Janardhanan, 2001).
Jack bean has a protein content ranging from 22,8 to 35,3 % (Sridhar & Seena, 2006) It is rich in
aspartic acid, glutamic acid and histidine, and its level of the EAAs isoleucine, leucine and tyrosine
are higher compared to some common legumes; however, it is deficient in sulphur containing
aminoacids (V. Mohan & Janardhanan, 1994). Canavalia seeds exhibit low protein digestibility,
due to the large proportion of globulins and the ANFs and secondary metabolites present (Sridhar &
Seena, 2006). However Siddhuraju & Becker (2001) found a relatively high level (69,0%) of in vitro
protein digestibility (IVPD).
16
The lipid content of C. ensiformis varies between 1,6-12,1% (Bhat & Karim, 2009). PUFA of
Canavalia spp. (71.1–77.6%) surpass those of other common beans, with oleic acid being the major
one (38,6-47,4%) (P Siddhuraju & Becker, 2001). The seed are also rich in essential fatty acids
(linoleic and linolenic acid). The predominant fatty acids of C. ensiformis are palmitic acid, oleic
acid and linoleic acid (Arun, Sridhar, Raviraja, Schmidt, & Jung, 2003).
The crude carbohydrates account for 45,8-65.4% of the seed‘s weight (Bhat & Karim, 2009). They
include monosaccharides, oligosaccharides, starch and other polysaccharides. The oligosaccharides
(raffinose, stachyose and verbacose) are liable for flatulence and lower its acceptance as food. The
high energy content of C. ensiformis (1470-1910 kJ/100g) is attributed to the high starch and
amylose levels (Sridhar & Seena, 2006).
The fiber content of the seeds ranges from 4,7-11,4% (Sridhar & Seena, 2006). Nevertheless, in their
study Siddhuraju & Becker (2001) fount a dietary fiber content of 17,5-23,6%. Ash composition of
Canavalia spp. ranged between 2,3% and 5,8% (Bhat & Karim, 2009). As far as minerals are
concerned potassium was found to be the most abundant mineral (Vadivel & Janardhanan, 2001).
The seeds also contain profuse amounts of sodium, magnesium, phosphorus, and calcium (V. Mohan
& Janardhanan, 1994). In fact, Rajaram & Janardhanan (1992) reported the seeds of C. ensiformis to
be a potential source of minerals fulfilling 2/3 of the recommended dietary allowances by NRC/NAS
(1989).
Despite these desirable features, jack beans are not extensively utilized as a food source due to the
relatively high content of ANFs. Raw seeds of Canavalia spp. consist of ANFs such as phenolics,
tannins, saponins, cyanogenic glycosides, concanavalin A, canavanine and hydrogen cyanide. Most
of them are heat-labile. (Sridhar & Seena, 2006)
The immature pods and seeds of Canavalia ensiformis can be eaten as a green vegetable or even
used in the preparation of pickles. However, the use of mature seeds as food requires care in
preparation, to reduce the toxic compounds present in the seeds. They are normally boiled or
processed before being eaten. Processing includes overnight soaking of the beans in water followed
by boiling (with addition of sodium bicarbonate), washing, and pounding. Jack beans are used in the
preparation of various types of curry as well as a substitute for mashed potatoes in some Asian
countries, including India. Furthermore, roasted and ground beans have been reported to be used as a
substitute for coffee. In general, the overall appeal of these beans to the consumer is low and they are
unlikely to find extensive use as a pulse when alternatives are available. The main reasons for their
lack of popularity could be poor texture and flavor (Bhat & Karim, 2009; Smartt, 1990; Vadivel &
Janardhanan, 2001).
17
C. ensiformis is also interesting in terms of its pharmacological importance. Trigonelline and
canavanine extracted from C. ensiformis have exhibited anticancerous properties and were found to
be cytotoxic to human pancreatic cancer cells (Morris, 1999) Furthermore, the seeds have shown a
cholesterol-lowering effect in hypercholesterolaemic rats (Marfo, Wallace, Timpo, & Simpson,
1990). This could be related to the fact that the seed coats of C. ensiformis contain protein with
complete sequence homology to bovine insulin, which is recognized by human insulin antibodies
(Oliveira, Sales, Machado, Fernandes, & Xavier-Filho, 1999).
3.4. Bambara groundnut (Vigna subterranea)
Bambara groundnut belongs to the family of Fabaceae and sub family of Faboidea, and its botanical
name is Voandzeia subterranea (L.) thousars, synonym of Vigna subterranea (Bamshaiye et al.,
2011). Bambara groundnut is considered the third most important food legume in Africa after
groundnuts (Arachis hypogea) and cowpeas (Vigna unguiculata) (Hillocks, Bennett & Mponda,
2012). It is generally classified as bean, but its seeds are actually dug from the ground like peanuts.
They may be round or elliptical in shape with cream to red/brown color, mottled or black – eyed, and
they are defined by pretty local names such as dove eyes, nightjar, and butterfly. (Adebowale,
Schwarzenbolz, & Henle, 2011; National Research Counsil, 2006b; Ojimelukwe & Ayernor, 1992)
Bambara groundnut originated in West Africa but has become widely distributed throughout the
semi-arid zone of sub-Saharan Africa (SSA), with Nigeria being the major producing country.
Nowadays, it is also found in many parts of South America, Asia and Oceania, where it is cultivated
in a lower extend (Bamshaiye et al., 2011; Hillocks, Bennett & Mponda, 2012) It is considered a
‗famine culture‘ cop, because it tolerant to drought, resistant to pests and diseases and it has the
ability to grow in soils too poor to support the growth of other legumes (Bamshaiye et al., 2011;
Brough & Azam-Ali, 1992). Nevertheless, it is usually given less value and priority in land
allocation because it is primarily grown by women, and for that it is seen as a snack or food
supplement, rather than a fruitful cash crop (Bamshaiye et al., 2011).
The seeds of bambara make a complete food, as they contain sufficient quantities of protein,
carbohydrate and fat. Their protein content ranges from 16,0% to 22,0% (Brough & Azam-Ali,
1992), of which the total EAAs amount to an average of 32,7% (Minka & Bruneteau, 2000).
According to Minka & Bruneteau (2000), lysine is the most predominant EAA with average value of
10,3%, but the nuts also contain appreciable amounts of leucine, phenylalanine, histidine and valine.
18
An unusually high content of methionine, compared to other legumes was also reported
(Murevanhema & Jideani, 2013).
The lipid content of bambara seeds accounts for 6,0 – 9,7% (Adebowale et al., 2011; Yusuf et al.,
2008) The PUFA linoleic (44%) and linolenic (21%) and the saturated palmitic acid (30%) were the
most predominant fatty acids while stearic acid was present in small quantities (Minka & Bruneteau,
2000).
V. subterranea consists of 42,0 – 61,3 % carbohydrates and 2,3 – 3,3% fiber (Brough & Azam-Ali,
1992; Fasoyiro et al., 2006; Yusuf et al., 2008) Sugar analysis showed that 30% of the neutral sugars
were present and identified essentially as glucose and galactose (Minka & Bruneteau, 2000). It also
contains 4,0 – 4,4% ash and around 2% minerals (Fasoyiro et al., 2006; Murevanhema & Jideani,
2013). This legume is a good source of calcium, potassium, magnesium, phosphorus and iron
(Amarteifio, Tibe, & Njogu, 2006) Red seeds contain almost twice as much iron as the cream seeds,
and their consumption could be useful in areas where iron deficiency is a problem (Bamshaiye et al.,
2011). Bambara groundnut has also been reported to contain low levels of trypsin inhibitor and
phenolic compounds (Bamshaiye et al., 2011).
Bambara seeds are consumed in various forms either immature or fully mature (Bamshaiye et al.,
2011). Immature bambara groundnuts may be consumed fresh or grilled, whereas the ripe seeds
demand extended periods of soaking and boiling to render them edible (Brough & Azam-Ali, 1992)
The seed coats are usually removed to reduce the ANFs and fiber content, resulting in better
appearance, texture, cooking quality, palatability and digestibility of the products (Bamshaiye et al.,
2011). The bambara seeds can be just boiled and eaten with salt or fried like peanuts. In many
African countries this legume is used in the preparation of numerous traditional recipes, including
cakes, balls, relishes and sauces. Roasted, pulverized seeds of bambara can be incorporated into
soups. The flour can also be used to make a stiff kind of porridge, called ―Aboboi‖. Many times
bambara based foods are accompanied by cassava or corn preparations. Furthermore, bambara flour
could be a potential alternative for the fortification of traditional weaning foods in Africa. Other
applications, involve bambara groundnut milk (a modified version of extraction of cowpea milk) and
fermented products (Bamshaiye et al., 2011; Brough & Azam-Ali, 1992; Hillocks, Bennett &
Mponda, 2012). Last but not least, some tribes in Congo reportedly roast and pound the seeds for oil
extraction, in spite of their relatively low oil content (Bamshaiye et al., 2011).
Additionally, bambara groundnuts have long been used as an animal feed (Bamshaiye et al., 2011),
while in some African countries the bambara plant has been attributed medicinal properties. It has
been used to treat diarrhea, water from boiling the leaves serves as a pesticide and insecticide and the
19
leaves themselves have been employed to cauterize and heal the animals‘ wounds (Bamshaiye et al.,
2011).
3.5. Velvet bean (Mucuna pruriens var. utilis)
Mucuna pruriens - commonly known as velvet bean or devil bean - belongs to the family
Papilionoideae of the order Leguminosae. The genus Mucuna includes about 150 species of annual
and perennial legumes. There is a great taxonomic confusion about the varietal difference of M.
pruriens, but it is now accepted that there are two varieties namely, M. pruriens var. utilis and M.
pruriens var. pruriens (Agbede & Aletor, 2005; Bhat & Karim, 2009; Pugalenthi, Vadivel, &
Siddhuraju, 2005). Different accessions of M. pruriens vary in color from black to white (V. R.
Mohan & Janardhanan, 1995). Initially, it was Mucuna cochinchinensis that was cultivated in parts
of Southern Nigeria and Senegal, and after this, it is believed that it was spread to other tropical
countries, in Southern and Southeastern Asian regions, along with other known accessions and
subspecies (Bhat & Karim, 2009) Mucuna pruriens var. utilis possesses good nutritional qualities,
exhibits tolerance to adverse environmental conditions such as drought, low soil fertility, and high
soil acidity and it is used as food, forage and cover (Pugalenthi et al., 2005; Vadivel & Janardhanan,
2000).
Velvet bean has a crude protein content of 25,1 - 29,3%, although lower and higher values have also
been reported (Ahenkora, Dadzie, & Osei-Bonsu, 1999; Vadivel & Janardhanan, 2000). That means
that its protein content is higher compared to some commonly consumed legumes like chick pea
(Cicer arietinum), green pea (Pisum sativum) and common bean (Phaseolus vulgaris), but lower than
that of soybean (Glycine max) (Mugendi & Njagi, 2010). The major bulk of the seed proteins
comprises of the globulin fraction, followed by albumin, glutelin and prolamin (Vadivel &
Janardhanan, 2000). The results about the amino-acid profile of Mucuna pruriens var. utilis are
contradicting. In general it is found that the seeds are defcient in sulphur-containing aminoacids
(Ezeagu & Gowda, 2006; Pugalenthi et al., 2005; Vadivel & Janardhanan, 2000); yet, Mohan &
Janardhanan (1995) found that the black coat seeds have high levels of cystein. Furthermore, lysine
was found to be a limiting amino acid in black color seeds (V. R. Mohan & Janardhanan, 1995;
Vadivel & Janardhanan, 2000). In general, velvet beans contain high amounts of the EAAs
isoleucine, tyrosine and phenylalanine, and they meet the recommended FAO/WHO (1990)
reference requirements for 2-5yr old, except for methionine and tryptophan (Mohan & Janardhanan,
20
1995). As far as IVPD is concerned, generally, it ranges between 72% and 77% (Bhat & Karim,
2009; Vadivel & Janardhanan, 2000).
The crude lipid content falls within the range of 4,1 – 7,4%, which is slightly higher than that of most
other legumes (Ahenkora et al., 1999; Vadivel & Janardhanan, 2000). Mucuna beans were found to
contain high concentrations of oleic acid, linoleic acid, palmitic acid and steric acid (Mohan &
Janardhanan, 1995; Pugalenthi et al., 2005).The anti-nutritional fatty acid, behenic acid was also
detected in the Mucuna seeds (Mohan & Janardhanan, 1995).
The carbohydrate content of velvet beans ranges from 49,9 to 61,2 % (Vadivel & Janardhanan,
2000). The soluble sugars account for 9,2% to 10,5% of the seed‘s weight, whereas average values of
total, digestible, and RS of the Mucuna seeds are 27,8%, 17,6%, and 10,1%, respectively (Pugalenthi
et al., 2005). The digestibility of the legume‘s starch is affected by the cell-wall structural features as
well as ANFs present in the seed (Siddhuraju & Becker, 2005). It appears that velvet beans have a
high range of carbohydrate, due to the low fat content, which brings their energy range to 1562-1606
kJ/100g DM (Pugalenthi et al., 2005; Vadivel & Janardhanan, 2000).
Crude fiber comprises of cellulose and hemicellulose, a heterogeneous group in which pentosans
usually predominate over lignin, pectic, and cutin substances. In M.utilis the crude fiber content
varies between 5,3 and 11,5% (Pugalenthi et al., 2005). Ash content in velvet beans accounts for 3,1
– 5,5% (Ahenkora et al., 1999; Vadivel & Janardhanan, 2000). Phosphorus (Ahenkora et al., 1999)
and potassium (Pugalenthi et al., 2005) are the predominant minerals. Velvet beans are also good
sources of calcium, iron, manganese, zinc and copper, and they contain low amounts of sodium
(Mohan & Janardhanan, 1995; Pugalenthi et al., 2005; Vadivel & Janardhanan, 2000).
The seeds of M. utilis also contain many ANFs such as total free phenolics, tannins, L-Dopa, lectins,
protease inhibitors, phytic acid, flatulence factors, saponins, and hydrogen cyanide that can have
adverse effects in monogastric animals (including human) upon regular consumption over a long
period of time (Agbede & Aletor, 2005; Pugalenthi et al., 2005). The average L-Dopa content in
mucuna bean is 3,1 – 6,7% (Mugendi & Njagi, 2010). Increased serum levels of L-Dopa from
consumption of velvet beans leads to high concentration of dopamine in peripheral tissues, inducing
antiphysiological effects such as nausea, vomiting, anorexia, paranoid delusions, hallucinations,
delirium and unmasking dementia (Josephine & Janardhanan, 1992). Nevertheless, L-Dopa,
extracted from the seeds of M. utilis is used in the treatment of Parkinson‘s disease (Pugalenthi et al.,
2005).
Velvet bean seeds are used as food, feed, and for pharmaceutical applications (Bhat & Karim, 2009).
The beans have been traditionally used as a food in a number of countries in Africa, Southeast Asia
and Latin America (Pugalenthi et al., 2005). The immature pods and leaves are used as vegetables,
21
while the seeds are consumed boiled or roasted (V. R. Mohan & Janardhanan, 1995; Vadivel &
Janardhanan, 2000). The beans can be eaten either as such or in combination with cereals. Mucuna
beans are used in various preparations, such as sauces, stews, soups, porridge and fried cakes. Velvet
beans are also used in ‗tempeh‘ (a fermented food) production, roasted and consumed as snacks or as
coffee substitute after grinding (Bhat & Karim, 2009; Pugalenthi et al., 2005). Symptoms such as
dizziness, weakness, vomiting and diarrhea have been reported either immediately or few hours after
eating Mucuna (Pugalenthi et al., 2005).
The seed has high viscosity starch, which can be used as a thickening agent for food products, or as
an adhesive in the paper and textile industries (Vadivel & Janardhanan, 2000). Some groups of
people in Nigeria utilize it as a dye. The bean is also used in indigenous ayurvedic medicine (Prakash
& Tewari, 1999). The leaves of Mucuna are used as blood tonic, whereas the seeds have been widely
used against snakebites and scorpion stings, as a uterine stimulant, aphrodisiac and strong emetic.
They are also used to treat nervous disorders and arthritis (Pugalenthi et al., 2005; Vadivel &
Janardhanan, 2000).
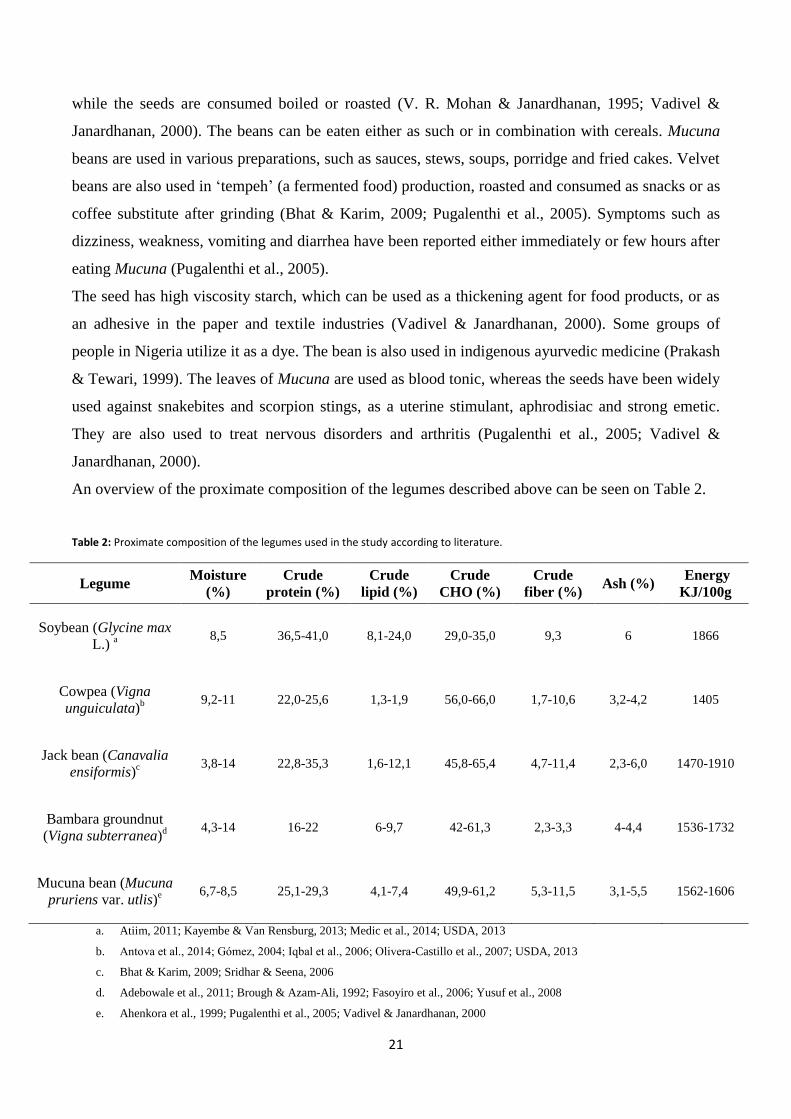
An overview of the proximate composition of the legumes described above can be seen on Table 2.
Table 2: Proximate composition of the legumes used in the study according to literature.
Legume Moisture
(%)
Crude
protein (%)
Crude
lipid (%)
Crude
CHO (%)
Crude
fiber (%) Ash (%)
Energy
KJ/100g
Soybean (Glycine max
L.) a 8,5 36,5-41,0 8,1-24,0 29,0-35,0 9,3 6 1866
Cowpea (Vigna
unguiculata)b 9,2-11 22,0-25,6 1,3-1,9 56,0-66,0 1,7-10,6 3,2-4,2 1405
Jack bean (Canavalia
ensiformis)c 3,8-14 22,8-35,3 1,6-12,1 45,8-65,4 4,7-11,4 2,3-6,0 1470-1910
Bambara groundnut
(Vigna subterranea)d 4,3-14 16-22 6-9,7 42-61,3 2,3-3,3 4-4,4 1536-1732
Mucuna bean (Mucuna
pruriens var. utlis)e 6,7-8,5 25,1-29,3 4,1-7,4 49,9-61,2 5,3-11,5 3,1-5,5 1562-1606
a. Atiim, 2011; Kayembe & Van Rensburg, 2013; Medic et al., 2014; USDA, 2013
b. Antova et al., 2014; Gómez, 2004; Iqbal et al., 2006; Olivera-Castillo et al., 2007; USDA, 2013
c. Bhat & Karim, 2009; Sridhar & Seena, 2006
d. Adebowale et al., 2011; Brough & Azam-Ali, 1992; Fasoyiro et al., 2006; Yusuf et al., 2008
e. Ahenkora et al., 1999; Pugalenthi et al., 2005; Vadivel & Janardhanan, 2000
22
4. Processing methods
The nutritive value of a protein depends on its composition, digestibility and bioavailability of
essential amino acids. The nutritive value of grain legumes depends primarily on their nutrient
contents, and presence or absence of anti-nutritional and ⁄ or toxic factors. With the aim of improving
the nutritive value of legumes, preparation techniques, including soaking, germination,
decortications, fermentation and cooking, have been developed to significantly raise the
bioavailability of nutrients (Ramakrishna, Jhansi Rani, & Ramakrishna Rao, 2008; Uppal & Bains,
2012).
In this chapter the effects of germination and fermentation on the composition and especially on the
protein content of legume seeds is briefly presented.
4.1. Germination
The process of germination has been a common practice in many parts of the world for centuries,
especially in Asian countries. Germination seems to be a simple, inexpensive, yet effective
processing method, bringing about desirable changes in nutritional quality. At present, there is an
increase in the consumption of germinated legumes worldwide, in order to enhance the acceptability
and nutrient content of the diets. Sprouts have been traditionally used in culinary preparations, but
nowadays there is a wider selection of seedlings available for consumer. Furthermore, germinated
legume seeds are used to produce flours of high nutritional value (Kuo, Rozan, Lambein, Frias, &
Vidal-Valverde, 2004; Tharanathan & Mahadevamma, 2003; Uppal & Bains, 2012).
It is known that during germination a sequence of metabolic changes results in the degradation of the
reserve materials in the seeds, partly for respiration and partly for synthesis of new cell constituents
of the developing embryo (Sangronis, Rodríguez, Cava, & Torres, 2005; Vidal-Valverde et al.,
2002). In other words, germination is a complex metabolic process during which the lipids,
carbohydrates, and storage proteins within the seed are broken down, due to increased enzymatic
activity, in order to provide the energy and amino acids necessary for the plant‘s development
(Tharanathan & Mahadevamma, 2003; Uppal & Bains, 2012; G Urbano et al., 2005). Therefore,
important changes in the biochemical, nutritional and sensory characteristics of the seeds can be
observed (Kuo et al., 2004; Vidal-Valverde et al., 2002). Germination improves the palatability,
23
digestibility and availability of certain nutrients (Uppal & Bains, 2012). Furthermore, Yamada et al.,
(2005) proposed germination as a process to reduce allergenicity in rice seeds due to the activation
of endogenous proteases. Nevertheless, some of the changes in the compositional and functional
properties in germinated legumes might be undesirable (Phillips et al., 2003).
During germination complex metabolic processes take place, which may alter the content and
composition of proteins and amino acids in legumes improving their nutritional value. The extensive
breakdown of seed-storage proteins can improve the protein digestibility and amino acid content
(Gulewicz et al., 2008; Martínez-Villaluenga, Gulewicz, Frias, Gulewicz, & Vidal-Valverde, 2007;
G Urbano et al., 2005; Gloria Urbano et al., 2005). A high content of free amino acids can be found
in germinated seeds, due to high amino acid biosynthetic activity in the seedling (Kuo et al., 2004;
Mugendi & Njagi, 2010). As sprouting proceeds, the ratio of essential to non essential amino acids
changes, providing more EAAs (Uppal & Bains, 2012). Additional advantages associated with
germination involve the degradation of some undesirable proteins included in the albumin fraction,
such as lypoxigenase, trypsin inhibitors, lectins and urease, which can interfere in the nutritional
quality of legumes (Martínez-Villaluenga et al., 2007). However, the presence of some potentially
toxic non-protein amino acids has been reported in commercially available seedlings (Kuo et al.,
2004).
Fat and carbohydrates are also broken down during germination (Kuo et al., 2004). Germination is
known to reduce the oligosaccharide content of the seeds (Phillips et al., 2003), while higher levels
of maltose are also present in sprouted seeds (Uppal & Bains, 2012). As a result germinated seeds
have improved carbohydrate and starch digestibility (Ghavidel & Prakash, 2007; Sangronis et al.,
2005). Upon germination, dietary fiber increases. Vitamins, minerals, and secondary compounds,
many of which act as antioxidants, also change dramatically during this process (Kuo et al., 2004).
Elevated levels of vitamin E (Torres, Frias, Granito, & Vidal-Valverde, 2007), vitamin C
(Tharanathan & Mahadevamma, 2003), thiamin, niacin and riboflavin (Phillips et al., 2003;
Tharanathan & Mahadevamma, 2003), iron, calcium and magnesium (Ghavidel & Prakash, 2007;
Sangronis et al., 2005), have been reported in germinated seeds. Sprouting has been found to
increase the antioxidant capacity, as well (Torres et al., 2007).
Much evidence exists on the role of germination in diminishing ANF levels that are present in raw
legume seeds. Germination results in reduction in phytates and tannins (Uppal & Bains, 2012). The
amount of other antinutrient factors, such as the flatulence-producing α-galactosides, trypsin and
chymotrypsin inhibitors, which affect the digestion of proteins, is also minimized after germination
(Kuo et al., 2004; Torres et al., 2007).
24
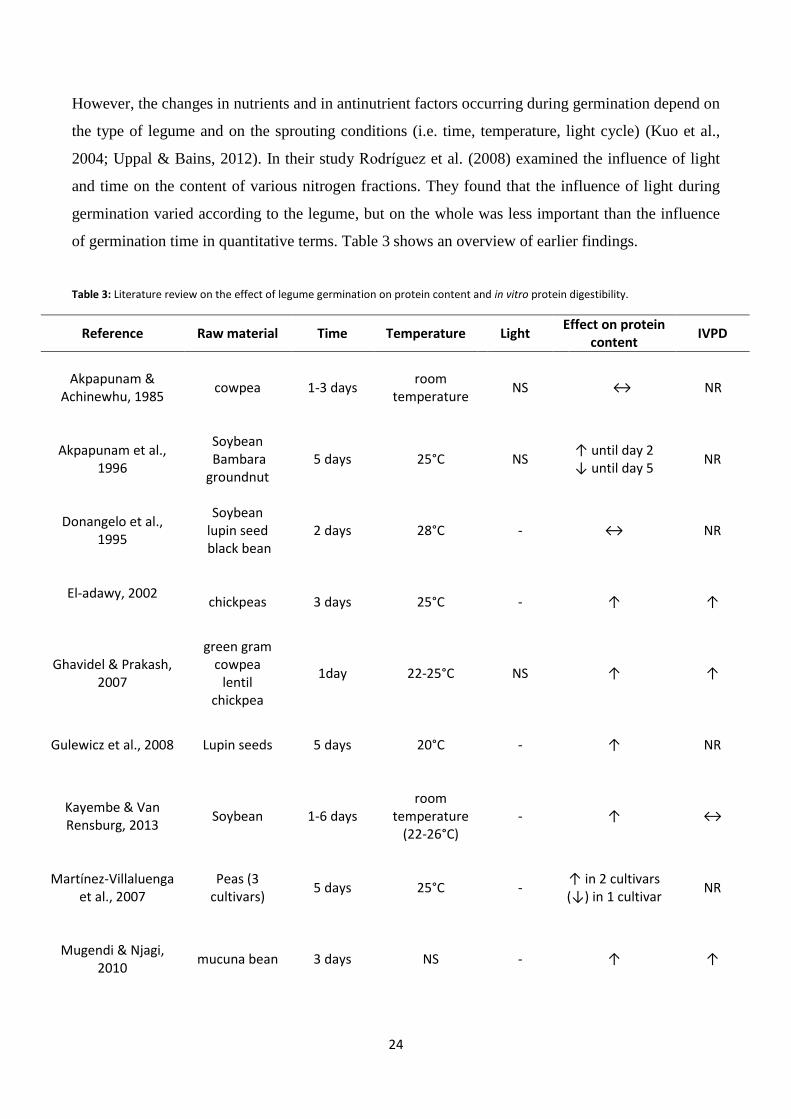
However, the changes in nutrients and in antinutrient factors occurring during germination depend on
the type of legume and on the sprouting conditions (i.e. time, temperature, light cycle) (Kuo et al.,
2004; Uppal & Bains, 2012). In their study Rodríguez et al. (2008) examined the influence of light
and time on the content of various nitrogen fractions. They found that the influence of light during
germination varied according to the legume, but on the whole was less important than the influence
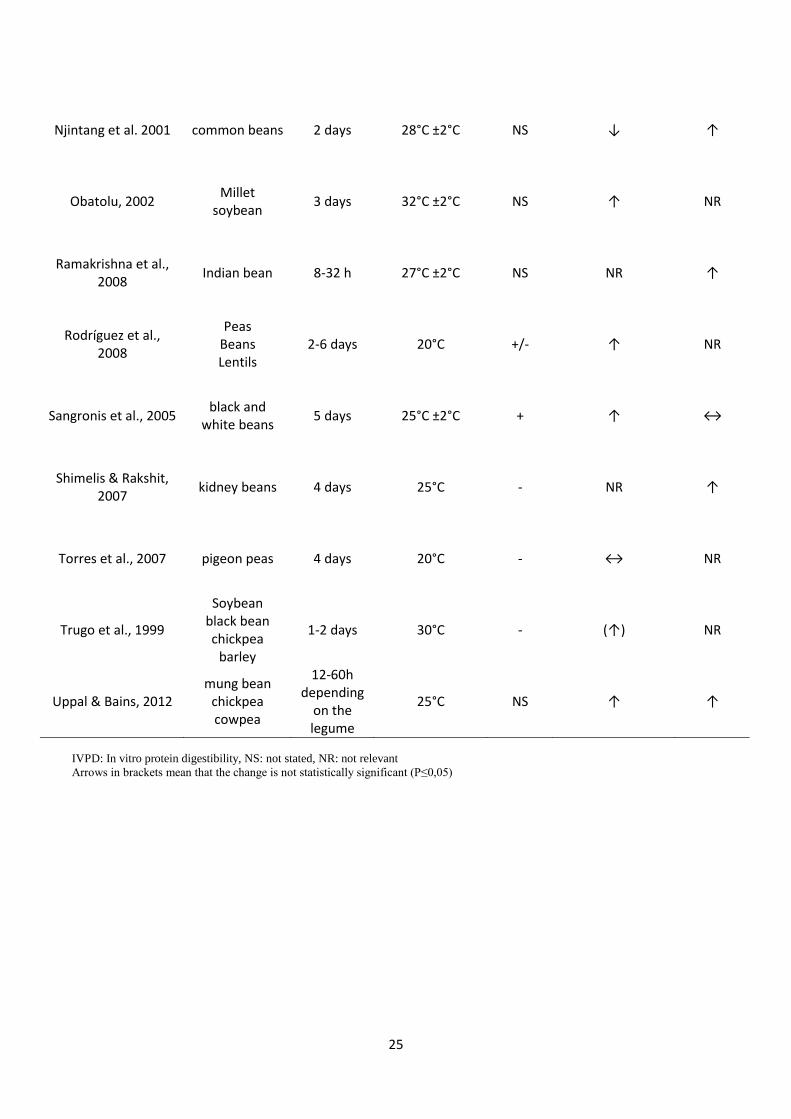
of germination time in quantitative terms. Table 3 shows an overview of earlier findings.
Table 3: Literature review on the effect of legume germination on protein content and in vitro protein digestibility.
Reference Raw material Time Temperature Light Effect on protein
content IVPD
Akpapunam & Achinewhu, 1985
cowpea 1-3 days room
temperature NS ↔ NR
Akpapunam et al., 1996
Soybean Bambara groundnut
5 days 25°C NS ↑ until day 2 ↓ until day 5
NR
Donangelo et al., 1995
Soybean lupin seed black bean
2 days 28°C - ↔ NR
El-adawy, 2002
chickpeas 3 days 25°C - ↑ ↑
Ghavidel & Prakash, 2007
green gram cowpea
lentil chickpea
1day 22-25°C NS ↑ ↑
Gulewicz et al., 2008 Lupin seeds 5 days 20°C - ↑ NR
Kayembe & Van Rensburg, 2013
Soybean 1-6 days room
temperature (22-26°C)
- ↑ ↔
Martínez-Villaluenga et al., 2007
Peas (3 cultivars)
5 days 25°C - ↑ in 2 cultivars (↓) in 1 cultivar
NR
Mugendi & Njagi, 2010
mucuna bean 3 days NS - ↑ ↑
25
Njintang et al. 2001 common beans 2 days 28°C ±2°C NS ↓ ↑
Obatolu, 2002 Millet
soybean 3 days 32°C ±2°C NS ↑ NR
Ramakrishna et al., 2008
Indian bean 8-32 h 27°C ±2°C NS NR ↑
Rodríguez et al., 2008
Peas Beans Lentils
2-6 days 20°C +/- ↑ NR
Sangronis et al., 2005 black and
white beans 5 days 25°C ±2°C + ↑ ↔
Shimelis & Rakshit, 2007
kidney beans 4 days 25°C - NR ↑
Torres et al., 2007 pigeon peas 4 days 20°C - ↔ NR
Trugo et al., 1999
Soybean black bean chickpea
barley
1-2 days 30°C - (↑) NR
Uppal & Bains, 2012 mung bean
chickpea cowpea
12-60h depending
on the legume
25°C NS ↑ ↑
IVPD: In vitro protein digestibility, NS: not stated, NR: not relevant
Arrows in brackets mean that the change is not statistically significant (P≤0,05)
26
4.2. Fermentation
Fermented food products constitute a very interesting group of foods that not only can be produced
with inexpensive ingredients and simple techniques, but also make a significant contribution to
human diet (Hui, 2012). Food fermentation has been for centuries a popular method to preserve
perishable food products (Hansen, 2004). The availability and acceptability of fermented foods differ
among different cultures (Hui, 2012). The raw materials traditionally used for fermentation are
diverse and include fruits and vegetables, cereals, honey, milk, meat, and fish. Fermented products
cover a variety of products including wine, beer, vinegar, bread, soy sauce, sauerkraut, kimchi,
pickled olives, different fermented milk products, a large number of cheeses, and a variety of
sausages (Hansen, 2004).
The microorganisms participating in food fermentation include bacteria, yeasts, and fungi (molds).
As such, there are four main types of food fermentation based on the key microorganisms
responsible: bacterial fermentation, yeast fermentation, fungal fermentation, and mixed culture
fermentation. The majority fermented foods, especially the traditional or indigenous ones, are
produced using mixed cultures of bacteria, yeasts, or fungi. (Liu, 2012)
Regardless of the microorganism involved, fermentation can also be categorized according to the
starting culture used. Fermentations can basically be performed either by spontaneous fermentation,
by back-slopping, or by addition of starter cultures (Josephsen & Jespersen, 2004). The natural
fermentation is the one performed with endogenous microflora. However, this kind of fermentation
may result to fermentation failures, due to the presence of undesirable microorganisms (Granito &
Alvarez, 2006). In back-slopping, a part of a previous batch of a fermented product is used to
inoculate the new batch. This procedure brings about a higher initial number of beneficial
microorganisms than usually found in raw material and ensures a faster and more reliable
fermentation (Josephsen & Jespersen, 2004). Spontaneous fermentation can be optimized through
back-slopping, resulting in dominance of the best adapted strains (Granito & Alvarez, 2006).
Addition of starter cultures is usually used when inactivation of the indigenous flora by heat
treatment of the raw material is possible, permitting the growth of only the added starter
microorganisms (Josephsen & Jespersen, 2004).
The process of food fermentation can also be assorted into alcoholic, acidic, and alkaline fermen-
tations based on the main products formed or pH changes (Liu, 2012). Alkaline-fermentation is the
fermentation process during which the pH of the substrate increases to alkaline values which may be
as high as pH 9 (Omafuvbe, Shonukan, & Abiose, 2000). The increase in pH is a result of
27
degradation of proteins from the raw material into peptides, amino acids and ammonia (Kiers, Van
Laeken, Rombouts, & Nout, 2000; Parkouda et al., 2009). Changes in pH, titratable acidity, and
viscosity of the fermented product depend on the species or combination of species involved in the
process (Phillips et al., 2003).
Apart from preservation (the main role of fermentation), it also results in enhancement of sensory
characteristics (flavor, texture, or color), and transformation of nutrients (improvement of
digestibility and biofortification), while it is also known to reduce ANFs (Barampama & Simard,
1995; Liu, 2012; Phillips et al., 2003; Smit, Wouters, & Meijer, 2004).
During fermentation, microorganisms oxidize carbohydrates and related compounds in order to
produce energy (Josephsen & Jespersen, 2004). As a result, α-galactooligosaccharides (raffinose,
stachyose and verbascose) contents, soluble fiber and resistant starch, the main flatulence-producing
factors in legumes, are reduced (Granito & Alvarez, 2006). Another major metabolic activity during
fermentation is proteolysis. Bacteria degrade the legume proteins and utilize the released amino
acids. This results to decreased protein content, increased in vitro digestibility and formation of
ammonia (Allagheny, Obanu, Campbell-Platt, & Owens, 1996; M. Granito, Torres, Frias, Guerra, &
Vidal-Valverde, 2005). Furthermore, fermentation seems to enhance the nutritive value of legumes
by decreasing the level of antinutrients in the foods. There is evidence on the reduction of some
antinutritional endogenous compounds such as phytic acid and α-galactosides, but the effect of
fermentation on trypsin inhibitor activity (TIA) and tannin content is still controversial (Granito et
al., 2005).
With regards to sensory qualities flavor, one of the attributes mostly affected by fermentation, is
highly correlated to the degradation of nutrients. Food substrates (carbohydrates, proteins, lipids,
organic acids, amino acids, phenolic compounds, glycosides, etc.) are transformed into nonvolatile
and volatile flavor compounds that affect not only taste but also aroma, and thus, food acceptance.
Particularly, the enzymatic degradation of proteins results in the formation of key-flavor
components, while lipolysis leads to the formation of free fatty acids, which can be precursors of
flavor compounds such as methylketones, alcohols, and lactones. The flavor compounds produced
during fermentation contribute to a range of sensory tastes and aromas such as sweetness (e.g.,
mannitol), sourness (e.g., lactic acid), umami (e.g., L-glutamic acid), bitterness (e.g., hydrophobic
peptides), fruitiness (esters), and sulfurous notes (volatile sulfur compounds). The concentration of
these components and the food matrices in which they are produced affect their overall desirability
or undesirability (Liu, 2012; Smit et al., 2004).
Table 4 shows an overview on what has been done so far on legume fermentation.
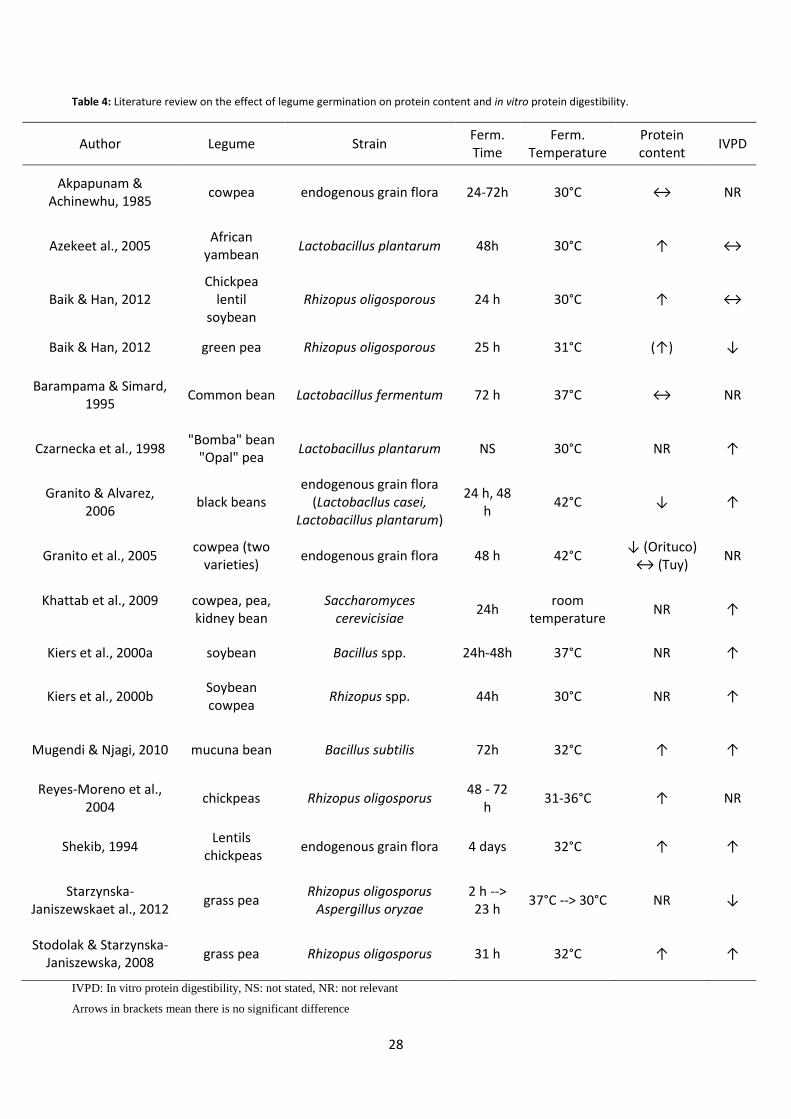
28
Table 4: Literature review on the effect of legume germination on protein content and in vitro protein digestibility.
Author Legume Strain Ferm. Time
Ferm. Temperature
Protein content
IVPD
Akpapunam & Achinewhu, 1985
cowpea endogenous grain flora 24-72h 30°C ↔ NR
Azekeet al., 2005 African
yambean Lactobacillus plantarum 48h 30°C ↑ ↔
Baik & Han, 2012 Chickpea
lentil soybean
Rhizopus oligosporous 24 h 30°C ↑ ↔
Baik & Han, 2012 green pea Rhizopus oligosporous 25 h 31°C (↑) ↓
Barampama & Simard, 1995
Common bean Lactobacillus fermentum 72 h 37°C ↔ NR
Czarnecka et al., 1998 "Bomba" bean
"Opal" pea Lactobacillus plantarum NS 30°C NR ↑
Granito & Alvarez, 2006
black beans endogenous grain flora
(Lactobacllus casei, Lactobacillus plantarum)
24 h, 48 h
42°C ↓ ↑
Granito et al., 2005 cowpea (two
varieties) endogenous grain flora 48 h 42°C
↓ (Orituco) ↔ (Tuy)
NR
Khattab et al., 2009
cowpea, pea, kidney bean
Saccharomyces cerevicisiae
24h room
temperature NR ↑
Kiers et al., 2000a soybean Bacillus spp. 24h-48h 37°C NR ↑
Kiers et al., 2000b Soybean cowpea
Rhizopus spp. 44h 30°C NR ↑
Mugendi & Njagi, 2010 mucuna bean Bacillus subtilis 72h 32°C ↑ ↑
Reyes-Moreno et al., 2004
chickpeas Rhizopus oligosporus 48 - 72
h 31-36°C ↑ NR
Shekib, 1994 Lentils
chickpeas endogenous grain flora 4 days 32°C ↑ ↑
Starzynska-Janiszewskaet al., 2012
grass pea Rhizopus oligosporus
Aspergillus oryzae 2 h --> 23 h
37°C --> 30°C NR ↓
Stodolak & Starzynska-Janiszewska, 2008
grass pea Rhizopus oligosporus 31 h 32°C ↑ ↑
IVPD: In vitro protein digestibility, NS: not stated, NR: not relevant
Arrows in brackets mean there is no significant difference
29
5. Experimental theory
Mid- and Near- Infrared spectroscopy
Almost any organic or inorganic compound possessing covalent bonds absorbs various frequencies
of electromagnetic radiation in the infrared region of the electromagnetic spectrum. As with other
types of energy absorption, when molecules absorb infrared radiation, they are excited to a higher
energy state. A molecule absorbs only certain frequencies (energies) of infrared radiation, which
correspond to the natural vibration frequencies of the molecule in question. The energy absorbed
results in an increase in the amplitude of the vibrational motions of the bonds in the molecule.
Symmetric bonds, such as H2 or Cl2, do not absorb infrared radiation. In order for energy to be
transferred a bond must present an electrical dipole that is changing at the same frequency as the
incoming radiation. So, only those bonds that have a dipole moment that changes as a function of
time have the ability to absorb infrared radiation (Pavia, Lampman, & Kriz, 2001).
The simplest types of vibrational motion in a molecule that are infrared active are the stretching and
bending modes. Those are the so-called fundamental absorptions (V) and they result from excitation
from the ground state to the lowest-energy excited state. In general, asymmetric stretching vibrations
occur at higher frequencies than bending vibrations. Usually the spectrum is complicated because
weak overtone, combination, and difference bands are also present. Overtones occur when the energy
status of the molecule is raised beyond the first higher (fundamental) level to the second or third, or
higher energy levels, which are integral multiples of the frequency of the fundamental, to produce
the first, second, and higher overtones respectively. In polyatomic molecules, two or more
vibrational modes can interact in such a way as to cause simultaneous energy changes and give rise
to a vibration of a new frequency within the molecule, which is the sum of multiples of each
interacting frequency. When such a vibration is infrared active, it is called a combination band (V̅comb
= V̅1 + V̅2). Difference bands are similar to combination bands, only the observed frequency in this
case results from the difference between the two interacting bands (V̅diff = V̅1 - V̅2). (Batten, 1998;
Blanco & Villarroya, 2002; Pavia et al., 2001)
The fundamental absorptions are the most intense absorption of energy and they occur at the mid-
infrared (IR) region of the spectrum, with wavelengths ranging between 2500–25000 nm (4000 –
400 cm−1
in wavenumbers). The highest wavenumber associated to an infrared active fundamental
vibration appears at 3998 cm−1
for HF; therefore 4000 cm−1
can be somehow considered the border
of the infrared and the near-infrared (NIR). The NIR spectrum is located between the IR and the
30
visible, at wavelengths found in the 800 nm to 2500 nm (or 4000cm−1
- 12500cm−1
). NIR is
sometimes called the overtone region, but, naturally, the first overtone of vibrations of lower
wavenumber is in the IR region. Absorption of energy in the NIR region is almost exclusively
associated with rising of the energy within the molecule to the first and second overtones and to
combinations of fundamental vibrations. Absorption bands in the NIR are broad peaks, rather than
sharp ones, because of the additive effects (combination of absorbances) of two or more bonds at
each wavelength. In general, overtones and combination tones are much weaker than the
fundamentals; the first ones usually by a factor of 10 to 100, whereas the second and higher
overtones and combination tones are even weaker. The intensity of absorption bands is related to the
degree of anharmonicity of the atoms. Hydrogen, the lightest atom, is associated with almost all
absorption bands in the NIR region. The NIR absorption of polymers, especially in the 4000 to 9000
cm−1
region, stems from the overtones of O-H, N-H, C-H, and S-H stretching vibrations as well as
from stretching-bending combinations involving these groups. Additionally, some electronic
transitions may also appear in the upper range of the NIR, close to the visible, especially in the range
of 9000 cm−1
to 12500 cm−1
(Batten, 1998; Blanco & Villarroya, 2002; Pavia et al., 2001; Sandorfy,
Buchet, & Lachenal, 2007).
Every type of bond has a different natural frequency of vibration. Furthermore, two bonds of the
same type in two different compounds are in two slightly different environments. So, no two
molecules of different structure can have exactly the same IR and NIR absorption patterns (IR and
NIR spectra). Thus, the analysis of the molecular bonds of a sample in the IR and NIR spectrum and
creates a characteristic spectrum that acts as a ―fingerprint‖ of the sample. By comparing the spectra
of two substances, one can establish whether they are, in fact, identical. A second and more
important use of the IR and NIR spectra is to determine the structural information about a molecule.
The absorptions of each type of bond (N-H, C-H, O-H, C-X, C=O, C-O, C-C, C=C, C ≡C, C≡N, and
so on) are regularly found only in specific small portions of the vibrational infrared region. A small
range of absorption can be defined for each type of bond, but, outside this range, absorptions are
normally due to some other type of bond. By establishing what kinds of bonds are present in a
sample, one can conclude on its chemical structure (Bevin, Fergusson, Perry, Janik, & Cozzolino,
2006; Pavia et al., 2001). More specifically, Fourier-transform infrared (FT-IR) spectroscopy in the
mid-infrared region is widely used in determinations of the proteins‘ secondary structure. The
characteristic amide I band (stretching vibrations of C=O in the peptide bond) between 1700 and
1600 cm-1
(in the mid- infrared range) provides information on protein secondary structure due to a
sensitivity of the amide I frequency to the hydrogen bonding pattern and dipolar couplings in the
protein backbone. This sensitivity makes it possible to study not only protein folding and unfolding,
31
but also aggregation processes. Furthermore, proteins have complementary but much weaker
fingerprints in the NIR region (Bruun, Holm, Hansen, & Jacobsen, 2006; Carbonaro, Maselli, &
Nucara, 2012)
The main advantage of using spectroscopic techniques is the exploratory character of the
measurements that facilitates concurrent detection of several different and even non-anticipated
constituents (Holse, Larsen, Hansen, & Engelsen, 2011). Other reasons that render spectroscopic
techniques as the preferred analytical method in many laboratories include: minimal sample
preparation/ pretreatment, short analysis time, cost-effective to analyze a single sample or large
batches of samples, non-destructive methods for the samples, no laboratory or skilled operator
needed for routine analyses, no use of hazardous chemical reagents, and, depending on the method,
the results are usually more precise and can be more accurate than, as accurate as, or of acceptable
accuracy, when compared with the method usually employed (Batten, 1998; Blanco & Villarroya,
2002).
32
AIM OF THE STUDY
Legumes are a good and inexpensive source of protein. Therefore, they could be a good alternative to
meat protein in developing countries, where protein deficiency is high.
The aim of the project is to examine the protein content of legumes from Ghana, and evaluate how
some traditional processing methods (germination, fermentation) can alter that protein content, with
the perspective of including them in high-protein snacks.
33
MATERIALS AND METHODS
Screening of samples
The following samples were used in the screening process with FT-IR.
Cowpea: asomdwee, asetenapa and soronko, Soybean: anidaso, nangbaare, jenguma and quarshie,
Lima: koloenu, lima 104 and 204, Bambara groundnut: Nar-4, Mucuna bean and Jack bean.
One replicate of each sample was milled in a coffee mill, frozen at -20 oC and freeze-dried for at
least 24h. FT-IR spectroscopy method (see method below) was performed. A triple determination
was carried out for each sample. The data obtained where used in a Principal Component Analysis
(PCA) model with a scope to identify the most differentiated samples.
Six samples were selected for further analysis. Cowpea: asetenapa and soronko, Soybean: anidaso,
Bambara groundnut, Mucuna bean and Jack bean.
Preparation of samples for analyses
Germination of samples
20g of each sample were weighed in a beaker. Three replicates of each sample were weighed (4
replicates for Bambara groundnut and Jack bean due to mould infection). The samples were soaked
in 100 mL of 1% w/v citric acid solution for 18h at room temperature. The solution was drained off.
The samples were washed with distilled water to neutral pH, and soaked in 100 mL distilled water
for 2 hours at room temperature. The distilled water was drained off and the samples were reweighed
to determine the amount of water absorbed.
The soaked seeds were, then, placed in petri dishes containing two filter papers (Rundfilter MN 615,
9 cm ø, MACHEREY-NAGEL GmbH & Co. KG, Dűren, Germany), and 5 mL distilled water were
sprinkled on top of them. The petri dishes were then put into plastic bags, in order to keep humidity,
and kept in darkness at 30oC for either 48h or 72h. The samples were sprinkled with distilled water
daily.
34
The sprouted samples were ground coarsely (using a kitchen mini-chopper), frozen at -20oC and
freeze-dried for at least 24h. Next, they were milled in a coffee mill and stored in plastic containers
at room temperature.
Fermentation of samples
20g of each sample were weighed in a beaker. Three replicates were weighed for each sample. The
samples were soaked in 100 mL of 1% w/v citric acid solution for 18h at room temperature. The
solution was drained off. The samples were washed with distilled water to neutral pH, and soaked in
100 mL distilled water for 2 hours at room temperature. The distilled water was drained off and the
samples were reweighed to determine the amount of water absorbed. The legumes were placed in 50
mL Eppendorf tubes with excess distilled water and put in a waterbath a 90oC for 30 min (for
cowpea and soybean samples) or 60 min (for bambara groundnuts, mucuna beans and jack beans)
(boiling step). After boiling the distilled water was drained off. The boiled samples were ground
coarsely (using a kitchen mini-chopper) and stored in plastic bags at 5oC overnight.
The next day the samples were left on the lab bench until they acquired room temperature and were
then inoculated with 1,2 mL Bacillus subtilis var. natto solution (7*106 CFU/ mL) and 2 mL distilled
water. The samples were massaged in order to ensure that the bacteria were spread throughout the
sample. The inoculated samples were kept in darkness at either 30oC or 37
oC for 48h. They were
massaged twice a day to maximize the legume surface that the bacteria ferment.
The fermented samples were frozen at -20oC and freeze-dried for at least 24h. They were, then,
milled in a coffee mill and stored in plastic containers at room temperature.
Control samples
20g of each sample were weighed in a beaker. Three replicates were weighed for each sample. The
samples were soaked in 100 mL of 1% w/v citric acid solution for 18h at room temperature. The
solution was drained off. The samples were washed with distilled water to neutral pH, and soaked in
100 mL distilled water for 2 hours at room temperature. The distilled water was drained off and the
samples were reweighed to determine the amount of water absorbed. Next, the control samples were
35
ground coarsely (using a kitchen mini-chopper), frozen at -20oC and freeze-dried for at least 24h.
They were, then, milled in a coffee mill and stored in plastic containers at room temperature.
Defatting of soybean samples for protein determination
Prior to protein determination of the soybean samples, a defatting step was necessary in order to
reduce the fat content below 10%. The method used was modified from L‘hocine, Boye, & Arcand
(2006). 1 g of each soy sample was weighed and put in a 15 mL Eppendorf tube. 5 mL of hexane
were added in the tube and the content of the tube was mixed in a vortex mixer for at least 30 sec.
The samples were then centrifuged for 10 min at 2000 rpm and the supernatant was discarded. The
procedure was repeated two more times. The samples were air-dried in room temperature under a
fume hood for approximately 24 h.
Samples‘ assessment
FT-IR (Fourier transform infrared) spectroscopy
The absorbance measurements were performed on an Arid-Zone MB100 FT-IR instrument (ABB
Bomen, Quebec, Canada) using an Attenuated Total Reflectance (ATR) device with a triple-bounce
diamond crystal. IR spectra were recorded in the range of 4000– 530 cm−1
using a spectral resolution
of 4 cm−1
. The ground legumes were positioned on the crystal surface and squeezed towards the
diamond crystal by use of a concave needle compressor. Each spectrum represents the average of 64
scans ratioed against the background (128 scans) collected with the empty crystal and stored as
absorbance spectra. Each sample was measured in duplicate.
NIR (Near infrared) spectroscopy
The QFA flex near-infrared spectrometer (Q- Interline A/S, Tølløse, Denmark) was used to collect
the spectra. The samples were placed in a 50mm diameter sample bottle. The instrument parameters
were set as following; resolution: 4 cm-1
; Gain: C and Gain: High. Each spectrum represents the
average of 16 scans ratioed against a background (32 scans) measured on an internal white 50mm
36
diameter bottle. The spectrum measured was 4000-14000 cm-1
. Duplicate measurements were
collected from each sample.
Determination of moisture content
Moisture content was estimated by a method modified from ICC-Standard No. 110/1. Double
determination was performed in milled raw legume samples. Clean vessels were dried for 2h at
130°C and cooled down to room temperature in a desiccator. The empty closed vessels were
weighed (W1) and the weight was noted. 1 g of each sample was weighed (W2). The vessels were
placed in the drying cabinet to dry at 130°C for 2 h (180 min set – 1 hour for reaching required
temperature). After drying the vessels were placed in the desiccators (the first 5-10 min with the lid
half-open) to cool down to room temperature. After cooling down, the vessels were weighed again
(W3).
Percent moisture content was calculated as follows;
Moisture % =𝑊2 − 𝑊3 − 𝑊1 ∗ 100
𝑊2
Where,
W1 = tare weight of vessels (with cover) in grams
W2 = initial weight of sample in grams
W3 = dry weight of sample and vessel (with cover) in grams
Determination of fat content
Crude fat was determined using a modified method of AACC Method 30-25 Crude Fat in Wheat,
Corn, and Soy Flour, Feeds, and Cooked Feeds. Beakers were dried at 103°C for 30 min and cooled
down to room temperature in a desiccator. Three glass beads were added in each beaker before
weighing (W4). 3 g of milled freeze-dried sample for samples with <10% fat (cowpeas, jack bean,
bambara bean, mucuna bean) and 2g for samples with >10% fat (soybean) were weighed (W5) in the
extraction holsters. A fat-free cotton cork was added and the holsters were put in the Soxtec
apparatus (Soxtec System HT 1043 Extraction Unit, FOSS Tecator, DK) in the assigned position. 40-
37
50 mL petroleum ether HPLC grade were added in each beaker, before the beakers were also placed
in the Soxtec apparatus. The holsters with the samples were held for 15 min in boiling position,
followed by 30 min in rinsing position. The solvent was collected in the condensers; the beakers
were removed from the apparatus and left under a fume hood for 30 min for any residual solvent to
evaporate. They were then weighed again (W6).
Cotton gloves and magnet forceps were used throughout the procedure, when handling the beakers
and extraction holsters.
Percent crude fat was calculated as follows:
Crude Fat % = 𝑊6 – 𝑊4 ∗ 100
𝑊5
Where,
W4 = tare weight of beaker (with glass beads) in grams
W5 = initial weight of sample in grams
W6 = gross weight of sample fat and beaker (with glass beads) in grams
Determination of protein content
Protein content was determined by a method modified from AOAC Official Method 2001.11 Protein
(Crude) in Animal Feed, Forage (Plant Tissue), Grain, and Oilseeds. 0,5 g milled freeze-dried sample
was weighed for samples with 25-50% protein (soybean, cowpeas, mucuna bean, jack bean) and 1g
for samples with 3-25% protein (bambara groundnut), folded into N-free paper and dropped into a
Kjeldahl tube. Single determinations were carried out. Two catalyst tabs, each containing 3,5 g
K2SO4 with 0,4 g Cu catalyst (CuSO4), and 12 mL concentrated H2SO4 (98%, reagent grade) were
added into each tube. Samples were digested in 420 °C for 1 h in Kjeltec digestion block (Kjeltc
System 2020 Digestor, FOSS Tecator, DK). After digestion samples were cooled for 15-20 min. 50
mL of NaOH (40 % w/w) and 25 mL of receiver solution (H3BO3, 4 % w/v) were used for distillation
(Kjeltc System 1026 Distilling unit, FOSS Tecator, DK). Distillate was titrated with standard 0.1000
N HCl to grey endpoint. Preparing blanks, 2 catalyst tabs were mixed with 12 mL concentrated
H2SO4 and then treated identically to the samples. Blanks evaluate nitrogen from chemicals and
other extraneous sources.
38
Percent nitrogen and percent crude protein can be calculated as shown below.
% 𝑁 = 𝑇 − 𝐵 ∗ 𝑁 ∗ 14,0067 ∗ 100
𝑊
% Protein = % N * F
T – titration volume for sample, mL;
B – titration volume for blank, mL;
N – normality of HCl acid (0.1000 N);
W – sample weight, mg;
F – Conversion factor for Nitrogen to protein – 6.25
(Note: For soybean samples the sample weight was reduced to the original weight before defatting.)
Data analysis
Scatter effects in the IR and NIR raw spectra were removed by application of MSC (Multiplicative
Scatter Correction) in MatLab. The transformed spectra were then imported into LatentiX 2.12
(LatentiX Aps, Frederiksberg, Denmark). Principal Compoonent Analysis (PCA) was performed on
the mean centered spectra, with random cross validation.
Furthermore, the data on the crude protein content of the germinated, fermented, and control samples
were imported in IBM SPSS Statistics 22 (IBM Software). One-way ANOVA was performed with
protein content as the dependent variable and treatment as the independent one. The samples were
checked for their homogeneity using Levene‘s test for equality of variances. In case the assumption
for homogeneity was violated (Sig. ≤0,05) a Welch ANOVA was also performed. Post-hoc analysis
of the samples was carried out using Scheffe test. For jack bean samples Independent Samples T-test
was also performed.
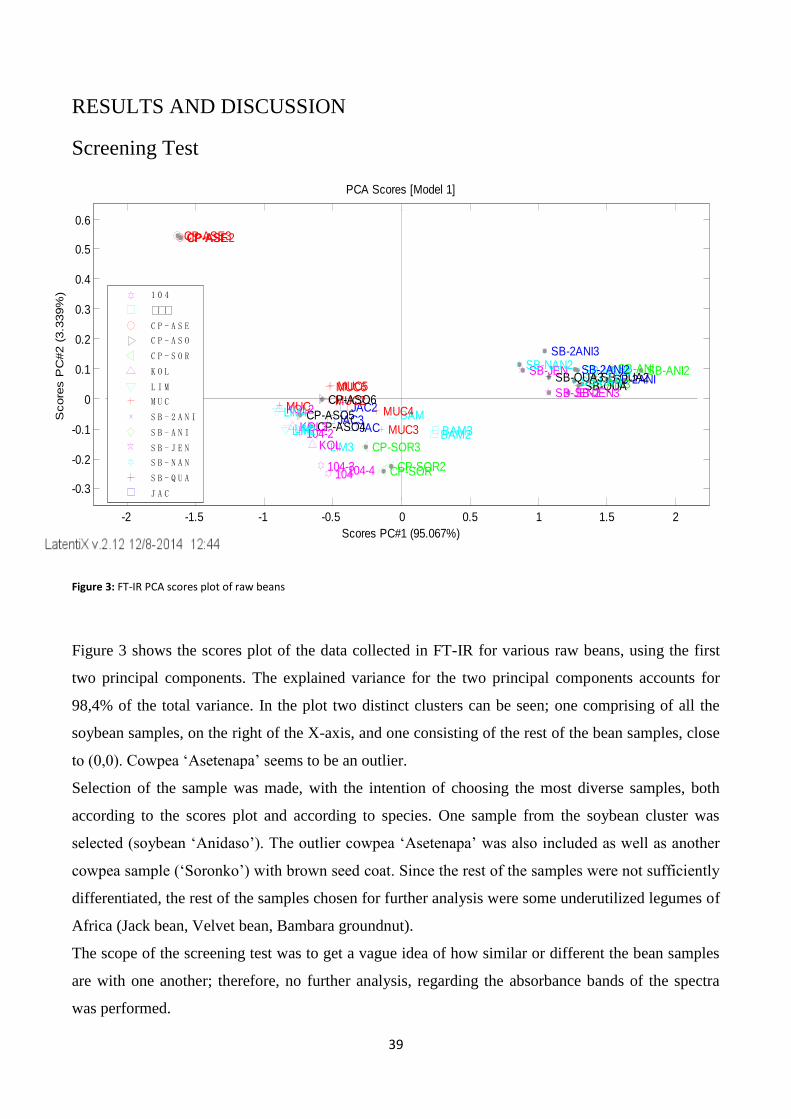
39
RESULTS AND DISCUSSION
Screening Test
Figure 3: FT-IR PCA scores plot of raw beans
Figure 3 shows the scores plot of the data collected in FT-IR for various raw beans, using the first
two principal components. The explained variance for the two principal components accounts for
98,4% of the total variance. In the plot two distinct clusters can be seen; one comprising of all the
soybean samples, on the right of the X-axis, and one consisting of the rest of the bean samples, close
to (0,0). Cowpea ‗Asetenapa‘ seems to be an outlier.
Selection of the sample was made, with the intention of choosing the most diverse samples, both
according to the scores plot and according to species. One sample from the soybean cluster was
selected (soybean ‗Anidaso‘). The outlier cowpea ‗Asetenapa‘ was also included as well as another
cowpea sample (‗Soronko‘) with brown seed coat. Since the rest of the samples were not sufficiently
differentiated, the rest of the samples chosen for further analysis were some underutilized legumes of
Africa (Jack bean, Velvet bean, Bambara groundnut).
The scope of the screening test was to get a vague idea of how similar or different the bean samples
are with one another; therefore, no further analysis, regarding the absorbance bands of the spectra
was performed.
-2 -1.5 -1 -0.5 0 0.5 1 1.5 2
-0.3
-0.2
-0.1
0
0.1
0.2
0.3
0.4
0.5
0.6
SB-ANI2 SB-ANI SB-2ANI SB-QUA2
SB-ANI3 SB-QUA
SB-NAN3 SB-2ANI2 SB-NAN
SB-JEN3
SB-QUA3
SB-JEN2
SB-2ANI3
SB-JEN SB-NAN2
BAM3 BAM2
Scores PC#1 (95.067%)
PCA Scores [Model 1]
BAM
CP-SOR2 CP-SOR
MUC3
MUC4
CP-SOR3
JAC
JAC2
104-4
MUC5
JAC3
MUC6
104
MUC2
LIM3
CP-ASO6
104-3
KOL
CP-ASO4 CP-ASO5
104-2 KOL3 LIM LIM2
KOL2 MUC LIM4
CP-ASE2 CP-ASE CP-ASE3
Score
s P
C#2 (
3.3
39%
) 1 0 4
ΒΒΒ
C P - A S E
C P - A S O
C P - S O R
K O L
L I M
M U C
S B - 2 A N I
S B - A N I
S B - J E N
S B - N A N
S B - Q U A
J A C
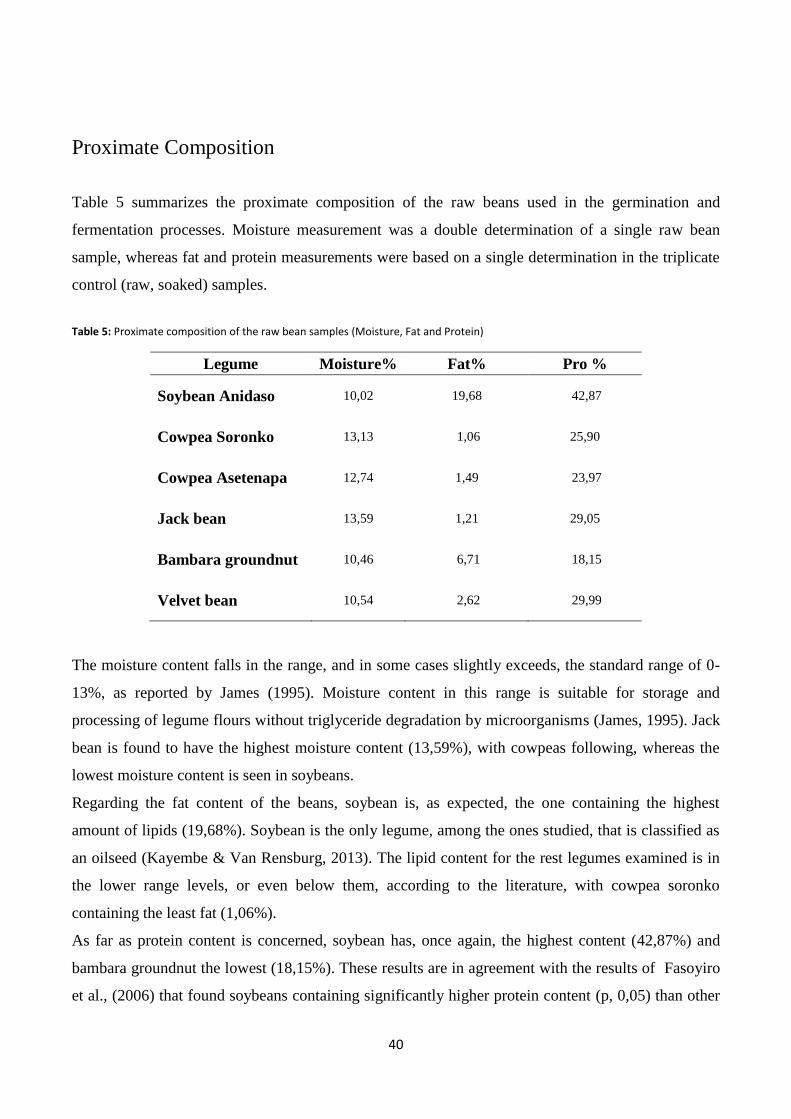
40
Proximate Composition
Table 5 summarizes the proximate composition of the raw beans used in the germination and
fermentation processes. Moisture measurement was a double determination of a single raw bean
sample, whereas fat and protein measurements were based on a single determination in the triplicate
control (raw, soaked) samples.
Table 5: Proximate composition of the raw bean samples (Moisture, Fat and Protein)
Legume Moisture% Fat% Pro %
Soybean Anidaso 10,02 19,68 42,87
Cowpea Soronko 13,13 1,06 25,90
Cowpea Asetenapa 12,74 1,49 23,97
Jack bean 13,59 1,21 29,05
Bambara groundnut 10,46 6,71 18,15
Velvet bean 10,54 2,62 29,99
The moisture content falls in the range, and in some cases slightly exceeds, the standard range of 0-
13%, as reported by James (1995). Moisture content in this range is suitable for storage and
processing of legume flours without triglyceride degradation by microorganisms (James, 1995). Jack
bean is found to have the highest moisture content (13,59%), with cowpeas following, whereas the
lowest moisture content is seen in soybeans.
Regarding the fat content of the beans, soybean is, as expected, the one containing the highest
amount of lipids (19,68%). Soybean is the only legume, among the ones studied, that is classified as
an oilseed (Kayembe & Van Rensburg, 2013). The lipid content for the rest legumes examined is in
the lower range levels, or even below them, according to the literature, with cowpea soronko
containing the least fat (1,06%).
As far as protein content is concerned, soybean has, once again, the highest content (42,87%) and
bambara groundnut the lowest (18,15%). These results are in agreement with the results of Fasoyiro
et al., (2006) that found soybeans containing significantly higher protein content (p, 0,05) than other
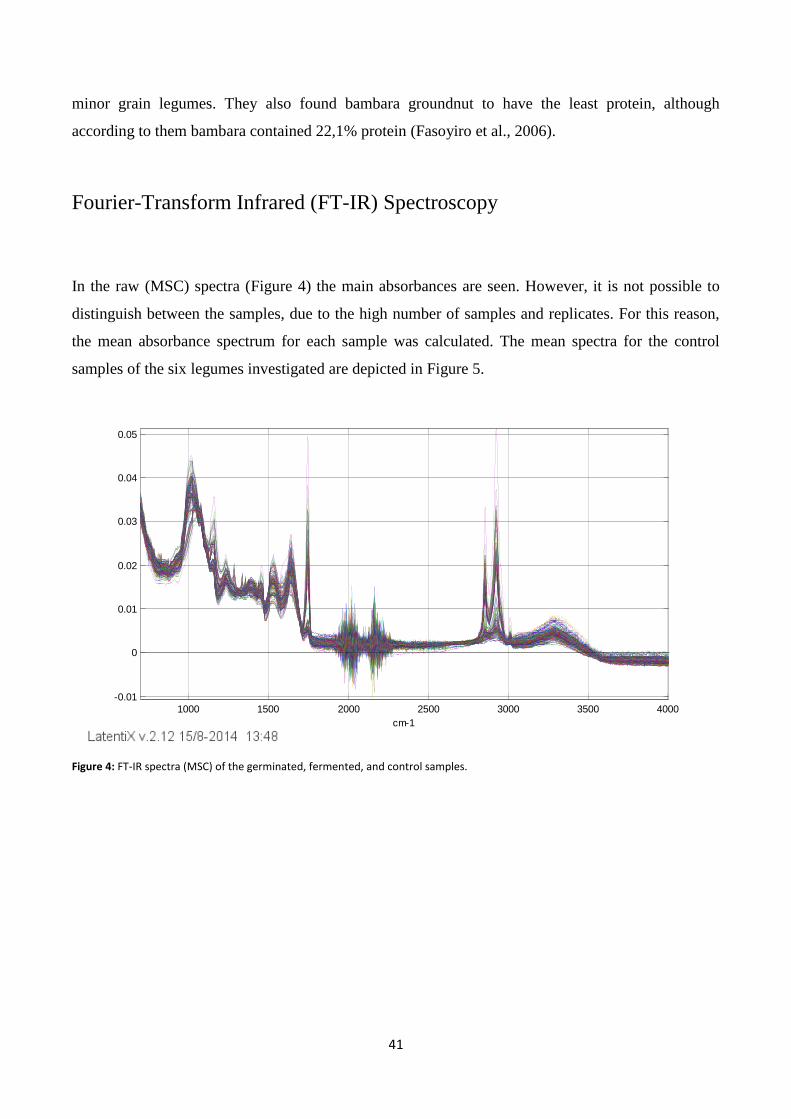
41
minor grain legumes. They also found bambara groundnut to have the least protein, although
according to them bambara contained 22,1% protein (Fasoyiro et al., 2006).
Fourier-Transform Infrared (FT-IR) Spectroscopy
In the raw (MSC) spectra (Figure 4) the main absorbances are seen. However, it is not possible to
distinguish between the samples, due to the high number of samples and replicates. For this reason,
the mean absorbance spectrum for each sample was calculated. The mean spectra for the control
samples of the six legumes investigated are depicted in Figure 5.
Figure 4: FT-IR spectra (MSC) of the germinated, fermented, and control samples.
1000 1500 2000 2500 3000 3500 4000
-0.01
0
0.01
0.02
0.03
0.04
0.05
cm-1
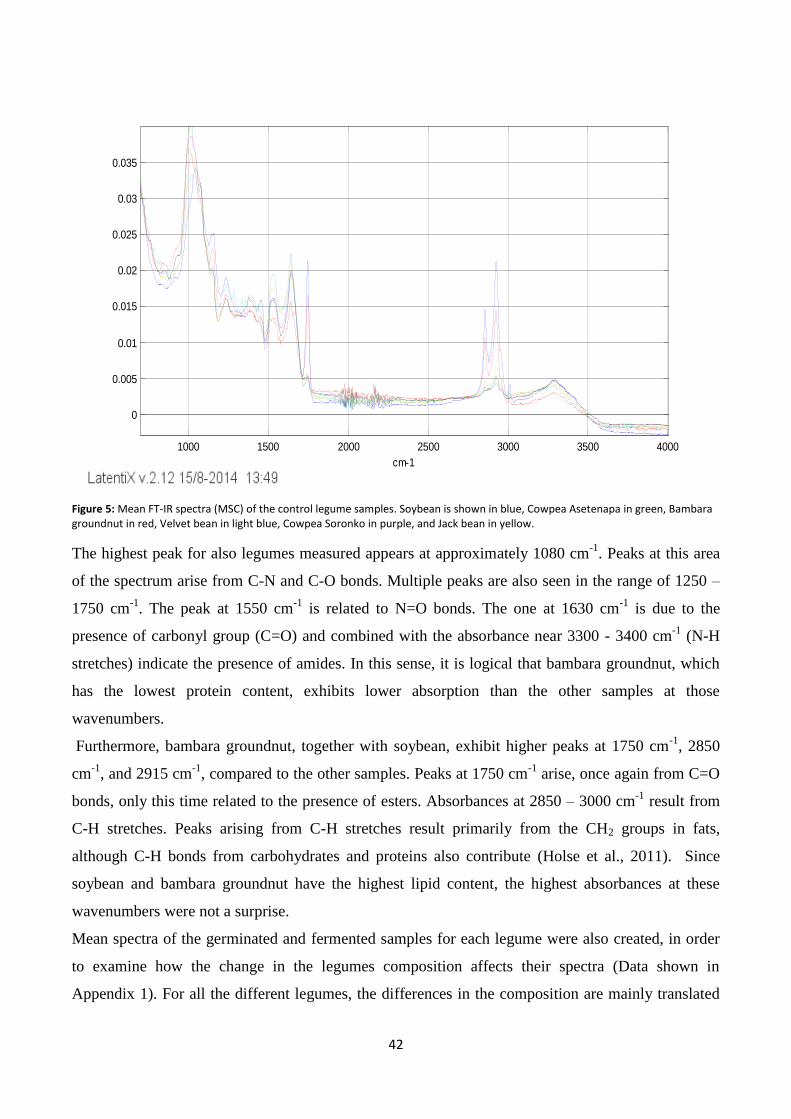
42
Figure 5: Mean FT-IR spectra (MSC) of the control legume samples. Soybean is shown in blue, Cowpea Asetenapa in green, Bambara groundnut in red, Velvet bean in light blue, Cowpea Soronko in purple, and Jack bean in yellow.
The highest peak for also legumes measured appears at approximately 1080 cm-1
. Peaks at this area
of the spectrum arise from C-N and C-O bonds. Multiple peaks are also seen in the range of 1250 –
1750 cm-1
. The peak at 1550 cm-1
is related to N=O bonds. The one at 1630 cm-1
is due to the
presence of carbonyl group (C=O) and combined with the absorbance near 3300 - 3400 cm-1
(N-H
stretches) indicate the presence of amides. In this sense, it is logical that bambara groundnut, which
has the lowest protein content, exhibits lower absorption than the other samples at those
wavenumbers.
Furthermore, bambara groundnut, together with soybean, exhibit higher peaks at 1750 cm-1
, 2850
cm-1
, and 2915 cm-1
, compared to the other samples. Peaks at 1750 cm-1
arise, once again from C=O
bonds, only this time related to the presence of esters. Absorbances at 2850 – 3000 cm-1
result from
C-H stretches. Peaks arising from C-H stretches result primarily from the CH2 groups in fats,
although C-H bonds from carbohydrates and proteins also contribute (Holse et al., 2011). Since
soybean and bambara groundnut have the highest lipid content, the highest absorbances at these
wavenumbers were not a surprise.
Mean spectra of the germinated and fermented samples for each legume were also created, in order
to examine how the change in the legumes composition affects their spectra (Data shown in
Appendix 1). For all the different legumes, the differences in the composition are mainly translated
1000 1500 2000 2500 3000 3500 4000
0
0.005
0.01
0.015
0.02
0.025
0.03
0.035
cm-1
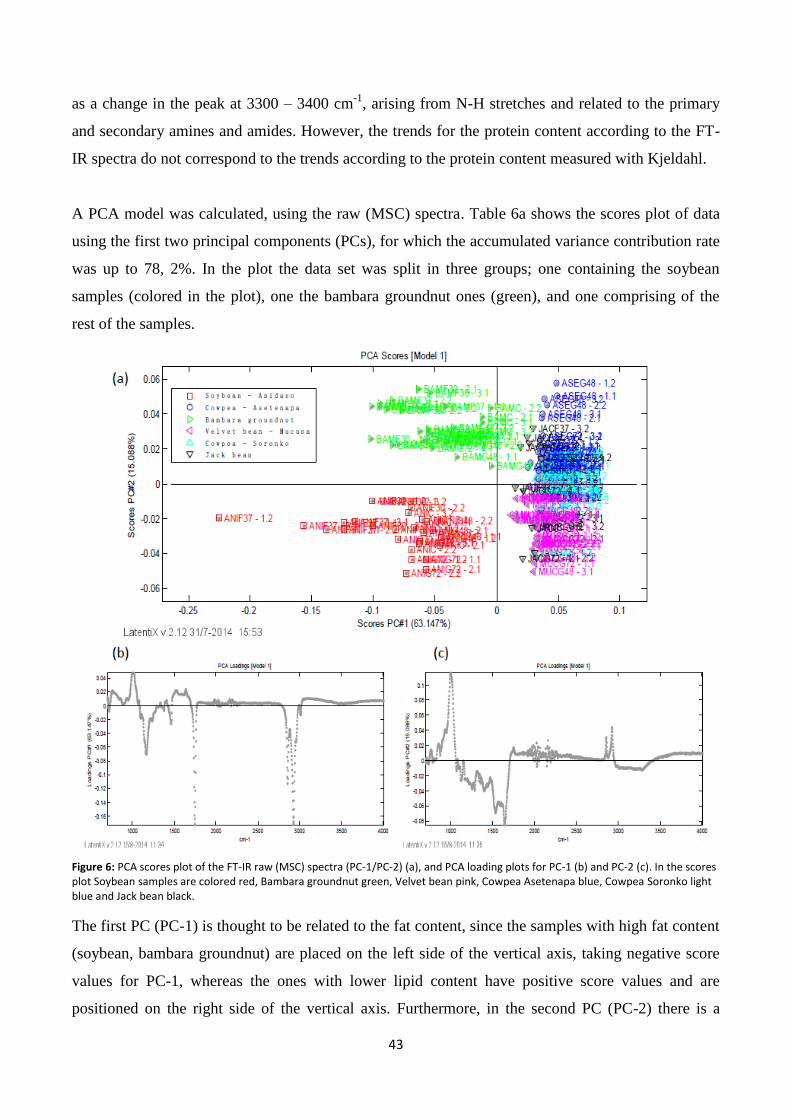
43
as a change in the peak at 3300 – 3400 cm-1
, arising from N-H stretches and related to the primary
and secondary amines and amides. However, the trends for the protein content according to the FT-
IR spectra do not correspond to the trends according to the protein content measured with Kjeldahl.
A PCA model was calculated, using the raw (MSC) spectra. Table 6a shows the scores plot of data
using the first two principal components (PCs), for which the accumulated variance contribution rate
was up to 78, 2%. In the plot the data set was split in three groups; one containing the soybean
samples (colored in the plot), one the bambara groundnut ones (green), and one comprising of the
rest of the samples.
Figure 6: PCA scores plot of the FT-IR raw (MSC) spectra (PC-1/PC-2) (a), and PCA loading plots for PC-1 (b) and PC-2 (c). In the scores plot Soybean samples are colored red, Bambara groundnut green, Velvet bean pink, Cowpea Asetenapa blue, Cowpea Soronko light blue and Jack bean black.
The first PC (PC-1) is thought to be related to the fat content, since the samples with high fat content
(soybean, bambara groundnut) are placed on the left side of the vertical axis, taking negative score
values for PC-1, whereas the ones with lower lipid content have positive score values and are
positioned on the right side of the vertical axis. Furthermore, in the second PC (PC-2) there is a
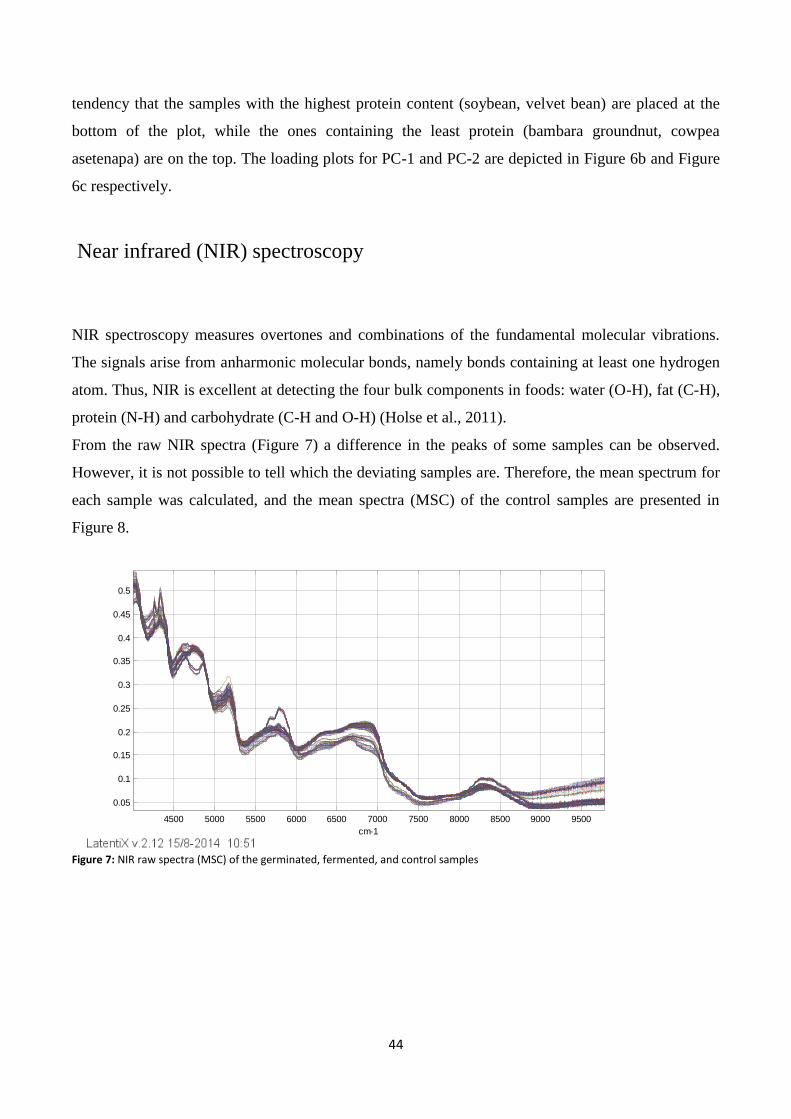
44
tendency that the samples with the highest protein content (soybean, velvet bean) are placed at the
bottom of the plot, while the ones containing the least protein (bambara groundnut, cowpea
asetenapa) are on the top. The loading plots for PC-1 and PC-2 are depicted in Figure 6b and Figure
6c respectively.
Near infrared (NIR) spectroscopy
NIR spectroscopy measures overtones and combinations of the fundamental molecular vibrations.
The signals arise from anharmonic molecular bonds, namely bonds containing at least one hydrogen
atom. Thus, NIR is excellent at detecting the four bulk components in foods: water (O-H), fat (C-H),
protein (N-H) and carbohydrate (C-H and O-H) (Holse et al., 2011).
From the raw NIR spectra (Figure 7) a difference in the peaks of some samples can be observed.
However, it is not possible to tell which the deviating samples are. Therefore, the mean spectrum for
each sample was calculated, and the mean spectra (MSC) of the control samples are presented in
Figure 8.
Figure 7: NIR raw spectra (MSC) of the germinated, fermented, and control samples
4500 5000 5500 6000 6500 7000 7500 8000 8500 9000 9500
0.05
0.1
0.15
0.2
0.25
0.3
0.35
0.4
0.45
0.5
cm-1
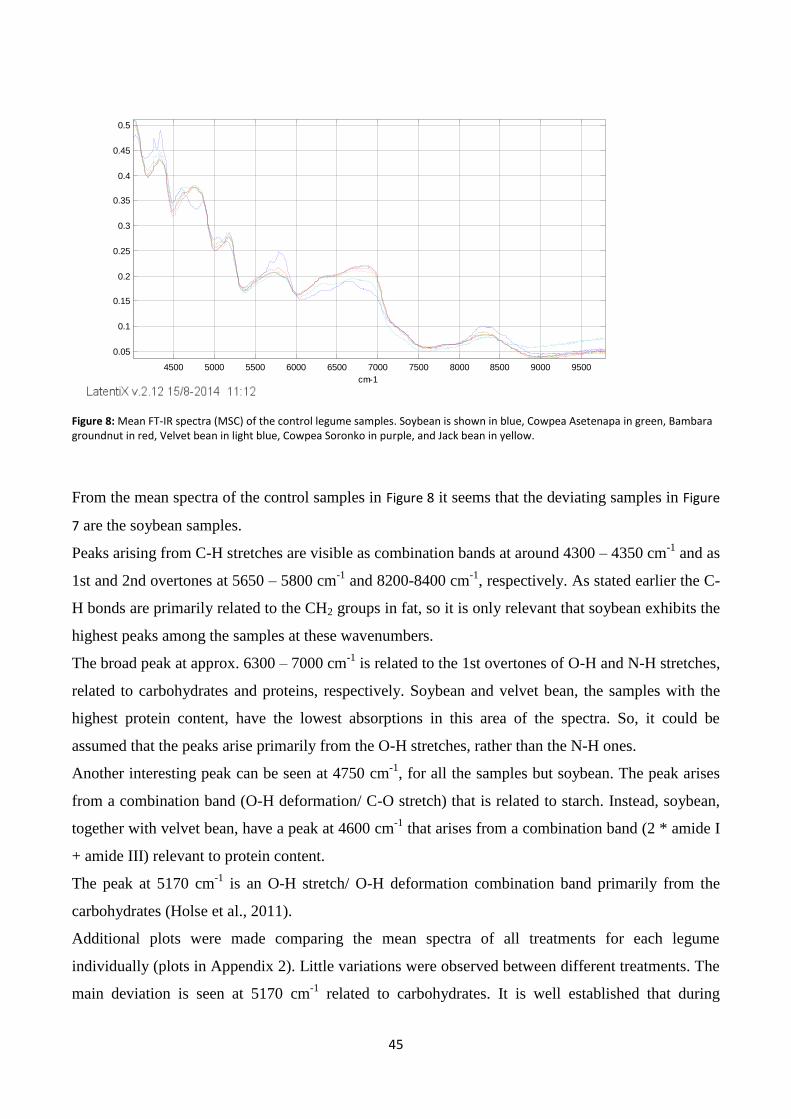
45
Figure 8: Mean FT-IR spectra (MSC) of the control legume samples. Soybean is shown in blue, Cowpea Asetenapa in green, Bambara groundnut in red, Velvet bean in light blue, Cowpea Soronko in purple, and Jack bean in yellow.
From the mean spectra of the control samples in Figure 8 it seems that the deviating samples in Figure
7 are the soybean samples.
Peaks arising from C-H stretches are visible as combination bands at around 4300 – 4350 cm-1
and as
1st and 2nd overtones at 5650 – 5800 cm-1
and 8200-8400 cm-1
, respectively. As stated earlier the C-
H bonds are primarily related to the CH2 groups in fat, so it is only relevant that soybean exhibits the
highest peaks among the samples at these wavenumbers.
The broad peak at approx. 6300 – 7000 cm-1
is related to the 1st overtones of O-H and N-H stretches,
related to carbohydrates and proteins, respectively. Soybean and velvet bean, the samples with the
highest protein content, have the lowest absorptions in this area of the spectra. So, it could be
assumed that the peaks arise primarily from the O-H stretches, rather than the N-H ones.
Another interesting peak can be seen at 4750 cm-1
, for all the samples but soybean. The peak arises
from a combination band (O-H deformation/ C-O stretch) that is related to starch. Instead, soybean,
together with velvet bean, have a peak at 4600 cm-1
that arises from a combination band (2 * amide I
+ amide III) relevant to protein content.
The peak at 5170 cm-1
is an O-H stretch/ O-H deformation combination band primarily from the
carbohydrates (Holse et al., 2011).
Additional plots were made comparing the mean spectra of all treatments for each legume
individually (plots in Appendix 2). Little variations were observed between different treatments. The
main deviation is seen at 5170 cm-1
related to carbohydrates. It is well established that during
4500 5000 5500 6000 6500 7000 7500 8000 8500 9000 9500
0.05
0.1
0.15
0.2
0.25
0.3
0.35
0.4
0.45
0.5
cm-1
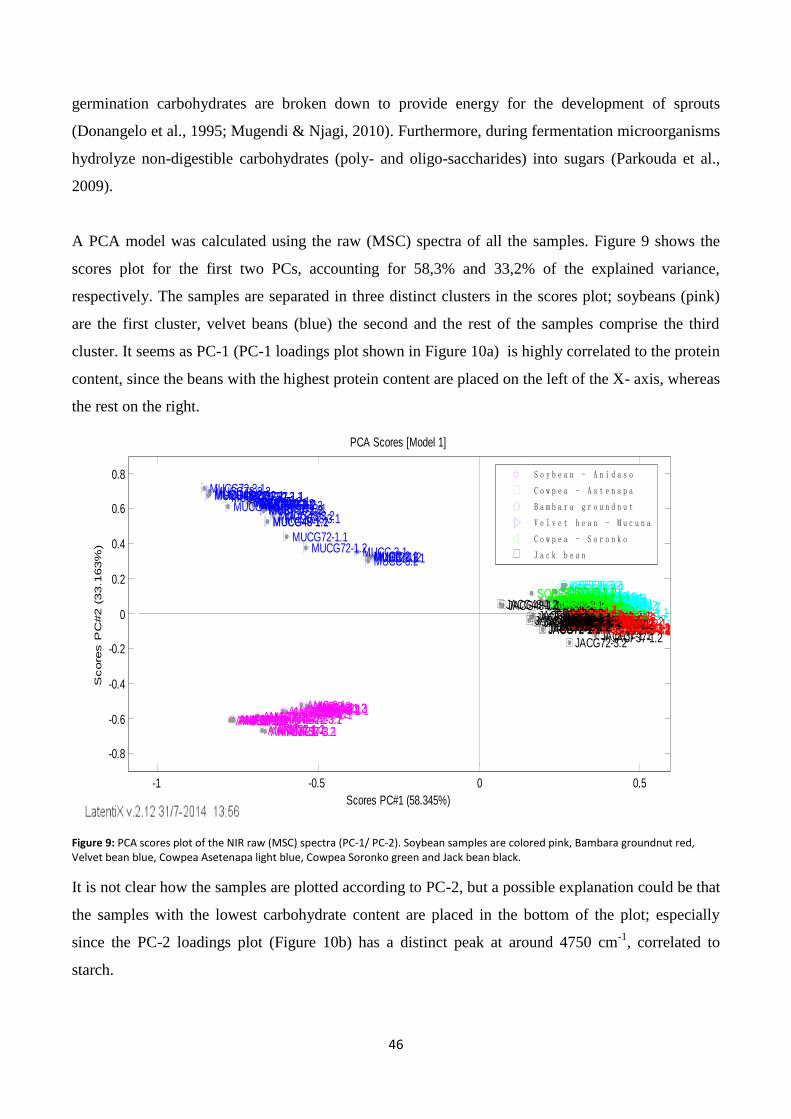
46
germination carbohydrates are broken down to provide energy for the development of sprouts
(Donangelo et al., 1995; Mugendi & Njagi, 2010). Furthermore, during fermentation microorganisms
hydrolyze non-digestible carbohydrates (poly- and oligo-saccharides) into sugars (Parkouda et al.,
2009).
A PCA model was calculated using the raw (MSC) spectra of all the samples. Figure 9 shows the
scores plot for the first two PCs, accounting for 58,3% and 33,2% of the explained variance,
respectively. The samples are separated in three distinct clusters in the scores plot; soybeans (pink)
are the first cluster, velvet beans (blue) the second and the rest of the samples comprise the third
cluster. It seems as PC-1 (PC-1 loadings plot shown in Figure 10a) is highly correlated to the protein
content, since the beans with the highest protein content are placed on the left of the X- axis, whereas
the rest on the right.
Figure 9: PCA scores plot of the NIR raw (MSC) spectra (PC-1/ PC-2). Soybean samples are colored pink, Bambara groundnut red, Velvet bean blue, Cowpea Asetenapa light blue, Cowpea Soronko green and Jack bean black.
It is not clear how the samples are plotted according to PC-2, but a possible explanation could be that
the samples with the lowest carbohydrate content are placed in the bottom of the plot; especially
since the PC-2 loadings plot (Figure 10b) has a distinct peak at around 4750 cm-1
, correlated to
starch.
-1 -0.5 0 0.5
-0.8
-0.6
-0.4
-0.2
0
0.2
0.4
0.6
0.8
BAMC-1.1 BAMC-1.2 ASEF37-1.2 BAMC-3.1 BAMC-3.2 BAMC-2.1 BAMC-2.2
ASEC-3.2 ASEF37-1.1
BAMG48-4.2 BAMG48-4.1 JACF37-1.2
ASEC-3.1 ASEF37-2.2 ASEC-2.1 ASEC-1.1 ASEC-2.4 ASEC-2.2 SORC-3.2 ASEC-2.3
JACF37-3.2
ASEC-1.2 ASEG48-1.2
JACF37-1.1
BAMG48-3.2 JACF37-3.1 SORC-3.1 BAMG72-3.1 BAMG72-3.2 BAMG48-3.3
JACF37-2.2
ASEG72-2.3 BAMG48-3.1 ASEF37-2.1 ASEF30-1.2
BAMG48-2.2
ASEG72-2.2 SORF37-2.2 JACF37-2.1
ASEF30-1.1
BAMG72-4.1 ASEG72-2.1
BAMC-1.3.
ASEG48-1.1
BAMG48-2.3
ASEG72-3.2
BAMC-1.4 BAMG72-4.2
ASEG48-3.2
BAMG48-2.1 SORF37-2.1 ASEF37-3.2
BAMG72-2.1 SORC-2.1 SORC-2.2 ASEG72-3.1 ASEF37-3.1
BAMG72-2.2
ASEF30-2.2
BAMG72-1.2
SORC-1.2
BAMG72-1.1 SORG48-3.2 BAMG48-1.1
SORC-1.1
BAMG48-1.2 BAMF37-1.2
ASEG48-3.1 ASEF30-2.1
BAMF37-1.1
JACG72-3.2
ASEG72-1.2 SORG48-2.2 ASEG72-1.1
BAMF37-3.2 BAMF37-3.1 JACC-1.1
ASEF30-3.1
JACG48-3.2 JACC-1.2
SORG48-3.1 BAMF30-2.2
ASEG48-2.2
SORF37-3.2
JACC-3.2 JACC-2.2 BAMF30-2.1 SORF37-1.2
ASEF30-3.2
JACG48-3.1 JACF30-1.2
SORG48-2.1 ASEG48-2.1
JACC-3.1 JACF30-3.2 BAMF30-1.2 SORF30-1.2 SORF30-3.2 JACC-2.1 BAMF30-1.1 SORF37-3.1 BAMF30-3.1 BAMF30-3.2 SORF37-1.1
BAMF37-2.1 JACG48-4.2
SORG48-1.2
JACF30-3.1 BAMF37-2.2 JACF30-1.1
SORG48-1.1 SORG72-3.2
JACG72-2.2 JACG48-4.1 JACG72-2.1
SORG72-3.1 SORF30-1.1 JACG48-2.2 SORF30-3.1 SORG72-2.2 SORG72-2.1 JACG48-2.1 SORG72-1.2 SORG72-1.1
JACG72-1.1 JACG72-1.2
SORF30-2.2
JACG72-4.2 JACG72-4.1 JACF30-2.1
SORF30-2.1
JACF30-2.2 JACG72-3.1 JACG48-1.1 JACG48-1.2
Scores PC#1 (58.345%)
PCA Scores [Model 1]
MUCC-1.1 MUCC-1.2 MUCC-3.2 MUCC-2.1 MUCC-2.2 MUCC-3.1
ANIC-2.1 ANIC-2.2 ANIG48-1.1 ANIG48-1.3 ANIG48-1.2 ANIC-1.2 ANIC-1.1 ANIC-3.2
MUCG72-1.2
ANIC-3.1 ANIG48-2.1 ANIG48-2.2 ANIG72-3.1
MUCG72-1.1
ANIG48-3.1 ANIG72-3.2
ANIF37-3.1
ANIG48-3.2
ANIF37-3.2
MUCG48-3.1 MUCG48-3.2
ANIG72-2.2 ANIF37-1.2 ANIF37-1.1
ANIG72-2.1
MUCG48-1.1 MUCG48-1.2 MUCF37-3.1
ANIF37-2.2
MUCF30-1.2 MUCF37-1.2 MUCF37-2.2
ANIG72-1.2 ANIF37-2.1
ANIG72-1.1
MUCF30-2.2 MUCF37-3.2 MUCF30-3.2 MUCF37-2.1 MUCF30-2.1 MUCF30-1.1
ANIF30-1.2 ANIF30-1.1
MUCF37-1.1 MUCF30-3.1
ANIF30-2.2 ANIF30-2.1 ANIF30-3.2 ANIF30-3.1
MUCG48-2.3 MUCG72-2.2 MUCG72-2.1 MUCG72-3.2 MUCG48-2.1 MUCG48-2.2
MUCG72-3.1
Score
s P
C#2 (
33.1
63%
)
S o y b e a n - A n i d a s o
C o w p e a - A s t e n a p a
B a m b a r a g r o u n d n u t
V e l v e t b e a n - M u c u n a
C o w p e a - S o r o n k o
J a c k b e a n
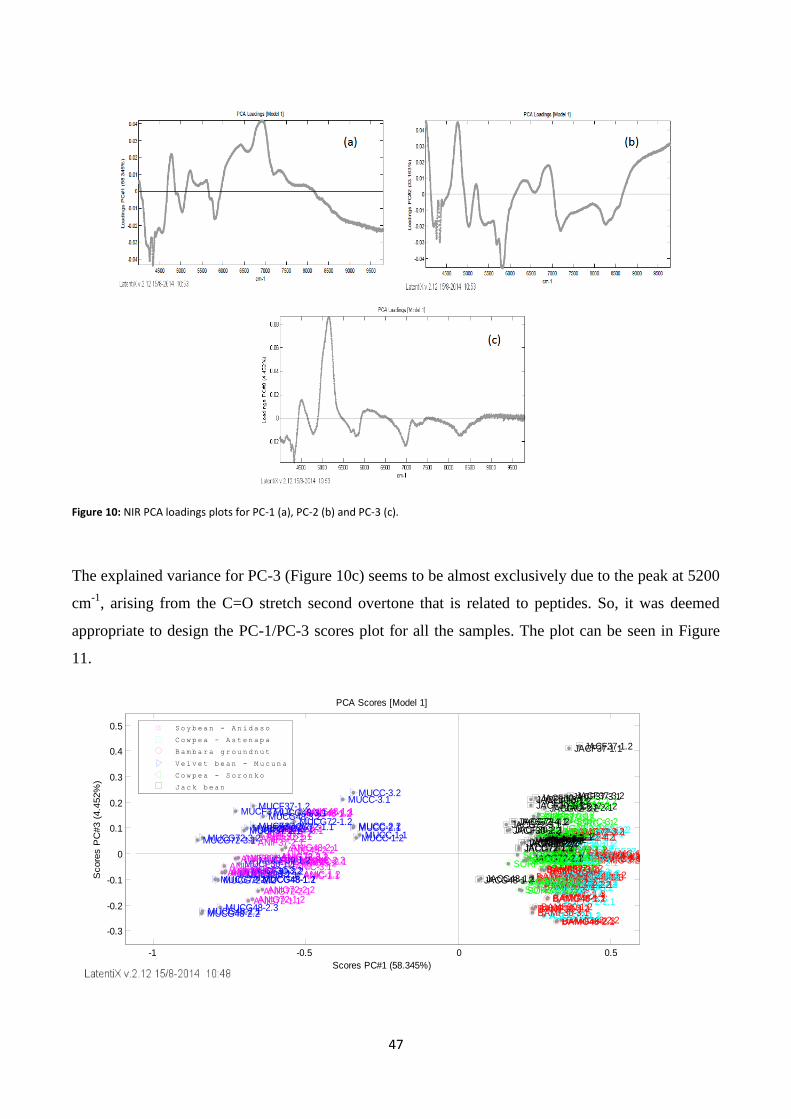
47
Figure 10: NIR PCA loadings plots for PC-1 (a), PC-2 (b) and PC-3 (c).
The explained variance for PC-3 (Figure 10c) seems to be almost exclusively due to the peak at 5200
cm-1
, arising from the C=O stretch second overtone that is related to peptides. So, it was deemed
appropriate to design the PC-1/PC-3 scores plot for all the samples. The plot can be seen in Figure
11.
-1 -0.5 0 0.5
-0.3
-0.2
-0.1
0
0.1
0.2
0.3
0.4
0.5
BAMC-1.1 BAMC-1.2 ASEF37-1.2 BAMC-3.1 BAMC-3.2 BAMC-2.1 BAMC-2.2
ASEC-3.2
ASEF37-1.1 BAMG48-4.2 BAMG48-4.1
JACF37-1.2
ASEC-3.1
ASEF37-2.2
ASEC-2.1 ASEC-1.1 ASEC-2.4 ASEC-2.2
SORC-3.2
ASEC-2.3
JACF37-3.2
ASEC-1.2
ASEG48-1.2
JACF37-1.1
BAMG48-3.2
JACF37-3.1
SORC-3.1 BAMG72-3.1 BAMG72-3.2
BAMG48-3.3
JACF37-2.2
ASEG72-2.3 BAMG48-3.1
ASEF37-2.1
ASEF30-1.2
BAMG48-2.2
ASEG72-2.2
SORF37-2.2 JACF37-2.1
ASEF30-1.1 BAMG72-4.1
ASEG72-2.1 BAMC-1.3.
ASEG48-1.1
BAMG48-2.3
ASEG72-3.2
BAMC-1.4
BAMG72-4.2
ASEG48-3.2
BAMG48-2.1
SORF37-2.1
ASEF37-3.2
BAMG72-2.1
SORC-2.1 SORC-2.2 ASEG72-3.1
ASEF37-3.1 BAMG72-2.2 ASEF30-2.2
BAMG72-1.2
SORC-1.2
BAMG72-1.1 SORG48-3.2
BAMG48-1.1
SORC-1.1
BAMG48-1.2
BAMF37-1.2
ASEG48-3.1 ASEF30-2.1
BAMF37-1.1
JACG72-3.2
ASEG72-1.2
SORG48-2.2
ASEG72-1.1
BAMF37-3.2 BAMF37-3.1
JACC-1.1
ASEF30-3.1
JACG48-3.2 JACC-1.2
SORG48-3.1
BAMF30-2.2
ASEG48-2.2
SORF37-3.2
JACC-3.2 JACC-2.2
BAMF30-2.1
SORF37-1.2
ASEF30-3.2
JACG48-3.1
JACF30-1.2
SORG48-2.1
ASEG48-2.1
JACC-3.1
JACF30-3.2
BAMF30-1.2
SORF30-1.2 SORF30-3.2 JACC-2.1
BAMF30-1.1
SORF37-3.1
BAMF30-3.1 BAMF30-3.2
SORF37-1.1
BAMF37-2.1
JACG48-4.2 SORG48-1.2
JACF30-3.1
BAMF37-2.2
JACF30-1.1
SORG48-1.1
SORG72-3.2 JACG72-2.2
JACG48-4.1
JACG72-2.1 SORG72-3.1 SORF30-1.1
JACG48-2.2
SORF30-3.1
SORG72-2.2 SORG72-2.1
JACG48-2.1
SORG72-1.2 SORG72-1.1
JACG72-1.1 JACG72-1.2 SORF30-2.2
JACG72-4.2 JACG72-4.1 JACF30-2.1
SORF30-2.1
JACF30-2.2 JACG72-3.1
JACG48-1.1 JACG48-1.2
Scores PC#1 (58.345%)
PCA Scores [Model 1]
MUCC-1.1 MUCC-1.2
MUCC-3.2
MUCC-2.1 MUCC-2.2
MUCC-3.1
ANIC-2.1 ANIC-2.2
ANIG48-1.1 ANIG48-1.3 ANIG48-1.2
ANIC-1.2 ANIC-1.1
ANIC-3.2
MUCG72-1.2
ANIC-3.1
ANIG48-2.1 ANIG48-2.2 ANIG72-3.1
MUCG72-1.1
ANIG48-3.1 ANIG72-3.2
ANIF37-3.1
ANIG48-3.2
ANIF37-3.2
MUCG48-3.1 MUCG48-3.2
ANIG72-2.2
ANIF37-1.2 ANIF37-1.1
ANIG72-2.1
MUCG48-1.1 MUCG48-1.2
MUCF37-3.1 ANIF37-2.2
MUCF30-1.2
MUCF37-1.2
MUCF37-2.2
ANIG72-1.2
ANIF37-2.1
ANIG72-1.1
MUCF30-2.2
MUCF37-3.2
MUCF30-3.2
MUCF37-2.1
MUCF30-2.1 MUCF30-1.1 ANIF30-1.2 ANIF30-1.1
MUCF37-1.1
MUCF30-3.1 ANIF30-2.2 ANIF30-2.1 ANIF30-3.2 ANIF30-3.1
MUCG48-2.3
MUCG72-2.2 MUCG72-2.1
MUCG72-3.2
MUCG48-2.1 MUCG48-2.2
MUCG72-3.1
Score
s P
C#3 (
4.4
52%
)
S o y b e a n - A n i d a s o
C o w p e a - A s t e n a p a
B a m b a r a g r o u n d n u t
V e l v e t b e a n - M u c u n a
C o w p e a - S o r o n k o
J a c k b e a n
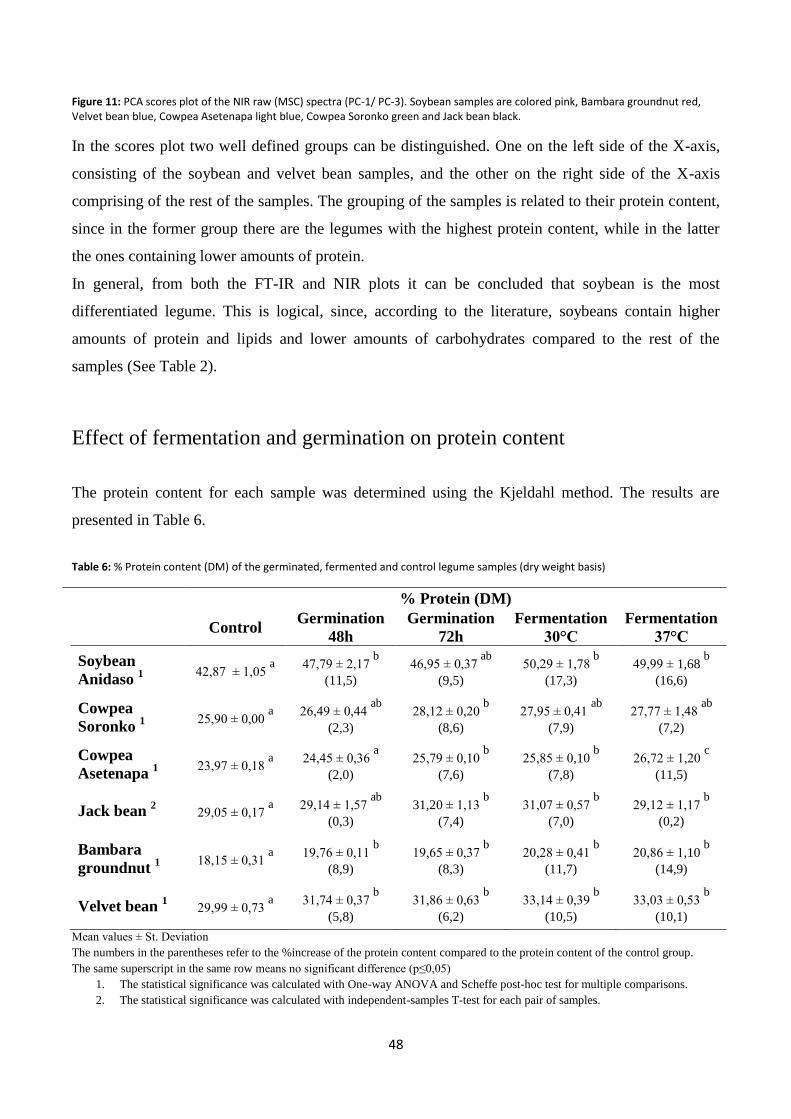
48
Figure 11: PCA scores plot of the NIR raw (MSC) spectra (PC-1/ PC-3). Soybean samples are colored pink, Bambara groundnut red, Velvet bean blue, Cowpea Asetenapa light blue, Cowpea Soronko green and Jack bean black.
In the scores plot two well defined groups can be distinguished. One on the left side of the X-axis,
consisting of the soybean and velvet bean samples, and the other on the right side of the X-axis
comprising of the rest of the samples. The grouping of the samples is related to their protein content,
since in the former group there are the legumes with the highest protein content, while in the latter
the ones containing lower amounts of protein.
In general, from both the FT-IR and NIR plots it can be concluded that soybean is the most
differentiated legume. This is logical, since, according to the literature, soybeans contain higher
amounts of protein and lipids and lower amounts of carbohydrates compared to the rest of the
samples (See Table 2).
Effect of fermentation and germination on protein content
The protein content for each sample was determined using the Kjeldahl method. The results are
presented in Table 6.
Table 6: % Protein content (DM) of the germinated, fermented and control legume samples (dry weight basis)
% Protein (DM)
Control Germination
48h
Germination
72h
Fermentation
30°C
Fermentation
37°C
Soybean
Anidaso 1 42,87 ± 1,05
a 47,79 ± 2,17 b
(11,5)
46,95 ± 0,37 ab
(9,5)
50,29 ± 1,78 b
(17,3)
49,99 ± 1,68 b
(16,6)
Cowpea
Soronko 1
25,90 ± 0,00 a
26,49 ± 0,44 ab
(2,3)
28,12 ± 0,20 b
(8,6)
27,95 ± 0,41 ab
(7,9)
27,77 ± 1,48 ab
(7,2)
Cowpea
Asetenapa 1
23,97 ± 0,18 a
24,45 ± 0,36 a
(2,0)
25,79 ± 0,10 b
(7,6)
25,85 ± 0,10 b
(7,8)
26,72 ± 1,20 c
(11,5)
Jack bean 2 29,05 ± 0,17
a
29,14 ± 1,57 ab
(0,3)
31,20 ± 1,13 b
(7,4)
31,07 ± 0,57 b
(7,0)
29,12 ± 1,17 b
(0,2)
Bambara
groundnut 1
18,15 ± 0,31 a
19,76 ± 0,11 b
(8,9)
19,65 ± 0,37 b
(8,3)
20,28 ± 0,41 b
(11,7)
20,86 ± 1,10 b
(14,9)
Velvet bean 1 29,99 ± 0,73
a
31,74 ± 0,37 b
(5,8)
31,86 ± 0,63 b
(6,2)
33,14 ± 0,39 b
(10,5)
33,03 ± 0,53 b
(10,1)
Mean values ± St. Deviation
The numbers in the parentheses refer to the %increase of the protein content compared to the protein content of the control group.
The same superscript in the same row means no significant difference (p≤0,05)
1. The statistical significance was calculated with One-way ANOVA and Scheffe post-hoc test for multiple comparisons.
2. The statistical significance was calculated with independent-samples T-test for each pair of samples.
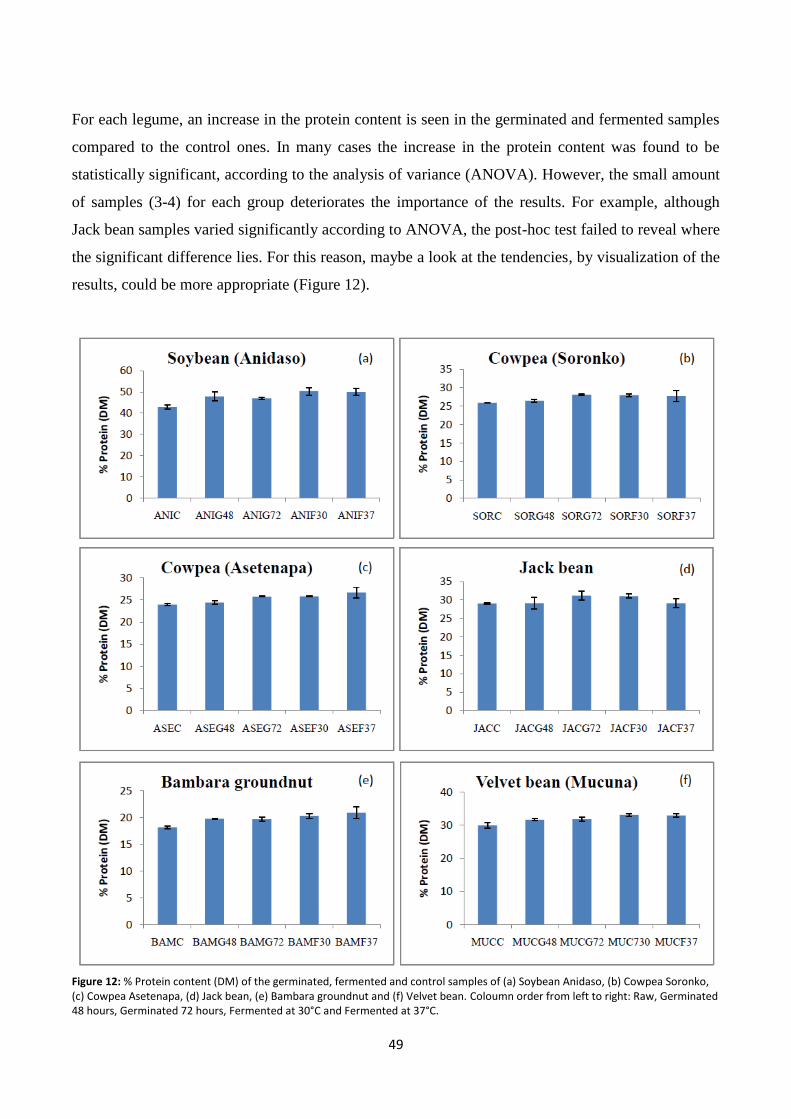
49
For each legume, an increase in the protein content is seen in the germinated and fermented samples
compared to the control ones. In many cases the increase in the protein content was found to be
statistically significant, according to the analysis of variance (ANOVA). However, the small amount
of samples (3-4) for each group deteriorates the importance of the results. For example, although
Jack bean samples varied significantly according to ANOVA, the post-hoc test failed to reveal where
the significant difference lies. For this reason, maybe a look at the tendencies, by visualization of the
results, could be more appropriate (Figure 12).
Figure 12: % Protein content (DM) of the germinated, fermented and control samples of (a) Soybean Anidaso, (b) Cowpea Soronko, (c) Cowpea Asetenapa, (d) Jack bean, (e) Bambara groundnut and (f) Velvet bean. Coloumn order from left to right: Raw, Germinated 48 hours, Germinated 72 hours, Fermented at 30°C and Fermented at 37°C.
50
The protein content in the germinated samples was found to be higher than the control ones, for all
legumes and this can -in most cases- already be seen from the column charts (Figure 12). This came
to no surprise; most researchers have observed an increase in the protein content of legumes, and
most of the times this increase is statistically significant (El-adawy, 2002; Ghavidel & Prakash,
2007; V. a Obatolu, 2002). Only a few found no changes (Trugo et al., 1999), or even slight decrease
(not significant) (Martínez-Villaluenga et al., 2007; Torres et al., 2007). In the present study the
highest increase in germinated samples was that of soybeans germinated for 48h (11,5%) and the
lowest at jack beans (0,3%), also at 48h. The %increase in protein content for the 48h was highly
deviating, but for 72h it was in the range of 6,2% (velvet bean) to 9,5% (soybean). The big difference
in %increase (6,3 – 7,1%) in the protein content between 48h and 72h, for jack beans and both
varieties of cowpeas, might mean that 48h are not enough for the germination of these legumes. In
general, most of the legumes exhibited higher protein contents after 72h of fermentation, rather than
48h. However, soybean and bambara groundnut had a highest protein content at 48h of germination,
compared to 72h, although the difference was not statistically significant. This is in accordance with
the results of Akpapunam et al. (1996); in their study they germinated soybeans and bambara
groundnuts for 1 – 5 days and they found an increase in the protein content up to 48h and a decrease
thereafter. Nevertheless, they removed the vegetative parts prior to the analysis, so that could be the
reason for their results.
For the fermentation, the increase observed was even higher (Figure 12). Once again, the highest
increase was observed in soybean samples fermented at 30oC (17,3%) and the lowest at jack beans
fermented at 37oC (0,2%). Mugendi & Njagi (2010) examined the effect of fermentation and
germination on the protein content of velvet beans and found that fermentation resulted in 17,87%
versus 3,13% for germination. Other than that, the results are controversial. Many researchers have
found a significant increase in protein in fermented legumes (Azeke et al., 2005; Baik & Han, 2012;
Reyes-Moreno et al., 2004); but there is also a great deal of them that observed a decreased protein
content after fermentation (Allagheny et al., 1996; Granito et al., 2005; Marisela Granito & Alvarez,
2006). The fermentation conditions and the microorganisms used in the studies varied a lot, and that
could be the reason for the contradicting results. The bacteria used in the present study was
B.subtilis, a bacteria naturally found in many traditional fermented products in Africa (Parkouda et
al., 2009).
In this study, there is no doubt that fermentation lead to elevated levels of protein. What is
inconclusive is the effect of temperature on the outcome. Some of the legumes exhibited better
results, regarding the protein content, at 30oC and other at 37
oC. An error during the experimental
work, resulted in one Cowpea Asetenapa sample being fermented for 24h at 30oC followed by 24h at
51
37oC, instead of 48h at 37
oC; nevertheless, the protein content of this sample was comparable to the
other Asetenapa samples fermented at 37oC.
Among the samples, soybeans and bambara groundnuts were the ones with the highest %protein
increase, both for germination and for fermentation, distinctively higher than that of the other
legumes. Both these legumes had the highest fat content. Fat is one of the storage compounds in
seeds that is degraded during germination (Mugendi & Njagi, 2010), and it known that Bacillus spp.
possess lipolytic activity, to a different extend depending on the strain (Ouoba et al., 2003). So,
perhaps the high protein is a result of altered protein proportion on a dry weigh basis rather than
actual increase (Akpapunam et al., 1996).
All in all, the germination and fermentation processes were deemed adequate, although
improvements could be made in the experimental procedure.
52
CONCLUSIONS
The study shows that the proximate composition (protein, fat, moisture) of the legumes examined
falls within the range according to the literature available. Soybean is the most differentiated legume,
of the ones studied, in regards to both fat and protein content, and overall according to spectroscopic
techniques (FT-IR, NIR).
Both germination and fermentation increased the protein content of the legumes considerably.
Germination for 72h resulted in higher protein levels compared to 48h of germination. In fermented
samples, the evidence on the effect of temperature in yielding higher protein contents was
inconclusive. In general fermentation brought about higher protein levels compared to germination.
Spectroscopic methods, showed a change in the protein (FT-IR) and carbohydrate (NIR) content of
the germinated and fermented samples, compared to the control ones.
PERSPECTIVES
Further investigation of the effect of temperature and time on the protein content of germinated and
fermented samples could lead to improved processing techniques.
Additionally, the determination of true protein, instead of crude protein, could be of interest since
alkaline fermentation results in elevated levels of ammonia (Allagheny et al., 1996), that could
tamper with the protein levels as determined by Kjeldahl.
Last but not least, the effect of germination and fermentation on the amino acid profile and protein
digestibility of the legumes could be of utmost importance in designing nutritious and acceptable
food products based on processed legumes.
53
BIBLIOGRAPHY
Adebowale, Y. A., Adeyemi, I. A., & Oshodi, A. A. (2005). Variability in the physicochemical,
nutritional and antinutritional attributes of six Mucuna species. Food Chemistry, 89(1), 37–48.
Adebowale, Y. A., Schwarzenbolz, U., & Henle, T. (2011). Protein Isolates from Bambara
Groundnut ( Voandzeia Subterranean L.): Chemical Characterization and Functional Properties.
International Journal of Food Properties, 14(4), 758–775.
Agbede, J. O., & Aletor, V. A. (2005). Studies of the chemical composition and protein quality
evaluation of differently processed Canavalia ensiformis and Mucuna pruriens seed flours.
Journal of Food Composition and Analysis, 18(1), 89–103.
Ahenkora, K., Dadzie, M., & Osei-Bonsu, P. (1999). Composition and functional properties of raw
and heat processed velvet bean ( Mucuna pruriens (L.) DC. var utilis) flours. International
Journal of Food Science & Technology, 34(2), 131–135.
Akpapunam, M. A., & Achinewhu, S. C. (1985). Effects of cooking, germination and fermentation
on the chemical composition of Nigerian cowpea (Vigna unguiculata). Plant Foods for Human
Nutrition, 35, 353–358.
Akpapunam, M. A., Igbedioh, S. O., & Aremo, I. (1996). Effect of malting time on chemical
composition and functional properties of soybean and bambara groundnut flours. International
Journal of Food Sciences and Nutrition, 47(1), 27–33.
Alexandratos, N. (1995). World Agriculture: Towards 2010. A FAO Study. New York: Food and
Agriculture Organisation of the United Nations and John Wiley and Sons.
Ali, M., & Kumar, S. (2000). Problems and Prospects of Pulses Research in India. Indian Farming,
50, 4–13.
Allagheny, N., Obanu, Z. A., Campbell-Platt, G., & Owens, J. D. (1996). Control of ammonia
formation during Bacillus subtilis fermentation of legumes. International Journal of Food
Microbiology, 29(2-3), 321–333.
Amarowicz, R., & Pegg, R. B. (2008). Legumes as a source of natural antioxidants. European
Journal of Lipid Science and Technology, 110(10), 865–878.
Amarteifio, J. O., Tibe, O., & Njogu, R. M. (2006). The mineral composition of bambara groundnut
(Vigna subterranea (L) Verdc) grown in Southern Africa. African Journal of Biotechnology,
5(23), 2408–2411.
Antova, G. A., Stoilova, T. D., & Ivanova, M. M. (2014). Proximate and lipid composition of
cowpea (Vigna unguiculata L.) cultivated in Bulgaria. Journal of Food Composition and
Analysis, 33(2), 146–152.
Aranda, P., Dostalova, J., Frias, J., Lopez-Jurado, M., Kozlowska, H., Pokorny, J., … Zdyunczyk, Z.
(2001). Nutrition. In C. L. Hedley (Ed.), Carbohydrates in Grain Legume Seeds. Improving
54
Nutritional Quality and Agronomic Characteristics (pp. 61–87). Wallingford, UK: CAB
International.
Arun, A., Sridhar, K., Raviraja, N., Schmidt, E., & Jung, K. (2003). Nutritional and antinutritional
components of Canavalia spp. seeds from the west coast sand dunes of India. Plant Foods for
Human Nutrition, 58(3), 1–13.
Atiim, P. (2011). Assessment of Postharvest Losses in Soybeans Production in the Builsa District in
the Upper East Region and Savelugu District in the Northern Region of Ghana. Kwame
Nkrumah University of Science and Technology.
Aykroyd, W. R., & Doughty, J. (1982). Legumes in human nutrition. Food and Agriculture
Organization of the United Nations. FAO Food Nutrition Papers, 20, 1–152.
Azeke, M. a, Fretzdorff, B., Buening-Pfaue, H., Holzapfel, W., & Betsche, T. (2005). Nutritional
value of African yambean (Sphenostylis stenocarpa L): improvement by lactic acid
fermentation. Journal of the Science of Food and Agriculture, 85(6), 963–970.
Baik, B., & Han, I. (2012). Cooking, Roasting, and Fermentation of Chickpeas, Lentils, Peas, and
Soybeans for Fortification of Leavened Bread. Cereal Chemistry, 89(6), 269–275.
Bamshaiye, O. M., Adegbola, J. A., & Bamishaiye, E. I. (2011). Bambara groundnut : an Under-
Utilized Nut in Africa. Advances in Agricultural Biotechnology, 1, 60–72.
Barampama, Z., & Simard, R. E. (1995). Effects of soaking, cooking and fermentation on
composition, in-vitro starch digestibility and nutritive value of common beans. Plant Foods for
Human Nutrition (Dordrecht, Netherlands), 48(4), 349–365.
Batten, G. D. (1998). Plant analysis using near infrared reflectance spectroscopy: the potential and
the limitations. Australian Journal of Experimental Agriculture, 38, 697–706.
Bau, H., Villaume, C., Nicolas, J.-P., & Mejean, L. (1997). Effect of germination on chemical
composition, biochemical constituents and antinutritional factors of soya bean (Glycine max)
seeds. Journal of the Science of Food and Agriculture, 73, 1–9.
Bevin, C. J., Fergusson, A. J., Perry, W. B., Janik, L. J., & Cozzolino, D. (2006). Development of a
rapid ―fingerprinting‖ system for wine authenticity by mid-infrared spectroscopy. Journal of
Agricultural and Food Chemistry, 54(26), 9713–8.
Bhat, R., & Karim, A. A. (2009). Exploring the Nutritional Potential of Wild and Underutilized
Legumes. Comprehensive Reviews in Food Science and Food Safety, 8(4), 305–331.
Blanco, M., & Villarroya, I. (2002). NIR spectroscopy: a rapid-response analytical tool. Trends in
Analytical Chemistry, 21(4), 240–250.
Bojňanská, T., Frančáková, H., Líšková, M., & Tokár, M. (2012). Legumes – The Alternative Raw
Materials For Bread Production. Journal of Microbiology, Biotechnology and Food Sciences,
1(February special issue), 876–886.
55
Bourne, L., Langenhoven, M., Steyn, K., Jooste, P., Laubscher, J., & Van der Vyver, E. (1993).
Nutrient intake in the urban African population of the Cape Peninsula, South Africa. The Brisk
study. The Central African Journal of Medicine, 39(12), 238–247.
Bressani, R., & Elfas, L. G. (1980). Nutritional values of legume crops for humans and animals. In
R. J. Summerfield & A. H. Bunting (Eds.), Advances in legume science (pp. 57–66). Londom:
FAO.
Brough, S. H., & Azam-Ali, S. N. (1992). The effect of soil moisture on the proximate composition
of bambara groundnut (Vigna subterranea (L) Verdc). Journal of the Science of Food and
Agriculture, 60(2), 197–203.
Bruun, S. W., Holm, J., Hansen, S. I., & Jacobsen, S. (2006). Application of near-infrared and
Fourier transform infrared spectroscopy in the characterization of ligand-induced conformation
changes in folate binding protein purified from bovine milk: influence of buffer type and pH.
Applied Spectroscopy, 60(7), 737–46.
Carbonaro, M., Maselli, P., & Nucara, A. (2012). Relationship between digestibility and secondary
structure of raw and thermally treated legume proteins: a Fourier transform infrared (FT-IR)
spectroscopic study. Amino Acids, 43(2), 911–921.
Champ, M. M.-J. (2002). Non-nutrient bioactive substances of pulses. The British Journal of
Nutrition, 88 Suppl 3, 307–19.
Czarnecka, M., Czarnecki, Z., Nowak, J., & Roszyk, H. (1998). Effect of lactic fermentation and
extrusion of bean and pea seeds on nutritional and functional properties. Nahrung / Food,
42(01), 7–11.
Dalgetty, D. D., & Baik, B.-K. (2003). Isolation and Characterization of Cotyledon Fibers from Peas,
Lentils, and Chickpeas. Cereal Chemistry, 80(3), 310–315.
Donangelo, C. M., Trugo, L. C., Trugo, N. M. F., & Eggum, B. O. (1995). Effect of germination of
legume seeds on chemical composition and on protein and energy utilization in rats. Food
Chemistry, 53, 23–27.
Doyle, J. J. (1994). Phylogeny of the legume family: an approach to understanding the origins of
nodulation. Annual Review of Ecology and Systematics, 25, 325–349.
El-adawy, T. A. (2002). Nutritional composition and antinutritional factors of chickpeas ( Cicer
arietinum L .) undergoing different. Plant Foods for Human Nutrition, 57, 83–97.
Ezeagu, I. E., & Gowda, L. R. (2006). Protein extractability, fractionation and amono acid
composition of some leguminous seeds found n Nigeria. Journal of Food Biochemistry, 30(1),
1–11.
Famurewa, J. A. V., & Raji, A. O. (2005). Parameters Affecting Milling Qualities of Undefatted
Soybeans ( Glycine max , l . Merill ) ( 1 ): Selected Thermal Treatment. International Journal
of Food Engineering, 1(4), 1–9.
56
FAO. (2014). FAO Statistical Yearbook 2014 - Africa Food and Agriculture. Accra: Food and
Angriculture Organization of the United Nations, Regional Office for Africa.
FAO/WHO. (1990). Protein quality evaluation. Report of a joint FAO/WHO expert consultation.
Bethesda, MD, 4 - 8 December 1989.
Farzana, W., & Khalil, I. A. (1999). Protein quality of tropical food legumes. Journal of Science and
Technology, 23, 13–19.
Fasoyiro, S. B., Ajibade, S. R., Omole, a. J., Adeniyan, O. N., & Farinde, E. O. (2006). Proximate,
minerals and antinutritional factors of some underutilized grain legumes in south-western
Nigeria. Nutrition & Food Science, 36(1), 18–23.
Ghavidel, R. A., & Prakash, J. (2007). The impact of germination and dehulling on nutrients,
antinutrients, in vitro iron and calcium bioavailability and in vitro starch and protein
digestibility of some legume seeds. LWT - Food Science and Technology, 40(7), 1292–1299.
Gómez, C. (2004). Cowpea: Post-harvest Operations. Rome, Italy: Food and Agriculture
Organisation of United Nations.
Granito, M., & Alvarez, G. (2006). Lactic acid fermentation of black beans (Phaseolus vulgaris) :
microbiological and chemical characterization. Journal of the Science of Food and Agriculture,
86, 1164–1171.
Granito, M., Torres, A., Frias, J., Guerra, M., & Vidal-Valverde, C. (2005). Influence of
fermentation on the nutritional value of two varieties of Vigna sinensis. European Food
Research and Technology, 220(2), 176–181.
Grusak, M. A. (2002). Enhancing Mineral Content in Plant Food Products. Journal of the American
College of Nutrition, 21(sup3), 178S–183S.
Guillon, F., & Champ, M. (1996). Grain Legumes and Transit in Humans. Grain Legumes AEP, 11,
18.
Gulewicz, P., Martínez-Villaluenga, C., Frias, J., Ciesiołka, D., Gulewicz, K., & Vidal-Valverde, C.
(2008). Effect of germination on the protein fraction composition of different lupin seeds. Food
Chemistry, 107(2), 830–844.
Hansen, E. B. (2004). Microorganisms. In Y. H. Hui (Ed.), Handbook of food and beverage
fermentation technology (pp. 10–26). New York: Marcel Dekker.
Hillocks, Bennett, C., & Mponda, O. M. (2012). Bambara nut: A review of utilization, market
potential and crop improvement. African Crop Science Journal, 20(1), 1–16.
Holse, M., Larsen, F. H., Hansen, Å., & Engelsen, S. B. (2011). Characterization of marama bean
(Tylosema esculentum) by comparative spectroscopy: NMR, FT-Raman, FT-IR and NIR. Food
Research International, 44(1), 373–384.
57
Honfoga, B. G., & van den Boom, G. J. (2003). Food-consumption patterns in central West Africa,
1961 to 2000, and challenges to combating malnutrition. Food and Nutrition Bulletin, 24(2),
167–82.
Hui, Y. H. (2012). Fermented Plant Products and Their Manufacturing. In Y. H. Hui, E. Ö. Evranuz,
& F. N. Arroyo-López (Eds.), Handbook of Plant-Based Fermented Food and Beverage
Technology (2nd ed., pp. 3–21). Boca Raton, Fla.: CRC Press.
Iqbal, A., Khalil, I. a., Ateeq, N., & Sayyar Khan, M. (2006). Nutritional quality of important food
legumes. Food Chemistry, 97(2), 331–335.
James, C. S. (1995). Analytical chemistry of foods (pp. 39–80). New York, USA: Chapman and Hall
Publishers.
Josephine, M. R., & Janardhanan, K. (1992). Studies on chemical composition and anti-nutritional
factors in three germplasm seed materials of the tribe pulse, Mucuna pruriens (L.) DC. Journal
of Food Chemistry, 43, 13–18.
Josephsen, J., & Jespersen, L. (2004). Starter Cultures and Fermented Products. In Y. H. Hui (Ed.),
Handbook of food and beverage fermentation technology (pp. 27–59). New York: Marcel
Dekker.
Kabagambe, E. K., Baylin, A., Ruiz-Narvarez, E., Siles, X., & Campos, H. (2005). Decreased
consumption of dried mature beans is positively associated with urbanization and nonfatal acute
myocardial infarction. The Journal of Nutrition, 135(7), 1770–1775.
Kayembe, N. C., & Van Rensburg, C. J. (2013). Germination as a processing technique for soybeans
in small-scale farming. South African Journal of Animal Science, 43(2), 167–173.
Khattab, R. Y., Arntfield, S. D., & Nyachoti, C. M. (2009). Nutritional quality of legume seeds as
affected by some physical treatments, Part 1: Protein quality evaluation. LWT - Food Science
and Technology, 42(6), 1107–1112.
Kiers, J. L., Nout, R. M. J., & Rombouts, F. M. (2000). In vitro digestibility of processed and
fermented soya bean , cowpea and maize. Journal of the Science of Food and Agriculture,
1331(January), 1325–1331.
Kiers, J. L., Van Laeken, a E., Rombouts, F. M., & Nout, M. J. (2000). In vitro digestibility of
Bacillus fermented soya bean. International Journal of Food Microbiology, 60(2-3), 163–9.
Kolapo, A. L. (2011). Soybean : Africa ‘ s Potential Cinderella Food Crop. In Prof. Tzi-Bun Ng
(Ed.), Soybean - Biochemistry, Chemistry and Physiology. InTech.
Kolapo, A. L., & Oladimeji, G. R. (2008). Production and quality evaluation of Soy-corn milk.
Journal of Applied Biosciences, 1(2), 40–45.
Kolapo, A. L., & Sanni, M. O. (2009). A comparative evaluation of the macronutrient and
micronutrient profiles of soybean-fortified gari and tapioca. Food and Nutrition Bulletin, 30(1),
90–94.
58
Kuo, Y.-H., Rozan, P., Lambein, F., Frias, J., & Vidal-Valverde, C. (2004). Effects of different
germination conditions on the contents of free protein and non-protein amino acids of
commercial legumes. Food Chemistry, 86(4), 537–545.
L‘hocine, L., Boye, J., & Arcand, Y. (2006). Composition and functional properties of soy protein
isolates prepared using alternative defatting and extraction procedures. Journal of Food Science,
71, C137–C145.
Liu, S. Q. (2012). Flavors and Food Fermentation. In Y. H. Hui, E. Ö. Evranuz, & F. N. Arroyo-
López (Eds.), Handbook of Plant-Based Fermented Food and Beverage Technology (2nd ed.,
pp. 23–34). Boca Raton, Fla.: CRC Press.
Lopriore, C., & Muehlhoff, E. (2003). Food Security and Nutrition Trends in West Africa -
Challenges and the Way Forward. In Conference Paper - 2nd International Workshop on Food-
based Approaches for a Healthy Nutrition (pp. 1–24). Ouagadougou - Burkina Faso.
Marfo, E., Wallace, P., Timpo, G., & Simpson, B. (1990). Cholesterol lowering effect of jackbean
(Canavalia ensiformis) seed protein. General Pharmacology, 21(5), 753–757.
Martínez-Villaluenga, C., Gulewicz, P., Frias, J., Gulewicz, K., & Vidal-Valverde, C. (2007).
Assessment of protein fractions of three cultivars of Pisum sativum L.: effect of germination.
European Food Research and Technology, 226(6), 1465–1478.
Medic, J., Atkinson, C., & Hurburgh, C. R. (2014). Current Knowledge in Soybean Composition.
Journal of the American Oil Chemists’ Society, 91(3), 363–384. doi:10.1007/s11746-013-2407-
9
Minka, S. R., & Bruneteau, M. (2000). Partial chemical composition of bambara pea [ Vigna
subterranea ( L .) Verde ], 68, 273–276.
Mishili, F. J., Fulton, J., Shehu, M., Kushwaha, S., Marfo, K., Jamal, M., … Lowenberg-DeBoer, J.
(2009). Consumer Preferences for Guality Chracteristics Along the Cowpea Value Chain in
Nigeria, Ghana and Mali. Agribusiness, 25(1), 16–35.
Mohan, V., & Janardhanan, K. (1994). The biochemical composition and nutrient assessment of less
known pulses of the genus Canavalia. International Journal of Food Sciences and Nutrition,
45, 255–262.
Mohan, V. R., & Janardhanan, K. (1995). Chemical analysis and nutritional assessment of lesser
known pulses of the genus , Mucuna. Food Chemistry, 52, 275–280.
Morris, J. (1999). Legume genetic resources with novel ―value added‖ industrial and pharmaceutical
use. In J. Janick (Ed.), Perspectives of new crops and new uses. (pp. 196–201). Alexandria, VA:
ASHS Press.
Mugendi, J. B., & Njagi, E. M. (2010). Effects of Processing Mucuna Bean (Mucuna pruriens L.) on
Protein Quality and Anti-nutrients Content. In Tropentag 2010, Conference on International
Research on Food Security, Natural Resource Management and Rural Development. ETH
Zurich, Switzerland.
59
Murevanhema, Y. Y., & Jideani, V. a. (2013). Potential of Bambara groundnut (Vigna subterranea
(L.) Verdc) milk as a probiotic beverage-a review. Critical Reviews in Food Science and
Nutrition, 53(9), 954–967.
National Research Counsil. (2006a). Cowpea. In Lost Crops of Africa: Volume II: Vegetables (pp.
105–118). Washington, D.C.: National Academy Press.
National Research Counsil. (2006b). Bambara bean. In Lost Crops of Africa: Volume II: Vegetables
(pp. 53–74). Washington, D.C: National Academy Press.
Nell, F. J., Siebrits, F. K., & Hayes, J. P. (1992). Studies on the nutritive value of cowpeas ( Vigna
unguiculata ). South African Journal of Animal Science, 22(5), 157–160.
NRC/NAS. (1989). recomended dietary allowances. Washington: National Academic Press.
Obatolu, V. a. (2002). Nutrient and sensory qualities of extruded malted or unmalted millet/soybean
mixture. Food Chemistry, 76(2), 129–133.
Obatolu, V. A., Augustine, O., & Iken, J. E. (2007). Improvement of home-made maize tortilla with
soybean. International Journal of Food Science & Technology, 42(4), 420–426.
Ojimelukwe, P., & Ayernor, G. (1992). Oligosaccharide composite and functional properties of flour
and starch isolates from four cultivars of Bambara groundnut seeds. Journal of Food Science
and Technology, 29, 319–321.
Oliveira, A. E. A., Sales, M. P., Machado, O. L. T., Fernandes, K. V. S., & Xavier-Filho, J. (1999).
The toxicity of Jack bean ( Canavalia ensiformis ) cotyledon and seed coat proteins to the
cowpea weevil ( Callosobruchus maculatus ). Entomologia Experimentalis et Applicata, 92(3),
249–255.
Olivera-Castillo, L., Pereira-Pacheco, F., Polanco-Lugo, E., Olvera-Novoa, M., Rivas-Burgos, J., &
Grant, G. (2007). Composition and bioactive factor content of cowpea ( Vigna unguiculata L .
Walp ) raw meal and protein concentrate. Journal of the Science of Food and Agriculture, 87,
112–119.
Omafuvbe, B. ., Shonukan, O. ., & Abiose, S. . (2000). Microbiological and biochemical changes in
the traditional fermentation of soybean for ―soy-daddawa‖ — Nigerian food condiment. Food
Microbiology, 17(5), 469–474.
Onwueme, I. C., & Sinha, T. D. (1991). Soybean. In Field crop production in tropical Africa (pp.
339–343). Tropical Centre for Agricultural and Rural Corporation. The Netherlands.
Ouoba, L. I. I., Rechinger, K. B., Barkholt, V., Diawara, B., Traore, a S., & Jakobsen, M. (2003).
Degradation of proteins during the fermentation of African locust bean (Parkia biglobosa) by
strains of Bacillus subtilis and Bacillus pumilus for production of Soumbala. Journal of Applied
Microbiology, 94(3), 396–402.
Parkouda, C., Nielsen, D. S., Azokpota, P., Ouoba, L. I. I., Amoa-Awua, W. K., Thorsen, L., …
Jakobsen, M. (2009). The microbiology of alkaline-fermentation of indigenous seeds used as
food condiments in Africa and Asia. Critical Reviews in Microbiology, 35(2), 139–156.
60
Pavia, D. L., Lampman, G. M., & Kriz, G. S. (2001). Infrared Spectroscopy. In Introduction to
spectroscopy. A guide for students of organic chemistry. (3rd ed., pp. 13–29). London, UK:
Brooks/Cole, Thomson Learning.
Phillips, R. D., & McWatters, K. H. (1991). Contribution of cowpeas to nutrition and health. Food
Technology, 45(9), 127–130.
Phillips, R. D., McWatters, K. H., Chinnan, M. S., Hung, Y.-C., Beuchat, L. R., Sefa-Dedeh, S., …
Saalia, F. K. (2003). Utilization of cowpeas for human food. Field Crops Research, 82(2-3),
193–213.
Prakash, D., & Tewari, S. K. (1999). Variation of L-dopa contents in Mucuna species. Journal of
Medicinal and Aromatic Plant Science, 21, 343–346.
Pugalenthi, M., Vadivel, V., & Siddhuraju, P. (2005). Alternative food/feed perspectives of an
underutilized legume Mucuna pruriens var. utilis--a review. Plant Foods for Human Nutrition,
60(4), 201–218.
Quinn, J. (1999). Cowpea. A Versatile Legume for Hot, Dry Conditions. Thomas Jefferson Institute.
Columbia, USA.
Rajaram, N., & Janardhanan, K. (1992). Nutritional and chemical evaluation of raw seeds of
Canavalia gladiata (Jacq) DC. and C. ensiformis DC: The under utilized food and fodder crops
in India. Plant Foods for Human Nutrition, 42, 329–336.
Ramakrishna, V., Jhansi Rani, P., & Ramakrishna Rao, P. (2008). Nutritional quality of storage
proteins during germination of Indian bean (Dolichos lablab. var. lignosus) seeds. International
Journal of Food Science & Technology, 43(5), 944–949.
Rangel, A., Saraiva, K., Schwengber, P., Narciso, M. S., Domont, G. B., Ferreira, S. T., & Pedrosa,
C. (2004). Biological evaluation of a protein isolate from cowpea (Vigna unguiculata) seeds.
Food Chemistry, 87(4), 491–499.
Reyes-Moreno, C., Cuevas-Rodríguez, E., Milán-Carrillo, J., Cárdenas-Valenzuela, O., & Barrón-
Hoyos, J. (2004). Solid state fermentation process for producing chickpea(Cicer arietinum L)
tempeh flour. Physicochemical and nutritional characteristics of the product. Journal of the
Science of Food and Agriculture, 84(3), 271–278.
Rodríguez, C., Frias, J., Vidal-Valverde, C., & Hernández, A. (2008). Correlations between some
nitrogen fractions, lysine, histidine, tyrosine, and ornithine contents during the germination of
peas, beans, and lentils. Food Chemistry, 108(1), 245–252.
Salvagiotti, F., Cassman, K. G., Specht, J. E., Walters, D. T., Weiss, a., & Dobermann, a. (2008).
Nitrogen uptake, fixation and response to fertilizer N in soybeans: A review. Field Crops
Research, 108(1), 1–13.
Sandorfy, C., Buchet, R., & Lachenal, G. (2007). Principles of Molecular Vibrations for Near-
Infrared Spectroscopy. In Y. Ozaki, W. F. McClure, & A. A. Christy (Eds.), Near-Infrared
Spectroscopy in Food Science and Technology (pp. 11–46). Hoboken, N.J: Wiley-Interscience.
61
Sangronis, E., Rodríguez, M., Cava, R., & Torres, A. (2005). Protein quality of germinated
Phaseolus vulgaris. European Food Research and Technology, 222(1-2), 144–148.
Shekib, L. a. (1994). Nutritional improvement of lentils, chick pea, rice and wheat by natural
fermentation. Plant Foods for Human Nutrition (Dordrecht, Netherlands), 46(3), 201–205.
Shimelis, E. A., & Rakshit, S. K. (2007). Effect of processing on antinutrients and in vitro protein
digestibility of kidney bean (Phaseolus vulgaris L.) varieties grown in East Africa. Food
Chemistry, 103(1), 161–172.
Siddhuraju, P., & Becker, K. (2001). Species/variety differences in biochemical composition and
nutritional value of Indian tribal legumes of the genus Canavalia. Nahrung/ Food, 45(4), 224–
233.
Siddhuraju, P., & Becker, K. (2005). Nutritional and antinutritional composition, in vitro amino acid
availability, starch digestibility and predicted glycemic index of differentially processed
mucuna beans (Mucuna pruriens var. utilis): an under-utilised legume. Food Chemistry, 91(2),
275–286.
Siddhuraju, P., Vijayakumari, K., & Janardhanan, K. (1996). Chemical composition and protein
quality of the little-known legume, velvet bean (Mucuna pruriens (L) DC). Journal of
Agricultural and Food Chemistry, 44(9), 2636–2641.
Sirtori, C. R., & Lovati, M. R. (2001). Soy Proteins and Cardiovascular Disease. Current
Atherosclerosis Reports, 3, 47–53.
Smartt, J. (1990). Minor grain legumes. In Grain Legumes. Evolution and Genetic Resources. (pp.
294–309). Cambridge, UK: Cambridge University Press.
Smit, G., Wouters, J. T. M., & Meijer, W. C. (2004). Quality and Flavor of Fermented Products. In
Y. H. Hui (Ed.), Handbook of food and beverage fermentation technology (pp. 105–130). New
York: Marcel Dekker.
Sridhar, K. R., & Seena, S. (2006). Nutritional and antinutritional significance of four
unconventional legumes of the genus Canavalia – A comparative study. Food Chemistry, 99(2),
267–288.
Starzynska-Janiszewska, A., Stodolak, B., Dulinski, R., & Mickowska, B. (2012). The influence of
inoculum composition on selected bioactive and nutritional parameters of grass pea tempeh
obtained by mixed-culture fermentation with Rhizopus oligosporus and Aspergillus oryzae
strains. Food Science and Technology International = Ciencia Y Tecnología de Los Alimentos
Internacional, 18(2), 113–122.
Stodolak, B., & Starzynska-Janiszewska, A. (2008). The influence of tempeh fermentation and
conventional cooking on anti-nutrient level and protein bioavailability (in vitro test ) of grass-
pea seeds. Journal of the Science of Food and Agriculture, 2270(October 2007), 2265–2270.
Tharanathan, R. ., & Mahadevamma, S. (2003). Grain legumes—a boon to human nutrition. Trends
in Food Science & Technology, 14(12), 507–518.
62
Torres, A., Frias, J., Granito, M., & Vidal-Valverde, C. (2007). Germinated Cajanus cajan seeds as
ingredients in pasta products: Chemical, biological and sensory evaluation. Food Chemistry,
101(1), 202–211.
Trugo, L., Muzquiz, M., Pedrosa, M., Ayet, G., Burbano, C., Cuadrado, C., & Cavieres, E. (1999).
Influence of malting on selected components of soya bean, black bean, chickpea and barley.
Food Chemistry, 65, 85–90.
Udedibie, A. B. I. (1990). Nutritional Evaluation of Jackbean (Canavalia ensiformis) for the Nigerian
Poultry Industry. Ambio, 19(8), 361–365.
Udensi, E., Ekwu, F., & Isinguzo, J. (2007). Antinutrient factors of vegetable cowpea (Sesquipedalis)
seeds during thermal processing. Pakistan Journal of Nutrition, 6(2), 194–197.
Udensi, E., Onwuka, G., & Oyewer, C. (2005). Effect of autoclaving and boiling on some
antinutritional factors in Mucuna Sloanie. Nigerian Food Journal, 23, 53–58.
Uppal, V., & Bains, K. (2012). Effect of germination periods and hydrothermal treatments on in vitro
protein and starch digestibility of germinated legumes. Journal of Food Science and
Technology, 49(2), 184–91.
Urbano, G., Aranda, P., Vilchez, A., Aranda, C., Cabrera, L., Porres, J., & Lopez-Jurado, M. (2005).
Effects of germination on the composition and nutritive value of proteins in , L. Food
Chemistry, 93(4), 671–679.
Urbano, G., López-Jurado, M., Frejnagel, S., Gómez-Villalva, E., Porres, J. M., Frías, J., … Aranda,
P. (2005). Nutritional assessment of raw and germinated pea (Pisum sativum L.) protein and
carbohydrate by in vitro and in vivo techniques. Nutrition (Burbank, Los Angeles County,
Calif.), 21(2), 230–9.
USDA. (2013). National Nutrient Database for Standard Reference, Release 26. Nutrient Data
Laboratory Home Page. Retrieved August 15, 2014, from http://www.ars.usda.gov/ba/bhnrc/ndl
Utrilla-Coello, R. G., Osorio-Diaz, P., & Bello-Perez, L. a. (2007). Alternative Use of Chickpea
Flour in Breadmaking: Chemical Composition and Starch Digestibility of Bread. Food Science
and Technology International, 13(4), 323–327.
Vadivel, V., & Janardhanan, K. (2000). Nutritional and anti-nutritional composition of velvet bean:
an under-utilized food legume in South India. International Journal of Food Sciences and
Nutrition, 51, 279–287.
Vadivel, V., & Janardhanan, K. (2001). Diversity in nutritional composition of wild jack bean
(Canavalia ensiformis L. DC) seeds collected from south India. Food Chemistry, 74(4), 507–
511.
Vidal-Valverde, C., Frias, J., Sierra, I., Blazquez, I., Lambein, F., & Kuo, Y.-H. (2002). New
functional legume foods by germination: effect on the nutritive value of beans, lentils and peas.
European Food Research and Technology, 215(6), 472–477.
63
Walker, A. R. (1996). The nutritional challenges in the new South Africa. Nutrition Research
Reviews, 9(1), 33–65.
Walker, A. R., & Segal, L. (1997). Health/ill-health transition in less privileged populations: what
does the future hold? Journal of the Royal College of Physicians of London, 31(4), 392–395.
Wang, T. L., Bogracheva, T. Y., & Hedley, C. L. (1998). Starch : as simple as A , B , C ? Journal of
Experimental Botany, 49, 481–502.
Wang, T. L., Domoney, C., Hedley, C. L., Casey, R., Grusak, M. A., Centre, J. I., … W, U. K. T. L.
(2003). Can We Improve the Nutritional Quality of Legume Seeds ? Plant Physiology,
131(March), 886–891.
Weaver, L. (1994). Feeding the weanling in the developing world: problems and solutions.
International Journal of Food Sciences and Nutrition, 45(2), 127–134.
Yamada, C., Izumi, H., Hirano, J., Mizukuchi, A., Kise, M., Matsuda, T., & Kato, Y. (2005).
Degradation of soluble proteins including some allergens in brown rice grains by endogenous
proteolytic activity during germination and heat-processing. Bioscience, Biotechnology, and
Biochemistry, 69(10), 1877–83.
Yusuf, a. a., Ayedun, H., & Sanni, L. O. (2008). Chemical composition and functional properties of
raw and roasted Nigerian benniseed (Sesamum indicum) and bambara groundnut (Vigna
subterranean). Food Chemistry, 111(2), 277–282.
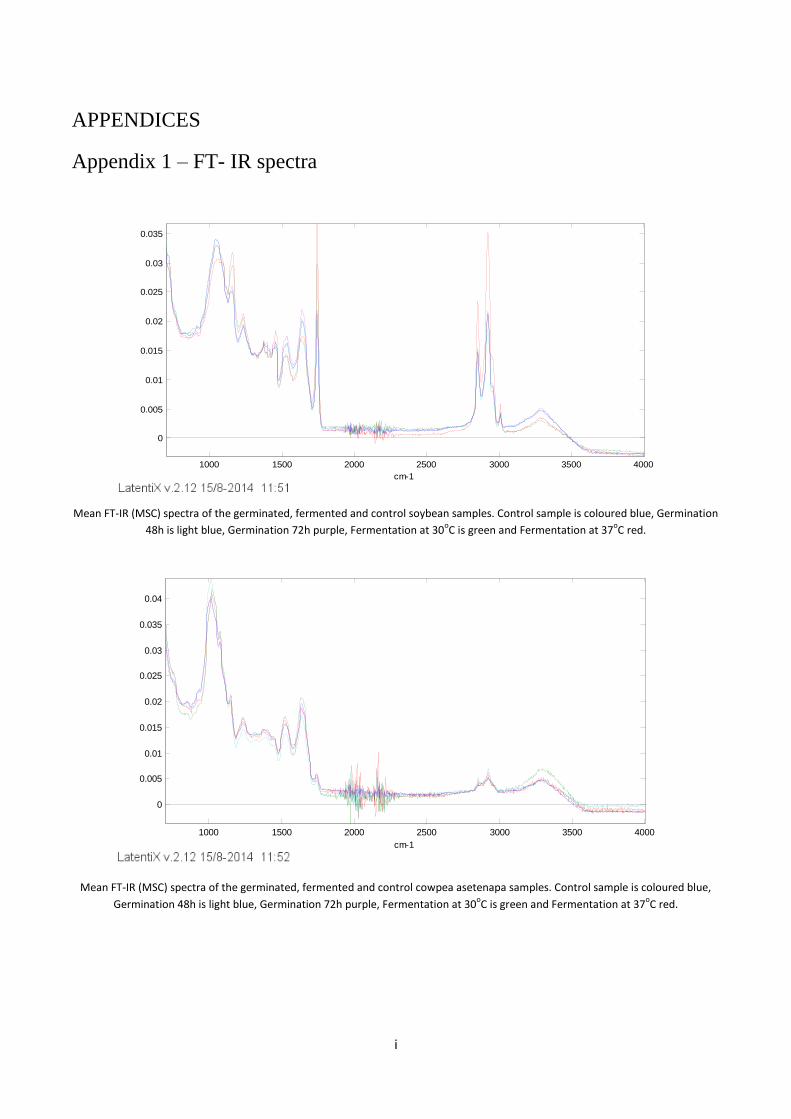
i
APPENDICES
Appendix 1 – FT- IR spectra
Mean FT-IR (MSC) spectra of the germinated, fermented and control soybean samples. Control sample is coloured blue, Germination
48h is light blue, Germination 72h purple, Fermentation at 30oC is green and Fermentation at 37
oC red.
Mean FT-IR (MSC) spectra of the germinated, fermented and control cowpea asetenapa samples. Control sample is coloured blue,
Germination 48h is light blue, Germination 72h purple, Fermentation at 30oC is green and Fermentation at 37
oC red.
1000 1500 2000 2500 3000 3500 4000
0
0.005
0.01
0.015
0.02
0.025
0.03
0.035
cm-1
1000 1500 2000 2500 3000 3500 4000
0
0.005
0.01
0.015
0.02
0.025
0.03
0.035
0.04
cm-1
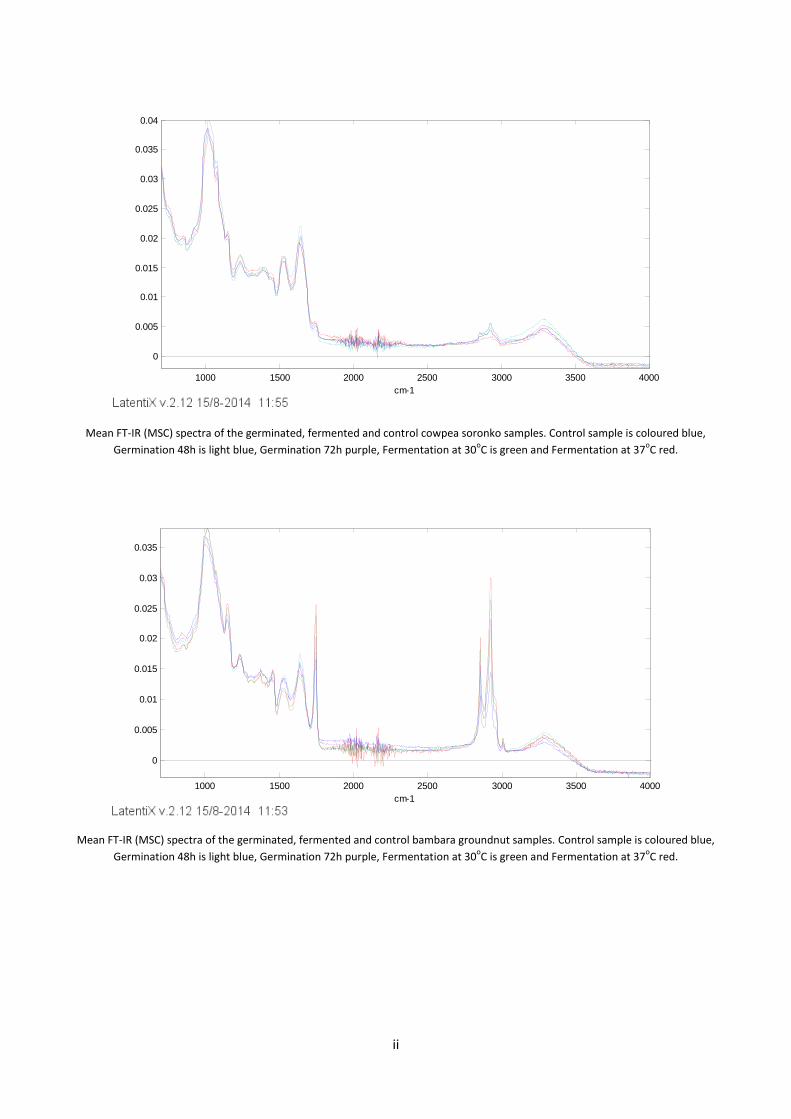
ii
Mean FT-IR (MSC) spectra of the germinated, fermented and control cowpea soronko samples. Control sample is coloured blue,
Germination 48h is light blue, Germination 72h purple, Fermentation at 30oC is green and Fermentation at 37
oC red.
Mean FT-IR (MSC) spectra of the germinated, fermented and control bambara groundnut samples. Control sample is coloured blue,
Germination 48h is light blue, Germination 72h purple, Fermentation at 30oC is green and Fermentation at 37
oC red.
1000 1500 2000 2500 3000 3500 4000
0
0.005
0.01
0.015
0.02
0.025
0.03
0.035
0.04
cm-1
1000 1500 2000 2500 3000 3500 4000
0
0.005
0.01
0.015
0.02
0.025
0.03
0.035
cm-1
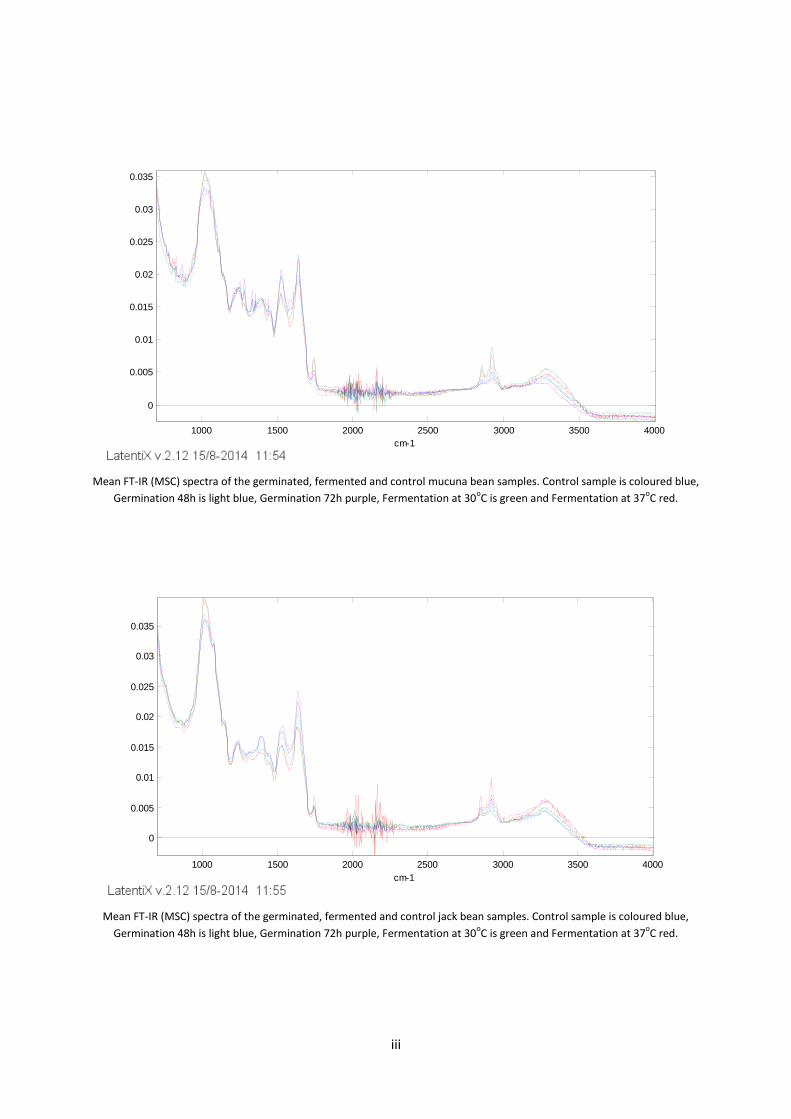
iii
Mean FT-IR (MSC) spectra of the germinated, fermented and control mucuna bean samples. Control sample is coloured blue,
Germination 48h is light blue, Germination 72h purple, Fermentation at 30oC is green and Fermentation at 37
oC red.
Mean FT-IR (MSC) spectra of the germinated, fermented and control jack bean samples. Control sample is coloured blue,
Germination 48h is light blue, Germination 72h purple, Fermentation at 30oC is green and Fermentation at 37
oC red.
1000 1500 2000 2500 3000 3500 4000
0
0.005
0.01
0.015
0.02
0.025
0.03
0.035
cm-1
1000 1500 2000 2500 3000 3500 4000
0
0.005
0.01
0.015
0.02
0.025
0.03
0.035
cm-1
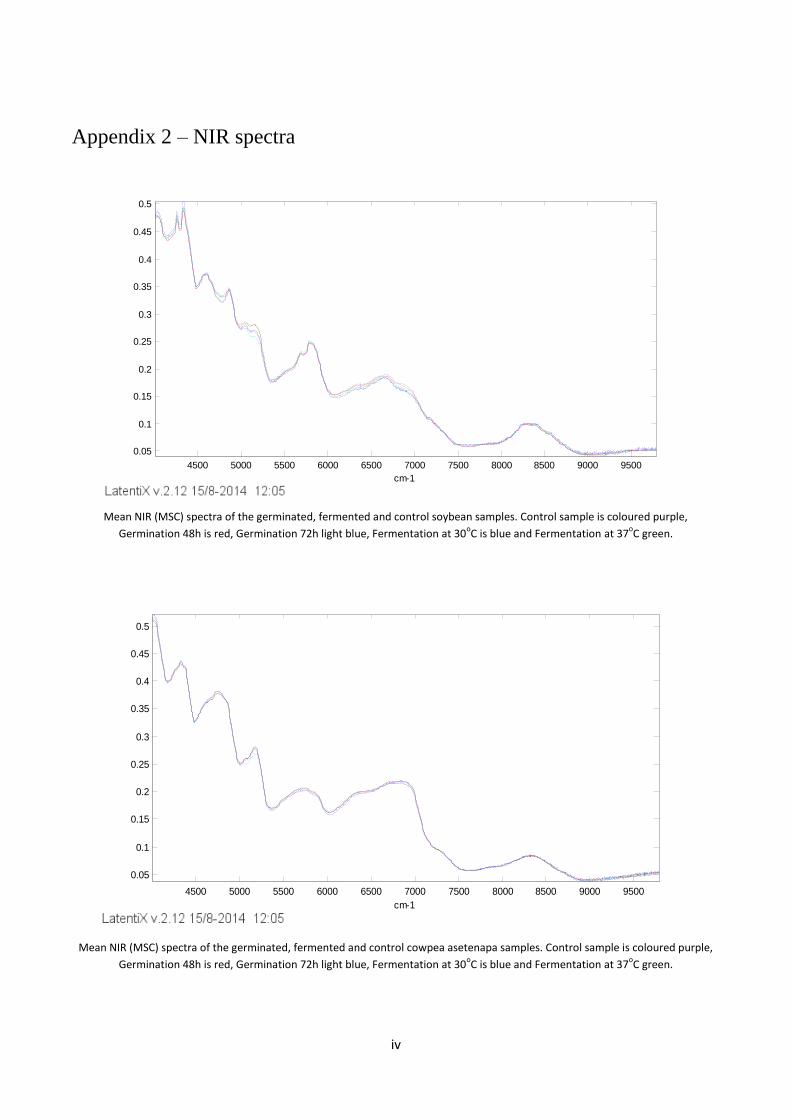
iv
Appendix 2 – NIR spectra
Mean NIR (MSC) spectra of the germinated, fermented and control soybean samples. Control sample is coloured purple,
Germination 48h is red, Germination 72h light blue, Fermentation at 30oC is blue and Fermentation at 37
oC green.
Mean NIR (MSC) spectra of the germinated, fermented and control cowpea asetenapa samples. Control sample is coloured purple,
Germination 48h is red, Germination 72h light blue, Fermentation at 30oC is blue and Fermentation at 37
oC green.
4500 5000 5500 6000 6500 7000 7500 8000 8500 9000 9500
0.05
0.1
0.15
0.2
0.25
0.3
0.35
0.4
0.45
0.5
cm-1
4500 5000 5500 6000 6500 7000 7500 8000 8500 9000 9500
0.05
0.1
0.15
0.2
0.25
0.3
0.35
0.4
0.45
0.5
cm-1
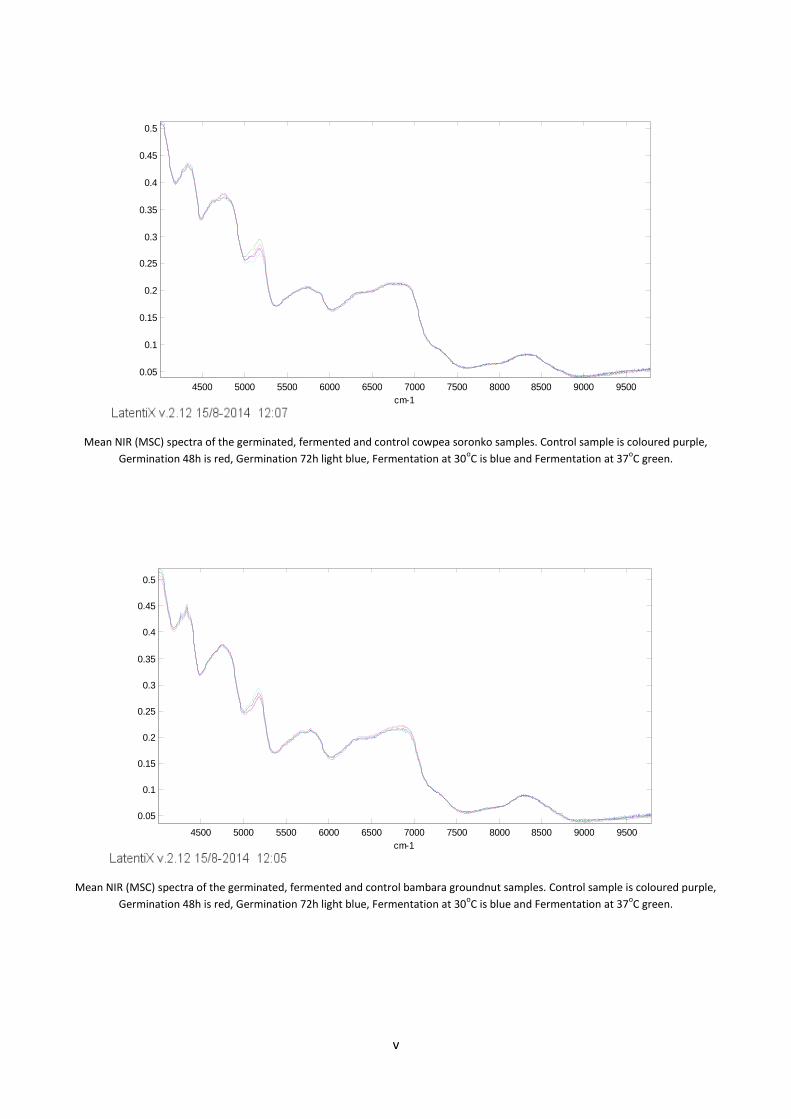
v
Mean NIR (MSC) spectra of the germinated, fermented and control cowpea soronko samples. Control sample is coloured purple,
Germination 48h is red, Germination 72h light blue, Fermentation at 30oC is blue and Fermentation at 37
oC green.
Mean NIR (MSC) spectra of the germinated, fermented and control bambara groundnut samples. Control sample is coloured purple,
Germination 48h is red, Germination 72h light blue, Fermentation at 30oC is blue and Fermentation at 37
oC green.
4500 5000 5500 6000 6500 7000 7500 8000 8500 9000 9500
0.05
0.1
0.15
0.2
0.25
0.3
0.35
0.4
0.45
0.5
cm-1
4500 5000 5500 6000 6500 7000 7500 8000 8500 9000 9500
0.05
0.1
0.15
0.2
0.25
0.3
0.35
0.4
0.45
0.5
cm-1
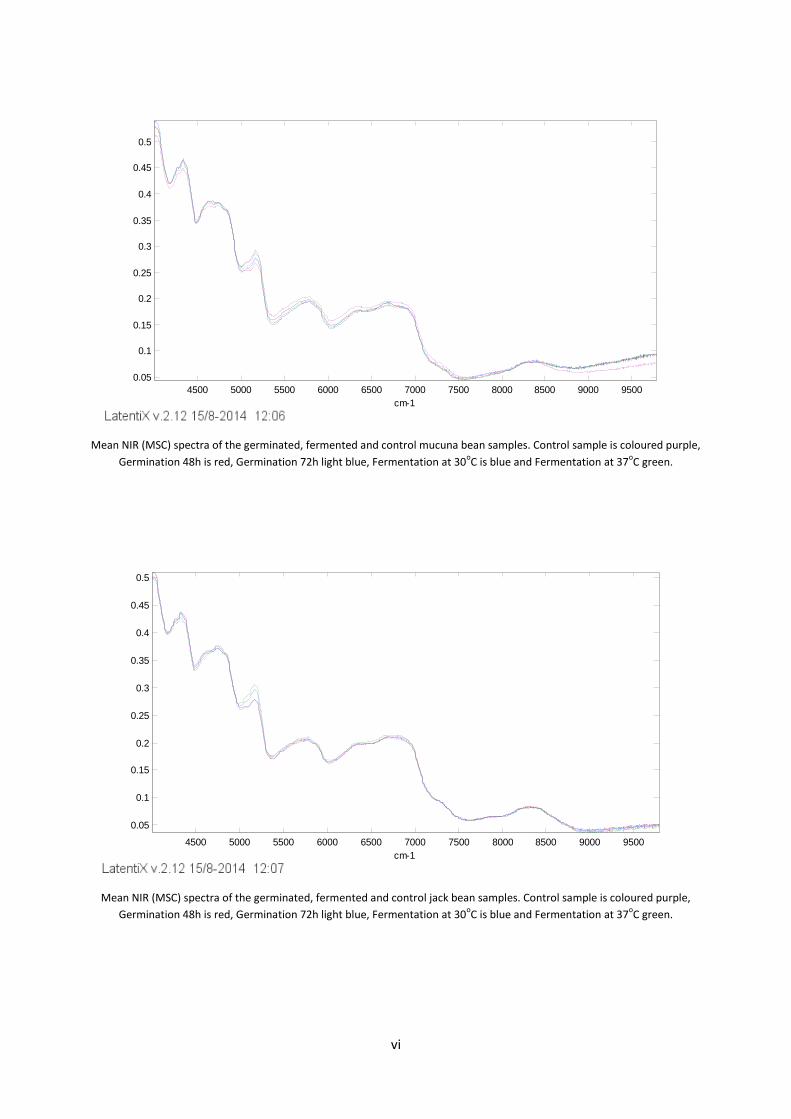
vi
Mean NIR (MSC) spectra of the germinated, fermented and control mucuna bean samples. Control sample is coloured purple,
Germination 48h is red, Germination 72h light blue, Fermentation at 30oC is blue and Fermentation at 37
oC green.
Mean NIR (MSC) spectra of the germinated, fermented and control jack bean samples. Control sample is coloured purple,
Germination 48h is red, Germination 72h light blue, Fermentation at 30oC is blue and Fermentation at 37
oC green.
4500 5000 5500 6000 6500 7000 7500 8000 8500 9000 9500
0.05
0.1
0.15
0.2
0.25
0.3
0.35
0.4
0.45
0.5
cm-1
4500 5000 5500 6000 6500 7000 7500 8000 8500 9000 9500
0.05
0.1
0.15
0.2
0.25
0.3
0.35
0.4
0.45
0.5
cm-1