Embed Size (px)
Citation preview
IJER © Serials Publications12(4), 2015: 1371-1393
ISSN: 0972-9380
EFFECT OF SOVEREIGN RATING CHANGESON REAL BONDS YIELDS RETURNS
Abstract: Many countries have experienced one after another downgrade of the sovereignratings in past fewyears, due to the Asian financial crisis, Euro Zone and the Global financialcrisis. These capital markets and their countries currency exchange rate reacted immediatelywith high lost couple with sharp depreciation of their currency against major foreignexchanges. Therefore, the main objective of this study is to investigate the effect of sovereignrating changes on bond market returns control for inflation. The importance of sovereignratings and the growing bond markets are the main motivation for this study. This paperanalyses the risk and return relationship of 30 major bond markets which account for 80percent of world GDP. This paper studies two categories of bond with different maturityperiod which are 1 year bond and 10 years bond. This study collects bond yield (YTM) forcontinuous five years (2007-2011) and the final sample consist of total number of 150observations for each category of bond. The relationship between bond yields, inflation ratesand real yields or inflation adjusted bond yields are examined based on individual observationand portfolio. Findings of portfolios analysis show that all the observations grouped intoportfolio, there is negative relationship between sovereign rating and bond yield and positiverelationship between inflation rate and bond yield. Finally, hypothesis that test on therelationship between sovereign ratings and real yields is rejected.Keywords: sovereign rating, sovereign rating changes, bond yields, inflation rates andreal yields, portfolio analysis.JEL Classification: G21
1. INTRODUCTION
International investors take the advantage of global diversification and invest in bothdeveloped and emerging countries. Consequently, investors need valuable informationthat represents the global marketplace and act as a benchmarking instrument for themto evaluate those markets. As a result, sovereign credit ratings start to play importantrole in assessing sovereign bond market. Greater dependency has been allocated onsovereign credit ratings by investors, regulators and relevant parties.
1 Associate Professor, 2ProfessorFaculty Economics and Management, University Putra Malaysia, 43400 UPM, Serdang, Selangor,Malaysia, E-mail: [email protected]

1372 Cheng Fan Fah, Lim Li Hsia and Annuar Nasir
In the recent worldwide economic crisis, the negative influence in capital marketand at the downgrading by the rating agencies had also adjusted the sovereign ratingfor countries. Significantly, financial and economic crisis since year 2008 until presenthas influence on the sovereign default risks in most countries. Announcement ofsovereign credits ratings by rating agencies lately, especially in European Unioncountries, had become important motivation of this research. Therefore, it is importantto identify the connection between changes of sovereign rating and yield to maturity(measure of bond market returns).
After Mexican economic downturn in year 1994, following with Asia financialcrisis in year 1997 and worldwide financial crisis in year 2008. Sovereign rating hasagain influenced the capital market globally. President of World Bank, Robert Zoellickindicates that Euro Zone crisis may deepen and threaten global economy with creationof ripple effect. Moreover, Li, Jeon, Cho and Chiang (2007) suggested that there issignificant connection between sovereign rating changes and Asia economic crisis in1997.
In the past, sovereign debt crisis rarely occur in developed countries (Reinhart,2010); conversely sovereign rating changes does not preserve as an erratic issuenowadays. The most eye catching issue was sovereign rating of United Statesgovernment bond downgraded by Standard & Poor’s (S&P) on 5th August 2011 for thefirst time after almost 90 years since United States ranked the top spot in 1971. Onenotch drop from AAA to AA+ mainly caused by failure of congress in budget tighteningand government spending cut. According to S&P, this decision taken after theyconsidered spending cut for US$2.1 trillion on 2nd August is unsatisfactory and thisamount is not enough to stabilize its debt.
After US sovereign rating downgraded by S&P, more sovereign rating continuouslybeing announced. After 13years, New Zealand faces its rating downgraded by bothFitch and S&P due to its high external debt on September. On 14th October 2011, Spainrating’s downgraded by rating agencies due to its high unemployment, economicslowdown and high private sector debt. Moreover, countries such as Greece, Japan(one notch), and Portugal (become junk status) faced ratings cut by rating agenciesand lastly Italy had being downgraded by three notches.
Generally, there are two alternatives capital market for investors to invest theirextra income, which include stock market and bond market. According to Cheng andAriff (2011), bond market capitalization consists of US$ 154 trillion whereas sharemarket consists of US$ 45trillion. Obviously, this amount shows that bond markets ismassive and act as an important platform for investors to generate income. The mostprecise proxy in measure bond returns goes to yield to maturity (YTM), which is bondyield, where it depends on maturity period and predominant interest rate (Ariff, Chengand Neoh, 2008). There are plenty of literature that studied on ratings changes andbond spread (see Kraussl, 2005; Afonso et al., 2011; Ismailescu and Hossein, 2010),which said to be more ostensibly. However, previous researches do not include

Effect of Sovereign Rating Changes on Real Bonds Yields Returns 1373
relationship between bond yields and sovereign rating changes in their studies.Therefore, the main purpose of this study is to investigate the effect of sovereignchanges on bond yields.
Malaysia has just experienced another downgrade of the sovereign rating lastmonths, our capital market and currency exchange rate reacted immediately withhigh loses in Bursa Malaysia couple with sharp depreciation of our currency againstmajor foreign exchanges. The effect is still being felt until today of writing (22/8/2013). Our Bank Negara has revised the GDP forecast for this year (New Strait Time,22/8/2013). The issue of sovereign rating change is very much at home, not somethinghappening at other part of the world. Therefore it is important for us to study the linkbetween sovereign ratings and rating changes to the bond yields and economicvariables.
Therefore, the problems are to identify these reactions on the directions, magnitudesand duration of these effects. This preliminary study is a modest attempt to understandthe behavior of investors’ reactions in short term and long term on the bond yieldscontrol by inflation.
2. LITERATURE REVIEW
2.1. Determinants of Sovereign Rating
Saunders (1986) argued macroeconomic variables of countries treated as “new”information in examine sovereign default. Besides that, Cantor and Parker (1996a)examined eight economic variables from 49 countries as determinants of ratingsencompassed by S&P and Moodys. Analysis proved that both agencies highlyconsistent in assigning sovereign rating by watching the macroeconomic fundamentsand there are six macroeconomic factors show significant result by applying ordinaryleast square as techniques of analysis.
This area is revised by Bheenick (2005) to assess the determinants of sovereignrating in economic aspect mentioned by both rating agencies. However, method usedby Bheenick (2005) is ordered response model, which claimed as higher accuracy andmore appropriate. This implication supported by Bheenick et al. (2006) as this study ll.Extension research had been conducted by Bheenick et al. (2006), which includes threerating agencies, S&P, Moodys and Fitch ratings. Bheenick (2005) appraisal the mostrelevant economic variables are GNP per capital and inflation. Furthermore, additionalvital indicators for emerging market include current account balance and level offoreign reserves. Therefore, results suggest that large range of indicators should beadded in emerging market.
Alternatively, Baek et al. (2005) assessed country risk by including economicfundamentals variables as well as market’s attitude toward risk, which consider asnon-country specific indicators. Results submitted that solvency, economic stabilityand liquidity have impact on ratings where measurement for each indicator provided

1374 Cheng Fan Fah, Lim Li Hsia and Annuar Nasir
in Table 2.1. Critically, risk appetite index (measurement of market’s attitude towardrisk) are important in define market assessed country risk premium.
Table 2.1Measurement of Solvency Risk, Liquidity Risk and Economic Stability
Variables Measurement
Solvency Real GDP growth rate, total external debt to GDP ratio, government budgetbalance to GDP ratio
Liquidity International reserves to imports ratio, current account balance to GDP ratioEconomic stability Inflation rate, real exchange rate
Source: Baek et al., 2005
2.3. Effect of Sovereign Changes on Bond Market Return
There are limited research on sovereign changes in relation to bond market returns.One of the earlier study by Cantor and Parker (1996) found that ratings changes giveimpact on bond return (yield) follow by Kaminsky and Schmukler (2002) that supportedsovereign rating announcements have relationship with bond market returns.However, the authors silent on it magnitude and explanation given in brief since themain purpose of the research focused on determinants of sovereign rating.
On the other hand, Pukthuanthong-Le et al. (2007) studies the relationship ofsovereign rating changes and return of stock and bond market. Measurements of bondmarket return used in mentioned research are daily price indexes and interest ratedata. Authors claimed that taking both data as measurements of market return helpsin maximize the supremacy and accuracy in hypothesis testing. Study indicates thatdowngrades of ratings give negative impact on both bond and stock market, whereaspositive returns only occur in bond market when there are upgrades announcements.Additionally, authors identified that downgrades of sovereign rating showedsignificant negative impact in countries which are high inflation and low currentaccount.
The latest study by Cheng and Ariff (2011) conducted a study to examine therelationship between sovereign rating and bond market returns which focusing on bondyields, term spread and real yield in 33countries with high GDP. Authors had groupedthe 33countires into portfolio and found that there is significant relationship betweensovereign rating and bond market return based on Spearman rank correlations analysis.
3. METHODOLOGY
This study focuses on secondary data to determine the effect on bond market returnby using yield to maturity, which estimated from government securities. Bondvaluation method is important in this study where sovereign ratings and bond yieldsfor five years period (2007-2011) of 30 countries, which representing 80 percent ofworld GDP is investigated. Data will be collected from Data stream’ bond indicessection, S&P Capital IQ, Asian Bond Online and each country’s central bank website.

Effect of Sovereign Rating Changes on Real Bonds Yields Returns 1375
The process of the research begins with the development of the research frameworkwhich shows that bond market return is the dependent variable, independent variableis sovereign rating changes and macroeconomic factors is the moderating variable.Ratings for five years (2007-2011) provided by the Standard and Poor’s this study areobtained in order to identify sovereign rating changes. Sample frame filtered by usingcountry gross domestic product (GDP) where only high GDP countries this study reselected. Moreover, bond market return measured by yield to maturity which hadbeen specified as the most accurate indicator. Additionally, moderating variable whichis inflation rate was studies in order to analyse on inflation adjusted bond yields.Sovereign ratings had been assigned with ranking where highest rating (AAA) assignedas rank 21 and lowest rating (SD) assigned as rank 1. Data was analysed throughcorrelation and regression analysis and sovereign ratings of 30 countries this studyare grouped into portfolio in order to reduce effect of errors.
3.1. Hypothesis Development
The theoretical framework illustrates the relationship between variables and therelationship being identified. A hypothesis is a testable statement or can be defined asa logically conjectured relationship in this study with two or more variables expressedin the form of a testable statement (Malhotra, 2009). Hypothesis will be tested in orderto find the relationship and solve the problem. The following is the hypothesis that isformulated to help to test the relationships between sovereign rating changes andbond market return.
H1: There is a relationship between sovereign rating changes and yield tomaturity.
H0: There is no relationship between sovereign rating changes and yield tomaturity.
H2:There is a relationship between inflation rate and yield to maturity.
Ho:There is no relationship between inflation rate and yield to maturity.
H3:There is a relationship between sovereign rating changes and inflationadjusted yield to maturity.
Ho.There is no relationship between sovereign rating changes and inflationadjusted yield to maturity.
3.2. Sample of the Study
The population of this study consists of 127 countries in S&P sovereign rating listfrom the rating list provided by S&P (Table 3.1). A final 30 countries filtered accordingto country’s gross domestic product (GDP). These 30 countries representing of thelargest bond market value in international bond market. Besides that, this samplecomposed about 80 percent of world’s GDP where total GDP for 30 selected marketsis US$ 56,430 billion and world’s GDP is US$ 70,011 billion (International Monetary

1376 Cheng Fan Fah, Lim Li Hsia and Annuar Nasir
Table 3.1Total Number of 127 Countries and Sovereign Rating as at 29th November 2011
Country Sovereign rating Country Sovereign rating
Abu Dhabi AA Costa Rica BB+Albania B+ Croatia BBB-Andorra A Curacao A-Angola BB- Cyprus BBBArgentina B Czech Republic AAAruba A- Denmark AAAAustralia AAA DominicanRepublic B+Austria AAA Ecuador B-Azerbaijan BB+ Egypt B+Bahamas BBB El Salvador BB-Bahrain BBB Estonia AA-Bangladesh BB- Fiji BBarbados BBB- Finland AAABelarus B- France AAABelgium AA Gabon BB-Belize B- Georgia BB-Benin B Germany AAABermuda AA Ghana BBolivia B+ Greece CCBosnia andHerzegovina B+ Grenada B-Botswana A- Guatemala BB+Brazil A- Guernsey AA+Bulgaria BBB Honduras BBurkina Faso B HongKong AAACambodia B Hungary BBB-Cameroon B Iceland BBB-Canada AAA India BBB-Cape Verde B+ Indonesia BB+Chile AA Ireland BBB+China AA- Isle of Man AA+Colombia BBB+ Israel AA-Cook Islands BB- Italy AJamaica B- Philippines BB+Japan AA- Poland AJordan BB Portugal BBB-Kazakhstan BBB+ Qatar AAKenya B+ Ras Al Khaimah AKorea A+ Romania BB+Kuwait AA Russia BBB+Latvia BB+ Saudi Arabia AA-Lebanon B Senegal B+Libya NR Serbia BBLiechtenstein AAA Singapore AAALithuania BBB Slovak Republic A+Luxembourg AAA Slovenia AA-Macedonia BB South Africa AMalaysia A Spain AA-
contd. table
Effect of Sovereign Rating Changes on Real Bonds Yields Returns 1377
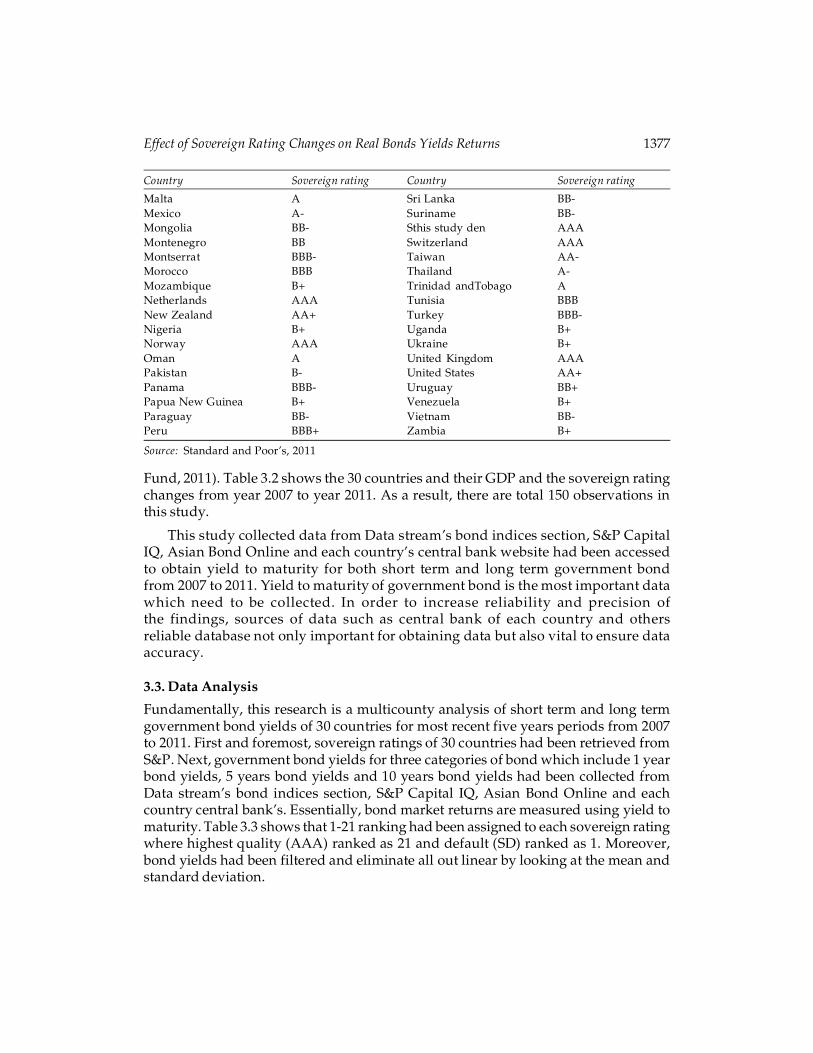
Fund, 2011). Table 3.2 shows the 30 countries and their GDP and the sovereign ratingchanges from year 2007 to year 2011. As a result, there are total 150 observations inthis study.
This study collected data from Data stream’s bond indices section, S&P CapitalIQ, Asian Bond Online and each country’s central bank website had been accessedto obtain yield to maturity for both short term and long term government bondfrom 2007 to 2011. Yield to maturity of government bond is the most important datawhich need to be collected. In order to increase reliability and precision ofthe findings, sources of data such as central bank of each country and othersreliable database not only important for obtaining data but also vital to ensure dataaccuracy.
3.3. Data Analysis
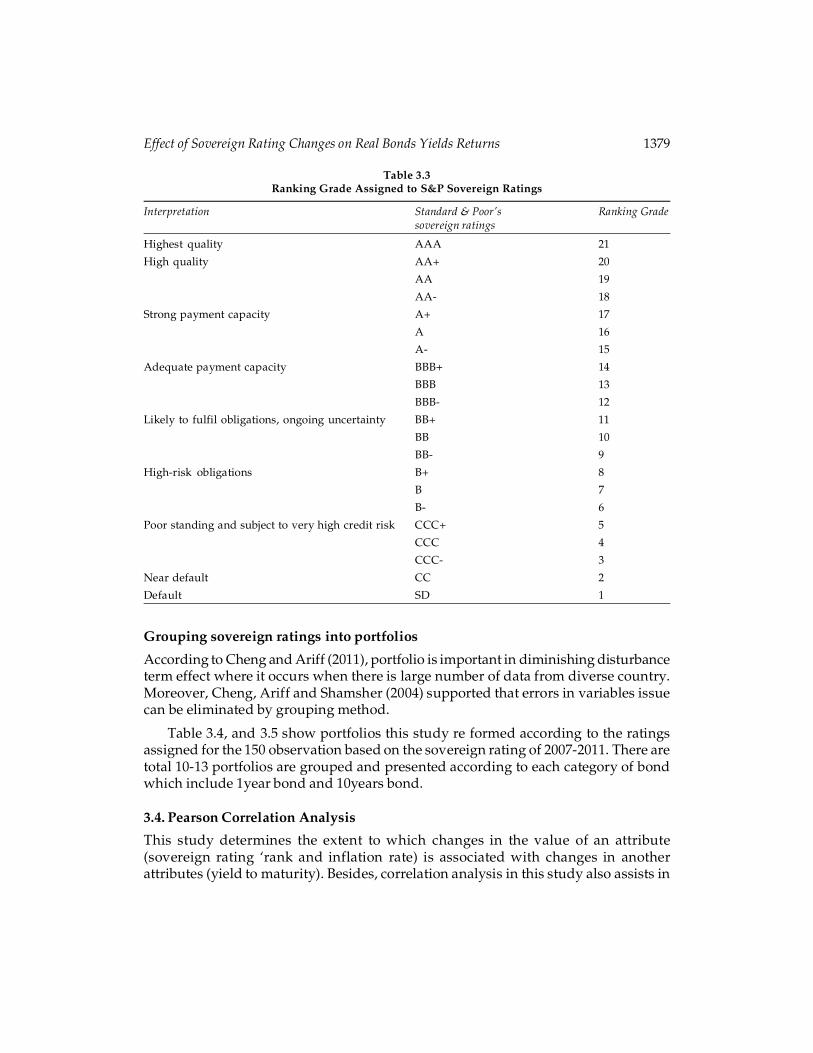
Fundamentally, this research is a multicounty analysis of short term and long termgovernment bond yields of 30 countries for most recent five years periods from 2007to 2011. First and foremost, sovereign ratings of 30 countries had been retrieved fromS&P. Next, government bond yields for three categories of bond which include 1 yearbond yields, 5 years bond yields and 10 years bond yields had been collected fromData stream’s bond indices section, S&P Capital IQ, Asian Bond Online and eachcountry central bank’s. Essentially, bond market returns are measured using yield tomaturity. Table 3.3 shows that 1-21 ranking had been assigned to each sovereign ratingwhere highest quality (AAA) ranked as 21 and default (SD) ranked as 1. Moreover,bond yields had been filtered and eliminate all out linear by looking at the mean andstandard deviation.
Malta A Sri Lanka BB-Mexico A- Suriname BB-Mongolia BB- Sthis study den AAAMontenegro BB Switzerland AAAMontserrat BBB- Taiwan AA-Morocco BBB Thailand A-Mozambique B+ Trinidad andTobago ANetherlands AAA Tunisia BBBNew Zealand AA+ Turkey BBB-Nigeria B+ Uganda B+Norway AAA Ukraine B+Oman A United Kingdom AAAPakistan B- United States AA+Panama BBB- Uruguay BB+Papua New Guinea B+ Venezuela B+Paraguay BB- Vietnam BB-Peru BBB+ Zambia B+
Source: Standard and Poor’s, 2011
Country Sovereign rating Country Sovereign rating

1378 Cheng Fan Fah, Lim Li Hsia and Annuar Nasir
Table 3.2GDP (2011) and Sovereign Rating Changes from Year 2007-2011
GDP 2011 2007 2008 2009 2010 2011
Country USD Billion Rating Rating Rating Rating RatingAustralia 1507.40 AAA AAA AAA AAA AAABelgium 529.05 AA+ AA+ AA+ AA+ AABrazil 2517.93 BBB BBB+ BBB+ BBB+ A-Canada 243.05 AAA AAA AAA AAA AAAChile 1758.68 AA AA AA AA AAChina 6988.47 A A+ A+ A+ AA-Denmark 349.12 AAA AAA AAA AAA AAAFrance 2808.27 AAA AAA AAA AAA AAAGermany 3628.62 AAA AAA AAA AAA AAAGreece 312.04 A A BBB+ BBB+ CCHong Kong 246.94 AA AA+ AA+ AA+ AAAIndia 1843.38 BBB- BBB- BBB- BBB- BBB-Indonesia 834.34 BB+ BB+ BB+ BB+ BB+Italy 2245.71 A+ A+ A+ A+ AJapan 5855.38 AA AA AA AA AA-Korea 1163.85 A+ A+ A+ A+ A+Malaysia 247.57 A+ A+ A+ A+ AMexico 1,185.22 A+ A+ A A A-New Zealand 168.82 AAA AAA AAA AAA AA+Norway 479.30 AAA AAA AAA AAA AAAPhilippines 216.10 BB+ BB+ BB+ BB+ BB+Portugal 241.92 AA- AA- A+ A- BBB-Spain 1536.48 AAA AAA AA+ AA AA-Sri Lanka 58.82 BB- B+ B+ B+ BB-Taiwan 504.612 AA- AA- AA- AA- AA-Thailand 339.40 A A A- A- A-Turkey 763.10 BB BB BB BB+ BBB-United Kingdom 2480.98 AAA AAA AAA AAA AAAUnited States 15064.82 AAA AAA AAA AAA AA+Venezuela 309.84 BB- BB- BB- BB- B+
Source: International Monetary Fund; Standard and Poor’s, 2011
The number of qualify observations in each category after filtering is118 observations for 1 year bond and 134 observations for 10 years bond. Dataare then grouped into portfolio according to category of bond with differentmaturity period. Portfolio results are presented in this study since this studyshow that portfolio is able to lower disturbance term. Differences of bond yield andinflation rate before and after sovereign rating changes are presented and discussedas well.
Effect of Sovereign Rating Changes on Real Bonds Yields Returns 1379
Table 3.3Ranking Grade Assigned to S&P Sovereign Ratings
Interpretation Standard & Poor’s Ranking Gradesovereign ratings
Highest quality AAA 21
High quality AA+ 20
AA 19
AA- 18
Strong payment capacity A+ 17
A 16
A- 15
Adequate payment capacity BBB+ 14
BBB 13
BBB- 12
Likely to fulfil obligations, ongoing uncertainty BB+ 11
BB 10
BB- 9
High-risk obligations B+ 8
B 7
B- 6
Poor standing and subject to very high credit risk CCC+ 5
CCC 4
CCC- 3
Near default CC 2
Default SD 1
Grouping sovereign ratings into portfolios
According to Cheng and Ariff (2011), portfolio is important in diminishing disturbanceterm effect where it occurs when there is large number of data from diverse country.Moreover, Cheng, Ariff and Shamsher (2004) supported that errors in variables issuecan be eliminated by grouping method.
Table 3.4, and 3.5 show portfolios this study re formed according to the ratingsassigned for the 150 observation based on the sovereign rating of 2007-2011. There aretotal 10-13 portfolios are grouped and presented according to each category of bondwhich include 1year bond and 10years bond.
3.4. Pearson Correlation Analysis
This study determines the extent to which changes in the value of an attribute(sovereign rating ‘rank and inflation rate) is associated with changes in anotherattributes (yield to maturity). Besides, correlation analysis in this study also assists in

1380 Cheng Fan Fah, Lim Li Hsia and Annuar Nasir
Table 3.4Portfolio of 1year Bond
Ratings Ranking No of observations
AAA 21 44AA+ 20 9AA+ 19 12AA- 18 3A+ 17 15A 16 7A- 15 6BBB+ 14 1BBB- 12 6BB+ 11 11BB 10 1BB- 9 1B+ 8 2Total 118
Table 3.5Portfolio of 10 years Bond
Ratings Ranking No of Observations
AAA 21 46AA+ 20 10AA+ 19 12AA- 18 9A+ 17 19A 16 9A- 15 6BBB+ 14 5BBB- 12 7BB+ 11 11Total 134
examining the association between yield to maturity and inflation rate. Inflation rateact as moderating variable, therefore, results of correlation between inflation adjustedyields to maturity and sovereign ratings this study re presented in chapter 4. Theformula for inflation adjusted yield to maturity as:
Inflation adjusted yield to maturity = Yield to maturity – Inflation rate (3)
3.5. Regression Analysis
Multivariate analysis applied when there are two or more measurements on eachelement, variables will be analysed simultaneously. Multiple linear regressions areused to test the relationship between two or more independent variables and onedependent variable at the same time. It could perform regressions based on thefollowing models:

Effect of Sovereign Rating Changes on Real Bonds Yields Returns 1381
y = �0 + �1 x1 + �2 x2 + �
Where:
y = Bond market return (yield to maturity)
x1 = Sovereign ratings
x2 = Inflation rate
� = Error term
All the methods above are used to increase the efficiency and the accuracy of dataanalysis of this study.
4. RESULTS
4.1. Descriptive Statistics of Bond based on Portfolio Results
Descriptive Statistics of 1year Bond in Portfolio
After filtering sample, there are12 groups of descriptive statistics of 1 year bond. Table4.1 shows that maximum ranking for 1 year bond portfolio is 21 which mean thesovereign rating it has is AAA and the minimum ranking is 8 (B+). Then, the minimumyield designates 1.39 percent, maximum yield 9.31 percent, a mean value of 4.8933percent and standard deviation of 2.85 percent. While the inflation for this categoryhas a minimum value of 2.13 percent, a maximum value of 7.47 percent, a mean valueof 4.30 percent and standard deviation of 2.07 percent. Furthermore, the inflationadjusted bond yield for 1year bond has minimum percentage of -0.74, maximumpercentage of 2.57, mean value as 4.89 percent and 2.85 percent for standard deviation.
Table 4.1Descriptive Statistics of 1year Bond in Portfolio
Type N Minimum Maximum Mean Standard Deviation
Ranking 12 8.00 21.00 14.666 4.5191year bond yields 12 1.39 9.31 4.893 2.849(portfolio)Inflation 12 2.13 7.47 4.299 2.071Inflation adjusted 1year 12 -0.74 2.57 0.594 0.989bond yields (portfolio)
Descriptive Statistics of 10 years Bond in Portfolio
Another group selection process has been done for the sample; there are 10 groups ofdescriptive statistic for 10 years bond portfolios. From the results obtained, theminimum ranking rating grade is BB+ while the maximum is AAA. The portfolio’syield, it has a minimum of 2.77 percent while maximum yield has 11.06 percent, meanvalue 5.743 and standard deviation of 2.694. Subsequently, the minimum inflationrate is 2.01 percent while maximum is 8.54 percent. Then for mean value shows 3.864

1382 Cheng Fan Fah, Lim Li Hsia and Annuar Nasir
percent and standard deviation 1.971 percent. Next, inflation adjusted bond yield showsminimum percentage of -0.33; maximum percentage of 6.42, mean value of 1.88 andstandard deviation shows 1.82 percent in Table 4.2.
Table 4.2Descriptive Statistics of 10 years Bond in Portfolio
Type N Minimum Maximum Mean Standard Deviation
Ranking 10 11.00 21.00 16.30 3.33510 years bond yields 10 2.77 11.06 5.74 2.693(portfolio)Inflation 10 2.01 8.54 3.86 1.971Inflation adjusted 10 years 10 -0.33 6.42 1.87 1.816bond yields (portfolio)
4.2. Descriptive analysis of changes of sovereign ratings and changes of bondyields
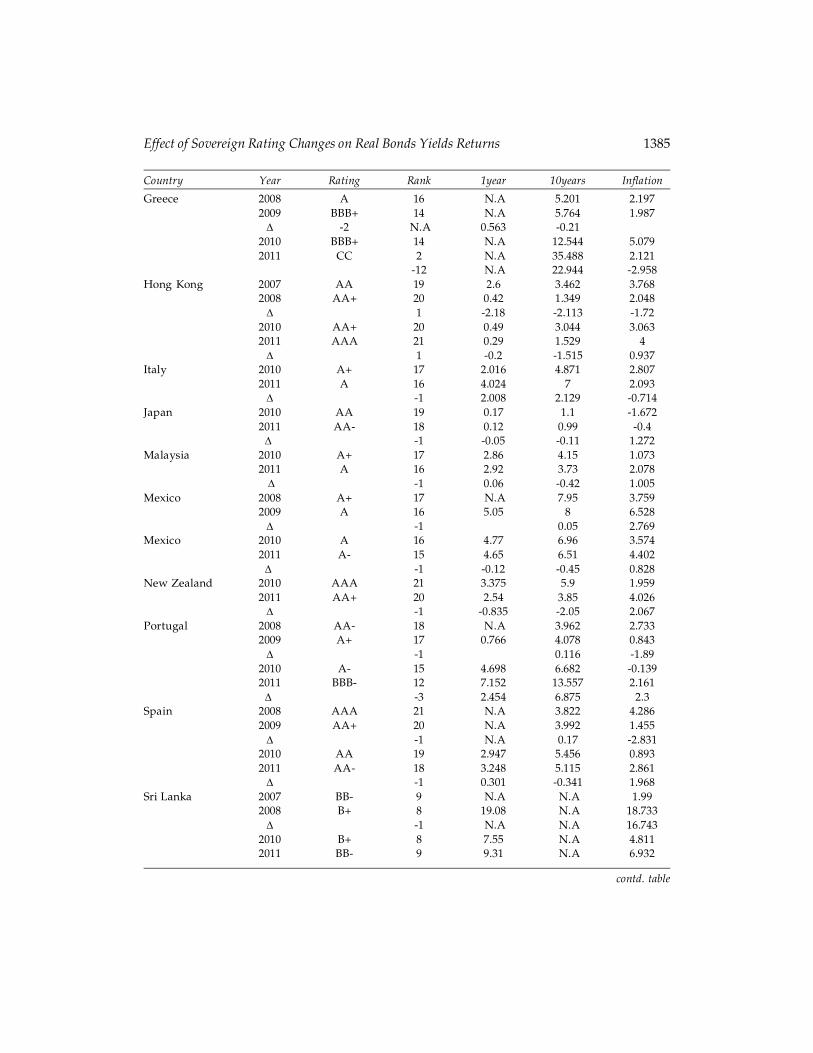
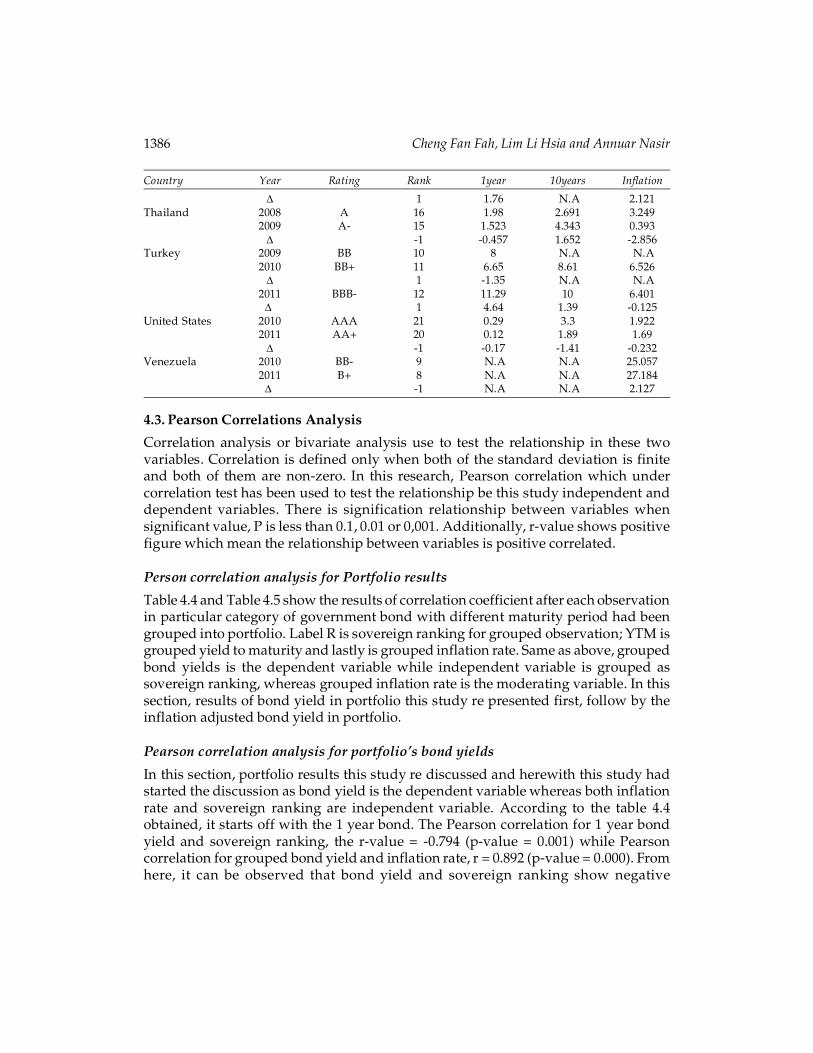
In Table 4.3, it shows the changes of bond yields when there are sovereign rating changes(upgrades and downgrades). As mentioned in chapter 3, there are total 30 countries asthe sample for this study. After filtered all countries which did not experienced anysovereign rating changes between years 2007-2011, there are 17 countries experiencedsovereign rating upgraded or downgraded by S&P in the last five years.
From the Table 4.3, it can be observed that there are total 28 changes of sovereignrating with 9 upgrades announcement and 19 downgrades announcement across 17countries. Among the 17 countries, there are 13 countries that experienced downgradesof sovereign rating, three countries had upgrades of sovereign rating and one countryhad both upgrades and downgrades of sovereign rating in past five years. Accordingto the theory, when the bond has downgraded, bond yield should increase sincedowngraded means higher of default risk. Therefore, changes of yields should shownegative sign (yield of current year less than yield of previous year) when upgradesand positive sign (yield of current year higher than yield of previous year) whendowngrades of sovereign rating. As a result, this section discussing on changes ofbond yield when there are sovereign rating changes.
The only one country which experience both upgrade and downgrade of sovereignrating is Sri Lanka. Sri Lanka experienced one notch down in year 2008 from BB-(ranked as 9 in year 2007) to become B+ (ranked as 8 in year 2008). Refresh back thatthe higher the ranking, higher quality is the bond where AAA+ ranked as 21. SriLanka had experienced downgrades in year 2008 from BB- in year 2007 to become B+in year 2008 and upgrades in year 2011 from B+ in year 2010 to become BB- in year2011. First, this study identified in Table 4.11 show that there is a sudden jump ininflation rate from 1.99 percent in year 2007 to become 18.7 percent in year 2008. Referto the upgrades in year 2011, this study identify that there is positive sign for changesof bond yield. Logically, the value of changes should provide negative sign when

Effect of Sovereign Rating Changes on Real Bonds Yields Returns 1383
there is upgrade. Yet, when bond yields less the inflation rate, the real yield obtainedwill be in negative sign. Therefore, this study indicates that the bond yield changes ofSri Lanka are consistent with the theory.
Additionally, there are four other countries experience upgrades in past five yearswhich include Brazil, China, Hong Kong and Turkey. Refer to the Table 4.4, all of thefour mentioned countries experienced two times of sovereign rating upgrades. Thisstudy observes that bond yields of Brazil have decrease once its sovereign ratingupgraded by S&P. Besides, China experiences one notch upgrade in year 2008 (fromA to A+) and the second time of one notch upgrade happened in year 2011 (from A+to AA-). Same as China, Hong Kong has experiences two times sovereign ratingupgrades in year 2008 (from AA to AA+) and year 2011(from AA+ to AAA). On theother hand, Turkey has experiences two times sovereign rating upgrades in continuousyear which are in year 2010 (from BB to become BB+) and year 2011 (from BB+ toBBB-). Refer to the column of bond yield changes; this study observed that yield changesof Brazil, China and Hong Kong have supported the theory by showing negative sign.These values indicate that when sovereign rating upgrades, bond yield for investorswill be reduced. Moreover, sovereign rating upgrades happened in Turkey do notsupport the theory, this might be due to the high inflation in Turkey where inflationrate reach 10.1 percent in year 2009 and about 7 percent in year 2010 and year 2011.
Other than the above mentioned countries (Sri Lanka, Brazil, China, Hong Kongand Turkey) above, the remained 12 countries have had experienced sovereign ratingdowngrades which include Belgium, Greece, Italy, Japan, Malaysia, Mexico, NewZealand, Portugal, Spain, Thailand, United States and Venezuela. The most significantcountries which involve in serious notches downgrade are Greece and Portugal.Obviously, Greece had experienced many notches downgrade last year from BBB+(ranked as 14) to CC (ranked as 2) which can be classified as junk bond. This study canidentify that inflation rate had decreased about 3 percent in year 2011 (5%) whencompare with year 2010 (2%). However, the changes of bond yields had increased in ahuge percentage. For instance, 3years bond yield is roughly 14 percent in year 2010when Greece sovereign rating given as BBB+, however when sovereign rating hadbeen downgrades as CC, 3years bond yield has increase to become 102 percent.Therefore, change of 3years bond yield is 88 percent. This phenomenon suggestedthat when there is downgrade of sovereign rating, bond yield offer by issuer need tobe raised as its risk of default increase equivalently.
Additionally, Portugal had experienced serious sovereign ratings downgrade sinceyear 2008. In year 2008, Portugal had been rates as AA- which falls in the category ofhigh quality bond. However, in year 2011, sovereign rating of Portugal becomes BBB-that interpret as government that has adequate payment capacity (refer to table 1.1).As showed in the table 4.4, the changes of bond yields have increase about 7 to 10percent once Portugal’s sovereign rating had been downgraded by S&P. Follow withMexico and Spain which had involve in sovereign downgrades since year 2008 to

1384 Cheng Fan Fah, Lim Li Hsia and Annuar Nasir
2011. Mexico had been announced sovereign rating downgrade in year 2008 (from A+to A) and year 2011 (from A to A-), this study can identify that sovereign ratings stillfall under the same category which interprets as the government has strong paymentcapacity (refer to Table 1.1). As a result, bond yields of Mexico at a decreasing rateand its changes of bond yields in Table 4.11 are in negative sign. This value indicatesthat when downgrades of sovereign rating fall under the same category and bondissued by government still considered as high quality, investors might not perceive ashigh risk and do not request for higher return. This justification can be observed fromthe sovereign rating changes and bond yield changes happened in Spain as this studyll. Spain had experienced downgrades for three times in year 2009 (from AAA to AA+),year 2010 (AA+ to AA) and year 2011 (from AA to AA-). All the sovereign ratings fallunder the same category where S&P given the interpretation as high quality bond.
Furthermore, the other countries have experienced minor notch downgrade areBelgium, Italy, Japan, Malaysia, New Zealand and Thailand. According to the Table3.2,these countries had experienced minor downgrade such as Belgium’s sovereign ratinghas downgraded from AA+ to AA and Malaysia’s sovereign rating had downgradedfrom A+ to A. In overall, this study identifies that government of these countries haveincreased the bond yields for short term and long term bond when sovereign ratingshad been downgraded. Therefore, changes of bond yields column in Table 4.4 showpositive sign which means that there is an increase by using current year bond yieldminus previous year bond yield. Last but not least, United States had been downgradedfor one notch from AAA to AA+ after being as the top spot government which has thehighest ability in paying their debt for 90years. From the changes of bond yield, thisstudy indicates that this announcement give small impact since the cost of borrowinghad decreased in year 2011 when compare to year 2010.
Table 4.3Changes of Bond Yields When Sovereign Rating Changes
Country Year Rating Rank 1year 10years Inflation
Belgium 2010 AA+ 20 1.529 3.971 3.38 2011 AA 19 0.774 4.12 2.5
� -1 -0.755 0.149 -0.88Brazil 2007 BBB 13 N.A 13.229 4.457 2008 BBB+ 14 N.A 12.56 5.902
� 1 N.A -0.669 1.445 2010 BBB+ 14 12.1 N.A 5.909 2011 A- 15 9.78 N.A 6.302 � 1 -2.32 N.A 0.393China 2007 A 16 4.1 4.475 6.633 2008 A+ 17 1.1 2.865 2.533 � 1 -3 -1.61 -4.1 2010 A+ 17 3.029 3.86 4.7 2011 AA- 18 2.7 3.52 5.099 � 1 -0.329 -0.34 0.399
contd. table
Effect of Sovereign Rating Changes on Real Bonds Yields Returns 1385
Greece 2008 A 16 N.A 5.201 2.197 2009 BBB+ 14 N.A 5.764 1.987
� -2 N.A 0.563 -0.21 2010 BBB+ 14 N.A 12.544 5.079 2011 CC 2 N.A 35.488 2.121 -12 N.A 22.944 -2.958Hong Kong 2007 AA 19 2.6 3.462 3.768
2008 AA+ 20 0.42 1.349 2.048� 1 -2.18 -2.113 -1.72
2010 AA+ 20 0.49 3.044 3.0632011 AAA 21 0.29 1.529 4 � 1 -0.2 -1.515 0.937
Italy 2010 A+ 17 2.016 4.871 2.807 2011 A 16 4.024 7 2.093 � -1 2.008 2.129 -0.714Japan 2010 AA 19 0.17 1.1 -1.672 2011 AA- 18 0.12 0.99 -0.4 � -1 -0.05 -0.11 1.272Malaysia 2010 A+ 17 2.86 4.15 1.073 2011 A 16 2.92 3.73 2.078 � -1 0.06 -0.42 1.005Mexico 2008 A+ 17 N.A 7.95 3.759 2009 A 16 5.05 8 6.528 � -1 0.05 2.769Mexico 2010 A 16 4.77 6.96 3.574 2011 A- 15 4.65 6.51 4.402 � -1 -0.12 -0.45 0.828New Zealand 2010 AAA 21 3.375 5.9 1.959
2011 AA+ 20 2.54 3.85 4.026� -1 -0.835 -2.05 2.067
Portugal 2008 AA- 18 N.A 3.962 2.733 2009 A+ 17 0.766 4.078 0.843 � -1 0.116 -1.89 2010 A- 15 4.698 6.682 -0.139 2011 BBB- 12 7.152 13.557 2.161 � -3 2.454 6.875 2.3Spain 2008 AAA 21 N.A 3.822 4.286 2009 AA+ 20 N.A 3.992 1.455 � -1 N.A 0.17 -2.831 2010 AA 19 2.947 5.456 0.893 2011 AA- 18 3.248 5.115 2.861 � -1 0.301 -0.341 1.968Sri Lanka 2007 BB- 9 N.A N.A 1.99 2008 B+ 8 19.08 N.A 18.733 � -1 N.A N.A 16.743 2010 B+ 8 7.55 N.A 4.811 2011 BB- 9 9.31 N.A 6.932
Country Year Rating Rank 1year 10years Inflation
contd. table
1386 Cheng Fan Fah, Lim Li Hsia and Annuar Nasir
� 1 1.76 N.A 2.121Thailand 2008 A 16 1.98 2.691 3.249 2009 A- 15 1.523 4.343 0.393 � -1 -0.457 1.652 -2.856Turkey 2009 BB 10 8 N.A N.A 2010 BB+ 11 6.65 8.61 6.526 � 1 -1.35 N.A N.A 2011 BBB- 12 11.29 10 6.401 � 1 4.64 1.39 -0.125United States 2010 AAA 21 0.29 3.3 1.922 2011 AA+ 20 0.12 1.89 1.69 � -1 -0.17 -1.41 -0.232Venezuela 2010 BB- 9 N.A N.A 25.057 2011 B+ 8 N.A N.A 27.184 � -1 N.A N.A 2.127
4.3. Pearson Correlations Analysis
Correlation analysis or bivariate analysis use to test the relationship in these twovariables. Correlation is defined only when both of the standard deviation is finiteand both of them are non-zero. In this research, Pearson correlation which undercorrelation test has been used to test the relationship be this study independent anddependent variables. There is signification relationship between variables whensignificant value, P is less than 0.1, 0.01 or 0,001. Additionally, r-value shows positivefigure which mean the relationship between variables is positive correlated.
Person correlation analysis for Portfolio results
Table 4.4 and Table 4.5 show the results of correlation coefficient after each observationin particular category of government bond with different maturity period had beengrouped into portfolio. Label R is sovereign ranking for grouped observation; YTM isgrouped yield to maturity and lastly is grouped inflation rate. Same as above, groupedbond yields is the dependent variable while independent variable is grouped assovereign ranking, whereas grouped inflation rate is the moderating variable. In thissection, results of bond yield in portfolio this study re presented first, follow by theinflation adjusted bond yield in portfolio.
Pearson correlation analysis for portfolio’s bond yields
In this section, portfolio results this study re discussed and herewith this study hadstarted the discussion as bond yield is the dependent variable whereas both inflationrate and sovereign ranking are independent variable. According to the table 4.4obtained, it starts off with the 1 year bond. The Pearson correlation for 1 year bondyield and sovereign ranking, the r-value = -0.794 (p-value = 0.001) while Pearsoncorrelation for grouped bond yield and inflation rate, r = 0.892 (p-value = 0.000). Fromhere, it can be observed that bond yield and sovereign ranking show negative
Country Year Rating Rank 1year 10years Inflation

Effect of Sovereign Rating Changes on Real Bonds Yields Returns 1387
correlation. Next, the correlation between bond yield and inflation rate shows positivecorrelation. In this category, all the significance values is less than 0.001, therefore,this study can conclude that there is quite a high association between bond yield withsovereign ranking and inflation rate.
Last but not least, the final category of bond in portfolio will be 10 years bond.From the results, the Pearson correlation for grouped 10 years bond yield and sovereignranking, r-value = -0.816 (p-value = 0.004) while the Pearson correlation for bond yieldand inflations rate, r-value is 0.738 (p-value = 0.015). From here, it can be seen thatboth of the correlation significant at 0.01. As suggested in the theory, higher quality ofsovereign ranking, lower is the bond yield. Whereas, there is positive correlationbetween yield and inflation rate, when increase in inflation rate, yield will increase aswell.
Table 4.4Pearson Correlation Analysis of Portfolio’s Bond Yields
Bond Yields (YTM) Number of groups in Sovereign Inflationportfolio (N) Ranking (R)
1 year bond yield 13 -0.794*** 0.892***P = (0.001) P = (0.000)
10 years bond yield 10 -0.816** 0.738**P = (0.004) P = (0.015)
Note: Correlation is significant at the *0.1, **0.01 and ***0.001 level
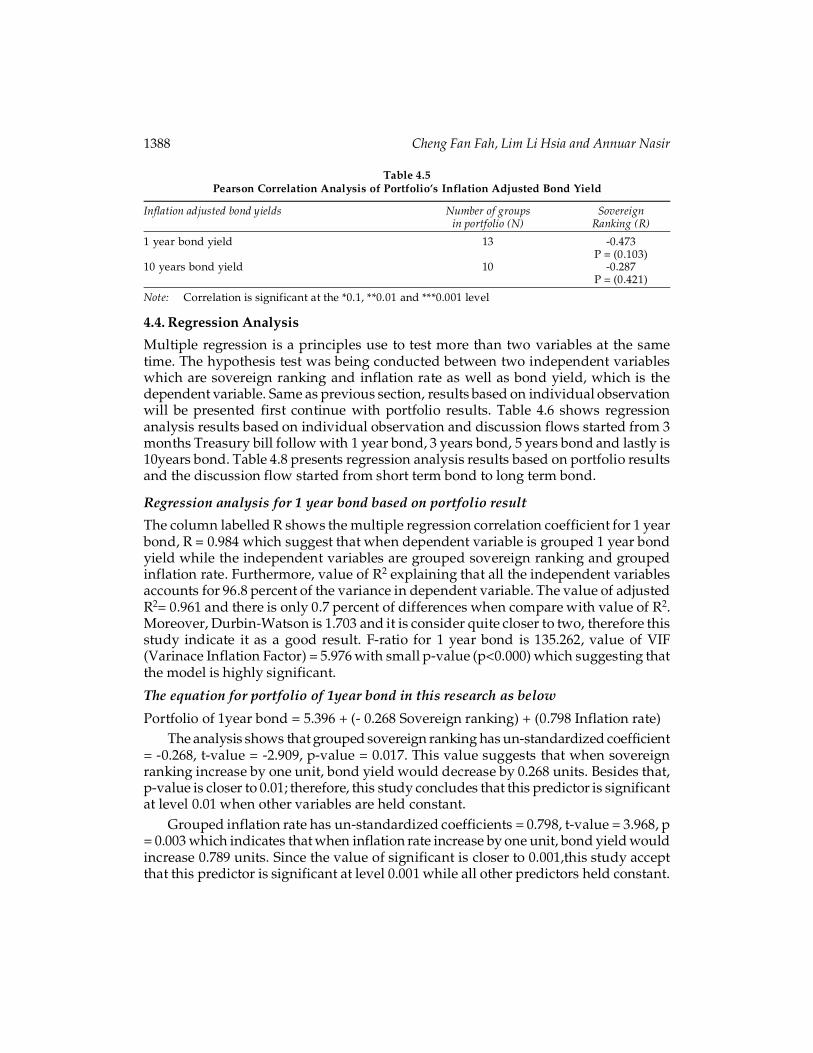
Pearson correlation analysis for portfolio’s inflation adjusted bond yields
After discussed on portfolio’s bond yield in previous section, this section inflationadjusted bond yield is the dependent variable and discussion is focusing on the Pearsoncorrelation for portfolio’s inflation adjusted bond yield and grouped sovereign ranking.Refer to the Table 4.5, the Pearson correlation for grouped 3 months inflation adjustedyield and sovereign ranking, r-value = -0.06 and p-value = 0.845. Although there is nosignificant relationship, this study still can conclude that there is negative correlationin inflation adjusted bond yield and sovereign ranking. As proposed in the theory,higher quality of the bond, in this study r is the real yield.
Whereas, the Pearson correlation for grouped 1 year inflation adjusted bond yieldand sovereign ranking, r-value = -0.473 and p-value = 0.103. Table show not significantresult for this grouped 1 year bond’s real yield. Again, it shows that there is negativecorrelation between real yield and sovereign ranking as supported by theory: higherquality of bond has lower real yield.
Continuously, portfolio of 10 years bond will be discussed. From the Table 4.5,correlation coefficient for grouped 10 years inflation adjusted bond yield and sovereignranking, r = -0.287 and p-value = 0.421. Therefore, this study can concludes that thereis no significant result for this portfolio. From the result, negative correlation withinvariables can be observed.
1388 Cheng Fan Fah, Lim Li Hsia and Annuar Nasir
Table 4.5Pearson Correlation Analysis of Portfolio’s Inflation Adjusted Bond Yield
Inflation adjusted bond yields Number of groups Sovereignin portfolio (N) Ranking (R)
1 year bond yield 13 -0.473P = (0.103)
10 years bond yield 10 -0.287P = (0.421)
Note: Correlation is significant at the *0.1, **0.01 and ***0.001 level
4.4. Regression Analysis
Multiple regression is a principles use to test more than two variables at the sametime. The hypothesis test was being conducted between two independent variableswhich are sovereign ranking and inflation rate as well as bond yield, which is thedependent variable. Same as previous section, results based on individual observationwill be presented first continue with portfolio results. Table 4.6 shows regressionanalysis results based on individual observation and discussion flows started from 3months Treasury bill follow with 1 year bond, 3 years bond, 5 years bond and lastly is10years bond. Table 4.8 presents regression analysis results based on portfolio resultsand the discussion flow started from short term bond to long term bond.
Regression analysis for 1 year bond based on portfolio result
The column labelled R shows the multiple regression correlation coefficient for 1 yearbond, R = 0.984 which suggest that when dependent variable is grouped 1 year bondyield while the independent variables are grouped sovereign ranking and groupedinflation rate. Furthermore, value of R2 explaining that all the independent variablesaccounts for 96.8 percent of the variance in dependent variable. The value of adjustedR2= 0.961 and there is only 0.7 percent of differences when compare with value of R2.Moreover, Durbin-Watson is 1.703 and it is consider quite closer to two, therefore thisstudy indicate it as a good result. F-ratio for 1 year bond is 135.262, value of VIF(Varinace Inflation Factor) = 5.976 with small p-value (p<0.000) which suggesting thatthe model is highly significant.
The equation for portfolio of 1year bond in this research as below
Portfolio of 1year bond = 5.396 + (- 0.268 Sovereign ranking) + (0.798 Inflation rate)The analysis shows that grouped sovereign ranking has un-standardized coefficient
= -0.268, t-value = -2.909, p-value = 0.017. This value suggests that when sovereignranking increase by one unit, bond yield would decrease by 0.268 units. Besides that,p-value is closer to 0.01; therefore, this study concludes that this predictor is significantat level 0.01 when other variables are held constant.
Grouped inflation rate has un-standardized coefficients = 0.798, t-value = 3.968, p= 0.003 which indicates that when inflation rate increase by one unit, bond yield wouldincrease 0.789 units. Since the value of significant is closer to 0.001,this study acceptthat this predictor is significant at level 0.001 while all other predictors held constant.

Effect of Sovereign Rating Changes on Real Bonds Yields Returns 1389
Regression analysis for 10 years bond based on portfolio result
According to the Table 4.6, multiple correlation coefficients for the model, value of R is0.820. Moreover, value of R2 is 0.637 which suggests that 63.7 percent of variance independent variable is explained by the predictors in the model. Besides that, value ofadjusted R2is 0.579 and the difference between value of R2and adjusted R2 is 0.06 whichtells us that the model would account for 6 percent less variance in the outcome whenthis study take population as the object of study instead of sample. When Durbin-Watsonis closer to 2 which means the result is superior. In this case, Durbin-Watson is 2.099which consideringasasuperior results. F-ratio is 7.189 with significant value = 0.02andVIF is 3.59. As a result, this study can designate that the result is significant at 5 percent.
The equation for portfolio of 10years bond in this research as below:
Portfolio of 10 years bond = 13.778 + (- 0.546 Sovereign ranking) + (0.224 Inflation rate)
Grouped sovereign ranking has un-standardized coefficients = -0.546, t-value = -1.650, p-value = 0.143 which suggest that when sovereign ranking increase by oneunit, bond yield will decrease by 0.546 units. Moreover, significant value is closer to0.1 therefore this study indicate that this variable is significant at 10 percent. Thisexplanation is true when other predictors are held constant.
Grouped inflation rate has un-standardized coefficients = 0.224, t-value = 0.4, p =0.701which explain that when inflation rate increase by one unit, bond yield wouldincrease 0.4. Moreover, this predictor is not significant and explanation is accuratewhen other predictors are held constant.
Table 4.6Multiple Regression Analysis of Portfolio
PortfolioModel 1year bond 10 years bondyield yield
Constant 5.396* 13.778**t = 2.480 t = 1.877(0.035) (0.103)-0.268** -0.546*
Sovereign Ranking t = -2.909 t = -1.650(0.017) (0.143)0.798** 0.224
Inflation rate t = 3.968 t = 0.4(0.003) (0.701)
R 0.984 0.820R Square 0.968 0.673Adjusted R Square 0.961 0.579Durbin-Watson 1.703 2.099VIF 5.976 3.59F 135.262 7.189
(0.000) (0.020)
Note: Significant at the *0.1, **0.01 and ***0.001 level

1390 Cheng Fan Fah, Lim Li Hsia and Annuar Nasir
Table 4.7 shows the results of the hypothesis in this model. Based on the tablebelow, this study can indicate there are two hypothesis (H1, H2) supported in portfolioanalysis and one hypotheses (H3) not supported in portfolio analysis.
Table 4.7Hypothesis Testing Results
Hypothesis Variables Portfolio Analysis
H1 Sovereign ratings and Bond yields SupportedH2 Inflation rate and Bond yields SupportedH3 Sovereign ratings and Inflation Not supported
adjusted bond yields
5. CONCLUSION
Global economic crisis in year 2008 had threatened worldwide financial market. Followwith Euro zone crisis in year 2011 had again deepen the global capital market. S&Pannounced to downgrade United States sovereign ratings in August 2011, continuewith downgrades announcement of few countries such as Italy, New Zealand andothers. Moreover, Greece and Portugal sovereign ratings had been downgraded formany notches and classified as junk bond. Sovereign debt crisis has significantly placethe financial market into a tension situation. Kaminsky and Schmukler (2002) indicatedthat sovereign rating changes have obviously give impact on bond returns. Theconcealment relationship between risk and return needed to be study. Sovereign debtissues become the main motive for this research to conduct in order to provide insightfor all related parties to understanding the relationship between sovereign ratingchanges and bond yields.
The main objective of this research is to find out the effect of sovereign ratingchanges on bond market returns. Moreover, nominal bond yield, real yield andinflation rate this study have considered in investigatingthe risk and returnrelationship. After studied plenty of previous research which has been discussed inliterature review, it provides insight and dimension about which area should becovered. Theories and finding of those researches are important and contributes inthis study. This study have discovered that rarely has study focused on therelationship between sovereign rating and yield to maturity. Therefore, this researchis important to provide new information and fresh idea regarding risk and returnrelationship in bond market.
As suggested by Cantor and Packer (1996), sovereign rating changes containinvisible information that gives impact on bond market which includes informationfor central government in decision making. Authors had indicated that governmentseek sovereign rating as an important tool for them to enter international market sincemost of the investors prefer rated bond. This study allows central government tounderstand that how sovereign rating changes affect investors’ perception towardtheir default risk and likelihood to invest in their government securities. Significantly,
Effect of Sovereign Rating Changes on Real Bonds Yields Returns 1391
this study allows central government to estimate their cost of borrowing duringsovereign rating changes. For instance, when there is downgrade announcement,government is expected to increase the bond yield. However, this means that theircost of funding will be increased and this situation might effect on their account. Highborrowing cost will give burden on government ability to pay their debt. In worst,huge government debt might cause collapse of a country’s future and threaten itsfinancial market. Besides, inflation rate and sovereign rating change are significanteffect on government policy.
Descriptive analysis on sovereign rating changes and bond yield changes provideinsight that when there is significant downgrade announcements such as Greece andPortugal, bond yields have been observed that increase in large percentage. However,different degree of downgrade and upgrade announcements give different impact onbond yields. For example, downgrades on Mexico did not brought any significantimpact on bond yield. This reason might be due to the sovereign rating within class oracross class will give different degree of impact. Besides that, sovereign ratingdowngrade of reputable country such as New Zealand and United States seek to havevery minor impact on bond yield. This information is able to give different point ofview for investors and related parties as other researchers who interested to study indeep regarding.
Last but not least, results found in this study would provide insight for regulators.As documented byPukthuanthong-Le et al (2007), the information regarding sovereignrating helps regulator agents such as Basel Committee to design their regulatory.Moreover, this research serves as the gateway for further research to study on topicregarding sovereign rating changes and bond yield.
**Please discuss a bit the policy implication fron this study?
References
Amihud, Y. (2002), Illiquidity and stock returns: Cross section and time series effects. Journal ofFinancial Markets, 5, 31-56.
Amihud, Y., Mendelson, H. & Pedersen, L. (2005), Liquidity and asset prices.Foundations andTrends in Finance, 1, 269-364.
Ariff, M., Cheng, F.F.& Neo, V.H. (2008), Bond Markets in Malaysia and Singapore.UniversityPutra Malaysia Press, Serdang, Selangor, Malaysia.
Baek, I-M., Bandopadhyaya, A. & Du, C. (2005), Determinants of market-assessed sovereignrisk: Economic fundamentals or market risk appetite? Journal of International Money andFinance, 24 (2005), 533-548
Bheenick, E. B. (2005), An analysis of the determinants of sovereign ratings.Global FinanceJournal, 15, 251-280.
Bheenick, E. B. (2012), Do sovereign rating changes trigger spillover effects? Research inInternational Business and Finance, 26, 79-96.

1392 Cheng Fan Fah, Lim Li Hsia and Annuar Nasir
Bheenick, E. B., Brooks, R. & Yip, Y. N. (2006), Determinants of sovereign ratings: Acomparison of case-based reasoning and ordered probit approaches. Global FinanceJournal, 17, 136-154.
Cantor, R. & Packer, F. (1995), Sovereign credit ratings.Federal Reserve Bank of New YorkEconomic Policy Review, 1(3), 1-6.
Cantor, R. & Packer, F. (1996), Determinants and impacts of sovereign credit ratings.FederalReserve Bank of New York Economic Policy Review, 2, 37-53.
Cantor, R. & Packer, F. (1996a), Determinants and impacts of sovereign credit ratings.FederalReserve Bank of New York Economic Policy Review, (October), 1-15.
Cheng. F.F. & Ariff, M. (2011), Risk, return relationship in world’s sovereign bond markets: Amulticounty study. Proceeding of World Finance Conference II. 23-27 July 2011.
Cheng, F.F., Ariff, M. & Shamsher, M.R.M. (2004), Accounting earnings and share revaluation:Further exploration. Capital Market Review, 9(1&2), 21-48.
International Monetary Fund (2011), Selected Online IMF Data Sources.Retrieved December7th, 2011, from http://www.imf.org/external/np/ds/matrix.htm
Ismailescu, J. &Kazemi, H. (2010), The reaction of emerging market credit default swapspreads to sovereign credit ratings changes. Journal of Banking & Finance, 34 (2), 2861-2871.
Kaminsky, G. &Schmukler, S. L. (2002), Emerging market instability: Do sovereign ratingaffect country risk and stock return? World Bank Economic Review, 16, 171-195.
Kraussel, R. (2005), Do credit rating agencies add to the dynamics of emerging market crises?Journal of Financial Stability, 1(3), 85-355.
Li, H., Jeon, B. N., Cho, S. Y. & Chiang, T. C. (2007), The impact of sovereign rating changes andfinancial contagion on stock returns: Evidence from five Asian countries. Global FinanceJournal, 19 (2008), 46-55.
Malhotra, N.K. (2009), Basic marketing research.A decision-making approach. New Jersey: PearsonPrentice Hall.
Moody’s Investors Services (2006), Moody’s Statistical Handbook Country Credit. RetrievedNovember 28th, 2011, from http://www2.um.edu.uy/fborraz/ratings-Statisical%20handbook%20No%2006.pdf
Pukthuanthong-Le, K., Elayan, F. A. & Rose, L. C. (2007), Equity and debt market responses tosovereign credit ratings announcement. Global Finance Journal, 18, 47-83.
Reinhart, C. (2010), This time is different chartbook: Country histories on debt, default, andfinancial crises. NBER Working Paper 15815.
Standard & Poor’s (2008), Sovereign credit ratings: A Primer. Standard &Poor’s Rating Direct.Standard & Poor’s (2010), Sovereign rating and country T&C assessment histories.Retrieved
December 7th, 2011, from http://www.standardandpoors.com/ratings/articles/en/us/?assetID=1245213114875
Standard & Poor’s (2011), Ratings direct on the global credit portal: Sovereign ratings andcountry T&C Assessments. Retrieved December 7th, 2011, from http://w w w . s t a n d a r d a n d p o o r s . c o m / r a t i n g s / s o v e r e i g n s / r a t i n g s - l i s t / e n / u s /?subSectorCode=39§orId=1221186707758&subSectorId=1221187348494

Effect of Sovereign Rating Changes on Real Bonds Yields Returns 1393
Standard &Poors (2011), Credit Ratings Definitions & FAQs. Retrieved November 28th, 2011,from http://www.standardandpoors.com
Saunders, M., Lewis, P. & Thornhill, A. (2000), Research Methods for business students. Essex:Pearson Educations.
Saunders, A. (1986), The determinants of country risk: A selective survey of the literature.Journal of Banking and Finance, 3, 1-38.