Embed Size (px)
Citation preview
HAL Id: hal-01619249https://hal.archives-ouvertes.fr/hal-01619249
Submitted on 15 Mar 2019
HAL is a multi-disciplinary open accessarchive for the deposit and dissemination of sci-entific research documents, whether they are pub-lished or not. The documents may come fromteaching and research institutions in France orabroad, or from public or private research centers.
L’archive ouverte pluridisciplinaire HAL, estdestinée au dépôt et à la diffusion de documentsscientifiques de niveau recherche, publiés ou non,émanant des établissements d’enseignement et derecherche français ou étrangers, des laboratoirespublics ou privés.
Effect of the particle size and the liquid content on theshear behaviour of wet granular material
Haithem Louati, Driss Oulahna, Alain de Ryck
To cite this version:Haithem Louati, Driss Oulahna, Alain de Ryck. Effect of the particle size and the liquid content onthe shear behaviour of wet granular material. Powder Technology, Elsevier, 2017, 315, pp.398-409.�10.1016/j.powtec.2017.04.030�. �hal-01619249�
Effect of the particle size and the liquid content on the shear behaviour ofwet granular material
H.�Louati�⁎, D . 0 V M a h n a , A . d e R y c kCentre�Rapsodee,�Mines�Albi,�CNRS,�Université�de�Toulouse,�Campus�Jarlard,�F-81013�Albi�Cedex�09,�France
a b s t r a c t
The size of particle is a relevant parameter in the study of the granular material behaviour. For wet granular ma-terials, it affects the capillary force and the number of liquid bridges. We present quantitative and qualitative in-vestigations of the effect of the particle size on the steady-state shear behaviour of partiallywet granularmaterial.Two sizes of glass beads have been used: 12–40 μm and 70–110 μm in diameter and the shear behaviour wasstudied using an annular shear cell. The results show different regimes of the shear-normal stresses relationshipdepending on the particle size, with a general increase of the magnitude of the shear stress for a decrease in theparticle size.Most studies of wet granular material behaviour have focused on the pendular state of saturation with liquidbridge formed between particles. In this study, the states of saturation are explored going up to completely fillingthe space between beads of 70–110 μm.Different regimes are identified depending on the liquid fraction and theapplied normal stress. A theoretical approach was used to estimate the tensile strength for the different states ofsaturation. An agreement between both experimental and theoretical data was observed and discussed.
Keywords:Particle sizeLiquid contentCapillary forceTensile strengthShear stressWet granular material
1. Introduction
The granular material is an assembly of discrete individual particles,with a collective behaviour due to the interactions between them. Theparticle size is one of the relevant properties, which affect significantlythe behaviour of the granular material. For particle smaller than hun-dred of microns, the inter-particle forces such as the Van-der-Waalsforces are generally greater than the gravitational forces [21]. Thischanges the behaviour of the granularmaterial from a non-cohesive be-haviour to a cohesive one.With the addition of awetting liquid, the cap-illary force dominates in magnitude the Van-der-Waals force.
At small or moderate volume of liquid content, [8,18] observed theyielding of the granular material at low stress conditions, by looking atthe angle of repose or the tensile strength of a pile. The yield strength in-creases first, for liquid content of about 1% of the total volume, then sat-urates till a liquid content of 15%. This saturation is explained by theLaplace pressure in the liquid bridges, which saturates with the volumeof liquid since the curvature of the liquid-air interface is bounded by theone imposed by the particle geometry.
Recently, we have investigated the increase of the shear resistancedue to the presence of a wetting liquid in steady-state conditions, inshear mixers [14]. In order to better control the sheared plane and toquantitatively analyse the shear stress, an annular shear cell was later
used to carry out the experiments for a large range of applied normalstress from about 0.3 kPa to 12 kPa [10]. We have investigated theshear behaviour of 70–110 μm glass beads in the pendular regime. Theresults give the variation of the shear stress at steady-state as a functionof the normal stress for a wide range of liquid fraction. A non-linear re-lationship of the shear stress–normal stress was observed, implying dif-ferent regimes. In particular, an apparent cohesion appeared at highnormal stress and high liquid fraction, while it remains negligible atlow normal stress. However, the shear stress is proportional to the nor-mal stresswhen the latter is small enough,with an apparent friction co-efficient increasing with the liquid fraction.
The increase of the shear resistance in steady-state conditions wasexplained by a model where the number of capillary bridges renewedduring shearing are dependent on the rearrangements of the particlebed and hence on its density, which is affected by the normal stress ap-plied [10]. In this paper, we go further, and we investigate the effect ofsmaller particle size on the shear behaviour of partially wet granularmaterial in steady-state for different normal stresses and liquid frac-tions up to completely filling the inter-particle spaces.
2. Materials and methods
The material used in this study consists of glass beads provided bySovitec®. The glass beads are used in the experiments as supplied with-out any surface treatments, but sieved to obtain narrow size distribu-tions. Two different sizes of glass beads were used in this study:
⁎ Corresponding author.E-mail address: [email protected] (H. Louati).
70–110 μm and 12–40 μm in diameter. These sizes are chosen small toenhance the effect of the capillary forces vis-à-vis the gravitationalforces. The spreads of both particle size distributions may be evaluatedaround 0.2 and 0.6 if supposed log-normal distributed, or the coefficientof uniformity is lower than 1.5 and 3.3 respectively [22]. Following thiswork and the one by Dexter & Tanner [4], we conclude that the packingdensity for non-cohesive granular materials may increase by 0.02 to0.05 for the glass beadswith awider distribution (12–40 μm) comparedto the70–110 μmglass beads. The expected increase isweak and the ob-servations reported in Section 3.1.1 indicate that the Van-der-Waalsforces for the 12–40 μm make the smaller material to be in fact lesspacked.
The glass beads were wetted using polyethylene glycol of 400 gmolar weight (PEG 400) provided by Alfa Aesar. This liquid has beenchosen since it wets well the glass beads and has also a low volatilitycompare to water, which helps to work with small liquid fractionswith small evaporation rate. The characteristics of the PEG 400 aregiven in Table 1. The viscous forces may play an important role on thedynamic of the glass beads. We compute a capillary number, Ca, inorder to quantify the viscous effect compared to the capillary effect.The viscous effect is considered as relevant if Ca N 1. This number isgiven as Ca=μlvp ,p/γ, where μl is the dynamic viscosity of liquid, γ isthe surface tension and vp ,p is the relative particle-particle velocity.The latter is calculated based on the Stokes velocity as vp ,p=(2R2(ρp−ρg)g)/(9μg), where μg is the dynamic viscosity of ambient gas, ρp and ρgare the density of particles and the density of ambient gas respectively[23]. For our experiments, we have Ca=0.04 for 12–40 μm glassbeads and Ca=0.9 for 70–110 μmglass beads. Furthermore, the viscouseffect not only depends on the liquid properties but also on the wetpowder processing parameters. The behaviour of the wet glass beadsis studied here using an annular shear test (see more details about thedevice in Section 2.2.2). Thus, we compute another dimensionless num-ber, which is the time scale for bridge filling relative to the shear time.The viscous effect should be considered if the time scale is in the orderof a shear time [23]. The obtained values for the dimensionless numberdo not exceed 0.001 for both particle sizes. Thus, the viscous effect isconsidered less relevant in this work and wewill focus only on the cap-illary effect.
The glass beadsweremixedwith various quantities of PEG400 usinga Kenwood planetary mixer (1200 g of glass beads during 20 min). Theprocedure of mixing is important to ensure a homogeneous distributionof liquid in the granular material, especially at low liquid fractions. Thefraction of liquid is expressed as a volume ratio (VR% = volume ofliquid ∕ total volume of particles). The fractions of liquid investigatedin this study vary from 0.01% to 20% for the partially state of saturation,so-called pendular state. It is increased then from 20% to 60% in order toinvestigate more saturation states (funicular and potentially capillarystates).
2.1. Characterisation of the glass beads properties
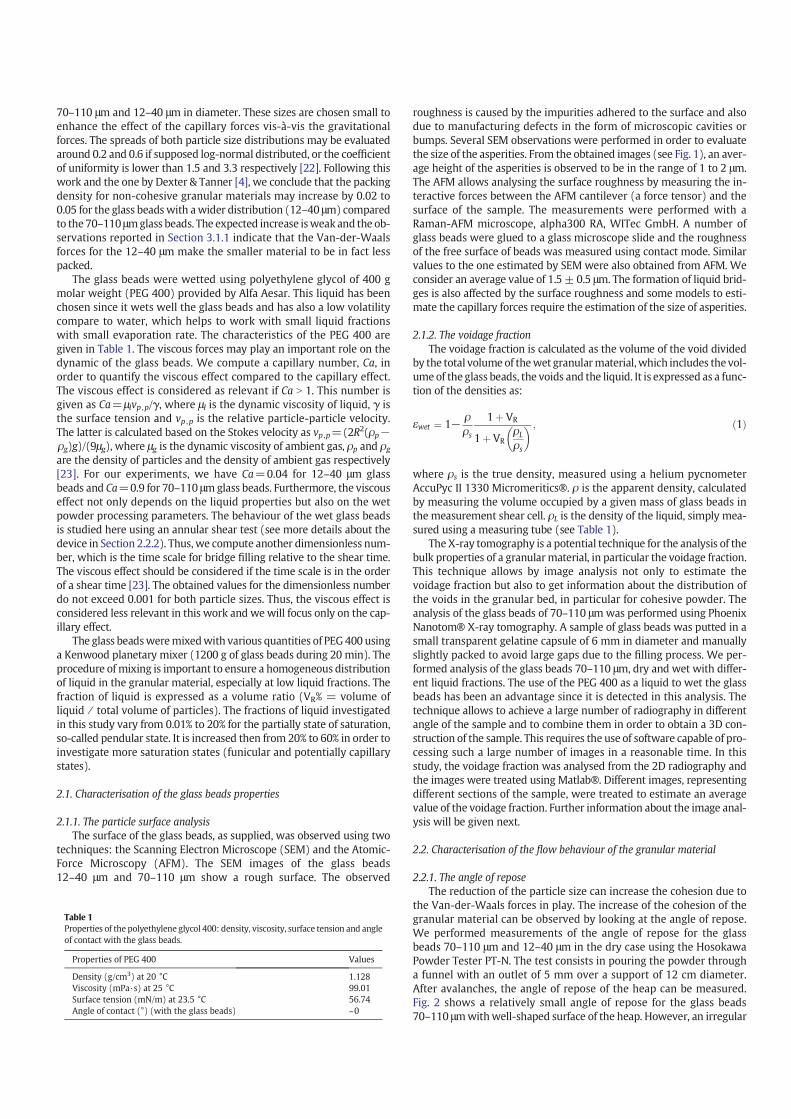
2.1.1. The particle surface analysisThe surface of the glass beads, as supplied, was observed using two
techniques: the Scanning Electron Microscope (SEM) and the Atomic-Force Microscopy (AFM). The SEM images of the glass beads12–40 μm and 70–110 μm show a rough surface. The observed
roughness is caused by the impurities adhered to the surface and alsodue to manufacturing defects in the form of microscopic cavities orbumps. Several SEM observations were performed in order to evaluatethe size of the asperities. From the obtained images (see Fig. 1), an aver-age height of the asperities is observed to be in the range of 1 to 2 μm.The AFM allows analysing the surface roughness by measuring the in-teractive forces between the AFM cantilever (a force tensor) and thesurface of the sample. The measurements were performed with aRaman-AFM microscope, alpha300 RA, WITec GmbH. A number ofglass beads were glued to a glass microscope slide and the roughnessof the free surface of beads was measured using contact mode. Similarvalues to the one estimated by SEM were also obtained from AFM. Weconsider an average value of 1.5 ± 0.5 μm. The formation of liquid brid-ges is also affected by the surface roughness and some models to esti-mate the capillary forces require the estimation of the size of asperities.
2.1.2. The voidage fractionThe voidage fraction is calculated as the volume of the void divided
by the total volume of thewet granularmaterial,which includes the vol-ume of the glass beads, the voids and the liquid. It is expressed as a func-tion of the densities as:
εwet ¼ 1−ρρs
1þ VR
1þ VRρL
ρs
! " ; ð1Þ
where ρs is the true density, measured using a helium pycnometerAccuPyc II 1330 Micromeritics®. ρ is the apparent density, calculatedby measuring the volume occupied by a given mass of glass beads inthe measurement shear cell. ρL is the density of the liquid, simply mea-sured using a measuring tube (see Table 1).
The X-ray tomography is a potential technique for the analysis of thebulk properties of a granularmaterial, in particular the voidage fraction.This technique allows by image analysis not only to estimate thevoidage fraction but also to get information about the distribution ofthe voids in the granular bed, in particular for cohesive powder. Theanalysis of the glass beads of 70–110 μmwas performed using PhoenixNanotom® X-ray tomography. A sample of glass beads was putted in asmall transparent gelatine capsule of 6 mm in diameter and manuallyslightly packed to avoid large gaps due to the filling process. We per-formed analysis of the glass beads 70–110 μm, dry and wet with differ-ent liquid fractions. The use of the PEG 400 as a liquid to wet the glassbeads has been an advantage since it is detected in this analysis. Thetechnique allows to achieve a large number of radiography in differentangle of the sample and to combine them in order to obtain a 3D con-struction of the sample. This requires the use of software capable of pro-cessing such a large number of images in a reasonable time. In thisstudy, the voidage fraction was analysed from the 2D radiography andthe images were treated using Matlab®. Different images, representingdifferent sections of the sample, were treated to estimate an averagevalue of the voidage fraction. Further information about the image anal-ysis will be given next.
2.2. Characterisation of the flow behaviour of the granular material
2.2.1. The angle of reposeThe reduction of the particle size can increase the cohesion due to
the Van-der-Waals forces in play. The increase of the cohesion of thegranular material can be observed by looking at the angle of repose.We performed measurements of the angle of repose for the glassbeads 70–110 μm and 12–40 μm in the dry case using the HosokawaPowder Tester PT-N. The test consists in pouring the powder througha funnel with an outlet of 5 mm over a support of 12 cm diameter.After avalanches, the angle of repose of the heap can be measured.Fig. 2 shows a relatively small angle of repose for the glass beads70–110 μmwithwell-shaped surface of the heap. However, an irregular
Table 1Properties of the polyethylene glycol 400: density, viscosity, surface tension and angleof contact with the glass beads.
Properties of PEG 400 Values
Density (g/cm3) at 20 °C 1.128Viscosity (mPa·s) at 25 °C 99.01Surface tension (mN/m) at 23.5 °C 56.74Angle of contact (°) (with the glass beads) ~0
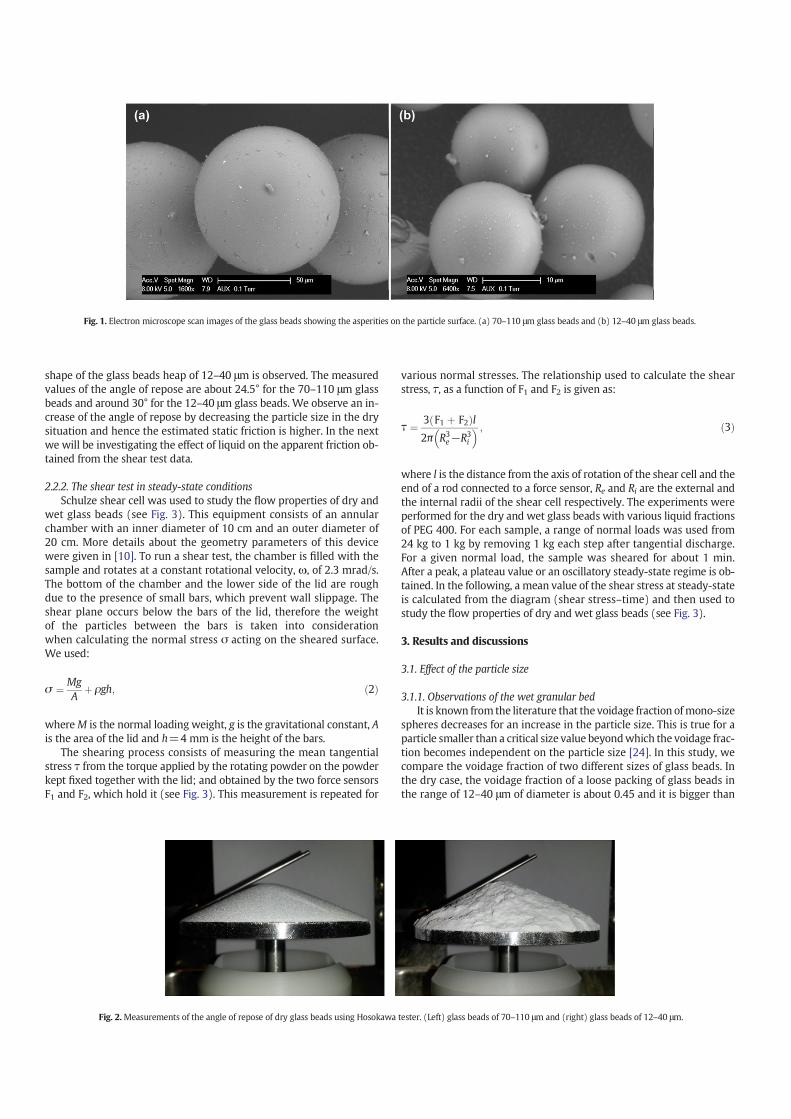
shape of the glass beads heap of 12–40 μm is observed. The measuredvalues of the angle of repose are about 24.5° for the 70–110 μm glassbeads and around 30° for the 12–40 μm glass beads. We observe an in-crease of the angle of repose by decreasing the particle size in the drysituation and hence the estimated static friction is higher. In the nextwe will be investigating the effect of liquid on the apparent friction ob-tained from the shear test data.
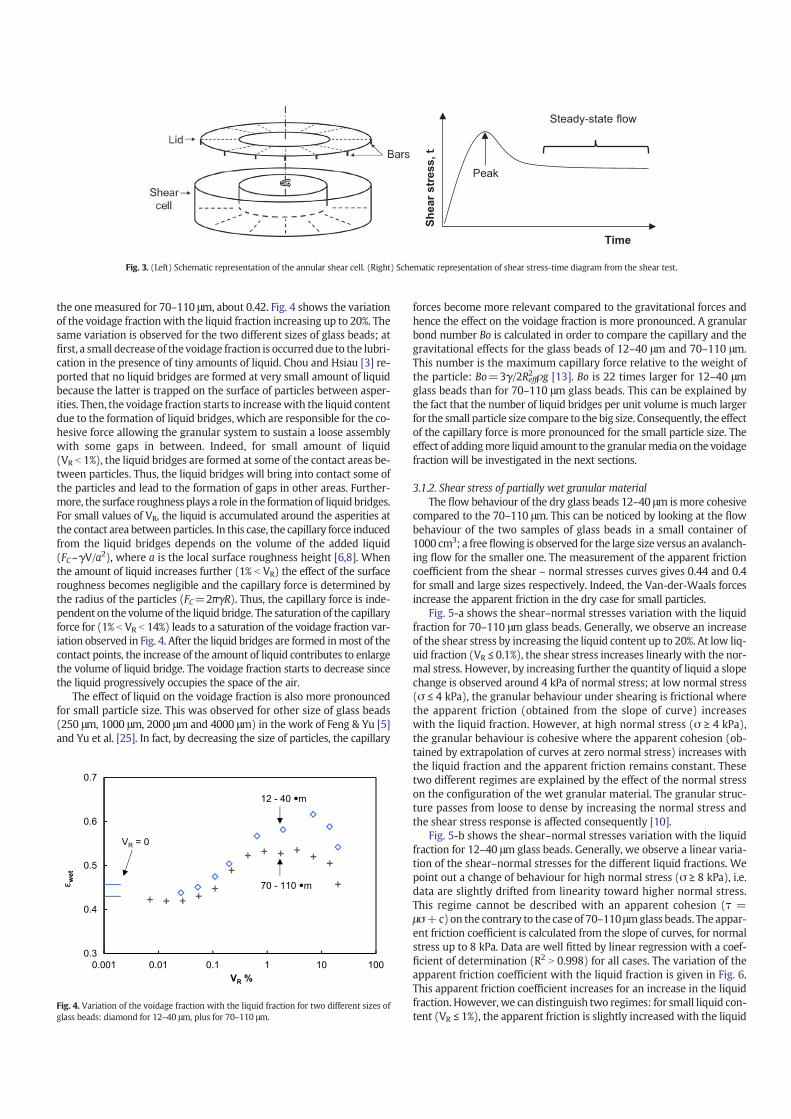
2.2.2. The shear test in steady-state conditionsSchulze shear cell was used to study the flow properties of dry and
wet glass beads (see Fig. 3). This equipment consists of an annularchamber with an inner diameter of 10 cm and an outer diameter of20 cm. More details about the geometry parameters of this devicewere given in [10]. To run a shear test, the chamber is filled with thesample and rotates at a constant rotational velocity, ω, of 2.3 mrad/s.The bottom of the chamber and the lower side of the lid are roughdue to the presence of small bars, which prevent wall slippage. Theshear plane occurs below the bars of the lid, therefore the weightof the particles between the bars is taken into considerationwhen calculating the normal stress σ acting on the sheared surface.We used:
σ ¼ MgA
þ ρgh; ð2Þ
whereM is the normal loading weight, g is the gravitational constant, Ais the area of the lid and h=4 mm is the height of the bars.
The shearing process consists of measuring the mean tangentialstress τ from the torque applied by the rotating powder on the powderkept fixed together with the lid; and obtained by the two force sensorsF1 and F2, which hold it (see Fig. 3). This measurement is repeated for
various normal stresses. The relationship used to calculate the shearstress, τ, as a function of F1 and F2 is given as:
τ ¼ 3 F1 þ F2ð Þl2π R3
e−R3i
# $ ; ð3Þ
where l is the distance from the axis of rotation of the shear cell and theend of a rod connected to a force sensor, Re and Ri are the external andthe internal radii of the shear cell respectively. The experiments wereperformed for the dry and wet glass beads with various liquid fractionsof PEG 400. For each sample, a range of normal loads was used from24 kg to 1 kg by removing 1 kg each step after tangential discharge.For a given normal load, the sample was sheared for about 1 min.After a peak, a plateau value or an oscillatory steady-state regime is ob-tained. In the following, a mean value of the shear stress at steady-stateis calculated from the diagram (shear stress–time) and then used tostudy the flow properties of dry and wet glass beads (see Fig. 3).
3. Results and discussions
3.1. Effect of the particle size
3.1.1. Observations of the wet granular bedIt is known from the literature that the voidage fraction ofmono-size
spheres decreases for an increase in the particle size. This is true for aparticle smaller than a critical size value beyondwhich the voidage frac-tion becomes independent on the particle size [24]. In this study, wecompare the voidage fraction of two different sizes of glass beads. Inthe dry case, the voidage fraction of a loose packing of glass beads inthe range of 12–40 μm of diameter is about 0.45 and it is bigger than
Fig. 1. Electron microscope scan images of the glass beads showing the asperities on the particle surface. (a) 70–110 μm glass beads and (b) 12–40 μm glass beads.
Fig. 2.Measurements of the angle of repose of dry glass beads using Hosokawa tester. (Left) glass beads of 70–110 μm and (right) glass beads of 12–40 μm.
the onemeasured for 70–110 μm, about 0.42. Fig. 4 shows the variationof the voidage fractionwith the liquid fraction increasing up to 20%. Thesame variation is observed for the two different sizes of glass beads; atfirst, a small decrease of the voidage fraction is occurreddue to the lubri-cation in the presence of tiny amounts of liquid. Chou and Hsiau [3] re-ported that no liquid bridges are formed at very small amount of liquidbecause the latter is trapped on the surface of particles between asper-ities. Then, the voidage fraction starts to increasewith the liquid contentdue to the formation of liquid bridges, which are responsible for the co-hesive force allowing the granular system to sustain a loose assemblywith some gaps in between. Indeed, for small amount of liquid(VR b 1%), the liquid bridges are formed at some of the contact areas be-tween particles. Thus, the liquid bridges will bring into contact some ofthe particles and lead to the formation of gaps in other areas. Further-more, the surface roughness plays a role in the formation of liquid bridges.For small values of VR, the liquid is accumulated around the asperities atthe contact area betweenparticles. In this case, the capillary force inducedfrom the liquid bridges depends on the volume of the added liquid(FC~γV/a2), where a is the local surface roughness height [6,8]. Whenthe amount of liquid increases further (1% b VR) the effect of the surfaceroughness becomes negligible and the capillary force is determined bythe radius of the particles (FC=2πγR). Thus, the capillary force is inde-pendent on the volume of the liquid bridge. The saturation of the capillaryforce for (1% b VR b 14%) leads to a saturation of the voidage fraction var-iation observed in Fig. 4. After the liquid bridges are formed inmost of thecontact points, the increase of the amount of liquid contributes to enlargethe volume of liquid bridge. The voidage fraction starts to decrease sincethe liquid progressively occupies the space of the air.
The effect of liquid on the voidage fraction is also more pronouncedfor small particle size. This was observed for other size of glass beads(250 μm, 1000 μm, 2000 μm and 4000 μm) in the work of Feng & Yu [5]and Yu et al. [25]. In fact, by decreasing the size of particles, the capillary
forces become more relevant compared to the gravitational forces andhence the effect on the voidage fraction is more pronounced. A granularbond number Bo is calculated in order to compare the capillary and thegravitational effects for the glass beads of 12–40 μm and 70–110 μm.This number is the maximum capillary force relative to the weight ofthe particle: Bo=3γ/2Reff2 ρg [13]. Bo is 22 times larger for 12–40 μmglass beads than for 70–110 μm glass beads. This can be explained bythe fact that the number of liquid bridges per unit volume is much largerfor the small particle size compare to the big size. Consequently, the effectof the capillary force is more pronounced for the small particle size. Theeffect of addingmore liquid amount to the granularmedia on the voidagefraction will be investigated in the next sections.
3.1.2. Shear stress of partially wet granular materialThe flow behaviour of the dry glass beads 12–40 μm is more cohesive
compared to the 70–110 μm. This can be noticed by looking at the flowbehaviour of the two samples of glass beads in a small container of1000 cm3; a freeflowing is observed for the large size versus an avalanch-ing flow for the smaller one. The measurement of the apparent frictioncoefficient from the shear – normal stresses curves gives 0.44 and 0.4for small and large sizes respectively. Indeed, the Van-der-Waals forcesincrease the apparent friction in the dry case for small particles.
Fig. 5-a shows the shear–normal stresses variation with the liquidfraction for 70–110 μm glass beads. Generally, we observe an increaseof the shear stress by increasing the liquid content up to 20%. At low liq-uid fraction (VR ≤ 0.1%), the shear stress increases linearly with the nor-mal stress. However, by increasing further the quantity of liquid a slopechange is observed around 4 kPa of normal stress; at low normal stress(σ ≤ 4 kPa), the granular behaviour under shearing is frictional wherethe apparent friction (obtained from the slope of curve) increaseswith the liquid fraction. However, at high normal stress (σ ≥ 4 kPa),the granular behaviour is cohesive where the apparent cohesion (ob-tained by extrapolation of curves at zero normal stress) increases withthe liquid fraction and the apparent friction remains constant. Thesetwo different regimes are explained by the effect of the normal stresson the configuration of the wet granular material. The granular struc-ture passes from loose to dense by increasing the normal stress andthe shear stress response is affected consequently [10].
Fig. 5-b shows the shear–normal stresses variation with the liquidfraction for 12–40 μm glass beads. Generally, we observe a linear varia-tion of the shear–normal stresses for the different liquid fractions. Wepoint out a change of behaviour for high normal stress (σ ≥ 8 kPa), i.e.data are slightly drifted from linearity toward higher normal stress.This regime cannot be described with an apparent cohesion (τ =μσ+c)on the contrary to the case of 70–110 μmglass beads. The appar-ent friction coefficient is calculated from the slope of curves, for normalstress up to 8 kPa. Data are well fitted by linear regression with a coef-ficient of determination (R2 N 0.998) for all cases. The variation of theapparent friction coefficient with the liquid fraction is given in Fig. 6.This apparent friction coefficient increases for an increase in the liquidfraction. However, we can distinguish two regimes: for small liquid con-tent (VR ≤ 1%), the apparent friction is slightly increased with the liquid
Peak
Steady-state flow
Time
Sh
ea
r s
tre
ss
, t
Fig. 3. (Left) Schematic representation of the annular shear cell. (Right) Schematic representation of shear stress-time diagram from the shear test.
0.3
0.4
0.5
0.6
0.7
0.001 0.01 0.1 1 10 100
we
t
VR
%
12 - 40 •m
70 - 110 •m
VR
= 0
Fig. 4. Variation of the voidage fraction with the liquid fraction for two different sizes ofglass beads: diamond for 12–40 μm, plus for 70–110 μm.
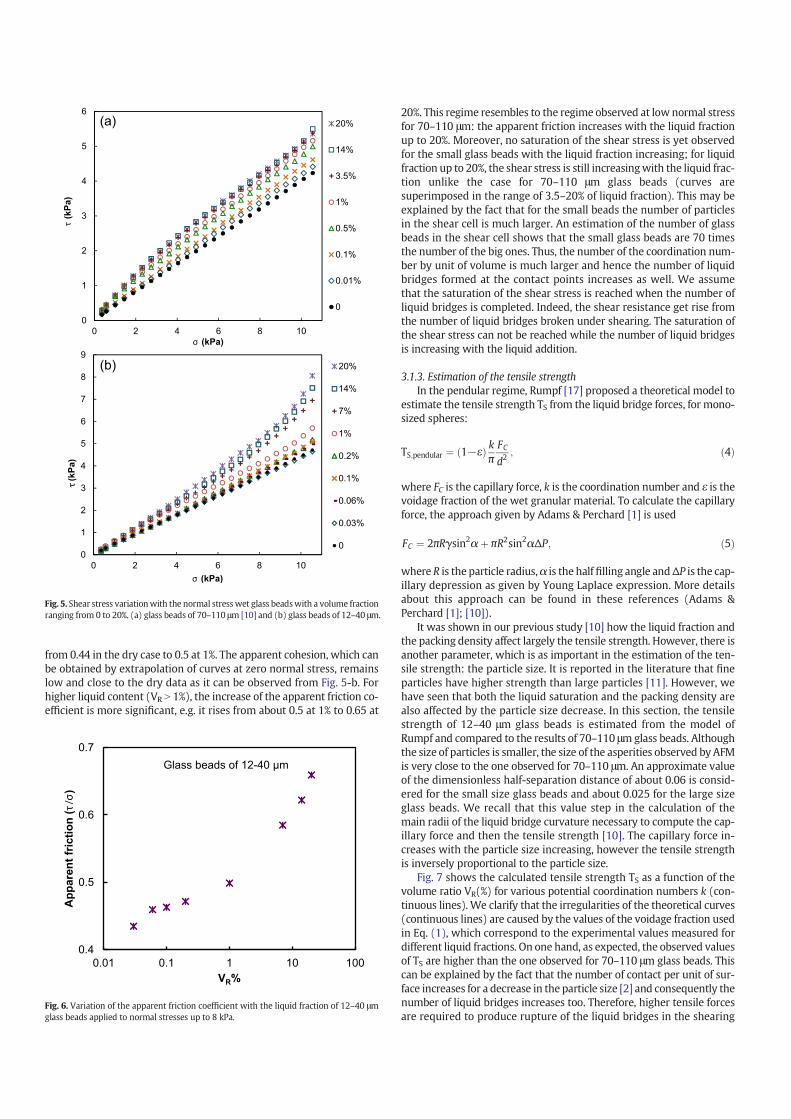
from 0.44 in the dry case to 0.5 at 1%. The apparent cohesion, which canbe obtained by extrapolation of curves at zero normal stress, remainslow and close to the dry data as it can be observed from Fig. 5-b. Forhigher liquid content (VR N 1%), the increase of the apparent friction co-efficient is more significant, e.g. it rises from about 0.5 at 1% to 0.65 at
20%. This regime resembles to the regime observed at low normal stressfor 70–110 μm: the apparent friction increases with the liquid fractionup to 20%. Moreover, no saturation of the shear stress is yet observedfor the small glass beads with the liquid fraction increasing; for liquidfraction up to 20%, the shear stress is still increasingwith the liquid frac-tion unlike the case for 70–110 μm glass beads (curves aresuperimposed in the range of 3.5–20% of liquid fraction). This may beexplained by the fact that for the small beads the number of particlesin the shear cell is much larger. An estimation of the number of glassbeads in the shear cell shows that the small glass beads are 70 timesthe number of the big ones. Thus, the number of the coordination num-ber by unit of volume is much larger and hence the number of liquidbridges formed at the contact points increases as well. We assumethat the saturation of the shear stress is reached when the number ofliquid bridges is completed. Indeed, the shear resistance get rise fromthe number of liquid bridges broken under shearing. The saturation ofthe shear stress can not be reached while the number of liquid bridgesis increasing with the liquid addition.
3.1.3. Estimation of the tensile strengthIn the pendular regime, Rumpf [17] proposed a theoretical model to
estimate the tensile strength TS from the liquid bridge forces, for mono-sized spheres:
TS;pendular ¼ 1−εð Þ kπFCd2
; ð4Þ
where FC is the capillary force, k is the coordination number and ε is thevoidage fraction of the wet granular material. To calculate the capillaryforce, the approach given by Adams & Perchard [1] is used
FC ¼ 2πRγsin2α þ πR2sin2αΔP; ð5Þ
where R is the particle radius,α is the half filling angle andΔP is the cap-illary depression as given by Young Laplace expression. More detailsabout this approach can be found in these references (Adams &Perchard [1]; [10]).
It was shown in our previous study [10] how the liquid fraction andthe packing density affect largely the tensile strength. However, there isanother parameter, which is as important in the estimation of the ten-sile strength: the particle size. It is reported in the literature that fineparticles have higher strength than large particles [11]. However, wehave seen that both the liquid saturation and the packing density arealso affected by the particle size decrease. In this section, the tensilestrength of 12–40 μm glass beads is estimated from the model ofRumpf and compared to the results of 70–110 μmglass beads. Althoughthe size of particles is smaller, the size of the asperities observed by AFMis very close to the one observed for 70–110 μm. An approximate valueof the dimensionless half-separation distance of about 0.06 is consid-ered for the small size glass beads and about 0.025 for the large sizeglass beads. We recall that this value step in the calculation of themain radii of the liquid bridge curvature necessary to compute the cap-illary force and then the tensile strength [10]. The capillary force in-creases with the particle size increasing, however the tensile strengthis inversely proportional to the particle size.
Fig. 7 shows the calculated tensile strength TS as a function of thevolume ratio VR(%) for various potential coordination numbers k (con-tinuous lines). We clarify that the irregularities of the theoretical curves(continuous lines) are caused by the values of the voidage fraction usedin Eq. (1), which correspond to the experimental values measured fordifferent liquid fractions. On one hand, as expected, the observed valuesof TS are higher than the one observed for 70–110 μm glass beads. Thiscan be explained by the fact that the number of contact per unit of sur-face increases for a decrease in the particle size [2] and consequently thenumber of liquid bridges increases too. Therefore, higher tensile forcesare required to produce rupture of the liquid bridges in the shearing
0
1
2
3
4
5
6
7
8
9
0 2 4 6 8 10
(k
Pa
)
(kPa)
20%
14%
7%
1%
0.2%
0.1%
0.06%
0.03%
0
(b)
0
1
2
3
4
5
6
0 2 4 6 8 10
(k
Pa
)
(kPa)
20%
14%
3.5%
1%
0.5%
0.1%
0.01%
0
(a)
Fig. 5. Shear stress variationwith the normal stresswet glass beadswith a volume fractionranging from 0 to 20%. (a) glass beads of 70–110 μm [10] and (b) glass beads of 12–40 μm.
0.4
0.5
0.6
0.7
0.01 0.1 1 10 100
Ap
pa
re
nt f
ric
tio
n (
)
VR%
Glass beads of 12-40 µm
Fig. 6. Variation of the apparent friction coefficient with the liquid fraction of 12–40 μmglass beads applied to normal stresses up to 8 kPa.
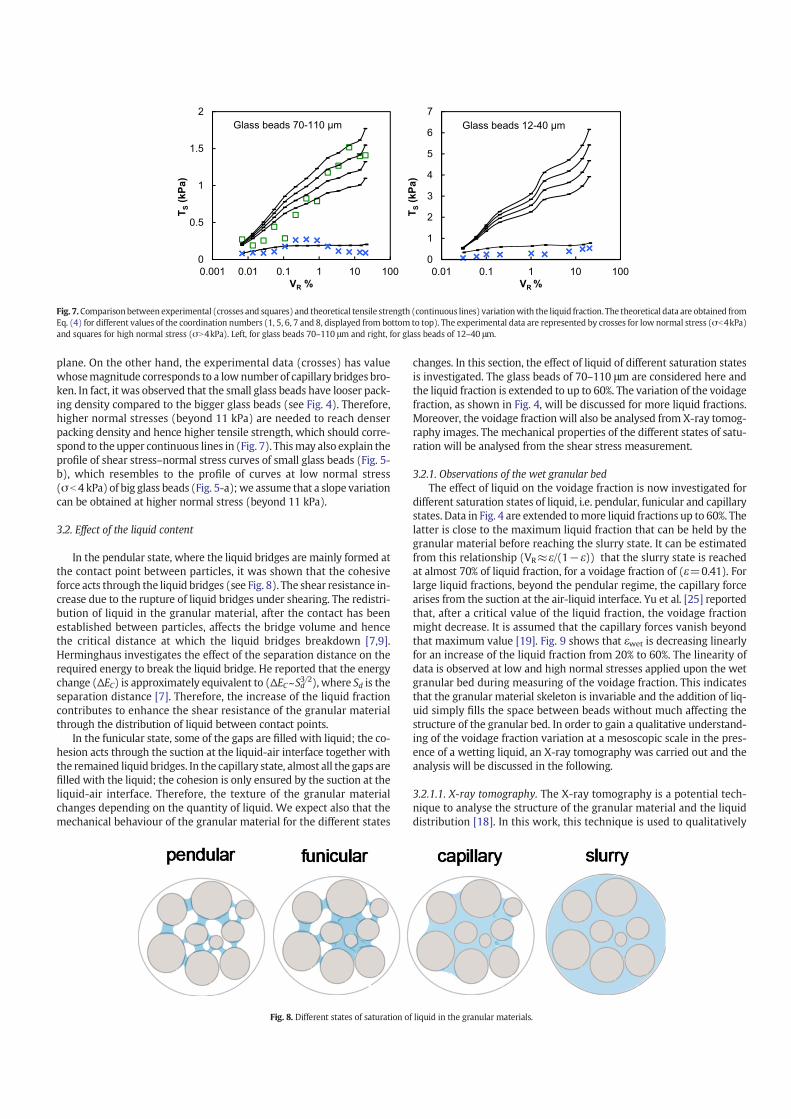
plane. On the other hand, the experimental data (crosses) has valuewhosemagnitude corresponds to a lownumber of capillary bridges bro-ken. In fact, it was observed that the small glass beads have looser pack-ing density compared to the bigger glass beads (see Fig. 4). Therefore,higher normal stresses (beyond 11 kPa) are needed to reach denserpacking density and hence higher tensile strength, which should corre-spond to the upper continuous lines in (Fig. 7). Thismay also explain theprofile of shear stress–normal stress curves of small glass beads (Fig. 5-b), which resembles to the profile of curves at low normal stress(σ b 4 kPa) of big glass beads (Fig. 5-a);we assume that a slope variationcan be obtained at higher normal stress (beyond 11 kPa).
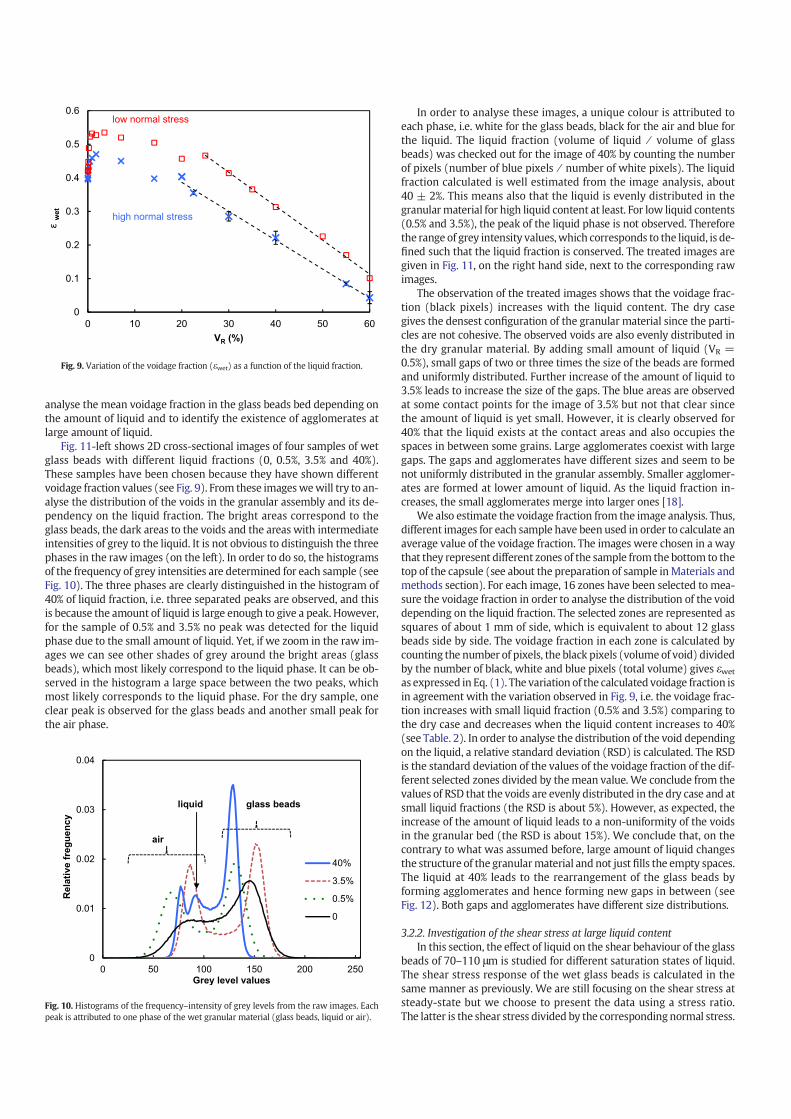
3.2. Effect of the liquid content
In the pendular state, where the liquid bridges are mainly formed atthe contact point between particles, it was shown that the cohesiveforce acts through the liquid bridges (see Fig. 8). The shear resistance in-crease due to the rupture of liquid bridges under shearing. The redistri-bution of liquid in the granular material, after the contact has beenestablished between particles, affects the bridge volume and hencethe critical distance at which the liquid bridges breakdown [7,9].Herminghaus investigates the effect of the separation distance on therequired energy to break the liquid bridge. He reported that the energychange (ΔEC) is approximately equivalent to (ΔEC~Sd3/2), where Sd is theseparation distance [7]. Therefore, the increase of the liquid fractioncontributes to enhance the shear resistance of the granular materialthrough the distribution of liquid between contact points.
In the funicular state, some of the gaps are filled with liquid; the co-hesion acts through the suction at the liquid-air interface together withthe remained liquid bridges. In the capillary state, almost all the gaps arefilled with the liquid; the cohesion is only ensured by the suction at theliquid-air interface. Therefore, the texture of the granular materialchanges depending on the quantity of liquid. We expect also that themechanical behaviour of the granular material for the different states
changes. In this section, the effect of liquid of different saturation statesis investigated. The glass beads of 70–110 μm are considered here andthe liquid fraction is extended to up to 60%. The variation of the voidagefraction, as shown in Fig. 4, will be discussed for more liquid fractions.Moreover, the voidage fraction will also be analysed from X-ray tomog-raphy images. The mechanical properties of the different states of satu-ration will be analysed from the shear stress measurement.
3.2.1. Observations of the wet granular bedThe effect of liquid on the voidage fraction is now investigated for
different saturation states of liquid, i.e. pendular, funicular and capillarystates. Data in Fig. 4 are extended tomore liquid fractions up to 60%. Thelatter is close to the maximum liquid fraction that can be held by thegranular material before reaching the slurry state. It can be estimatedfrom this relationship (VR≈ε/(1−ε)) that the slurry state is reachedat almost 70% of liquid fraction, for a voidage fraction of (ε=0.41). Forlarge liquid fractions, beyond the pendular regime, the capillary forcearises from the suction at the air-liquid interface. Yu et al. [25] reportedthat, after a critical value of the liquid fraction, the voidage fractionmight decrease. It is assumed that the capillary forces vanish beyondthat maximum value [19]. Fig. 9 shows that εwet is decreasing linearlyfor an increase of the liquid fraction from 20% to 60%. The linearity ofdata is observed at low and high normal stresses applied upon the wetgranular bed during measuring of the voidage fraction. This indicatesthat the granular material skeleton is invariable and the addition of liq-uid simply fills the space between beads without much affecting thestructure of the granular bed. In order to gain a qualitative understand-ing of the voidage fraction variation at a mesoscopic scale in the pres-ence of a wetting liquid, an X-ray tomography was carried out and theanalysis will be discussed in the following.
3.2.1.1. X-ray tomography. The X-ray tomography is a potential tech-nique to analyse the structure of the granular material and the liquiddistribution [18]. In this work, this technique is used to qualitatively
0
1
2
3
4
5
6
7
0.01 0.1 1 10 100
TS
(k
Pa
)
VR
%
0
0.5
1
1.5
2
0.001 0.01 0.1 1 10 100
TS
(k
Pa
)
VR
%
Glass beads 70-110 µm Glass beads 12-40 µm
Fig. 7.Comparisonbetween experimental (crosses and squares) and theoretical tensile strength (continuous lines) variationwith the liquid fraction. The theoretical data are obtained fromEq. (4) for different values of the coordination numbers (1, 5, 6, 7 and 8, displayed from bottom to top). The experimental data are represented by crosses for low normal stress (σb4kPa)and squares for high normal stress (σN4kPa). Left, for glass beads 70–110 μm and right, for glass beads of 12–40 μm.
Fig. 8. Different states of saturation of liquid in the granular materials.
analyse the mean voidage fraction in the glass beads bed depending onthe amount of liquid and to identify the existence of agglomerates atlarge amount of liquid.
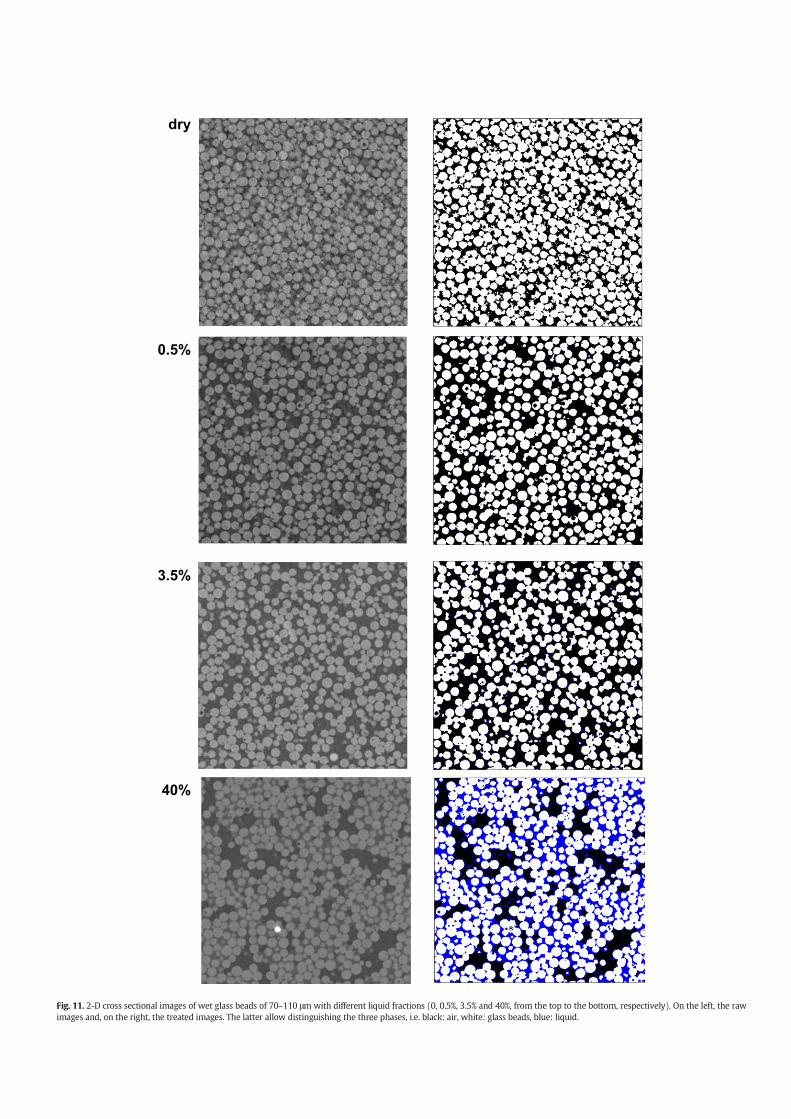
Fig. 11-left shows 2D cross-sectional images of four samples of wetglass beads with different liquid fractions (0, 0.5%, 3.5% and 40%).These samples have been chosen because they have shown differentvoidage fraction values (see Fig. 9). From these imageswewill try to an-alyse the distribution of the voids in the granular assembly and its de-pendency on the liquid fraction. The bright areas correspond to theglass beads, the dark areas to the voids and the areas with intermediateintensities of grey to the liquid. It is not obvious to distinguish the threephases in the raw images (on the left). In order to do so, the histogramsof the frequency of grey intensities are determined for each sample (seeFig. 10). The three phases are clearly distinguished in the histogram of40% of liquid fraction, i.e. three separated peaks are observed, and thisis because the amount of liquid is large enough to give a peak. However,for the sample of 0.5% and 3.5% no peak was detected for the liquidphase due to the small amount of liquid. Yet, if we zoom in the raw im-ages we can see other shades of grey around the bright areas (glassbeads), which most likely correspond to the liquid phase. It can be ob-served in the histogram a large space between the two peaks, whichmost likely corresponds to the liquid phase. For the dry sample, oneclear peak is observed for the glass beads and another small peak forthe air phase.
In order to analyse these images, a unique colour is attributed toeach phase, i.e. white for the glass beads, black for the air and blue forthe liquid. The liquid fraction (volume of liquid ∕ volume of glassbeads) was checked out for the image of 40% by counting the numberof pixels (number of blue pixels ∕ number of white pixels). The liquidfraction calculated is well estimated from the image analysis, about40 ± 2%. This means also that the liquid is evenly distributed in thegranularmaterial for high liquid content at least. For low liquid contents(0.5% and 3.5%), the peak of the liquid phase is not observed. Thereforethe range of grey intensity values,which corresponds to the liquid, is de-fined such that the liquid fraction is conserved. The treated images aregiven in Fig. 11, on the right hand side, next to the corresponding rawimages.
The observation of the treated images shows that the voidage frac-tion (black pixels) increases with the liquid content. The dry casegives the densest configuration of the granular material since the parti-cles are not cohesive. The observed voids are also evenly distributed inthe dry granular material. By adding small amount of liquid (VR =0.5%), small gaps of two or three times the size of the beads are formedand uniformly distributed. Further increase of the amount of liquid to3.5% leads to increase the size of the gaps. The blue areas are observedat some contact points for the image of 3.5% but not that clear sincethe amount of liquid is yet small. However, it is clearly observed for40% that the liquid exists at the contact areas and also occupies thespaces in between some grains. Large agglomerates coexist with largegaps. The gaps and agglomerates have different sizes and seem to benot uniformly distributed in the granular assembly. Smaller agglomer-ates are formed at lower amount of liquid. As the liquid fraction in-creases, the small agglomerates merge into larger ones [18].
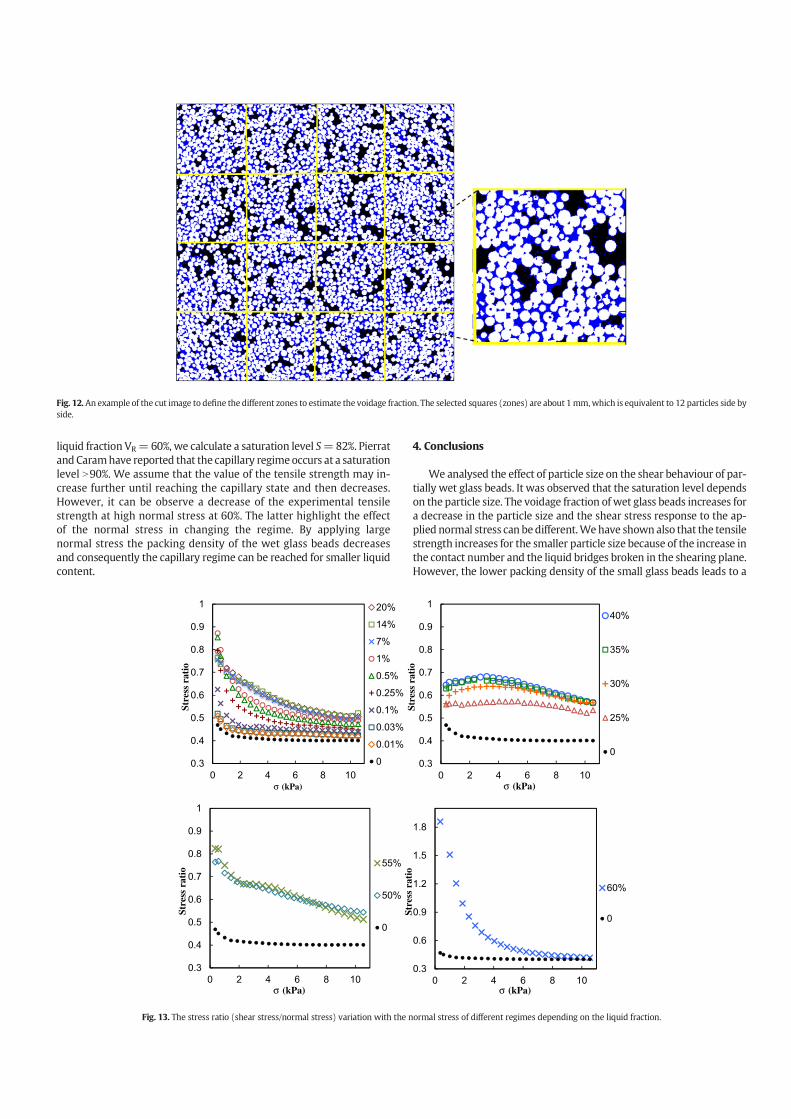
We also estimate the voidage fraction from the image analysis. Thus,different images for each sample have been used in order to calculate anaverage value of the voidage fraction. The images were chosen in a waythat they represent different zones of the sample from the bottom to thetop of the capsule (see about the preparation of sample inMaterials andmethods section). For each image, 16 zones have been selected to mea-sure the voidage fraction in order to analyse the distribution of the voiddepending on the liquid fraction. The selected zones are represented assquares of about 1 mm of side, which is equivalent to about 12 glassbeads side by side. The voidage fraction in each zone is calculated bycounting the number of pixels, the black pixels (volume of void) dividedby the number of black, white and blue pixels (total volume) gives εwet
as expressed in Eq. (1). The variation of the calculated voidage fraction isin agreement with the variation observed in Fig. 9, i.e. the voidage frac-tion increases with small liquid fraction (0.5% and 3.5%) comparing tothe dry case and decreases when the liquid content increases to 40%(see Table. 2). In order to analyse the distribution of the void dependingon the liquid, a relative standard deviation (RSD) is calculated. The RSDis the standard deviation of the values of the voidage fraction of the dif-ferent selected zones divided by themean value. We conclude from thevalues of RSD that the voids are evenly distributed in the dry case and atsmall liquid fractions (the RSD is about 5%). However, as expected, theincrease of the amount of liquid leads to a non-uniformity of the voidsin the granular bed (the RSD is about 15%). We conclude that, on thecontrary to what was assumed before, large amount of liquid changesthe structure of the granularmaterial and not just fills the empty spaces.The liquid at 40% leads to the rearrangement of the glass beads byforming agglomerates and hence forming new gaps in between (seeFig. 12). Both gaps and agglomerates have different size distributions.
3.2.2. Investigation of the shear stress at large liquid contentIn this section, the effect of liquid on the shear behaviour of the glass
beads of 70–110 μm is studied for different saturation states of liquid.The shear stress response of the wet glass beads is calculated in thesame manner as previously. We are still focusing on the shear stress atsteady-state but we choose to present the data using a stress ratio.The latter is the shear stress divided by the corresponding normal stress.
0
0.1
0.2
0.3
0.4
0.5
0.6
0 10 20 30 40 50 60
we
t
VR
(%)
low normal stress
high normal stress
Fig. 9. Variation of the voidage fraction (εwet) as a function of the liquid fraction.
0
0.01
0.02
0.03
0.04
0 50 100 150 200 250
Re
lativ
e f
re
gu
en
cy
Grey level values
40%
3.5%
0.5%
0
glass beads
air
liquid
Fig. 10. Histograms of the frequency–intensity of grey levels from the raw images. Eachpeak is attributed to one phase of the wet granular material (glass beads, liquid or air).
dry
0.5%
3.5%
40%
Fig. 11. 2-D cross sectional images of wet glass beads of 70–110 μm with different liquid fractions (0, 0.5%, 3.5% and 40%, from the top to the bottom, respectively). On the left, the rawimages and, on the right, the treated images. The latter allow distinguishing the three phases, i.e. black: air, white: glass beads, blue: liquid.

The presentation of the data in this manner helps to illustrate better thecontribution of the capillary force on the shear stress. Also, it allowsdistinguishing different regimes of the stress ratio variation dependingon the liquid fractions as you can see in Fig. 13. We can distinguishfour regimes:
a) For liquid fraction varying between 0.01% and 20%: an overview ofall the data shows that the stress ratio increases with the liquid frac-tion and decreases by increasing the normal stress. A critical stressratio value is observed at high normal stress, i.e. the stress ratio be-comes independent on the normal stress. Depending on the amountof liquid, this constant value is obtained at different normal stressvalues. Indeed, the value of the critical normal stress (value fromwhich the stress ratio becomes constant) increases with the liquidfraction. This assumes that the effect of the capillary force is morepronounced at low normal stresses applied to the granular materialcomparing to the frictional force. Also, the effect of the amount of liq-uid is more relevant at low normal stresses than at high normalstresses.
b) For liquid fraction varying between 25% and 40%: the stress ratio isalmost independent on the normal stress. An increase of the stressratio is observed from 25% to 30% of liquid fraction, however no var-iation is observed between 30% and 40% where data aresuperimposed. TheX-ray tomography for 40% shows that the regimecorresponds to the funicular state of saturation where the glassbeads form agglomerates with different gaps in between.
c) For liquid fraction varying between 50% and 55%: the stress ratiovariation resembles to the one observed in regime a). In comparisonwith the variation in regime b), the stress ratio values increase at lownormal stress but decrease at high normal stress. This means that byapplying high normal stress to the wet glass beads, we reduce thevoidage fraction and hence we get closer to the capillary regimewhere the capillary force decreases. The observation of the voidagefraction for 55% at high normal stress shows that the void only pre-sents 10% of the total volume of the granular material (see Fig. 9).
d) For liquid fraction of 60%: the stress ratio decreases for an increaseof the normal stress. At high normal stress, the stress ratio joins thevalue obtained for the dry case. This means that the capillary regimeis reached and overcame at high normal stresses since the stressratio get back to the dry one, i.e. the gaps are totally filled by liquidand the capillary force vanished. Indeed the suction at the interfaceair–liquid is equal to zero when the particles are fully immersed.
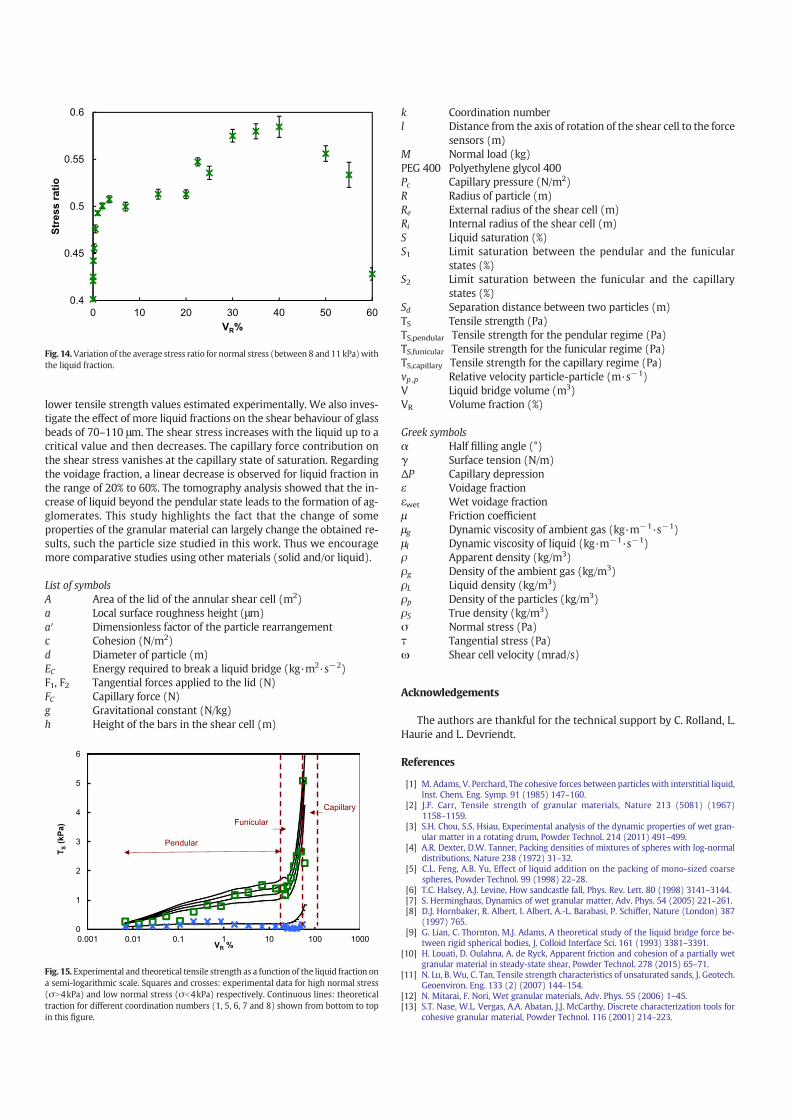
Fig. 14 shows the variation of the mean value of the stress ratio cal-culated at high normal stress between 8 kPa and 11 kPa as a function ofthe liquid fraction in the range of 0.01% to 60%. The shear stress evolu-tion of the wet glass beads can be analysed from this graph. First, an in-crease of the shear stress with the liquid is observed until saturation isreached. The stress ratio goes up from 0.4 to 0.5 just by adding 1% of liq-uid. After saturation, the shear stress increases again from about 0.5 to0.6 when the liquid fraction goes from 20% to 40%. At around 40%, themaximum shear stress is observed and after that any increase of liquidleads to decrease the stress.
3.2.3. Estimation of the tensile strengthIn this section, we investigate the tensile strength in the funicular
and capillary states of saturation. The model of Rumpf is only valid forthe pendular state,where the capillary force is estimated from the liquidbridges distributed across the surface of rupture of the agglomerate. Inthe capillary state, the liquid fills all the space between particles andthe force to hold the particles together is only produced from the capil-lary pressure, Pc, at the agglomerate surface. The tensile strength isgiven by Schubert [15] as:
TS;capillary ¼ SPc; ð6Þ
where Pc is the capillary pressure and is given as:
Pc ¼ a01−εε
γd
ð7Þ
where a′ is a dimensionless factor ranging between 6 and 8,which is de-pendent on the particles rearrangement.
Using the assumption to estimate the coordination number, k, fromthe voidage fraction as k=π/ε [16], Eq. (7) can be written as:
Pc ¼ a01−επ
kγd
ð8Þ
S is the liquid saturation, which is defined as the volume of liquid di-vided by the volume of void in the granular material and expressed as:
S ¼ 1−εε
VR: ð9Þ
In the funicular state, the tensile strength is estimated from thoseobtained in the pendular state and the capillary state. Indeed, zoneswith liquid bridges and zones completely saturated with liquid coexistin the funicular regime [15]. Therefore, the capillary force arises fromthe liquid bridge forces and the capillary pressure. The tensile strengthin the funicular regime is expressed as:
TS;funicular ¼ TS;capillaryS2−SS2−S1
þ TS;pendularS−S1S2−S1
; ð10Þ
where S1 is the limit saturation between the pendular and the funicularstates and S2 is the limit saturation between the funicular and the capil-lary states. Two approximate values of S1 and S2 are considered as 0.25and 0.9 respectively, from the literature [15].
It has been reported that the cohesive force due to the addition ofliquid rises in the pendular, funicular and capillary states. This cohesionleads to a finite tensile strength in quasi-static experiments [12]. Fig. 15shows the theoretical data (continuous lines) and experimental data(crosses or squares) of the tensile strength for wide range of the liquidfraction up to 60%. The experimental tensile strength values are obtain-ed by linear extrapolation of curves in Fig. 5-a [τ= μ(σ+TS)], distinctlyat low normal stress (σ ≤ 4 kPa) and high normal stress (σ ≥ 4 kPa). Thetensile strength, at high normal stress (squares), increases for an in-crease of the liquid fraction while it remains small at low normal stress(crosses).We observe a good agreement between the experimental andtheoretical data. The slope of the curves at high normal stress changessignificantly at the boundary between the pendular and the funicularstates;we observe a significant increase of the tensile strength in the fu-nicular state compared to the pendular state. Mitarai and Nori have re-ported that the tensile strengthmay either increase or decreasewith theliquid fraction in the funicular state of saturation. We distinguish an in-crease of the tensile strength at high normal stress since the capillaryforces rise from the pendular to the funicular regime. On the contrary,the tensile strength remains low and perhaps decreases at low normalstress as a result of the size enlargement of gaps and agglomerates inthe granular bed. The rolling rearrangement of the agglomeratesunder traction leads to the breakage of less than one liquid bridge pergrains and consequently to reduce the tensile strength value.
Regarding the capillary state, it seems from the estimation of the sat-uration level (see Eq. (9)) that it is not reached yet. For the maximum
Table 2Values of the voidage fraction εwet and the RSD for each liquid fraction.
Liquid fraction 0 0.5% 3.5% 40%
Average εwet 0.31 0.46 0.45 0.15RSD 5% 5.2% 3% 15%
liquid fraction VR= 60%, we calculate a saturation level S=82%. Pierratand Caramhave reported that the capillary regimeoccurs at a saturationlevel N90%. We assume that the value of the tensile strength may in-crease further until reaching the capillary state and then decreases.However, it can be observe a decrease of the experimental tensilestrength at high normal stress at 60%. The latter highlight the effectof the normal stress in changing the regime. By applying largenormal stress the packing density of the wet glass beads decreasesand consequently the capillary regime can be reached for smaller liquidcontent.
4. Conclusions
We analysed the effect of particle size on the shear behaviour of par-tially wet glass beads. It was observed that the saturation level dependson the particle size. The voidage fraction of wet glass beads increases fora decrease in the particle size and the shear stress response to the ap-plied normal stress can bedifferent.Wehave shown also that the tensilestrength increases for the smaller particle size because of the increase inthe contact number and the liquid bridges broken in the shearing plane.However, the lower packing density of the small glass beads leads to a
Fig. 12. An example of the cut image to define the different zones to estimate the voidage fraction. The selected squares (zones) are about 1mm,which is equivalent to 12 particles side byside.
0.3
0.4
0.5
0.6
0.7
0.8
0.9
1
0 2 4 6 8 10
Stre
ss r
atio
σ (kPa)
20%
14%
7%
1%
0.5%
0.25%
0.1%
0.03%
0.01%
0 0.3
0.4
0.5
0.6
0.7
0.8
0.9
1
0 2 4 6 8 10
Stre
ss r
atio
σ (kPa)
40%
35%
30%
25%
0
0.3
0.4
0.5
0.6
0.7
0.8
0.9
1
0 2 4 6 8 10
Stre
ss r
atio
σ (kPa)
55%
50%
0
0.3
0.6
0.9
1.2
1.5
1.8
0 2 4 6 8 10
Stre
ss r
atio
σ (kPa)
60%
0
Fig. 13. The stress ratio (shear stress/normal stress) variation with the normal stress of different regimes depending on the liquid fraction.
lower tensile strength values estimated experimentally. We also inves-tigate the effect of more liquid fractions on the shear behaviour of glassbeads of 70–110 μm. The shear stress increases with the liquid up to acritical value and then decreases. The capillary force contribution onthe shear stress vanishes at the capillary state of saturation. Regardingthe voidage fraction, a linear decrease is observed for liquid fraction inthe range of 20% to 60%. The tomography analysis showed that the in-crease of liquid beyond the pendular state leads to the formation of ag-glomerates. This study highlights the fact that the change of someproperties of the granular material can largely change the obtained re-sults, such the particle size studied in this work. Thus we encouragemore comparative studies using other materials (solid and/or liquid).
List of symbolsA Area of the lid of the annular shear cell (m2)a Local surface roughness height (μm)a′ Dimensionless factor of the particle rearrangementc Cohesion (N/m2)d Diameter of particle (m)EC Energy required to break a liquid bridge (kg·m2·s−2)F1, F2 Tangential forces applied to the lid (N)FC Capillary force (N)g Gravitational constant (N/kg)h Height of the bars in the shear cell (m)
k Coordination numberl Distance from the axis of rotation of the shear cell to the force
sensors (m)M Normal load (kg)PEG 400 Polyethylene glycol 400Pc Capillary pressure (N/m2)R Radius of particle (m)Re External radius of the shear cell (m)Ri Internal radius of the shear cell (m)S Liquid saturation (%)S1 Limit saturation between the pendular and the funicular
states (%)S2 Limit saturation between the funicular and the capillary
states (%)Sd Separation distance between two particles (m)TS Tensile strength (Pa)TS,pendular Tensile strength for the pendular regime (Pa)TS,funicular Tensile strength for the funicular regime (Pa)TS,capillary Tensile strength for the capillary regime (Pa)vp ,p Relative velocity particle-particle (m·s−1)V Liquid bridge volume (m3)VR Volume fraction (%)
Greek symbolsα Half filling angle (°)γ Surface tension (N/m)ΔP Capillary depressionε Voidage fractionεwet Wet voidage fractionμ Friction coefficientμg Dynamic viscosity of ambient gas (kg·m−1·s−1)μl Dynamic viscosity of liquid (kg·m−1·s−1)ρ Apparent density (kg/m3)ρg Density of the ambient gas (kg/m3)ρL Liquid density (kg/m3)ρp Density of the particles (kg/m3)ρS True density (kg/m3)σ Normal stress (Pa)τ Tangential stress (Pa)ω Shear cell velocity (mrad/s)
Acknowledgements
The authors are thankful for the technical support by C. Rolland, L.Haurie and L. Devriendt.
References
[1] M. Adams, V. Perchard, The cohesive forces between particles with interstitial liquid,Inst. Chem. Eng. Symp. 91 (1985) 147–160.
[2] J.F. Carr, Tensile strength of granular materials, Nature 213 (5081) (1967)1158–1159.
[3] S.H. Chou, S.S. Hsiau, Experimental analysis of the dynamic properties of wet gran-ular matter in a rotating drum, Powder Technol. 214 (2011) 491–499.
[4] A.R. Dexter, D.W. Tanner, Packing densities of mixtures of spheres with log-normaldistributions, Nature 238 (1972) 31–32.
[5] C.L. Feng, A.B. Yu, Effect of liquid addition on the packing of mono-sized coarsespheres, Powder Technol. 99 (1998) 22–28.
[6] T.C. Halsey, A.J. Levine, How sandcastle fall, Phys. Rev. Lett. 80 (1998) 3141–3144.[7] S. Herminghaus, Dynamics of wet granular matter, Adv. Phys. 54 (2005) 221–261.[8] D.J. Hornbaker, R. Albert, I. Albert, A.-L. Barabasi, P. Schiffer, Nature (London) 387
(1997) 765.[9] G. Lian, C. Thornton, M.J. Adams, A theoretical study of the liquid bridge force be-
tween rigid spherical bodies, J. Colloid Interface Sci. 161 (1993) 3381–3391.[10] H. Louati, D. Oulahna, A. de Ryck, Apparent friction and cohesion of a partially wet
granular material in steady-state shear, Powder Technol. 278 (2015) 65–71.[11] N. Lu, B.Wu, C. Tan, Tensile strength characteristics of unsaturated sands, J. Geotech.
Geoenviron. Eng. 133 (2) (2007) 144–154.[12] N. Mitarai, F. Nori, Wet granular materials, Adv. Phys. 55 (2006) 1–45.[13] S.T. Nase, W.L. Vergas, A.A. Abatan, J.J. McCarthy, Discrete characterization tools for
cohesive granular material, Powder Technol. 116 (2001) 214–223.
0.4
0.45
0.5
0.55
0.6
0 10 20 30 40 50 60
Stre
ss
ra
tio
VR%
Fig. 14.Variation of the average stress ratio for normal stress (between 8 and 11 kPa)withthe liquid fraction.
0
1
2
3
4
5
6
0.001 0.01 0.1 1 10 100 1000
TS
(k
Pa
)
VR
%
Pendular
Funicular
Capillary
Fig. 15. Experimental and theoretical tensile strength as a function of the liquid fraction ona semi-logarithmic scale. Squares and crosses: experimental data for high normal stress(σN4kPa) and low normal stress (σb4kPa) respectively. Continuous lines: theoreticaltraction for different coordination numbers (1, 5, 6, 7 and 8) shown from bottom to topin this figure.
[14] D. Oulahna, R. Collet, A. de Ryck, Mechanical resistance due to shearing of partiallywet granular media, KONA 30 (2013) 109–118.
[15] P. Pierrat, H.S. Caram, Tensile strength of wet granular materials, Powder Technol.91 (1997) 83–93.
[16] W. Pietsch, Agglomeration Process, Wiley-VCH, Weinheim, 2002.[17] H. Rumpf, The tensile strength of granules and agglomerates, Intersci. Publ. (1962)
379–418.[18] M. Scheel, R. Seemann, M. Brinkmann, M. Di Michiel, A. Sheppard, B. Breidenbach, S.
Herminghaus, Morphological clues to wet granular pile stability, Nat. Mater. 7(2008) 189–193.
[19] H. Schubert, Capillary forces: modeling and application in particulate technology,Powder Technol. 37 (1984) 105–116.
[21] J.P.K. Seville, C.D. Willett, P.C. Knight, Inter-particle forces in fluidisation: a review,Powder Technol. 113 (2000) 261–268.
[22] H.Y. Sohn, C. Moreland, The effect of particle size distribution on packing density,Can. J. Chem. Eng. 46 (1968) 162–167.
[23] M.Wu, S. Radl, J.G. Khinast, A model to predict liquid bridge formation between wetparticles based on direct numerical simulations, AICHE J. 62 (2016) 1877–1897.
[24] A.B. Yu, J. Bridgwater, A. Burbidge, On the modelling of the packing of fine particles,Powder Technol. 92 (1997) 185–194.
[25] A.B. Yu, C.L. Feng, R.P. Zou, R.Y. Yang, On the relationship between porosity and in-terparticle forces, Powder Technol. 130 (2003) 70–76.
![PARTICLE SIZE, PARTICLE SIZE DISTRIBUTION & COMPACTION AND COMPRESSION [PREFORMULATION STUDY] (1-32)](https://img.pdfslide.net/doc/110x75/56649e855503460f94b87eac/particle-size-particle-size-distribution-compaction-and-compression-preformulation.jpg)