Embed Size (px)
Citation preview
Article
Effect of the Particle Size on the TDA Shear Strength andStiffness Parameters in Large-Scale Direct Shear Tests
Hany El Naggar *, Khaled Zahran and Ahmed Moussa
�����������������
Citation: El Naggar, H.; Zahran, K.;
Moussa, A. Effect of the Particle Size
on the TDA Shear Strength and
Stiffness Parameters in Large-Scale
Direct Shear Tests. Geotechnics 2021, 1,
1–17. https://doi.org/10.3390/
geotechnics1010001
Received: 13 November 2020
Accepted: 15 January 2021
Published: 25 January 2021
Publisher’s Note: MDPI stays neutral
with regard to jurisdictional claims in
published maps and institutional affil-
iations.
Copyright: © 2021 by the authors.
Licensee MDPI, Basel, Switzerland.
This article is an open access article
distributed under the terms and
conditions of the Creative Commons
Attribution (CC BY) license (https://
creativecommons.org/licenses/by/
4.0/).
Department of Civil & Resource Engineering, Dalhousie University, Halifax, NS B3H 4R2, Canada;[email protected] (K.Z.); [email protected] (A.M.)* Correspondence: [email protected]
Abstract: The increase in the number of discarded tires every year is becoming a major issue all overthe world. Tires stockpiles and landfills have become a critical issue as they are considered a fertileenvironment for the breeding of rats and insects, a real fire hazard that may take up to months toextinguish and occupy a valuable, large area of land. One of the safest effective ways of recycling tiresis that to use them as backfilling material, among different usages, in civil engineering projects due totheir low unit weight and specific gravity. However, to use any material in the construction industry,several material properties must be evaluated, including the shear strength and stiffness parameters.Many factors control the measured parameters. One main factor that is known to have a significanteffect is the particle size. This paper focuses on evaluating the effect of the particle size on the shearstrength and stiffness parameters of six tire-derived aggregate (TDA) samples having particle sizesrange between (9.5–101.6 mm) using a large-scale direct shear machine. The tests were conductedunder three normal stresses: 50.1, 98.8 and 196.4 kPa using a constant shearing rate of 0.5 mm/min.The results of this study showed an increasing angle of internal friction as the maximum particle sizeincreases. Moreover, the secant shear modulus also exhibited an increase by increasing the maximumparticle size. Furthermore, equations to estimate the stress-strain curves of Type A-TDA for differentconfidence levels were developed, and their predictions were compared with experimental results toassess their suitability.
Keywords: large scale direct shear test; tire derived aggregates; aggregate size effect
1. Introduction
The number of scrap tires generated every year all over the world is rapidly increasing.The reason behind this increase is that the number of vehicles is growing at an unprece-dented rate, and the current technology is not targeting new means for recycling tires.However, it is engaged in the development of renewable fuels. In 2015, Americans disposedof around 250 million tires. In the same year, approximately 35 million scrap tires werediscarded in Canada.
This increasing number of scrap tires is becoming a significant hazard for the environ-ment as the primary means of getting rid of scrap tires is either by stockpiling or disposingof them in landfills. These solutions possess serious hazards and are not environmentallyacceptable as they are considered a fertile environment for insects and mosquitoes tobreed and are prone to fire hazards as tires can catch fire easily, and it was noted that it ischallenging to extinguish them [1].
Fortunately, some methods for recycling scrap tires, including using them as groundrubbers for different applications as in children’s playgrounds and gyms, have started togain popularity. Last but not least, they could be used in several civil engineering projectsas tire-derived aggregates (TDA) in which scrap tires are shredded into smaller pieces andused mainly as light backfill material, among other usages. Some of these usages includeuse of TDA products as an additive to alleviate the inferior geotechnical properties ofsubgrade deposits of clay soil with high expansivity, [2,3]. Moreover, Shahrokhi-Shahraki
Geotechnics 2021, 1, 1–17. https://doi.org/10.3390/geotechnics1010001 https://www.mdpi.com/journal/geotechnics

Geotechnics 2021, 1 2
et al. [4] investigated the use of pulverized waste tires, either on their own or mixedwith soil (well graded sand), to act as adsorptive fill materials, demonstrating adsorptionof organic/inorganic contaminants (benzene, toluene, ethylbenzene, and xylene (BTEX)components and two heavy metal ions (Pb2+ and Cu2+). ASTM D6270 [5] classifies TDAinto two types; A and B. Type A is roughly 75–100 mm in size with a maximum particledimension measured in any direction of 200 mm. On the other hand, Type B is about150–305 mm in size, with a maximum particle dimension in any direction of 450 mm [6].
Type A is typically used as an insulation material for road projects or a fill materialbehind retaining walls, whereas type B is mostly used as an embankment fill. Shreddedtire products have a number of desirable geotechnical properties that can improve theperformance of civil engineering infrastructure. Such products weigh only one-third tohalf as much as conventional granular backfill materials. The specific gravity of TDAranges from 1.15 to 1.21, while the specific gravity of conventional backfill ranges from2.55 to 2.75 [7]. Over the previous two centuries, TDA has been utilized as a drainagematerial beneath perforated leachate collection pipes as the permeability of TDA is 10times higher than that of gravel. In addition, TDA is regarded as a good thermal insulatorand is eight times more effective than regular soil in this respect [8]. The use of TDAas lightweight backfill material in embankments and retaining wall projects has beenexamined by many researchers [1,9]. TDA has also been used under shallow foundationsand in trench fill projects above and around buried pipes and culverts to improve thearching mechanism [10–13]. In addition, owing to the excellent damping characteristics ofTDA, it is also used as a vibration dampening, [14]. For example, Moussa and El Naggar [15]found that TDA-infilled buried trenches could improve the screening effectiveness of theburied infilled trenches compared to other materials.
One of the main characterizations, which is essential for TDA adoption in civil en-gineering projects, is their geotechnical characterization. However, TDA particles areconsidered large in size compared to the available standard testing equipment, and practi-tioners are forced to test smaller TDA particle sizes not representative of the real sizes usedin construction projects. Hence, the main focus of this paper is to study the particle sizeeffect on the shear strength parameters of TDA using a large-scale direct shear machine.Several studies were done on granular and fine soils to study the effect of the particle sizeon the shear strength parameters, while none considered the particle size effect of TDA.
For the granular materials, one of the earliest studies for the particle size effect forcoarse-grained soils was done by Kim and Ha [16]. The authors in this research investigatedthe shear strength parameters of coarse-grained soils for three samples with three differentmaximum particle sizes; 4.75 mm, 7.9 mm and 15.9 mm. The samples were tested in a purestate, supported with a soft geogrid, and supported with a stiff geogrid. The testing wasundertaken using a shear box with dimensions of 300 mm × 300 mm with a shear rate of1 mm/min. The tests were performed under three normal stresses: 98 kPa, 196 kPa and294 kPa. The results showed that the angle of internal friction increased from 40.56◦ for the4.75 mm sample, up to 54.04◦ for the 15.9 mm sample.
Moreover, Islam et al. [17] studied the effect of particle size on the shear strengthparameters of sands. A series of direct shear tests were conducted on 10 samples in total.Eight samples with uniform particle sizes (0.075, 0.15, 0.212, 0.3, 0.6, 1.18, 1.72 and 2.76 mm)and two samples with graded particle sizes (0.075–1.18 mm and 0.075–2.36 mm). Testswere performed with a shear box with a diameter of 50.8 mm under a constant rate. Thespecimens had unit weight range of 12.65 to 15.7 kN/m3 and void ratio range of 0.38 to 0.95.The results showed that the angle of internal friction increased from 35.54◦ up to 42.24◦ forthe samples with uniform particle sizes. For the two samples with graded particle sizes,the internal friction angle increased from 41.18◦ to 41.83◦.
Furthermore, Vangla and Latha [18] conducted a series of direct shear tests to in-vestigate the influence of the particle size on the shear strength of sands. The tests wereconducted on three samples; fine, medium and coarse. The coarse sample had a maximumparticle size of 4.75 mm. The medium sample had a maximum particle size of 2 mm, while
Geotechnics 2021, 1 3
the fine sample had a maximum particle size of 0.425 mm. All samples had the samerelative density, void ratio and unit weight. The specimens’ relative density, void ratioand unit weight were 70%, 0.68 and 15.2 kN/m3, respectively. The tests were conductedusing a large-scale direct shear test with a shear box of dimensions 300 mm × 300 mm. Theshearing rate was 1 mm/min under three normal stresses: 21 kPa, 37 kPa, 58 kPa. Theresults showed that the ultimate friction angle increased from 35.9◦ for the fine sand up to38.9◦ for the coarse sand.
As shown above, detailed studies were conducted to study the particle size effect onthe shear strength parameters of coarse and fine-grained soils. It is noted that the shearresistance of the sample increases as the particle size increases. However, according to theauthor’s knowledge, no studies were performed on TDA to study the particle size effect onthe TDA’s shear strength or stiffness. Furthermore, a non-linear regression analysis wascarried out to develop stress-strain curves of TDA type A considering the various TDAmaximum aggregates size. Lastly, the developed equations of stress-strain curves of TDAtype A were compared with other curves obtained from the literature.
2. Experimental Setup and Material2.1. Experimental Setup
Figure 1 shows the large-scale direct shear test setup with a sample size of 305 mmby 305 mm and a height of 230 mm that was used in this study. The height of the lowermovable part of the shear box was 90 mm, and the height of the upper part was 140 mm.
Geotechnics 2020, 1, FOR PEER REVIEW 3
Furthermore, Vangla and Latha [18] conducted a series of direct shear tests to inves-
tigate the influence of the particle size on the shear strength of sands. The tests were con-
ducted on three samples; fine, medium and coarse. The coarse sample had a maximum
particle size of 4.75 mm. The medium sample had a maximum particle size of 2 mm, while
the fine sample had a maximum particle size of 0.425 mm. All samples had the same rel-
ative density, void ratio and unit weight. The specimens’ relative density, void ratio and
unit weight were 70%, 0.68 and 15.2 kN/m3, respectively. The tests were conducted using
a large-scale direct shear test with a shear box of dimensions 300 mm × 300 mm. The shear-
ing rate was 1 mm/min under three normal stresses; 21 kPa, 37 kPa, 58 kPa. The results
showed that the ultimate friction angle increased from 35.9° for the fine sand up to 38.9°
for the coarse sand.
As shown above, detailed studies were conducted to study the particle size effect on
the shear strength parameters of coarse and fine-grained soils. It is noted that the shear
resistance of the sample increases as the particle size increases. However, according to the
author’s knowledge, no studies were performed on TDA to study the particle size effect
on the TDA’s shear strength or stiffness. Furthermore, a non-linear regression analysis
was carried out to develop stress-strain curves of TDA type A considering the various
TDA maximum aggregates size. Lastly, the developed equations of stress-strain curves of
TDA type A were compared with other curves obtained from the literature.
2. Experimental Setup and Material
2.1. Experimental Setup
Figure 1 shows the large-scale direct shear test setup with a sample size of 305 mm
by 305 mm and a height of 230 mm that was used in this study. The height of the lower
movable part of the shear box was 90 mm, and the height of the upper part was 140 mm.
This setup can shear a sample up to 50 mm horizontal displacement with a shearing
rate ranging between 0.02–2 mm/min. The setup has a load cell and two linear variable
displacement transducers (LVDTs), which were used to measure the shear force (kN),
horizontal displacement (mm) and vertical displacement (mm). The load cell and the 2
LVDTs were connected to a data acquisition system to record the data from the test. The
direct shear apparatus can apply normal stresses ranging between 50.1–293.2 kPa using a
deadweight loading mechanism.
Figure 1. Large-scale direct shear apparatus.
2.2. Material
The TDA used in this research was shredded at Halifax C&D Recycling Ltd. (Good-
wood, NS, Canada), shown in Figure 2, using the conventional method of tires shredding
Figure 1. Large-scale direct shear apparatus.
This setup can shear a sample up to 50 mm horizontal displacement with a shearingrate ranging between 0.02–2 mm/min. The setup has a load cell and two linear variabledisplacement transducers (LVDTs), which were used to measure the shear force (kN),horizontal displacement (mm) and vertical displacement (mm). The load cell and the2 LVDTs were connected to a data acquisition system to record the data from the test. Thedirect shear apparatus can apply normal stresses ranging between 50.1–293.2 kPa using adeadweight loading mechanism.
2.2. Material
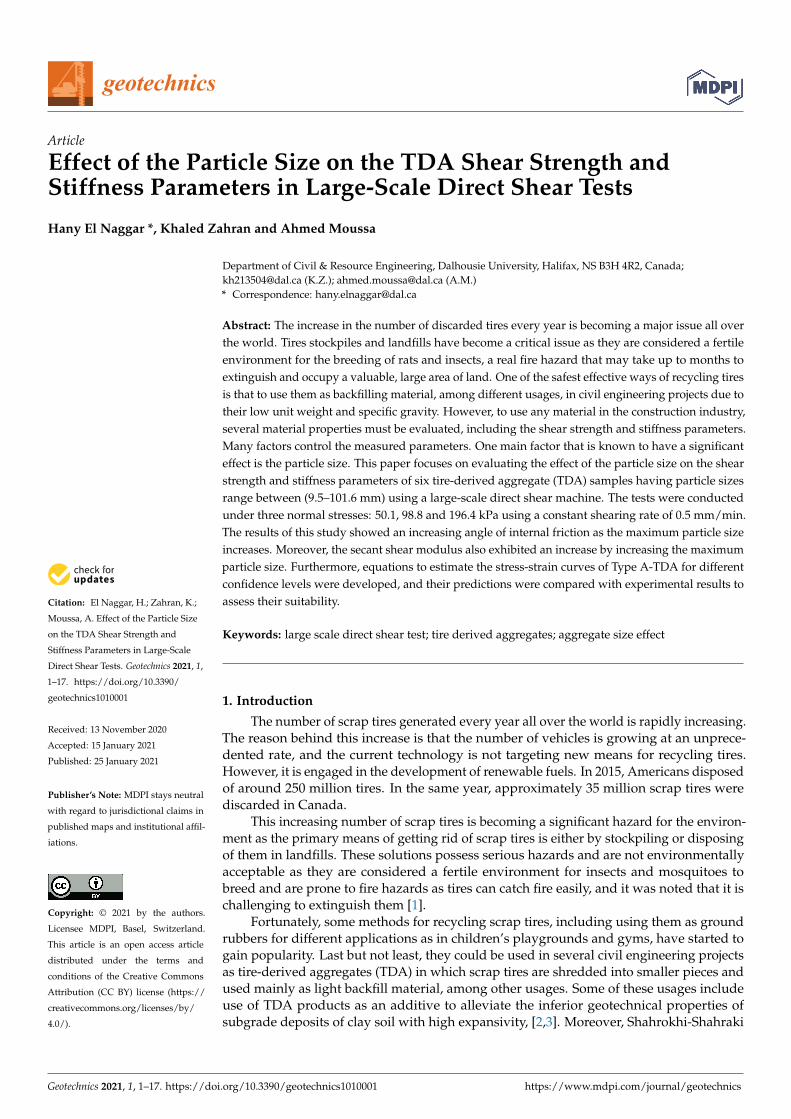
The TDA used in this research was shredded at Halifax C&D Recycling Ltd. (Good-wood, NS, Canada), shown in Figure 2, using the conventional method of tires shredding bypassing the tires through shredders under ambient temperature until reaching the desiredparticle size range. In this research, five samples having different maximum particle sizes(Dmax); of 19.05, 38.1, 50.8, 76.2, and 101.6 mm were considered.
Geotechnics 2021, 1 4
Geotechnics 2020, 1, FOR PEER REVIEW 4
by passing the tires through shredders under ambient temperature until reaching the de-
sired particle size range. In this research, five samples having different maximum particle
sizes (Dmax); of 19.05, 38.1, 50.8, 76.2, and 101.6 mm were considered.
Any protruding steel in the samples was removed entirely. So, the shear resistance
resulting from these samples should be more conservative than the actual TDA used in
civil engineering projects commonly used with their protruding steel. The samples were
sieved following the procedures of ASTM C136/C136M—14. All the samples had a parti-
cle size range starting from 9.5 mm and up to the maximum particle size (Dmax) existing in
the sample. Due to the particle size distribution for the five samples being tested, the sam-
ples fall under the Type A—TDA classification.
The characteristics of the five samples are given below in Table 1. The samples had
an increasing maximum particle size (Dmax), which qualifies the samples for the study of
the effect of the particle size effect on the shear strength parameters of TDA. The gradation
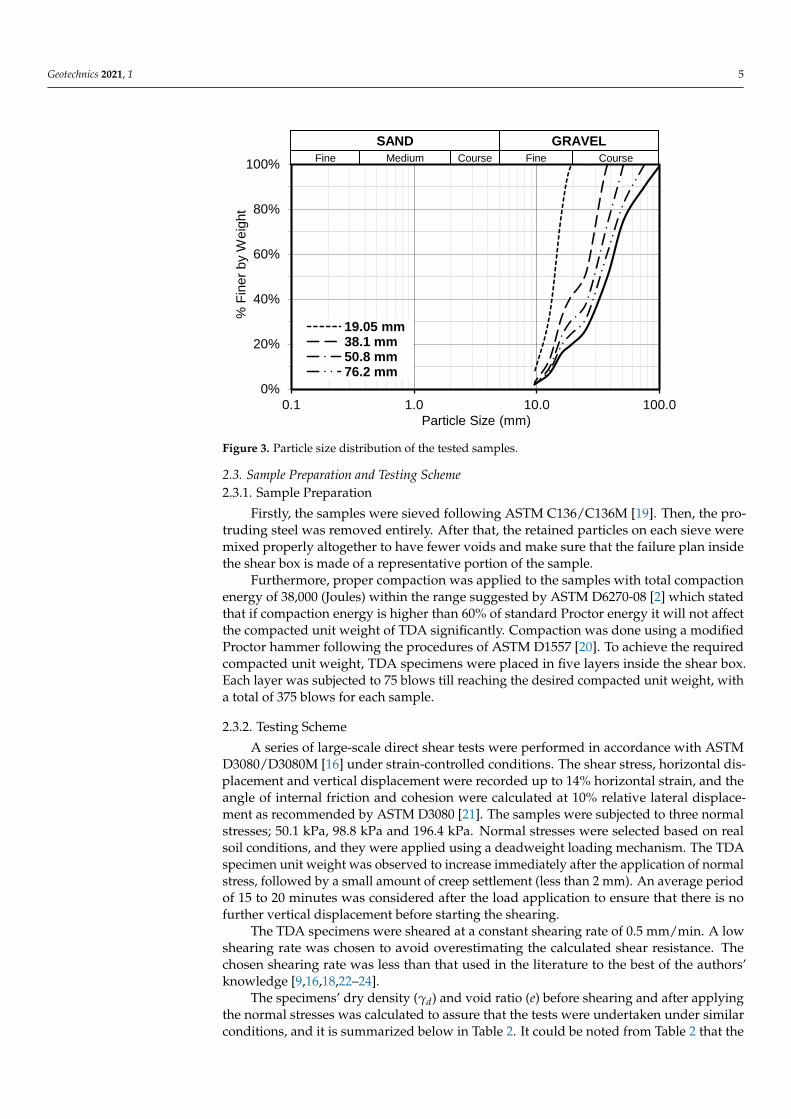
curves of the five samples are shown in Figure 3.
Figure 2. Tire-derived aggregate (TDA) from Halifax C&D recycling Ltd.
Table 1. Characteristics of the TDA used in the research.
Characteristics Sample #1 Sample #2 Sample #3 Sample #4 Sample #5
D10 (mm) 9.7 12 12.8 13 15
D30 (mm) 12.4 16.5 19 25 27.5
D50 (mm) 14 25 29.5 33 39
D60 (mm) 15.5 27.5 33 39 45
Dmax (mm) 19.05 38.1 50.8 76.2 101.6
Size Range (mm) 9.5–19.05 9.5–38.1 9.5–50.8 9.5–76.2 9.5–101.6
Cu 1.63 2.3 2.58 3 3
Cc 1.04 0.83 0.85 1.23 1.12
Specific Gravity (Gs) 1.03 1.05 1.06 1.06 1.09
Figure 2. Tire-derived aggregate (TDA) from Halifax C&D recycling Ltd.
Any protruding steel in the samples was removed entirely. So, the shear resistanceresulting from these samples should be more conservative than the actual TDA used incivil engineering projects commonly used with their protruding steel. The samples weresieved following the procedures of ASTM C136/C136M—14. All the samples had a particlesize range starting from 9.5 mm and up to the maximum particle size (Dmax) existing in thesample. Due to the particle size distribution for the five samples being tested, the samplesfall under the Type A—TDA classification.
The characteristics of the five samples are given below in Table 1. The samples had anincreasing maximum particle size (Dmax), which qualifies the samples for the study of theeffect of the particle size effect on the shear strength parameters of TDA. The gradationcurves of the five samples are shown in Figure 3.
Table 1. Characteristics of the TDA used in the research.
Characteristics Sample #1 Sample #2 Sample #3 Sample #4 Sample #5
D10 (mm) 9.7 12 12.8 13 15D30 (mm) 12.4 16.5 19 25 27.5D50 (mm) 14 25 29.5 33 39D60 (mm) 15.5 27.5 33 39 45
Dmax (mm) 19.05 38.1 50.8 76.2 101.6Size Range (mm) 9.5–19.05 9.5–38.1 9.5–50.8 9.5–76.2 9.5–101.6
Cu 1.63 2.3 2.58 3 3Cc 1.04 0.83 0.85 1.23 1.12
Specific Gravity (Gs) 1.03 1.05 1.06 1.06 1.09
The coefficient of uniformity (Cu) was calculated as follows:
Cu = D60/ D10 (1)
while the coefficient of curvature (Cc) was calculated as follows:
Cc = D230/(D60 × D10) (2)
Geotechnics 2021, 1 5
Geotechnics 2020, 1, FOR PEER REVIEW 5
Figure 3. Particle size distribution of the tested samples.
The coefficient of uniformity (Cu) was calculated as follows:
𝐶𝑢 = 𝐷60/ 𝐷10 (1)
while the coefficient of curvature (Cc) was calculated as follows:
𝐶𝑐 = 𝐷302 /(𝐷60 × 𝐷10) (2)
2.3. Sample Preparation and Testing Scheme
2.3.1. Sample Preparation
Firstly, the samples were sieved following ASTM C136/C136M [19]. Then, the pro-
truding steel was removed entirely. After that, the retained particles on each sieve were
mixed properly altogether to have fewer voids and make sure that the failure plan inside
the shear box is made of a representative portion of the sample.
Furthermore, proper compaction was applied to the samples with total compaction
energy of 38,000 (Joules) within the range suggested by ASTM D6270-08 [2] which stated
that if compaction energy is higher than 60% of standard Proctor energy it will not affect
the compacted unit weight of TDA significantly. Compaction was done using a modified
Proctor hammer following the procedures of ASTM D1557 [20]. To achieve the required
compacted unit weight, TDA specimens were placed in five layers inside the shear box.
Each layer was subjected to 75 blows till reaching the desired compacted unit weight, with
a total of 375 blows for each sample.
2.3.2. Testing Scheme
A series of large-scale direct shear tests were performed in accordance with ASTM
D3080/D3080M [16] under strain-controlled conditions. The shear stress, horizontal dis-
placement and vertical displacement were recorded up to 14% horizontal strain, and the
angle of internal friction and cohesion were calculated at 10% relative lateral displacement
as recommended by ASTM D3080 [21]. The samples were subjected to three normal
stresses; 50.1 kPa, 98.8 kPa and 196.4 kPa. Normal stresses were selected based on real soil
conditions, and they were applied using a deadweight loading mechanism. The TDA
specimen unit weight was observed to increase immediately after the application of nor-
mal stress, followed by a small amount of creep settlement (less than 2 mm). An average
period of 15 to 20 minutes was considered after the load application to ensure that there
is no further vertical displacement before starting the shearing.
0%
20%
40%
60%
80%
100%
0.1 1.0 10.0 100.0
% F
iner
by
Weig
ht
Particle Size (mm)
19.05 mm38.1 mm50.8 mm76.2 mm
GRAVELSAND
CourseCourse FineMediumFine
Figure 3. Particle size distribution of the tested samples.
2.3. Sample Preparation and Testing Scheme2.3.1. Sample Preparation
Firstly, the samples were sieved following ASTM C136/C136M [19]. Then, the pro-truding steel was removed entirely. After that, the retained particles on each sieve weremixed properly altogether to have fewer voids and make sure that the failure plan insidethe shear box is made of a representative portion of the sample.
Furthermore, proper compaction was applied to the samples with total compactionenergy of 38,000 (Joules) within the range suggested by ASTM D6270-08 [2] which statedthat if compaction energy is higher than 60% of standard Proctor energy it will not affectthe compacted unit weight of TDA significantly. Compaction was done using a modifiedProctor hammer following the procedures of ASTM D1557 [20]. To achieve the requiredcompacted unit weight, TDA specimens were placed in five layers inside the shear box.Each layer was subjected to 75 blows till reaching the desired compacted unit weight, witha total of 375 blows for each sample.
2.3.2. Testing Scheme
A series of large-scale direct shear tests were performed in accordance with ASTMD3080/D3080M [16] under strain-controlled conditions. The shear stress, horizontal dis-placement and vertical displacement were recorded up to 14% horizontal strain, and theangle of internal friction and cohesion were calculated at 10% relative lateral displace-ment as recommended by ASTM D3080 [21]. The samples were subjected to three normalstresses; 50.1 kPa, 98.8 kPa and 196.4 kPa. Normal stresses were selected based on realsoil conditions, and they were applied using a deadweight loading mechanism. The TDAspecimen unit weight was observed to increase immediately after the application of normalstress, followed by a small amount of creep settlement (less than 2 mm). An average periodof 15 to 20 minutes was considered after the load application to ensure that there is nofurther vertical displacement before starting the shearing.
The TDA specimens were sheared at a constant shearing rate of 0.5 mm/min. A lowshearing rate was chosen to avoid overestimating the calculated shear resistance. Thechosen shearing rate was less than that used in the literature to the best of the authors’knowledge [9,16,18,22–24].
The specimens’ dry density (γd) and void ratio (e) before shearing and after applyingthe normal stresses was calculated to assure that the tests were undertaken under similarconditions, and it is summarized below in Table 2. It could be noted from Table 2 that the
Geotechnics 2021, 1 6
void ratios of all samples at a given normal stress were relatively similar. Since the TDAused herein was from the same supplier; as a result, the data regarding the specific gravityand void ratios were the same. This finding was also indicated by Yi et al. [25], where theauthors obtained the minimum and maximum dry unit weights and void ratios, specificgravity and initial void ratios of two types of TDA. Different samples from the same TDAtype (i.e., tires obtained from the same source) showed that the specific gravity, void ratioand maximum and minimum dry densities and void ratios were similar. This was becausethe amount of steel in the same type of TDA was similar.
Table 2. Dry density and void ratio before shearing.
Maximum Particle Size (Dmax)
Density (kN/m3) and Void Ratio before Shearing
50.1 kPa 98.8 kPa 196.4 kPa
γd e γd e γd e
19.05 mm 6.3 0.60 6.6 0.53 7.3 0.3838.1 mm 6.3 0.64 6.7 0.54 7.3 0.4150.8 mm 6.4 0.62 6.8 0.53 7.3 0.4276.2 mm 6.3 0.65 6.7 0.55 7.4 0.41
101.6 mm 6.4 0.67 6.7 0.60 7.5 0.43
3. Results3.1. Shear Strength
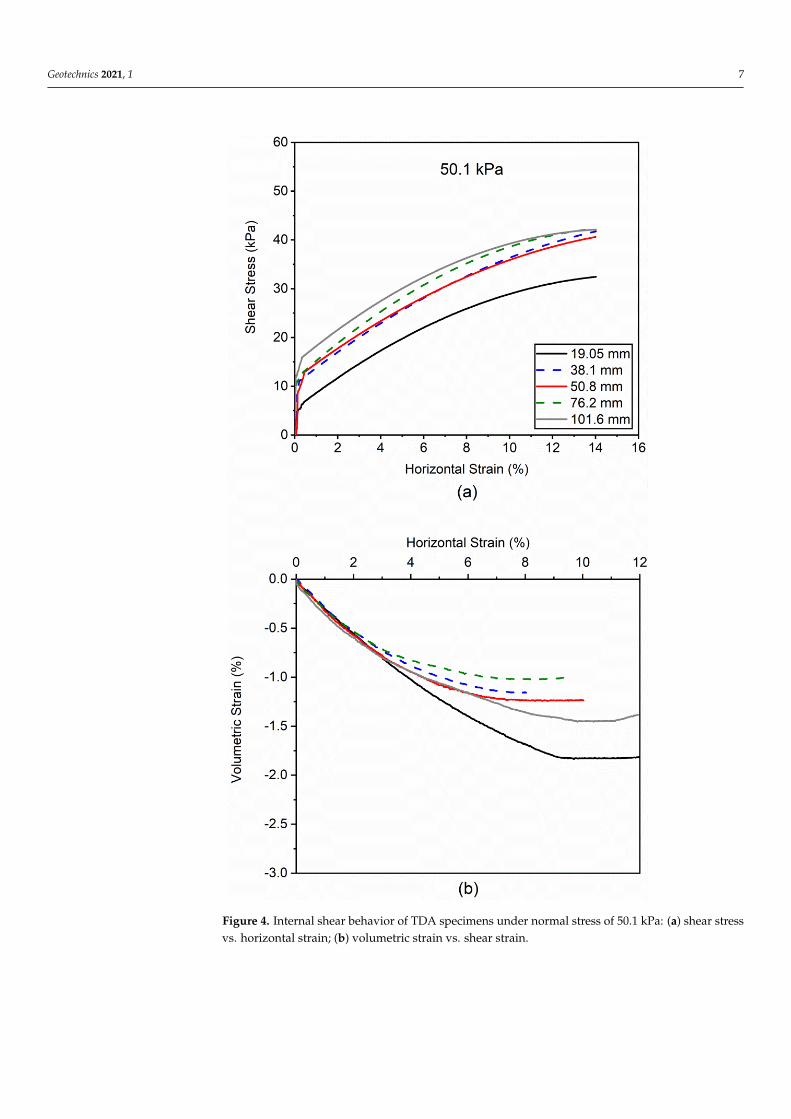
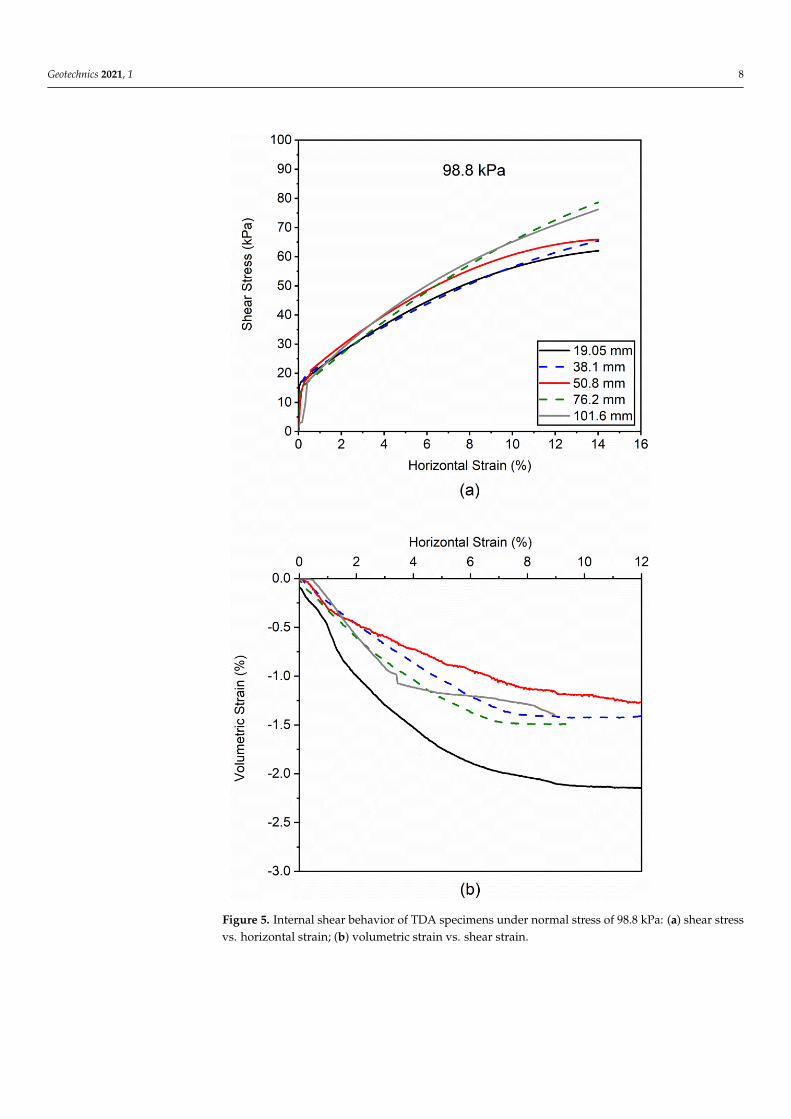
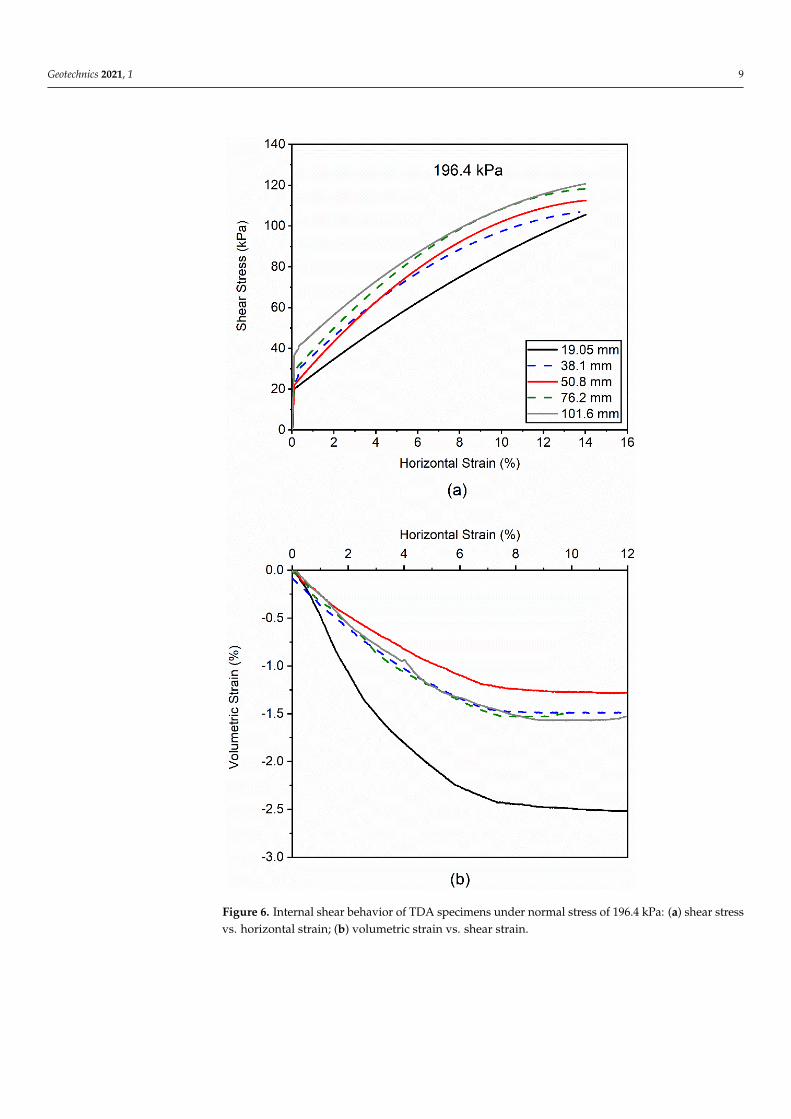
Figures 4–6 show the shear stress-strain curves for the five TDA tested samples underthe three normal stresses. The 19.05 mm sample showed the least shear stress-strain curve,while the 101.6 mm sample showed the highest shear stress-strain curves under the threenormal stresses. Generally, the curves showed a bi-linear behavior with a very steep initialincrease in shear stress. Then, the shear stress continued to increase with a lower slope upto 10% horizontal strain, after which most of the curves tended towards peak strength.
Furthermore, the TDA samples exhibited contractive behaviour under all the appliednormal stresses as shown in Figures 4–6. Generally, a higher contraction occurs when thenormal stress applied to the sample increases. In addition, the smallest sample 19.05 mmexhibited the highest volumetric strain, however, the larger sample sizes had a lower andsimilar volumetric strain as the horizontal shear strain increases.
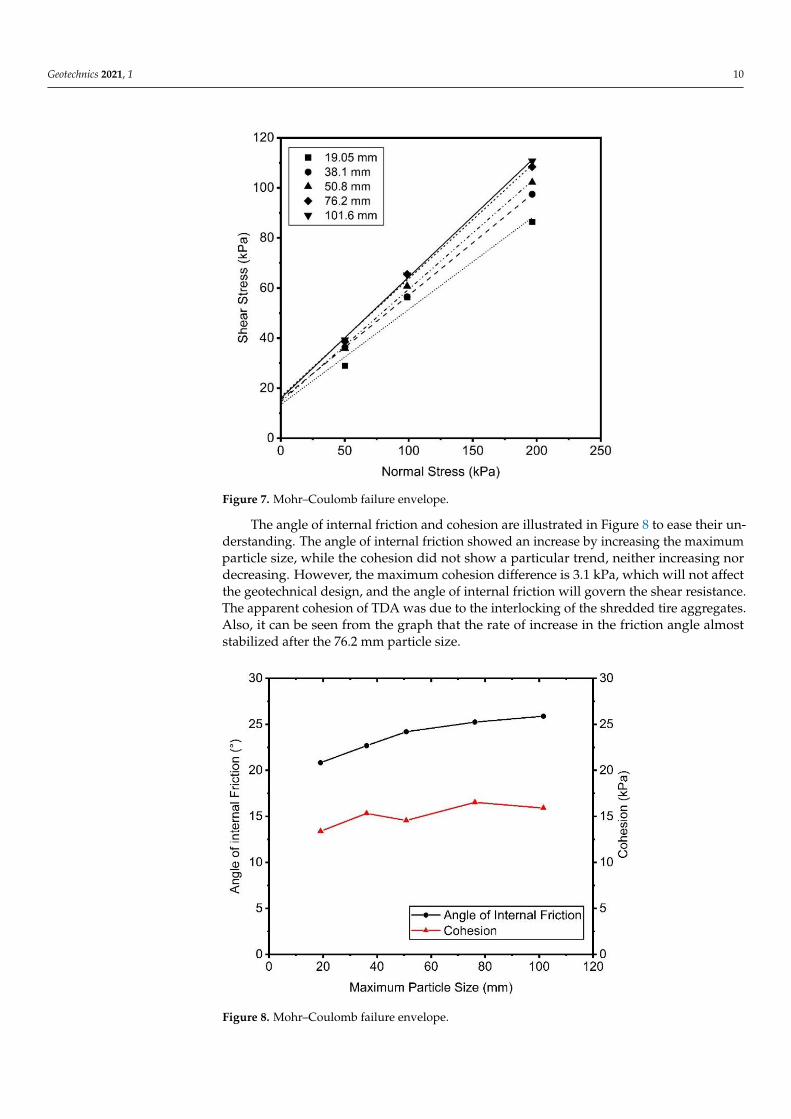
The angle of internal friction and cohesion were defined using the Mohr–Coulombfailure criterion. Due to the absence of the peak, the failure was considered to be at 10%horizontal strain as recommended by ASTM D3080 [21]. Figure 7 shows Mohr–Coulombfailure envelopes for the six samples. It can be noted that as the aggregate size increases, theshear Mohr–Coulomb failure envelopes turn counter clockwise, hence possessing highershear strength.
From the failure envelopes shown in Figure 7, the angle of internal friction andcohesion were calculated using the Mohr–Coulomb failure equation, as shown below inEquation (3).
τ10% = c + σ tanϕ (3)
where (τ10%) is the shear stress at 10% horizontal strain, (c) is the cohesion, which is they-intercept, and (ϕ) is the angle of internal friction.
Geotechnics 2021, 1 7
Geotechnics 2020, 1, FOR PEER REVIEW 7
Figure 4. Internal shear behavior of TDA specimens under normal stress of 50.1 kPa: (a) shear
stress vs. horizontal strain; (b) volumetric strain vs. shear strain.
Figure 4. Internal shear behavior of TDA specimens under normal stress of 50.1 kPa: (a) shear stressvs. horizontal strain; (b) volumetric strain vs. shear strain.
Geotechnics 2021, 1 8
Geotechnics 2020, 1, FOR PEER REVIEW 8
Figure 5. Internal shear behavior of TDA specimens under normal stress of 98.8 kPa: (a) shear
stress vs. horizontal strain; (b) volumetric strain vs. shear strain.
Furthermore, the TDA samples exhibited contractive behaviour under all the applied
normal stresses as shown in Figures 4–6. Generally, a higher contraction occurs when the
normal stress applied to the sample increases. In addition, the smallest sample 19.05 mm
exhibited the highest volumetric strain, however, the larger sample sizes had a lower and
similar volumetric strain as the horizontal shear strain increases.
The angle of internal friction and cohesion were defined using the Mohr–Coulomb
failure criterion. Due to the absence of the peak, the failure was considered to be at 10%
horizontal strain as recommended by ASTM D3080 [21]. Figure 7 shows Mohr–Coulomb
failure envelopes for the six samples. It can be noted that as the aggregate size increases,
the shear Mohr–Coulomb failure envelopes turn counter clockwise, hence possessing
higher shear strength.
From the failure envelopes shown in Figure 7, the angle of internal friction and co-
hesion were calculated using the Mohr–Coulomb failure equation, as shown below in
Equation (3).
Figure 5. Internal shear behavior of TDA specimens under normal stress of 98.8 kPa: (a) shear stressvs. horizontal strain; (b) volumetric strain vs. shear strain.
Geotechnics 2021, 1 9
Geotechnics 2020, 1, FOR PEER REVIEW 9
Figure 6. Internal shear behavior of TDA specimens under normal stress of 196.4 kPa: (a) shear
stress vs. horizontal strain; (b) volumetric strain vs. shear strain.
𝜏10% = 𝑐 + 𝜎 tan (3)
where (τ10%) is the shear stress at 10% horizontal strain, (c) is the cohesion, which is the y-
intercept, and (φ) is the angle of internal friction.
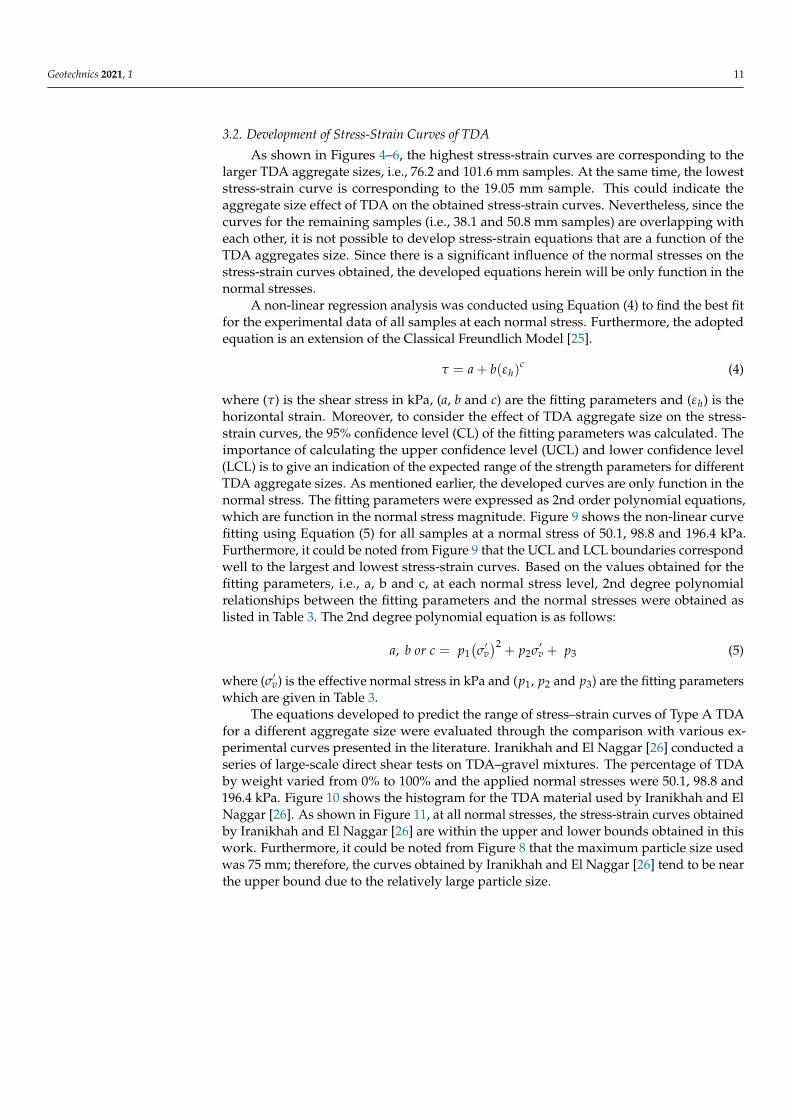
The angle of internal friction and cohesion are illustrated in Figure 8 to ease their
understanding. The angle of internal friction showed an increase by increasing the maxi-
mum particle size, while the cohesion did not show a particular trend, neither increasing
nor decreasing. However, the maximum cohesion difference is 3.1 kPa, which will not
affect the geotechnical design, and the angle of internal friction will govern the shear re-
sistance. The apparent cohesion of TDA was due to the interlocking of the shredded tire
aggregates. Also, it can be seen from the graph that the rate of increase in the friction angle
almost stabilized after the 76.2 mm particle size.
Figure 6. Internal shear behavior of TDA specimens under normal stress of 196.4 kPa: (a) shear stressvs. horizontal strain; (b) volumetric strain vs. shear strain.
Geotechnics 2021, 1 10
Geotechnics 2020, 1, FOR PEER REVIEW 10
Figure 7. Mohr–Coulomb failure envelope.
Figure 8. Mohr–Coulomb failure envelope.
3.2. Development of Stress-Strain Curves of TDA
As shown in Figures 4–6, the highest stress-strain curves are corresponding to the
larger TDA aggregate sizes, i.e., 76.2 and 101.6 mm samples. At the same time, the lowest
stress-strain curve is corresponding to the 19.05 mm sample. This could indicate the ag-
gregate size effect of TDA on the obtained stress-strain curves. Nevertheless, since the
curves for the remaining samples (i.e., 38.1 and 50.8 mm samples) are overlapping with
each other, it is not possible to develop stress-strain equations that are a function of the
TDA aggregates size. Since there is a significant influence of the normal stresses on the
stress-strain curves obtained, the developed equations herein will be only function in the
normal stresses.
A non-linear regression analysis was conducted using Equation 4 to find the best fit
for the experimental data of all samples at each normal stress. Furthermore, the adopted
equation is an extension of the Classical Freundlich Model [25].
𝜏 = 𝑎 + 𝑏(𝜀ℎ)𝑐 (4)
where (𝜏) is the shear stress in kPa, (a, b and c) are the fitting parameters and (𝜀ℎ) is the
horizontal strain. Moreover, to consider the effect of TDA aggregate size on the stress-
Figure 7. Mohr–Coulomb failure envelope.
The angle of internal friction and cohesion are illustrated in Figure 8 to ease their un-derstanding. The angle of internal friction showed an increase by increasing the maximumparticle size, while the cohesion did not show a particular trend, neither increasing nordecreasing. However, the maximum cohesion difference is 3.1 kPa, which will not affectthe geotechnical design, and the angle of internal friction will govern the shear resistance.The apparent cohesion of TDA was due to the interlocking of the shredded tire aggregates.Also, it can be seen from the graph that the rate of increase in the friction angle almoststabilized after the 76.2 mm particle size.
Geotechnics 2020, 1, FOR PEER REVIEW 10
Figure 7. Mohr–Coulomb failure envelope.
Figure 8. Mohr–Coulomb failure envelope.
3.2. Development of Stress-Strain Curves of TDA
As shown in Figures 4–6, the highest stress-strain curves are corresponding to the
larger TDA aggregate sizes, i.e., 76.2 and 101.6 mm samples. At the same time, the lowest
stress-strain curve is corresponding to the 19.05 mm sample. This could indicate the ag-
gregate size effect of TDA on the obtained stress-strain curves. Nevertheless, since the
curves for the remaining samples (i.e., 38.1 and 50.8 mm samples) are overlapping with
each other, it is not possible to develop stress-strain equations that are a function of the
TDA aggregates size. Since there is a significant influence of the normal stresses on the
stress-strain curves obtained, the developed equations herein will be only function in the
normal stresses.
A non-linear regression analysis was conducted using Equation 4 to find the best fit
for the experimental data of all samples at each normal stress. Furthermore, the adopted
equation is an extension of the Classical Freundlich Model [25].
𝜏 = 𝑎 + 𝑏(𝜀ℎ)𝑐 (4)
where (𝜏) is the shear stress in kPa, (a, b and c) are the fitting parameters and (𝜀ℎ) is the
horizontal strain. Moreover, to consider the effect of TDA aggregate size on the stress-
Figure 8. Mohr–Coulomb failure envelope.
Geotechnics 2021, 1 11
3.2. Development of Stress-Strain Curves of TDA
As shown in Figures 4–6, the highest stress-strain curves are corresponding to thelarger TDA aggregate sizes, i.e., 76.2 and 101.6 mm samples. At the same time, the loweststress-strain curve is corresponding to the 19.05 mm sample. This could indicate theaggregate size effect of TDA on the obtained stress-strain curves. Nevertheless, since thecurves for the remaining samples (i.e., 38.1 and 50.8 mm samples) are overlapping witheach other, it is not possible to develop stress-strain equations that are a function of theTDA aggregates size. Since there is a significant influence of the normal stresses on thestress-strain curves obtained, the developed equations herein will be only function in thenormal stresses.
A non-linear regression analysis was conducted using Equation (4) to find the best fitfor the experimental data of all samples at each normal stress. Furthermore, the adoptedequation is an extension of the Classical Freundlich Model [25].
τ = a + b(εh)c (4)
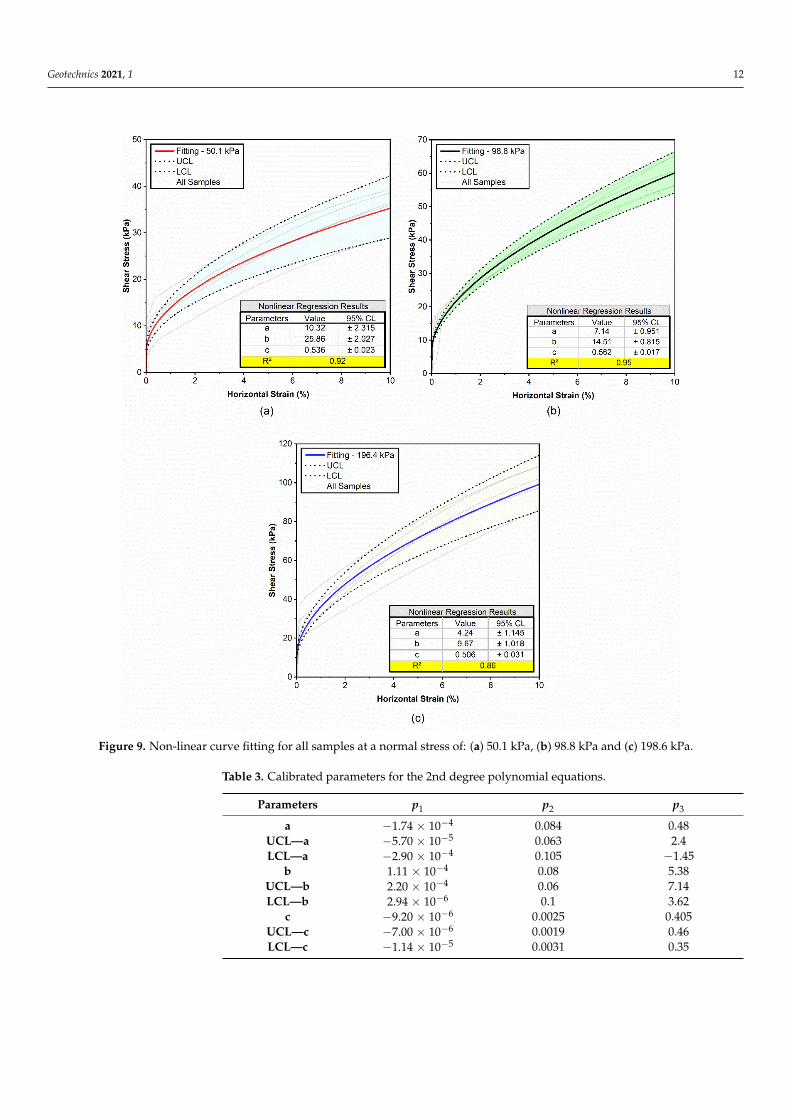
where (τ) is the shear stress in kPa, (a, b and c) are the fitting parameters and (εh) is thehorizontal strain. Moreover, to consider the effect of TDA aggregate size on the stress-strain curves, the 95% confidence level (CL) of the fitting parameters was calculated. Theimportance of calculating the upper confidence level (UCL) and lower confidence level(LCL) is to give an indication of the expected range of the strength parameters for differentTDA aggregate sizes. As mentioned earlier, the developed curves are only function in thenormal stress. The fitting parameters were expressed as 2nd order polynomial equations,which are function in the normal stress magnitude. Figure 9 shows the non-linear curvefitting using Equation (5) for all samples at a normal stress of 50.1, 98.8 and 196.4 kPa.Furthermore, it could be noted from Figure 9 that the UCL and LCL boundaries correspondwell to the largest and lowest stress-strain curves. Based on the values obtained for thefitting parameters, i.e., a, b and c, at each normal stress level, 2nd degree polynomialrelationships between the fitting parameters and the normal stresses were obtained aslisted in Table 3. The 2nd degree polynomial equation is as follows:
a, b or c = p1(σ′v)2
+ p2σ′v + p3 (5)
where (σ′v) is the effective normal stress in kPa and (p1, p2 and p3) are the fitting parameterswhich are given in Table 3.
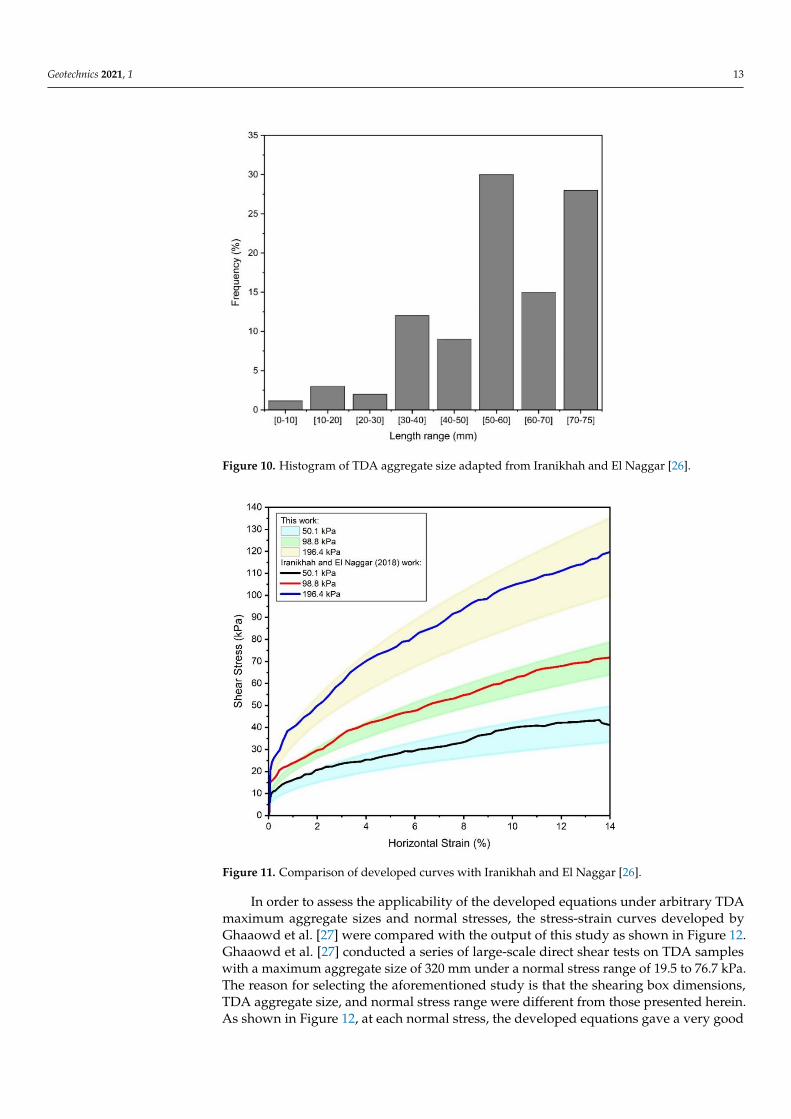
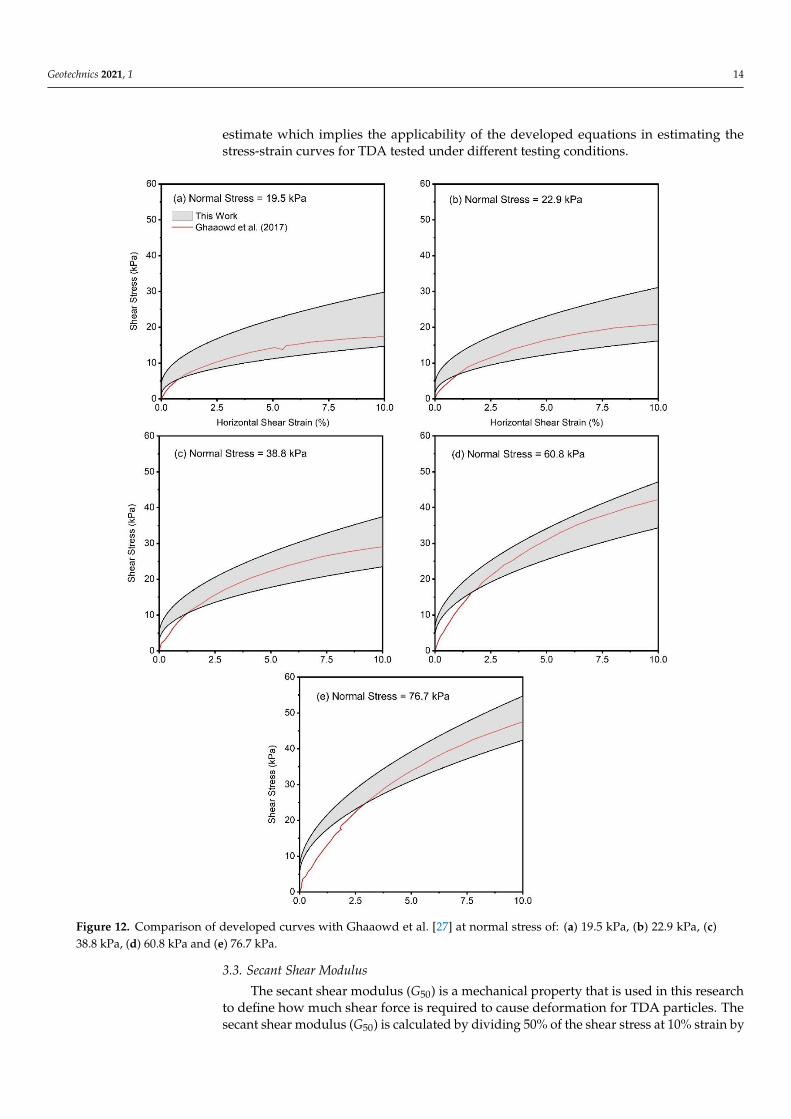
The equations developed to predict the range of stress–strain curves of Type A TDAfor a different aggregate size were evaluated through the comparison with various ex-perimental curves presented in the literature. Iranikhah and El Naggar [26] conducted aseries of large-scale direct shear tests on TDA–gravel mixtures. The percentage of TDAby weight varied from 0% to 100% and the applied normal stresses were 50.1, 98.8 and196.4 kPa. Figure 10 shows the histogram for the TDA material used by Iranikhah and ElNaggar [26]. As shown in Figure 11, at all normal stresses, the stress-strain curves obtainedby Iranikhah and El Naggar [26] are within the upper and lower bounds obtained in thiswork. Furthermore, it could be noted from Figure 8 that the maximum particle size usedwas 75 mm; therefore, the curves obtained by Iranikhah and El Naggar [26] tend to be nearthe upper bound due to the relatively large particle size.
Geotechnics 2021, 1 12
Geotechnics 2020, 1, FOR PEER REVIEW 12
Figure 9. Non-linear curve fitting for all samples at a normal stress of: (a) 50.1 kPa, (b) 98.8 kPa and (c) 198.6 kPa. Figure 9. Non-linear curve fitting for all samples at a normal stress of: (a) 50.1 kPa, (b) 98.8 kPa and (c) 198.6 kPa.
Table 3. Calibrated parameters for the 2nd degree polynomial equations.
Parameters p1 p2 p3
a −1.74 × 10⁻⁴ 0.084 0.48UCL—a −5.70 × 10⁻⁵ 0.063 2.4LCL—a −2.90 × 10⁻⁴ 0.105 −1.45
b 1.11 × 10⁻⁴ 0.08 5.38UCL—b 2.20 × 10⁻⁴ 0.06 7.14LCL—b 2.94 × 10⁻⁶ 0.1 3.62
c −9.20 × 10⁻⁶ 0.0025 0.405UCL—c −7.00 × 10⁻⁶ 0.0019 0.46LCL—c −1.14 × 10⁻⁵ 0.0031 0.35
Geotechnics 2021, 1 13
Geotechnics 2020, 1, FOR PEER REVIEW 13
Figure 10. Histogram of TDA aggregate size adapted from Iranikhah and El Naggar [26].
Figure 11. Comparison of developed curves with Iranikhah and El Naggar [26].
Figure 10. Histogram of TDA aggregate size adapted from Iranikhah and El Naggar [26].
Geotechnics 2020, 1, FOR PEER REVIEW 13
Figure 10. Histogram of TDA aggregate size adapted from Iranikhah and El Naggar [26].
Figure 11. Comparison of developed curves with Iranikhah and El Naggar [26]. Figure 11. Comparison of developed curves with Iranikhah and El Naggar [26].
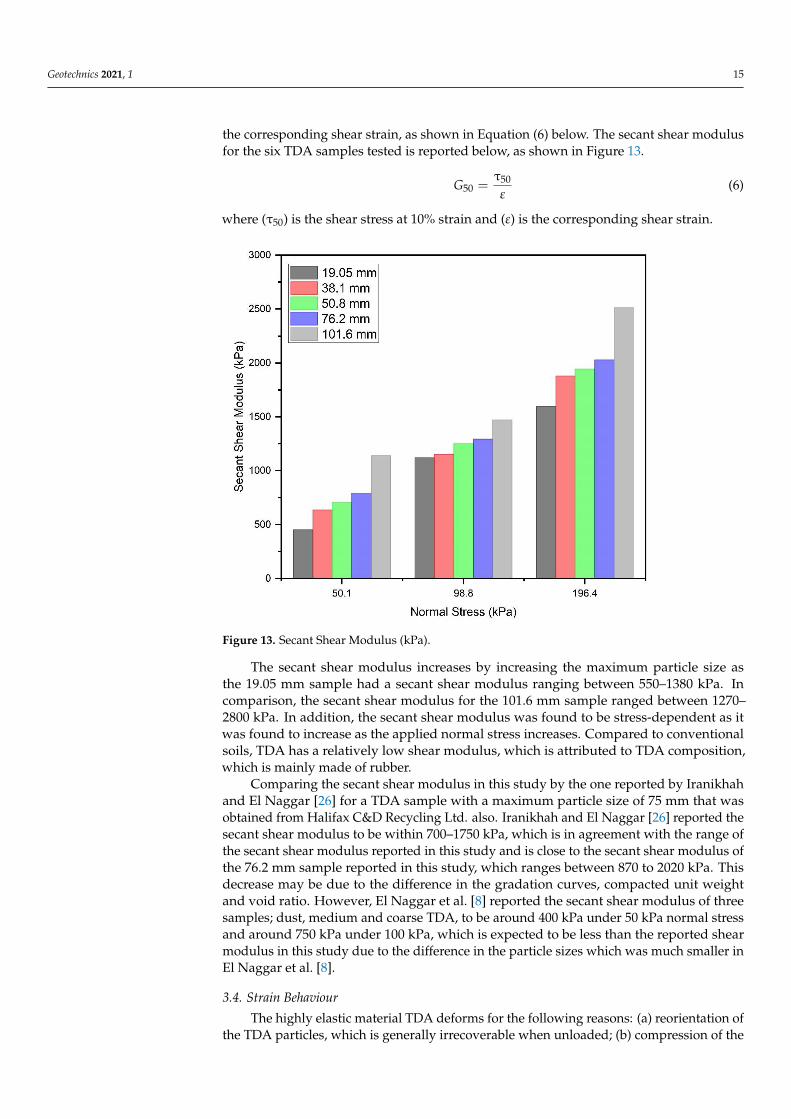
In order to assess the applicability of the developed equations under arbitrary TDAmaximum aggregate sizes and normal stresses, the stress-strain curves developed byGhaaowd et al. [27] were compared with the output of this study as shown in Figure 12.Ghaaowd et al. [27] conducted a series of large-scale direct shear tests on TDA sampleswith a maximum aggregate size of 320 mm under a normal stress range of 19.5 to 76.7 kPa.The reason for selecting the aforementioned study is that the shearing box dimensions,TDA aggregate size, and normal stress range were different from those presented herein.As shown in Figure 12, at each normal stress, the developed equations gave a very good
Geotechnics 2021, 1 14
estimate which implies the applicability of the developed equations in estimating thestress-strain curves for TDA tested under different testing conditions.Geotechnics 2020, 1, FOR PEER REVIEW 14
Figure 12. Comparison of developed curves with Ghaaowd et al. [27] at normal stress of: (a) 19.5 kPa, (b) 22.9 kPa, (c) 38.8
kPa, (d) 60.8 kPa and (e) 76.7 kPa.
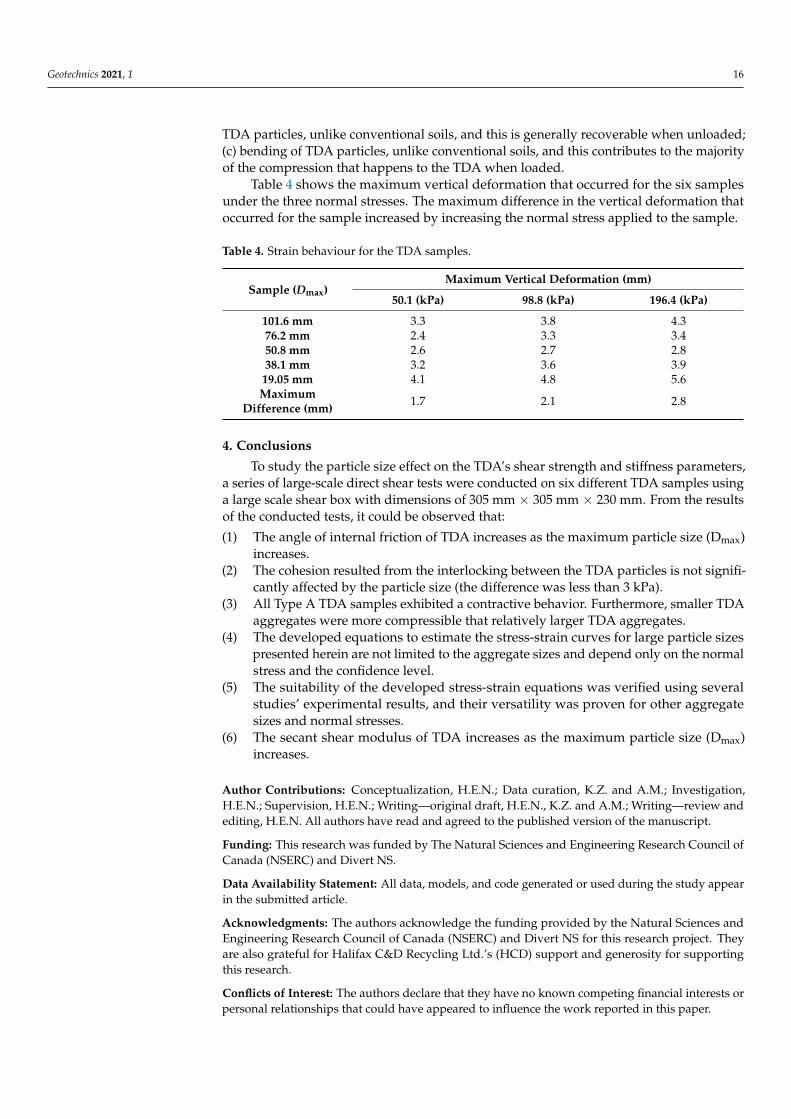
3.3. Secant Shear Modulus
The secant shear modulus (G50) is a mechanical property that is used in this research
to define how much shear force is required to cause deformation for TDA particles. The
secant shear modulus (G50) is calculated by dividing 50% of the shear stress at 10% strain
by the corresponding shear strain, as shown in Equation 6 below. The secant shear mod-
ulus for the six TDA samples tested is reported below, as shown in Figure 13.
𝐺50 =τ50
𝜀 (6)
Figure 12. Comparison of developed curves with Ghaaowd et al. [27] at normal stress of: (a) 19.5 kPa, (b) 22.9 kPa, (c)38.8 kPa, (d) 60.8 kPa and (e) 76.7 kPa.
3.3. Secant Shear Modulus
The secant shear modulus (G50) is a mechanical property that is used in this researchto define how much shear force is required to cause deformation for TDA particles. Thesecant shear modulus (G50) is calculated by dividing 50% of the shear stress at 10% strain by
Geotechnics 2021, 1 15
the corresponding shear strain, as shown in Equation (6) below. The secant shear modulusfor the six TDA samples tested is reported below, as shown in Figure 13.
G50 =τ50
ε(6)
where (τ50) is the shear stress at 10% strain and (ε) is the corresponding shear strain.
Geotechnics 2020, 1, FOR PEER REVIEW 15
where (τ50) is the shear stress at 10% strain and (ε) is the corresponding shear strain.
The secant shear modulus increases by increasing the maximum particle size as the
19.05 mm sample had a secant shear modulus ranging between 550–1380 kPa. In compar-
ison, the secant shear modulus for the 101.6 mm sample ranged between 1270–2800 kPa.
In addition, the secant shear modulus was found to be stress-dependent as it was found
to increase as the applied normal stress increases. Compared to conventional soils, TDA
has a relatively low shear modulus, which is attributed to TDA composition, which is
mainly made of rubber.
Comparing the secant shear modulus in this study by the one reported by Iranikhah
and El Naggar [26] for a TDA sample with a maximum particle size of 75 mm that was
obtained from Halifax C&D Recycling Ltd. also. Iranikhah and El Naggar [26] reported
the secant shear modulus to be within 700–1750 kPa, which is in agreement with the range
of the secant shear modulus reported in this study and is close to the secant shear modulus
of the 76.2 mm sample reported in this study, which ranges between 870 to 2020 kPa. This
decrease may be due to the difference in the gradation curves, compacted unit weight and
void ratio. However, El Naggar et al. [8] reported the secant shear modulus of three sam-
ples; dust, medium and coarse TDA, to be around 400 kPa under 50 kPa normal stress and
around 750 kPa under 100 kPa, which is expected to be less than the reported shear mod-
ulus in this study due to the difference in the particle sizes which was much smaller in El
Naggar et al. [8].
Figure 13. Secant Shear Modulus (kPa).
3.4. Strain Behaviour
The highly elastic material TDA deforms for the following reasons: (a) reorientation
of the TDA particles, which is generally irrecoverable when unloaded; (b) compression of
the TDA particles, unlike conventional soils, and this is generally recoverable when un-
loaded; (c) bending of TDA particles, unlike conventional soils, and this contributes to the
majority of the compression that happens to the TDA when loaded.
Table 4 shows the maximum vertical deformation that occurred for the six samples
under the three normal stresses. The maximum difference in the vertical deformation that
occurred for the sample increased by increasing the normal stress applied to the sample.
Figure 13. Secant Shear Modulus (kPa).
The secant shear modulus increases by increasing the maximum particle size asthe 19.05 mm sample had a secant shear modulus ranging between 550–1380 kPa. Incomparison, the secant shear modulus for the 101.6 mm sample ranged between 1270–2800 kPa. In addition, the secant shear modulus was found to be stress-dependent as itwas found to increase as the applied normal stress increases. Compared to conventionalsoils, TDA has a relatively low shear modulus, which is attributed to TDA composition,which is mainly made of rubber.
Comparing the secant shear modulus in this study by the one reported by Iranikhahand El Naggar [26] for a TDA sample with a maximum particle size of 75 mm that wasobtained from Halifax C&D Recycling Ltd. also. Iranikhah and El Naggar [26] reported thesecant shear modulus to be within 700–1750 kPa, which is in agreement with the range ofthe secant shear modulus reported in this study and is close to the secant shear modulus ofthe 76.2 mm sample reported in this study, which ranges between 870 to 2020 kPa. Thisdecrease may be due to the difference in the gradation curves, compacted unit weightand void ratio. However, El Naggar et al. [8] reported the secant shear modulus of threesamples; dust, medium and coarse TDA, to be around 400 kPa under 50 kPa normal stressand around 750 kPa under 100 kPa, which is expected to be less than the reported shearmodulus in this study due to the difference in the particle sizes which was much smaller inEl Naggar et al. [8].
3.4. Strain Behaviour
The highly elastic material TDA deforms for the following reasons: (a) reorientation ofthe TDA particles, which is generally irrecoverable when unloaded; (b) compression of the
Geotechnics 2021, 1 16
TDA particles, unlike conventional soils, and this is generally recoverable when unloaded;(c) bending of TDA particles, unlike conventional soils, and this contributes to the majorityof the compression that happens to the TDA when loaded.
Table 4 shows the maximum vertical deformation that occurred for the six samplesunder the three normal stresses. The maximum difference in the vertical deformation thatoccurred for the sample increased by increasing the normal stress applied to the sample.
Table 4. Strain behaviour for the TDA samples.
Sample (Dmax)Maximum Vertical Deformation (mm)
50.1 (kPa) 98.8 (kPa) 196.4 (kPa)
101.6 mm 3.3 3.8 4.376.2 mm 2.4 3.3 3.450.8 mm 2.6 2.7 2.838.1 mm 3.2 3.6 3.9
19.05 mm 4.1 4.8 5.6Maximum
Difference (mm) 1.7 2.1 2.8
4. Conclusions
To study the particle size effect on the TDA’s shear strength and stiffness parameters,a series of large-scale direct shear tests were conducted on six different TDA samples usinga large scale shear box with dimensions of 305 mm × 305 mm × 230 mm. From the resultsof the conducted tests, it could be observed that:
(1) The angle of internal friction of TDA increases as the maximum particle size (Dmax)increases.
(2) The cohesion resulted from the interlocking between the TDA particles is not signifi-cantly affected by the particle size (the difference was less than 3 kPa).
(3) All Type A TDA samples exhibited a contractive behavior. Furthermore, smaller TDAaggregates were more compressible that relatively larger TDA aggregates.
(4) The developed equations to estimate the stress-strain curves for large particle sizespresented herein are not limited to the aggregate sizes and depend only on the normalstress and the confidence level.
(5) The suitability of the developed stress-strain equations was verified using severalstudies’ experimental results, and their versatility was proven for other aggregatesizes and normal stresses.
(6) The secant shear modulus of TDA increases as the maximum particle size (Dmax)increases.
Author Contributions: Conceptualization, H.E.N.; Data curation, K.Z. and A.M.; Investigation,H.E.N.; Supervision, H.E.N.; Writing—original draft, H.E.N., K.Z. and A.M.; Writing—review andediting, H.E.N. All authors have read and agreed to the published version of the manuscript.
Funding: This research was funded by The Natural Sciences and Engineering Research Council ofCanada (NSERC) and Divert NS.
Data Availability Statement: All data, models, and code generated or used during the study appearin the submitted article.
Acknowledgments: The authors acknowledge the funding provided by the Natural Sciences andEngineering Research Council of Canada (NSERC) and Divert NS for this research project. Theyare also grateful for Halifax C&D Recycling Ltd.’s (HCD) support and generosity for supportingthis research.
Conflicts of Interest: The authors declare that they have no known competing financial interests orpersonal relationships that could have appeared to influence the work reported in this paper.
Geotechnics 2021, 1 17
References1. Cecich, V.; Gonzales, L.; Hoisaeter, A.; Williams, J.; Krishna, R. Use of Shredded Tires as Lightweight Backfill Material for
Retaining Structure. Waste Manag. Res. 2016, 14, 433–451. [CrossRef]2. Soltani, A.; Deng, A.; Taheri, A.; O’Kelly, B.C. Engineering Reactive Clay Systems by Ground Rubber Replacement and
Polyacrylamide Treatment. Polymers 2019, 11, 1675. [CrossRef] [PubMed]3. Soltani, A.; Taheri, A.; Deng, A.; O’Kelly, B.C. Improved Geotechnical Behavior of an Expansive Soil Amended with Tire-Derived
Aggregates Having Different Gradations. Minerals 2020, 10, 923. [CrossRef]4. Shahrokhi-Shahraki, R.; Kwon, P.S.; Park, J.; O’Kelly, B.C.; Rezania, S. BTEX and Heavy Metals Removal Using Pulverized Waste
Tires in Engineered Fill Materials. Chemosphere 2020, 242, 125281. [CrossRef] [PubMed]5. ASTM D6270-08(2012). Standard Practice for Use of Scrap Tires in Civil Engineering Applications; ASTM International: West
Conshohocken, PA, USA, 2012.6. Zahran, K.; El Naggar, H. Effect of Sample Size on TDA Shear Strength Parameters in Direct Shear Tests. Transp. Res. Rec. 2020,
2674, 1110–1119. [CrossRef]7. Sparkes, J.; El Naggar, H.; Valsangkar, A. Compressibility and Shear Strength Properties of Tire Derived Aggregate Mixed with
Lightweight Aggregate. J. Pipeline Syst. Eng. Pract ASCE 2019, 10, 04018031. [CrossRef]8. El Naggar, H.; Soleimani, P.; Fakhroo, A. Strength and Stiffness Properties of Green Lightweight Fill Mixtures. Geotech. Geol. Eng.
2016, 34, 867. [CrossRef]9. Humphrey, D.N.; Sandford, T.C.; Cribbs, M.M.; Manion, W.P. Shear Strength and Compressibility of Tire Chips for Use as Retaining
Wall Backfill. Transp. Res. Rec. 1993, 29–35. Available online: http://onlinepubs.trb.org/Onlinepubs/trr/1993/1422/1422-006.pdf(accessed on 13 November 2020).
10. Mahgoub, A.; El Naggar, H. Using TDA as an Engineered Stress-Reduction Fill over Preexisting Buried Pipes. J. Pipeline Syst.Eng. Pract. 2019, 10, 04018034. [CrossRef]
11. Mahgoub, A.; El Naggar, H. Innovative Application of Tire-Derived Aggregate around Corrugated Steel Plate Culverts. J. PipelineSyst. Eng. Pract. 2020. [CrossRef]
12. Mahgoub, A.; El Naggar, H. Coupled TDA-Geocell Stress-Bridging System for Buried Corrugated Metal Pipes. J. Geotech.Geoenviron. Eng. 2020, 146. [CrossRef]
13. Mahgoub, A.; El Naggar, H. Using TDA Underneath Shallow Foundations: Field Tests and Numerical Modelling. J. Com-put. Geotech. 2020. in production. [CrossRef]
14. Moussa, A.; El Naggar, H. Dynamic Characterization of Tire Derived Aggregates. J. Mater. Civ. Eng. 2020, 33. [CrossRef]15. Moussa, A.; El Naggar, H. Numerical evaluation of buried wave barriers performance. Int. J. Geosynth. Ground Eng. 2020, 6, 1–13.
[CrossRef]16. Kim, D.; Ha, S. Effects of Particle Size on the Shear Behavior of Coarse Grained Soils Reinforced with Geogrid. Materials 2014,
7, 963–979. [CrossRef]17. Islam, M.N.; Siddika, A.; Hossain, M.B.; Rahman, A.; Asad, M.A. Effect of particle size on the shear strength behaviour of sands.
Aust. Geomech. J. 2011, 46, 85–95.18. Vangla, P.; Latha, G.M. Influence of Particle Size on the Friction and Interfacial Shear Strength of Sands of Similar Morphology.
Int. J. Geosynth. Ground Eng. 2015, 1, 6. [CrossRef]19. ASTM C136/C136M-14. Standard Test Method for Sieve Analysis of Fine and Coarse Aggregates; ASTM International: West Con-
shohocken, PA, USA, 2014.20. ASTM D1557-12e1. Standard Test Methods for Laboratory Compaction Characteristics of Soil Using Modified Effort (56,000 ft-lbf/ft3 (2700
kN-m/m3)); ASTM International: West Conshohocken, PA, USA, 2012.21. ASTM D3080 / D3080M-11. Standard Test Method for Direct Shear Test of Soils Under Consolidated Drained Conditions; ASTM
International: West Conshohocken, PA, USA, 2011.22. Bernal, A.; Salgado, R.; Swan, R.; Lovell, C. Interaction between tire shreds, rubber-sand, and geosynthetics. Geosynth. Int. 1997,
4, 623–643. [CrossRef]23. Foose, G.J.; Benson, C.H.; Bosscher, P.J. Sand Reinforced with Shredded Waste Tires. J. Geotech. Eng. 1996. [CrossRef]24. Xiao, M.; Ledezma, M.; Hartman, C. Shear Resistance of Tire-Derived Aggregate Using Large-Scale Direct Shear Tests. J. Mater.
Civ. Eng. 2014, 27. [CrossRef]25. Freundlich, H. Kapillarchemie, eine Darstellung der Chemie der Kolloide und verwandter Gebiete. Akad. Verlagsgesellschaft 1909.26. Iranikhah, A.; El Naggar, H. Effect of Tire-Derived Aggregate (TDA) Content on the Shear Strength Parameters of Gravel-TDA
Mixtures. In Proceedings of the 71st Canadian Geotechnical Conference (GeoEdmonton 2018), Edmonton, AB, Canada, 23–26September 2018.
27. Ghaaowd, I.; McCartney, J.S.; Thielmann, S.S.; Sanders, M.J.; Fox, P.J. Shearing behavior of tire-derived aggregate with largeparticle size. I: Internal and concrete interface direct shear. J. Geotech. Geoenviron. Eng. 2017, 143. [CrossRef]