Embed Size (px)
Citation preview

Working Paper 2016:28 Department of Economics School of Economics and Management
Effect of Type 1 Diabetes on School Performance in a Dynamic World: New Analysis Exploring Swedish Register Data Emma Persson Sofie Persson Ulf-G. Gerdtham Katarina Steen Carlsson October 2016

1
Effect of Type 1 Diabetes on School Performance in a Dynamic World:
New Analysis Exploring Swedish Register Data
Emma Persson1*, Sofie Persson2*, Ulf-G. Gerdtham2,3,4, and Katarina Steen Carlsson2,3
for the Swedish Childhood Diabetes Study Group
1Department of Statistics, USBE, Umeå University, Umeå, Sweden
2Health Economics Unit, Department of Clinical Sciences, Lund University, Malmö, Sweden 3Health Economics Program, Lund University, Lund, Sweden 4Department of Economics, Lund University, Lund, Sweden
Keywords: type 1 diabetes, education, school performance, register data
JEL codes: I00, I10, I21, J24
Abstract
This paper investigates if the effect of type 1 diabetes mellitus (T1DM) on school performance
has changed over time using national Swedish population register data. The issue is of interest
because management and treatment of the disease have improved over the last decades and,
furthermore, because of changes in the educational grading system. Despite these changes, data
indicate a persistent negative effect of T1DM on compulsory and upper secondary school
grades and the results appears similar to earlier findings on cohorts completing school under
the previous grading system. Moreover, the results are robust to alternative model specifications
and econometric estimation strategies. Whereas access to new treatment technologies and
improved diabetes management strategies has reduced the burden of diabetes in daily life, the
results from this study indicate that other trends have not implied a reduction, over time, in the
impact of T1DM on school performance. This finding indicates that continued efforts are
needed to improve the situation in school for children with T1DM to prevent potential long-
term socioeconomic consequences.
Correspondence: Sofie Persson, Health Economics Unit, Department of Clinical Sciences,
Lund University, Medicon Village, 223 81 Lund, Sweden. Phone: +46 735561293, fax: +46
46-2224720. Email: [email protected]
*Emma Persson and Sofie Persson contributed to this work equally.

2
1. Introduction
The relationship between education and health has been widely studied as part of the economic
literature on the complex relationship between socioeconomic status and health. Though most
studies focus on the effect of education on health, there is a growing body of literature on the
effect of health in early childhood on education (Glied and Smith, 2011, Eide and Showalter,
2011). Type 1 diabetes mellitus (T1DM) is one example of a childhood health shock that has
been found to negatively affect school performance and level of education (Wodrich et al.,
2011, Hannonen et al., 2010, Parent et al., 2009, Wennick et al., 2011, Milton et al., 2006, Taras
and Potts-Datema, 2005, Persson et al., 2016, Persson et al., 2013, Dahlquist and Källén, 2007,
Cooper et al., 2014). The two largest published register studies on this topic used Swedish data
from the Swedish Childhood Diabetes Register (SCDR) to investigate the effect of T1DM on
school performance: Dahlquist and Källén (2007) compared school grades from compulsory
school among children on the SCDR with children in the general population born in 1973–
1986. After controlling for potential confounders, the authors found a negative effect on school
grades, particularly among those diagnosed before the age 2 years, and an increased risk of not
passing in Mathematics, English, Swedish, and Physical Education. Persson et al. (2013)
investigated the effect of T1DM on school performance by exploring the effect on mean final
grades in compulsory and upper secondary school in children born between 1972 and 1978. In
line with Dahlquist and Källén, they found a similar negative effect of T1DM on school grades
in compulsory school as well as in theoretical programs in upper secondary school, after
controlling for demographic and socioeconomic background.
Over time, however, several factors may change the conditions for children with T1DM to
perform well in school. Firstly, new health care technologies and improved diabetes education
may diminish the influence of T1DM as they may improve health and facilitate the situation

3
for the affected children through easier diabetes self-management and improved disease control
and health. For example, a recent Australian study (Cooper et al., 2014) indicates that the
negative effect of T1DM on school performance may have “leveled out” in recent years as they
found no evidence of an overall negative effect on test scores1 in compulsory school among
children born in 1994–2003. Secondly, school setting-related changes may influence the
conditions for children with poor health to achieve well in school. In 1997, the educational
grading system in Sweden switched from a relative grading system to an absolute and goal-
oriented grading system. This structural change may increase or decrease the effect of T1DM
depending on potential parallel mechanisms, such as changes in criteria for grading of students,
or additional requirements for children with special needs in school implemented along with
the reform. Together, the treatment developments and the changes in the grading system raise
the question of how T1DM affects school performance in more recent birth cohorts of children.
Investigating the effect of these two factors combined is an empirical question.
This paper therefore examines if the effect of T1DM on school performance has remained
constant over time. Firstly, we investigate if childhood onset T1DM has affected school
performance in compulsory and upper secondary school also among children born in the 1980s
and early 1990s (and completing school during 1998–2010). Secondly, we analyze if the effect
has changed compared to the effect seen in earlier cohorts (born in the 1970s) by comparing
the estimated effect to a previous study (Persson et al., 2013).
Similar to Persson et al. (2013), we base our analysis on data from the SCDR, which has been
matched to a sample of non-diabetic controls born in the same year and living in the same
municipality. In addition to regression analysis, we test the robustness of our results by also
1 Based on test scores from the National Assessment Program – Literacy and Numeracy (NAPLAN), which
examines four educational outcome domains and is administered annually in Australia.
4
estimating the average effect of T1DM in the T1DM population using a matching estimator that
relaxes underlying model assumptions while still taking the case control design into account.
The paper contributes to the literature of how a childhood onset of a chronic disease, such as
T1DM, affects educational prospects. The aim is to investigate if this effect may have changed,
and may even have been reduced, due to improvements in the treatment of diabetes in
combination with reforms in the educational grading system. From a policy perspective, this
may be of particular interest as the results may generate knowledge of how to prevent
educational disadvantages of children with chronic diseases in the future. This may also be of
importance for decision makers when assessing the need for additional support of children with
T1DM in school. Furthermore, the paper contributes methodologically by exploring the
robustness of the results through two alternative statistical approaches (regression and matching
analysis) in a case control setting.
The paper is organized as follows: the next section, Section 2, discusses T1DM as a childhood
health shock and how it affects school performance. It also provides some background
information on changes in the treatment of T1DM and the school setting in Sweden over time.
Section 3 presents the data and methods used for the analysis; and in Section 4, the results are
presented. The discussion and concluding remarks are presented in Section 5.
2. Background
2.1 Type 1 diabetes mellitus – a childhood health shock
Type 1 diabetes is a serious chronic health disorder in which the pancreas becomes unable to
produce the vital hormone insulin that is needed to regulate glucose levels in the blood
(Daneman, 2006). Sweden has the second highest incidence rate of T1DM in Europe
(44/100,000 children aged 0–14 per year during the period 2005–2007) (Berhan et al., 2011)
and around 700 children each year experience onset of the disease (Patterson et al., 2009).

5
It has not been possible to identify a single underlying cause of T1DM, but current evidence
suggests that the onset is triggered by a complex combination of genetic and environmental
factors that the child needs to be exposed to, possibly in a certain sequence, during a vulnerable
time period, to trigger the onset (Dahlquist, 1998, Dahlquist et al., 1999, Dahlquist, 1995,
Daneman, 2006, Åkerblom et al., 2002). To date, there is little hard evidence that
socioeconomic factors, as conventionally measured, are concerns for confounding of the
relationship between T1DM and outcomes later in life. Other unobserved and unknown
characteristics can, of course, never be completely ruled out.
There are several characteristics of T1DM that may impact school performance of the affected
children, both as a consequence of the short- and long-term diabetic complications and due to
the demanding daily disease management to keep glucose levels within target ranges. Our
analysis is inspired by the human capital theory of the demand for health (Grossman, 1972).
Following the Grossman model, a random health shock in childhood, such as T1DM, may
impact on school performance as a consequence of the health depreciation that implies less
healthy time available for educational investments. Self-monitoring of blood glucose, self-care
education programs, health care visits, and strict daily routines are all factors that can take time
and focus from school participation and studying. The direct complications associated with
T1DM, such as episodes of hyperglycemia and ketoacidosis, may also affect mental alertness
and learning capacity and may therefore increase the time investment needed to accumulate
human capital. Type 1 diabetes is also associated with long-term complications, including
cardiovascular disease and nerve, kidney, and eye disease (The Diabetes Control and
Complications Trial Research Group, 1993b, Nathan et al., 2005), as well as mortality risk
(Lind et al., 2014, Rawshani et al., 2015). Knowledge about these risks may motivate individual
disease management, but may also reduce incentives to invest in education as a consequence of
uncertainty about future labor market productivity and life expectancy. Technological progress,

6
such as in development of medicines and medical devices, may reduce some of the burden of
T1DM in daily management that may be associated with the documented effect on school
performance (Persson et al., 2013, Dahlquist and Källén, 2007).
2.2 Changes in the treatment of type 1 diabetes mellitus
The management and treatment of T1DM has changed substantially and new treatment
guidelines for metabolic control have been developed over the last decades. During the 1990s,
the results from the Diabetes Control and Complications Trial (DCCT) provided strong
evidence of the importance of maintaining blood glucose values under a proposed level to avoid
the risk of many long-term, diabetes-related complications (The Diabetes Control and
Complications Trial Research Group, 1993a). In the years following the DCCT, intensive blood
glucose control measures were adopted by most pediatric clinics in Sweden. In 1996, the
Swedish National Board of Health and Welfare released its first national guidelines for the
treatment of diabetes, emphasizing the importance of maintaining metabolic control to delay
and prevent diabetes-related complications (Socialstyrelsen, 1996). Self-care support for
children with diabetes in school has also improved over the last decade and in 2009 the Swedish
legislation regarding support to children with chronic diseases was strengthened by stating their
right to an individualized, written action plan defining the help needed during the school day
(Sarnblad et al., 2016).
During the same time period, several improvements were made in glucose-lowering drugs and
the technology for administering them (Hanås, 2014). In 1984, treatment with multiple daily
injections of insulin was introduced in Sweden and in 1985, the first insulin pens were available,
enabling a freer lifestyle with more flexible mealtime routines. Long acting insulin agents were
introduced in Sweden in the early 2000s (Hanås, 2014), enabling a more stable level of insulin
during the day and the night. Additionally, access to insulin pumps has increased; often they
have been targeted to people with difficulty to control their blood glucose levels. In 1997,

7
insulin pump therapy was included in the Swedish reimbursement system (The Swedish
Diabetes Association, 2016) and in 2008, more than 40% of 12–16-year-olds with T1DM had
insulin pump-based treatment (Sarnblad et al., 2016).
Based on the human capital model, we might expect these treatment improvements to decrease
the negative effect of T1DM on school performance as they should allow children to spend
more time on studying and school participation instead of disease management. Additionally,
if improved treatment is able to decrease or delay the development of diabetes-related
complications, then incentives for education may be less affected. Improved treatment could
also free up time for the parents of children with T1DM for interactions with their children
other than disease management, possibly enhancing other human capital formation including
education.
2.3 Changes in the educational grading system
Another aspect of this study is the change in the educational grading system in Sweden.
Individuals included in the two earlier studies (Dahlquist and Källén, 2007, Persson et al., 2013)
received school grades according to the relative grading system in use in Sweden from the early
1960s to 1996. This grading system was based on a scale of 1 to 5 and intended to be normally
distributed at national level. The relative grading system was replaced in the mid-1990s starting
with the 1981 birth cohort for compulsory school and the 1978 birth cohort for upper secondary
school. The new, goal-oriented grading system had a four-level alphabetic scale. Grades were
set according to achievement of specific absolute goals of learning and were not relative to
other students’ performance.
There is no empirical literature on how this change in the grading system has changed the
conditions for children with diabetes or other chronic diseases and different arguments may be
pursued regarding the effects this has had, favorable or unfavorable. One argument is that the

8
new system is beneficial for children in need of extra support in school, as can be the case with
children with T1DM. This is because the new, goal-oriented grading system includes a level
for “not passing,” not defined in the relative grading system, which may contribute to earlier
identification of students in need of additional support (Gustafsson et al., 2009). Additionally,
the new level for “not passing” may provide stronger incentives to teachers to help their students
pass and, thus, to improve the school’s statistics on how well their students meet basic
requirements (Böhlmark and Holmlund, 2011). Such school outputs may have increased in
importance after the school reform in 1992 which allowed students to apply to any school rather
than being allocated a school close to home. If this is the case, then the change in the grading
system, together with improved treatment, may have enhanced the position for children with
T1DM and we would expect a reduced effect, on a group level, of the disease on school
performance.
On the other hand, an argument for an unfavorable effect of the new grading system is that
reports evaluating the effects of the switch between the two systems have generally found
increased differences in grades among certain groups of students after implementing the goal-
oriented system (by social background, gender, and ethnicity), particularly based on the
educational level of the parents (Björklund et al., 2010, Gustafsson et al., 2009). This may be a
consequence of the central concept of normal distribution associated with the relative grading
system (The Swedish National Agency for Education, 2011). Applying a normal distribution
was associated with limiting the proportion of students who would achieve both the higher and
the lower grades and essentially putting a significant proportion of all students in the middle, at
grade 3, making the middle heterogeneous in terms of real school achievements.
Consequently, we may have two underlying, conflicting mechanisms in this analysis of the
impact of T1DM on school performance - a decreasing impact due to improved treatment, but
9
at the same time an increasing impact due to the new grading system. It is an empirical question
to investigate the size of the combined effect.
3. Materials and Methods
3.1 Study design and data
We stud the impact of T1DM on school grades using unique data from the SCDR. The register
includes children (<15 years) diagnosed with T1DM in Sweden. Cases of childhood T1DM
have been registered by the SCDR since July 1st, 1977. The register covers 96–99% of all
children with T1DM (Nyström et al., 1990, Dahlquist et al., 1982) and includes more than
15,000 individuals diagnosed between 1977 and 2010. For research purposes, the SCDR has
been linked to other national registers and databases, including the Multi-Generation Register
(Statistics Sweden, 2010), the Longitudinal Integration Database for Health Insurance and
Labour Market Studies (LISA) (Statistics Sweden, 2011), the Medical Birth Register (Center
for Epidemiology, 2003), and the Swedish Register of Education (Statistics Sweden, 2006).
The research database enables the study of, inter alia, socioeconomic consequences of T1DM.
Since the incidence of T1DM is very low, a control group has been constructed for the SCDR
using a matched case control design. For each child in the register, four non-diabetic children
have been selected from the Swedish general population and matched by year of birth and
municipality of residence at the time of the T1DM diagnosis in the matched case. In addition,
LISA data has been collected for the parents of both cases and controls through the Multi-
Generation Register (Statistics Sweden, 2010).
The data collection for the SCDR was performed according to the Declaration of Helsinki and
informed consent was obtained from all registered children and/or their parents. The study has
been approved by the Regional Research Ethics Board in Umeå (dnr. 07-169M).

10
3.2 Study population
Our study is based on two populations of children from the SCDR. For the analysis of grades
from compulsory school, the study population includes children born in the 12-year period
between 1982 and 1993 and diagnosed with T1DM between 1982 and 2008, and their controls.
The analysis considers children who finish compulsory school in 1998–2010 and were alive at
the age of 17 (5,895 cases and 23,803 controls (Table 1)). To investigate grades from upper
secondary school, we included children born during 1979–1990, who were alive and had
obtained a final grade at the age of 20 (3,794 cases and 15,929 controls). In this subgroup, the
children with T1DM were diagnosed between 1979 and 2005.
3.3 Schooling variable measures
We use the final grade attained when finishing compulsory and upper secondary school as a
measure of school performance. The goal-oriented grading system includes four distinct levels
in each subject: “Fail,” “Pass,” “Pass with distinction,” and “Pass with special distinction,”
representing 0, 10, 15, and 20 points, respectively. When finishing compulsory school, the final
grade is calculated by summing up the 16 highest grades from school subjects completed,
resulting in a maximum total grade of 320 points (20*16). This final total grade from
compulsory school is then used when applying to upper secondary school.
In upper secondary school, the final grade is the average grade of completed courses during 3
years, weighted by the length of each course. The maximum average grade is 20 points and is
used when applying for admission to university.
3.4 Type 1 diabetes mellitus and potentially confounding control variables
Type 1 diabetes is defined as a binary variable with two categories: 1 = T1DM and 0 = control,
as well as a four-level categorical variable for different age groups at the time of the T1DM
diagnosis (ages 0–4, 5–9, 10–15 years, and controls). A set of potentially confounding factors,

11
possibly impacting both T1DM and grades, is also identified. Since the exact causes of T1DM
are largely unknown, we searched the medical literature to identify key factors associated with
T1DM and use these as control variables in the analysis. As the incidence of T1DM is known
to vary over time and across countries (with some of the highest incidence rates registered in
the Scandinavian countries (Patterson et al., 2009)), we use year of birth, municipality of
residence, and having a parent born in a Nordic country as risk factors for T1DM onset that
could also impact educational performance. Some other potential risk factors indicated in the
literature are: gender (male) (Ostman et al., 2008), mother’s educational level, serious life
events, and some perinatal events, such as birth weight and maternal age (Dahlquist et al., 1999,
Dahlquist, 2006, Nygren et al., 2015, Åkerblom et al., 2002, Maahs et al., 2010). Hence, we
also control for birth weight, the mother’s age at delivery, and the mother’s educational level,
measured 1 year prior to the onset of T1DM. Education is categorized by three levels: low =
compulsory education; medium = upper secondary education; and high = university education.
3.5 Statistical methods
In several studies, the effect of T1DM on different socioeconomic outcomes has been estimated
using regression analysis, controlling for potentially confounding factors (Persson et al., 2013,
Cooper et al., 2014, Minor, 2013, Steen Carlsson et al., 2010). As a first step in this study, we
follow the same approach and estimate two models of T1DM. Model 1 controls for year of birth
and municipality (the initial matching variables), whereas Model 2 controls for additional
potential confounders (sex, birth weight (low), age of mother at delivery, mother’s education,
and having at least one parent born in a Nordic country), in addition to year of birth and
municipality. We also investigated if the effect of T1DM differ depending on age at diagnosis
(Model 3, including three groups of age at T1DM diagnosis) and mother’s education (Model 4,
including the interaction between T1DM and mother’s education).

12
A potential limitation of traditional regression is that even if all relevant confounders are
controlled for, the model may still yield biased estimates if the relationship between these
factors and the outcome measure is not appropriately modeled. This issue may become a great
concern in situations where the case and control groups differ essentially in the distribution of
background characteristics (Fortson et al., 2015). To address this issue, we extend the analysis
by using Propensity Score Matching (PSM) (Abadie and Imbens, 2006). Through PSM we
target the average effect of T1DM within the group of people with T1DM, commonly referred
to as the “average treatment effect of the treated (ATT)” (Imbens and Wooldridge, 2009). In
addition to estimating a different parameter (the ATT) 2 , the PSM method differs from
regression analysis in that it requires no model assumption for the outcome, e.g., linearity.
Moreover, by matching, we restrict the analysis to individuals within the region of common
support (that is, we only include cases and controls with similar background characteristics,
expressed through overlapping propensity scores). However, similarly as in the regression
approach, PSM cannot account for unmeasured confounders. Both methods therefore relied on
the assumption that there are no additional factors correlated with both the T1DM and school
grades (Fortson et al., 2015).3
The matched case control design of the data in this study implies that T1DM is overrepresented
in the sample compared to in the general population and that information about the distribution
of the matching variables is lost. Therefore, a concern with using a PSM approach in this
particular setting is that additional knowledge may be needed to account for the sampling
design4 (Persson et al., 2014). More specifically, information about the prevalence of cases (of
2 Regression parameters are inherently conditional and may be interpreted as average or marginal only under
certain assumptions/models. Matching estimators typically target average effects within specified populations. 3 If an instrumental variable is available, this (unconfoundedness) assumption may be tested. For an instrument
to be valid, it must be strongly associated with T1DM and independent of school performance. However, in this
study, we have not been able to find a reliable instrument that meets both these criteria. 4 This is not an issue in regression analysis as long as the model assumptions are not violated, i.e., we have a
correctly specified model.

13
T1DM) in the population, as well as prevalence within the levels of year of birth and
municipality (the initial matching variables), is needed to correctly estimate the propensity
score, and subsequently the ATT.
To account for the sampling design, we use weighted maximum likelihood for the estimation
of the propensity score (Persson and Waernbaum, 2013). In this method, the weights should be
chosen based on what is known about the prevalence of T1DM in the population as well as
within the levels of year of birth and municipality. However, no reliable information on the
prevalence conditional on municipality is available. Hence, weights are approximated using
information about the prevalence of T1DM in the population as well as conditional on year of
birth. The prevalence is calculated using information about the number of individuals with
T1DM from the SCDR and about population size from Statistics Sweden. Because of the study
design the estimated propensity score using all individuals is also used when estimating the
effect within subgroups (e.g., boys/girls) (Rassen et al., 2012).
The matching estimator matches (nearest neighbor) controls to cases with replacement (Abadie
and Imbens, 2006). Instead of matching on the potential confounders directly, we use the
propensity score5 to balance the variables between the two groups. The propensity score is
defined as the probability of having T1DM, given the confounding variables, and is a function
sufficient for the control of confounding variables (Rosenbaum and Rubin, 1983). In the
analysis, matching is also performed within the levels of year of birth and/or municipality, i.e.,
exact matching, to improve balance. The propensity score was assumed to follow a logistic
regression and only significant variables (significance level of 0.1) were included in the model.
5 The matching estimator is not consistent when matching directly on more than one variable. By using the
propensity score, we can reduce the dimension of the variable vector to 1.

14
3.6 Standardized differences for comparison between time periods
To analyze if the effect of T1DM has changed over time, we calculated the standardized effect
size (Cohen’s d) (Cohen, 1988) and compared it to results, reported by Persson et al. (2013),
among children born in 1972–1978, and finishing compulsory school in 1988–1994 and upper
secondary school in 1991–1997. Cohen’s d is the difference in means between the cases and
the control group, divided by the average of their standard deviations. A d of 1 tells us that the
means of two groups differ by one standard deviation. This is a common effect measure used
to compare various educational and cognitive measurements that are not directly comparable
due to different scales (Gaudieri et al., 2008, Bangert-Drowns et al., 2004). Furthermore, this
method is a benchmarking system used for classification of the size of the effect (small if
approximately 0.20, medium if approximately 0.50, and large if approximately 0.80) (Cohen,
1988).
3.7 Descriptive statistics
The background characteristics of the T1DM group and the control group are relatively similar,
but some differences are found (Table 2). There are slightly fewer girls in the T1DM group
whereas the proportion of Swedish-born children is slightly larger among the cases. The largest
difference between the two groups can be seen in the variable of parental birth country, with a
greater proportion of children with T1DM having at least one parent born in a Nordic country
(97% vs. 91% in the compulsory school subgroup and 98% vs. 93% in the upper secondary
school subgroup).
Fewer children in the T1DM group had received a final grade from school, with the largest
difference seen in upper secondary school (95% and 96%, respectively, of the T1DM group
and the control group completed compulsory school and 73% and 76%, respectively, completed
upper secondary school). Among those attending upper secondary school, 52% in the T1DM
group vs. 56% of controls received a final grade from a theoretical program (defined as science,

15
social science, technology, an aesthetic program, or an International Baccalaureate education)
(Statistics Sweden, 2007). The unadjusted difference in average final grade between the T1DM
group and controls is -6.644 points (on a scale of 0–320 points) and -0.239 points (on a scale
of 0–20 points) for compulsory school and upper secondary school, respectively.
4. Results
4.1 Regression analysis
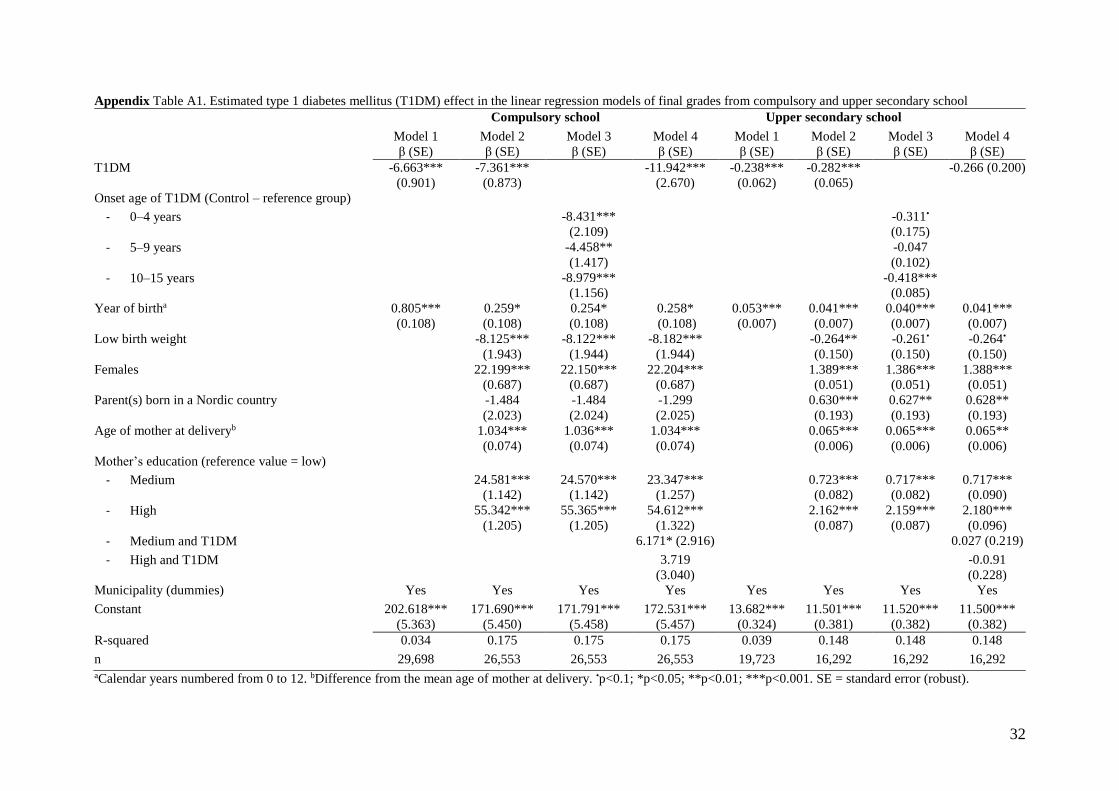
Table 3 presents the effect of T1DM on final school grades after controlling for year of birth
and municipality (Model 1), together with the effect of the disease when also controlling for
sex, birth weight (low), age of mother at delivery, mother’s educational level, and parent(s)
born in a Nordic country (Model 2).
The compulsory school results show a negative effect of T1DM using both models (Model 1: -
6.663 (p<0.001) and Model 2: -7.361 (p<0.001) points on a scale of 0–320 points)6. A negative
effect is seen also on the grades from upper secondary school, both in total (Model 1: -0.238
(p<0.001) and Model 2: -0.282 (p<0.001) on a scale of 0–20 points) and within each of the two
categories of upper secondary programs (theoretical -0.266 (p=0.002) and vocational -0.196
(p=0.033)). Similar effects are found for boys and girls in both levels of schooling, with highly
overlapping confidence intervals (CIs). However, the effect appears to be larger among children
with an early (0–4 years old) or late (10–15 years old) onset of the disease compared to those
diagnosed between the ages of 5 and 9 years (Model 3). In upper secondary school, no
significant effect is seen among those diagnosed at 5–9 years of age.
6 Individuals with missing information were excluded from the analysis. Hence, the Model 2 analyses were
based on a slightly smaller sample. Within these subsets, the unadjusted difference in mean grades was -7.39 in
compulsory school and -0.26 in upper secondary school (-0.22 in theoretical and -0.15 in vocational programs).

16
We also tested potential interaction effects between T1DM and the other variables in the
models. Most interactions were non-significant except for a tendency of a non-linear impact of
T1DM in relation to mother’s educational level in the analysis of compulsory school grades
(Model 4). The findings here suggest that in compulsory school, children whose mother only
has a compulsory school education may suffer a larger disadvantage from their disease
compared to those whose mothers have upper secondary schooling (11.9, 5.8, and 8.2 points
lower, respectively, depending on the mother’s educational level (low, medium, and high)).
However, we are unable to find a similar pattern for upper secondary school. Full regression
results from Models 1, 2, 3, and 4 are presented in the Appendix, Table A1.
4.2 Propensity Score Matching
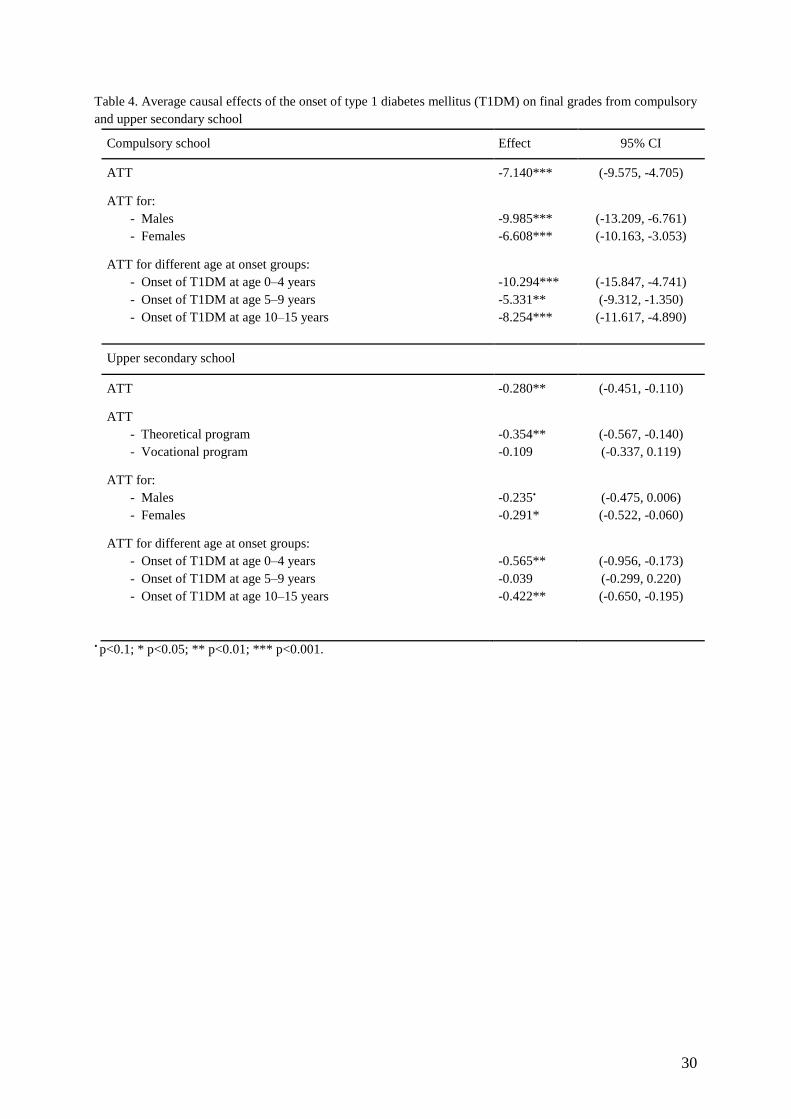
Table 4 presents the results from compulsory and upper secondary school when using PSM to
estimate the ATT within the T1DM population. Full results from the logistic propensity score
models are shown in the Appendix, Table A2.7
Overall, the PSM results are very similar to the regression results reported in Table 3. In
compulsory school,8 the estimated ATT of T1DM on final grades is -7.140 points, with a 95%
CI of (-9.575, -4.705).9 The effect is similar among boys and girls, although a somewhat larger
effect is estimated for boys, but with overlapping CIs (-9.985 (95% CI -13.209, -6.761) and -
6.608 points (95% CI -10.163, -3.053) for boys and girls, respectively). Moreover, a larger
negative effect of T1DM is seen among children with an early (0–4 years of age) or late (10–
7 The balance for all variables is improved after matching (Appendix, Table A2). 8 In compulsory school, the propensity score model adjusted for year of birth, municipality, birth weight, sex,
mothers’ age at delivery, and parental birth country. The mother’s educational level was not included in the
model since it was not a significant predictor in the propensity score model (Appendix, Table A2, Column 1). 9 The 1,747 individuals with missing information on birth weight and maternal age at delivery were excluded
from the analysis and the unadjusted difference in means for the remaining subsample was -7.17 points. This is
close to the estimated ATT.

17
15 years) onset of the disease compared to those diagnosed between the ages of 5 and 9 years.
The ATT of T1DM for children who experienced the onset before the age of 5 is -10.294 points.
In upper secondary school,10 the ATT is -0.280 points (95% CI -0.451, -0.110). Separately
analyzing the ATT for children who completed theoretical and vocational programs yielded
results similar to those seen in the regression analysis. The results indicate a slightly larger
negative effect among the theoretical programs, and, in contrast to the regression analysis, a
non-significant effect in the vocational programs. Additionally, the difference in the effect of
T1DM in upper secondary school for girls and boys is very small, but the effect is only
marginally significant for boys. However, a similar pattern as in the regression results is seen
in the different onset groups, with a larger effect among children who experienced the onset of
T1DM before the age of 5 or in the age range of 10–15 years. No effect is seen for the group
with onset at 5–9 years.
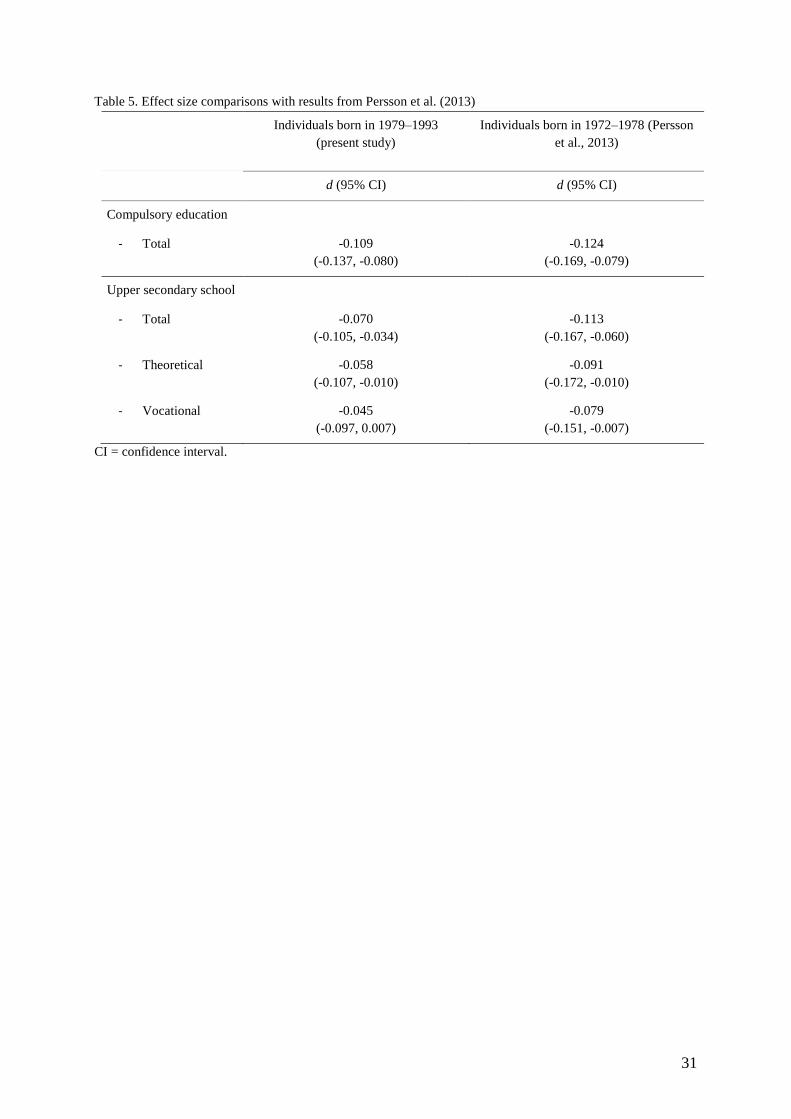
4.3 Effect size comparison with previous cohorts
Translated into a standardized difference (Cohen’s d), the effect of T1DM in compulsory and
upper secondary school, respectively, is d = -0.109 (95% CI -0.137, -0.080) and d = -0.070
(95% CI -0.105, -0.034). This represents a small effect, according to Cohen’s classification (d
<0.2). Table 5 shows these results in comparison to standardized differences derived from
results in Persson et al. (2013) based on an earlier birth cohort (1972–1978) in the SCDR
database.11 There is a potential marginally diminishing impact of T1DM between cohorts, but
the CIs are largely overlapping, indicating that the differences are not significant.
10 In upper secondary school, the propensity score model adjusted for year of birth, municipality, birth weight,
mothers’ age at delivery, and parental birth country. Sex and maternal education level were not significant in the
propensity score model and consequently were not included in the conditioning set of variables (Appendix,
Table A2, column 4). 11 Due to the robustness of the results using the different method approaches, the standardized unadjusted effect
of T1DM was used in the comparison to results reported in Persson et al. (2013).

18
5. Discussion
This study uses national register data covering the whole Swedish population to investigate if
the effect of childhood onset of T1DM on school performance, documented in prior research,
has changed in more recent birth cohorts of children. We found that T1DM has a negative effect
on final grades in both compulsory school and theoretical upper secondary school programs
among children born in 1979–1993, who received their final grades during 1998–2010. The
effect appears to be similar for boys and girls, but slightly larger among children with an early
(ages 0–4 years) or late (ages 10–15 years) onset of the disease. By standardizing the estimated
effects, we are able to compare the size of the effect to that among children born in the 1970s
(Persson et al., 2013). This analysis indicates that the negative effect of T1DM is still present
and only marginally smaller among children born in the 1980s and early 1990s.
The finding that the effect of T1DM appears relatively stable across the birth cohorts may be
interpreted in several ways. Firstly, the persistent effect of T1DM, despite improved treatment,
may suggest that the new, goal-oriented grading system is less beneficial for students with
T1DM compared to students in general. This is supported by findings from evaluations of the
switch between the two systems, reporting that the goal-oriented grading system has increased
the gap between potentially weaker groups of students, e.g., students with less well educated
parents or with non-Swedish-born parents, and their peers (Björklund et al., 2010, Gustafsson
et al., 2009). In a similar sense, if children with T1DM can be considered a more challenged
group due to their disease, then the decrease in the negative effect of T1DM, potentially
generated by improved treatment, may be balanced out by the unbeneficial new grading system.
Another possible interpretation of the results is that the negative effect of T1DM on school
performance may be driven by some characteristics of the disease that are less related to the
changes in treatment seen over the last decades. Perhaps most of the major benefits of enhanced
treatment generate improvements in other aspects of the children’s life or aspects that appear
19
later in life, such as delayed diabetic complications that may not develop before 10–15 years of
diabetes duration, or more. Instead benefits of improved treatment may be more visible if
looking at socioeconomic outcomes later in life, e.g., labor market participation or income. For
example, a study from 1998 shows an improvement in the labor market impact of diabetes
(types 1 and 2) among women between 1976 and 1992, coinciding with several important
medical advances during that time period (Kahn, 1998a). Nevertheless, regardless of which
interpretation is true, the results from this study clearly show that the effect of T1DM on school
grades is still present among individuals who has recently completed school.
Interestingly, this finding is not in line with the results reported by Cooper and colleagues, who
investigated school performance in a younger cohort of individuals (born in 1994–2003) in
Australia (Cooper et al., 2014). When studying test scores in compulsory school, they found no
impact of T1DM, except among children with poor glycemic control. They concluded that the
results provide reassuring evidence to clinicians and families, that a T1DM diagnosis during
childhood should not be expected to lessen school performance (Cooper et al., 2014).
There may be several reasons for the conflicting results. Firstly, the studies are performed in
different school and health care settings (in Sweden and Australia). Secondly, the studies used
different measures of school performance (final grade from compulsory and upper secondary
school vs. test scores from a standardized school achievement test administered in years 3, 5,
7, and 9 of school). Thirdly, the studies assess school performance among children of different
ages (at age 16 and 19 years when finishing compulsory and upper secondary school, vs. age
7–14 years when the standardized test was administered). Thus, the children in the Australian
study were still young, had had shorter disease duration on average, and had had less time to
accumulate effects of the disease.

20
A major strength of this study is the use of prospectively recorded, individual-level data from
national population registers. Additionally, the study population consists of approximately
30,000 and 20,000 individuals at the two levels of schooling, respectively. This rich dataset
allows us to account for several potential confounding factors, such as demographic and
socioeconomic background, as well as perinatal events. Although we have no data on the
treatment the individuals received while growing up, our specific interest lies with the fact that
this younger cohort has had access to a broader set of treatment alternatives during the course
of their life, compared to earlier birth cohorts. Aggregate data shows a gradual introduction of
new treatment technologies. However, as the children in our study cohort completed school in
1998–2010, it is likely that we have not captured the effect of the Swedish legislation in 2009
regulating support to children with chronic diseases during the school day. Further research is
needed to evaluate the importance of this targeted educational effort for the school performance
of children with diabetes.
The use of alternative estimation strategies, a linear regression and a PSM approach, also
enabled us to assess the robustness of the T1DM effect on educational performance. The two
methods generated similar results and the magnitude of the effects differed only slightly in most
of the analyses, indicating that the potential confounding factors do not, in fact, have a strong
impact on the estimated effect of T1DM on the final grades. However, it is important to keep
in mind that both methods assume that the bias introduced by potential confounding factors can
be controlled for through the observed variables, and neither method is able to account for
potential unobservable factors that may bias the results. Nevertheless, we expect any systematic
differences between the children in our study before the onset of T1DM to be small, if present
at all, due to the specific etiology of the disease. It is also important to note that the decrease in
the study sample (e.g., from Model 1 to Models 2-4), due to missing information in some of the
control variables, may not be random but may likely concern those born abroad, mainly

21
controls. Therefore, some of the difference in the estimated effect may be due to different
samples rather than use of different methods.
Finally, looking at the results from this study, we ask ourselves, how important, in a broader
sense, is this negative effect on school grades for the affected individuals? We know that the
final grade from both compulsory and upper secondary school is essential when applying to
higher levels of education, and therefore is a prerequisite to the ability to choose a preferred
upper secondary or university program. Even though the negative effect of T1DM is small, it
could still mean the difference between being admitted to the program of choice or not. The
strong positive relationship between education and labor market outcomes is widely studied
and accepted in the literature of human capital (Goldberg and Smith, 2007, Card, 1999). With
this in mind, the long-term consequences of T1DM may involve fewer career opportunities,
greater probability of unemployment, and lower earnings. This is further supported by research
indicating that T1DM is associated with negative effects on labour market outcomes in
adulthood among both men and women (Minor, 2011, Minor, 2013, Steen Carlsson et al., 2010,
Persson et al., 2016), findings that could in part be explained by the negative effect on
education. There is also evidence suggesting that increased education has a positive impact on
diabetic health investments, such as diet, blood glucose control, and smoking (Kahn, 1998b).
In the long run, this may imply that the negative impact of T1DM on educational performance
could generate negative effects also on adult health.
In conclusion, while access to new treatment technologies and improved diabetes management
strategies have reduced the burden of diabetes in daily life, the results from this study show that
childhood onset T1DM is still associated with educational challenges among children
completing school in recent years. The results indicate that continued efforts are needed to
improve the school situation for children with T1DM to prevent potential long-term
socioeconomic consequences of the disease.

22
Acknowledgements: We are grateful to Ingeborg Waernbaum, of the Department of Statistics,
Umeå University, for valuable support and insightful comments throughout the work on this
study. We would also like to thank Gisela Dahlquist at Umeå University as well as the
participants at the Swedish Childhood Diabetes Study Group and the Nordic Health
Economists’ Study Group (NHESG) for helpful comments and suggestions on earlier versions
of the paper.
Contributors: E.P. and S.P. contributed equally to the design and data analysis, as well as
writing, reviewing, and editing the article. U.G. and K.S.C. contributed to design and the
discussion, and reviewed and edited the article.
Funding: The Swedish Childhood Diabetes Register (SCDR) is funded by the Swedish
Research Council Project (No. 07531), research grants from the Swedish Council for Working
Life and Social Research (FAS) (dnr. 2009-0768 and 2012-0419), the Swedish Research
Council (dnr. 2014-646), the Swedish Diabetes Fund (2009-065), and Västerbotten County
Council. The Health Economics Program (HEP) at Lund University also receives core funding
from the FAS (dnr. 2006-1660), the Government Grant for Clinical Research (“ALF”), Skåne
Region (Gerdtham), and Riksbankens Jubileumsfond (P11-0814:1). The funding sources
played no part in the study design or collection, analysis, or interpretation of the data, the
writing of the manuscript, or the decision to submit the manuscript for publication. The authors
have no conflict of interest to declare.
Conflict of interest: No potential conflicts of interest relevant to this article were reported.

23
References
ABADIE, A. & IMBENS, G. W. 2006. Large Sample Properties of Matching Estimators for
Average Treatment Effects. Econometrica, 74, 235-267.
BANGERT-DROWNS, R. L., HURLEY, M. M. & WILKINSON, B. 2004. The Effects of
School-Based Writing-to-Learn Interventions on Academic Achievement: A Meta-
Analysis. Review of Educational Research, 74, 29-58.
BERHAN, Y., WAERNBAUM, I., LIND, T., MOLLSTEN, A. & DAHLQUIST, G. 2011.
Thirty years of prospective nationwide incidence of childhood type 1 diabetes: the
accelerating increase by time tends to level off in Sweden. Diabetes, 60, 577-81.
BJÖRKLUND, A., FREDRIKSSON, P., GUSTAFSSON, J.-E. & ÖCKERT, B. 2010. Den
svenska utbildningspolitikens arbetsmarknadseffekter: vad säger forskningen? .
Rapport 2010:13. Institutet för arbetsmarknadspolitisk utvärdering (IFAU)
BÖHLMARK, A. & HOLMLUND, H. 2011. 20 years of changes in school: What happened
to the equivalence? [20 år med förändringar i skolan: Vad har hänt med
likvärdigheten?]. SNS.
CARD, D. 1999. The Causal Effect of Education on Earnings. Handbook of Labor
Economics, 3, 1801-1863.
CENTER FOR EPIDEMIOLOGY 2003. The Swedish Medical Birth Register - A summary
of content and quality.
COHEN J 1988. Statistical power analysis for the behavioral sciences, Hillsdale, NJ:
Lawrence Erlbaum.
COOPER, M. N., MCNAMARA, K. A., DE KLERK, N. H., DAVIS, E. A. & JONES, T. W.
2014. School performance in children with type 1 diabetes: a contemporary
population-based study. Pediatr Diabetes.
DAHLQUIST, G. 1995. Environmental risk factors in human type 1 diabetes—An
epidemiological perspective. Diabetes/Metabolism Reviews, 11, 37-46.
DAHLQUIST, G. 1998. The aetiology of type 1 diabetes: an epidemiological perspective.
Acta Paediatr Suppl, 425, 5-10.
DAHLQUIST, G. 2006. Can we slow the rising incidence of childhood-onset autoimmune
diabetes? The overload hypothesis. Diabetologia, 49, 20-24.
DAHLQUIST, G., GUSTAVSSON, K. H., HOLMGREN, G., HAGGLOF, B., LARSSON,
Y., NILSSON, K. O., SAMUELSSON, G., STERKY, G., THALME, B. & WALL, S.
1982. The incidence of diabetes mellitus in Swedish children 0-14 years of age. A
prospective study 1977-1980. Acta Paediatr Scand, 71, 7-14.
DAHLQUIST, G. & KÄLLÉN, B. 2007. School performance in children with type 1
diabetes--a population-based register study. Diabetologia, 50, 957-64.
DAHLQUIST, G. G., PATTERSON, C. & SOLTESZ, G. 1999. Perinatal risk factors for
childhood type 1 diabetes in Europe. The EURODIAB Substudy 2 Study Group.
Diabetes Care, 22, 1698-1702.
DANEMAN, D. 2006. Type 1 diabetes. The Lancet, 367, 847-858. EIDE, E. R. & SHOWALTER, M. H. 2011. Estimating the relation between health and
education: What do we know and what do we need to know? Economics of Education
Review, 30, 778-791.
FORTSON, K., GLEASON, P., KOPA, E. & VERBITSKY-SAVITZ, N. 2015. Horseshoes,
hand grenades, and treatment effects? Reassessing whether nonexperimental
estimators are biased. Economics of Education Review, 44, 100-113.
GAUDIERI, P. A., CHEN, R., GREER, T. F. & HOLMES, C. S. 2008. Cognitive function in
children with type 1 diabetes: a meta-analysis. Diabetes Care, 31, 1892-7.

24
GLIED, S. & SMITH, P. C. 2011. The Oxford Handbook of Health Economics. 'Oxford
University Press'.
GOLDBERG, J. & SMITH, J. 2007. The effects of education on labor market outcomes.
Handbook of research in education finance and policy, New York, NY: Routledge,
688-708.
GROSSMAN, M. 1972. On the Concept of Health Capital and the Demand for Health. The
Journal of Political Economy, 80, 223-255.
GUSTAFSSON, J.-E., MYRBERG, E., ROSÉN, M. & AL., E. 2009. What affects the results
of the Swedish school? [Vad påverkar resultaten i svenska skolan?]. The Swedish
National Agency for Education [Skolverket]
HANÅS, R. 2014. Type 1 Diabetes in Children, Adolescents and Adults - How to become an
expert on your own diabetes, Uddevalla Betamed.
HANNONEN, R., KOMULAINEN, J., EKLUND, K., TOLVANEN, A., RIIKONEN, R. &
AHONEN, T. 2010. Verbal and academic skills in children with early-onset type 1
diabetes. Developmental Medicine & Child Neurology, 52, e143-e147.
IMBENS, G. W. & WOOLDRIDGE, J. M. 2009. Recent Developments in the Econometrics
of Program Evaluation. Journal of Economic Literature, American Economic
Association, 47, 5-86.
KAHN, M. E. 1998a. Health and Labor Market Performance: The Case of Diabetes. Journal
of Labor Economics, 16, 878-899.
KAHN, M. E. 1998b. Education's role in explaining diabetic health investment differentials.
Economics of Education Review, 17, 257-266.
LIND, M., SVENSSON, A. M., KOSIBOROD, M., GUDBJORNSDOTTIR, S., PIVODIC,
A., WEDEL, H., DAHLQVIST, S., CLEMENTS, M. & ROSENGREN, A. 2014.
Glycemic control and excess mortality in type 1 diabetes. N Engl J Med, 371, 1972-
82.
MAAHS, D. M., WEST, N. A., LAWRENCE, J. M. & MAYER-DAVIS, E. J. 2010.
Epidemiology of type 1 diabetes. Endocrinol Metab Clin North Am, 39, 481-97.
MILTON, B., HOLLAND, P. & WHITEHEAD, M. 2006. The social and economic
consequences of childhood-onset Type 1 diabetes mellitus across the lifecourse: a
systematic review. Diabetic Medicine, 23, 821-829.MINOR, T. 2011. The effect of
diabetes on female labor force decisions: new evidence from the National Health
Interview Survey. Health economics, 20, 1468-86.
MINOR, T. 2013. An investigation into the effect of type I and type II diabetes duration on
employment and wages. Econ Hum Biol, 11, 534-44.
NATHAN, D., CLEARY, P., BACKLUND, J., GENUTH, S., LACHIN, J., ORCHARD, T.,
RASKIN, P. & ZINMAN, B. 2005. Intensive diabetes treatment and cardiovascular
disease in patients with type 1 diabetes. N Engl J Med, 353, 2643-53.
NYGREN, M., CARSTENSEN, J., KOCH, F., LUDVIGSSON, J. & FROSTELL, A. 2015.
Experience of a serious life event increases the risk for childhood type 1 diabetes: the
ABIS population-based prospective cohort study. Diabetologia.
NYSTRÖM, L., DAHLQUIST, G., REWERS, M. & WALL, S. 1990. The Swedish
Childhood Diabetes Study. An Analysis of the Temporal Variation in Diabetes
Incidence 1978–1987. International journal of epidemiology: official journal of the
International epidemiological association, 19, 141-146.
OSTMAN, J., LONNBERG, G., ARNQVIST, H. J., BLOHME, G., BOLINDER, J., EKBOM
SCHNELL, A., ERIKSSON, J. W., GUDBJORNSDOTTIR, S., SUNDKVIST, G. &
NYSTROM, L. 2008. Gender differences and temporal variation in the incidence of
type 1 diabetes: results of 8012 cases in the nationwide Diabetes Incidence Study in
Sweden 1983-2002. J Intern Med, 263, 386-94.
25
PARENT, K. B., WODRICH, D. L. & HASAN, K. S. 2009. Type 1 diabetes mellitus and
school: a comparison of patients and healthy siblings. Pediatr Diabetes, 10, 554-62.
PATTERSON, C. C., DAHLQUIST, G. G., GYURUS, E., GREEN, A., SOLTESZ, G. &
GROUP, E. S. 2009. Incidence trends for childhood type 1 diabetes in Europe during
1989-2003 and predicted new cases 2005-20: a multicentre prospective registration
study. Lancet, 373, 2027-33.
PERSSON, E. & WAERNBAUM, I. 2013. Estimating a marginal causal odds ratio in a case-
control design: analyzing the effect of low birth weight on the risk of type 1 diabetes
mellitus. Stat Med, 32, 2500-12.
PERSSON, E., WAERNBAUM, I. & LIND, T. 2014. Estimating marginal causal effects in a
secondary analysis of case-control data. Causal Inference and Case-Control Studies
with Applications Related to Childhood Diabetes, Manuscript in doctoral dissertation,
2014.
PERSSON, S., GERDTHAM, U.-G. & STEEN CARLSSON, K. 2016. Labor market
consequences of childhood onset type 1 diabetes. Economics and Human Biology
(Accepted).
PERSSON, S., DAHLQUIST, G., GERDTHAM, U. G. & STEEN CARLSSON, K. 2013.
Impact of childhood-onset type 1 diabetes on schooling: a population-based register
study. Diabetologia, 56, 1254-62.
RASSEN, J. A., GLYNN, R. J., ROTHMAN, K. J., SETOGUCHI, S. & SCHNEEWEISS, S.
2012. Applying propensity scores estimated in a full cohort to adjust for confounding
in subgroup analyses. Pharmacoepidemiol Drug Saf, 21, 697-709.
RAWSHANI, A., SVENSSON, A. M., ROSENGREN, A., ELIASSON, B. &
GUDBJORNSDOTTIR, S. 2015. Impact of Socioeconomic Status on Cardiovascular
Disease and Mortality in 24,947 Individuals With Type 1 Diabetes. Diabetes Care, 38,
1518-27.
ROSENBAUM, P. R. & RUBIN, D. B. 1983. The central role of the propensity score in
observational studies for causal effects. Biometrika, 70, 41-55.
SARNBLAD, S., AKESSON, K., FERNSTROM, L., ILVERED, R. & FORSANDER, G. 2016. Improved diabetes management in Swedish schools: results from two national surveys. Pediatr Diabetes.
SOCIALSTYRELSEN 1996. Nationella riktlinjer för vård och behandling vid diabetes
mellitus. Socialstyrelsen, Stockholm.
STATISTICS SWEDEN 2006. Evaluation of the Swedish Register of Education.
STATISTICS SWEDEN 2007. Tema: Utbildning Ungdomar utan fullföljd
gymnasieutbildning. Population and Welfare Statistics 2007:4
STATISTICS SWEDEN 2010. Multi-Generation Register 2009 - A description of contents
and quality. Population and Welfare Statistics 2010:3.
STATISTICS SWEDEN 2011. Longitudinell integrationsdatabas för Sjukförsäkrings- och
Arbetsmarknadsstudier (LISA) 1990–2009. Arbetsmarknads- och utbildningsstatistik
2011:4.
STEEN CARLSSON, K., LANDIN-OLSSON, M., NYSTROM, L., ARNQVIST, H. J.,
BOLINDER, J., OSTMAN, J. & GUDBJORNSDOTTIR, S. 2010. Long-term
detrimental consequences of the onset of type 1 diabetes on annual earnings--evidence
from annual registry data in 1990-2005. Diabetologia, 53, 1084-92. TARAS, H. & POTTS-DATEMA, W. 2005. Chronic health conditions and student
performance at school. J Sch Health, 75, 255-66.
THE DIABETES CONTROL AND COMPLICATIONS TRIAL RESEARCH GROUP
1993a. The effect of intensive treatment of diabetes on the development and

26
progression of long-term complications in insulin-dependent diabetes mellitus. N Engl
J Med, 329, 977-86.
THE DIABETES CONTROL AND COMPLICATIONS TRIAL RESEARCH GROUP
1993b. The Effect of Intensive Treatment of Diabetes on the Development and
Progression of Long-Term Complications in Insulin-Dependent Diabetes Mellitus.
New England Journal of Medicine, 329, 977-986.
THE SWEDISH DIABETES ASSOCIATION (DIABETESFÖRBUNDET). 2016. Viktiga
händelser [Online]. http://www.diabetes.se/sv/Om-oss/Historik/Viktiga-handelser/:
The Swedish Diabetes Association (Diabetesförbundet). [Accessed 2016-03-22.]
THE SWEDISH NATIONAL AGENCY FOR EDUCATION [SKOLVERKET]. 2011.
History of grades [Betygshistorik] [Online].
http://www.skolverket.se/bedomning/betyg/betygshistorik-1.46885. [Accessed 2015-
05-27.
WENNICK, A., HALLSTROM, I., LINDGREN, B. & BOLIN, K. 2011. Attained education
and self-assessed health later in life when diagnosed with diabetes in childhood: a
population-based study. Pediatr Diabetes, 12, 619-26.
WODRICH, D. L., HASAN, K. & PARENT, K. B. 2011. Type 1 diabetes mellitus and
school: a review. Pediatr Diabetes, 12, 63-70.ÅKERBLOM, H. K., VAARALA, O.,
HYÖTY, H., ILONEN, J. & KNIP, M. 2002. Environmental factors in the etiology of
type 1 diabetes. American Journal of Medical Genetics, 115, 18-29.

27
Table 1 Inclusion and exclusion criteria
Total sample, n
(%) T1DM,
n (%)
Compulsory school, number of children:
Born in 1982–1993 31,345 (100) 6,269 (100)
Death before age 17 47 (0.2) 17 (0.3)
With missing educational information 1,600 (5.1) 357 (5.7)
Total sample size (N) 29,698 (94.8) 5,895 (94.0)
Upper secondary school, number of children:
Born in 1979–1990 26,795 (100) 5,359 (100)
Death before age 20 73 (0.3) 24 (0.5)
With missing educational information 6,620 (24.7) 1,464 (27.3)
Received a final grade from upper secondary school after age 20 379 (1.4) 77 (1.4)
Total sample size (N) 19,723 (73.6) 3,794 (70.8)
T1DM = type 1 diabetes mellitus.

28
Table 2 Background characteristics of the type 1 diabetes mellitus (T1DM) group and the control group
Variables Compulsory school Upper secondary school
T1DM Controls T1DM Controls
Proportion receiving final grade 94.9% 95.5% 72.6% 75.9%
Proportion completing a theoretical program if
finishing upper secondary school 52.4% 56.1%
Key outcome
Final grade, mean (SD) a 200.6
(63.2) 207.3
(60.5) 13.5
(3.5) 13.7
(3.4)
Demographic and socioeconomic variables
Proportion of girls 47.1% 48.6% 48.6% 50.4%
Proportion of Swedish-born children 98.1% 94.8% 98.4% 95.0%
Municipality at diagnosis (number of groups) 335 335 335 335
Birth weight in grams, mean (SD)b 3,546
(543) 3,517
(563) 3,551
(536) 3,514
(551)
Percentage of children with low birth weight
(<2,500 gram)b 3.0% 3.4% 2.7% 3.6%
Proportion of children with at least one parent
born in a Nordic country 96.8% 90.6% 97.6% 92.5%
Percentage of children with the following
maternal educational level:
- Compulsory school 13.1% 14.3% 10.3% 11.7%
- Upper secondary school 52.8% 50.3% 47.9% 45.3%
- Higher education 28.8% 28.4% 29.2% 29.0%
- Missing information 5.3% 7.0% 12.6% 13.9%
Age of mother at delivery, yrs, mean (SD)c 28.8 (5.0) 28.5 (5.1) 29.0 (5.1) 28.5 (5.0) a On a scale of 0–320 and 0–20 points in compulsory school and upper secondary school, respectively. b Missing data for 5.9% in compulsory school and 5.8% in upper secondary school. c Missing data for 1.0% in compulsory school and 1.1% in upper secondary school.
Note: Year of birth and municipality of residence are not presented in this table as they were prematched in the
case control design of the data and are therefore similar between the two groups.
SD = standard deviation.

29
Table 3. Estimated type 1 diabetes mellitus (T1DM) effect in the linear regression models of final grades from
compulsory and upper secondary school
T1DM effect β ± SE (robust) 95% CI p
Compulsory school
Model 1 a (n = 29,698, R-squared = 0.034) -6.663 (0.901) -8.385, -4.941 <0.001
Model 2 b (n = 26,553, R-squared = 0.175) -7.361 (0.873) -9.072, -5.649 <0.001
Model 2 b (n = 13,719, R-squared = 0.161) males -7.577 (1.183) -9.900, -5.259 <0.001
Model 2 b (n = 12,834, R-squared = 0.160) females -7.244 (1.307) -9.806, -4.682 <0.001
Model 3 b (n = 26,553, R-squared = 0.175)
- Onset of T1DM at age 0–4 years -8.431 (2.109) -12.564, -4.297 <0.001
- Onset of T1DM at age 5–9 years -4.458 (1.417) -7.239, -1.680 0.002
- Onset of T1DM at age 10–15 years -8.979 (1.156) -11.245, -6.712 <0.001
Model 4 b (n = 26,553, R-squared = 0.175)
- T1DM and mother with compulsory education -11.942 (2.670) -17.174, -6.709 <0.001
- T1DM and mother with upper secondary education 6.171 (2.916) 0.456, 11.886 0.034
- T1DM and mother with higher education 3.719 (3.040) -2.239, 9.677 0.221
Upper secondary school
Model 1 a (n = 19,723, R-squared = 0.039) -0.238 (0.062) -0.360, -0.116 <0.001
Model 2 b (n = 16,292, R-squared = 0.148) -0.282 (0.065) -0.409, -0.154 <0.001
Model 2 b (n = 9,064, R-squared = 0.132) theoretical -0.266 (0.084) -0.431, -0.102 0.002
Model 2 b (n = 7,183, R-squared = 0.135) vocational -0.196 (0.093) -0.381, -0.016 0.033
Model 2 b (n = 8,150, R-squared = 0.128) males -0.233 (0.094) -0.418, -0.048 0.014
Model 2 b (n = 8,142, R-squared = 0.136) females -0.309 (0.092) -0.489, -0.130 0.001
Model 3 b (n = 16,292, R-squared = 0.148)
- Onset of T1DM at age 0–4 years -0.311 (0.175) -0.654, 0.032 0.075
- Onset of T1DM at age 5–9 years -0.047 (0.102) -0.247, 0.153 0.643
- Onset of T1DM at age 10–15 years -0.418 (0.085) -0.586, -0.251 <0.001
Model 4 b (n = 16,292, R-squared = 0.148)
- T1DM and mother with compulsory education -0.266 (0.200) -0.658, -0.127 0.185
- T1DM and mother with upper secondary education 0.027 (0.219) -0.403, 0.456 0.903
- T1DM and mother with higher education -0.091 (0.228) -0.538, 0.355 0.688 a Controlling for year of birth and municipality (the initial matching variables). b Controlling for year of birth, and
municipality (the initial matching variables), as well as sex (if analysis not separated by sex), birth weight (low),
age of mother at delivery, mother’s educational level, and parent(s) born in a Nordic country.
SE = standard error (robust). CI = confidence interval.
30
Table 4. Average causal effects of the onset of type 1 diabetes mellitus (T1DM) on final grades from compulsory
and upper secondary school
Compulsory school Effect 95% CI
ATT -7.140*** (-9.575, -4.705)
ATT for:
- Males
- Females
-9.985***
-6.608***
(-13.209, -6.761)
(-10.163, -3.053)
ATT for different age at onset groups:
- Onset of T1DM at age 0–4 years
- Onset of T1DM at age 5–9 years
- Onset of T1DM at age 10–15 years
-10.294***
-5.331**
-8.254***
(-15.847, -4.741)
(-9.312, -1.350)
(-11.617, -4.890)
Upper secondary school
ATT -0.280** (-0.451, -0.110)
ATT
- Theoretical program
- Vocational program
-0.354**
-0.109
(-0.567, -0.140)
(-0.337, 0.119)
ATT for:
- Males
- Females
-0.235•
-0.291*
(-0.475, 0.006)
(-0.522, -0.060)
ATT for different age at onset groups:
- Onset of T1DM at age 0–4 years
- Onset of T1DM at age 5–9 years
- Onset of T1DM at age 10–15 years
-0.565**
-0.039
-0.422**
(-0.956, -0.173)
(-0.299, 0.220)
(-0.650, -0.195)
• p<0.1; * p<0.05; ** p<0.01; *** p<0.001.
31
Table 5. Effect size comparisons with results from Persson et al. (2013)
Individuals born in 1979–1993
(present study) Individuals born in 1972–1978 (Persson
et al., 2013)
d (95% CI) d (95% CI)
Compulsory education
- Total -0.109
(-0.137, -0.080) -0.124
(-0.169, -0.079)
Upper secondary school
- Total -0.070
(-0.105, -0.034) -0.113
(-0.167, -0.060)
- Theoretical -0.058
(-0.107, -0.010) -0.091
(-0.172, -0.010)
- Vocational -0.045
(-0.097, 0.007) -0.079
(-0.151, -0.007)
CI = confidence interval.
32
Appendix Table A1. Estimated type 1 diabetes mellitus (T1DM) effect in the linear regression models of final grades from compulsory and upper secondary school
Compulsory school Upper secondary school Model 1
β (SE) Model 2
β (SE) Model 3
β (SE) Model 4
β (SE) Model 1
β (SE) Model 2
β (SE) Model 3
β (SE) Model 4
β (SE) T1DM -6.663***
(0.901) -7.361***
(0.873) -11.942***
(2.670) -0.238***
(0.062) -0.282***
(0.065) -0.266 (0.200)
Onset age of T1DM (Control – reference group) - 0–4 years -8.431***
(2.109) -0.311•
(0.175)
- 5–9 years -4.458**
(1.417) -0.047
(0.102)
- 10–15 years -8.979***
(1.156) -0.418***
(0.085)
Year of birtha 0.805***
(0.108) 0.259*
(0.108) 0.254*
(0.108) 0.258*
(0.108) 0.053***
(0.007) 0.041***
(0.007) 0.040***
(0.007) 0.041***
(0.007) Low birth weight -8.125***
(1.943) -8.122***
(1.944) -8.182***
(1.944) -0.264**
(0.150) -0.261•
(0.150) -0.264•
(0.150) Females 22.199***
(0.687) 22.150***
(0.687) 22.204***
(0.687) 1.389***
(0.051) 1.386***
(0.051) 1.388***
(0.051) Parent(s) born in a Nordic country -1.484
(2.023) -1.484
(2.024) -1.299
(2.025) 0.630***
(0.193) 0.627**
(0.193) 0.628**
(0.193) Age of mother at deliveryb 1.034***
(0.074) 1.036***
(0.074) 1.034***
(0.074) 0.065***
(0.006) 0.065***
(0.006) 0.065**
(0.006) Mother’s education (reference value = low)
- Medium 24.581***
(1.142) 24.570***
(1.142) 23.347***
(1.257) 0.723***
(0.082) 0.717***
(0.082) 0.717***
(0.090) - High 55.342***
(1.205) 55.365***
(1.205) 54.612***
(1.322) 2.162***
(0.087) 2.159***
(0.087) 2.180***
(0.096) - Medium and T1DM 6.171* (2.916) 0.027 (0.219) - High and T1DM 3.719
(3.040) -0.0.91
(0.228) Municipality (dummies) Yes Yes Yes Yes Yes Yes Yes Yes Constant 202.618***
(5.363) 171.690***
(5.450) 171.791***
(5.458) 172.531***
(5.457) 13.682***
(0.324) 11.501***
(0.381) 11.520***
(0.382) 11.500***
(0.382) R-squared 0.034 0.175 0.175 0.175 0.039 0.148 0.148 0.148 n 29,698 26,553 26,553 26,553 19,723 16,292 16,292 16,292 aCalendar years numbered from 0 to 12. bDifference from the mean age of mother at delivery. •p<0.1; *p<0.05; **p<0.01; ***p<0.001. SE = standard error (robust).

33
Appendix Table A2. The logistic propensity score models and standardized mean differences before and after
matching for estimation of average treatment effect of the treated (ATT)
T1DM Compulsory school
(N=27,951) Upper secondary school
(N=18,587)
Balance (standardized mean
differences)
Balance
(standardized mean
differences)
β (SE) Before After β (SE) Before After
Column 1 2 3 4 5 6
Year of birth 0.040***
(0.005) -0.766 0 0.028***
(0.006) 0.703 0
Birth weight 0.00007**
(0.00003) 5.384 0.167 0.0001**
(0.00003) 6.882 0.174
Sex (girl) -0.053•
(0.031) -3.315 0.614 -3.771 -2.360
Parent(s) born in a
Nordic country 1.070***
(0.107) 23.202 -0.396 1.148***
(0.169) 20.76 0
Age of mother at
delivery 0.008**
(0.003) 5.054 0.580 0.017***
(0.004) 9.202 -1.198
Municipality Yes Yes
Constant -86.03***
(9.333) -62.84***
(11.23)
•p<0.1; *p<0.05; **p<0.01; ***p<0.001. SE = standard error.