Embed Size (px)
Citation preview
#analyticsx
Snigdha Gutha, Anusha Mamillapalli
MS in Business Analytics, Oklahoma State University
ABSTRACT
Uber has changed the face of taxi ridership, making it more convenient and comfortable for riders. But, there aretimes when customers are left unsatisfied because of shortage of vehicles which ultimately led to Uber adopting surgepricing. It’s a very difficult task to forecast number of riders at different locations in a city at different points in time.This gets more complicated with changes in weather. In this paper we attempt to estimate the number of trips perborough on a daily basis in New York City. We add an exogenous factor, weather to this analysis to see how it impactsthe changes in number of trips. We fetched six month worth data (approximately 1 million records) of Uber rides inNew York City ranging from January 2015 to June 2015 from github. We also gathered weather data (from WeatherUnderground) of New York City Borough wise for the same period of six months from Jan 2015 to June 2015. In thisposter, we attempted to analyze Uber data and weather data together to estimate the change in the number of tripsper borough due to changing weather conditions. We used SAS® Forecast Studio and built a model to predict thenumber of trips per day for the one week ahead forecast for each borough of the New York City.
DATA PREPARATION AND ANALYSIS
Data Preparation and Analysis
We merged three datasets namely Uber_PickUp_data, Taxi_LookUp_Zone and Weather data to obtain the final datasetas shown in Fig. 1. In the first step, we combined Uber_PickUp_Data and Taxi_Lookup_Zone datasets to bring uberrides to borough level (Merged1 in Fig. 1). We considered Uber rides information for five boroughs of New York City:Manhattan, Brooklyn, Bronx, Queens and Staten Island for our analysis. Final dataset Uber_Final is obtained by mergingMerged1 dataset with Weather dataset. Information about the various weather metrics taken for analysis are listed inthe Table 1.
Fig. 1 (Data Preparation) Table 1
EXPLORATORY ANALYSIS
Effect of Weather on Uber Ridership
Uber Location Merged1
Merged1 Weather Uber_Final
Dataset Variables
Uber_PickUp_data Dispatching_Base_Num,
Date_of_Pickup,Time,
Affiliated_Base_Num, LocationID
Taxi_Lookup_Zone Location_ID, Borough, Zone
Weather Date ,Temperature, Humidity, Sea_level_pressure, Precipitation (Max, Mean and Min ),Cloud_Cover, Wind, Event
Fog seems to impact the number of rides in Bronx more than any other borough. Fog-Rain and Rain-Thunderstorms are influencing the number of rides in Queens the most. Rain and Snow is increasing the number of rides in Manhattan more than any other event. Considering all five boroughs, Wednesdays are the busiest day representing mid week followed by Sunday (weekend). Saturdays have the least turnout.
The Initial exploratory analysis revealed following insights:Manhattan has the largest user base being the most populous county and financial capital of world followed by Brooklyn and Queens. On an average a rainy day has reported more number of rides followed by snow than a normal day.
Fig. 2: Number of Rides by Borough Fig. 3: Average Number of Rides by Event
Fig. 4: Average Number of Rides by Borough and Event Fig. 5: Mean Number of Rides by Day of Week
#analyticsx
MS in Business Analytics, Oklahoma State University
EXPLORATORY ANALYSIS(CONTD….)
DATA CLEANING AND TRANSFORMATION
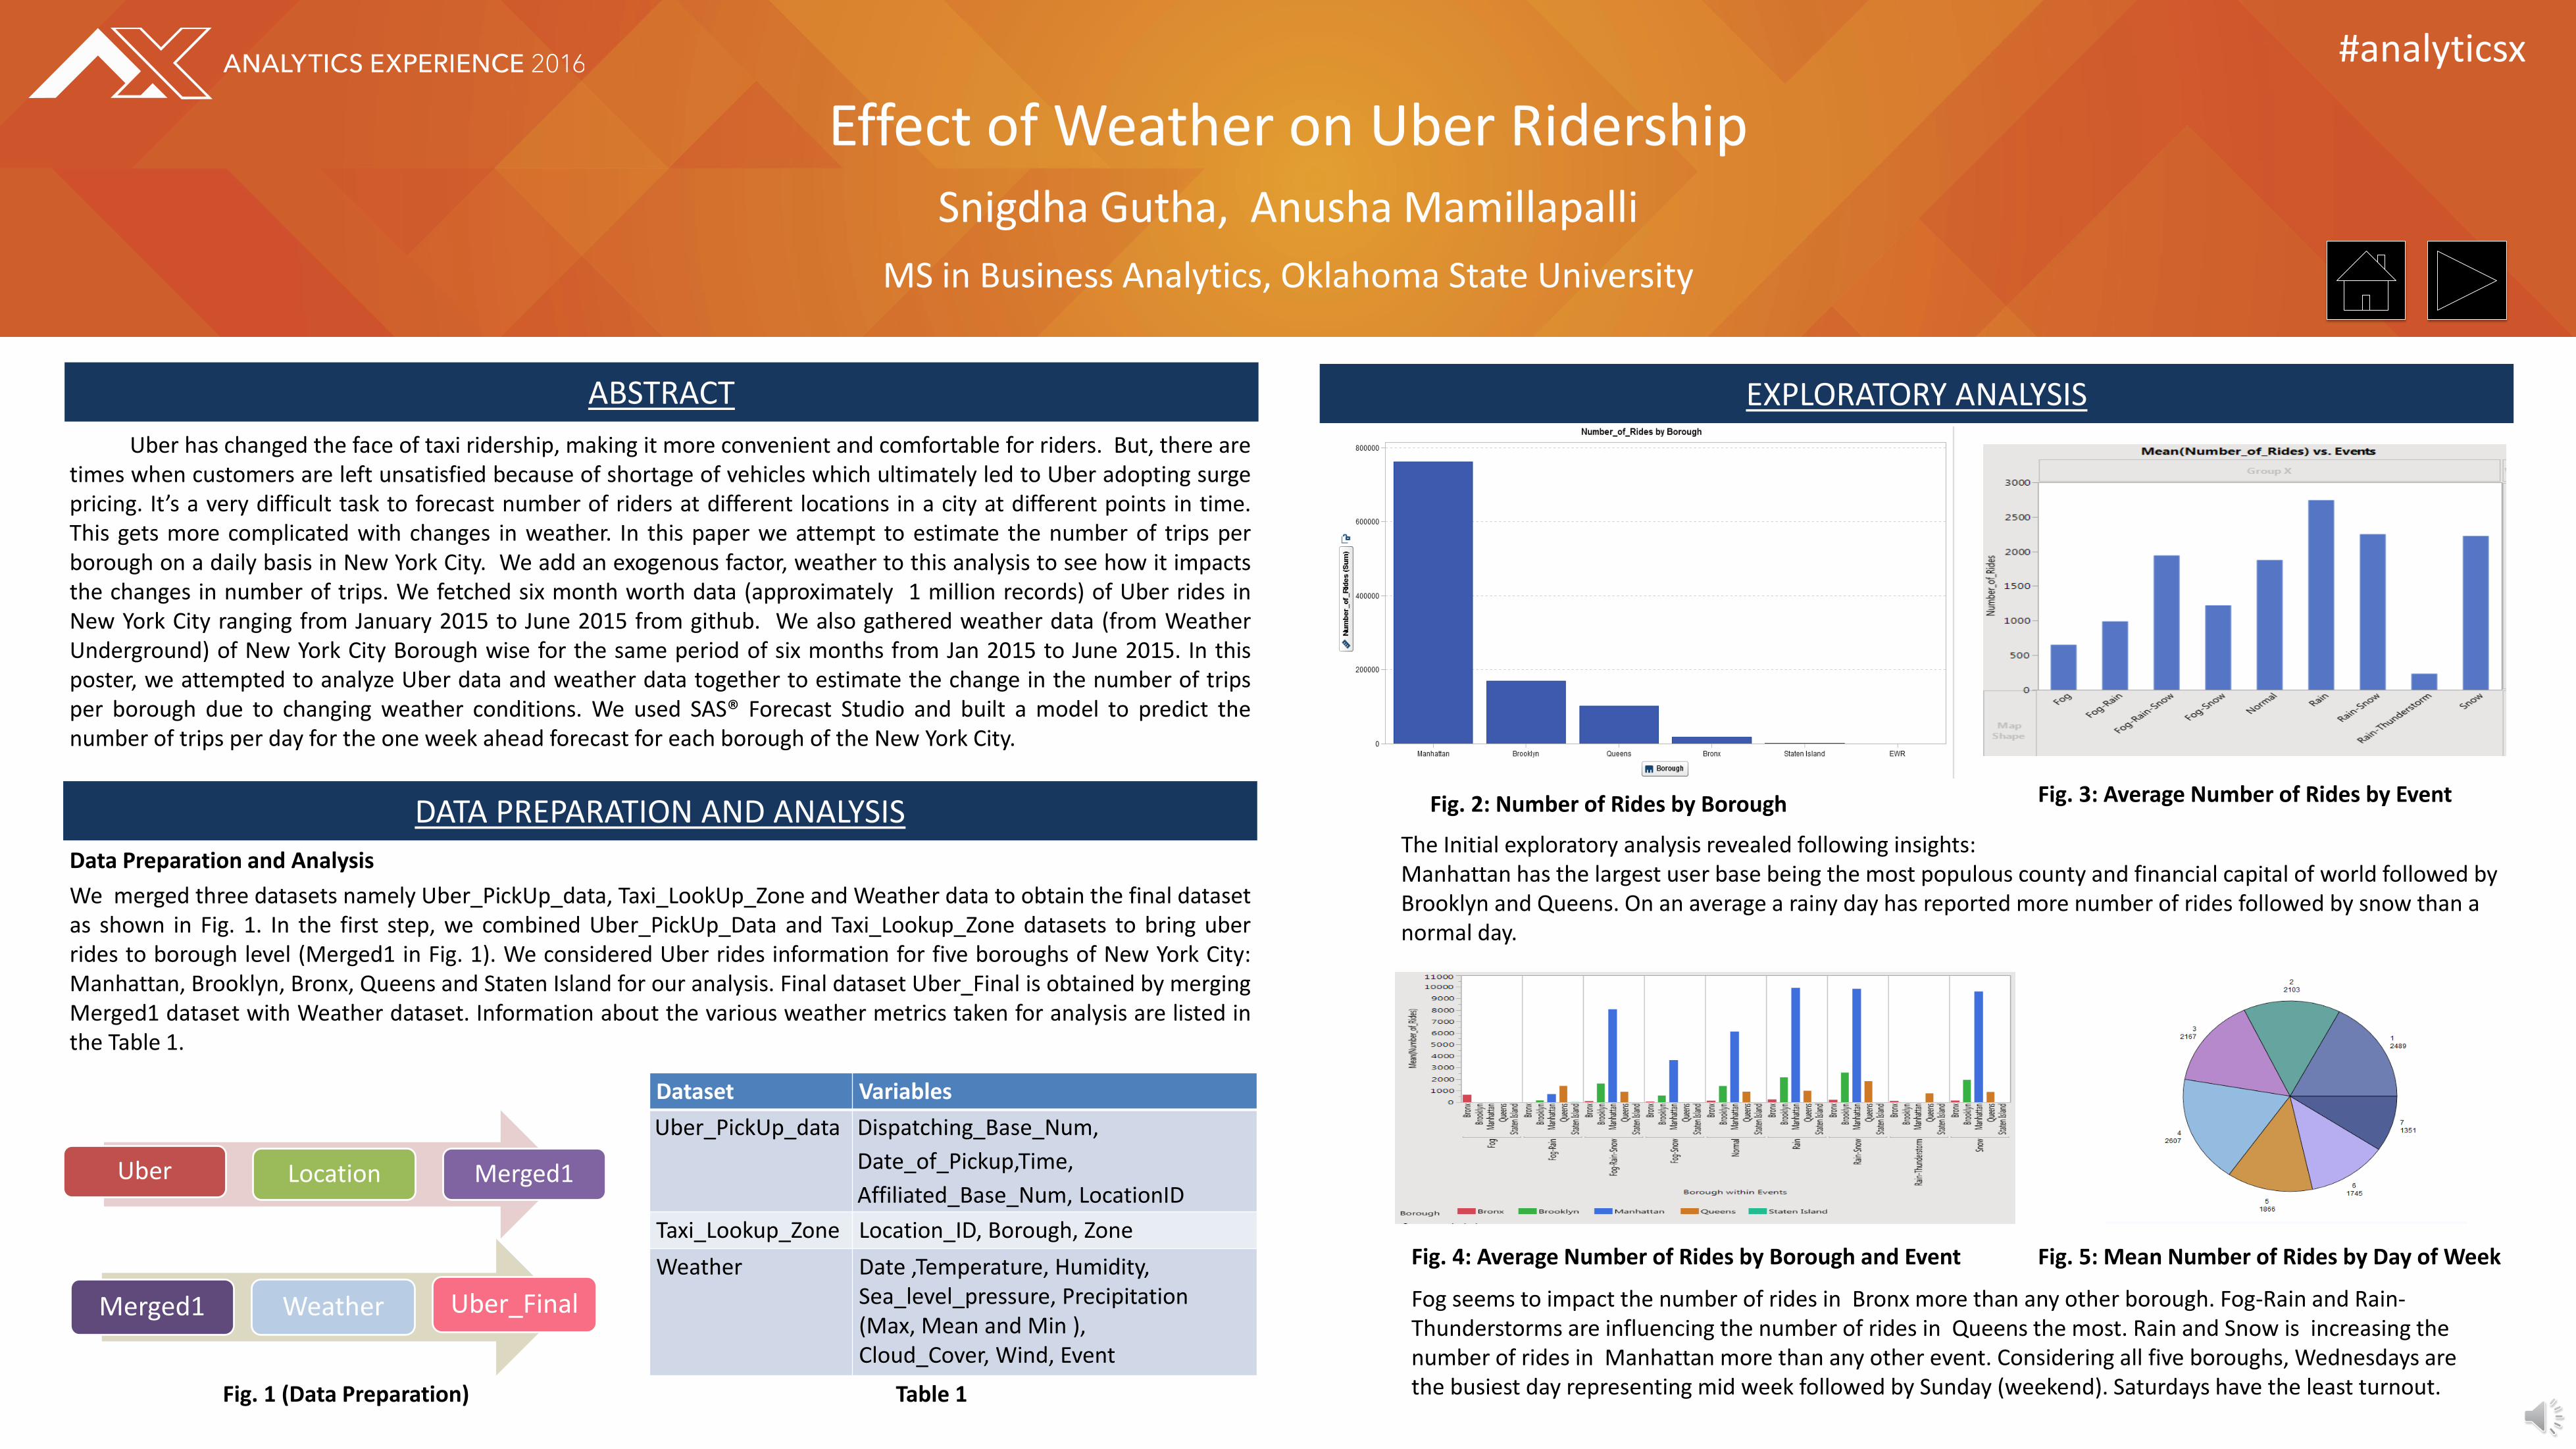
Uber_Pickup_Data has ridership information missing for certain days. We used average of immediate previousinterval non missing value and immediate next interval non missing values to fill in the missing values. We used SASEnterprise Guide’s create time series data node to produce the final time series data on a daily level.
We used SAS Enterprise Miner’s Transform Variables node to transform number of rides and weather metrics to bring the data to normality.
TIME SERIES FORECASTING
• We used SAS Forecast Studio for Desktop 14.1 version to perform time series forecasting.
• We considered one month of rides (June) as the holdout sample and borough as a by group variable to generate forecasts at borough level.
• Set the cutoff to 2% for the detection of outliers.
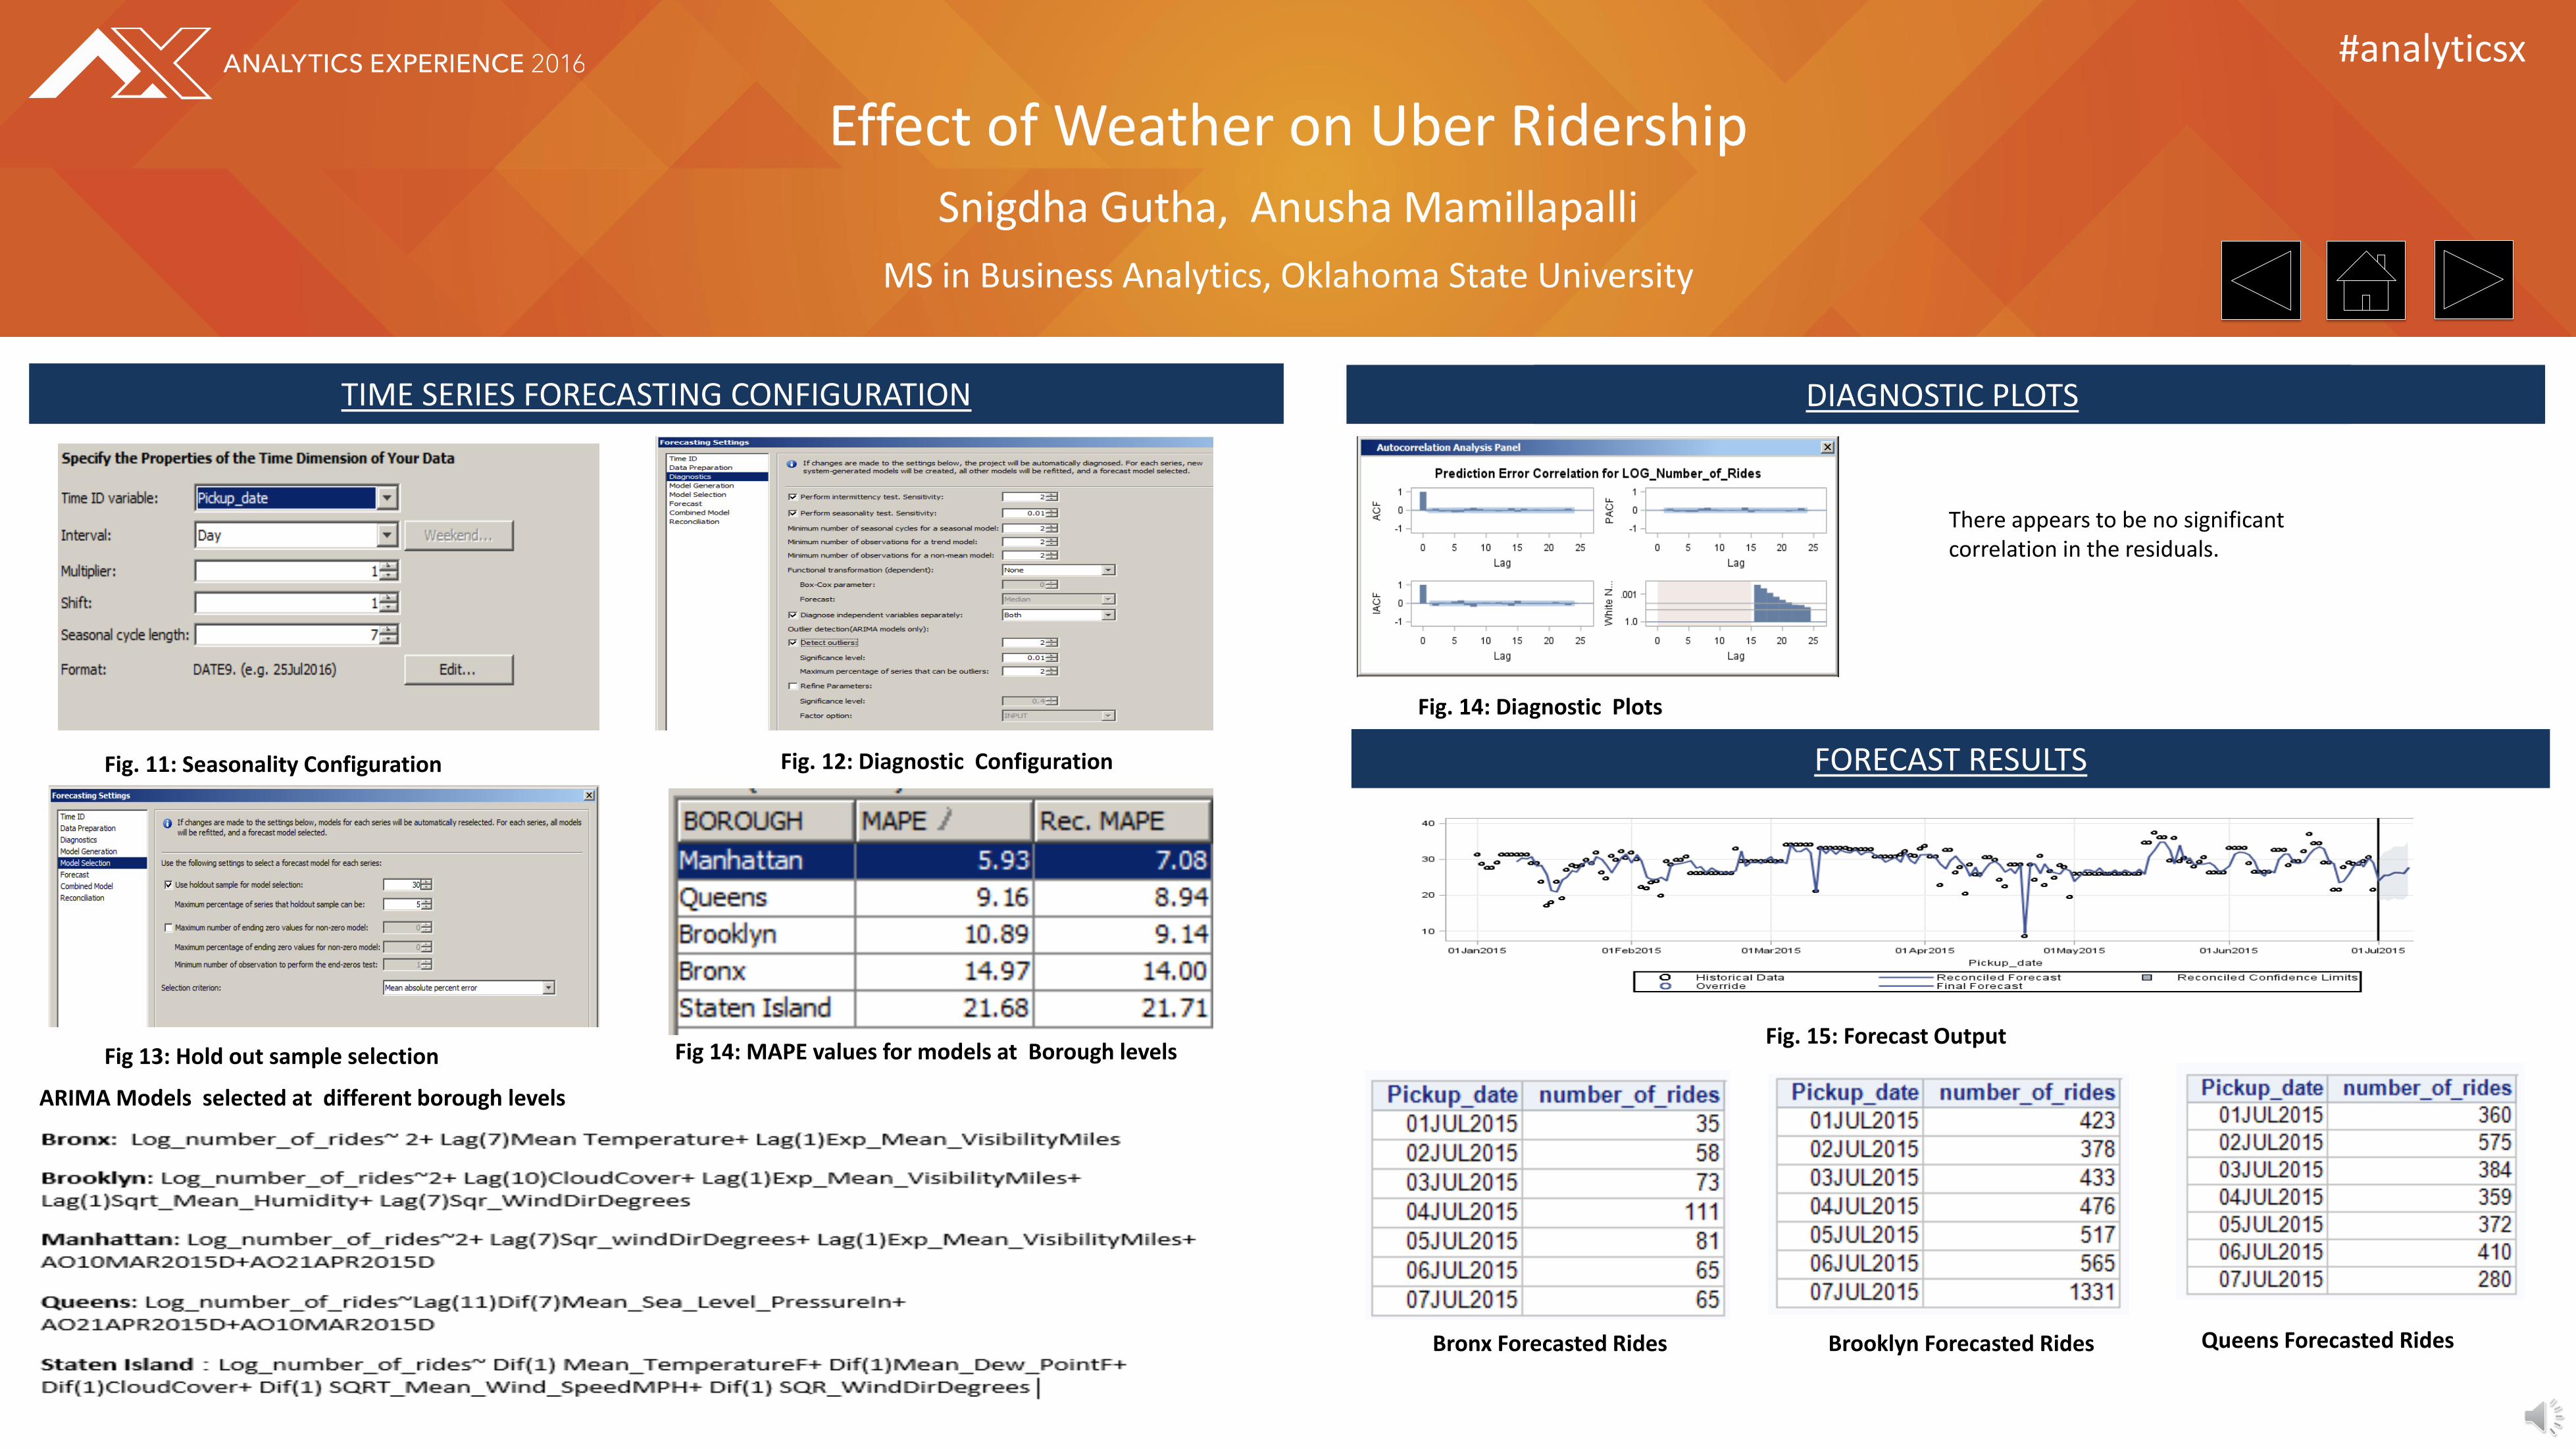
• ARIMA Model(Top_1) has been chosen as the best model based on holdout MAPE. Mean Temperature with a lag(1), Mean Visibility Miles, Wind direction, cloud cover and sea pressure turned out to be significant in predicting the number of rides.
EXPLORATORY ANALYSIS(CONTD….)
Effect of Weather on Uber Ridership Snigdha Gutha, Anusha Mamillapalli
Fig. 6: Mean Number of Rides by Borough by Day of Week Fig. 7: Number of Rides by Month
Wednesdays are the busiest day for Manhattan followed by Sunday. Whereas Sundays turn out tobe the busiest day in the other boroughs. The month of May shows the peak number of rideswhen compared with the other months. April has the least number of rides.
Fig. 8: Mean Change in Number of Rides by Borough by Event
Fi.g 9: Mean Change in Number of Rides by Borough by Weather Transition
Mean change in number of rides is highest on a Rainy day with Snow in every borough except Bronx. In Bronx thechange in number of rides is highest on a foggy day. On an average change in number of rides is most prevalent whenthere is a transition of weather from normal to rain-snow or fog-snow.
Fig. 10: Mean Change in Number of Rides by Day Transition
Mean change in number of rides ishighest when compared betweenSaturday vs. Sunday and Tuesday vs.Wednesday. There is not muchchange between Wednesday andThursday
#analyticsx
TIME SERIES FORECASTING CONFIGURATION Diagnostic Plots
Effect of Weather on Uber Ridership Snigdha Gutha, Anusha Mamillapalli
MS in Business Analytics, Oklahoma State University
Fig. 12: Diagnostic Configuration Fig. 11: Seasonality Configuration
Fig 13: Hold out sample selection
FORECAST RESULTS
Fig 14: MAPE values for models at Borough levels
ARIMA Models selected at different borough levels
DIAGNOSTIC PLOTS
There appears to be no significant correlation in the residuals.
Fig. 14: Diagnostic Plots
Fig. 15: Forecast Output
Bronx Forecasted Rides Brooklyn Forecasted Rides Queens Forecasted Rides
#analyticsx
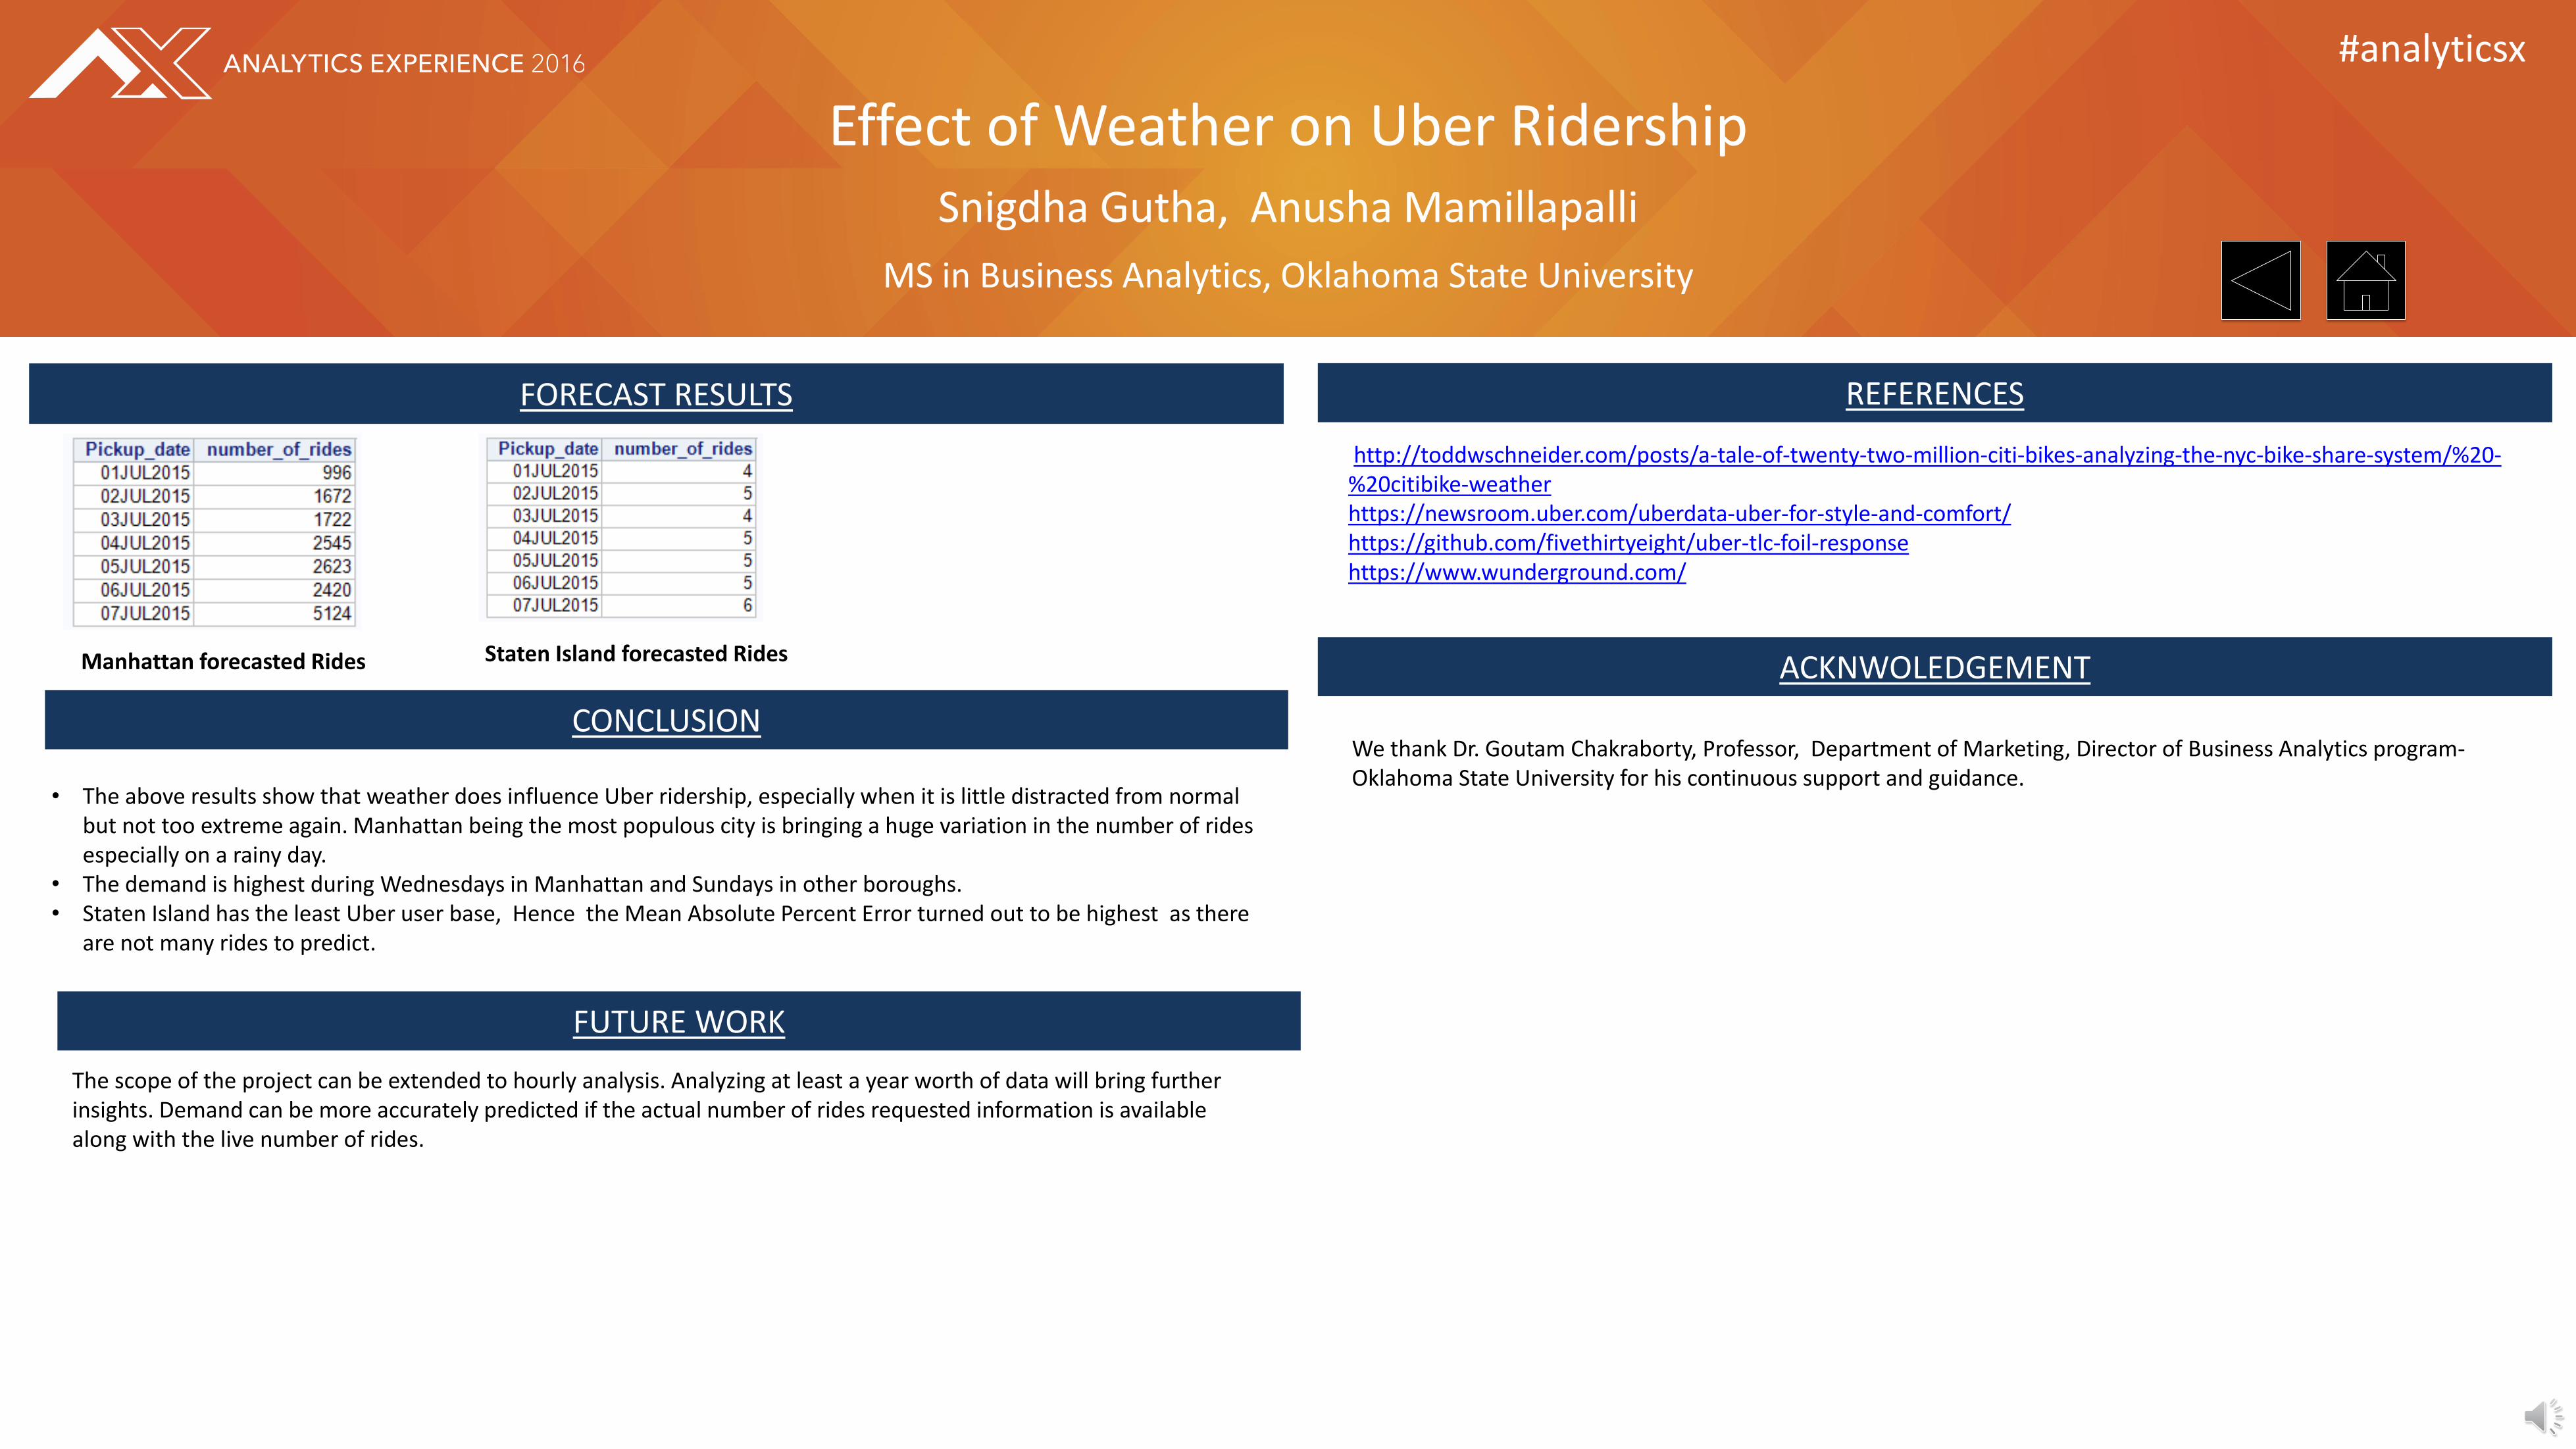
FORECAST RESULTS REFERENCES
Effect of Weather on Uber Ridership Snigdha Gutha, Anusha Mamillapalli
MS in Business Analytics, Oklahoma State University
CONCLUSION
FUTURE WORK
The scope of the project can be extended to hourly analysis. Analyzing at least a year worth of data will bring further insights. Demand can be more accurately predicted if the actual number of rides requested information is available along with the live number of rides.
http://toddwschneider.com/posts/a-tale-of-twenty-two-million-citi-bikes-analyzing-the-nyc-bike-share-system/%20-%20citibike-weatherhttps://newsroom.uber.com/uberdata-uber-for-style-and-comfort/https://github.com/fivethirtyeight/uber-tlc-foil-responsehttps://www.wunderground.com/
ACKNWOLEDGEMENT
We thank Dr. Goutam Chakraborty, Professor, Department of Marketing, Director of Business Analytics program-Oklahoma State University for his continuous support and guidance.
Manhattan forecasted Rides Staten Island forecasted Rides
• The above results show that weather does influence Uber ridership, especially when it is little distracted from normal but not too extreme again. Manhattan being the most populous city is bringing a huge variation in the number of rides especially on a rainy day.
• The demand is highest during Wednesdays in Manhattan and Sundays in other boroughs. • Staten Island has the least Uber user base, Hence the Mean Absolute Percent Error turned out to be highest as there
are not many rides to predict.