Embed Size (px)
Citation preview
Effective adhesive systems
and optimal bonding
parameters for hybrid CLT
Blake Larkin
Oregon State University
Materials Science and Wood Science & Engineering
Co-authors: Lech Muszynski, Arijit Sinha, Andre Barbosa, Rakesh Gupta, and Vahid Mahdavifar

Presentation Overview
• Brief intro to cross laminated timber (CLT)
• Hypothesis
• Approach
• Screening study goals
• Preliminary results
• Further Research

Cross Laminated Timber (CLT)
What is
CLT ?
http://www.prosalesmagazine.com/products/lumber/x-marks-the-opportunity_o
Layers: Typically 3, 5, or 7
Area: Up to ~ 10 X 60 ft2
http://www.internationaltradenews.com/klh_massivholz_gmbh/portrait/ http://www.structurearchives.org/article.aspx?articleID=1474
"KLH: Sustainability." KLH UK. Web. 30 Oct. 2014. <http://www.klhuk.com/sustainability.aspx>.
Our Hypothesis is that…
…CLT panels with hybrid layups (layers arranged from
high- and low-grade lamellas or composed of mixed
species) can meet the critical performance parameters
specified in the ANSI PRG 320 2012
and
that adhesive systems alternative to polyurethane (PUR)
can be successfully utilized in hybrid CLT products.
Approach
• Screen for species/grade/adhesive
combinations that pass bond integrity
criteria (varying pressing parameters)
Test viable combinations for:
• engineering performance criteria
• connector performance
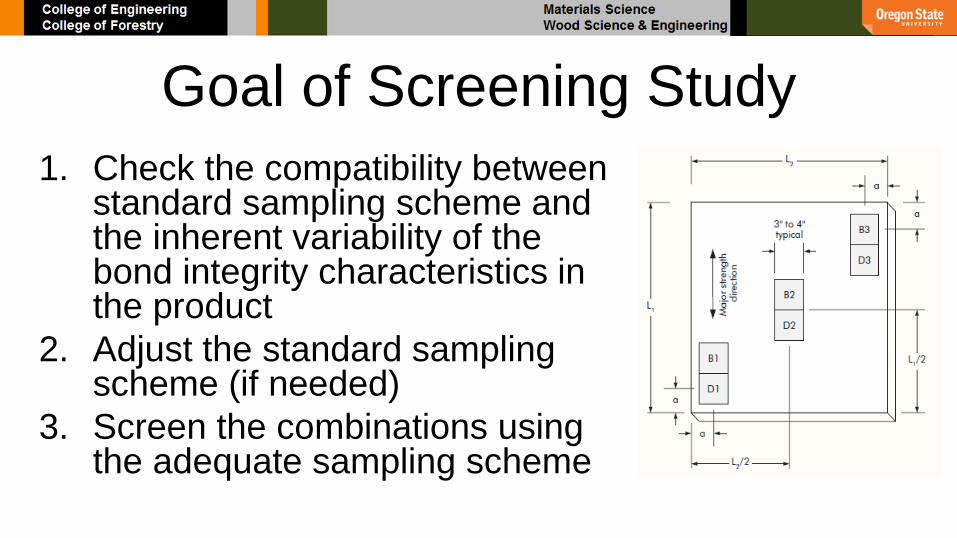
Goal of Screening Study
1. Check the compatibility between standard sampling scheme and the inherent variability of the bond integrity characteristics in the product
2. Adjust the standard sampling scheme (if needed)
3. Screen the combinations using the adequate sampling scheme
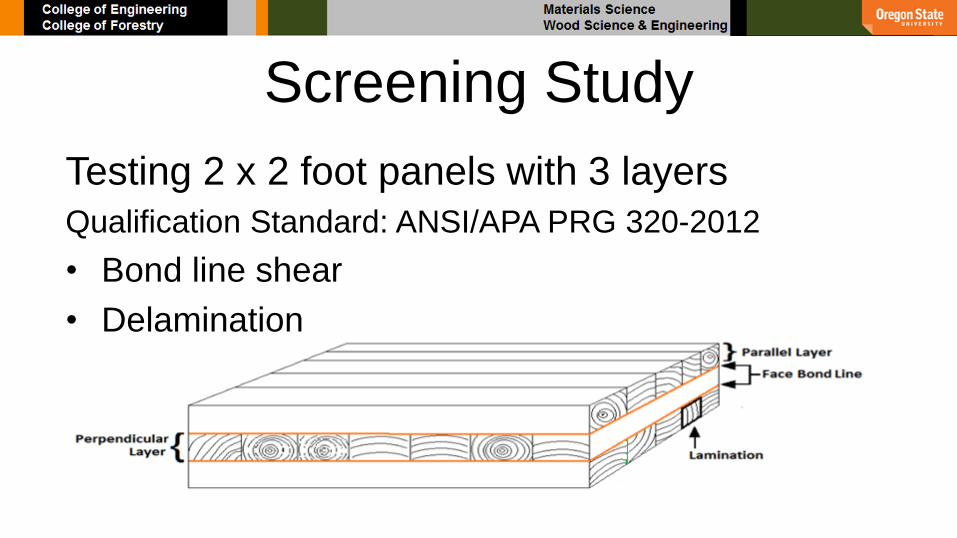
Screening Study
Testing 2 x 2 foot panels with 3 layers
Qualification Standard: ANSI/APA PRG 320-2012
• Bond line shear
• Delamination
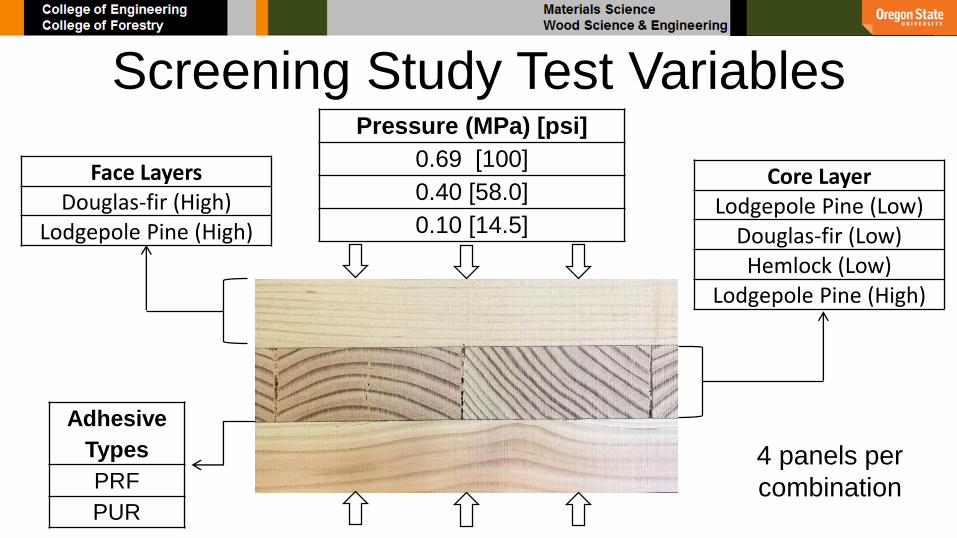
Screening Study Test VariablesPressure (MPa) [psi]
0.69 [100]
0.40 [58.0]
0.10 [14.5]
Core LayerLodgepole Pine (Low)
Douglas-fir (Low)Hemlock (Low)
Lodgepole Pine (High)
Adhesive
Types
PRF
PUR
Face LayersDouglas-fir (High)
Lodgepole Pine (High)
4 panels per
combination
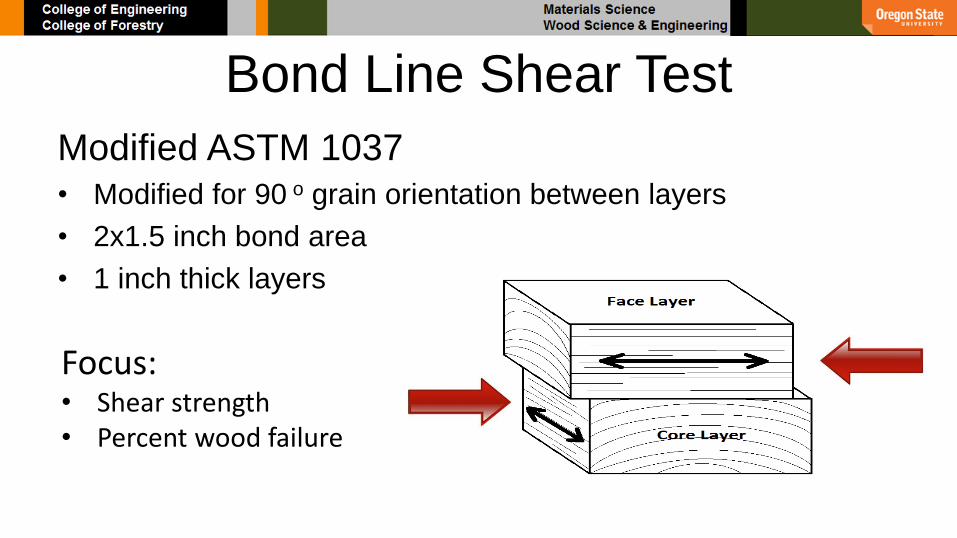
Bond Line Shear Test
Modified ASTM 1037
• Modified for 90 o grain orientation between layers
• 2x1.5 inch bond area
• 1 inch thick layers
Focus:• Shear strength• Percent wood failure
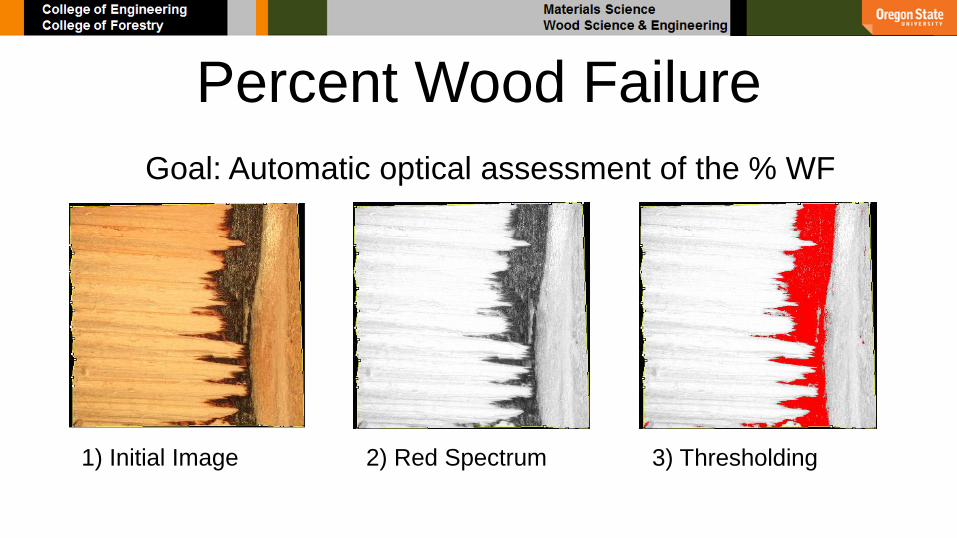
Percent Wood Failure
1) Initial Image 2) Red Spectrum
Goal: Automatic optical assessment of the % WF
3) Thresholding
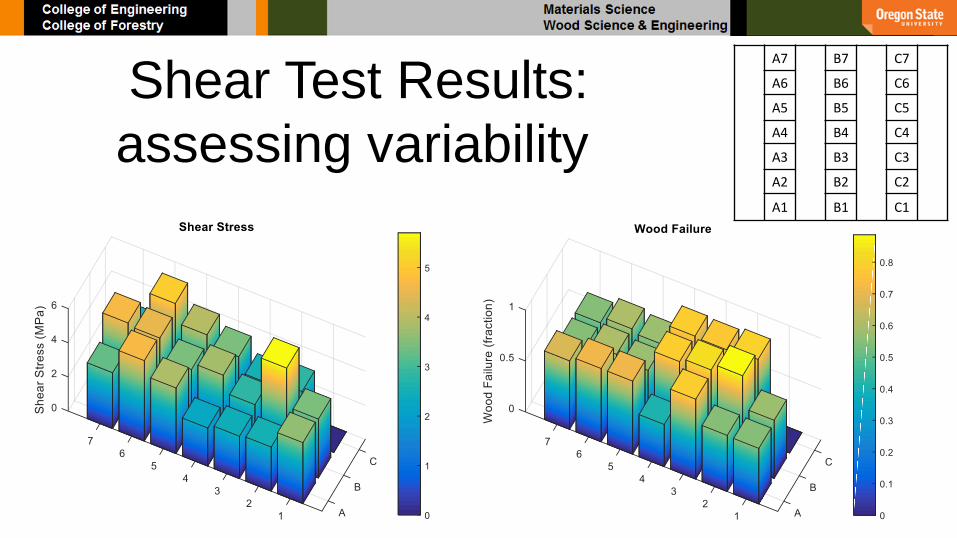
Shear Test Results:
assessing variability
A7 B7 C7
A6 B6 C6
A5 B5 C5
A4 B4 C4
A3 B3 C3
A2 B2 C2
A1 B1 C1
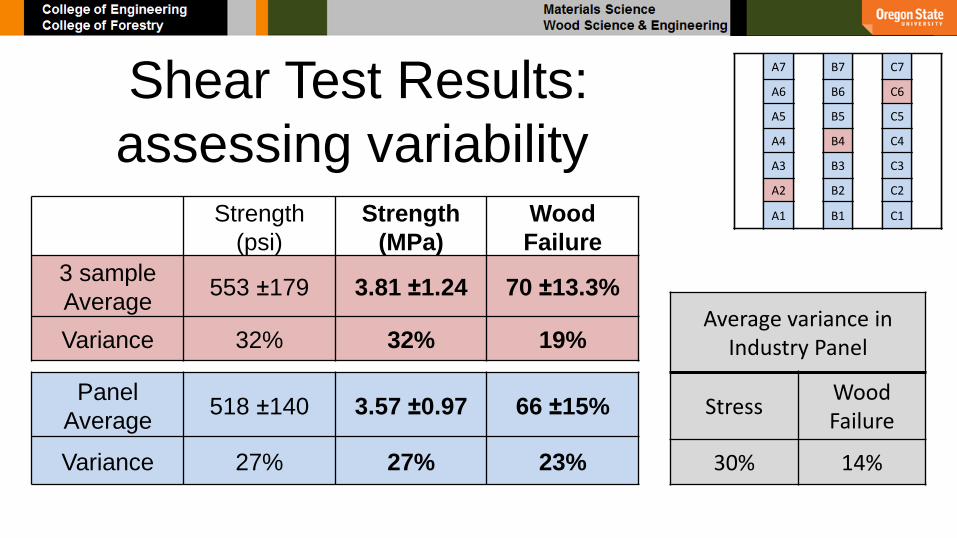
Shear Test Results:
assessing variability
A7 B7 C7
A6 B6 C6
A5 B5 C5
A4 B4 C4
A3 B3 C3
A2 B2 C2
A1 B1 C1
A7 B7 C7
A6 B6 C6
A5 B5 C5
A4 B4 C4
A3 B3 C3
A2 B2 C2
A1 B1 C1Strength
(psi)
Strength
(MPa)
Wood
Failure
3 sample
Average553 ±179 3.81 ±1.24 70 ±13.3%
Variance 32% 32% 19%
Panel
Average518 ±140 3.57 ±0.97 66 ±15%
Variance 27% 27% 23%
Average variance in Industry Panel
StressWood Failure
30% 14%
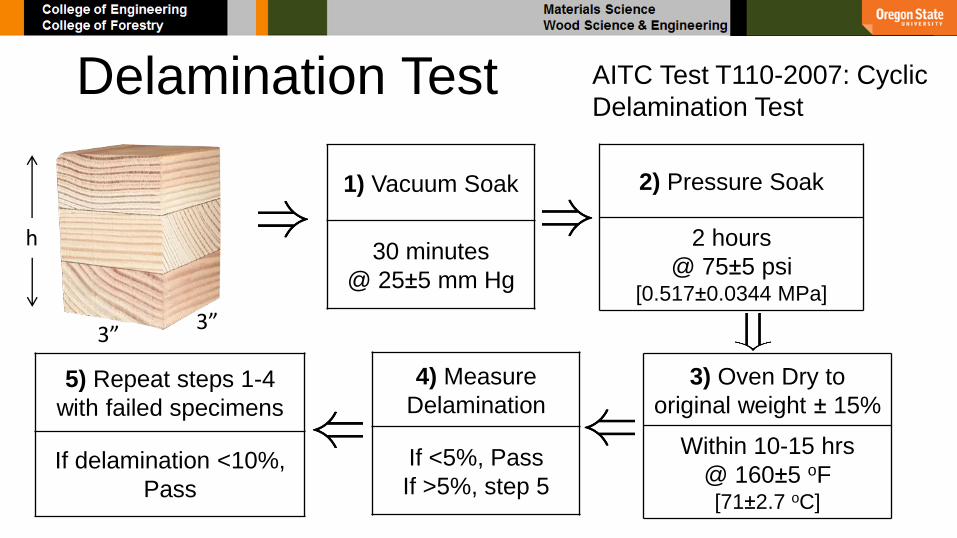
Delamination Test AITC Test T110-2007: Cyclic
Delamination Test
1) Vacuum Soak
30 minutes
@ 25±5 mm Hg
2) Pressure Soak
2 hours
@ 75±5 psi [0.517±0.0344 MPa]
3) Oven Dry to
original weight ± 15%
Within 10-15 hrs
@ 160±5 oF[71±2.7 oC]
4) Measure
Delamination
If <5%, Pass
If >5%, step 5
5) Repeat steps 1-4
with failed specimens
If delamination <10%,
Pass
3”3”
h
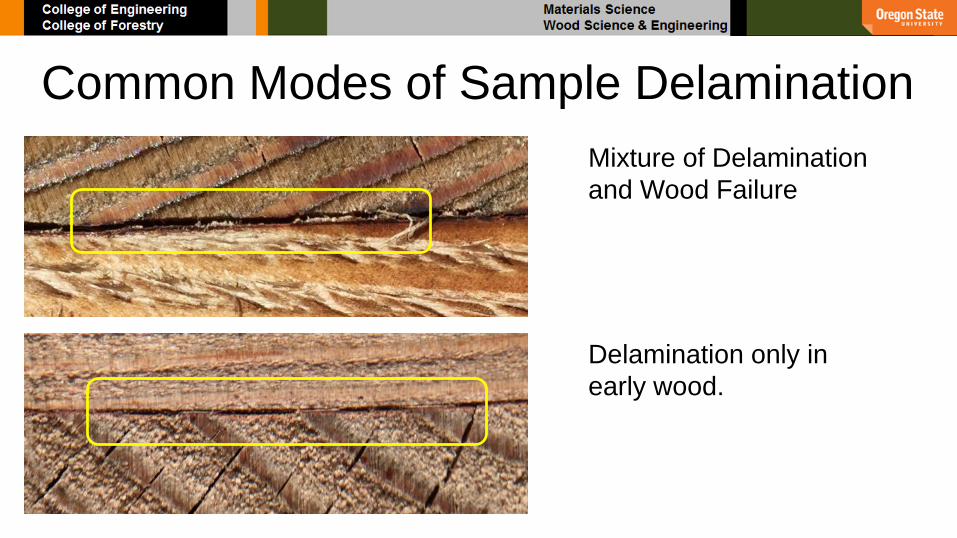
Common Modes of Sample Delamination
Mixture of Delamination
and Wood Failure
Delamination only in
early wood.
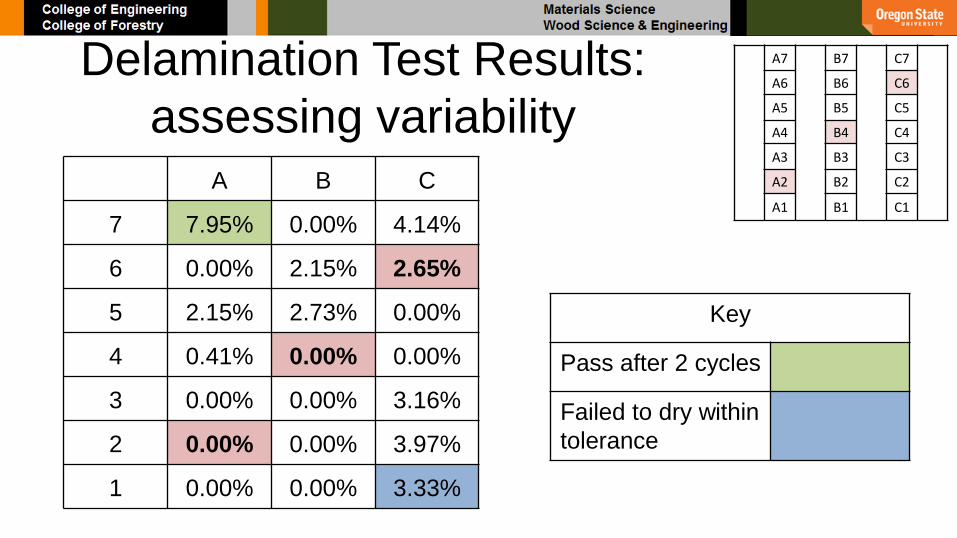
Delamination Test Results:
assessing variabilityA B C
7 7.95% 0.00% 4.14%
6 0.00% 2.15% 2.65%
5 2.15% 2.73% 0.00%
4 0.41% 0.00% 0.00%
3 0.00% 0.00% 3.16%
2 0.00% 0.00% 3.97%
1 0.00% 0.00% 3.33%
Key
Pass after 2 cycles
Failed to dry within
tolerance
A7 B7 C7
A6 B6 C6
A5 B5 C5
A4 B4 C4
A3 B3 C3
A2 B2 C2
A1 B1 C1
Preliminary Conclusions
• Large variation in shear of shear block strength and
wood failure within a single panel
• Optical measurements offer semi-automatic method to
measure WF% while reducing user input, but shallow
wood failure is hard to categorize.
Future Work
• Investigate variation between billets produced within the
same test variables
• Determine reference rolling shear values for all species
involved in the study
• Develop and Test PUR optical WF% assessment
• Develop automated optical method for assessment of
delamination

Acknowledgments• USDA NIFA Forest Products Research Grant Program (proj. ref.
#2013-05978)
• Swanson group and Interfor for lumber
• Momentive and Henkel for adhesives
• OSU Lab manager: Milo Clauson
• Oregon State University faculty and graduate students
http://commons.wikimedia.org/wiki/File:USDA_NIFA_Twitter_Logo.jpg
http://www.ute1stop.org/home/ute/smartlist_127
http://www.interfor.com/careershttp://www.momentive.com/careers/
http://www.henkel.com/contact-us?pageID=184414
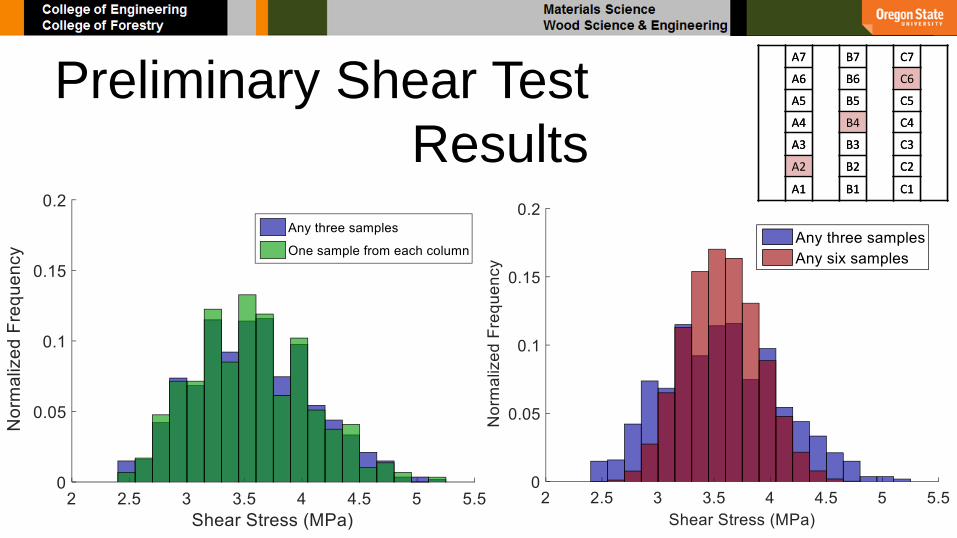
Preliminary Shear Test
Results
A7 B7 C7
A6 B6 C6
A5 B5 C5
A4 B4 C4
A3 B3 C3
A2 B2 C2
A1 B1 C1
A7 B7 C7
A6 B6 C6
A5 B5 C5
A4 B4 C4
A3 B3 C3
A2 B2 C2
A1 B1 C1
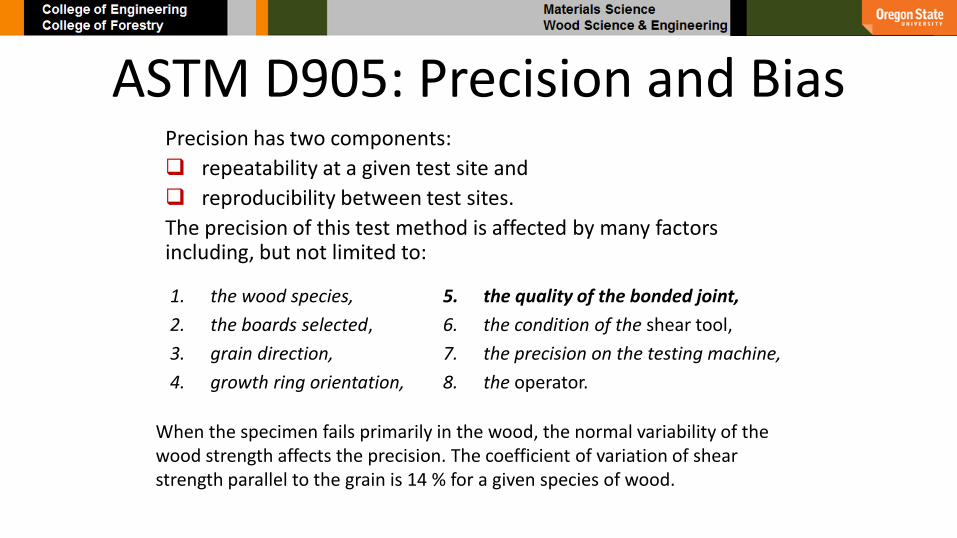
ASTM D905: Precision and BiasPrecision has two components:
repeatability at a given test site and
reproducibility between test sites.
The precision of this test method is affected by many factors including, but not limited to:
5. the quality of the bonded joint,
6. the condition of the shear tool,
7. the precision on the testing machine,
8. the operator.
1. the wood species,
2. the boards selected,
3. grain direction,
4. growth ring orientation,
When the specimen fails primarily in the wood, the normal variability of the wood strength affects the precision. The coefficient of variation of shear strength parallel to the grain is 14 % for a given species of wood.
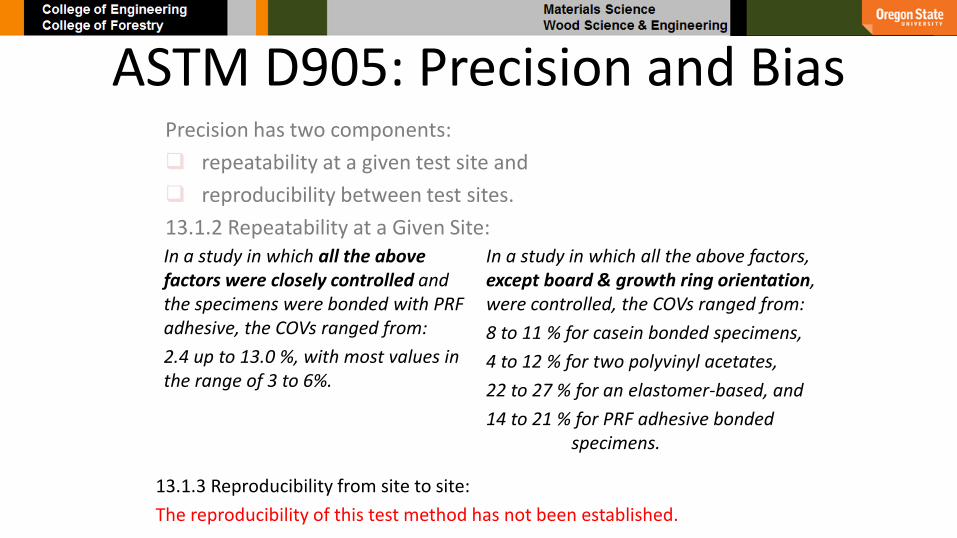
ASTM D905: Precision and BiasPrecision has two components:
repeatability at a given test site and
reproducibility between test sites.
13.1.2 Repeatability at a Given Site:In a study in which all the above factors, except board & growth ring orientation, were controlled, the COVs ranged from:
8 to 11 % for casein bonded specimens,
4 to 12 % for two polyvinyl acetates,
22 to 27 % for an elastomer-based, and
14 to 21 % for PRF adhesive bonded specimens.
In a study in which all the above factors were closely controlled and the specimens were bonded with PRF adhesive, the COVs ranged from:
2.4 up to 13.0 %, with most values in the range of 3 to 6%.
13.1.3 Reproducibility from site to site:
The reproducibility of this test method has not been established.