Embed Size (px)
Citation preview

1
Effective CharacterizationEffective Characterization TechnologiesTechnologies
Deana M Crumbling MSDeana M Crumbling MSTechnology Innovation OfficeTechnology Innovation Office
US Environmental Protection AgencyUS Environmental Protection AgencyWashington DCWashington DC
(703) 603(703) 603--06430643crumblingdeanaepagovcrumblingdeanaepagov
RCRARCRA--BF Internet Seminar December 8 2003BF Internet Seminar December 8 2003
1
2
What is a Conceptual Site ModelWhat is a Conceptual Site Model
A CSM is anyA CSM is any tool(stool(s) that lets you represent ldquoconceptualizerdquo) that lets you represent ldquoconceptualizerdquo or ldquomodelrdquo site contamination issues and concentrationor ldquomodelrdquo site contamination issues and concentration populations so you can make predictions about naturepopulations so you can make predictions about nature
extent risk and risk reduction strategiesextent risk and risk reduction strategies
Successful Cleanup Actions or MonitoringSuccessful Cleanup Actions or Monitoring Depends on An Accurate CSMDepends on An Accurate CSM
project constraints
Project constraints costs time desiredpreferred site reuseproject outcome
2
3
To make good project decisions build a more accurate CSMTo make good project decisions build a more accurate CSM
To develop a more accurate CSM you need data from the siteTo develop a more accurate CSM you need data from the site
The Triad approach is a framework for integrating modern dataThe Triad approach is a framework for integrating modern data generation technologies with efficient work strategies sogeneration technologies with efficient work strategies so CSMsCSMs
can be built ldquofaster cheaper and betterrdquocan be built ldquofaster cheaper and betterrdquo
Just 2 examples of these technologies are presentedJust 2 examples of these technologies are presented
A CSM represents your best estimate forA CSM represents your best estimate for bullbull where the contamination iswhere the contamination isbullbull what is happening to itwhat is happening to itbullbull how someone or something might be exposed andhow someone or something might be exposed and bullbull what you are going to do to stop any unacceptable exposureswhat you are going to do to stop any unacceptable exposures
Stated another wayhellipStated another wayhellip
3
4
Typical WaterTypical Water--Filled Passive DiffusionFilled Passive Diffusion Bag (PDB) Samplers (forBag (PDB) Samplers (for VOCsVOCs))
PDB sampler withPDB sampler withprotective meshprotective mesh
PDB samplerPDB sampler without protectivewithout protective
meshmeshPDB samplerPDB sampler attached toattached tobailer bottombailer bottom
Must purchase fromMust purchase from vendor or obtainvendor or obtain
license from USGSlicense from USGS(703 6484344)(703 6484344)
For more info seeFor more info see archived Internetarchived Internet
seminarPPT file onseminarPPT file on CluClu--In Website belowIn Website below
Slide adapted fromSlide adapted from httpwwwclu-inorgchartechnologiespassdiffcfm
Passive Diffusion Bag (PDB) samplers consist of a low-density polyethylene sleeve filled with laboratory-grade deionized water and closed at both ends Pictured here are three types of diffusion samplers commonly used and commercially available The samplers on the left are supplied prefilled with laboratory-grade deionized water and the sampler on the right is field-fillable PDB samplers employ patented technology (US patent number 5804743) and therefore require that the user purchase commercially produced samplers from a licensed manufacturer or purchase a non-exclusive license for sampler construction from the US Geological Survey Technology Enterprise Office Mail Stop 211 National Center 12201 Sunrise Valley Drive Reston Virginia 20192 (telephone 703 648-4344 fax 703 648-4408)
4
5
Diffusion Samplers Deployed in WellDiffusion Samplers Deployed in Well(must ensure certain hydrologic conditions are met)(must ensure certain hydrologic conditions are met)
Diffusion Samplers
Weight
Cross Sectional View
Avg Diffusion Sampler size 1 to 2
feet in length
Slide adapted fromSlide adapted from httpwwwclu-inorgchartechnologiespassdiffcfm
That is where the diffusion samplers come in PDB samplers are deployed in the screened interval and allowed to equilibrate After sufficient equilibration the samplers are removed and the enclosed water is transferred to volatile organic analysis (VOA) vials Thereafter the samples are treated as ordinary VOA samples
5
6
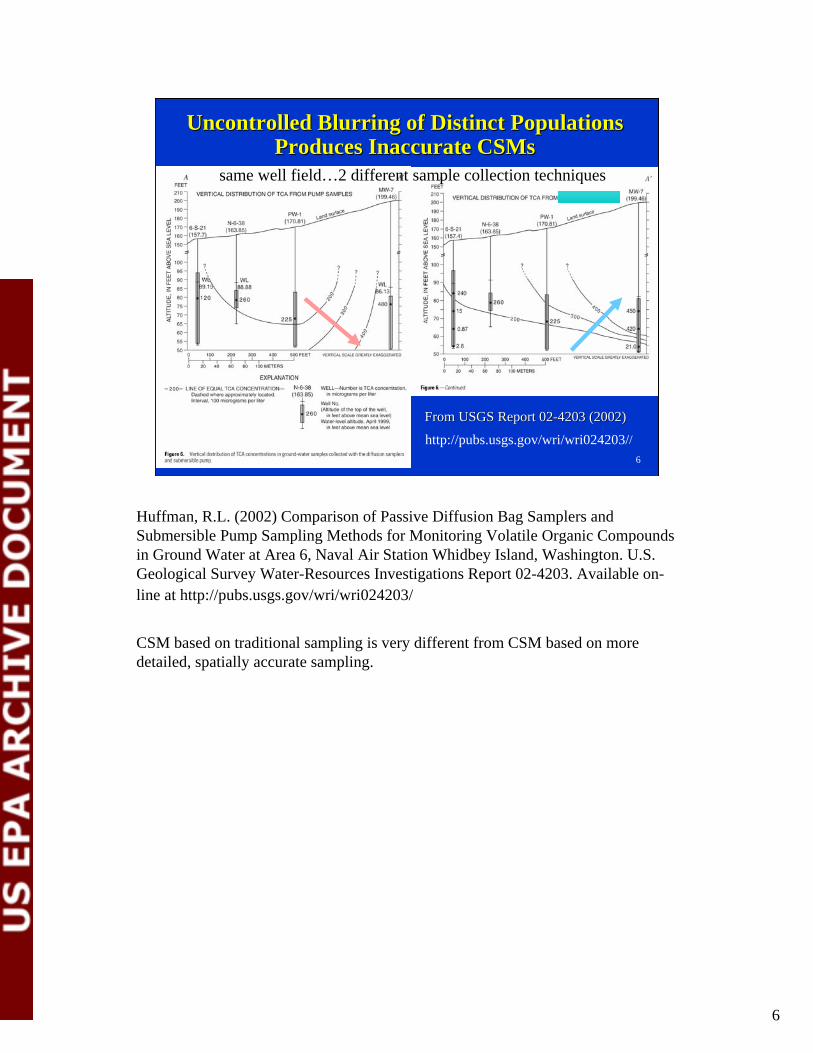
From USGS Report 02From USGS Report 02--4203 (2002)4203 (2002)
httppubsusgsgovwriwri024203
Uncontrolled Blurring of Distinct PopulationsUncontrolled Blurring of Distinct Populations Produces InaccurateProduces Inaccurate CSMsCSMs
same well fieldhellip2 different sample collection techniques
Huffman RL (2002) Comparison of Passive Diffusion Bag Samplers and Submersible Pump Sampling Methods for Monitoring Volatile Organic Compounds in Ground Water at Area 6 Naval Air Station Whidbey Island Washington US Geological Survey Water-Resources Investigations Report 02-4203 Available onshyline at httppubsusgsgovwriwri024203
CSM based on traditional sampling is very different from CSM based on more detailed spatially accurate sampling
6
11-DCE
TCA
httpwaterusgsgovpubsw
riwri024203
httpwaterusgsgovpubsw
riwri024203
7
Fro
m U
SG
S R
epor
t 02
Fro
m U
SG
S R
epor
t 02 --
4203
(20
02)
4203
(20
02)
Passive Diffusion Samplers Preserve AnyPassive Diffusion Samplers Preserve Any Vertical Concentration Gradients in the WellVertical Concentration Gradients in the Well
11-DCE
TCA 240
15
~1
~3
Huffman RL (2002) Comparison of Passive Diffusion Bag Samplers and Submersible Pump Sampling Methods for Monitoring Volatile Organic Compounds in Ground Water at Area 6 Naval Air Station Whidbey Island Washington US Geological Survey Water-Resources Investigations Report 02-4203 Available onshyline at httppubsusgsgovwriwri024203
7
8
Membrane Interface Probes (Membrane Interface Probes (MIPsMIPs for for VOCsVOCs))
Direct push rigsDirect push rigs (small trucks)(small trucks)
CPT units (largeCPT units (large 2020--ton trucks)ton trucks)
Drill rigsDrill rigs
Slide adapted from Columbia Technologies Inc 2003Slide adapted from Columbia Technologies Inc 2003
Multiple Platforms for DeploymentMultiple Platforms for Deployment
WaterborneWaterborne AllAll--terrain trackterrain track Indoor orIndoor or
limited accesslimited access
8
9
Direct Sensing ModuleDirect Sensing Module
Slide adapted from Columbia Technologies Inc 2003Slide adapted from Columbia Technologies Inc 2003
9
10
MIP Principles of OperationMIP Principles of Operation Heated probeHeated probe SemiSemi--permeablepermeable
membranemembrane Contaminant vaporsContaminant vapors
ldquofilteredrdquo into carrier gasldquofilteredrdquo into carrier gas Transported to FID PIDTransported to FID PID
ECD ampor MS detectors atECD ampor MS detectors at the surfacethe surface
Results are displayed inResults are displayed in realreal--time on a laptime on a lap--toptopcomputercomputer
Go to clu-inorg Slide adapted from Columbia Technologies Inc 2001Slide adapted from Columbia Technologies Inc 2001
10
11
Direct Sensing Logs Raw Data as TracingsDirect Sensing Logs Raw Data as Tracings
Fine Grain Characteristics
Indication of Ground Water
Discrete Petroleum
Slide adapted from
Colum
bia Technologies Inc 2003
Slide adapted from
Colum
bia Technologies Inc 2003
Converted by sophisticated software intohellipConverted by sophisticated software intohellip
11
12
Still frame from a 3D Video of Plume vs GW WellsStill frame from a 3D Video of Plume vs GW Wells
Slide adapted from Columbia Technologies Inc 2003Slide adapted from Columbia Technologies Inc 2003
helliphellipa 3a 3--D View of the CSMD View of the CSM
MIP Response
Discrete Sample Conc
What the technology is capable of in the hands of a sophisticated user
12
13
The MIP Helps ldquoImagerdquo the Location and RelativeThe MIP Helps ldquoImagerdquo the Location and Relative Concentration of Subsurface VOC ContaminationConcentration of Subsurface VOC Contamination
Graphic courtesy ofGraphic courtesy of Columbia TechnologiesColumbia Technologies
MIPECD relative responseMIPECD relative response (in(in microvoltsmicrovolts) traced) traced
against depth for the TCEagainst depth for the TCE contaminantcontaminant
MIP relative responseMIP relative response correlated with results ofcorrelated with results of depthdepth--discrete samplesdiscrete samplesAringAring
Fee
t b
elow
gro
und
su
rfac
eF
eet
bel
ow g
rou
nd s
urf
ace
Direct-push MIP-ECD taking readings every 2 inches going down to create a vertical profile of contamination in the subsurface
Soil conductivity results suggest transitions from sandy matrix to clay matrix (higher conductivity in clayey soil) The 7- to 8-ft wide band of contamination is associated with a clay layer in the subsurface Small discrete GW samples (ie very small sample support) representative of point concentrations were collected using the DP probe and analyzed using GC-MS The results allow coarse calibration (in units of ugL = mass TCE per volume of GW) of the magnitude of the ECD response (in voltage units)
What analytical results (low medium or high lab results) would be expected if a monitoring well were screened over the various intervals in the animation graphic (Keep in mind that clay layers may be rather non-permeable to water flow as compared to sandier layers)
13
14
Analytical Results from Heterogeneous SystemsAnalytical Results from Heterogeneous Systems Are Determined by How Samples Are CollectedAre Determined by How Samples Are Collected
vsvs
WellWellscreenscreen
11
WellWellscreenscreen
22
Depending on screenDepending on screen construction you can getconstruction you can get completely different GWcompletely different GWresults that have nothingresults that have nothing to do with the lab or theto do with the lab or the analytical methodanalytical method
Unless information aboutUnless information about contaminant distributioncontaminant distribution guides well constructionguides well construction GW results can be highlyGW results can be highly variable and difficult tovariable and difficult to interpretinterpret
vsvs 33
Direct-push MIP-ECD taking readings every 2 inches going down to create a vertical profile of contamination in the subsurface
Soil conductivity results suggest transitions from sandy matrix to clay matrix (higher conductivity in clayey soil) The 7- to 8-ft wide band of contamination is associated with a clay layer in the subsurface Small discrete GW samples (ie very small sample support) representative of point concentrations were collected using the DP probe and analyzed using GC-MS The results allow coarse calibration (in units of ugL = mass TCE per volume of GW) of the magnitude of the ECD response (in voltage units)
What analytical results (low medium or high lab results) would be expected if a monitoring well were screened over the various intervals in the animation graphic (Keep in mind that clay layers may be rather non-permeable to water flow as compared to sandier layers)
14
15
Display Options 2Display Options 2--D Representation of a CSMD Representation of a CSM
Slid
e adap
ted from
Colu
mb
ia Tech
nologies In
c 2001
15
16
Display Options Include Discrete Sample ResultsDisplay Options Include Discrete Sample Results
Comparison of GW Samples to Continuous Sensor ProfileComparison of GW Samples to Continuous Sensor Profile
Slide adapted from Columbia Technologies Inc 2003Slide adapted from Columbia Technologies Inc 2003
MIP Response
Discrete SamplemdashTotal Chlorinated VOC Concentration
SMART DATA OUTPUTS
bull Built to client specifications
bull Interactive 3D
bull Easy to view correlation between various data sets
16
17
Membrane Interface Probe informationMembrane Interface Probe information Through Field Analytics Encyclopedia websiteThrough Field Analytics Encyclopedia websit httpwwwclu-inorg
ndashndashhttpwwwclu-inorgchartechnologiesmipcfm
Passive Diffusion Samplers informationPassive Diffusion Samplers information Through ITRC websiteThrough ITRC website httpwwwitrcweborghttpwwwitrcweborg
ndashndash httpdiffusionsampleritrcweborgcommondefaultasphttpdiffusionsampleritrcweborgcommondefaultasp
Related informationRelated information EPAEPA TIOrsquosTIOrsquos CluClu--In website for TriadIn website for Triad httphttpcluinorgcluinorgtriadtriad
ndashndash Assorted sampling informationAssorted sampling information httpcluinorgchar1_educfmsamp_collhttpcluinorgchar1_educfmsamp_collandand httpcluinorgchar1_educfmstat_samphttpcluinorgchar1_educfmstat_samp
ndashndash Archived Triad seminarArchived Triad seminar httpwwwtriadcentralorgnewsdsp_archivecfm USACE Engineering Manuals (USACE Engineering Manuals (EMsEMs)) httpwwwusacearmymilpublicationseng-manualsilS Army Corps CSM Guidance EM EM 1110US Army Corps CSM Guidance EM EM 1110--11--12001200ndashndash US Army Corps TPP Guidance EM EM 200US Army Corps TPP Guidance EM EM 200--11--22
USACE CRREL Technical Report LibraryUSACE CRREL Technical Report Library httphttpwwwcrrelusacearmymilproductsproductshtmlwwwcrrelusacearmymilproductsproductshtml
Additional InformationAdditional Information
17

2
What is a Conceptual Site ModelWhat is a Conceptual Site Model
A CSM is anyA CSM is any tool(stool(s) that lets you represent ldquoconceptualizerdquo) that lets you represent ldquoconceptualizerdquo or ldquomodelrdquo site contamination issues and concentrationor ldquomodelrdquo site contamination issues and concentration populations so you can make predictions about naturepopulations so you can make predictions about nature
extent risk and risk reduction strategiesextent risk and risk reduction strategies
Successful Cleanup Actions or MonitoringSuccessful Cleanup Actions or Monitoring Depends on An Accurate CSMDepends on An Accurate CSM
project constraints
Project constraints costs time desiredpreferred site reuseproject outcome
2
3
To make good project decisions build a more accurate CSMTo make good project decisions build a more accurate CSM
To develop a more accurate CSM you need data from the siteTo develop a more accurate CSM you need data from the site
The Triad approach is a framework for integrating modern dataThe Triad approach is a framework for integrating modern data generation technologies with efficient work strategies sogeneration technologies with efficient work strategies so CSMsCSMs
can be built ldquofaster cheaper and betterrdquocan be built ldquofaster cheaper and betterrdquo
Just 2 examples of these technologies are presentedJust 2 examples of these technologies are presented
A CSM represents your best estimate forA CSM represents your best estimate for bullbull where the contamination iswhere the contamination isbullbull what is happening to itwhat is happening to itbullbull how someone or something might be exposed andhow someone or something might be exposed and bullbull what you are going to do to stop any unacceptable exposureswhat you are going to do to stop any unacceptable exposures
Stated another wayhellipStated another wayhellip
3
4
Typical WaterTypical Water--Filled Passive DiffusionFilled Passive Diffusion Bag (PDB) Samplers (forBag (PDB) Samplers (for VOCsVOCs))
PDB sampler withPDB sampler withprotective meshprotective mesh
PDB samplerPDB sampler without protectivewithout protective
meshmeshPDB samplerPDB sampler attached toattached tobailer bottombailer bottom
Must purchase fromMust purchase from vendor or obtainvendor or obtain
license from USGSlicense from USGS(703 6484344)(703 6484344)
For more info seeFor more info see archived Internetarchived Internet
seminarPPT file onseminarPPT file on CluClu--In Website belowIn Website below
Slide adapted fromSlide adapted from httpwwwclu-inorgchartechnologiespassdiffcfm
Passive Diffusion Bag (PDB) samplers consist of a low-density polyethylene sleeve filled with laboratory-grade deionized water and closed at both ends Pictured here are three types of diffusion samplers commonly used and commercially available The samplers on the left are supplied prefilled with laboratory-grade deionized water and the sampler on the right is field-fillable PDB samplers employ patented technology (US patent number 5804743) and therefore require that the user purchase commercially produced samplers from a licensed manufacturer or purchase a non-exclusive license for sampler construction from the US Geological Survey Technology Enterprise Office Mail Stop 211 National Center 12201 Sunrise Valley Drive Reston Virginia 20192 (telephone 703 648-4344 fax 703 648-4408)
4
5
Diffusion Samplers Deployed in WellDiffusion Samplers Deployed in Well(must ensure certain hydrologic conditions are met)(must ensure certain hydrologic conditions are met)
Diffusion Samplers
Weight
Cross Sectional View
Avg Diffusion Sampler size 1 to 2
feet in length
Slide adapted fromSlide adapted from httpwwwclu-inorgchartechnologiespassdiffcfm
That is where the diffusion samplers come in PDB samplers are deployed in the screened interval and allowed to equilibrate After sufficient equilibration the samplers are removed and the enclosed water is transferred to volatile organic analysis (VOA) vials Thereafter the samples are treated as ordinary VOA samples
5
6
From USGS Report 02From USGS Report 02--4203 (2002)4203 (2002)
httppubsusgsgovwriwri024203
Uncontrolled Blurring of Distinct PopulationsUncontrolled Blurring of Distinct Populations Produces InaccurateProduces Inaccurate CSMsCSMs
same well fieldhellip2 different sample collection techniques
Huffman RL (2002) Comparison of Passive Diffusion Bag Samplers and Submersible Pump Sampling Methods for Monitoring Volatile Organic Compounds in Ground Water at Area 6 Naval Air Station Whidbey Island Washington US Geological Survey Water-Resources Investigations Report 02-4203 Available onshyline at httppubsusgsgovwriwri024203
CSM based on traditional sampling is very different from CSM based on more detailed spatially accurate sampling
6
11-DCE
TCA
httpwaterusgsgovpubsw
riwri024203
httpwaterusgsgovpubsw
riwri024203
7
Fro
m U
SG
S R
epor
t 02
Fro
m U
SG
S R
epor
t 02 --
4203
(20
02)
4203
(20
02)
Passive Diffusion Samplers Preserve AnyPassive Diffusion Samplers Preserve Any Vertical Concentration Gradients in the WellVertical Concentration Gradients in the Well
11-DCE
TCA 240
15
~1
~3
Huffman RL (2002) Comparison of Passive Diffusion Bag Samplers and Submersible Pump Sampling Methods for Monitoring Volatile Organic Compounds in Ground Water at Area 6 Naval Air Station Whidbey Island Washington US Geological Survey Water-Resources Investigations Report 02-4203 Available onshyline at httppubsusgsgovwriwri024203
7
8
Membrane Interface Probes (Membrane Interface Probes (MIPsMIPs for for VOCsVOCs))
Direct push rigsDirect push rigs (small trucks)(small trucks)
CPT units (largeCPT units (large 2020--ton trucks)ton trucks)
Drill rigsDrill rigs
Slide adapted from Columbia Technologies Inc 2003Slide adapted from Columbia Technologies Inc 2003
Multiple Platforms for DeploymentMultiple Platforms for Deployment
WaterborneWaterborne AllAll--terrain trackterrain track Indoor orIndoor or
limited accesslimited access
8
9
Direct Sensing ModuleDirect Sensing Module
Slide adapted from Columbia Technologies Inc 2003Slide adapted from Columbia Technologies Inc 2003
9
10
MIP Principles of OperationMIP Principles of Operation Heated probeHeated probe SemiSemi--permeablepermeable
membranemembrane Contaminant vaporsContaminant vapors
ldquofilteredrdquo into carrier gasldquofilteredrdquo into carrier gas Transported to FID PIDTransported to FID PID
ECD ampor MS detectors atECD ampor MS detectors at the surfacethe surface
Results are displayed inResults are displayed in realreal--time on a laptime on a lap--toptopcomputercomputer
Go to clu-inorg Slide adapted from Columbia Technologies Inc 2001Slide adapted from Columbia Technologies Inc 2001
10
11
Direct Sensing Logs Raw Data as TracingsDirect Sensing Logs Raw Data as Tracings
Fine Grain Characteristics
Indication of Ground Water
Discrete Petroleum
Slide adapted from
Colum
bia Technologies Inc 2003
Slide adapted from
Colum
bia Technologies Inc 2003
Converted by sophisticated software intohellipConverted by sophisticated software intohellip
11
12
Still frame from a 3D Video of Plume vs GW WellsStill frame from a 3D Video of Plume vs GW Wells
Slide adapted from Columbia Technologies Inc 2003Slide adapted from Columbia Technologies Inc 2003
helliphellipa 3a 3--D View of the CSMD View of the CSM
MIP Response
Discrete Sample Conc
What the technology is capable of in the hands of a sophisticated user
12
13
The MIP Helps ldquoImagerdquo the Location and RelativeThe MIP Helps ldquoImagerdquo the Location and Relative Concentration of Subsurface VOC ContaminationConcentration of Subsurface VOC Contamination
Graphic courtesy ofGraphic courtesy of Columbia TechnologiesColumbia Technologies
MIPECD relative responseMIPECD relative response (in(in microvoltsmicrovolts) traced) traced
against depth for the TCEagainst depth for the TCE contaminantcontaminant
MIP relative responseMIP relative response correlated with results ofcorrelated with results of depthdepth--discrete samplesdiscrete samplesAringAring
Fee
t b
elow
gro
und
su
rfac
eF
eet
bel
ow g
rou
nd s
urf
ace
Direct-push MIP-ECD taking readings every 2 inches going down to create a vertical profile of contamination in the subsurface
Soil conductivity results suggest transitions from sandy matrix to clay matrix (higher conductivity in clayey soil) The 7- to 8-ft wide band of contamination is associated with a clay layer in the subsurface Small discrete GW samples (ie very small sample support) representative of point concentrations were collected using the DP probe and analyzed using GC-MS The results allow coarse calibration (in units of ugL = mass TCE per volume of GW) of the magnitude of the ECD response (in voltage units)
What analytical results (low medium or high lab results) would be expected if a monitoring well were screened over the various intervals in the animation graphic (Keep in mind that clay layers may be rather non-permeable to water flow as compared to sandier layers)
13
14
Analytical Results from Heterogeneous SystemsAnalytical Results from Heterogeneous Systems Are Determined by How Samples Are CollectedAre Determined by How Samples Are Collected
vsvs
WellWellscreenscreen
11
WellWellscreenscreen
22
Depending on screenDepending on screen construction you can getconstruction you can get completely different GWcompletely different GWresults that have nothingresults that have nothing to do with the lab or theto do with the lab or the analytical methodanalytical method
Unless information aboutUnless information about contaminant distributioncontaminant distribution guides well constructionguides well construction GW results can be highlyGW results can be highly variable and difficult tovariable and difficult to interpretinterpret
vsvs 33
Direct-push MIP-ECD taking readings every 2 inches going down to create a vertical profile of contamination in the subsurface
Soil conductivity results suggest transitions from sandy matrix to clay matrix (higher conductivity in clayey soil) The 7- to 8-ft wide band of contamination is associated with a clay layer in the subsurface Small discrete GW samples (ie very small sample support) representative of point concentrations were collected using the DP probe and analyzed using GC-MS The results allow coarse calibration (in units of ugL = mass TCE per volume of GW) of the magnitude of the ECD response (in voltage units)
What analytical results (low medium or high lab results) would be expected if a monitoring well were screened over the various intervals in the animation graphic (Keep in mind that clay layers may be rather non-permeable to water flow as compared to sandier layers)
14
15
Display Options 2Display Options 2--D Representation of a CSMD Representation of a CSM
Slid
e adap
ted from
Colu
mb
ia Tech
nologies In
c 2001
15
16
Display Options Include Discrete Sample ResultsDisplay Options Include Discrete Sample Results
Comparison of GW Samples to Continuous Sensor ProfileComparison of GW Samples to Continuous Sensor Profile
Slide adapted from Columbia Technologies Inc 2003Slide adapted from Columbia Technologies Inc 2003
MIP Response
Discrete SamplemdashTotal Chlorinated VOC Concentration
SMART DATA OUTPUTS
bull Built to client specifications
bull Interactive 3D
bull Easy to view correlation between various data sets
16
17
Membrane Interface Probe informationMembrane Interface Probe information Through Field Analytics Encyclopedia websiteThrough Field Analytics Encyclopedia websit httpwwwclu-inorg
ndashndashhttpwwwclu-inorgchartechnologiesmipcfm
Passive Diffusion Samplers informationPassive Diffusion Samplers information Through ITRC websiteThrough ITRC website httpwwwitrcweborghttpwwwitrcweborg
ndashndash httpdiffusionsampleritrcweborgcommondefaultasphttpdiffusionsampleritrcweborgcommondefaultasp
Related informationRelated information EPAEPA TIOrsquosTIOrsquos CluClu--In website for TriadIn website for Triad httphttpcluinorgcluinorgtriadtriad
ndashndash Assorted sampling informationAssorted sampling information httpcluinorgchar1_educfmsamp_collhttpcluinorgchar1_educfmsamp_collandand httpcluinorgchar1_educfmstat_samphttpcluinorgchar1_educfmstat_samp
ndashndash Archived Triad seminarArchived Triad seminar httpwwwtriadcentralorgnewsdsp_archivecfm USACE Engineering Manuals (USACE Engineering Manuals (EMsEMs)) httpwwwusacearmymilpublicationseng-manualsilS Army Corps CSM Guidance EM EM 1110US Army Corps CSM Guidance EM EM 1110--11--12001200ndashndash US Army Corps TPP Guidance EM EM 200US Army Corps TPP Guidance EM EM 200--11--22
USACE CRREL Technical Report LibraryUSACE CRREL Technical Report Library httphttpwwwcrrelusacearmymilproductsproductshtmlwwwcrrelusacearmymilproductsproductshtml
Additional InformationAdditional Information
17
3
To make good project decisions build a more accurate CSMTo make good project decisions build a more accurate CSM
To develop a more accurate CSM you need data from the siteTo develop a more accurate CSM you need data from the site
The Triad approach is a framework for integrating modern dataThe Triad approach is a framework for integrating modern data generation technologies with efficient work strategies sogeneration technologies with efficient work strategies so CSMsCSMs
can be built ldquofaster cheaper and betterrdquocan be built ldquofaster cheaper and betterrdquo
Just 2 examples of these technologies are presentedJust 2 examples of these technologies are presented
A CSM represents your best estimate forA CSM represents your best estimate for bullbull where the contamination iswhere the contamination isbullbull what is happening to itwhat is happening to itbullbull how someone or something might be exposed andhow someone or something might be exposed and bullbull what you are going to do to stop any unacceptable exposureswhat you are going to do to stop any unacceptable exposures
Stated another wayhellipStated another wayhellip
3
4
Typical WaterTypical Water--Filled Passive DiffusionFilled Passive Diffusion Bag (PDB) Samplers (forBag (PDB) Samplers (for VOCsVOCs))
PDB sampler withPDB sampler withprotective meshprotective mesh
PDB samplerPDB sampler without protectivewithout protective
meshmeshPDB samplerPDB sampler attached toattached tobailer bottombailer bottom
Must purchase fromMust purchase from vendor or obtainvendor or obtain
license from USGSlicense from USGS(703 6484344)(703 6484344)
For more info seeFor more info see archived Internetarchived Internet
seminarPPT file onseminarPPT file on CluClu--In Website belowIn Website below
Slide adapted fromSlide adapted from httpwwwclu-inorgchartechnologiespassdiffcfm
Passive Diffusion Bag (PDB) samplers consist of a low-density polyethylene sleeve filled with laboratory-grade deionized water and closed at both ends Pictured here are three types of diffusion samplers commonly used and commercially available The samplers on the left are supplied prefilled with laboratory-grade deionized water and the sampler on the right is field-fillable PDB samplers employ patented technology (US patent number 5804743) and therefore require that the user purchase commercially produced samplers from a licensed manufacturer or purchase a non-exclusive license for sampler construction from the US Geological Survey Technology Enterprise Office Mail Stop 211 National Center 12201 Sunrise Valley Drive Reston Virginia 20192 (telephone 703 648-4344 fax 703 648-4408)
4
5
Diffusion Samplers Deployed in WellDiffusion Samplers Deployed in Well(must ensure certain hydrologic conditions are met)(must ensure certain hydrologic conditions are met)
Diffusion Samplers
Weight
Cross Sectional View
Avg Diffusion Sampler size 1 to 2
feet in length
Slide adapted fromSlide adapted from httpwwwclu-inorgchartechnologiespassdiffcfm
That is where the diffusion samplers come in PDB samplers are deployed in the screened interval and allowed to equilibrate After sufficient equilibration the samplers are removed and the enclosed water is transferred to volatile organic analysis (VOA) vials Thereafter the samples are treated as ordinary VOA samples
5
6
From USGS Report 02From USGS Report 02--4203 (2002)4203 (2002)
httppubsusgsgovwriwri024203
Uncontrolled Blurring of Distinct PopulationsUncontrolled Blurring of Distinct Populations Produces InaccurateProduces Inaccurate CSMsCSMs
same well fieldhellip2 different sample collection techniques
Huffman RL (2002) Comparison of Passive Diffusion Bag Samplers and Submersible Pump Sampling Methods for Monitoring Volatile Organic Compounds in Ground Water at Area 6 Naval Air Station Whidbey Island Washington US Geological Survey Water-Resources Investigations Report 02-4203 Available onshyline at httppubsusgsgovwriwri024203
CSM based on traditional sampling is very different from CSM based on more detailed spatially accurate sampling
6
11-DCE
TCA
httpwaterusgsgovpubsw
riwri024203
httpwaterusgsgovpubsw
riwri024203
7
Fro
m U
SG
S R
epor
t 02
Fro
m U
SG
S R
epor
t 02 --
4203
(20
02)
4203
(20
02)
Passive Diffusion Samplers Preserve AnyPassive Diffusion Samplers Preserve Any Vertical Concentration Gradients in the WellVertical Concentration Gradients in the Well
11-DCE
TCA 240
15
~1
~3
Huffman RL (2002) Comparison of Passive Diffusion Bag Samplers and Submersible Pump Sampling Methods for Monitoring Volatile Organic Compounds in Ground Water at Area 6 Naval Air Station Whidbey Island Washington US Geological Survey Water-Resources Investigations Report 02-4203 Available onshyline at httppubsusgsgovwriwri024203
7
8
Membrane Interface Probes (Membrane Interface Probes (MIPsMIPs for for VOCsVOCs))
Direct push rigsDirect push rigs (small trucks)(small trucks)
CPT units (largeCPT units (large 2020--ton trucks)ton trucks)
Drill rigsDrill rigs
Slide adapted from Columbia Technologies Inc 2003Slide adapted from Columbia Technologies Inc 2003
Multiple Platforms for DeploymentMultiple Platforms for Deployment
WaterborneWaterborne AllAll--terrain trackterrain track Indoor orIndoor or
limited accesslimited access
8
9
Direct Sensing ModuleDirect Sensing Module
Slide adapted from Columbia Technologies Inc 2003Slide adapted from Columbia Technologies Inc 2003
9
10
MIP Principles of OperationMIP Principles of Operation Heated probeHeated probe SemiSemi--permeablepermeable
membranemembrane Contaminant vaporsContaminant vapors
ldquofilteredrdquo into carrier gasldquofilteredrdquo into carrier gas Transported to FID PIDTransported to FID PID
ECD ampor MS detectors atECD ampor MS detectors at the surfacethe surface
Results are displayed inResults are displayed in realreal--time on a laptime on a lap--toptopcomputercomputer
Go to clu-inorg Slide adapted from Columbia Technologies Inc 2001Slide adapted from Columbia Technologies Inc 2001
10
11
Direct Sensing Logs Raw Data as TracingsDirect Sensing Logs Raw Data as Tracings
Fine Grain Characteristics
Indication of Ground Water
Discrete Petroleum
Slide adapted from
Colum
bia Technologies Inc 2003
Slide adapted from
Colum
bia Technologies Inc 2003
Converted by sophisticated software intohellipConverted by sophisticated software intohellip
11
12
Still frame from a 3D Video of Plume vs GW WellsStill frame from a 3D Video of Plume vs GW Wells
Slide adapted from Columbia Technologies Inc 2003Slide adapted from Columbia Technologies Inc 2003
helliphellipa 3a 3--D View of the CSMD View of the CSM
MIP Response
Discrete Sample Conc
What the technology is capable of in the hands of a sophisticated user
12
13
The MIP Helps ldquoImagerdquo the Location and RelativeThe MIP Helps ldquoImagerdquo the Location and Relative Concentration of Subsurface VOC ContaminationConcentration of Subsurface VOC Contamination
Graphic courtesy ofGraphic courtesy of Columbia TechnologiesColumbia Technologies
MIPECD relative responseMIPECD relative response (in(in microvoltsmicrovolts) traced) traced
against depth for the TCEagainst depth for the TCE contaminantcontaminant
MIP relative responseMIP relative response correlated with results ofcorrelated with results of depthdepth--discrete samplesdiscrete samplesAringAring
Fee
t b
elow
gro
und
su
rfac
eF
eet
bel
ow g
rou
nd s
urf
ace
Direct-push MIP-ECD taking readings every 2 inches going down to create a vertical profile of contamination in the subsurface
Soil conductivity results suggest transitions from sandy matrix to clay matrix (higher conductivity in clayey soil) The 7- to 8-ft wide band of contamination is associated with a clay layer in the subsurface Small discrete GW samples (ie very small sample support) representative of point concentrations were collected using the DP probe and analyzed using GC-MS The results allow coarse calibration (in units of ugL = mass TCE per volume of GW) of the magnitude of the ECD response (in voltage units)
What analytical results (low medium or high lab results) would be expected if a monitoring well were screened over the various intervals in the animation graphic (Keep in mind that clay layers may be rather non-permeable to water flow as compared to sandier layers)
13
14
Analytical Results from Heterogeneous SystemsAnalytical Results from Heterogeneous Systems Are Determined by How Samples Are CollectedAre Determined by How Samples Are Collected
vsvs
WellWellscreenscreen
11
WellWellscreenscreen
22
Depending on screenDepending on screen construction you can getconstruction you can get completely different GWcompletely different GWresults that have nothingresults that have nothing to do with the lab or theto do with the lab or the analytical methodanalytical method
Unless information aboutUnless information about contaminant distributioncontaminant distribution guides well constructionguides well construction GW results can be highlyGW results can be highly variable and difficult tovariable and difficult to interpretinterpret
vsvs 33
Direct-push MIP-ECD taking readings every 2 inches going down to create a vertical profile of contamination in the subsurface
Soil conductivity results suggest transitions from sandy matrix to clay matrix (higher conductivity in clayey soil) The 7- to 8-ft wide band of contamination is associated with a clay layer in the subsurface Small discrete GW samples (ie very small sample support) representative of point concentrations were collected using the DP probe and analyzed using GC-MS The results allow coarse calibration (in units of ugL = mass TCE per volume of GW) of the magnitude of the ECD response (in voltage units)
What analytical results (low medium or high lab results) would be expected if a monitoring well were screened over the various intervals in the animation graphic (Keep in mind that clay layers may be rather non-permeable to water flow as compared to sandier layers)
14
15
Display Options 2Display Options 2--D Representation of a CSMD Representation of a CSM
Slid
e adap
ted from
Colu
mb
ia Tech
nologies In
c 2001
15
16
Display Options Include Discrete Sample ResultsDisplay Options Include Discrete Sample Results
Comparison of GW Samples to Continuous Sensor ProfileComparison of GW Samples to Continuous Sensor Profile
Slide adapted from Columbia Technologies Inc 2003Slide adapted from Columbia Technologies Inc 2003
MIP Response
Discrete SamplemdashTotal Chlorinated VOC Concentration
SMART DATA OUTPUTS
bull Built to client specifications
bull Interactive 3D
bull Easy to view correlation between various data sets
16
17
Membrane Interface Probe informationMembrane Interface Probe information Through Field Analytics Encyclopedia websiteThrough Field Analytics Encyclopedia websit httpwwwclu-inorg
ndashndashhttpwwwclu-inorgchartechnologiesmipcfm
Passive Diffusion Samplers informationPassive Diffusion Samplers information Through ITRC websiteThrough ITRC website httpwwwitrcweborghttpwwwitrcweborg
ndashndash httpdiffusionsampleritrcweborgcommondefaultasphttpdiffusionsampleritrcweborgcommondefaultasp
Related informationRelated information EPAEPA TIOrsquosTIOrsquos CluClu--In website for TriadIn website for Triad httphttpcluinorgcluinorgtriadtriad
ndashndash Assorted sampling informationAssorted sampling information httpcluinorgchar1_educfmsamp_collhttpcluinorgchar1_educfmsamp_collandand httpcluinorgchar1_educfmstat_samphttpcluinorgchar1_educfmstat_samp
ndashndash Archived Triad seminarArchived Triad seminar httpwwwtriadcentralorgnewsdsp_archivecfm USACE Engineering Manuals (USACE Engineering Manuals (EMsEMs)) httpwwwusacearmymilpublicationseng-manualsilS Army Corps CSM Guidance EM EM 1110US Army Corps CSM Guidance EM EM 1110--11--12001200ndashndash US Army Corps TPP Guidance EM EM 200US Army Corps TPP Guidance EM EM 200--11--22
USACE CRREL Technical Report LibraryUSACE CRREL Technical Report Library httphttpwwwcrrelusacearmymilproductsproductshtmlwwwcrrelusacearmymilproductsproductshtml
Additional InformationAdditional Information
17

4
Typical WaterTypical Water--Filled Passive DiffusionFilled Passive Diffusion Bag (PDB) Samplers (forBag (PDB) Samplers (for VOCsVOCs))
PDB sampler withPDB sampler withprotective meshprotective mesh
PDB samplerPDB sampler without protectivewithout protective
meshmeshPDB samplerPDB sampler attached toattached tobailer bottombailer bottom
Must purchase fromMust purchase from vendor or obtainvendor or obtain
license from USGSlicense from USGS(703 6484344)(703 6484344)
For more info seeFor more info see archived Internetarchived Internet
seminarPPT file onseminarPPT file on CluClu--In Website belowIn Website below
Slide adapted fromSlide adapted from httpwwwclu-inorgchartechnologiespassdiffcfm
Passive Diffusion Bag (PDB) samplers consist of a low-density polyethylene sleeve filled with laboratory-grade deionized water and closed at both ends Pictured here are three types of diffusion samplers commonly used and commercially available The samplers on the left are supplied prefilled with laboratory-grade deionized water and the sampler on the right is field-fillable PDB samplers employ patented technology (US patent number 5804743) and therefore require that the user purchase commercially produced samplers from a licensed manufacturer or purchase a non-exclusive license for sampler construction from the US Geological Survey Technology Enterprise Office Mail Stop 211 National Center 12201 Sunrise Valley Drive Reston Virginia 20192 (telephone 703 648-4344 fax 703 648-4408)
4
5
Diffusion Samplers Deployed in WellDiffusion Samplers Deployed in Well(must ensure certain hydrologic conditions are met)(must ensure certain hydrologic conditions are met)
Diffusion Samplers
Weight
Cross Sectional View
Avg Diffusion Sampler size 1 to 2
feet in length
Slide adapted fromSlide adapted from httpwwwclu-inorgchartechnologiespassdiffcfm
That is where the diffusion samplers come in PDB samplers are deployed in the screened interval and allowed to equilibrate After sufficient equilibration the samplers are removed and the enclosed water is transferred to volatile organic analysis (VOA) vials Thereafter the samples are treated as ordinary VOA samples
5
6
From USGS Report 02From USGS Report 02--4203 (2002)4203 (2002)
httppubsusgsgovwriwri024203
Uncontrolled Blurring of Distinct PopulationsUncontrolled Blurring of Distinct Populations Produces InaccurateProduces Inaccurate CSMsCSMs
same well fieldhellip2 different sample collection techniques
Huffman RL (2002) Comparison of Passive Diffusion Bag Samplers and Submersible Pump Sampling Methods for Monitoring Volatile Organic Compounds in Ground Water at Area 6 Naval Air Station Whidbey Island Washington US Geological Survey Water-Resources Investigations Report 02-4203 Available onshyline at httppubsusgsgovwriwri024203
CSM based on traditional sampling is very different from CSM based on more detailed spatially accurate sampling
6
11-DCE
TCA
httpwaterusgsgovpubsw
riwri024203
httpwaterusgsgovpubsw
riwri024203
7
Fro
m U
SG
S R
epor
t 02
Fro
m U
SG
S R
epor
t 02 --
4203
(20
02)
4203
(20
02)
Passive Diffusion Samplers Preserve AnyPassive Diffusion Samplers Preserve Any Vertical Concentration Gradients in the WellVertical Concentration Gradients in the Well
11-DCE
TCA 240
15
~1
~3
Huffman RL (2002) Comparison of Passive Diffusion Bag Samplers and Submersible Pump Sampling Methods for Monitoring Volatile Organic Compounds in Ground Water at Area 6 Naval Air Station Whidbey Island Washington US Geological Survey Water-Resources Investigations Report 02-4203 Available onshyline at httppubsusgsgovwriwri024203
7
8
Membrane Interface Probes (Membrane Interface Probes (MIPsMIPs for for VOCsVOCs))
Direct push rigsDirect push rigs (small trucks)(small trucks)
CPT units (largeCPT units (large 2020--ton trucks)ton trucks)
Drill rigsDrill rigs
Slide adapted from Columbia Technologies Inc 2003Slide adapted from Columbia Technologies Inc 2003
Multiple Platforms for DeploymentMultiple Platforms for Deployment
WaterborneWaterborne AllAll--terrain trackterrain track Indoor orIndoor or
limited accesslimited access
8
9
Direct Sensing ModuleDirect Sensing Module
Slide adapted from Columbia Technologies Inc 2003Slide adapted from Columbia Technologies Inc 2003
9
10
MIP Principles of OperationMIP Principles of Operation Heated probeHeated probe SemiSemi--permeablepermeable
membranemembrane Contaminant vaporsContaminant vapors
ldquofilteredrdquo into carrier gasldquofilteredrdquo into carrier gas Transported to FID PIDTransported to FID PID
ECD ampor MS detectors atECD ampor MS detectors at the surfacethe surface
Results are displayed inResults are displayed in realreal--time on a laptime on a lap--toptopcomputercomputer
Go to clu-inorg Slide adapted from Columbia Technologies Inc 2001Slide adapted from Columbia Technologies Inc 2001
10
11
Direct Sensing Logs Raw Data as TracingsDirect Sensing Logs Raw Data as Tracings
Fine Grain Characteristics
Indication of Ground Water
Discrete Petroleum
Slide adapted from
Colum
bia Technologies Inc 2003
Slide adapted from
Colum
bia Technologies Inc 2003
Converted by sophisticated software intohellipConverted by sophisticated software intohellip
11
12
Still frame from a 3D Video of Plume vs GW WellsStill frame from a 3D Video of Plume vs GW Wells
Slide adapted from Columbia Technologies Inc 2003Slide adapted from Columbia Technologies Inc 2003
helliphellipa 3a 3--D View of the CSMD View of the CSM
MIP Response
Discrete Sample Conc
What the technology is capable of in the hands of a sophisticated user
12
13
The MIP Helps ldquoImagerdquo the Location and RelativeThe MIP Helps ldquoImagerdquo the Location and Relative Concentration of Subsurface VOC ContaminationConcentration of Subsurface VOC Contamination
Graphic courtesy ofGraphic courtesy of Columbia TechnologiesColumbia Technologies
MIPECD relative responseMIPECD relative response (in(in microvoltsmicrovolts) traced) traced
against depth for the TCEagainst depth for the TCE contaminantcontaminant
MIP relative responseMIP relative response correlated with results ofcorrelated with results of depthdepth--discrete samplesdiscrete samplesAringAring
Fee
t b
elow
gro
und
su
rfac
eF
eet
bel
ow g
rou
nd s
urf
ace
Direct-push MIP-ECD taking readings every 2 inches going down to create a vertical profile of contamination in the subsurface
Soil conductivity results suggest transitions from sandy matrix to clay matrix (higher conductivity in clayey soil) The 7- to 8-ft wide band of contamination is associated with a clay layer in the subsurface Small discrete GW samples (ie very small sample support) representative of point concentrations were collected using the DP probe and analyzed using GC-MS The results allow coarse calibration (in units of ugL = mass TCE per volume of GW) of the magnitude of the ECD response (in voltage units)
What analytical results (low medium or high lab results) would be expected if a monitoring well were screened over the various intervals in the animation graphic (Keep in mind that clay layers may be rather non-permeable to water flow as compared to sandier layers)
13
14
Analytical Results from Heterogeneous SystemsAnalytical Results from Heterogeneous Systems Are Determined by How Samples Are CollectedAre Determined by How Samples Are Collected
vsvs
WellWellscreenscreen
11
WellWellscreenscreen
22
Depending on screenDepending on screen construction you can getconstruction you can get completely different GWcompletely different GWresults that have nothingresults that have nothing to do with the lab or theto do with the lab or the analytical methodanalytical method
Unless information aboutUnless information about contaminant distributioncontaminant distribution guides well constructionguides well construction GW results can be highlyGW results can be highly variable and difficult tovariable and difficult to interpretinterpret
vsvs 33
Direct-push MIP-ECD taking readings every 2 inches going down to create a vertical profile of contamination in the subsurface
Soil conductivity results suggest transitions from sandy matrix to clay matrix (higher conductivity in clayey soil) The 7- to 8-ft wide band of contamination is associated with a clay layer in the subsurface Small discrete GW samples (ie very small sample support) representative of point concentrations were collected using the DP probe and analyzed using GC-MS The results allow coarse calibration (in units of ugL = mass TCE per volume of GW) of the magnitude of the ECD response (in voltage units)
What analytical results (low medium or high lab results) would be expected if a monitoring well were screened over the various intervals in the animation graphic (Keep in mind that clay layers may be rather non-permeable to water flow as compared to sandier layers)
14
15
Display Options 2Display Options 2--D Representation of a CSMD Representation of a CSM
Slid
e adap
ted from
Colu
mb
ia Tech
nologies In
c 2001
15
16
Display Options Include Discrete Sample ResultsDisplay Options Include Discrete Sample Results
Comparison of GW Samples to Continuous Sensor ProfileComparison of GW Samples to Continuous Sensor Profile
Slide adapted from Columbia Technologies Inc 2003Slide adapted from Columbia Technologies Inc 2003
MIP Response
Discrete SamplemdashTotal Chlorinated VOC Concentration
SMART DATA OUTPUTS
bull Built to client specifications
bull Interactive 3D
bull Easy to view correlation between various data sets
16
17
Membrane Interface Probe informationMembrane Interface Probe information Through Field Analytics Encyclopedia websiteThrough Field Analytics Encyclopedia websit httpwwwclu-inorg
ndashndashhttpwwwclu-inorgchartechnologiesmipcfm
Passive Diffusion Samplers informationPassive Diffusion Samplers information Through ITRC websiteThrough ITRC website httpwwwitrcweborghttpwwwitrcweborg
ndashndash httpdiffusionsampleritrcweborgcommondefaultasphttpdiffusionsampleritrcweborgcommondefaultasp
Related informationRelated information EPAEPA TIOrsquosTIOrsquos CluClu--In website for TriadIn website for Triad httphttpcluinorgcluinorgtriadtriad
ndashndash Assorted sampling informationAssorted sampling information httpcluinorgchar1_educfmsamp_collhttpcluinorgchar1_educfmsamp_collandand httpcluinorgchar1_educfmstat_samphttpcluinorgchar1_educfmstat_samp
ndashndash Archived Triad seminarArchived Triad seminar httpwwwtriadcentralorgnewsdsp_archivecfm USACE Engineering Manuals (USACE Engineering Manuals (EMsEMs)) httpwwwusacearmymilpublicationseng-manualsilS Army Corps CSM Guidance EM EM 1110US Army Corps CSM Guidance EM EM 1110--11--12001200ndashndash US Army Corps TPP Guidance EM EM 200US Army Corps TPP Guidance EM EM 200--11--22
USACE CRREL Technical Report LibraryUSACE CRREL Technical Report Library httphttpwwwcrrelusacearmymilproductsproductshtmlwwwcrrelusacearmymilproductsproductshtml
Additional InformationAdditional Information
17

5
Diffusion Samplers Deployed in WellDiffusion Samplers Deployed in Well(must ensure certain hydrologic conditions are met)(must ensure certain hydrologic conditions are met)
Diffusion Samplers
Weight
Cross Sectional View
Avg Diffusion Sampler size 1 to 2
feet in length
Slide adapted fromSlide adapted from httpwwwclu-inorgchartechnologiespassdiffcfm
That is where the diffusion samplers come in PDB samplers are deployed in the screened interval and allowed to equilibrate After sufficient equilibration the samplers are removed and the enclosed water is transferred to volatile organic analysis (VOA) vials Thereafter the samples are treated as ordinary VOA samples
5
6
From USGS Report 02From USGS Report 02--4203 (2002)4203 (2002)
httppubsusgsgovwriwri024203
Uncontrolled Blurring of Distinct PopulationsUncontrolled Blurring of Distinct Populations Produces InaccurateProduces Inaccurate CSMsCSMs
same well fieldhellip2 different sample collection techniques
Huffman RL (2002) Comparison of Passive Diffusion Bag Samplers and Submersible Pump Sampling Methods for Monitoring Volatile Organic Compounds in Ground Water at Area 6 Naval Air Station Whidbey Island Washington US Geological Survey Water-Resources Investigations Report 02-4203 Available onshyline at httppubsusgsgovwriwri024203
CSM based on traditional sampling is very different from CSM based on more detailed spatially accurate sampling
6
11-DCE
TCA
httpwaterusgsgovpubsw
riwri024203
httpwaterusgsgovpubsw
riwri024203
7
Fro
m U
SG
S R
epor
t 02
Fro
m U
SG
S R
epor
t 02 --
4203
(20
02)
4203
(20
02)
Passive Diffusion Samplers Preserve AnyPassive Diffusion Samplers Preserve Any Vertical Concentration Gradients in the WellVertical Concentration Gradients in the Well
11-DCE
TCA 240
15
~1
~3
Huffman RL (2002) Comparison of Passive Diffusion Bag Samplers and Submersible Pump Sampling Methods for Monitoring Volatile Organic Compounds in Ground Water at Area 6 Naval Air Station Whidbey Island Washington US Geological Survey Water-Resources Investigations Report 02-4203 Available onshyline at httppubsusgsgovwriwri024203
7
8
Membrane Interface Probes (Membrane Interface Probes (MIPsMIPs for for VOCsVOCs))
Direct push rigsDirect push rigs (small trucks)(small trucks)
CPT units (largeCPT units (large 2020--ton trucks)ton trucks)
Drill rigsDrill rigs
Slide adapted from Columbia Technologies Inc 2003Slide adapted from Columbia Technologies Inc 2003
Multiple Platforms for DeploymentMultiple Platforms for Deployment
WaterborneWaterborne AllAll--terrain trackterrain track Indoor orIndoor or
limited accesslimited access
8
9
Direct Sensing ModuleDirect Sensing Module
Slide adapted from Columbia Technologies Inc 2003Slide adapted from Columbia Technologies Inc 2003
9
10
MIP Principles of OperationMIP Principles of Operation Heated probeHeated probe SemiSemi--permeablepermeable
membranemembrane Contaminant vaporsContaminant vapors
ldquofilteredrdquo into carrier gasldquofilteredrdquo into carrier gas Transported to FID PIDTransported to FID PID
ECD ampor MS detectors atECD ampor MS detectors at the surfacethe surface
Results are displayed inResults are displayed in realreal--time on a laptime on a lap--toptopcomputercomputer
Go to clu-inorg Slide adapted from Columbia Technologies Inc 2001Slide adapted from Columbia Technologies Inc 2001
10
11
Direct Sensing Logs Raw Data as TracingsDirect Sensing Logs Raw Data as Tracings
Fine Grain Characteristics
Indication of Ground Water
Discrete Petroleum
Slide adapted from
Colum
bia Technologies Inc 2003
Slide adapted from
Colum
bia Technologies Inc 2003
Converted by sophisticated software intohellipConverted by sophisticated software intohellip
11
12
Still frame from a 3D Video of Plume vs GW WellsStill frame from a 3D Video of Plume vs GW Wells
Slide adapted from Columbia Technologies Inc 2003Slide adapted from Columbia Technologies Inc 2003
helliphellipa 3a 3--D View of the CSMD View of the CSM
MIP Response
Discrete Sample Conc
What the technology is capable of in the hands of a sophisticated user
12
13
The MIP Helps ldquoImagerdquo the Location and RelativeThe MIP Helps ldquoImagerdquo the Location and Relative Concentration of Subsurface VOC ContaminationConcentration of Subsurface VOC Contamination
Graphic courtesy ofGraphic courtesy of Columbia TechnologiesColumbia Technologies
MIPECD relative responseMIPECD relative response (in(in microvoltsmicrovolts) traced) traced
against depth for the TCEagainst depth for the TCE contaminantcontaminant
MIP relative responseMIP relative response correlated with results ofcorrelated with results of depthdepth--discrete samplesdiscrete samplesAringAring
Fee
t b
elow
gro
und
su
rfac
eF
eet
bel
ow g
rou
nd s
urf
ace
Direct-push MIP-ECD taking readings every 2 inches going down to create a vertical profile of contamination in the subsurface
Soil conductivity results suggest transitions from sandy matrix to clay matrix (higher conductivity in clayey soil) The 7- to 8-ft wide band of contamination is associated with a clay layer in the subsurface Small discrete GW samples (ie very small sample support) representative of point concentrations were collected using the DP probe and analyzed using GC-MS The results allow coarse calibration (in units of ugL = mass TCE per volume of GW) of the magnitude of the ECD response (in voltage units)
What analytical results (low medium or high lab results) would be expected if a monitoring well were screened over the various intervals in the animation graphic (Keep in mind that clay layers may be rather non-permeable to water flow as compared to sandier layers)
13
14
Analytical Results from Heterogeneous SystemsAnalytical Results from Heterogeneous Systems Are Determined by How Samples Are CollectedAre Determined by How Samples Are Collected
vsvs
WellWellscreenscreen
11
WellWellscreenscreen
22
Depending on screenDepending on screen construction you can getconstruction you can get completely different GWcompletely different GWresults that have nothingresults that have nothing to do with the lab or theto do with the lab or the analytical methodanalytical method
Unless information aboutUnless information about contaminant distributioncontaminant distribution guides well constructionguides well construction GW results can be highlyGW results can be highly variable and difficult tovariable and difficult to interpretinterpret
vsvs 33
Direct-push MIP-ECD taking readings every 2 inches going down to create a vertical profile of contamination in the subsurface
Soil conductivity results suggest transitions from sandy matrix to clay matrix (higher conductivity in clayey soil) The 7- to 8-ft wide band of contamination is associated with a clay layer in the subsurface Small discrete GW samples (ie very small sample support) representative of point concentrations were collected using the DP probe and analyzed using GC-MS The results allow coarse calibration (in units of ugL = mass TCE per volume of GW) of the magnitude of the ECD response (in voltage units)
What analytical results (low medium or high lab results) would be expected if a monitoring well were screened over the various intervals in the animation graphic (Keep in mind that clay layers may be rather non-permeable to water flow as compared to sandier layers)
14
15
Display Options 2Display Options 2--D Representation of a CSMD Representation of a CSM
Slid
e adap
ted from
Colu
mb
ia Tech
nologies In
c 2001
15
16
Display Options Include Discrete Sample ResultsDisplay Options Include Discrete Sample Results
Comparison of GW Samples to Continuous Sensor ProfileComparison of GW Samples to Continuous Sensor Profile
Slide adapted from Columbia Technologies Inc 2003Slide adapted from Columbia Technologies Inc 2003
MIP Response
Discrete SamplemdashTotal Chlorinated VOC Concentration
SMART DATA OUTPUTS
bull Built to client specifications
bull Interactive 3D
bull Easy to view correlation between various data sets
16
17
Membrane Interface Probe informationMembrane Interface Probe information Through Field Analytics Encyclopedia websiteThrough Field Analytics Encyclopedia websit httpwwwclu-inorg
ndashndashhttpwwwclu-inorgchartechnologiesmipcfm
Passive Diffusion Samplers informationPassive Diffusion Samplers information Through ITRC websiteThrough ITRC website httpwwwitrcweborghttpwwwitrcweborg
ndashndash httpdiffusionsampleritrcweborgcommondefaultasphttpdiffusionsampleritrcweborgcommondefaultasp
Related informationRelated information EPAEPA TIOrsquosTIOrsquos CluClu--In website for TriadIn website for Triad httphttpcluinorgcluinorgtriadtriad
ndashndash Assorted sampling informationAssorted sampling information httpcluinorgchar1_educfmsamp_collhttpcluinorgchar1_educfmsamp_collandand httpcluinorgchar1_educfmstat_samphttpcluinorgchar1_educfmstat_samp
ndashndash Archived Triad seminarArchived Triad seminar httpwwwtriadcentralorgnewsdsp_archivecfm USACE Engineering Manuals (USACE Engineering Manuals (EMsEMs)) httpwwwusacearmymilpublicationseng-manualsilS Army Corps CSM Guidance EM EM 1110US Army Corps CSM Guidance EM EM 1110--11--12001200ndashndash US Army Corps TPP Guidance EM EM 200US Army Corps TPP Guidance EM EM 200--11--22
USACE CRREL Technical Report LibraryUSACE CRREL Technical Report Library httphttpwwwcrrelusacearmymilproductsproductshtmlwwwcrrelusacearmymilproductsproductshtml
Additional InformationAdditional Information
17

6
From USGS Report 02From USGS Report 02--4203 (2002)4203 (2002)
httppubsusgsgovwriwri024203
Uncontrolled Blurring of Distinct PopulationsUncontrolled Blurring of Distinct Populations Produces InaccurateProduces Inaccurate CSMsCSMs
same well fieldhellip2 different sample collection techniques
Huffman RL (2002) Comparison of Passive Diffusion Bag Samplers and Submersible Pump Sampling Methods for Monitoring Volatile Organic Compounds in Ground Water at Area 6 Naval Air Station Whidbey Island Washington US Geological Survey Water-Resources Investigations Report 02-4203 Available onshyline at httppubsusgsgovwriwri024203
CSM based on traditional sampling is very different from CSM based on more detailed spatially accurate sampling
6
11-DCE
TCA
httpwaterusgsgovpubsw
riwri024203
httpwaterusgsgovpubsw
riwri024203
7
Fro
m U
SG
S R
epor
t 02
Fro
m U
SG
S R
epor
t 02 --
4203
(20
02)
4203
(20
02)
Passive Diffusion Samplers Preserve AnyPassive Diffusion Samplers Preserve Any Vertical Concentration Gradients in the WellVertical Concentration Gradients in the Well
11-DCE
TCA 240
15
~1
~3
Huffman RL (2002) Comparison of Passive Diffusion Bag Samplers and Submersible Pump Sampling Methods for Monitoring Volatile Organic Compounds in Ground Water at Area 6 Naval Air Station Whidbey Island Washington US Geological Survey Water-Resources Investigations Report 02-4203 Available onshyline at httppubsusgsgovwriwri024203
7
8
Membrane Interface Probes (Membrane Interface Probes (MIPsMIPs for for VOCsVOCs))
Direct push rigsDirect push rigs (small trucks)(small trucks)
CPT units (largeCPT units (large 2020--ton trucks)ton trucks)
Drill rigsDrill rigs
Slide adapted from Columbia Technologies Inc 2003Slide adapted from Columbia Technologies Inc 2003
Multiple Platforms for DeploymentMultiple Platforms for Deployment
WaterborneWaterborne AllAll--terrain trackterrain track Indoor orIndoor or
limited accesslimited access
8
9
Direct Sensing ModuleDirect Sensing Module
Slide adapted from Columbia Technologies Inc 2003Slide adapted from Columbia Technologies Inc 2003
9
10
MIP Principles of OperationMIP Principles of Operation Heated probeHeated probe SemiSemi--permeablepermeable
membranemembrane Contaminant vaporsContaminant vapors
ldquofilteredrdquo into carrier gasldquofilteredrdquo into carrier gas Transported to FID PIDTransported to FID PID
ECD ampor MS detectors atECD ampor MS detectors at the surfacethe surface
Results are displayed inResults are displayed in realreal--time on a laptime on a lap--toptopcomputercomputer
Go to clu-inorg Slide adapted from Columbia Technologies Inc 2001Slide adapted from Columbia Technologies Inc 2001
10
11
Direct Sensing Logs Raw Data as TracingsDirect Sensing Logs Raw Data as Tracings
Fine Grain Characteristics
Indication of Ground Water
Discrete Petroleum
Slide adapted from
Colum
bia Technologies Inc 2003
Slide adapted from
Colum
bia Technologies Inc 2003
Converted by sophisticated software intohellipConverted by sophisticated software intohellip
11
12
Still frame from a 3D Video of Plume vs GW WellsStill frame from a 3D Video of Plume vs GW Wells
Slide adapted from Columbia Technologies Inc 2003Slide adapted from Columbia Technologies Inc 2003
helliphellipa 3a 3--D View of the CSMD View of the CSM
MIP Response
Discrete Sample Conc
What the technology is capable of in the hands of a sophisticated user
12
13
The MIP Helps ldquoImagerdquo the Location and RelativeThe MIP Helps ldquoImagerdquo the Location and Relative Concentration of Subsurface VOC ContaminationConcentration of Subsurface VOC Contamination
Graphic courtesy ofGraphic courtesy of Columbia TechnologiesColumbia Technologies
MIPECD relative responseMIPECD relative response (in(in microvoltsmicrovolts) traced) traced
against depth for the TCEagainst depth for the TCE contaminantcontaminant
MIP relative responseMIP relative response correlated with results ofcorrelated with results of depthdepth--discrete samplesdiscrete samplesAringAring
Fee
t b
elow
gro
und
su
rfac
eF
eet
bel
ow g
rou
nd s
urf
ace
Direct-push MIP-ECD taking readings every 2 inches going down to create a vertical profile of contamination in the subsurface
Soil conductivity results suggest transitions from sandy matrix to clay matrix (higher conductivity in clayey soil) The 7- to 8-ft wide band of contamination is associated with a clay layer in the subsurface Small discrete GW samples (ie very small sample support) representative of point concentrations were collected using the DP probe and analyzed using GC-MS The results allow coarse calibration (in units of ugL = mass TCE per volume of GW) of the magnitude of the ECD response (in voltage units)
What analytical results (low medium or high lab results) would be expected if a monitoring well were screened over the various intervals in the animation graphic (Keep in mind that clay layers may be rather non-permeable to water flow as compared to sandier layers)
13
14
Analytical Results from Heterogeneous SystemsAnalytical Results from Heterogeneous Systems Are Determined by How Samples Are CollectedAre Determined by How Samples Are Collected
vsvs
WellWellscreenscreen
11
WellWellscreenscreen
22
Depending on screenDepending on screen construction you can getconstruction you can get completely different GWcompletely different GWresults that have nothingresults that have nothing to do with the lab or theto do with the lab or the analytical methodanalytical method
Unless information aboutUnless information about contaminant distributioncontaminant distribution guides well constructionguides well construction GW results can be highlyGW results can be highly variable and difficult tovariable and difficult to interpretinterpret
vsvs 33
Direct-push MIP-ECD taking readings every 2 inches going down to create a vertical profile of contamination in the subsurface
Soil conductivity results suggest transitions from sandy matrix to clay matrix (higher conductivity in clayey soil) The 7- to 8-ft wide band of contamination is associated with a clay layer in the subsurface Small discrete GW samples (ie very small sample support) representative of point concentrations were collected using the DP probe and analyzed using GC-MS The results allow coarse calibration (in units of ugL = mass TCE per volume of GW) of the magnitude of the ECD response (in voltage units)
What analytical results (low medium or high lab results) would be expected if a monitoring well were screened over the various intervals in the animation graphic (Keep in mind that clay layers may be rather non-permeable to water flow as compared to sandier layers)
14
15
Display Options 2Display Options 2--D Representation of a CSMD Representation of a CSM
Slid
e adap
ted from
Colu
mb
ia Tech
nologies In
c 2001
15
16
Display Options Include Discrete Sample ResultsDisplay Options Include Discrete Sample Results
Comparison of GW Samples to Continuous Sensor ProfileComparison of GW Samples to Continuous Sensor Profile
Slide adapted from Columbia Technologies Inc 2003Slide adapted from Columbia Technologies Inc 2003
MIP Response
Discrete SamplemdashTotal Chlorinated VOC Concentration
SMART DATA OUTPUTS
bull Built to client specifications
bull Interactive 3D
bull Easy to view correlation between various data sets
16
17
Membrane Interface Probe informationMembrane Interface Probe information Through Field Analytics Encyclopedia websiteThrough Field Analytics Encyclopedia websit httpwwwclu-inorg
ndashndashhttpwwwclu-inorgchartechnologiesmipcfm
Passive Diffusion Samplers informationPassive Diffusion Samplers information Through ITRC websiteThrough ITRC website httpwwwitrcweborghttpwwwitrcweborg
ndashndash httpdiffusionsampleritrcweborgcommondefaultasphttpdiffusionsampleritrcweborgcommondefaultasp
Related informationRelated information EPAEPA TIOrsquosTIOrsquos CluClu--In website for TriadIn website for Triad httphttpcluinorgcluinorgtriadtriad
ndashndash Assorted sampling informationAssorted sampling information httpcluinorgchar1_educfmsamp_collhttpcluinorgchar1_educfmsamp_collandand httpcluinorgchar1_educfmstat_samphttpcluinorgchar1_educfmstat_samp
ndashndash Archived Triad seminarArchived Triad seminar httpwwwtriadcentralorgnewsdsp_archivecfm USACE Engineering Manuals (USACE Engineering Manuals (EMsEMs)) httpwwwusacearmymilpublicationseng-manualsilS Army Corps CSM Guidance EM EM 1110US Army Corps CSM Guidance EM EM 1110--11--12001200ndashndash US Army Corps TPP Guidance EM EM 200US Army Corps TPP Guidance EM EM 200--11--22
USACE CRREL Technical Report LibraryUSACE CRREL Technical Report Library httphttpwwwcrrelusacearmymilproductsproductshtmlwwwcrrelusacearmymilproductsproductshtml
Additional InformationAdditional Information
17
11-DCE
TCA
httpwaterusgsgovpubsw
riwri024203
httpwaterusgsgovpubsw
riwri024203
7
Fro
m U
SG
S R
epor
t 02
Fro
m U
SG
S R
epor
t 02 --
4203
(20
02)
4203
(20
02)
Passive Diffusion Samplers Preserve AnyPassive Diffusion Samplers Preserve Any Vertical Concentration Gradients in the WellVertical Concentration Gradients in the Well
11-DCE
TCA 240
15
~1
~3
Huffman RL (2002) Comparison of Passive Diffusion Bag Samplers and Submersible Pump Sampling Methods for Monitoring Volatile Organic Compounds in Ground Water at Area 6 Naval Air Station Whidbey Island Washington US Geological Survey Water-Resources Investigations Report 02-4203 Available onshyline at httppubsusgsgovwriwri024203
7
8
Membrane Interface Probes (Membrane Interface Probes (MIPsMIPs for for VOCsVOCs))
Direct push rigsDirect push rigs (small trucks)(small trucks)
CPT units (largeCPT units (large 2020--ton trucks)ton trucks)
Drill rigsDrill rigs
Slide adapted from Columbia Technologies Inc 2003Slide adapted from Columbia Technologies Inc 2003
Multiple Platforms for DeploymentMultiple Platforms for Deployment
WaterborneWaterborne AllAll--terrain trackterrain track Indoor orIndoor or
limited accesslimited access
8
9
Direct Sensing ModuleDirect Sensing Module
Slide adapted from Columbia Technologies Inc 2003Slide adapted from Columbia Technologies Inc 2003
9
10
MIP Principles of OperationMIP Principles of Operation Heated probeHeated probe SemiSemi--permeablepermeable
membranemembrane Contaminant vaporsContaminant vapors
ldquofilteredrdquo into carrier gasldquofilteredrdquo into carrier gas Transported to FID PIDTransported to FID PID
ECD ampor MS detectors atECD ampor MS detectors at the surfacethe surface
Results are displayed inResults are displayed in realreal--time on a laptime on a lap--toptopcomputercomputer
Go to clu-inorg Slide adapted from Columbia Technologies Inc 2001Slide adapted from Columbia Technologies Inc 2001
10
11
Direct Sensing Logs Raw Data as TracingsDirect Sensing Logs Raw Data as Tracings
Fine Grain Characteristics
Indication of Ground Water
Discrete Petroleum
Slide adapted from
Colum
bia Technologies Inc 2003
Slide adapted from
Colum
bia Technologies Inc 2003
Converted by sophisticated software intohellipConverted by sophisticated software intohellip
11
12
Still frame from a 3D Video of Plume vs GW WellsStill frame from a 3D Video of Plume vs GW Wells
Slide adapted from Columbia Technologies Inc 2003Slide adapted from Columbia Technologies Inc 2003
helliphellipa 3a 3--D View of the CSMD View of the CSM
MIP Response
Discrete Sample Conc
What the technology is capable of in the hands of a sophisticated user
12
13
The MIP Helps ldquoImagerdquo the Location and RelativeThe MIP Helps ldquoImagerdquo the Location and Relative Concentration of Subsurface VOC ContaminationConcentration of Subsurface VOC Contamination
Graphic courtesy ofGraphic courtesy of Columbia TechnologiesColumbia Technologies
MIPECD relative responseMIPECD relative response (in(in microvoltsmicrovolts) traced) traced
against depth for the TCEagainst depth for the TCE contaminantcontaminant
MIP relative responseMIP relative response correlated with results ofcorrelated with results of depthdepth--discrete samplesdiscrete samplesAringAring
Fee
t b
elow
gro
und
su
rfac
eF
eet
bel
ow g
rou
nd s
urf
ace
Direct-push MIP-ECD taking readings every 2 inches going down to create a vertical profile of contamination in the subsurface
Soil conductivity results suggest transitions from sandy matrix to clay matrix (higher conductivity in clayey soil) The 7- to 8-ft wide band of contamination is associated with a clay layer in the subsurface Small discrete GW samples (ie very small sample support) representative of point concentrations were collected using the DP probe and analyzed using GC-MS The results allow coarse calibration (in units of ugL = mass TCE per volume of GW) of the magnitude of the ECD response (in voltage units)
What analytical results (low medium or high lab results) would be expected if a monitoring well were screened over the various intervals in the animation graphic (Keep in mind that clay layers may be rather non-permeable to water flow as compared to sandier layers)
13
14
Analytical Results from Heterogeneous SystemsAnalytical Results from Heterogeneous Systems Are Determined by How Samples Are CollectedAre Determined by How Samples Are Collected
vsvs
WellWellscreenscreen
11
WellWellscreenscreen
22
Depending on screenDepending on screen construction you can getconstruction you can get completely different GWcompletely different GWresults that have nothingresults that have nothing to do with the lab or theto do with the lab or the analytical methodanalytical method
Unless information aboutUnless information about contaminant distributioncontaminant distribution guides well constructionguides well construction GW results can be highlyGW results can be highly variable and difficult tovariable and difficult to interpretinterpret
vsvs 33
Direct-push MIP-ECD taking readings every 2 inches going down to create a vertical profile of contamination in the subsurface
Soil conductivity results suggest transitions from sandy matrix to clay matrix (higher conductivity in clayey soil) The 7- to 8-ft wide band of contamination is associated with a clay layer in the subsurface Small discrete GW samples (ie very small sample support) representative of point concentrations were collected using the DP probe and analyzed using GC-MS The results allow coarse calibration (in units of ugL = mass TCE per volume of GW) of the magnitude of the ECD response (in voltage units)
What analytical results (low medium or high lab results) would be expected if a monitoring well were screened over the various intervals in the animation graphic (Keep in mind that clay layers may be rather non-permeable to water flow as compared to sandier layers)
14
15
Display Options 2Display Options 2--D Representation of a CSMD Representation of a CSM
Slid
e adap
ted from
Colu
mb
ia Tech
nologies In
c 2001
15
16
Display Options Include Discrete Sample ResultsDisplay Options Include Discrete Sample Results
Comparison of GW Samples to Continuous Sensor ProfileComparison of GW Samples to Continuous Sensor Profile
Slide adapted from Columbia Technologies Inc 2003Slide adapted from Columbia Technologies Inc 2003
MIP Response
Discrete SamplemdashTotal Chlorinated VOC Concentration
SMART DATA OUTPUTS
bull Built to client specifications
bull Interactive 3D
bull Easy to view correlation between various data sets
16
17
Membrane Interface Probe informationMembrane Interface Probe information Through Field Analytics Encyclopedia websiteThrough Field Analytics Encyclopedia websit httpwwwclu-inorg
ndashndashhttpwwwclu-inorgchartechnologiesmipcfm
Passive Diffusion Samplers informationPassive Diffusion Samplers information Through ITRC websiteThrough ITRC website httpwwwitrcweborghttpwwwitrcweborg
ndashndash httpdiffusionsampleritrcweborgcommondefaultasphttpdiffusionsampleritrcweborgcommondefaultasp
Related informationRelated information EPAEPA TIOrsquosTIOrsquos CluClu--In website for TriadIn website for Triad httphttpcluinorgcluinorgtriadtriad
ndashndash Assorted sampling informationAssorted sampling information httpcluinorgchar1_educfmsamp_collhttpcluinorgchar1_educfmsamp_collandand httpcluinorgchar1_educfmstat_samphttpcluinorgchar1_educfmstat_samp
ndashndash Archived Triad seminarArchived Triad seminar httpwwwtriadcentralorgnewsdsp_archivecfm USACE Engineering Manuals (USACE Engineering Manuals (EMsEMs)) httpwwwusacearmymilpublicationseng-manualsilS Army Corps CSM Guidance EM EM 1110US Army Corps CSM Guidance EM EM 1110--11--12001200ndashndash US Army Corps TPP Guidance EM EM 200US Army Corps TPP Guidance EM EM 200--11--22
USACE CRREL Technical Report LibraryUSACE CRREL Technical Report Library httphttpwwwcrrelusacearmymilproductsproductshtmlwwwcrrelusacearmymilproductsproductshtml
Additional InformationAdditional Information
17
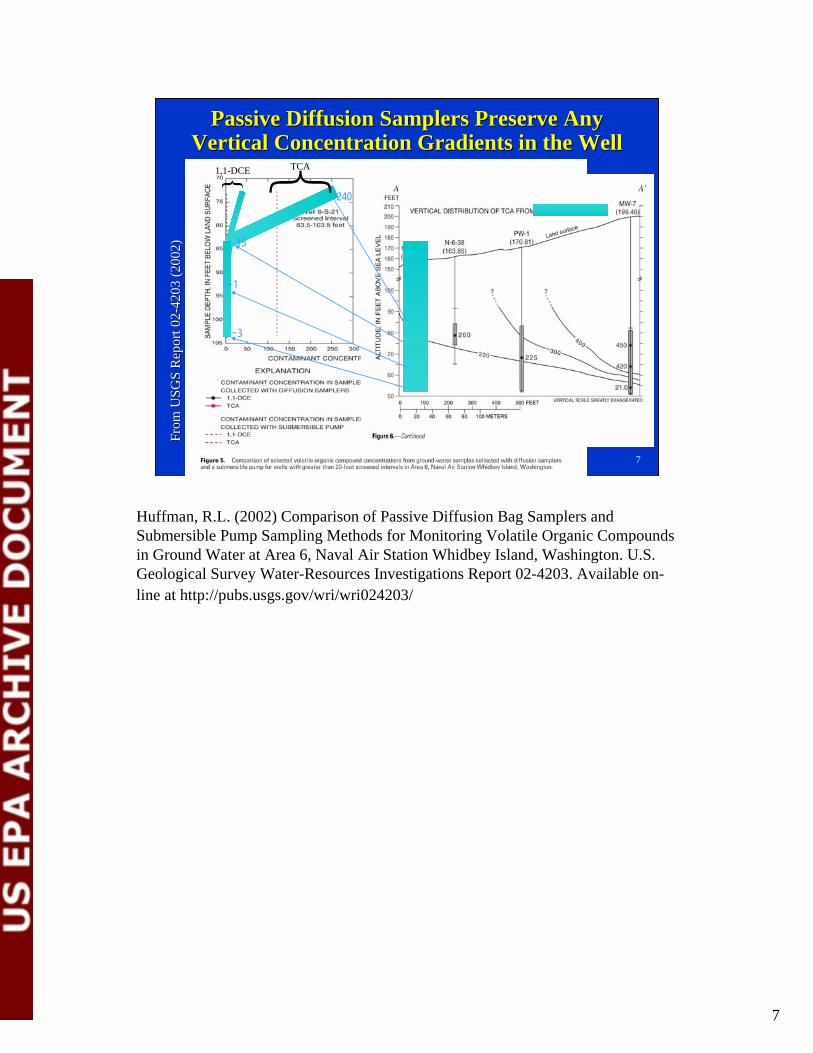
8
Membrane Interface Probes (Membrane Interface Probes (MIPsMIPs for for VOCsVOCs))
Direct push rigsDirect push rigs (small trucks)(small trucks)
CPT units (largeCPT units (large 2020--ton trucks)ton trucks)
Drill rigsDrill rigs
Slide adapted from Columbia Technologies Inc 2003Slide adapted from Columbia Technologies Inc 2003
Multiple Platforms for DeploymentMultiple Platforms for Deployment
WaterborneWaterborne AllAll--terrain trackterrain track Indoor orIndoor or
limited accesslimited access
8
9
Direct Sensing ModuleDirect Sensing Module
Slide adapted from Columbia Technologies Inc 2003Slide adapted from Columbia Technologies Inc 2003
9
10
MIP Principles of OperationMIP Principles of Operation Heated probeHeated probe SemiSemi--permeablepermeable
membranemembrane Contaminant vaporsContaminant vapors
ldquofilteredrdquo into carrier gasldquofilteredrdquo into carrier gas Transported to FID PIDTransported to FID PID
ECD ampor MS detectors atECD ampor MS detectors at the surfacethe surface
Results are displayed inResults are displayed in realreal--time on a laptime on a lap--toptopcomputercomputer
Go to clu-inorg Slide adapted from Columbia Technologies Inc 2001Slide adapted from Columbia Technologies Inc 2001
10
11
Direct Sensing Logs Raw Data as TracingsDirect Sensing Logs Raw Data as Tracings
Fine Grain Characteristics
Indication of Ground Water
Discrete Petroleum
Slide adapted from
Colum
bia Technologies Inc 2003
Slide adapted from
Colum
bia Technologies Inc 2003
Converted by sophisticated software intohellipConverted by sophisticated software intohellip
11
12
Still frame from a 3D Video of Plume vs GW WellsStill frame from a 3D Video of Plume vs GW Wells
Slide adapted from Columbia Technologies Inc 2003Slide adapted from Columbia Technologies Inc 2003
helliphellipa 3a 3--D View of the CSMD View of the CSM
MIP Response
Discrete Sample Conc
What the technology is capable of in the hands of a sophisticated user
12
13
The MIP Helps ldquoImagerdquo the Location and RelativeThe MIP Helps ldquoImagerdquo the Location and Relative Concentration of Subsurface VOC ContaminationConcentration of Subsurface VOC Contamination
Graphic courtesy ofGraphic courtesy of Columbia TechnologiesColumbia Technologies
MIPECD relative responseMIPECD relative response (in(in microvoltsmicrovolts) traced) traced
against depth for the TCEagainst depth for the TCE contaminantcontaminant
MIP relative responseMIP relative response correlated with results ofcorrelated with results of depthdepth--discrete samplesdiscrete samplesAringAring
Fee
t b
elow
gro
und
su
rfac
eF
eet
bel
ow g
rou
nd s
urf
ace
Direct-push MIP-ECD taking readings every 2 inches going down to create a vertical profile of contamination in the subsurface
Soil conductivity results suggest transitions from sandy matrix to clay matrix (higher conductivity in clayey soil) The 7- to 8-ft wide band of contamination is associated with a clay layer in the subsurface Small discrete GW samples (ie very small sample support) representative of point concentrations were collected using the DP probe and analyzed using GC-MS The results allow coarse calibration (in units of ugL = mass TCE per volume of GW) of the magnitude of the ECD response (in voltage units)
What analytical results (low medium or high lab results) would be expected if a monitoring well were screened over the various intervals in the animation graphic (Keep in mind that clay layers may be rather non-permeable to water flow as compared to sandier layers)
13
14
Analytical Results from Heterogeneous SystemsAnalytical Results from Heterogeneous Systems Are Determined by How Samples Are CollectedAre Determined by How Samples Are Collected
vsvs
WellWellscreenscreen
11
WellWellscreenscreen
22
Depending on screenDepending on screen construction you can getconstruction you can get completely different GWcompletely different GWresults that have nothingresults that have nothing to do with the lab or theto do with the lab or the analytical methodanalytical method
Unless information aboutUnless information about contaminant distributioncontaminant distribution guides well constructionguides well construction GW results can be highlyGW results can be highly variable and difficult tovariable and difficult to interpretinterpret
vsvs 33
Direct-push MIP-ECD taking readings every 2 inches going down to create a vertical profile of contamination in the subsurface
Soil conductivity results suggest transitions from sandy matrix to clay matrix (higher conductivity in clayey soil) The 7- to 8-ft wide band of contamination is associated with a clay layer in the subsurface Small discrete GW samples (ie very small sample support) representative of point concentrations were collected using the DP probe and analyzed using GC-MS The results allow coarse calibration (in units of ugL = mass TCE per volume of GW) of the magnitude of the ECD response (in voltage units)
What analytical results (low medium or high lab results) would be expected if a monitoring well were screened over the various intervals in the animation graphic (Keep in mind that clay layers may be rather non-permeable to water flow as compared to sandier layers)
14
15
Display Options 2Display Options 2--D Representation of a CSMD Representation of a CSM
Slid
e adap
ted from
Colu
mb
ia Tech
nologies In
c 2001
15
16
Display Options Include Discrete Sample ResultsDisplay Options Include Discrete Sample Results
Comparison of GW Samples to Continuous Sensor ProfileComparison of GW Samples to Continuous Sensor Profile
Slide adapted from Columbia Technologies Inc 2003Slide adapted from Columbia Technologies Inc 2003
MIP Response
Discrete SamplemdashTotal Chlorinated VOC Concentration
SMART DATA OUTPUTS
bull Built to client specifications
bull Interactive 3D
bull Easy to view correlation between various data sets
16
17
Membrane Interface Probe informationMembrane Interface Probe information Through Field Analytics Encyclopedia websiteThrough Field Analytics Encyclopedia websit httpwwwclu-inorg
ndashndashhttpwwwclu-inorgchartechnologiesmipcfm
Passive Diffusion Samplers informationPassive Diffusion Samplers information Through ITRC websiteThrough ITRC website httpwwwitrcweborghttpwwwitrcweborg
ndashndash httpdiffusionsampleritrcweborgcommondefaultasphttpdiffusionsampleritrcweborgcommondefaultasp
Related informationRelated information EPAEPA TIOrsquosTIOrsquos CluClu--In website for TriadIn website for Triad httphttpcluinorgcluinorgtriadtriad
ndashndash Assorted sampling informationAssorted sampling information httpcluinorgchar1_educfmsamp_collhttpcluinorgchar1_educfmsamp_collandand httpcluinorgchar1_educfmstat_samphttpcluinorgchar1_educfmstat_samp
ndashndash Archived Triad seminarArchived Triad seminar httpwwwtriadcentralorgnewsdsp_archivecfm USACE Engineering Manuals (USACE Engineering Manuals (EMsEMs)) httpwwwusacearmymilpublicationseng-manualsilS Army Corps CSM Guidance EM EM 1110US Army Corps CSM Guidance EM EM 1110--11--12001200ndashndash US Army Corps TPP Guidance EM EM 200US Army Corps TPP Guidance EM EM 200--11--22
USACE CRREL Technical Report LibraryUSACE CRREL Technical Report Library httphttpwwwcrrelusacearmymilproductsproductshtmlwwwcrrelusacearmymilproductsproductshtml
Additional InformationAdditional Information
17

9
Direct Sensing ModuleDirect Sensing Module
Slide adapted from Columbia Technologies Inc 2003Slide adapted from Columbia Technologies Inc 2003
9
10
MIP Principles of OperationMIP Principles of Operation Heated probeHeated probe SemiSemi--permeablepermeable
membranemembrane Contaminant vaporsContaminant vapors
ldquofilteredrdquo into carrier gasldquofilteredrdquo into carrier gas Transported to FID PIDTransported to FID PID
ECD ampor MS detectors atECD ampor MS detectors at the surfacethe surface
Results are displayed inResults are displayed in realreal--time on a laptime on a lap--toptopcomputercomputer
Go to clu-inorg Slide adapted from Columbia Technologies Inc 2001Slide adapted from Columbia Technologies Inc 2001
10
11
Direct Sensing Logs Raw Data as TracingsDirect Sensing Logs Raw Data as Tracings
Fine Grain Characteristics
Indication of Ground Water
Discrete Petroleum
Slide adapted from
Colum
bia Technologies Inc 2003
Slide adapted from
Colum
bia Technologies Inc 2003
Converted by sophisticated software intohellipConverted by sophisticated software intohellip
11
12
Still frame from a 3D Video of Plume vs GW WellsStill frame from a 3D Video of Plume vs GW Wells
Slide adapted from Columbia Technologies Inc 2003Slide adapted from Columbia Technologies Inc 2003
helliphellipa 3a 3--D View of the CSMD View of the CSM
MIP Response
Discrete Sample Conc
What the technology is capable of in the hands of a sophisticated user
12
13
The MIP Helps ldquoImagerdquo the Location and RelativeThe MIP Helps ldquoImagerdquo the Location and Relative Concentration of Subsurface VOC ContaminationConcentration of Subsurface VOC Contamination
Graphic courtesy ofGraphic courtesy of Columbia TechnologiesColumbia Technologies
MIPECD relative responseMIPECD relative response (in(in microvoltsmicrovolts) traced) traced
against depth for the TCEagainst depth for the TCE contaminantcontaminant
MIP relative responseMIP relative response correlated with results ofcorrelated with results of depthdepth--discrete samplesdiscrete samplesAringAring
Fee
t b
elow
gro
und
su
rfac
eF
eet
bel
ow g
rou
nd s
urf
ace
Direct-push MIP-ECD taking readings every 2 inches going down to create a vertical profile of contamination in the subsurface
Soil conductivity results suggest transitions from sandy matrix to clay matrix (higher conductivity in clayey soil) The 7- to 8-ft wide band of contamination is associated with a clay layer in the subsurface Small discrete GW samples (ie very small sample support) representative of point concentrations were collected using the DP probe and analyzed using GC-MS The results allow coarse calibration (in units of ugL = mass TCE per volume of GW) of the magnitude of the ECD response (in voltage units)
What analytical results (low medium or high lab results) would be expected if a monitoring well were screened over the various intervals in the animation graphic (Keep in mind that clay layers may be rather non-permeable to water flow as compared to sandier layers)
13
14
Analytical Results from Heterogeneous SystemsAnalytical Results from Heterogeneous Systems Are Determined by How Samples Are CollectedAre Determined by How Samples Are Collected
vsvs
WellWellscreenscreen
11
WellWellscreenscreen
22
Depending on screenDepending on screen construction you can getconstruction you can get completely different GWcompletely different GWresults that have nothingresults that have nothing to do with the lab or theto do with the lab or the analytical methodanalytical method
Unless information aboutUnless information about contaminant distributioncontaminant distribution guides well constructionguides well construction GW results can be highlyGW results can be highly variable and difficult tovariable and difficult to interpretinterpret
vsvs 33
Direct-push MIP-ECD taking readings every 2 inches going down to create a vertical profile of contamination in the subsurface
Soil conductivity results suggest transitions from sandy matrix to clay matrix (higher conductivity in clayey soil) The 7- to 8-ft wide band of contamination is associated with a clay layer in the subsurface Small discrete GW samples (ie very small sample support) representative of point concentrations were collected using the DP probe and analyzed using GC-MS The results allow coarse calibration (in units of ugL = mass TCE per volume of GW) of the magnitude of the ECD response (in voltage units)
What analytical results (low medium or high lab results) would be expected if a monitoring well were screened over the various intervals in the animation graphic (Keep in mind that clay layers may be rather non-permeable to water flow as compared to sandier layers)
14
15
Display Options 2Display Options 2--D Representation of a CSMD Representation of a CSM
Slid
e adap
ted from
Colu
mb
ia Tech
nologies In
c 2001
15
16
Display Options Include Discrete Sample ResultsDisplay Options Include Discrete Sample Results
Comparison of GW Samples to Continuous Sensor ProfileComparison of GW Samples to Continuous Sensor Profile
Slide adapted from Columbia Technologies Inc 2003Slide adapted from Columbia Technologies Inc 2003
MIP Response
Discrete SamplemdashTotal Chlorinated VOC Concentration
SMART DATA OUTPUTS
bull Built to client specifications
bull Interactive 3D
bull Easy to view correlation between various data sets
16
17
Membrane Interface Probe informationMembrane Interface Probe information Through Field Analytics Encyclopedia websiteThrough Field Analytics Encyclopedia websit httpwwwclu-inorg
ndashndashhttpwwwclu-inorgchartechnologiesmipcfm
Passive Diffusion Samplers informationPassive Diffusion Samplers information Through ITRC websiteThrough ITRC website httpwwwitrcweborghttpwwwitrcweborg
ndashndash httpdiffusionsampleritrcweborgcommondefaultasphttpdiffusionsampleritrcweborgcommondefaultasp
Related informationRelated information EPAEPA TIOrsquosTIOrsquos CluClu--In website for TriadIn website for Triad httphttpcluinorgcluinorgtriadtriad
ndashndash Assorted sampling informationAssorted sampling information httpcluinorgchar1_educfmsamp_collhttpcluinorgchar1_educfmsamp_collandand httpcluinorgchar1_educfmstat_samphttpcluinorgchar1_educfmstat_samp
ndashndash Archived Triad seminarArchived Triad seminar httpwwwtriadcentralorgnewsdsp_archivecfm USACE Engineering Manuals (USACE Engineering Manuals (EMsEMs)) httpwwwusacearmymilpublicationseng-manualsilS Army Corps CSM Guidance EM EM 1110US Army Corps CSM Guidance EM EM 1110--11--12001200ndashndash US Army Corps TPP Guidance EM EM 200US Army Corps TPP Guidance EM EM 200--11--22
USACE CRREL Technical Report LibraryUSACE CRREL Technical Report Library httphttpwwwcrrelusacearmymilproductsproductshtmlwwwcrrelusacearmymilproductsproductshtml
Additional InformationAdditional Information
17
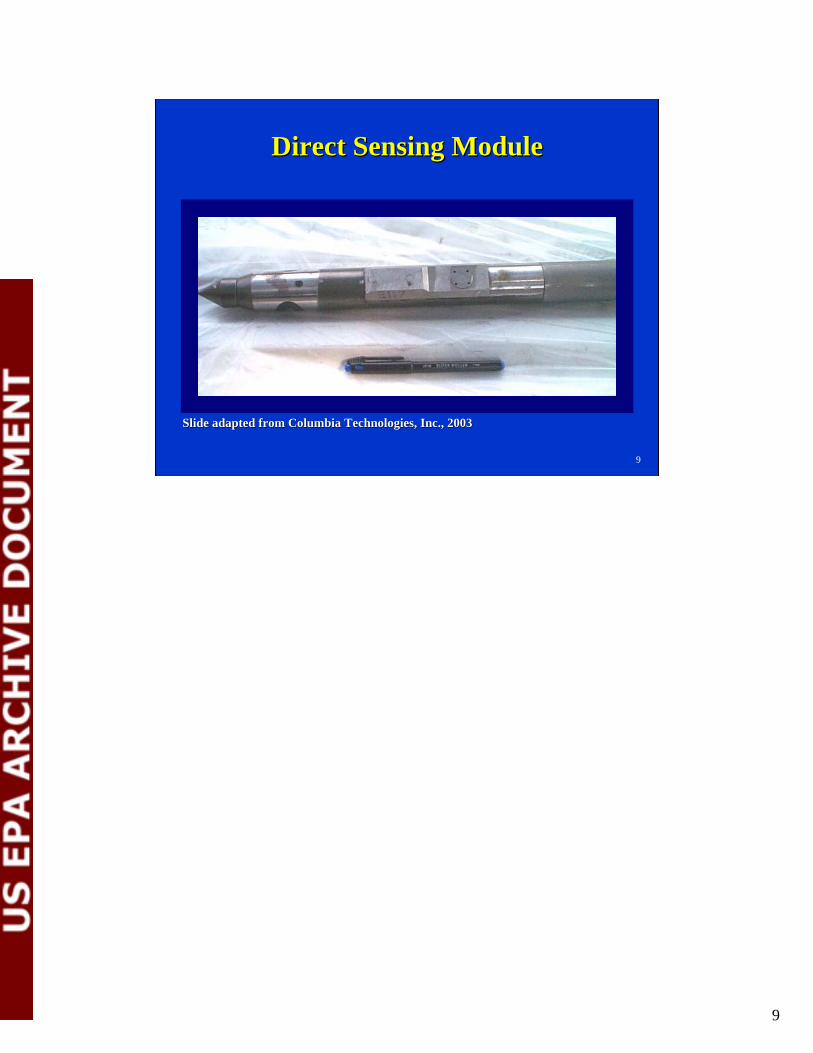
10
MIP Principles of OperationMIP Principles of Operation Heated probeHeated probe SemiSemi--permeablepermeable
membranemembrane Contaminant vaporsContaminant vapors
ldquofilteredrdquo into carrier gasldquofilteredrdquo into carrier gas Transported to FID PIDTransported to FID PID
ECD ampor MS detectors atECD ampor MS detectors at the surfacethe surface
Results are displayed inResults are displayed in realreal--time on a laptime on a lap--toptopcomputercomputer
Go to clu-inorg Slide adapted from Columbia Technologies Inc 2001Slide adapted from Columbia Technologies Inc 2001
10
11
Direct Sensing Logs Raw Data as TracingsDirect Sensing Logs Raw Data as Tracings
Fine Grain Characteristics
Indication of Ground Water
Discrete Petroleum
Slide adapted from
Colum
bia Technologies Inc 2003
Slide adapted from
Colum
bia Technologies Inc 2003
Converted by sophisticated software intohellipConverted by sophisticated software intohellip
11
12
Still frame from a 3D Video of Plume vs GW WellsStill frame from a 3D Video of Plume vs GW Wells
Slide adapted from Columbia Technologies Inc 2003Slide adapted from Columbia Technologies Inc 2003
helliphellipa 3a 3--D View of the CSMD View of the CSM
MIP Response
Discrete Sample Conc
What the technology is capable of in the hands of a sophisticated user
12
13
The MIP Helps ldquoImagerdquo the Location and RelativeThe MIP Helps ldquoImagerdquo the Location and Relative Concentration of Subsurface VOC ContaminationConcentration of Subsurface VOC Contamination
Graphic courtesy ofGraphic courtesy of Columbia TechnologiesColumbia Technologies
MIPECD relative responseMIPECD relative response (in(in microvoltsmicrovolts) traced) traced
against depth for the TCEagainst depth for the TCE contaminantcontaminant
MIP relative responseMIP relative response correlated with results ofcorrelated with results of depthdepth--discrete samplesdiscrete samplesAringAring
Fee
t b
elow
gro
und
su
rfac
eF
eet
bel
ow g
rou
nd s
urf
ace
Direct-push MIP-ECD taking readings every 2 inches going down to create a vertical profile of contamination in the subsurface
Soil conductivity results suggest transitions from sandy matrix to clay matrix (higher conductivity in clayey soil) The 7- to 8-ft wide band of contamination is associated with a clay layer in the subsurface Small discrete GW samples (ie very small sample support) representative of point concentrations were collected using the DP probe and analyzed using GC-MS The results allow coarse calibration (in units of ugL = mass TCE per volume of GW) of the magnitude of the ECD response (in voltage units)
What analytical results (low medium or high lab results) would be expected if a monitoring well were screened over the various intervals in the animation graphic (Keep in mind that clay layers may be rather non-permeable to water flow as compared to sandier layers)
13
14
Analytical Results from Heterogeneous SystemsAnalytical Results from Heterogeneous Systems Are Determined by How Samples Are CollectedAre Determined by How Samples Are Collected
vsvs
WellWellscreenscreen
11
WellWellscreenscreen
22
Depending on screenDepending on screen construction you can getconstruction you can get completely different GWcompletely different GWresults that have nothingresults that have nothing to do with the lab or theto do with the lab or the analytical methodanalytical method
Unless information aboutUnless information about contaminant distributioncontaminant distribution guides well constructionguides well construction GW results can be highlyGW results can be highly variable and difficult tovariable and difficult to interpretinterpret
vsvs 33
Direct-push MIP-ECD taking readings every 2 inches going down to create a vertical profile of contamination in the subsurface
Soil conductivity results suggest transitions from sandy matrix to clay matrix (higher conductivity in clayey soil) The 7- to 8-ft wide band of contamination is associated with a clay layer in the subsurface Small discrete GW samples (ie very small sample support) representative of point concentrations were collected using the DP probe and analyzed using GC-MS The results allow coarse calibration (in units of ugL = mass TCE per volume of GW) of the magnitude of the ECD response (in voltage units)
What analytical results (low medium or high lab results) would be expected if a monitoring well were screened over the various intervals in the animation graphic (Keep in mind that clay layers may be rather non-permeable to water flow as compared to sandier layers)
14
15
Display Options 2Display Options 2--D Representation of a CSMD Representation of a CSM
Slid
e adap
ted from
Colu
mb
ia Tech
nologies In
c 2001
15
16
Display Options Include Discrete Sample ResultsDisplay Options Include Discrete Sample Results
Comparison of GW Samples to Continuous Sensor ProfileComparison of GW Samples to Continuous Sensor Profile
Slide adapted from Columbia Technologies Inc 2003Slide adapted from Columbia Technologies Inc 2003
MIP Response
Discrete SamplemdashTotal Chlorinated VOC Concentration
SMART DATA OUTPUTS
bull Built to client specifications
bull Interactive 3D
bull Easy to view correlation between various data sets
16
17
Membrane Interface Probe informationMembrane Interface Probe information Through Field Analytics Encyclopedia websiteThrough Field Analytics Encyclopedia websit httpwwwclu-inorg
ndashndashhttpwwwclu-inorgchartechnologiesmipcfm
Passive Diffusion Samplers informationPassive Diffusion Samplers information Through ITRC websiteThrough ITRC website httpwwwitrcweborghttpwwwitrcweborg
ndashndash httpdiffusionsampleritrcweborgcommondefaultasphttpdiffusionsampleritrcweborgcommondefaultasp
Related informationRelated information EPAEPA TIOrsquosTIOrsquos CluClu--In website for TriadIn website for Triad httphttpcluinorgcluinorgtriadtriad
ndashndash Assorted sampling informationAssorted sampling information httpcluinorgchar1_educfmsamp_collhttpcluinorgchar1_educfmsamp_collandand httpcluinorgchar1_educfmstat_samphttpcluinorgchar1_educfmstat_samp
ndashndash Archived Triad seminarArchived Triad seminar httpwwwtriadcentralorgnewsdsp_archivecfm USACE Engineering Manuals (USACE Engineering Manuals (EMsEMs)) httpwwwusacearmymilpublicationseng-manualsilS Army Corps CSM Guidance EM EM 1110US Army Corps CSM Guidance EM EM 1110--11--12001200ndashndash US Army Corps TPP Guidance EM EM 200US Army Corps TPP Guidance EM EM 200--11--22
USACE CRREL Technical Report LibraryUSACE CRREL Technical Report Library httphttpwwwcrrelusacearmymilproductsproductshtmlwwwcrrelusacearmymilproductsproductshtml
Additional InformationAdditional Information
17

11
Direct Sensing Logs Raw Data as TracingsDirect Sensing Logs Raw Data as Tracings
Fine Grain Characteristics
Indication of Ground Water
Discrete Petroleum
Slide adapted from
Colum
bia Technologies Inc 2003
Slide adapted from
Colum
bia Technologies Inc 2003
Converted by sophisticated software intohellipConverted by sophisticated software intohellip
11
12
Still frame from a 3D Video of Plume vs GW WellsStill frame from a 3D Video of Plume vs GW Wells
Slide adapted from Columbia Technologies Inc 2003Slide adapted from Columbia Technologies Inc 2003
helliphellipa 3a 3--D View of the CSMD View of the CSM
MIP Response
Discrete Sample Conc
What the technology is capable of in the hands of a sophisticated user
12
13
The MIP Helps ldquoImagerdquo the Location and RelativeThe MIP Helps ldquoImagerdquo the Location and Relative Concentration of Subsurface VOC ContaminationConcentration of Subsurface VOC Contamination
Graphic courtesy ofGraphic courtesy of Columbia TechnologiesColumbia Technologies
MIPECD relative responseMIPECD relative response (in(in microvoltsmicrovolts) traced) traced
against depth for the TCEagainst depth for the TCE contaminantcontaminant
MIP relative responseMIP relative response correlated with results ofcorrelated with results of depthdepth--discrete samplesdiscrete samplesAringAring
Fee
t b
elow
gro
und
su
rfac
eF
eet
bel
ow g
rou
nd s
urf
ace
Direct-push MIP-ECD taking readings every 2 inches going down to create a vertical profile of contamination in the subsurface
Soil conductivity results suggest transitions from sandy matrix to clay matrix (higher conductivity in clayey soil) The 7- to 8-ft wide band of contamination is associated with a clay layer in the subsurface Small discrete GW samples (ie very small sample support) representative of point concentrations were collected using the DP probe and analyzed using GC-MS The results allow coarse calibration (in units of ugL = mass TCE per volume of GW) of the magnitude of the ECD response (in voltage units)
What analytical results (low medium or high lab results) would be expected if a monitoring well were screened over the various intervals in the animation graphic (Keep in mind that clay layers may be rather non-permeable to water flow as compared to sandier layers)
13
14
Analytical Results from Heterogeneous SystemsAnalytical Results from Heterogeneous Systems Are Determined by How Samples Are CollectedAre Determined by How Samples Are Collected
vsvs
WellWellscreenscreen
11
WellWellscreenscreen
22
Depending on screenDepending on screen construction you can getconstruction you can get completely different GWcompletely different GWresults that have nothingresults that have nothing to do with the lab or theto do with the lab or the analytical methodanalytical method
Unless information aboutUnless information about contaminant distributioncontaminant distribution guides well constructionguides well construction GW results can be highlyGW results can be highly variable and difficult tovariable and difficult to interpretinterpret
vsvs 33
Direct-push MIP-ECD taking readings every 2 inches going down to create a vertical profile of contamination in the subsurface
Soil conductivity results suggest transitions from sandy matrix to clay matrix (higher conductivity in clayey soil) The 7- to 8-ft wide band of contamination is associated with a clay layer in the subsurface Small discrete GW samples (ie very small sample support) representative of point concentrations were collected using the DP probe and analyzed using GC-MS The results allow coarse calibration (in units of ugL = mass TCE per volume of GW) of the magnitude of the ECD response (in voltage units)
What analytical results (low medium or high lab results) would be expected if a monitoring well were screened over the various intervals in the animation graphic (Keep in mind that clay layers may be rather non-permeable to water flow as compared to sandier layers)
14
15
Display Options 2Display Options 2--D Representation of a CSMD Representation of a CSM
Slid
e adap
ted from
Colu
mb
ia Tech
nologies In
c 2001
15
16
Display Options Include Discrete Sample ResultsDisplay Options Include Discrete Sample Results
Comparison of GW Samples to Continuous Sensor ProfileComparison of GW Samples to Continuous Sensor Profile
Slide adapted from Columbia Technologies Inc 2003Slide adapted from Columbia Technologies Inc 2003
MIP Response
Discrete SamplemdashTotal Chlorinated VOC Concentration
SMART DATA OUTPUTS
bull Built to client specifications
bull Interactive 3D
bull Easy to view correlation between various data sets
16
17
Membrane Interface Probe informationMembrane Interface Probe information Through Field Analytics Encyclopedia websiteThrough Field Analytics Encyclopedia websit httpwwwclu-inorg
ndashndashhttpwwwclu-inorgchartechnologiesmipcfm
Passive Diffusion Samplers informationPassive Diffusion Samplers information Through ITRC websiteThrough ITRC website httpwwwitrcweborghttpwwwitrcweborg
ndashndash httpdiffusionsampleritrcweborgcommondefaultasphttpdiffusionsampleritrcweborgcommondefaultasp
Related informationRelated information EPAEPA TIOrsquosTIOrsquos CluClu--In website for TriadIn website for Triad httphttpcluinorgcluinorgtriadtriad
ndashndash Assorted sampling informationAssorted sampling information httpcluinorgchar1_educfmsamp_collhttpcluinorgchar1_educfmsamp_collandand httpcluinorgchar1_educfmstat_samphttpcluinorgchar1_educfmstat_samp
ndashndash Archived Triad seminarArchived Triad seminar httpwwwtriadcentralorgnewsdsp_archivecfm USACE Engineering Manuals (USACE Engineering Manuals (EMsEMs)) httpwwwusacearmymilpublicationseng-manualsilS Army Corps CSM Guidance EM EM 1110US Army Corps CSM Guidance EM EM 1110--11--12001200ndashndash US Army Corps TPP Guidance EM EM 200US Army Corps TPP Guidance EM EM 200--11--22
USACE CRREL Technical Report LibraryUSACE CRREL Technical Report Library httphttpwwwcrrelusacearmymilproductsproductshtmlwwwcrrelusacearmymilproductsproductshtml
Additional InformationAdditional Information
17

12
Still frame from a 3D Video of Plume vs GW WellsStill frame from a 3D Video of Plume vs GW Wells
Slide adapted from Columbia Technologies Inc 2003Slide adapted from Columbia Technologies Inc 2003
helliphellipa 3a 3--D View of the CSMD View of the CSM
MIP Response
Discrete Sample Conc
What the technology is capable of in the hands of a sophisticated user
12
13
The MIP Helps ldquoImagerdquo the Location and RelativeThe MIP Helps ldquoImagerdquo the Location and Relative Concentration of Subsurface VOC ContaminationConcentration of Subsurface VOC Contamination
Graphic courtesy ofGraphic courtesy of Columbia TechnologiesColumbia Technologies
MIPECD relative responseMIPECD relative response (in(in microvoltsmicrovolts) traced) traced
against depth for the TCEagainst depth for the TCE contaminantcontaminant
MIP relative responseMIP relative response correlated with results ofcorrelated with results of depthdepth--discrete samplesdiscrete samplesAringAring
Fee
t b
elow
gro
und
su
rfac
eF
eet
bel
ow g
rou
nd s
urf
ace
Direct-push MIP-ECD taking readings every 2 inches going down to create a vertical profile of contamination in the subsurface
Soil conductivity results suggest transitions from sandy matrix to clay matrix (higher conductivity in clayey soil) The 7- to 8-ft wide band of contamination is associated with a clay layer in the subsurface Small discrete GW samples (ie very small sample support) representative of point concentrations were collected using the DP probe and analyzed using GC-MS The results allow coarse calibration (in units of ugL = mass TCE per volume of GW) of the magnitude of the ECD response (in voltage units)
What analytical results (low medium or high lab results) would be expected if a monitoring well were screened over the various intervals in the animation graphic (Keep in mind that clay layers may be rather non-permeable to water flow as compared to sandier layers)
13
14
Analytical Results from Heterogeneous SystemsAnalytical Results from Heterogeneous Systems Are Determined by How Samples Are CollectedAre Determined by How Samples Are Collected
vsvs
WellWellscreenscreen
11
WellWellscreenscreen
22
Depending on screenDepending on screen construction you can getconstruction you can get completely different GWcompletely different GWresults that have nothingresults that have nothing to do with the lab or theto do with the lab or the analytical methodanalytical method
Unless information aboutUnless information about contaminant distributioncontaminant distribution guides well constructionguides well construction GW results can be highlyGW results can be highly variable and difficult tovariable and difficult to interpretinterpret
vsvs 33
Direct-push MIP-ECD taking readings every 2 inches going down to create a vertical profile of contamination in the subsurface
Soil conductivity results suggest transitions from sandy matrix to clay matrix (higher conductivity in clayey soil) The 7- to 8-ft wide band of contamination is associated with a clay layer in the subsurface Small discrete GW samples (ie very small sample support) representative of point concentrations were collected using the DP probe and analyzed using GC-MS The results allow coarse calibration (in units of ugL = mass TCE per volume of GW) of the magnitude of the ECD response (in voltage units)
What analytical results (low medium or high lab results) would be expected if a monitoring well were screened over the various intervals in the animation graphic (Keep in mind that clay layers may be rather non-permeable to water flow as compared to sandier layers)
14
15
Display Options 2Display Options 2--D Representation of a CSMD Representation of a CSM
Slid
e adap
ted from
Colu
mb
ia Tech
nologies In
c 2001
15
16
Display Options Include Discrete Sample ResultsDisplay Options Include Discrete Sample Results
Comparison of GW Samples to Continuous Sensor ProfileComparison of GW Samples to Continuous Sensor Profile
Slide adapted from Columbia Technologies Inc 2003Slide adapted from Columbia Technologies Inc 2003
MIP Response
Discrete SamplemdashTotal Chlorinated VOC Concentration
SMART DATA OUTPUTS
bull Built to client specifications
bull Interactive 3D
bull Easy to view correlation between various data sets
16
17
Membrane Interface Probe informationMembrane Interface Probe information Through Field Analytics Encyclopedia websiteThrough Field Analytics Encyclopedia websit httpwwwclu-inorg
ndashndashhttpwwwclu-inorgchartechnologiesmipcfm
Passive Diffusion Samplers informationPassive Diffusion Samplers information Through ITRC websiteThrough ITRC website httpwwwitrcweborghttpwwwitrcweborg
ndashndash httpdiffusionsampleritrcweborgcommondefaultasphttpdiffusionsampleritrcweborgcommondefaultasp
Related informationRelated information EPAEPA TIOrsquosTIOrsquos CluClu--In website for TriadIn website for Triad httphttpcluinorgcluinorgtriadtriad
ndashndash Assorted sampling informationAssorted sampling information httpcluinorgchar1_educfmsamp_collhttpcluinorgchar1_educfmsamp_collandand httpcluinorgchar1_educfmstat_samphttpcluinorgchar1_educfmstat_samp
ndashndash Archived Triad seminarArchived Triad seminar httpwwwtriadcentralorgnewsdsp_archivecfm USACE Engineering Manuals (USACE Engineering Manuals (EMsEMs)) httpwwwusacearmymilpublicationseng-manualsilS Army Corps CSM Guidance EM EM 1110US Army Corps CSM Guidance EM EM 1110--11--12001200ndashndash US Army Corps TPP Guidance EM EM 200US Army Corps TPP Guidance EM EM 200--11--22
USACE CRREL Technical Report LibraryUSACE CRREL Technical Report Library httphttpwwwcrrelusacearmymilproductsproductshtmlwwwcrrelusacearmymilproductsproductshtml
Additional InformationAdditional Information
17

13
The MIP Helps ldquoImagerdquo the Location and RelativeThe MIP Helps ldquoImagerdquo the Location and Relative Concentration of Subsurface VOC ContaminationConcentration of Subsurface VOC Contamination
Graphic courtesy ofGraphic courtesy of Columbia TechnologiesColumbia Technologies
MIPECD relative responseMIPECD relative response (in(in microvoltsmicrovolts) traced) traced
against depth for the TCEagainst depth for the TCE contaminantcontaminant
MIP relative responseMIP relative response correlated with results ofcorrelated with results of depthdepth--discrete samplesdiscrete samplesAringAring
Fee
t b
elow
gro
und
su
rfac
eF
eet
bel
ow g
rou
nd s
urf
ace
Direct-push MIP-ECD taking readings every 2 inches going down to create a vertical profile of contamination in the subsurface
Soil conductivity results suggest transitions from sandy matrix to clay matrix (higher conductivity in clayey soil) The 7- to 8-ft wide band of contamination is associated with a clay layer in the subsurface Small discrete GW samples (ie very small sample support) representative of point concentrations were collected using the DP probe and analyzed using GC-MS The results allow coarse calibration (in units of ugL = mass TCE per volume of GW) of the magnitude of the ECD response (in voltage units)
What analytical results (low medium or high lab results) would be expected if a monitoring well were screened over the various intervals in the animation graphic (Keep in mind that clay layers may be rather non-permeable to water flow as compared to sandier layers)
13
14
Analytical Results from Heterogeneous SystemsAnalytical Results from Heterogeneous Systems Are Determined by How Samples Are CollectedAre Determined by How Samples Are Collected
vsvs
WellWellscreenscreen
11
WellWellscreenscreen
22
Depending on screenDepending on screen construction you can getconstruction you can get completely different GWcompletely different GWresults that have nothingresults that have nothing to do with the lab or theto do with the lab or the analytical methodanalytical method
Unless information aboutUnless information about contaminant distributioncontaminant distribution guides well constructionguides well construction GW results can be highlyGW results can be highly variable and difficult tovariable and difficult to interpretinterpret
vsvs 33
Direct-push MIP-ECD taking readings every 2 inches going down to create a vertical profile of contamination in the subsurface
Soil conductivity results suggest transitions from sandy matrix to clay matrix (higher conductivity in clayey soil) The 7- to 8-ft wide band of contamination is associated with a clay layer in the subsurface Small discrete GW samples (ie very small sample support) representative of point concentrations were collected using the DP probe and analyzed using GC-MS The results allow coarse calibration (in units of ugL = mass TCE per volume of GW) of the magnitude of the ECD response (in voltage units)
What analytical results (low medium or high lab results) would be expected if a monitoring well were screened over the various intervals in the animation graphic (Keep in mind that clay layers may be rather non-permeable to water flow as compared to sandier layers)
14
15
Display Options 2Display Options 2--D Representation of a CSMD Representation of a CSM
Slid
e adap
ted from
Colu
mb
ia Tech
nologies In
c 2001
15
16
Display Options Include Discrete Sample ResultsDisplay Options Include Discrete Sample Results
Comparison of GW Samples to Continuous Sensor ProfileComparison of GW Samples to Continuous Sensor Profile
Slide adapted from Columbia Technologies Inc 2003Slide adapted from Columbia Technologies Inc 2003
MIP Response
Discrete SamplemdashTotal Chlorinated VOC Concentration
SMART DATA OUTPUTS
bull Built to client specifications
bull Interactive 3D
bull Easy to view correlation between various data sets
16
17
Membrane Interface Probe informationMembrane Interface Probe information Through Field Analytics Encyclopedia websiteThrough Field Analytics Encyclopedia websit httpwwwclu-inorg
ndashndashhttpwwwclu-inorgchartechnologiesmipcfm
Passive Diffusion Samplers informationPassive Diffusion Samplers information Through ITRC websiteThrough ITRC website httpwwwitrcweborghttpwwwitrcweborg
ndashndash httpdiffusionsampleritrcweborgcommondefaultasphttpdiffusionsampleritrcweborgcommondefaultasp
Related informationRelated information EPAEPA TIOrsquosTIOrsquos CluClu--In website for TriadIn website for Triad httphttpcluinorgcluinorgtriadtriad
ndashndash Assorted sampling informationAssorted sampling information httpcluinorgchar1_educfmsamp_collhttpcluinorgchar1_educfmsamp_collandand httpcluinorgchar1_educfmstat_samphttpcluinorgchar1_educfmstat_samp
ndashndash Archived Triad seminarArchived Triad seminar httpwwwtriadcentralorgnewsdsp_archivecfm USACE Engineering Manuals (USACE Engineering Manuals (EMsEMs)) httpwwwusacearmymilpublicationseng-manualsilS Army Corps CSM Guidance EM EM 1110US Army Corps CSM Guidance EM EM 1110--11--12001200ndashndash US Army Corps TPP Guidance EM EM 200US Army Corps TPP Guidance EM EM 200--11--22
USACE CRREL Technical Report LibraryUSACE CRREL Technical Report Library httphttpwwwcrrelusacearmymilproductsproductshtmlwwwcrrelusacearmymilproductsproductshtml
Additional InformationAdditional Information
17

14
Analytical Results from Heterogeneous SystemsAnalytical Results from Heterogeneous Systems Are Determined by How Samples Are CollectedAre Determined by How Samples Are Collected
vsvs
WellWellscreenscreen
11
WellWellscreenscreen
22
Depending on screenDepending on screen construction you can getconstruction you can get completely different GWcompletely different GWresults that have nothingresults that have nothing to do with the lab or theto do with the lab or the analytical methodanalytical method
Unless information aboutUnless information about contaminant distributioncontaminant distribution guides well constructionguides well construction GW results can be highlyGW results can be highly variable and difficult tovariable and difficult to interpretinterpret
vsvs 33
Direct-push MIP-ECD taking readings every 2 inches going down to create a vertical profile of contamination in the subsurface
Soil conductivity results suggest transitions from sandy matrix to clay matrix (higher conductivity in clayey soil) The 7- to 8-ft wide band of contamination is associated with a clay layer in the subsurface Small discrete GW samples (ie very small sample support) representative of point concentrations were collected using the DP probe and analyzed using GC-MS The results allow coarse calibration (in units of ugL = mass TCE per volume of GW) of the magnitude of the ECD response (in voltage units)
What analytical results (low medium or high lab results) would be expected if a monitoring well were screened over the various intervals in the animation graphic (Keep in mind that clay layers may be rather non-permeable to water flow as compared to sandier layers)
14
15
Display Options 2Display Options 2--D Representation of a CSMD Representation of a CSM
Slid
e adap
ted from
Colu
mb
ia Tech
nologies In
c 2001
15
16
Display Options Include Discrete Sample ResultsDisplay Options Include Discrete Sample Results
Comparison of GW Samples to Continuous Sensor ProfileComparison of GW Samples to Continuous Sensor Profile
Slide adapted from Columbia Technologies Inc 2003Slide adapted from Columbia Technologies Inc 2003
MIP Response
Discrete SamplemdashTotal Chlorinated VOC Concentration
SMART DATA OUTPUTS
bull Built to client specifications
bull Interactive 3D
bull Easy to view correlation between various data sets
16
17
Membrane Interface Probe informationMembrane Interface Probe information Through Field Analytics Encyclopedia websiteThrough Field Analytics Encyclopedia websit httpwwwclu-inorg
ndashndashhttpwwwclu-inorgchartechnologiesmipcfm
Passive Diffusion Samplers informationPassive Diffusion Samplers information Through ITRC websiteThrough ITRC website httpwwwitrcweborghttpwwwitrcweborg
ndashndash httpdiffusionsampleritrcweborgcommondefaultasphttpdiffusionsampleritrcweborgcommondefaultasp
Related informationRelated information EPAEPA TIOrsquosTIOrsquos CluClu--In website for TriadIn website for Triad httphttpcluinorgcluinorgtriadtriad
ndashndash Assorted sampling informationAssorted sampling information httpcluinorgchar1_educfmsamp_collhttpcluinorgchar1_educfmsamp_collandand httpcluinorgchar1_educfmstat_samphttpcluinorgchar1_educfmstat_samp
ndashndash Archived Triad seminarArchived Triad seminar httpwwwtriadcentralorgnewsdsp_archivecfm USACE Engineering Manuals (USACE Engineering Manuals (EMsEMs)) httpwwwusacearmymilpublicationseng-manualsilS Army Corps CSM Guidance EM EM 1110US Army Corps CSM Guidance EM EM 1110--11--12001200ndashndash US Army Corps TPP Guidance EM EM 200US Army Corps TPP Guidance EM EM 200--11--22
USACE CRREL Technical Report LibraryUSACE CRREL Technical Report Library httphttpwwwcrrelusacearmymilproductsproductshtmlwwwcrrelusacearmymilproductsproductshtml
Additional InformationAdditional Information
17

15
Display Options 2Display Options 2--D Representation of a CSMD Representation of a CSM
Slid
e adap
ted from
Colu
mb
ia Tech
nologies In
c 2001
15
16
Display Options Include Discrete Sample ResultsDisplay Options Include Discrete Sample Results
Comparison of GW Samples to Continuous Sensor ProfileComparison of GW Samples to Continuous Sensor Profile
Slide adapted from Columbia Technologies Inc 2003Slide adapted from Columbia Technologies Inc 2003
MIP Response
Discrete SamplemdashTotal Chlorinated VOC Concentration
SMART DATA OUTPUTS
bull Built to client specifications
bull Interactive 3D
bull Easy to view correlation between various data sets
16
17
Membrane Interface Probe informationMembrane Interface Probe information Through Field Analytics Encyclopedia websiteThrough Field Analytics Encyclopedia websit httpwwwclu-inorg
ndashndashhttpwwwclu-inorgchartechnologiesmipcfm
Passive Diffusion Samplers informationPassive Diffusion Samplers information Through ITRC websiteThrough ITRC website httpwwwitrcweborghttpwwwitrcweborg
ndashndash httpdiffusionsampleritrcweborgcommondefaultasphttpdiffusionsampleritrcweborgcommondefaultasp
Related informationRelated information EPAEPA TIOrsquosTIOrsquos CluClu--In website for TriadIn website for Triad httphttpcluinorgcluinorgtriadtriad
ndashndash Assorted sampling informationAssorted sampling information httpcluinorgchar1_educfmsamp_collhttpcluinorgchar1_educfmsamp_collandand httpcluinorgchar1_educfmstat_samphttpcluinorgchar1_educfmstat_samp
ndashndash Archived Triad seminarArchived Triad seminar httpwwwtriadcentralorgnewsdsp_archivecfm USACE Engineering Manuals (USACE Engineering Manuals (EMsEMs)) httpwwwusacearmymilpublicationseng-manualsilS Army Corps CSM Guidance EM EM 1110US Army Corps CSM Guidance EM EM 1110--11--12001200ndashndash US Army Corps TPP Guidance EM EM 200US Army Corps TPP Guidance EM EM 200--11--22
USACE CRREL Technical Report LibraryUSACE CRREL Technical Report Library httphttpwwwcrrelusacearmymilproductsproductshtmlwwwcrrelusacearmymilproductsproductshtml
Additional InformationAdditional Information
17

16
Display Options Include Discrete Sample ResultsDisplay Options Include Discrete Sample Results
Comparison of GW Samples to Continuous Sensor ProfileComparison of GW Samples to Continuous Sensor Profile
Slide adapted from Columbia Technologies Inc 2003Slide adapted from Columbia Technologies Inc 2003
MIP Response
Discrete SamplemdashTotal Chlorinated VOC Concentration
SMART DATA OUTPUTS
bull Built to client specifications
bull Interactive 3D
bull Easy to view correlation between various data sets
16
17
Membrane Interface Probe informationMembrane Interface Probe information Through Field Analytics Encyclopedia websiteThrough Field Analytics Encyclopedia websit httpwwwclu-inorg
ndashndashhttpwwwclu-inorgchartechnologiesmipcfm
Passive Diffusion Samplers informationPassive Diffusion Samplers information Through ITRC websiteThrough ITRC website httpwwwitrcweborghttpwwwitrcweborg
ndashndash httpdiffusionsampleritrcweborgcommondefaultasphttpdiffusionsampleritrcweborgcommondefaultasp
Related informationRelated information EPAEPA TIOrsquosTIOrsquos CluClu--In website for TriadIn website for Triad httphttpcluinorgcluinorgtriadtriad
ndashndash Assorted sampling informationAssorted sampling information httpcluinorgchar1_educfmsamp_collhttpcluinorgchar1_educfmsamp_collandand httpcluinorgchar1_educfmstat_samphttpcluinorgchar1_educfmstat_samp
ndashndash Archived Triad seminarArchived Triad seminar httpwwwtriadcentralorgnewsdsp_archivecfm USACE Engineering Manuals (USACE Engineering Manuals (EMsEMs)) httpwwwusacearmymilpublicationseng-manualsilS Army Corps CSM Guidance EM EM 1110US Army Corps CSM Guidance EM EM 1110--11--12001200ndashndash US Army Corps TPP Guidance EM EM 200US Army Corps TPP Guidance EM EM 200--11--22
USACE CRREL Technical Report LibraryUSACE CRREL Technical Report Library httphttpwwwcrrelusacearmymilproductsproductshtmlwwwcrrelusacearmymilproductsproductshtml
Additional InformationAdditional Information
17

17
Membrane Interface Probe informationMembrane Interface Probe information Through Field Analytics Encyclopedia websiteThrough Field Analytics Encyclopedia websit httpwwwclu-inorg
ndashndashhttpwwwclu-inorgchartechnologiesmipcfm
Passive Diffusion Samplers informationPassive Diffusion Samplers information Through ITRC websiteThrough ITRC website httpwwwitrcweborghttpwwwitrcweborg
ndashndash httpdiffusionsampleritrcweborgcommondefaultasphttpdiffusionsampleritrcweborgcommondefaultasp
Related informationRelated information EPAEPA TIOrsquosTIOrsquos CluClu--In website for TriadIn website for Triad httphttpcluinorgcluinorgtriadtriad
ndashndash Assorted sampling informationAssorted sampling information httpcluinorgchar1_educfmsamp_collhttpcluinorgchar1_educfmsamp_collandand httpcluinorgchar1_educfmstat_samphttpcluinorgchar1_educfmstat_samp
ndashndash Archived Triad seminarArchived Triad seminar httpwwwtriadcentralorgnewsdsp_archivecfm USACE Engineering Manuals (USACE Engineering Manuals (EMsEMs)) httpwwwusacearmymilpublicationseng-manualsilS Army Corps CSM Guidance EM EM 1110US Army Corps CSM Guidance EM EM 1110--11--12001200ndashndash US Army Corps TPP Guidance EM EM 200US Army Corps TPP Guidance EM EM 200--11--22
USACE CRREL Technical Report LibraryUSACE CRREL Technical Report Library httphttpwwwcrrelusacearmymilproductsproductshtmlwwwcrrelusacearmymilproductsproductshtml
Additional InformationAdditional Information
17