Embed Size (px)
Citation preview

Effective Chronic Disease Progression Model
using Frequent Subgraph Mining Algorithm
M. S. Gayathri
B.E, Department of CSE,
Builder Engineering College,
Kangayam, Tirupur, Tamilnadu, India.
M. Shiva
B.E, Department of CSE,
Builder Engineering College,
Kangayam ,Tirupur, Tamilnadu, India.
T. Hariharasudh A N
B.E, Department of CSE,
Builder Engineering College,
Kangayam,Tirupur, Tamilnadu, India.
K. Ravikumar
M. E.,(Ph.d), Assistant Professor,
Department of CSE,
Builder Engineering College,
Kangayam,Tirupur, Tamilnadu,India.
ABSTRACT—Public healthcare funds around the world a
billions of dollars in losses due to Healthcare insurance
fraud. Understanding disease progression can help the
investigators to detect healthcare insurance frauds early on.
Existing disease progression methods often ignore complex
relations, such as the time-gap and pattern of disease
occurrence. They also do not take into account the different
medication stages of the same chronic disease, which is of
great help when conducting healthcare insurance fraud
detection and reducing healthcare costs. This project
proposes a heterogeneous network-based chronic disease
progression mining method to improve the current
understanding on the progression of chronic diseases,
including orphan diseases. The method also considers the
different medication stages of the same chronic disease.
Combining automated method and statistical knowledge
lead to the emergence of a new interdisciplinary branch of
science that is named Knowledge Discovery from
Databases(KDD).
Keywords: Disease progression, Heterogeneous network,
Knowledge from Database, Healthcare fraud.
I. INTRODUCTION:
Datamining, or knowledge discovery, is the
computer-assisted process of digging through and
analyzing enormous sets of data and then extracting the
meaning of the data. Data mining tools predict behaviors
and future trends, allowing businesses to make proactive,
knowledge-driven decisions. Data mining tools can
answer business questions that traditionally were too time
consuming to resolve.
Classifications of Data Mining Methods : There are
different classifications of data mining. It depends on the
kinds of data being mined, the kinds of knowledge being
discovered and the kinds of techniques utilized.
1. Logistic regression is a machine learning algorithm for classification. In this algorithm, the
probabilities describing the possible outcomes of
a single trial are modelled using a logistic
function.
2. Naive Bayes algorithm based on Bayes’ theorem
with the assumption of independence between
every pair of features. Naive Bayes classifiers work well in many real-world situations such as
document classification and spam filtering.
3. Stochastic gradient descent is a simple and very
efficient approach to fit linear models. It is
particularly useful when the number of samples
is very large. It supports different loss functions
and penalties for classification.
4. Neighbours based classification is a type of lazy
learning as it does not attempt to construct a
general internal model, but simply stores
instances of the training data.
5. Dicision tree, In Given a data of attributes together with its classes, a decision tree produces
a sequence of rules that can be used to classify
the data.
6. Random forest classifier is a meta-estimator that
fits a number of decision trees on various sub-
samples of datasets and uses average to improve
the predictive accuracy of the model and controls
International Journal of Engineering Research & Technology (IJERT)
ISSN: 2278-0181
Published by, www.ijert.org
RTICCT - 2019 Conference Proceedings
Volume 7, Issue 01
Special Issue - 2019
1

over-fitting. The sub-sample size is always the
same as the original input sample size but the
samples are drawn with replacement.
7. Support vector machine is a representation of the
training data as points in space separated into
categories by a clear gap that is as wide as
possible. New examples are then mapped into
that same space and predicted to belong to a
category based on which side of the gap they
fall.
KDD technique:
The term Knowledge Discovery in Databases, or KDD
for short, refers to the broad process of finding knowledge
in data, and emphasizes the "high-level" application of
particular data mining methods.KDD involves several
steps, starting from understanding the organization
environment, determining obvious objectives, understanding the data, cleaning, preparation and
transformation of the data, selecting the appropriate data
mining approach, applying data mining algorithms, and
evaluation and interpretation of the findings. In this paper,
we use this KDD technique to find the progression of the
chronic diseases using the data we have.KDD technique
gives a overall progression to find the knowledge in data,
here this technique is our overall process of the paper to
know the progression of a particular disease. In this paper,
we propose a Heterogeneous Network-based Chronic
Disease Progression Mining (HNCDPM) method to help us understand the progression of chronic disease,
including orphan diseases, detect chronic disease fraud,
and reduce healthcare costs.
The application of Constrained Frequent Subgraph
Mining (CFSM),which can maintain rare nodes and mine
only subgraphs with a certain structure. Our methods can
reduce thesize of the candidate subgraph set and
remarkably improve computation efficiency.
II. RELATED WORKS:
1. T. Ramraja, R.Prabhakar– A work done to
create a common data structure used to represent
/ model real world system. In this paper, a survey
is done on theapproaches in targeting frequent
sub graphs and various scalable techniques to
find them.
2. K.Lakshmi and Dr. T. Meyyappan.– A work
done, for the purpose is to help user to apply the
technique in a task specific manner in various
application domain. In this paper we present a
detailed survey on frequent subgraph mining
algorithms, which are used for knowledge
discovery in complex objects and also propose a
frame work for classification of these algorithms.
3. Mrs.M.H.Sangle1, Prof.S.A.Bhavsar-A work
done to propose a frequent subgraph algorithm
called as gSpan-H which is iterative SS
MapReduce based framework . This algorithm
uses breadth first search strategy. This algorithm
is isomorphism testing free approach for
efficiently mine frequent subgraph. This
experiments with real life and large synthetic
datasets validatethe effectiveness of gSpan-H for
mining frequent subgraphs from large distributed
datasets.
4. Chenfei Sun, Qingzhong Li, Lizhen Cui, Hui
Li, and Yuliang Shi – A work done by Frequent
subgraph mining. The objective of FSM is to
extract all of the frequent subgraphs in a given
data set with occurrence counts a specified
threshold.
5. Chenfei Sun, Qingzhong Li, Lizhen Cui, Hui
Li, and Yuliang Shi - This part of the
framework essentially determines the similarity
between the base chronic disease network and
the healthcare history of a new patient. This
method is called longitudinal node matching,
which combines the sequential phases of rule-
based and graph theory.
III. EXISTING SYSTEM
A. Health-seeking temporal graph construction
Health-seeking Behavior. Each health
seeking behavior bi can be denoted as bi D .p; d; t where
p is the patient, d denotes the diagnose, and t is the
health-seeking time of the health-seeking behavior, a
health-seeking behavior may contain multiple kinds of
drugs/treatments.
Health-seeking Temporal Graph. Health-seeking
temporal graph G is a heterogeneous information network
with three types of nodes: patient, health seeking-
behavior, and process. Three types of edges are observed
in G.
The edge between patient node pi and health-seeking behavior node bj shows that patient pi conducts
the health-seeking behavior bj.
The edge between health-seeking behavior node bu
and health-seeking behavior node bv indicates that bv
occurs after bu, and the weight of edge euv is defined as,
International Journal of Engineering Research & Technology (IJERT)
ISSN: 2278-0181
Published by, www.ijert.org
RTICCT - 2019 Conference Proceedings
Volume 7, Issue 01
Special Issue - 2019
2
𝑊𝑒𝑢𝑣=
1
|𝑡𝑢 − 𝑡𝑣| + 1
Fig.1. Example of health-seeking temporal graph of patient p1. The
spherical node indicates a patient with a chronic disease, each
square node represents a health-seeking behavior, and each circular
node is a process.
B. Constrained frequent disease-process
subgraphmining
In this section, we consider the diagnosis
of each health-seeking behavior. Frequent
disease-process pattern mining can be considered
as a CFSM problem in the graph set GS D hGi W
i D 1; 2; : : : ; Npi, where Np is the number of
patients.
Def 1: Frequent subgraph. For a given graph set
GS , if a subgraph g occurs more frequently than the
specified threshold, then g is a frequent subgraph of
GS.
Def 2: Frequent subgraph mining. The objective
of FSM is to extract all of the frequent subgraphs in
a given data set with occurrence counts above a
specified threshold.
The general process of subgraph mining algorithms, such
as gSpan, is as follows:
(1). Traverse all graphs and calculate the frequency
of all nodes and edges.(2).Compare the frequency and
threshold of all nodes and edges, and remove those with
frequencies smaller than the threshold. (3) Recalculate the
frequency of the remaining nodes and edges, order them
by frequency, and then recode them by their order. (4)
Conduct submining for each edge in the remaining edge
set.
Def 3:Constrained frequent subgraph mining. A
constrained frequent subgraph means the structure of the
subgraph is predefined, and the support calculation is
redefined as
𝑠𝑢𝑝𝑝𝑜𝑟𝑡(𝑔 + 𝑣) =𝑐𝑜𝑢𝑛𝑡((𝑔 + 𝑣). 𝐺𝑠)
min(𝑐𝑜𝑢𝑛𝑡(𝑔. 𝐺𝑠). 𝑐𝑜𝑢𝑛𝑡(𝑣. 𝐺𝑠))
C.Subgraph as a disease node and multiple process
nodes. Then, the process of CFSM can be divided into
four steps.
(1) Remove the two-node subgraphs that do not match
the predefined structure of the frequent subgraph.
(2) Calculate the support of the filtered two-node
subgraphs using the new support definition and remove
those subgraphs with supports lower than the threshold.
(3) Conduct submining on the obtained two-node
subgraph. In contrast to existing submining processes, our
method maintains all of the mined frequent subgraphs
instead of the maximal frequent subgraphs.
(4) Return the mined frequent subgraphs.
as FSz;z D 1;2; :::;Z, where Z is the number of frequent
subgraphs mined from CFSM mentioned above. Based on
the mined frequent disease-process subgraph, we can
recode the health-seeking temporal graph of patients
.Algorithm1 gives a detail description of our CFSM
method.
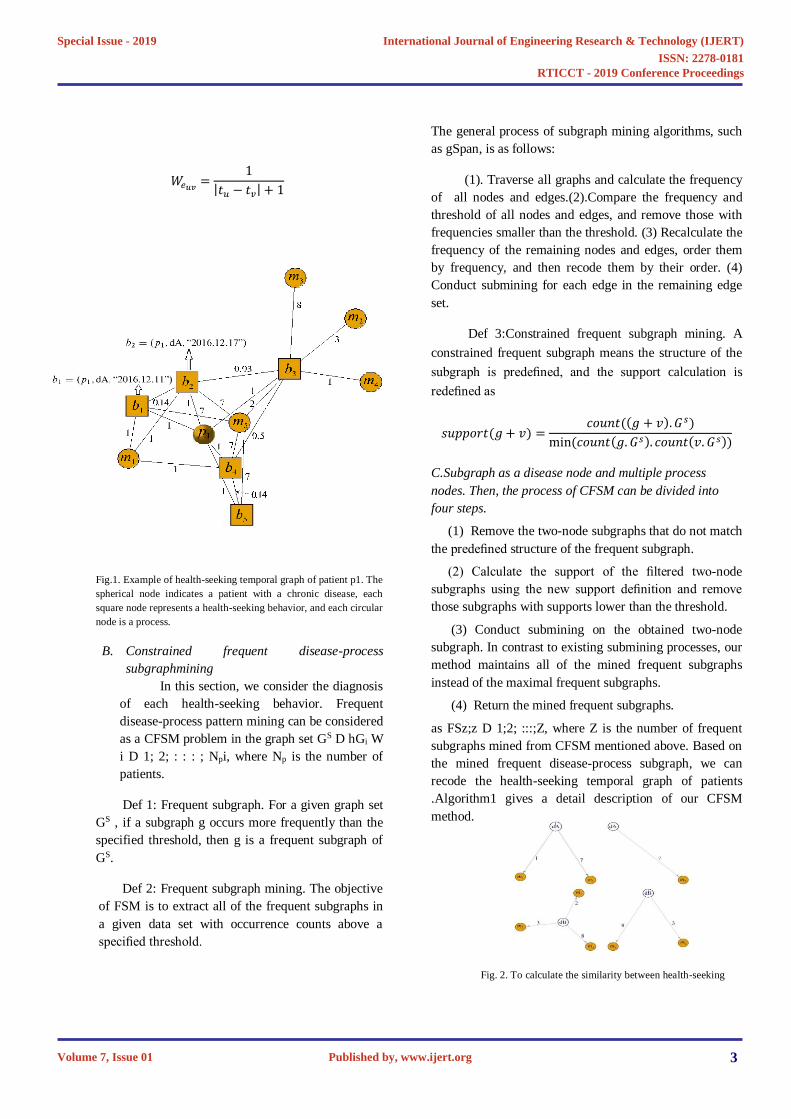
Fig. 2. To calculate the similarity between health-seeking
International Journal of Engineering Research & Technology (IJERT)
ISSN: 2278-0181
Published by, www.ijert.org
RTICCT - 2019 Conference Proceedings
Volume 7, Issue 01
Special Issue - 2019
3
Algorithm Constrained frequent disease-process subgraph
mining
each patient during a time period Ts Te; FS D ?
for pi in P do Construct temporal graph Gi
end for
Filter two-node subgraphs matching predefined
structure for gj in filtered two-node subgraphs do Calculate support .gj ) if support.gj ) > threshold then FS D FS [ gj
subMining (gj ) – same as the node-increased iteration in gSpan end if end for return FS
Fig. 3 Recoded health-seeking temporal graph of patient pi. Here, p1
indicates patient pi and the rest of the nodes FS1, FS2, and FS3 represent
different frequent disease-process subgraphs.
C. Base disease progression network construction
The base disease progression network is constructed from
a recoded graph set using statistical aggregation. In the
base network Gbase, each node indicates a mined
frequent disease-process subgraph, and the edge between
nodes refers to the frequency with which nodes tend to
occur sequentially. A node attribute called frequentness.
D.Heterogeneous network-based chronic disease
progression mining
To understand the process of chronic disease
progression, we adopt community detection methods
based on the obtained base disease progression network.
Nodes that have a close connection with each other tend
to be divided into the same community. In contrast to
traditional community detection, multiple edges may be
found between two nodes in Gbase.
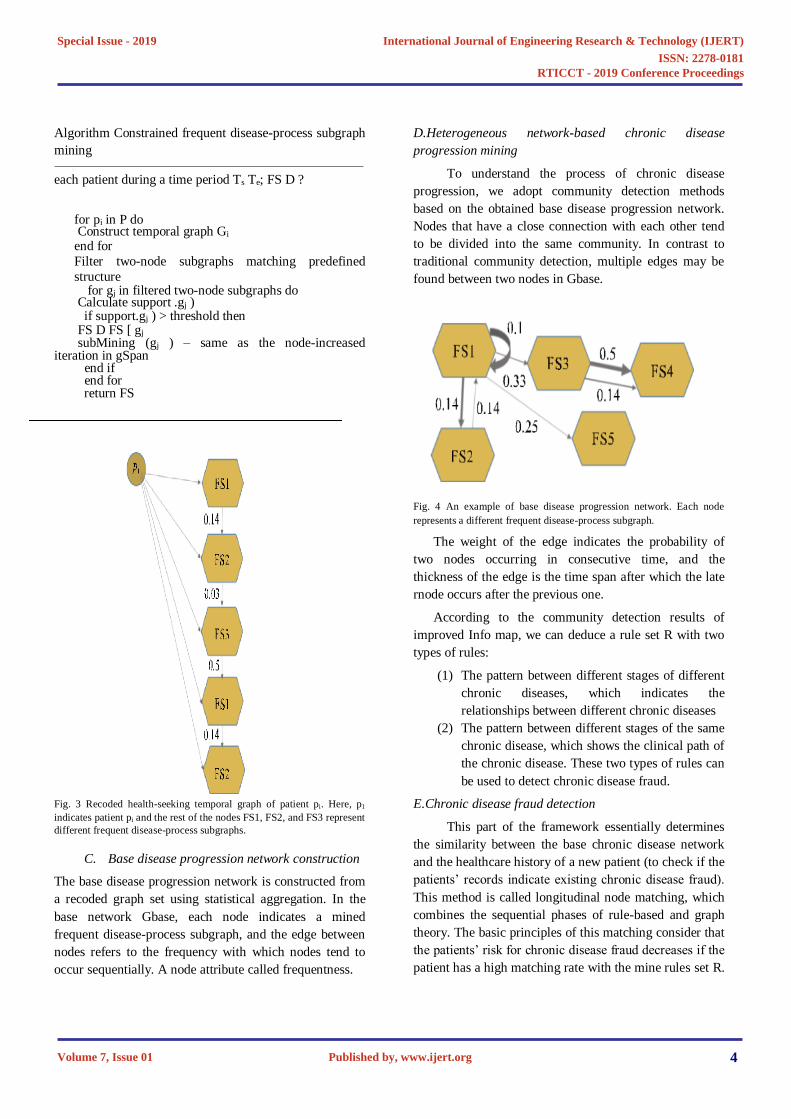
Fig. 4 An example of base disease progression network. Each node
represents a different frequent disease-process subgraph.
The weight of the edge indicates the probability of
two nodes occurring in consecutive time, and the
thickness of the edge is the time span after which the late
rnode occurs after the previous one.
According to the community detection results of
improved Info map, we can deduce a rule set R with two
types of rules:
(1) The pattern between different stages of different
chronic diseases, which indicates the
relationships between different chronic diseases
(2) The pattern between different stages of the same
chronic disease, which shows the clinical path of
the chronic disease. These two types of rules can
be used to detect chronic disease fraud.
E.Chronic disease fraud detection
This part of the framework essentially determines
the similarity between the base chronic disease network
and the healthcare history of a new patient (to check if the
patients’ records indicate existing chronic disease fraud).
This method is called longitudinal node matching, which
combines the sequential phases of rule-based and graph
theory. The basic principles of this matching consider that
the patients’ risk for chronic disease fraud decreases if the
patient has a high matching rate with the mine rules set R.
International Journal of Engineering Research & Technology (IJERT)
ISSN: 2278-0181
Published by, www.ijert.org
RTICCT - 2019 Conference Proceedings
Volume 7, Issue 01
Special Issue - 2019
4

For a new patient p new, suppose his health seeking
temporal graph is G new. Were code G new with the
mined disease-process subgraph and obtain G renew.
Then, the probability of fraud of patient p new can be
calculated as.
𝑝𝑟𝑜(𝑝𝑛𝑒𝑤) = 1 − 𝑠𝑖𝑚(𝐺𝑟𝑒𝑛𝑒𝑤 , 𝑅)
=∑∀𝑒𝑑𝑔𝑒∈𝐺𝑛𝑒𝑤𝑓(𝑒𝑑𝑔𝑒, 𝑅)
|𝐺𝑛𝑒𝑤|
F(edge);R/ indicates whether a rule in R can match the
edge. If such a rule exists, f(edge);R/ is 1. Otherwise,
f(edge);R/ is 0. The less the similarity between G new
with G base, the larger probability that patient p new will
conduct chronic disease-related health insurance fraud.
IV. PROPOSED SYSTEM
The proposed system involves all the existing
system approaches. In addition, before nodes are assigned
with graphs for Map process, the graphs are balanced
such that all the nodes get correct number of graphs with
nodes count. For example, two small graphs are given to
Node A and one big graph is given to Node B. So, the
map processes are completed in fewer intervals in all the
nodes so that reduce phase can be started immediately.
Some of the advantages of proposed system:
Before sending input graph data to nodes,
they are balanced. For example, two
nodes are equal number of nodes and edges.
Nodes complete the Mapper process in
fewer intervals so that Reduce phase can
be started with minimum delay.
Overall time efficiency is increased.
V. CONCLUSION
This paper proposes HNCDPM to help detect
health insurance fraud. The developed method helps us
understand the progression of chronic disease, including
orphan diseases, and is helpful in detecting chronic
disease-related fraud and reducing healthcare costs.
HNCDPM considers different medication periods of the
same disease and produces two types of rules: the pattern
between different stages of different chronic diseases,
which indicates the relationship between different types
of chronic disease, and the pattern between different
stages of the same chronic disease, which shows the
clinical path of the disease. These two types of rules can
be used to help detect chronic disease fraud. The proposed
system presented a novel iterative Map Reduce based
frequent subgraph mining algorithm, called FSM-H. The
proposed system shows the performance of FSM-H over
real life and large synthetic datasets for various system
and input configurations. In this project also compare the
execution time of FSM-H with an existing method, which
shows that FSM-H is significantly better than the existing
method.
REFERENCE
[1] S. S. Waghade and A. M. Karandikar, A
comprehensive study of healthcare fraud detection based
on machine learning, Int. J. Appl. Eng. Res., vol. 13, no.
6, pp. 4175– 4178, 2018.
[2] H. Joudaki, A. Rashidian, B. Minaei-Bidgoli, M.
Mahmoodi,B.Geraili,M.Nasiri,andM.Arab,Usingdata
mining to detect health care fraud and abuse: A review of
literature, Glob. J. Health Sci., vol. 7, no. 1, pp. 194–202,
2015.
[3] R. A. Bauder and T. M. Khoshgoftaar, A novel
method for fraudulent Medicare claims detection from
expected payment deviations (application paper), in Proc.
17th Int. Conf. Information Reuse and Integration (IRI),
Pittsburgh, PA, USA, 2016, pp. 11–19.
[4] H. Joudaki, A. Rashidian, B. Minaei-Bidgoli, M.
Mahmoodi,B.Geraili,M.Nasiri,andM. Arab,Improving
fraud and abuse detection in general physician claims: A
dataminingstudy,Int.J. HealthPolicyManag.,vol.5,no. 3,
pp. 165–172, 2016.
[5 ]J.S.Ko,H.Chalfin,B.J.Trock,Z.Y.Feng,E.Humphreys,
S. W. Park, H. B. Carter, K. D. Frick, and M. Han,
Variability in Medicare utilization and payment among
urologists, Urology, vol. 85, no. 5, pp. 1045–1051, 2015.
[6] R. A. Bauder, T. M. Khoshgoftaar, A. Richter, and
M. Herland, Predicting medical provider specialties to
detect anomalousinsuranceclaims,inProc.28th Int.Conf.
Tools with Artificial Intelligence (ICTAI), San Jose, CA,
USA, 2016, pp. 784–790.
[7] M. E. Charlson, P. Pompei, K. L. Ales, and C. R.
MacKenzie, A new method of classifying prognostic
comorbidity in longitudinal studies: Development and
International Journal of Engineering Research & Technology (IJERT)
ISSN: 2278-0181
Published by, www.ijert.org
RTICCT - 2019 Conference Proceedings
Volume 7, Issue 01
Special Issue - 2019
5

validation, J. Chron. Dis., vol. 40, no. 5, pp. 373–383,
1987.
[8] A. Elixhauser, C. Steiner, D. R. Harris, and R. M.
Coffey, Comorbidity measures for use with administrative
data, Med. Care, vol. 36, no. 1, pp. 8–27, 1998.
[9] M. T. A. Sharabiani, P. Aylin, and A. Bottle,
Systematic review of comorbidity indices for
administrative data, Med. Care, vol. 50, no. 12, pp. 1109–
1118, 2012.
[10] D. T. Wong and W. A. Knaus, Predicting outcome
in criticalcare: ThecurrentstatusoftheAPACHEprognostic
scoring system, Can. J. Anaesth., vol. 38, no. 3, pp. 374–
383, 1991.34 BigDataMiningandAnalytics,March 2019,
2(1): 25-34
[11] M. J. Breslow and O. Badawi, Severity scoring in
the critically ill: Part 1—Interpretation and accuracy of
outcome prediction scoring systems, Chest, vol. 141, no.
1, pp. 245–252, 2012.
[12]M.Baglioni,S.Pieroni,F.Geraci,F.Mariani,S.Molinaro,
M. Pellegrini, and E. Lastres, A new framework for
distilling higher quality information from health data via
social network analysis, in Proc. 13th Int. Conf. Data
Mining Workshops, Dallas, TX, USA, 2013, pp. 48–55.
[13] J. G. Anderson, Evaluation in health informatics:
Social network analysis, Comput. Biol. Med., vol. 32, no.
3, pp. 179–193, 2002.
[14] S. Uddin, A. Khan, and M. Piraveenan,
Administrative
claimdatatolearnabouteffectivehealthcarecollaboration
and coordination through social network, in Proc. 48th
Hawaii Int.Conf.System Sciences, Kauai, HI,USA,2015,
pp. 3105–3114.
[15] S. Uddin, A. Khan, and L. A. Baur, A framework to
explore the knowledge structure of multidisciplinary
research fields, PLoS One, vol. 10, no. 4, p. e0123537,
2015.
[16] H. Luijks, T. Schermer, H. Bor, C. Van Weel, T.
LagroJanssen, M. Biermans, and W. De Grauw,
Prevalence and incidence density rates of chronic
comorbidity in type 2 diabetespatients:
Anexploratorycohortstudy,BMCMed., vol. 10, p. 128,
2012.
[17] D. Chambers, P. Wilson, C. Thompson, and M.
Harden, Social network analysis in healthcare settings: A
systematic scoping review, PLoS One, vol. 7, no. 8, p.
e41911, 2012.
[18] X.F.YanandJ.W.Han,gSpan: Graph-
basedsubstructure pattern mining, in Proc. 2002 IEEE Int.
Conf. Data Mining, Maebashi, Japan, 2002, pp. 721–724.
[19]M.RosvallandC.T.Bergstrom,Mapsofrandomwalkson
complexnetworksrevealcommunitystructure,Proc. Natl.
Acad. Sci. USA, vol. 105, no. 4, pp. 1118–1123, 2008.
[20] X. Y. Li, H. H. Cao, E. H. Chen, H. Xiong, and J.
L. Tian, BP-growth: Searching strategies for efficient
behavior pattern mining, in Proc. 13th Int. Conf. Mobile
Data Management, Bengaluru, India, 2012, pp. 238–247.
[21] J. A. K. Suykens, Support vector machines: A
nonlinear modelling and control perspective, Eur. J.
Control, vol. 7, nos. 2&3, pp. 311–327, 2001.
International Journal of Engineering Research & Technology (IJERT)
ISSN: 2278-0181
Published by, www.ijert.org
RTICCT - 2019 Conference Proceedings
Volume 7, Issue 01
Special Issue - 2019
6