Embed Size (px)
Citation preview

School of Innovation, Design and Engineering
Effective inventory
management in the
automotive industry, a
literature study.
Bachelor thesis work
15 credits, Basic level
Product and process development
Production and Logistics
Mohamed Saliji
Tutor (university): Victor Azamfirei
Examiner: San Giliyana
A B S T R A C T
The automotive industry is characterized by the importance of its inventories and the diversity of
these inventories. They are strategic key factors to ensure a short time to market. The effective
management of such an important asset is vital to ensure the high competitiveness of car
manufacturers. Stocks immobilize significant financial resources while generating additional costs at
various levels too. The importance of cost-effective management of these costs for car manufacturers
has made it a field of interest for many studies. Many cost control techniques and concepts have been
proposed. Yet, the author of this thesis could not find articles or reviews that discuss the possible links
between these tools and concepts. The aim of this thesis is therefore to explore and get a better
understanding of the financial side of inventory management out of applied inventory management
cost control techniques.
This literature review is based on scientific articles which deal with the subject, and which are
published in recognized scientific journals. The PRISMA method is used as a selection criterion for
these articles, followed by an in-depth analysis of them. It draws special attention to the four key
factors that contribute to cost-effective inventory management within the automotive industry (1)
quantity, (2) predictability, (3) prioritization and (4) information. It discusses their impact on
inventories and highlights the pros and cons of different tools mentioned in the studied papers.
Forecasting is found to be the common element of all the tools. Propositions for further studies of
interest to the subject are presented at the end.
Keywords: Inventory management, automotive industry, cost-effectiveness, inventory management
techniques, data management.

A C K N O W L E D G E M E N T S
I would like to express my special thanks of gratitude to my university tutor Victor Azamfirei
as well as the programme coordinator San Giliyana who gave me the golden opportunity to do this
wonderful project on the very interesting topic of Effective inventory management in the
automotive industry, which also helped me with guidance to do a lot of research. I came to know
about so many new things, and I am thankful to them.
I would also like to thank my parents, family and friends who helped me and encourage me a lot to
finalise this project within the limited time frame.
Student: Date:
Mohamed Saliji 2021-05-14
CONTENTS 1. INTRODUCTION .......................................................................................................................................... 1
1.1. BACKGROUND ............................................................................................................................................. 1
1.2. PROBLEM FORMULATION ............................................................................................................................... 2
1.3. AIM AND RESEARCH QUESTIONS ..................................................................................................................... 2
1.4. PROJECT LIMITATIONS ................................................................................................................................... 3
2. RESEARCH METHOD ................................................................................................................................... 3
2.1. RESEARCH STRATEGY .................................................................................................................................... 3
2.2. SELECTION CRITERIA ..................................................................................................................................... 3
2.3. DATA ANALYSIS ............................................................................................................................................ 5
2.4. QUALITY ASSESSMENT ................................................................................................................................... 5
2.4.1. Validity of the study ........................................................................................................................... 6
2.4.1.1. Internal validity .............................................................................................................................. 6
2.4.1.2. External validity ............................................................................................................................. 6
2.4.2. Reliability of the study ........................................................................................................................ 6
3. THEORETIC FRAMEWORK ........................................................................................................................... 6
3.1. WHAT IS INVENTORY AND WHY IT IS NEEDED ...................................................................................................... 6
3.1.1. Inventory types ................................................................................................................................... 6
3.1.1.1. Raw materials ................................................................................................................................ 7
3.1.1.2. Finished goods ............................................................................................................................... 7
3.1.1.3. Work-in-process ............................................................................................................................. 7
3.1.2. Inventory purposes ............................................................................................................................. 7
3.1.3. Production systems and inventories ................................................................................................... 7
3.2. INVENTORY COSTS ........................................................................................................................................ 8
3.2.1. Ordering cost ...................................................................................................................................... 8
3.2.2. Holding cost ........................................................................................................................................ 9
3.2.3. Shortage cost ...................................................................................................................................... 9
3.3. EFFECTIVENESS IN THIS STUDY ....................................................................................................................... 10
4. RESULTS ................................................................................................................................................... 10
4.1. CATEGORY SELECTION ................................................................................................................................. 10

4.2. LITERATURE REVIEW RESULTS ........................................................................................................................ 11
4.3. INVENTORY MANAGEMENT TECHNIQUES ......................................................................................................... 13
4.3.1. Economic order quantity (EOQ) ........................................................................................................ 13
4.3.2. ABC analysis ..................................................................................................................................... 14
4.3.3. Just-In-Time (JIT)............................................................................................................................... 15
4.3.4. Safety Stock ...................................................................................................................................... 15
4.4. INVENTORY DATA MANAGEMENT................................................................................................................... 16
4.4.1. Demand forecasting ......................................................................................................................... 16
4.4.2. Industry 4.0....................................................................................................................................... 16
4.5. MANUFACTURER-SUPPLIER RELATIONSHIP....................................................................................................... 18
5. ANALYSIS AND DISCUSSION ..................................................................................................................... 18
5.1. QUANTITY ................................................................................................................................................ 19
5.2. PREDICTABILITY ......................................................................................................................................... 20
5.3. PRIORITIZATION ......................................................................................................................................... 20
5.4. INFORMATION ........................................................................................................................................... 20
6. CONCLUSIONS AND RECOMMENDATIONS ............................................................................................... 22
6.1. RECOMMENDATIONS .................................................................................................................................. 23
REFERENCES ...................................................................................................................................................... 24

L I S T O F F I G U R E S
Fig 1: Flow of information through the different phases of a systematic review (Moher et al., 2009). .......... 4
Fig 2: Results of PRISMA method application .................................................................................................. 5
Fig 3: Breakup of ordering costs (Shenoy and Rosas, 2018). ........................................................................... 8
Fig 4: Breakup of holding costs (Shenoy and Rosas, 2018). ............................................................................. 9
Fig 5: A classification framework .................................................................................................................... 10
Fig 6: EOQ representation (Digiesi et al., 2013) ............................................................................................. 14
Fig 7: Industry 4.0 technologies (Saturno et al., 2018) ................................................................................... 17
Fig 8: Different factors, management techniques and inventory costs. Source: author ............................... 18
Fig 9: Car sequence manufacturing (Yildiz et al., 2016) ................................................................................. 20
L I S T O F T A B L E S
Table 1: Keywords and selection criteria .......................................................................................................... 3
Table 2: Impact of production system on inventories ...................................................................................... 7
Table 3: Literature categories ......................................................................................................................... 11
Table 4: Literature review summary table ...................................................................................................... 12
Table 5: Quantitative citation of techniques in different publications ........................................................... 13
L I S T O F E Q U A T I O N S
Equation 1: EOQ Wilson formula .................................................................................................................... 13
Equation 2: Safety stock formula .................................................................................................................... 15

A B B R E V I A T I O N S
MDH Mälardalen university (Mälardalens Högskola)
PRISMA Preferred Reporting Items for Systematic Reviews and Meta-Analyses
WIP Work-in-process
OEM Original Equipment Manufacturer
JIT Just-in-time
EOQ Economical Order Quantity
R&D Research and Development
RQ Research Question
IoT Internet of Things
TTM Time to Market
CPS Cyber-Physical System

1
1. INTRODUCTION Under this section, background, aim and problem formulation will be presented. In the background comes a
deeper presentation of the subject that will be analysed. Problem formulation will determine why is it
relevant to tackle this subject while the aim section defines the desired goal from this thesis. Further on are
discussed limitations of the study.
1.1. Background Today's automotive industry faces several challenges. The automotive market has become more
demanding in terms of cost and functionalities (Benko and McFarlan, 2003). To guarantee market shares,
Singh and Singh (2020) argue that manufacturers must be reactive, which implies a significant reduction in
development, production and logistics times in order to offer the shortest possible Time To Market (TTM).
They must also be able to guarantee a wide choice of functionalities at competitive prices (Lawson et al.,
2018). In other words, move to the mass customisation concept. According to Piller (2004), mass
customisation refers to the combination of the flexibility of custom-made products with the low costs of
mass production. These two aspects partly justify the need for an effective and reliable inventory cost
management system throughout the product value chain.
The automotive industry is characterized by the importance of its inventories and the diversity of these
inventories (Wang, 2019, Singh and Singh, 2020). Inventories are constituted at various steps of the
production chain (raw material, work-in-progress and finished products). They present both benefits and
risks. The primary aim of constituting an inventory of any product is to absorb any possible mismatch
between supply and demand (Yildiz et al., 2016, Awheda et al., 2016, Al Barrak et al., 2017). However, if not
well managed, stocks can generate higher extra costs for businesses. The effective management of such
asset is therefore crucial for a car manufacturer to reduce the loss of money that can be caused by either
overstock or stock out.
Bose (2006) claims that the type of inventory management system used in a business is closely related to
the production system the car manufacturer is adopting. In Lean manufacturing, inventories are considered
as waste and should therefore be kept as low as possible if not eliminated (Jim Wu, 2002). While in the
mass production model instead, there is a tendency to create stocks to ensure production flow continuity
and avoid shortage.
Studies in the field tried to present different approaches to manage inventories effectively and efficiently in
this special branch of industries (Rizkya et al., 2018). According to the authors, these studies focused on the
notions of quantity, time and periodicity of use of the items that constitute inventories. Different levels of
stock management have been considered from warehouses to a global supply chain. The ultimate objective
of all these studies is to free up financial resources that are related to inventories and which can be used in
the competitiveness improvement of the car manufacturer. Although the subject is widely treated from
different perspectives and at different levels, there's no consensus on what is the best way of managing
stocks. Each method presents advantages and inconveniences. Nevertheless, all tools and concepts
referred to in the subject, are somehow linked and a common base to what can be an effective inventory
management system could be identified.

2
1.2. Problem formulation Inventories constitute an important immobilization of resources which can slow down the
development of automobile manufacturers (Dongdong and Xingwu, 2018). The authors estimate that
inventories constitute more than 7% of the total liquidity of the company. This asset can be used for other
purposes such as research and development (R&D), investment in new technologies or the modernization
of production equipment. For an industry that is based on a short time to market for new products,
production reliability and reactivity are key factors of development.
The automotive industry is a pioneer in the process of cost control and continuous improvements (Singh
and Singh, 2020). It is moreover the Japanese automobile manufacturer Toyota which is at the origin of the
philosophy of Lean manufacturing. In the Lean concept, inventories are identified as being one of the seven
wastes that must be eliminated (Jim Wu, 2002). The author defines waste as any activity that consumes
resources without contributing to the added value wanted by the customer.
The importance of inventory cost management for car manufacturers has made it a field of interest for
many studies. Some of which focus on specific case studies of internal cost control through continuous
improvement of a given aspect in a car manufacturer. Others offer mathematical and statistical calculations
modules which are sometimes difficult to practically interpret or apply for the whole automotive industry.
Several tools for controlling inventory costs are cited in scientific papers. Nevertheless, the author of this
thesis could not find any review or article on the possible links between these tools and concepts. This, at
term, could help identify a common base for an effective inventory cost management system in all these
tools.
On the grounds of this, the purpose of this thesis is to explore the factors that contribute to cost-effective
inventory management within the automotive industry. This purpose is achieved by carrying out an analysis
of the tools used in inventory management. A review of the similarities, differences, and dependencies
among them is then established. This would contribute to a better understanding of the financial side of
inventory management. This understanding is key for future studies that treat inventories cost
improvements and cost control in an ever-changing economical environment.
The thesis is organised as follows. Section 2 presents the methodology of this literature review. Section 3
describes the theoretical framework that covers inventory management aspects in the automotive
industry. Section 4 presents the highlighted inventory management tools and their pros and cons when it
comes to cost management. Section 5 carries out an analysis of dependencies between these tools. Finally,
conclusions are drawn from this analysis, and recommendations for future research are identified in
Section 6.
1.3. Aim and Research questions To explore the important elements that directly or indirectly influence inventory management cost-
effectiveness and discuss relevant tools and methods lifted in previous research that help improve the cost-
effectiveness in the automotive industry. To encircle this goal, the following research questions are to be
answered:

3
• RQ1: What are the factors and tools that influence inventory management cost and how?
• RQ2: What is the common attribute between all these factors and tools?
1.4. Project limitations Although the subject of this thesis is globally discussed, some limitations have been adopted for this
paper. Types of inventories are being identified but the focus will be on the raw material only. Papers used
in this literature review are only produced in English. Out of a reliability perspective, all papers published
during 2021 have been excluded. The report focuses on inventory management in the first category of the
automotive industry, meaning car manufacturers which’s main activity is the production of complete
vehicles.
2. RESEARCH METHOD The used methods for the thesis will be presented. Then the chapter ends with a discussion about the quality
of the study in term of validity and reliability.
2.1. Research strategy To develop this literature study, a research strategy has been adopted to search and identify relevant
literature. The search has been conducted throughout Mälardalens högskola (MDH’s) library as an
indexation database. The founded results were provided from other databases which’s access are granted
by the university such as Scopus, ProQuest, IEEE Xplore and Emerald insight. Keywords have been identified
and synonyms to the keywords were registered to widen the results. A combination of keywords and logical
connectors has been used in the search to get as specific and relevant results as possible.
Table 1: Keywords and selection criteria
Keywords Cost AND effectiv* AND (inventory OR stock) AND management AND
(automotive OR automobile)
Type of document Research articles, conference or review papers
Research Area Business, management & accounting
Language English
Publications Year Between 2000 and 2020, publications in 2021 are excluded.
The first conducted searches had no time and no publication type limitation. The objective was to gain a
wider understanding of the subject. They included journal articles, conference papers, review papers that
only are published in English. Book chapters and books are only used in the theoretic framework section.
2.2. Selection criteria The selection was based on the Preferred Reporting Items for Systematic Reviews and Meta-Analyses
statement (PRISMA) (Moher et al., 2009). It follows a checklist based on four steps. A flowchart defining the
PRISMA method is presented in Fig 1.

4
Fig 1: Flow of information through the different phases of a systematic review (Moher et al., 2009).
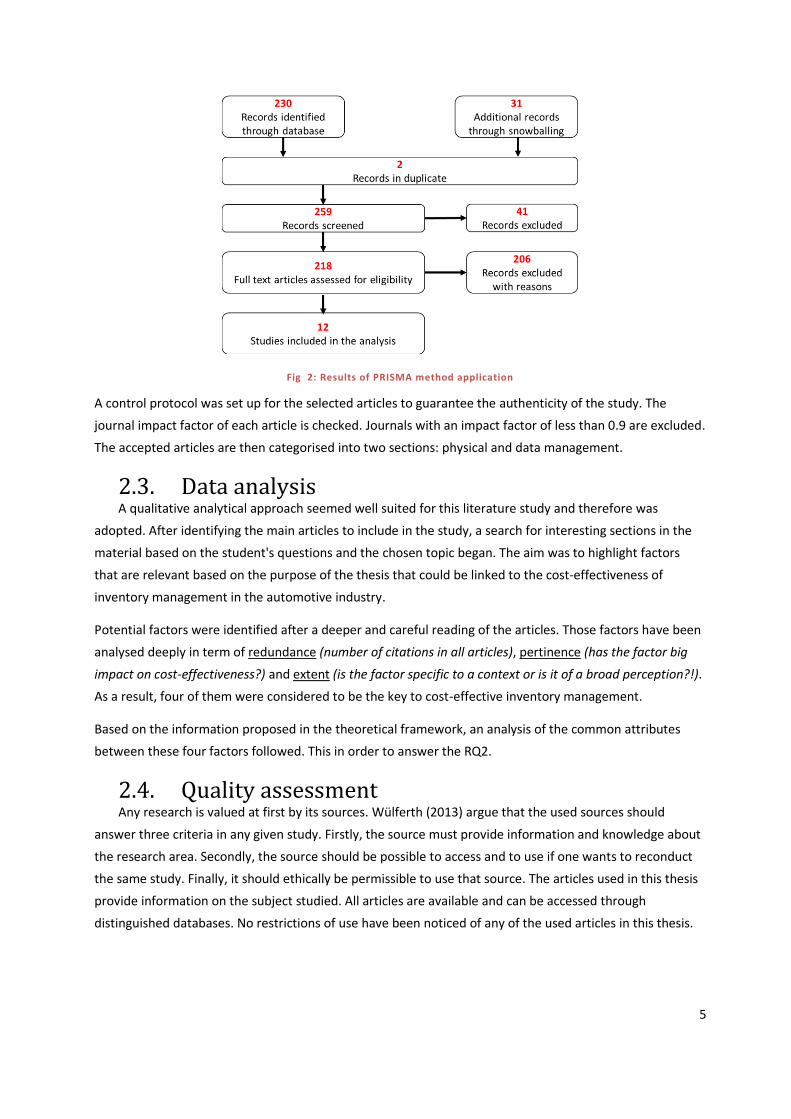
Although this statement aims to improve reporting of systematic reviews and meta-analyses, it was
adopted and used in this thesis as described in Fig 2. The extracted records are the result of database
research and snowballing method. Säfsten et al. (2020) define snowballing as the method of identifying
articles that are relevant to the topic by scanning the reference list of a chosen article. It can also be
referred to as bibliographic search or citation tracking. An Excel sheet was used in the process of data
treatment. It is convenient to mention here that books were used to a limited extend, especially in the
theoretical framework, and had no date limitations.
Some articles were excluded based on non-compliance with the research subject. Others dealt with
inventory management in other industries and cited the automotive industry just as an example. Finally, a
few articles were excluded because they statistically studied very specific cases which cannot be
generalized.
5
Fig 2: Results of PRISMA method application
A control protocol was set up for the selected articles to guarantee the authenticity of the study. The
journal impact factor of each article is checked. Journals with an impact factor of less than 0.9 are excluded.
The accepted articles are then categorised into two sections: physical and data management.
2.3. Data analysis A qualitative analytical approach seemed well suited for this literature study and therefore was
adopted. After identifying the main articles to include in the study, a search for interesting sections in the
material based on the student's questions and the chosen topic began. The aim was to highlight factors
that are relevant based on the purpose of the thesis that could be linked to the cost-effectiveness of
inventory management in the automotive industry.
Potential factors were identified after a deeper and careful reading of the articles. Those factors have been
analysed deeply in term of redundance (number of citations in all articles), pertinence (has the factor big
impact on cost-effectiveness?) and extent (is the factor specific to a context or is it of a broad perception?!).
As a result, four of them were considered to be the key to cost-effective inventory management.
Based on the information proposed in the theoretical framework, an analysis of the common attributes
between these four factors followed. This in order to answer the RQ2.
2.4. Quality assessment Any research is valued at first by its sources. Wülferth (2013) argue that the used sources should
answer three criteria in any given study. Firstly, the source must provide information and knowledge about
the research area. Secondly, the source should be possible to access and to use if one wants to reconduct
the same study. Finally, it should ethically be permissible to use that source. The articles used in this thesis
provide information on the subject studied. All articles are available and can be accessed through
distinguished databases. No restrictions of use have been noticed of any of the used articles in this thesis.
6
According to Säfsten et al. (2020), the quality of a research study is measured by the two concepts of
validity and reliability. Both concepts are dependent on one another and any study should strive for both
high validity and high reliability.
2.4.1. VALIDITY OF THE STUDY Validity is defined as the extent to which a study measures what it was meant to measure, in other
words, do the authors answer the research question(s) they asked at the start of the study (Yin, 2018, as
cited in Säfsten et al., 2020). Generally, this criterion is approached from two perspectives:
2.4.1.1. INTERNAL VALIDITY This literature review is based on peer-reviewed publications that are proper to the field. Therefore, it
is judged that it provides a good basis to answer the RQ defined at the very beginning of the study.
2.4.1.2. EXTERNAL VALIDITY The exclusion of the specific case studies from the approved article for this literature review makes it
more suited to be generalized.
2.4.2. RELIABILITY OF THE STUDY Reliability is defined as the ability to reproduce the research or observation and getting the same
results (Nyquist, 2017, as cited in Säfsten et al., 2020). All the used material are accessible through the
research publisher’s websites for persons with granted access to those databases. To get high reliability,
the research results published in 2021 were excluded, as there is a possibility of publication of new articles
in the field during the year which could give other results than the ones obtained when producing this
thesis.
3. THEORETIC FRAMEWORK Relevant notions and theories will be presented in this chapter. The chapter is structured in such a way that
it first identifies the role and the types of inventories and finally the meaning of effectiveness in this study.
3.1. What is inventory and why it is needed All companies need a form of inventory, whether it is a manufacturing company or a service-oriented
organisation. Shenoy and Rosas (2018) describes inventories as those stocks or items used to support the
production, supporting activities (i.e., maintenance) and customer services. They vary in form depending on
the process they are mean to support.
3.1.1. INVENTORY TYPES Inventories in a company are made up of production stocks and non-production stocks (Muller, 2011).
Production stocks include all the materials which, after processing, provide the finished products. Non-
production stocks are those which do not enter into processing but accompany production such as
packaging products, lubricants and spare parts. This study deals exclusively with production stocks.
Production stocks can be divided into the following three groups.

7
3.1.1.1. RAW MATERIALS Those are the stocks of raw components and material needed to create a product, and on which none
of the production activities has been initiated yet (Shenoy and Rosas, 2018). For a car manufacturer, those
can be tires, steel sheets, glass. Sub-assemblies received as such from suppliers are also considered to be
raw materials (e.g., pre-assembled seats).
3.1.1.2. FINISHED GOODS The completed products on which all the production activities have been performed and are ready for
sale. This includes all certified cars after performing all the necessary tests.
3.1.1.3. WORK-IN-PROCESS Considered to be work in progress or WIP, the stock of materials on which the production processes
have started but not yet completed. These materials are not yet ready for sale (Shenoy and Rosas, 2018).
3.1.2. INVENTORY PURPOSES Viale and Carrigan (1996) argue that inventories allow better predictability during sequence planning,
which gives more flexibility in the production lines. They also allow a quick response to changes in market
demand. This is made possible by the existence of stocks that allow production to ramp up in high demand
seasons. Finally, the authors believe that inventories protect against uncertainties in the logistics chain.
They ensure against distributions of deliveries which can generate downtime and consequently a high
downtime cost.
On the financial side, inventories also play an important economical role. Through the purchase of large
quantities (which creates stocks) producers can negotiate better discounts. Large orders reduce ordering
costs. Finally, inventories provide protection against the increase in the cost of materials used in
manufacturing in international markets (Viale and Carrigan, 1996).
Yet, inventories are sometimes results and not choices (Viale and Carrigan, 1996, Muller, 2011). Several
factors can generate inventories and determine their levels. Among these can be found the choice of the
production process. Mass production tends to produce large stocks at all levels of production, while lean
manufacturing tends to reduce these intermediate inventories as much as possible.
3.1.3. PRODUCTION SYSTEMS AND INVENTORIES In industry, the three basic production systems are batch production, continuous production and
projects. the choice of the production system depends on the type and quantity of items to be
manufactured, but also on the production steps necessary for this purpose. Bose (2006) suggests that there
is a close relationship between the type of production system and inventories levels. Table 2 presents a
summary of production system impacts on inventories.
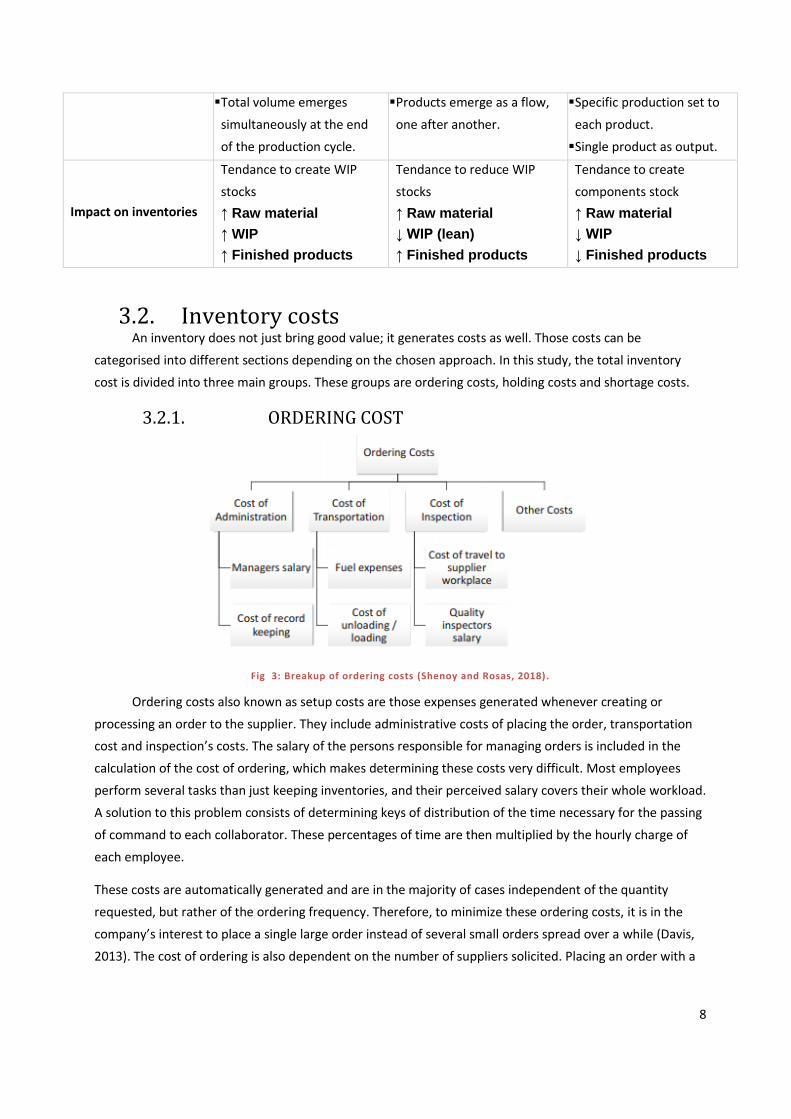
Table 2: Impact of production system on inventories
Production systems Batch System Continuous system Project system
Specifications
▪ Small quantities of output.
▪ Specifications can vary from
batch to batch.
▪ Large quantity of output.
▪ Common operations/steps
to all the products.
▪ Single, one of a kind
product.
8
▪ Total volume emerges
simultaneously at the end
of the production cycle.
▪ Products emerge as a flow,
one after another.
▪ Specific production set to
each product.
▪ Single product as output.
Impact on inventories
Tendance to create WIP
stocks
↑ Raw material
↑ WIP
↑ Finished products
Tendance to reduce WIP
stocks
↑ Raw material
↓ WIP (lean)
↑ Finished products
Tendance to create
components stock
↑ Raw material
↓ WIP
↓ Finished products
3.2. Inventory costs An inventory does not just bring good value; it generates costs as well. Those costs can be
categorised into different sections depending on the chosen approach. In this study, the total inventory
cost is divided into three main groups. These groups are ordering costs, holding costs and shortage costs.
3.2.1. ORDERING COST
Fig 3: Breakup of ordering costs (Shenoy and Rosas, 2018).
Ordering costs also known as setup costs are those expenses generated whenever creating or
processing an order to the supplier. They include administrative costs of placing the order, transportation
cost and inspection’s costs. The salary of the persons responsible for managing orders is included in the
calculation of the cost of ordering, which makes determining these costs very difficult. Most employees
perform several tasks than just keeping inventories, and their perceived salary covers their whole workload.
A solution to this problem consists of determining keys of distribution of the time necessary for the passing
of command to each collaborator. These percentages of time are then multiplied by the hourly charge of
each employee.
These costs are automatically generated and are in the majority of cases independent of the quantity
requested, but rather of the ordering frequency. Therefore, to minimize these ordering costs, it is in the
company’s interest to place a single large order instead of several small orders spread over a while (Davis,
2013). The cost of ordering is also dependent on the number of suppliers solicited. Placing an order with a

9
single supplier who manages several items is in this case economically more profitable than placing several
orders with several different suppliers.
3.2.2. HOLDING COST
Fig 4: Breakup of holding costs (Shenoy and Rosas, 2018).
Also known as carrying cost, it gathers all the costs linked to the storage of material before its use or
sale. It englobes the storage space costs, whether it is owned by the company or leased. Added to that
facility maintenance such as lighting and ventilation. The cost of physical handling of goods is also included
in the holding cost as well as insurance, security, and IT software and hardware. An important part of the
carrying cost is the inventory risk costs like theft, shipping errors or damages.
Unlike the ordering cost, holding cost is mainly directly related to the quantity of material rather than the
number of arrivals. This cost increases when the quantity to manage is important. From an economic
perspective, businesses have an interest in keeping product quantities low if they want to minimize the
holding cost. It should be noted that this cost is also directly linked to the value of the stored products. The
greater the value of the material, the higher the cost of ownership. In this perspective, if the company
wants to minimize the cost of ownership it must control the value of its stock by minimizing the number of
high-value items in its inventories (Davis, 2013).
3.2.3. SHORTAGE COST Sometimes called Stock-out cost, it occurs when companies happen to be out of stock for whatever
reason (Viale and Carrigan, 1996). The main part of this cost is generated by the disruption of production. A
shortage of material means that the business will have to pay charges even without producing anything.
This is even more important for the car industry as it operates in continuous production lines, a shortage
will mean that the whole production process will be affected and come to stop eventually if the shortage
last in time. On the other hand, a stockout means paying extra costs to get a shipment on time, or what is
called emergency shipments. This shows that even a shortage of the smallest component (in value) can
have big consequences on the shortfall.

10
More implicitly, shortages mean longer production and delivery time, which can impact customer loyalty
and the company's reputation.
3.3. Effectiveness in this study According to Allen (1990), the word effectiveness refers to the extent to which something is successful
in producing the desired result. Effectiveness is commonly referred to as “doing the correct things”, while
efficiency can be described as “doing things correctly”. In other words, effectiveness focuses on the
activities results and efficiency focuses on the activities performances.
It is important to notice that effective inventory management is a general topic. It englobes all the aspect
related to inventory, for instance, time management, space management, risk management and human
factor management. This study sets focus on the cost aspect of this management only.
4. RESULTS In this chapter, results on data that have been retrieved from chosen articles will be presented to then
answer the questions and highlight the important factors that affect inventory management cost-
effectiveness.
4.1. Category selection The categories used to classify the literature are presented in Fig 5. To match the specificity of this
subject, this categorisation is based on the theoretical framework classification discussed in section 3, and
the relevance of literature in term of citations number.
Fig 5: A classification framework
General information
Authors
Year
Inventoryfocus
Raw material
WIP
Finishedproducts
Spare parts
Item considered
Physicalmanagement
Data management
Relationships
Inventorycosts
Ordering cost
Holding cost
Shortage cost
Relevance
Paradigm
Context
Nb. Ofcitations
11
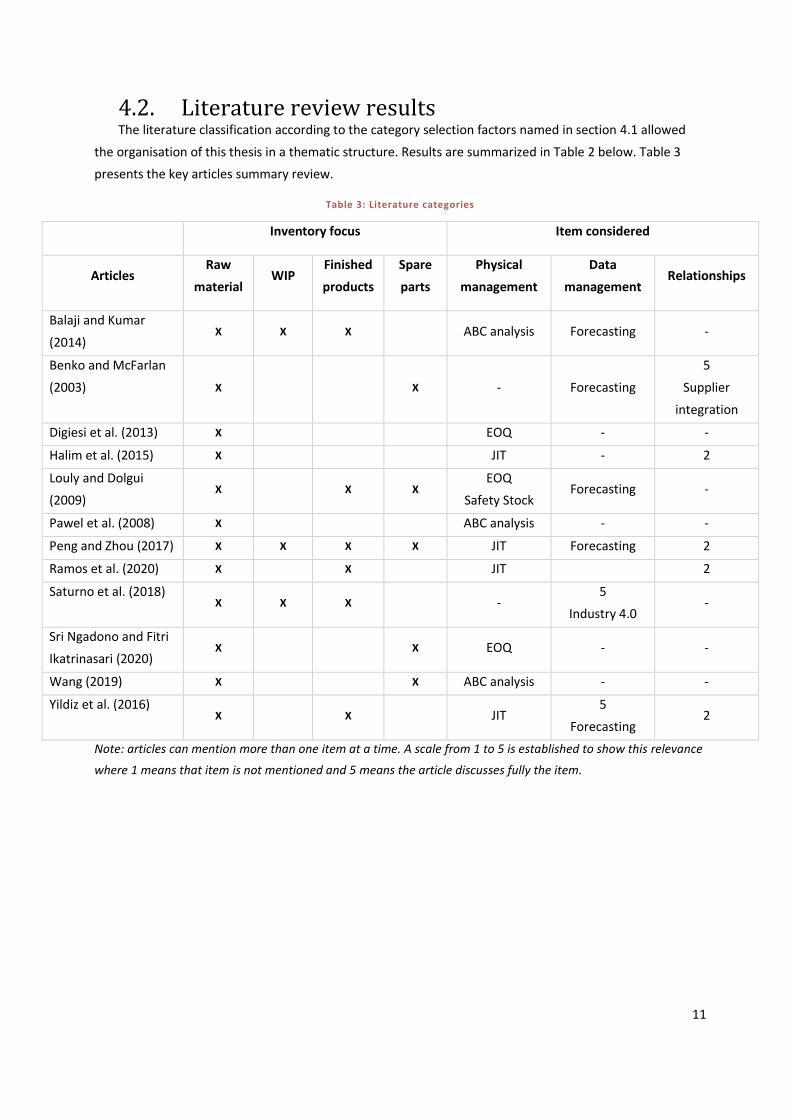
4.2. Literature review results The literature classification according to the category selection factors named in section 4.1 allowed
the organisation of this thesis in a thematic structure. Results are summarized in Table 2 below. Table 3
presents the key articles summary review.
Table 3: Literature categories
Inventory focus Item considered
Articles Raw
material WIP
Finished
products
Spare
parts
Physical
management
Data
management Relationships
Balaji and Kumar
(2014) X X X ABC analysis Forecasting -
Benko and McFarlan
(2003) X X - Forecasting
5
Supplier
integration
Digiesi et al. (2013) X EOQ - -
Halim et al. (2015) X JIT - 2
Louly and Dolgui
(2009) X X X
EOQ
Safety Stock Forecasting -
Pawel et al. (2008) X ABC analysis - -
Peng and Zhou (2017) X X X X JIT Forecasting 2
Ramos et al. (2020) X X JIT 2
Saturno et al. (2018) X X X -
5
Industry 4.0 -
Sri Ngadono and Fitri
Ikatrinasari (2020) X X EOQ - -
Wang (2019) X X ABC analysis - -
Yildiz et al. (2016) X X JIT
5
Forecasting 2
Note: articles can mention more than one item at a time. A scale from 1 to 5 is established to show this relevance
where 1 means that item is not mentioned and 5 means the article discusses fully the item.

12
Table 4: Literature review summary table
Authors/Date Topic Paradigm Context Findings
Benko and McFarlan
(2003)
Metamorphosis in the auto industry
Quantitative /
Qualitative
Consulting study for the
automotive industry
Modular assembly helps growing efficiency.
In the future, the supplier will take over the entire engineering and
design process.
Digiesi et al. (2013) A Sustainable Order Quantity Model under Uncertain
Product Demand.
Quantitative A case study from
automotive supply
A sustainable ordering model can be based on EOQ, yet very related
to demand uncertainty.
Louly and Dolgui
(2009)
Calculating safety stocks for assembly systems with
random component procurement lead times: A branch
and bound algorithm
Qualitative A study of stock
calculation algorithms for
assembly systems
A proposed method to be used to estimate security coefficients to
calculate the planned lead time for unreliable suppliers based on
statistics for the procurement lead times for each supplier
Peng and Zhou
(2017)
Scheduling the in-house logistics distribution for
automotive assembly lines with just-in-time principles
Qualitative A study of algorithms
simulation for JIT supply.
A proposed mathematical simulation model to facilitate an efficient
JIT parts supply to avoid inventory peaks.
Saturno et al. (2018) Proposal of an automation solutions architecture for
Industry 4.0
Qualitative A case study from 5 large
companies
Improving the performance of individual pieces of equipment and
systems no longer supports the current demand for a fully
integrated industry.
Adaptations in the pattern of human resources training will be
required for implementing industry 4.0
Wang (2019) Optimization of ABC Classification Method for
Automobile Spare Parts based on DEA
Quantitative Case study The ABC classification method based on the outbound value of
products only consider liquidity occupation; another method should
complete taking into consideration other important factors.
Yildiz et al. (2016) Production Planning Using Evolving Demand Forecasts
in the Automotive Industry
Quantitative Case study Presenting a forecast model and two order release adjustments to
provide increased visibility to the upstream supply chain which
reduces the bullwhip effect

13
Several stock management techniques were identified from the articles studied. Table 4 below shows the
number of citations of each technique in the different articles studied.
Table 5: Quantitative citation of techniques in different publications
Technique Number of citations of the
technique in the retrieved
articles
Main articles discussing the
technique
ABC 5 (Wang, 2019)
JIT 7 (Peng and Zhou, 2017)
EOQ 4 (Digiesi et al., 2013)
Safety Stock 6 (Louly and Dolgui, 2009)
Demand forecasting 8 (Yildiz et al., 2016)
Supplier integration 3 (Benko and McFarlan, 2003)
Industry 4.0 7 (Saturno et al., 2018)
4.3. Inventory management techniques This section treats the physical aspect of inventory management. It focuses on the tools mentioned in the
literature and highlights the advantages and inconveniences of each one.
4.3.1. ECONOMIC ORDER QUANTITY (EOQ) Digiesi et al. (2013) argue that the EOQ model was first introduced by Ford W. Harris in 1903 and was
developed ever since. It is an economic model that aims to determine the optimal quantity to order to
minimize inventory costs such as holding costs, shortage costs, and order costs. It is based on the annual
demand for a given product, the cost per order, the cost per unit and the holding cost (Louly and Dolgui,
2009).
The EOQ can be calculated using the Wilson formula as follow:
𝑬𝑶𝑸 = √𝟐 ∗ 𝑫 ∗ 𝑺
𝑯
Equation 1: EOQ Wilson formula
D: annual demand (unit)
S: cost per order (kr)
H: holding cost (kr)

14
Fig 6: EOQ representation (Digiesi et al., 2013)
Note: graphically, the EOQ represents the lowest point of the total cost curve. It is indeed the point where both
ordering cost and holding cost are equal.
However, one important limitation of the Equation 1 formula, is that it assumes that the demand for the
company’s products, the holding and ordering costs and remain constant over time. Which is very difficult
in today's economy (Digiesi et al., 2013, Sri Ngadono and Fitri Ikatrinasari, 2020).
4.3.2. ABC ANALYSIS An automobile, the product of the automotive industry, is made up of thousands of parts in the form of
single parts or sub-assemblies (Pawel et al., 2008). Precise individual management of all these huge stocks
is quite simply very difficult and not economically profitable. Stock management is considered itself as a
cost (Wang, 2019). The ABC concept brings a possible solution to this problem. ABC analysis is an approach
that aims to classify inventory items based on their consumption values. The consumption value of an item
is the value (normally expressed in currency) consumed during a defined period, for example, one year.
To do this, the ABC method is based on the Pareto law or the 80-20 rule. This means in this case that 20% of
the products generate 80% of the charges. The products are classified into three categories:
• Class A: the number of items in this group is relatively low but their consumption values are the
highest. it is, therefore, logical to bring great importance to the analysis and the management of
the stocks of these articles.
• Class B: the consumption value of items in this class is less than that of class A but greater than
that of class C. The inventory management policies for this class are determined by the company’s
estimation of the item’s cost and control systems.
• Class C: in general, this class is important in terms of the number of items but not in terms of
consumption, it groups together the items with the lowest consumption values. It is generally not
cost-effective to closely monitor inventory for these items because the value at risk for large losses
is relatively low.
The advantage of this approach is that it offers better inventory control over high-value articles, which
improves their availability and consequently reduces costs and the risk of losses (Wang, 2019). ABC analysis
also allows efficient use of inventory management resources. However, it is important to note that
managers must not forget the other aspects of inventory management that the ABC method does not

15
consider such as storage conditions and obsolescence (Balaji and Kumar, 2014). The dilemma here is that
the calculation of the ABC analysis is done on the annual basis of product releases. This does not consider
the periodicity of use. A class C product is much more likely to run out of stock than the other products of
the other two classes. This is due to the fact of no close collaboration with the suppliers of those products
plus the non-rigorous follow-up of the logistic chain. Which makes the adaptation to seasons of strong
demand more difficult (Wang, 2019).
4.3.3. JUST-IN-TIME (JIT) The just-in-time philosophy is based on the elimination of waste. For Ramos et al. (2020), inventories
are considered to be wastes because not only do they not produce added value, but also they generate
additional costs (cost of management, space, risks). This concept is part of the Lean manufacturing
developed by the Japanese car manufacturer Toyota during the 20th century. The effect of the JIT on the
stock is visible in the first place on the finished products and on the WIP. Indeed, the PULL system used by
the method only produces what is required, which considerably reduces these inventories (Yildiz et al.,
2016, Peng and Zhou, 2017). The backbone of this approach is to be able to forecast demand very
precisely. It is also based on sharing precise production forecast with suppliers for better synchronisation in
term of deliveries.
This method also presents big risks. The manufacturer becomes more and more dependent on the
efficiency of its suppliers and the reliability of the logistics chain put between it and them (Halim et al.,
2015). The uncertainty of one or the other can generate stock shortages resulting in additional costs (Peng
and Zhou, 2017).
4.3.4. SAFETY STOCK Louly and Dolgui (2009) estimate that the role of safety stock is to create a buffer between possible
stock-out and new material arrival. It is this extra number of articles ordered to the calculated needs. It
gives protection for businesses against unexpected events such as greater demand than expected or
disturbances in the supply chain. The problem with safety stocks is that they are difficult to define. Too high
and it generates unnecessary costs, while too low and it will not prevent potential stockout, which in turn
generates shortage costs.
Based on historical inventory data, it is possible to determine an optimum safety stock for each product
using the safety stock formula in Equation 2.
𝒁 = 𝝈𝑳𝑻 ∗ 𝑫
Equation 2: Safety stock formula
Where
Z: safety stock
σLT: Standard deviation of Lead time
D: demand average

16
4.4. Inventory data management This section treats the data aspect of inventory management. It highlights the role and weight of
information in the stock management process.
4.4.1. DEMAND FORECASTING Yildiz et al. (2016) define demand forecasting as the process by which businesses try to determine
future demand over a period of time based on historical data. This tool serves as a base for several
important activities in the business from strategic decisions on opening new facilities abroad to internal
inventory management. There are different types of demand forecasting. Which one to adopt depends on
the product, the sector and the complexity of the business to run. Major types are:
• Passive demand forecasting: based on simple extrapolations of historical data and requires minimal
assumptions. It is generally limited to small businesses.
• Active demand forecasting: suitable for sectors such as the automotive industry with significant
growth plans in term of products portfolio, marketing activities and expansion. It takes also into
consideration of competitors and the overall economic environment.
o Short-term demand forecasting: covers generally a period from 3 - 12 months, it focuses
on the seasonal pattern of demand to make necessary adjustments to the internal
production system.
o Medium and long-term demand forecasting: concerns periods longer than 12 months, it
drives the business strategy in term of budgeting, planning, sales, marketing finance etc.
As the production capacity is limited in the automobile factories, and the sales of cars are not stable during
the year, it is important to have forecasts spread over a given period. Stocks are then built up when there is
a strong demand for cars, and a minimization of the quantity of stock is undertaken during periods of
downturn. This allows good control of the cost of inventory management in this period.
4.4.2. INDUSTRY 4.0 The automotive sector has always been an important vector for development in term of technics and
technologies. Saturno et al. (2018) estimate that new technologies can help reduce management costs at
different stages of the value chain.

17
Fig 7: Industry 4.0 technologies (Saturno et al., 2018)
Automobile manufacturers are at the heart of a value chain that includes auto equipment manufacturers
upstream, and dealers downstream. The control of data exchange and the relevance of this data is essential
for optimal management of stock levels and therefore better cost control at each stage.
The flow of information is huge, and the management of this information requires resources, which comes
at a cost (Yadav et al., 2020). The use of Big data analytics technology makes it possible to design
algorithms and transformational analysis between statistical data and economic context, to create precise
demand forecasts. The use of Cloud technology allows data share in real-time with all the participants in
the value chain, which allows the anticipation of peak demand by building up stocks or reducing the
production rate to reduce an inventory of a given item in the event of low orders.
This information can also be automated through the Internet of Things (IoT) technology to launch item
orders at a precise quantity, period and rate directly linked to forecasts. It will consequently reduce the
inventory of products and at the same time reduce the cost of managing these stocks.
That said, this close integration of the value chain for all stakeholders (suppliers, manufacturers and
dealers) requires investment and unification of the work platform. In the short and medium term, that
would be an additional cost attributable to the various stages of production, including inventory
management. Another important point to keep in mind is the cybersecurity of a system that is very
dependent on sharing data at the risk of being vulnerable to unwanted access. The cost of such IT
infrastructure maintenance will increase, and at the same time, increase the cost of inventory management
(Saturno et al., 2018).
From a purely economic point of view, a dilemma arises. The objective being to reduce the cost of
managing physical stocks, the integration of this type of solution will generate an enormous flow of data.
The processing of this data would be essential for the relevance of decision-making. However, the cost of
data management will increase and persist over time, this includes the cost of the energy used but also the

18
cost of the IT material. It should be remembered that IT equipment requires periodic renewal in order to
guarantee data confidentiality.
4.5. Manufacturer-supplier relationship Today's cars market is based on reactivity, and also on new technologies (Benko and McFarlan, 2003).
To keep in the cap, the supplier changes from a single article supplier to a sub-assembly manufacturer.
Automakers started to adopt premade sub-assemblies developed by suppliers, such as seats, brake
systems, multimedia systems, etc.
Benko and McFarlan (2003) argue that this change in the whole supply chain directly impacts the inventory
at the car manufacturer as the number of articles is reduced significantly depending on the subassembly.
The management of one single product instead of multiple components reduces the order, holding and
stockout cost of those components. It allows the externalisation of inventories at the supplier instead of
taking care of them internally.
This is more facilitated by the high degree of integration between the automaker and the supplier. Also, by
the easiness of today's data interchangeability that current solutions provide. It is estimated that the future
trend is that it will continue to develop supplier’s full product integration through the utility of industry 4.0.
5. ANALYSIS AND DISCUSSION In this chapter, an analysis is carried out based on the previous results and framework sections. The
objective is to discuss the findings and highlights how identified factors impact cost-effectiveness in
inventory management for the automotive industry.
This literature study aims to determine the factors cited in the literature that influence inventory
management costs in the automotive industry.
Fig 8: Different factors, management techniques and inventory costs . Source: author
Note: a proposed model which explains the relationships between the different types of inventory costs, inventory
management tools and the key cost control key factors. Mastering tools and key factors allow the limitation and
minimization of inventory costs.
19
A remark should be highlighted at this stage. Those tools mentioned in section 4 do not have an influence
limited to a single type of cost, but their actions extend towards almost all types of costs. ABC analysis has a
direct influence on the holding and order cost, but also on the stockout cost by allowing the constitution of
large stocks on products classified in category C, which reduces the possibility of ending up out of stock.
Demand forecasting of automobile’s sales has a direct influence on the ordering cost by establishing a
detailed component ordering plan. This reduces the cost of item ownership by limiting the number of items
per shipment. As an indirect consequence of this technique, the risk of a stockout is significantly reduced
since customer demand and the number of items available (in theory) are equal.
OEMs and automakers are continuously working on the development of new products and technologies.
Benko and McFarlan (2003) consider that one of the most important aspects of this cooperation is the
reactivity of response to the needs of the market. This can be achieved in part by supplying a kit instead of
separate products. This approach allows both to increase the integration rate of the supplier and to reduce
the quantity of stock at the manufacturers. All this in exchange for a more extensive collaboration with the
car manufacturer in terms of quality and responsiveness. Benko and McFarlan (2003) cite as an example
the Japanese manufacturers (Toyota, Nissan) who buy equity shares from their suppliers and allow them to
develop entire product kits instead of single components.
The analysis of the inventory management tools identified in this thesis makes it possible to determine
points of common importance among them. These common points can be assimilated to factors influencing
the financial management of stocks. Controlling these factors allows a reduction in inventories costs at all
levels of the value chain. Fig 8 presents these factors which are quantity, predictability, prioritization, and
information.
5.1. Quantity Quantity is the key factor in inventory costs. It has a direct or indirect influence on all types of costs.
Directly, the inventory cost is a function of the quantity and unit price of the items stored. Indirectly, and
well before the installation of the production unit, the storage premises are dimensioned based on the
calculation of the average quantities required. The costs of managing these premises have a direct impact
on the costs, which is directly linked to the actual quantity of products stored, as mentioned in the
theoretical part of this thesis.
EOQ tries to find the optimal quantity in terms of cost to order (Digiesi et al., 2013). The ABC classification
makes it possible to determine the components with high values for which the determination of the
quantity to foresee in its stock is determining for the cost of storage (Wang, 2019). The JIT tries to reduce
the amount of stock to the minimum necessary (Peng and Zhou, 2017). The demand forecast for its part
tries to find a balance between the quantity in Stock and production needs (Yildiz et al., 2016). Supplier
integration makes it possible to combine several quantities of product in a single kit (Benko and McFarlan,
2003).

20
5.2. Predictability Automobile production operates in chain mode, also known as continuous production. One of the key
factors in this method is the work sequence, which means planning different types of vehicles to build one
after another. As a result, some components can be stored without needing them, generating unnecessary
costs.
Demand forecasting makes it possible to forecast the precise needs of each component in each period
(Yildiz et al., 2016). It aims to prevent the company from ordering it previously to store it unnecessarily.
This also makes it possible to extend the sequencing to the suppliers themselves so that they only deliver
what is requested from the auto manufacturer, which reduces stocks. It is also the principle of JIT which is
based on production forecasts.
Fig 9: Car sequence manufacturing (Yildiz et al., 2016)
5.3. Prioritization Pawel et al. (2008) estimate that the storage cost is directly linked to the nature of the component stored
since it is a function of the unit price of the latter. The higher the unit price of the products stored, the
higher the storage costs generated, including the cost of out of stock since the shortfall would be very
large.
Car manufacturers have an average of thousands of parts and sub-assemblies to manage at different stages
of production. A classification by importance of these items is essential for effective stock management.
The resources intended for inventory management are limited in terms of working hours, management
budgets and dedicated human resources. It will simply be necessary to prioritize between the different
articles. ABC analysis makes it possible to identify the 20% of products that generate more than 80% of the
cost (Pareto law which is integrated into the ABC analysis). The JIT technique and demand forecasting also
implicitly allow a classification of the inventories of products to be constituted during each step of the
process.
5.4. Information For Saturno et al. (2018), the reliability of inventory information is essential for the proper function of the
activities related to inventory management, especially in the automotive industry. The automotive industry
is characterized by having large inventories to manage and high product turnover, generally promoting
what is called a perpetual inventory system. This type of system allows inputs and outputs to be tracked in

21
real-time, updating the inventory account with each transaction. This is where the benefits of data
management are most evident.
A computerized inventory management system allows inventory levels to be known in real-time. This
increased confidence in the reality of current stocks makes it possible to review the minimum stock levels
downwards and to realize immediate financial gains. Knowing the stock in real-time also makes it possible
to control more precisely the maximum stock levels, when it is a question (products undergoing risks of
supply disruption, or at risk of suffering a significant price increase or requiring a strategic stock …etc.).
Better inventory management finally frees up and optimizes storage space, to increase the profitability per
square meter of warehouses.
In this literature study, it was noticed that there are close links between the different stock
management tools mentioned in this report. Some are either based on others or complementary to others.
ABC analysis forms a basis for choosing which products to apply the safety stock to, while the demand
forecast determines the quantity of this inventory. Demand forecasting constitutes the exclusive basis of all
these tools since it makes it possible to determine the nature of the need for each item at a given step of
the process (JIT), the desired quantity (EOQ + ABC) as well as taking into consideration possible supply
chain irregularities (Safety stock + integration of suppliers). Accurate forecasting is, therefore, a necessity to
guarantee the proper functioning of the value chain, including maintaining effective inventory management
through production. Forecasting can be defined as a rigorous analysis of a huge amount of data to get a
precise prediction of the future product's demand over a while. The future of inventory management in the
automotive industry will focus therefore more on information management to optimize the management
of physical inventories as much as possible. This will be made possible with the help of some industry 4.0
technologies as Big data analytics.
From another point of view, the information constitutes the basis of forecasting demand, to be able to
project clear and precise forecasts, car manufacturers base their previsions on a complex system of data
collection and analysis. This system implies implicit processing of data already recorded, data collected by
the network of sellers as well as geostrategic elements that may have an impact on the purchasing power
of consumers or what is commonly called by experts the economic climate. Technologies constituting
Industry 4.0, for example, big data analytics, Cloud and IoT in this case, allow the identification of possible
consumption trends and the rapid adaptation to these trends throughout the value chain to be as
competitive and responsive as possible. Therefore, the adoption of Industry 4.0 is a big challenge for the
automotive industry which allows it to be more flexible and to be able to control its production costs, of
which the inventory cost is an important element and a field of continuous improvement by far. The
promotion of the Cyber-Physical System (CPS) is a strategic bet for important activity sectors such as the
automotive industry.
The concept of industry 4.0 is based on the overall connectivity between all actors of the supply chain. It
means bigger integration of OEM in the automotive value chain. Suppliers will have a bigger impact on the
product than today's limited modular systems integration. It can extend to the design and engineering of
subassemblies, which will reduce components number for a car manufacturer and thus lower inventory
costs. It also means a higher data share rate with third parties such as transporters. Better forecasting of
22
goods to transport will permit the transporters to adapt logistic equipment to quantities which will
positively impact the delivery costs and timing.
With that said, many challenges arise when dealing with industry 4.0, such as defining the extent of data
share a car manufacturer is wailing to have with all these parties. Confidentiality is of big concern for car
manufacturer as sensitive data can be subject to illegal use, which can impact the competitiveness of the
car manufacturer and reduce its sell force and market share in the worst case.
It is an ever-developing subject which means that periodic updates must be introduced to the system.
Whether is it integrating new technologies or new management concepts. Depending on the decisions
made to reduce inventory management cost impact, other costs will emerge. It is therefore essential to
compare and establish a projection of the gains to obtain before implementing any.
To sum it all, effective inventory management is a strategic segment that is not reduced to single actions
and does not concern a single level of management. It is a complete system of solutions that must be
implemented at different levels of the company. This includes the involvement of the top management as
investments can be necessary. It also requires close collaboration with the various departments of the
company, since it is directly linked to the mode of production, cash flow, production rate, etc.
6. CONCLUSIONS AND RECOMMENDATIONS In this last chapter, conclusions are drawn from the analysis part and scientific questions are answered. In
the future, some proposals are presented which the author considers interesting to implement and which
may be based on this study.
This study aimed to explore the key factors influencing the cost of inventory management in the
automotive industry. This to clarify what can be called effective inventory management in this sector.
Through this literature study, it emerged that effective inventory management in the automotive industry
should take into consideration three big aspects. Those aspects are (1) physical management, (2) data
management, and (3) manufacturer-supplier relationship. Cost control tools were identified and the
dependencies between these tools were discussed.
The answer to the two research questions that have been set at the beginning of this study comes as
follow:
• RQ1: What are the factors and tools that influence inventory management cost and how?
These factors are Quantity, predictability, prioritization and information. All the tools seek to define the
optimum quantity of orders or stocks to have. They need to predict the needs over a period as well as
defining the right elements to ensure that no extra costs are generated unnecessarily. Those calculations
and predictions are made on basis of accurate information to meet effective inventory management.
• RQ2: What is the common attribute between all these factors and tools?
Forecasting is the common attribute, and the basis of all inventory management tools, especially in the
automotive industry where responsiveness to the market is essential and where the supply chain is
23
considerably long. The integration of the whole supply chain is a key factor in the successful cost control of
inventories. All the management tools used in inventory management are interconnected.
It is convenient to mention that this thesis covers a big subject from a limited perspective. The results and
findings of this work are not to be presented as an exhaustive list.
6.1. Recommendations A cost study comparison between the actual inventory management systems and the integrated
management system proposed by the concept of industry 4.0 within the automotive industry would be very
instructive. It is interesting to see the extent of gains in inventory management over time that car
manufacturer can be made from smart factories concept through the short, medium and long term.
It would be also interesting to study the impact of the combination of geographic localisation of car
manufacturer and the concept of industry 4.0 in inventory management cost-effectiveness. This would help
to understand the future trends when it comes to the globalisation of the automotive industry.

24
REFERENCES AL BARRAK, F., AL MERIOUH, Y. & ZNIBER EL MOUHABBIS, M. 2017. Work In Process stock
integrity in the automotive industry. Production & Manufacturing Research, 5, 2-14.
ALLEN, R. E. 1990. The Oxford Dictionary of current English, Oxford, Oxford Univ. Pr. AWHEDA, A., AB RAHMAN, M. N., RAMLI, R. & ARSHAD, H. 2016. Factors related to supply
chain network members in SMEs. Journal of Manufacturing Technology Management, 27, 312-335.
BALAJI, K. & KUMAR, V. S. S. 2014. Multicriteria Inventory ABC Classification in an Automobile Rubber Components Manufacturing Industry. Procedia CIRP, 17, 463-468.
BENKO, C. & MCFARLAN, W. 2003. Metamorphosis in the auto industry. Strategy & Leadership, 31, 4-8.
BOSE, D. C. 2006. Inventory management, New Delhi, PHI Learning Pvt. Ltd. DAVIS, R. A. 2013. Demand-Driven Inventory Optimization and Replenishment : Creating a
More Efficient Supply Chain, Somerset, UNITED STATES, John Wiley & Sons, Incorporated.
DIGIESI, S., MOSSA, G. & MUMMOLO, G. 2013. A Sustainable Order Quantity Model under Uncertain Product Demand. IFAC Proceedings Volumes, 46, 664-669.
DONGDONG, G. & XINGWU, Y. 2018. The Lean Management of Spare parts in Automotive Manufacturing. MATEC Web of Conference, 214, 04005.
HALIM, N. H. A., YUSUF, N., JAAFAR, R., JAFFAR, A., KASEH, N. A. I. & AZIRA, N. N. 2015. Effective Material Handling System for JIT Automotive Production Line. Procedia Manufacturing, 2, 251-257.
JIM WU, Y. C. 2002. Effective Lean Logistics Strategy for the Auto Industry. The International Journal of Logistics Management, 13, 19-38.
LAWSON, B., PIL, F. K. & HOLWEG, M. 2018. Multi-Modal Order Fulfillment: Concept and Application. Production and Operations Management, 27, 269-284.
LOULY, M.-A. O. & DOLGUI, A. 2009. Calculating safety stocks for assembly systems with random component procurement lead times: A branch and bound algorithm. European Journal of Operational Research, 199, 723-731.
MOHER, D., LIBERATI, A., TETZLAFF, J., ALTMAN, D. G. & GROUP, P. 2009. Preferred reporting items for systematic reviews and meta-analyses: the PRISMA statement. Journal of clinical epidemiology, 62, 1006-1012.
MULLER, M. 2011. Essentials of Inventory Management, Saranac Lake, UNITED STATES, AMACOM.
NYQUIST, H. 2017. Statistikens grunder : vetenskap, empiriska undersökningar och statistisk analys, Lund, Studentlitteratur.
PAWEL, P., MAREK, F. & PAULINA, G. Using ABC classification to determine production sequence in automotive industry. 2008 World Automation Congress, 28 Sept.-2 Oct. 2008 2008. 1-6.
PENG, T. & ZHOU, B. 2017. Scheduling the in-house logistics distribution for automotive assembly lines with just-in-time principles. Assembly Automation, 37, 51-63.

25
PILLER, F. T. 2004. Mass Customization: Reflections on the State of the Concept. International Journal of Flexible Manufacturing Systems, 16, 313-334.
RAMOS, E., PETTIT, T. J., FLANIGAN, M., ROMERO, L. & HUAYTA, K. 2020. Inventory management model based on lean supply chain to increase the service level in a distributor of automotive sector. International Journal of Supply Chain Management, 9, 113-131.
RIZKYA, I., SYAHPUTRI, K., SARI, R. M., ANIZAR, SIREGAR, I. & GINTING, E. 2018. Comparison of Periodic Review Policy and Continuous Review Policy for the Automotive Industry Inventory System. IOP Conference Series: Materials Science and Engineering, 288, 012085.
SATURNO, M., PERTEL, V. & DESCHAMPS, F. 2018. Proposal of an automation solutions architecture for Industry 4.0. Scientific journal of logistics, 14, 185-195.
SHENOY, D. & ROSAS, R. 2018. Problems & Solutions in Inventory Management, Cham, Springer International Publishing :.
SINGH, J. & SINGH, H. 2020. Application of lean manufacturing in automotive manufacturing unit. International Journal of Lean Six Sigma, 11, 171-210.
SRI NGADONO, T. & FITRI IKATRINASARI, Z. 2020. Raw Materials Inventory Planning in Automotive Industries by EOQ Method Consider with the Contract Agreement. IOP Conference Series: Materials Science and Engineering, 847, 012049.
SÄFSTEN, K., GUSTAVSSON, M. & EHNSIÖ, R. 2020. Research methodology : for engineers and other problem-solvers, Studentlitteratur.
VIALE, J. D. & CARRIGAN, C. 1996. Basics of Inventory Management : From Warehouse to Distribution Center, Menlo Park, UNITED STATES, Course Technology Crisp.
WANG, X. 2019. Optimization of ABC Classification Method for Automobile Spare Parts based on DEA. IOP Conference Series: Earth and Environmental Science, 252, 022005.
WÜLFERTH, H. 2013. Validity and Reliability of Empirical Discretion Model. Managerial Discretion and Performance in China: Towards Resolving the Discretion Puzzle for Chinese Companies and Multinationals. Berlin, Heidelberg: Springer Berlin Heidelberg.
YADAV, G., LUTHRA, S., JAKHAR, S. K., MANGLA, S. K. & RAI, D. P. 2020. A framework to overcome sustainable supply chain challenges through solution measures of industry 4.0 and circular economy: An automotive case. Journal of Cleaner Production, 254, 120112.
YILDIZ, H., DUHADWAY, S., NARASIMHAN, R. & NARAYANAN, S. 2016. Production Planning Using Evolving Demand Forecasts in the Automotive Industry. IEEE Transactions on Engineering Management, 63, 296-304.
YIN, R. K. 2018. Case study research and applications : design and methods, Thousand Oaks, California, SAGE.