Embed Size (px)
Citation preview
Effective leadership styles: a pilot
study in legal services
Lilian van de Water
Master of Business Administration
University Twente
Enschede 2014

Master Business Administration Lilian van de Water
University Twente s 0182273
2
UNIVERSITY OF TWENTE
Effective leadership styles: a pilot study in legal services
Master Thesis
MSc Business Administration: Service Management
Faculty of Management and Governance
Enschede, Netherlands
Researcher
Lilian van de Water
Boulevard Heuvelink 105
6828 KK Arnhem
The Netherlands
Telephone: 06 149 068 48
Email: [email protected]
Supervisors
Prof. Dr. C.C.J.M. Millar
Dr. Rainer Harms
M.J. Roersen, MSc
Date
March 2014

Master Business Administration Lilian van de Water
University Twente s 0182273
3
Acknowledgement
This research is a final thesis for my Master of Business Administration study with the specialization
of Service Management. The main goal of this thesis is to measure the effectiveness of several
current leadership styles.
I would like to thank all the people who were involved in this research. Without these friends and
family I could never made this research such a nice project to work on. I am grateful to
Prof. Dr. C.C.J.M. Millar, Dr. Rainer Harms and M.J. Roersen MSc as my first and second supervisors.
They gave me the right instructions, new ideas and approaches to move on with this research.
Lilian van de Water
March 2014

Master Business Administration Lilian van de Water
University Twente s 0182273
4
Management summary
This research is written by interest in the effectiveness of current leadership styles in legal service
organizations. The main question of this research is:
Which current leadership styles lead to most effective leadership in legal service organizations?
During the past four decades the relationship between leadership styles and organizational
performances was already a topic of interest in research. One of the reasons for this interest is that
several researchers considered that the adopted leadership style in organizations is important in
achieving organizational goals. Research showed that different leadership styles affect organizational
performance differently, depending on the context of the organization. There is no single effective
leadership style. Instead, an organization should adopt the leadership style that suits the context in
which the leader and the subordinate interact (Jing & Avery, 2011).
This research is written by interest in the effectiveness of current leadership styles in legal service
organizations. Legal service organizations are categorized in the context of knowledge-intensive
organizations. Knowledge-intensive organizations are often indicated as organizations with the great
latitude of their employees, emphasizing their freedom and the important of intellectual skills, as the
core competence of the organization. Knowledge is thereby identified as one of the most important
resources that contribute to the competitive advantage of an organization (Politis, 2001). Research
about leadership in knowledge-intensive organizations emphasize leadership as particularly
important. Leadership in knowledge intensive organizations is often characterized by leaders shaping
organizational conditions in order to allow the presumed core competence (the professional
employees close to the products and services) to develop their creativity so as to perform and
innovate successfully (Alvesson & Sveningsson, 2003).
The drivers of interest in today`s leadership theories are associated with changes and complexity in
business and organizational environments (Higgs, 2003). Nowadays, a growing interest in the
literature is focused on authentic leadership, complexity leadership, cross-cultural leadership, e-
leadership, ethical leadership, servant leadership, shared leadership, spiritual leadership and
responsible leadership (Avolio, Walumbwa & Weber 2009; Brown, Treviño & Harrison, 2005; Carter
& Greer, 2013). In the literature are no articles found who compares these different current
leadership styles on their effectiveness in the context of knowledge-intensive organizations. In this
research the authentic, ethical, and servant leadership styles are chosen as variables for the current
leadership styles. The reasons for the choice of these leadership styles is based on two aspects. The
first aspect is based on the available and usable information in the literature. These leadership styles
getting (again) attention in the literature over the last few years, and were so interested that several
researches already developed different definitions, conceptualizations and measures of these
leadership styles. The second reason for these leadership styles is based on the fact of why these
leadership styles were used or again used. These leadership styles were al getting attention in the
literature after the corporate scandals and management malfeasance from the previous years.
In the literature many performance indicators are given, but a performance indicator is specific
chosen, depending on the goals of the organization (Carter & Greer, 2013; Popova & Sharpanskykh,

Master Business Administration Lilian van de Water
University Twente s 0182273
5
2010; Richard, Devinney, Yip, & Johnson, 2009). In this research the performance indicators are
defined as customer satisfaction, job satisfaction, and revenue. These performance indicators are
findings from a research from 6 leaders in different organizations. These leaders are managing a
knowledge-intensive organization or a knowledge-intensive part of an organization, meaning that a
large part of the work in the organization of part of the organization is primarily intellectual, it draws
on mental abilities rather than physical strength or manual craft.
This legal service organizations research is taken by 38 lawyers from 10 different legal service
organizations in the period November 2013. The choice of the legal service organizations is based on
the connection within the researchers` social network. In every organization one person is working
who knows the researcher personally. These persons were the contact persons for the organization
and they were asked for more lawyers to fill in the survey in their organization. In every organization
that has more than 20 lawyers, the survey is filled in by one of every ten lawyers. In every
organizations who has less than 20 lawyers the survey is filled in by one of every five lawyers. The
research is taken in a web survey with open and closed questions.
To measure the goal of this legal service organizations research, the 38 lawyers from the different
legal service organizations rated their leader on the different leadership styles and performance
indicators. These leadership styles and performance indicators need to be filled in by a Likert scale
(Vennix, 2006).
Based on the results from the legal service organizations research only one leadership style has
significant influence on one performance indicator. This leadership style is the ethical leadership style
and the performance indicator is customer satisfaction. Ethical leadership leads to most customer
satisfaction in the different legal service organizations, the other measured leadership styles and
performance indicators are not significant related to each other.

Master Business Administration Lilian van de Water
University Twente s 0182273
6
Table of contents
Acknowledgement 3
Management summary 4
1.0 Introduction 9
1.1 Introduction research 9
1.2 Leadership 9
1.2.1 General leadership 9
1.2.2 History of leadership 10
1.3 Effective leadership 11
1.3.1 General effective leadership 11
1.3.2 Performance indicators 12
1.4 Context of the research 12
1.4.1 Knowledge-intensive organizations 12
1.4.2 Context organization 13
1.4.2.1 Leadership styles 13
1.4.2.2 Performance indicators 13
1.5 Research question 14
2.0 Literature research 15
2.1 Leadership styles 15
2.1.1 Authentic leadership: short history and definition 15
2.1.2 Authentic leadership: current interest 16
2.1.3 Authentic leadership: operationalization and measurement 16
2.1.4 Ethical leadership: short history and definition 17
2.1.5 Ethical leadership: current interest 17
2.1.6 Ethical leadership: operationalization and measurement 17
2.1.7 Servant leadership: short history and definition 18
2.1.8 Servant leadership: current interest 19
2.1.9 Servant leadership: operationalization and measurement 19
2.2 Organizational performance indicators 19
2.2.1 Customer satisfaction: definition 19
2.2.2 Customer satisfaction and leadership styles 20
2.2.3 Job satisfaction: definition 20
2.2.4 Job satisfaction and authentic leadership 20
2.2.5 Job satisfaction and ethical leadership 21
2.2.6 Job satisfaction and servant leadership 21
2.2.7 Revenue and authentic leadership 22
2.2.8 Revenue and ethical leadership 22
2.2.9 Revenue and servant leadership 22
2.3 Overview hypothesis 23

Master Business Administration Lilian van de Water
University Twente s 0182273
7
3.0 Methodology 24
3.1 Sample legal service organizations research 24
3.2. Operationalization legal service organizations research 25
3.2.1 Measurement authentic leadership 25
3.2.2 Measurement ethical leadership 26
3.2.3 Measurement servant leadership 26
3.2.4 Measurement customer satisfaction 28
3.2.5 Measurement job satisfaction 28
3.2.6 Measurement revenue 29
3.2.7 Measurement relationship leadership styles and customer satisfaction 29
3.3 Method of analysis legal service organizations research 29
4.0 Research findings 31
4.1 Findings legal service organizations research 31
4.2 Basic results 31
4.2.1 Authentic leadership 31
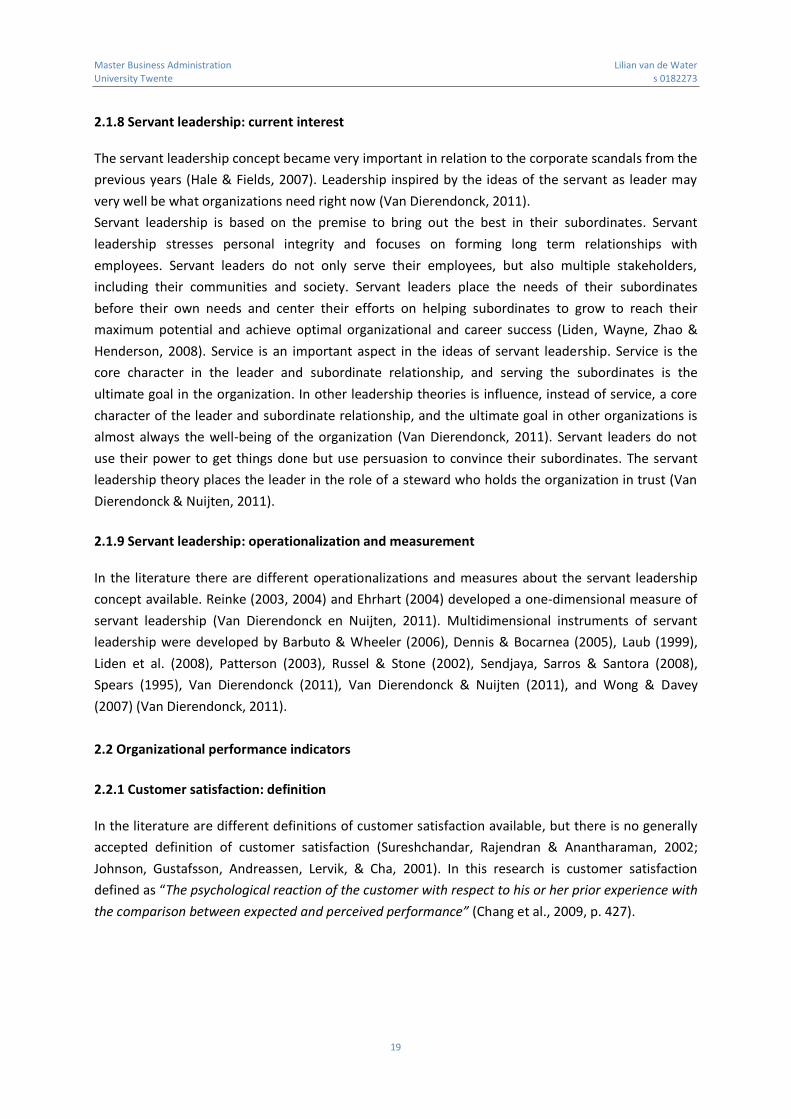
4.2.2 Ethical leadership 32
4.2.3 Servant leadership 33
4.2.4 Customer satisfaction 34
4.2.5 Job satisfaction 35
4.2.6 Revenue 35
4.2.7 Relationship between leadership styles and customer satisfaction 36
4.3 Main results 37
4.3.1 Correlation analysis 37
4.3.2 Multiple regression analyses 38
4.3.2.1 Authentic leadership and customer satisfaction 38
4.3.2.2 Authentic leadership and job satisfaction 40
4.3.2.3 Authentic leadership and revenue 41
4.3.2.4 Ethical leadership and customer satisfaction 42
4.3.2.5 Ethical leadership and job satisfaction 44
4.3.2.6 Ethical leadership and revenue 45
4.3.2.7 Servant leadership and customer satisfaction 46
4.3.2.8 Servant leadership and job satisfaction 48
4.3.2.9 Servant leadership and revenue 49
4.3.2.10 Summary authentic leadership 50
4.3.2.11 Summary ethical leadership 51
4.3.2.12 Summary servant leadership 52
5.0 Conclusion 53
5.1 Implications for further research 53
5.2 Limitations 54
5.3 Implications for practice 54

Master Business Administration Lilian van de Water
University Twente s 0182273
8
References 55
Appendix 1: Research performance indicators 62
Appendix 2: Research questions 71
Appendix 3: Interview details 75
Appendix 4: The Authentic Leadership Inventory (ALI) 78
Appendix 5: The Ethical Leadership at Work (ELW) questionnaire 79
Appendix 6: The Servant Leadership Survey (SLS) 81
Appendix 7: Customer satisfaction index (CSI) 82
Appendix 8: Job Satisfaction Index (JSI) 5-item version 83
Appendix 9: Revenue index (RI) 84
Appendix 10: Research results 85
Appendix 11: Assumptions correlation and multiple linear regression analyses 91

Master Business Administration Lilian van de Water
University Twente s 0182273
9
1.0 Introduction
1.1 Introduction research
This research is written by interest in the effectiveness of current leadership styles in legal service
organizations. A leadership style is a part of the overall leadership concept and indicates the manner
or process of social influence which a leader can lead and enlist the support of subordinates to
accomplish a task (Chan, Ng & Jee, 2012). Leadership can be described as a process of influence
toward the achievement of organizational objectives. Leadership is thereby generally focused on the
dyadic relationship between a leader and a subordinate (Amagoh, 2009).
Leadership effectiveness can be explained as a leaders success in influencing subordinates to
achieving organizational goals (Amagoh, 2009). Effective leadership is often seen as a source of
competitive advantage (Kim, 2007) and the foundation for organizational performance and growth.
The absence of effective leadership has impact on the ability to meet performance expectations
(Vardiman, Houghton, & Jinkerson, 2006), and to implement and sustain strategic change activities.
The essential roles of effective leaders include establishing and reinforcing values and purpose,
developing a vision and the strategies necessary to achieve the vision, building the community
necessary to implement the strategies, and initiating and managing the changes necessary to assure
growth and survival (Amagoh, 2009).
In the next paragraphs an introduction to the concepts of leadership and effective leadership is
given. Paragraph 1.2 gives an definition of the leadership concept followed by an history of the
different leadership theories. Paragraph 1.3 gives an introduction to effective leadership and
measurement of effective leadership by different performance indicators. These paragraphs lead to
the context of this research, written in paragraph 1.4 and 1.5.
1.2 Leadership
1.2.1 General leadership
A leadership style is a part of the overall leadership concept (Chan et al., 2012). In the literature is no
generally accepted definition or concept of leadership given. One of the reasons for this fact is that
the terms of leadership and management are often used interchangeable. Several studies on
leadership and management indicate that these concepts are the same, or at least related, but other
studies show differences between these concepts. There is also no agreement about the roles of
managers or leaders to the performance of the organization. There is an ongoing debate about the
relevance and significance of leadership and its role in the performance of the organization
compared to that of management. On examining the management and leadership literature, it
appears that both concepts are concerned with the overall performance of the organization
(Nienaber, 2011).
In this research are the concepts of leadership and management seen as the same and defined with
the four most common conceptualizations. Leadership or management (a) is a process (b) entails
Master Business Administration Lilian van de Water
University Twente s 0182273
10
influence, (c) occurs within a group setting or context, and (d) involves achieving goals that reflect a
common vision (Cummings et al., 2010, p. 364).
1.2.2 History of leadership
This paragraph gives a short overview of the history of leadership theories. The primary focus of the
general leadership concept was based on studying an individual leader, who was most likely seen as a
man. This leader was thereby almost always working in the private sector in the United States. In
recent years the study of leadership is also focused on subordinates, peers, supervisors, work
settings, and culture instead of only the individual leader. The range of the working man in the
private sector in the United States is extended to the entire spectrum of diversity, public, private, and
not-for profit organizations from nations around the globe. The first definitions about leadership
were described as individual characteristics or differences, but now leadership is more described as a
dyadic, shared, relational, strategic, global, and complex social dynamic (Avolio et al. 2009).
In Bass & Stogdill (1990) handbook of leadership a historical review of the most important theories
and models of leadership is given. In the last 100 years were a lot of different leadership theories
developed. Some leadership theories followed each other, but others were developed parallel in
time. Until the 1950s, most leadership theories were focused on the personal traits of leaders,
followed until the late 1960s by the rose of personal styles of leadership. From the late 1960s to the
early 1980s, leadership theories were based on a mix of leaders and subordinates, traits and
situations. In the 1980s leadership theories of inspiration and transformation were coming up and
became prominent in the 1990s and the beginning of the twenty-first century (Bass & Bass, 2009).
Several researchers suggests that the history of leadership is shaped by the leadership of the great
man. The great man theories were a part of the categorized `Personal & situational theories` in Bass
& Stogdill (1990) handbook of leadership. The great man is a person who contained unique qualities
that capture the imagination of the masses. These unique qualities were inherited, and almost all
leaders were a man from the upper class. The great man was born and not made to be a leader. The
great man theories evolved into the trait theories. The rise of the trait theories came by the
assumption that the great leader was contained with superior qualities that differ from his
subordinates, so it should be possible to identify those qualities. In this period, researchers wanted
to know what traits distinguish the leaders from other people and what the extent of those
difference was (Bass & Stogdill, 1990). In direct opposition to the trait theories came the situational
theories. The situational researchers believe that leadership is all a matter of situational demands.
The situational factors determine who will emerge as leader, and favored the theory that the leader
was born and not made. The researchers of the great man and situational theories continued the
discussion of personality or situation was the more important factor of leadership. The situationalist
saw the great leader as a result of time, place and circumstances (Bass & Bass, 2009). After wars and
other crises, various researchers maintained that the situation alone was not sufficient to account for
leadership. The researchers from both great man and situational theories overlooked now the
combining effects of individual and situational factors, instead of one single aspect. This area was
labeled as the person-situational theories. The person-situational theories dominated the field of
leadership. These theories build on the idea to match the individuals` personal history, competencies

Master Business Administration Lilian van de Water
University Twente s 0182273
11
and traits with the requirements of a job (Bass & Bass, 2009). Around the 1960s, humanistic theories
of leadership came into sight, also named social psychology theories of leadership. These theories
build on the individual in an effective and cohesive organization, grounded in the American ideals of
democracy and individual freedom. The human being is from nature a motivated organism and the
organization is by nature structured and controlled. The function of leadership is thereby to modify
the organization to provide freedom for individuals to realize their motivational potential for the
fulfillment of their needs, and to contribute to the accomplishment of organizational goals. Famous
humanistic or social psychology theories came from Mc Gregor, Argyris, Likert, Hersey & Blanchard,
Blake & Mounton, Rost and Maslow (Bass & Stogdill, 1990 and Bass & Bass, 2009).
Bass & Stogdill (1990) categorized also the `Interaction & social learning theories`. The humanistic or
social psychology theories formed the basis for the interaction & social learning theories, and many
other theories of leadership. Social interaction and social learning theories explained the leader-
subordinate relationship as a consequence of the leaders interaction with the subordinates and the
circumstances. Interaction theories were characterized as the combination of the leaders
personality; the subordinates` needs, values, attributes and personality; and the group structure of
interpersonal relations, character, task, and environmental setting (Bass & Bass, 2009). The theories
of interaction & social learning were divided into leader-role theories, theories on attaining the
leadership role, reinforced-change theory, path-goal theories, and contingency theories (Bass &
Stogdill, 1990).
Recent studies about leadership were categorized as` Hybrid theories`. A part of the hybrid theories is
defined as transformational leadership. By 1960, the dominant paradigm of leadership had evolved
into a more dynamic approach of leadership instead of the research on the traits and situations that
effect leadership. This dynamic approach was seen in the transaction or exchange between the
leader and the subordinate. Leaders exchanged thereby promises of rewards (Bass & Stogdill, 1990),
so that the subordinates act like the leaders` wishes. The leader motivated the subordinates to
perform as expected (Hartog, Muijen & Koopman, 1997). This kind of leadership is called
transactional leadership. Building on the transactional leadership, came between the 1980s
transformational leadership (Bass & Stogdill, 1990). The transformational leader inspired
subordinates to do more than originally expected (Hartog et al, 1997). The transformational leader
asks subordinates to transcend their own self-interest for the good of the group, organization or
society. They ask also their subordinates to consider their long term needs to develop themselves,
rather than their needs of the moment; and to become more aware of what is really important (Bass
& Stogdill, 1990). This transformational leadership theory became prominent in the 1990s and the
beginning of the twenty-first century (Bass & Bass, 2009).
1.3 Effective leadership
1.3.1 General effective leadership
Leadership effectiveness can be explained as a leaders success in influencing subordinates to
achieving organizational goals (Amagoh, 2009). Organizational performance measurement and
analysis is crucial for managing the organization to realize its organizational goals. Measuring and

Master Business Administration Lilian van de Water
University Twente s 0182273
12
analyzing organizational performance plays an important role in translating organizational goals to
reality. It is essential for an organization to determine the relevant performance indicators, how they
were related to the formulated organizational goals, and how they depend on the performance
activities (Popova & Sharpanskykh, 2010). Organizational performance is essential to the survival and
success of the modern organization and acquires a central theme in the modern organizational
activity. Measuring organizational performance is thereby essential for leaders. Measuring
organizational performance allows leaders to evaluate the specific actions of organizations and
leaders, where the organizations stand in comparison with their competitors, and how organizations
evolve and perform over time (Richard et al. 2009).
1.3.2 Performance indicators
In this research is effective leadership measured by different performance indicators. In the literature
are different measures of organizational performance indicators given. Performance indicators are
specific chosen, depending on the goals of the organization. The diversity of approaches is based
from single to multiple measures, objective to subjective indicators, qualitative to quantitative
indicators, and based on the large range of financial, product-market, shareholder, innovation,
efficiency, social, and environmental measures (Carter & Greer, 2013; Popova & Sharpanskykh, 2010;
Richard et al., 2009).
1.4 Context of the research
1.4.1 Knowledge-intensive organizations
During the past four decades the relationship between leadership styles and organizational
performances was already a topic of interest in research. One of the reasons for this is that several
researchers considered that the adopted leadership style in organizations is important in achieving
organizational goals. Research showed that different leadership styles affect organizational
performance differently, depending on the context of the organization. There is no single effective
leadership style. Instead, an organization should adopt the leadership style that suits the context in
which the leader and the subordinate interact (Jing & Avery, 2011).
This research is written by interest in the effectiveness of current leadership styles in legal service
organizations. Legal service organizations are categorized in the context of knowledge-intensive
organizations. Knowledge-intensive organizations are often indicated as organizations with the great
latitude of their employees, emphasizing their freedom and the important of intellectual skills, as the
core competence of the organization. Knowledge is thereby identified as one of the most important
resources that contribute to the competitive advantage of an organization (Politis, 2001). Research
about leadership in knowledge-intensive organizations emphasize leadership as particularly
important. Leadership in knowledge intensive organizations is often characterized by leaders shaping
organizational conditions in order to allow the presumed core competence (the professional
employees close to the products and services) to develop their creativity so as to perform and
innovate successfully (Alvesson & Sveningsson, 2003).

Master Business Administration Lilian van de Water
University Twente s 0182273
13
1.4.2 Context organization
In the literature many articles are found who studied the relationship between leadership styles and
the effectiveness of these styles, but a restricted number of leadership styles were studied in these
articles. Much research has been done about the transactional and transformational leadership style
concepts (Jing & Avery, 2011), also in knowledge intensive organizations (Politis, 2001).
Transactional leadership was the dominant leadership style in the 1960s, while transformational
leadership became prominent in the 1990`s and the begin of the twenty-first century (Bass & Bass,
2009). These styles are not usable for this research, because they are not from the last couple of
years.
1.4.2.1 Leadership styles
The drivers of interest in today`s leadership theories are associated with changes and complexity in
business and organizational environments (Higgs, 2003). Nowadays, a growing interest in the
literature is focused on authentic leadership, complexity leadership, cross-cultural leadership, e-
leadership, ethical leadership, servant leadership, shared leadership, spiritual leadership and
responsible leadership (Avolio et al., 2009; Brown et al., 2005; Carter & Greer, 2013). In the literature
are no studies found who compares these different current leadership styles on their effectiveness in
the context of knowledge-intensive organizations. In this research the authentic, ethical, and servant
leadership styles are chosen as variables for the current leadership styles. The reasons for the choice
of these leadership styles is based on two aspects. The first aspect is based on the available and
usable information in the literature. These leadership styles getting (again) attention in the literature
over the last few years, and were so interested that several researches already developed different
definitions, conceptualizations and measures of these leadership styles. The second reason for these
leadership styles is based on the fact of why these leadership styles were used or again used. These
leadership styles were al getting attention in the literature after the corporate scandals and
management malfeasance from the previous years.
1.4.2.2 Performance indicators
In the literature many performance indicators are given, but a performance indicator is specific
chosen, depending on the goals of the organization (Carter & Greer, 2013; Popova & Sharpanskykh,
2010; Richard et al., 2009). In this research the performance indicators are defined as customer
satisfaction, job satisfaction, and revenue. These performance indicators are findings from a research
from 6 leaders in different organizations. These leaders are managing a knowledge-intensive
organization or a knowledge-intensive part of an organization, meaning that a large part of the work
in the organization of part of the organization is primarily intellectual, it draws on mental abilities
rather than physical strength or manual craft. In Appendix 1 the details of this research are
described.

Master Business Administration Lilian van de Water
University Twente s 0182273
14
1.5 Research question
Based on the interest of the leadership concept and the given background, is the research question
defined as follows:
Which current leadership styles lead to most effective leadership in legal service organizations?
The current leadership styles are characterized as authentic, ethical, and servant leadership styles
and effective leadership is measured by the performance indicators customer satisfaction, job
satisfaction, and revenue. This research starts with a literature review about the single concepts of
authentic leadership, ethical leadership, and servant leadership. After these parts, the concepts of
customer satisfaction, job satisfaction and revenue are described and a comparison between these
concepts and the different leadership styles is made. After the literature study the method for this
research is explained, followed by the research results and conclusion.

Master Business Administration Lilian van de Water
University Twente s 0182273
15
2.0 Literature research
In this chapter, the literature review about the authentic leadership, ethical leadership, servant
leadership, customer satisfaction, job satisfaction, and revenue concepts are given. There is searched
for the following subjects of the different leadership styles: short history, definition, current interest,
operationalization and measurement. In this chapter a short introduction about the
operationalization and measurement is given, in the next chapter these aspects are further analyzed.
In this literature research is also searched for the definition and measurement of the customer
satisfaction and job satisfaction concepts, and the measurement of the revenue concept. At last is
searched for the relationships between these current leadership styles and performance indicators,
and are hypotheses formulated.
For this literature research, guidelines for a systematic literature research are followed. Literature is
found on the following online search sites: Web of science, www.scholar.google.nl,
www.springerlink.com, www.jstor.org, www.scopus.com, www.sciencedirect.com. These sources are
searched on the following keywords: authentic leadership, ethical leadership, servant leadership,
customer, satisfaction, job satisfaction, revenue, and the combinations with history, definition,
current interest, operationalization, and measurement. A selection of relevant articles and books is
first of all made on their title and abstract. The relevant articles and books are used to find more
useful information.
2.1 Leadership styles
2.1.1 Authentic leadership: short history and definition
A variety of definitions about authentic leadership became more advanced over the years.
Henderson & Hoy (1983) were the first researches who define authentic leadership (Gardner,
Cogliser, Davis & Dickens, 2011) as “the extent to which subordinates perceive their leader to
demonstrate the acceptance of organizational and personal responsibility for actions, outcomes, and
mistakes; to be non-manipulating of subordinates; and to exhibit salience of self over role”
(Henderson & Hoy, 1983, pp. 67-68). Although the first definition of authentic leadership was
developed in 1983, the interest in this subject returned around the year 2003. This comeback was
stimulated by the research of Luthans & Avolio (2003), and the book of George (2003) about
authentic leadership (Gardner et al., 2011). Luthans & Avolio (2003) wrote in their research the need
for scholarly research about the positive aspects of authenticity as a component of leadership, and
George (2003) argued the need for a new type of leader to bring effective as well as ethical
leadership to organizations in wake of the corporate scandals of the 2000s.
Until now, after many years of research, there is still no single accepted definition about authentic
leadership, and several researchers use the term in different ways. Certain elements to define an
authentic leader, shared by the majority of the researchers, are; possessing self-knowledge and a
personal point of view, identifying strongly with their leadership role, expressing themselves by
enacting that role, and acting on the basis of their values and convictions (Shamir & Eilam, 2005).
Bruce Avolio, William Gardner, Fred Luthans, Doug May, and Fred Walumbwa seems to be the key

Master Business Administration Lilian van de Water
University Twente s 0182273
16
researches of the authentic leadership concept. These researchers and their colleagues developed in
recent years different definitions about authentic leadership, and culminated with the definition in
Walumbwa, Avolio, Gardner, Wernsing & Peterson (2008). Based on this information is in this
research the definition of Walumbwa et al. (2008) being used. Walumbwa et al. (2008) define
authentic leadership as:
A pattern of leader behavior that draws upon and promotes both positive psychological capacities
and a positive ethical climate, to foster greater self-awareness, an internalized moral perspective,
balanced processing of information, and relational transparency on the part of leaders working with
followers, fostering positive self-development. (p. 94)
2.1.2 Authentic leadership: current interest
In previous years authentic leadership was seen as an extension of transformational leadership.
Nowadays authentic leadership is more seen as a root concept that underlies the positive aspects of
charismatic, transformational, spiritual, and ethical leadership theories (Neider & Schriesheim, 2011).
The recent interest in authentic leadership is a result of taking a macro level perspective, an upswing
in highly publicized corporate scandals, management malfeasance, and broader societal challenges
facing public and private organizations. These combined aspects effected the call for more positive
forms of leadership in organizations, and to restore confidence in all levels of leadership (Walumbwa
et al., 2008). The objectives of the authentic leadership theory are twofold. First, authentic
leadership address the ethical crisis in organizations. Authentic leadership is a `moral compass`, to
help in the struggling of corporate scandals and management malfeasance, foster ethical climates
and aids to conduct business in an ethical and socially responsible manner. Second, authentic
leadership focuses to help people find meaning and connection in their work, and increases the well-
being of organizational members (Algera & Lips-Wiersma, 2012).
2.1.3 Authentic leadership: operationalization and measurement
As noted in the first paragraph, Henderson & Hoy (1893) were the first researchers who defined
authentic leadership. They also operationalized the authentic leadership concept and developed the
Leader Authenticity Inventory (LAI) for measuring the aspects defined in their definition of authentic
leadership. There were a lot of comments about this research given, and after the call for scholarly
research in 2003, alternative measures were developed (Gardner et al., 2011). In recent years, the
majority of the studies have used either the Authenticity Inventory (AI: 3) or the Authentic
Leadership Questionnaire (ALQ) to operationalize the authentic leadership concept. Kernis &
Goldman (2005, 2006) designed the AI: 3 to measure individual authenticity, as opposed to authentic
leadership. The ALQ is developed by Avolio, Gardner, Luthans, May, Walumbwa & colleagues (Avolio
& Gardner, 2005; Gardner, Avolio, Luthans, May & Walumbwa, 2005; Walumbwa et al., 2008) to
measure authentic leadership (Gardner et al., 2011).
Master Business Administration Lilian van de Water
University Twente s 0182273
17
2.1.4 Ethical leadership: short history and definition
Until 2005, the ethical leadership concept was not studied as a single leadership style. The study of
ethical leadership was focused on ethical components in different leadership styles, like authentic,
charismatic, spiritual and transformational leadership (Kalshoven, Den Hartog & De Hoogh, 2011a;
Kalshoven Den Hartog & De Hoogh, 2011b; Brown & Treviño, 2006). Ethical leadership can be seen in
different perspectives. Brown et al. (2005) sees ethical leadership as a social learning perspective. In
this social learning perspective uses the leader transactional efforts, and role modeling of
appropriate behavior to stimulate the behavior of the subordinates. Other researchers expected that
ethical leaders are driven by a system of accepted believes and appropriate judgments instead of
self-interest, which is beneficial for subordinates, organizations, and society (Kalshoven et al. 2011a).
Brown et al. (2005) were the first researchers who studied ethical leadership as a separate leadership
style (Kalshoven et al., 2011a) and defined ethical leadership as the demonstration of normatively
appropriate conduct through personal actions and interpersonal relationships, and the promotion of
such conduct to followers through two-way communication, reinforcement, and decision-making. (p.
120). This definition is in recent years often used by several researchers (Kalshoven et al., 2011a;
Kalshoven et al. 2011b), and is the reason why this definition is being used in this research.
2.1.5 Ethical leadership: current interest
Ethical leadership became very important in relation to the recent ethical and fraud scandals in
diverse organizations (Brown & Treviño, 2006; Kalshoven et al., 2011b). Ethical leaders were seen as
fair and principle centered decision-makers, and were characterized as honest, caring, and principles
leaders. These leaders do not only care about their subordinates, but also about society. Ethical
leaders behave ethically in their personal and professional lives. The ethical leader influenced the
ethical and unethical behaviors of subordinates by means of proactive efforts. This means that the
ethical leader frequently communicate with their subordinates about ethics and ethical standards,
and use rewards and punishments for the correct performing of these standards (Brown & Treviño,
2006).
2.1.6 Ethical leadership: operationalization and measurement
In the literature only a few measures of ethical leadership were available. Most of the researches see
ethical leadership as a multi-dimensional concept, but the one-dimensional measure of Brown et al.
(2005) is currently often used in researches (Kalshoven et al., 2011b). Brown et al. (2005) were the
first researchers who developed a measure for ethical leadership (Kalshoven et al. - 2011a). In the
following years De Hoogh & Den Hartog (2008), Resick, Hanges, Dickson & Mitchelson (2006) and
Kalshoven et al. (2011b) developed different multi-dimensional measures of ethical leadership
(Kalshoven et al., 2011b).

Master Business Administration Lilian van de Water
University Twente s 0182273
18
2.1.7 Servant leadership: short history and definition
The basis of the servant leadership concept is more than 40 years ago written by Greenleaf, first
published in 1970:
It begins with the natural feeling that one wants to serve, to serve first. Then conscious choice brings
one to aspire to lead. The difference manifests itself in the care taken by the servant—first to make
sure that other people`s highest priority needs are being served. The best test is: Do those served
grow as persons; do they, while being served, become healthier, wiser, freer, more autonomous, more
likely themselves to become servants? (p. 4)
Greenleaf (1977) described his ideas of the servant as leader, however he did not give a definition of
servant leadership. Inspired by the work of Greenleaf were in the last 40 years many interpretations
of servant leadership given (Van Dierendonck, 2011). After all these years, there is still no consensus
about a definition of servant leadership, and the concepts of servant leadership vary greatly (Van
Dierendonck & Nuijten, 2011). Most of the researchers did not give a definition of the servant
leadership concept, but describe servant leadership on a basis of several dimensions or
characteristics. Some of these concepts seems to be more important, but none is given to focus on.
Therefore in this research the description of Greenleaf (1970) as definition of the servant leader has
been used.
The researches of Patterson (2003), Russel & Stone (2002), and Spears (1995) were one of the most
influential studies of servant leadership (Van Dierendonck, 2011). In the following paragraph the
dimensions or characteristics from these studies are explained, so that the variety of the servant
leadership concept becomes visible.
Spears (1995) developed ten characteristics of the servant as a leader. Spears was the CEO of the
Greenleaf Center for Servant Leadership and his work was related direct and indirect to the writings
of Greenleaf. The ten characteristics of Spears research are often used as input for various studies.
These ten characteristics are listening, empathy, healing, awareness, persuasion, conceptualization,
foresight, stewardship, growth, and building community. Russel & Stone (2002) developed nine
functional and eleven accompanying characteristics of servant leadership. These 20 characteristics
were based on an exhausting review of the servant leadership literature in 2002, including the
literature of Spears and the interpretations of Greenleaf his writings by several researchers. Russel &
Stone (2002) combine these reviews together in 20 characteristics. The nine functional
characteristics are vision, honesty, integrity, trust, service, modeling, pioneering, appreciation of
others and, empowerment. The eleven accompanying characteristics are defined as communication,
credibility, competence, stewardship, visibility, influence, persuasion, listening, encouragement,
teaching, and delegation. Patterson (2003) presented a theory of servant leadership as an extension
on the transformational leadership theory. This theory was based on the observation that the
transformational theory was not addressing some essential characteristics for subordinates. So she
described servant leadership as seven virtues which define a servant leader. These virtues are
agapao love, humility, altruistic, visionary, trusting, serving and, empowers subordinates.
Master Business Administration Lilian van de Water
University Twente s 0182273
19
2.1.8 Servant leadership: current interest
The servant leadership concept became very important in relation to the corporate scandals from the
previous years (Hale & Fields, 2007). Leadership inspired by the ideas of the servant as leader may
very well be what organizations need right now (Van Dierendonck, 2011).
Servant leadership is based on the premise to bring out the best in their subordinates. Servant
leadership stresses personal integrity and focuses on forming long term relationships with
employees. Servant leaders do not only serve their employees, but also multiple stakeholders,
including their communities and society. Servant leaders place the needs of their subordinates
before their own needs and center their efforts on helping subordinates to grow to reach their
maximum potential and achieve optimal organizational and career success (Liden, Wayne, Zhao &
Henderson, 2008). Service is an important aspect in the ideas of servant leadership. Service is the
core character in the leader and subordinate relationship, and serving the subordinates is the
ultimate goal in the organization. In other leadership theories is influence, instead of service, a core
character of the leader and subordinate relationship, and the ultimate goal in other organizations is
almost always the well-being of the organization (Van Dierendonck, 2011). Servant leaders do not
use their power to get things done but use persuasion to convince their subordinates. The servant
leadership theory places the leader in the role of a steward who holds the organization in trust (Van
Dierendonck & Nuijten, 2011).
2.1.9 Servant leadership: operationalization and measurement
In the literature there are different operationalizations and measures about the servant leadership
concept available. Reinke (2003, 2004) and Ehrhart (2004) developed a one-dimensional measure of
servant leadership (Van Dierendonck en Nuijten, 2011). Multidimensional instruments of servant
leadership were developed by Barbuto & Wheeler (2006), Dennis & Bocarnea (2005), Laub (1999),
Liden et al. (2008), Patterson (2003), Russel & Stone (2002), Sendjaya, Sarros & Santora (2008),
Spears (1995), Van Dierendonck (2011), Van Dierendonck & Nuijten (2011), and Wong & Davey
(2007) (Van Dierendonck, 2011).
2.2 Organizational performance indicators
2.2.1 Customer satisfaction: definition
In the literature are different definitions of customer satisfaction available, but there is no generally
accepted definition of customer satisfaction (Sureshchandar, Rajendran & Anantharaman, 2002;
Johnson, Gustafsson, Andreassen, Lervik, & Cha, 2001). In this research is customer satisfaction
defined as “The psychological reaction of the customer with respect to his or her prior experience with
the comparison between expected and perceived performance” (Chang et al., 2009, p. 427).

Master Business Administration Lilian van de Water
University Twente s 0182273
20
2.2.2 Customer satisfaction and leadership styles
In the literature are no studies or theories found who were related to the relationship between
customer satisfaction and authentic, ethical or servant leadership. Based on the results of the legal
service organizations research (next chapter), are the following hypotheses formulated.
Hypothesis 1
Authentic leadership is positive related to customer satisfaction.
Hypothesis 2
Ethical leadership is positive related to customer satisfaction.
Hypothesis 3
Servant leadership is positive related to customer satisfaction.
2.2.3 Job satisfaction: definition
There is no generally accepted definition of job satisfaction (Weiss, 2002). Job satisfaction has been
an important research concept and there were many definitions developed by several researchers
(Thompson & Phua, 2012). Cranny, Smith & Stone (1992) suggested that there is a clear consensus in
the different definitions of job satisfaction. Their consensus definition of job satisfaction is defined as
“an affective (that is, emotional) reaction to one’s job, resulting from the incumbent’s comparison of
actual outcomes with those that are desired (expected, deserved, and so on.)’’ (p. 1). This definition is
used in this research.
2.2.4 Job satisfaction and authentic leadership
Empirical evidence of the direct relationship between authentic leadership and job satisfaction is not
available (Walumbwa et al., 2008). Although there is no evidence for the direct relationship between
these two variables, there are several studies and theories who suggest that there might be a
positive relationship.
Theories of the authentic leadership concept suggest that authentic leadership should be positive
related to job satisfaction (Walumbwa et al., 2008). A reason for this possible relationship is that
authentic leaders have more satisfied subordinates, because their goals as leaders were more
focused on the values and the well-being of the subordinates, than on the individual and
organizational performance (Ilies, Morgeson & Nahrgang, 2005). Another reason is that authentic
leaders are likely to have a positive influence on subordinate behaviors. These leaders seem to be
more effective at fostering intrinsic worker motivation, which should result in higher job satisfaction
(Walumbwa et al., 2008).
On the other hand demonstrates the studies of Giallonardo, Wong & Iwasiw (2010), Jensen &
Luthans (2006), and Walumbwa et al. (2008) that authentic leadership is positively related to the job
satisfaction concept (Gardner et al., 2011), although these studies do not only measure the

Master Business Administration Lilian van de Water
University Twente s 0182273
21
relationship between authentic leadership and job satisfaction. Other variables like work
engagement, organizational climate, organizational commitment, job performance and work
happiness were also measured and have also influence on the relationship between authentic
leadership and job satisfaction.
Hypothesis 4
Authentic leadership is positive related to job satisfaction.
2.2.5 Job satisfaction and ethical leadership
Several researchers suggest that ethical leadership is positively related to the job satisfaction
concept. In theory Brown & Treviño (2006) expect that ethical leadership is related to positive
subordinate attitudes, because of the leaders honesty, trustworthiness, caring and concern for
employees and other people, and their fair and principle centered decision-making. Brown et al.
(2005) predict that ethical leadership is associated with job satisfaction.
In the literature only a few studies are available who measure the relationship between ethical
leadership and job satisfaction. In the previous year’s several studies were performed by measuring
the relationship between the ethical dimension in other leadership styles or the ethical climate in
organizations related to the job satisfaction concept (Zhu, May & Avolio, 2004 and Schwepker, 2001).
A more recent study about the ethical leadership concept measured the relationship between ethical
leadership and job satisfaction, but in this study were also other variables measured (Neubert,
Carlson, Kacmar, Roberts & Chonko, 2009). Neubert et al., (2009) measured the relationship between
ethical leadership behavior, interactional justice, ethical climate, job satisfaction and affective
organizational commitment. This research shows that ethical leadership has a positive direct and
indirect relationship to job satisfaction.
Hypothesis 5
Ethical leadership is positive related to job satisfaction.
2.2.6 Job satisfaction and servant leadership
Servant leadership is in theory an eminently people-centered leadership style, so evidence is
expected that servant leaders have more satisfied subordinates than other leadership styles. Based
on the servant leadership theories are the servant leaders working toward positive job attitudes by
encouraging the psychological needs of their subordinates (Van Dierendonck, 2011).
In the literature just a few studies are available related to the concepts of servant leadership and job
satisfaction. The studies of Mayer et al. (2008) and West, Bocarnea & Maranon (2009) are related to
these concepts, but also other variables were researched in these studies (Van Dierendonck, 2011).
As example, Mayer et al. (2008) examined the relationship between servant leadership, subordinate
needs and job satisfaction by examining organizational justice as a mediator in this relationships.
West et al. (2009) measured organizational commitment, job satisfaction, role clarity, and perceived
organizational support as subordinate outcomes of servant leadership. Job satisfaction is in both

Master Business Administration Lilian van de Water
University Twente s 0182273
22
studies indirect positive related to the servant leadership concept, there were no studies found who
measured the direct relationship between servant leadership and job satisfaction.
Hypothesis 6
Servant leadership is positive related to job satisfaction.
2.2.7 Revenue and authentic leadership
In the literature no theories were found who suggested the direct relationship between authentic
leadership and the revenues of an organization. There is limited empirical evidence that authentic
leadership is related to the revenues of an organization (Gardner et al., 2011). Clapp-Smith,
Vogelgesang & Avey (2009) researched the relationship between authentic leadership and unit sales
growth in a small chain of retail stores. The relationship was positive related, but trust in
management partially mediated this relationship. Another study measured the relationship between
organizational performance and authentic leadership. Organizational performance was measured by
an index of revenue and employment growth, and is indirectly positive related to authentic
leadership through the effective tone of top management teams (Hmieleski, Cole & Baron, 2012).
Hypothesis 7
Authentic leadership is positive related to revenue.
2.2.8 Revenue and ethical leadership
In the literature no studies or theories were found who suggested the direct relationship between
ethical leadership and revenues of an organization. There is limited empirical evidence that ethical
leadership is related to the revenues of an organization. Kim & Brymer (2011) researched the effects
of ethical leadership on a hotel middle manager’s job satisfaction and affective commitment, which
in turn influence the manager’s behavioral outcomes and hotel performances. The hotel
performances are positively related to ethical leadership in this indirect relationship.
Hypothesis 8
Ethical leadership is positive related to revenue.
2.2.9 Revenue and servant leadership
There is limited empirical evidence that measures the direct relationship between servant leadership
and the revenues of an organization. Jones (2011) researched the role that servant leadership might
play in ensuring a participative business culture along with profitability. The results suggest that
servant leadership enhances profits through reduced turnover and increased organizational trust.
Theories suggested that the revenues of an organization are not the primary interest for researchers
related to the servant leadership concept (Carter & Greer, 2013 and Van Dierendonck, 2011). Other
organizational outcomes, such as corporate social responsibility, building responsible organizations,

Master Business Administration Lilian van de Water
University Twente s 0182273
23
create a great place to work, building great relationships with the stakeholders, focusing on the
community, and creating a high quality of life have more interest by these researchers (Van
Dierendonck, 2011).
Hypothesis 9
Servant leadership is positive related to revenue.
2.3 Overview hypothesis
Servant leadership
Revenue
Job satisfaction
Customer satisfaction Authentic leadership
Revenue

Master Business Administration Lilian van de Water
University Twente s 0182273
24
3.0 Methodology
In this chapter more information is given about the methodology of this research. The goal of this
research is to measure which current leadership styles leads to most effective leadership in legal
service organizations, whereby effective leadership is measured by different performance indicators.
To measure and analyze these relationships different measures and hypothesis are needed. The
concepts of authentic leadership, ethical leadership, servant leadership, customer satisfaction, job
satisfaction, and revenue need to be measured, and the relationships between these concepts need
to be formulated in hypotheses. This research is divided into a literature research and a legal service
organizations research. The literature research is used as input for the legal service organization
research. The literature research is divided in two chapters, the previous chapter and a part of this
chapter. The legal service organization research is written in this chapter.
In the literature research, the measures of authentic leadership, ethical leadership, servant
leadership, and job satisfaction are found. In the literature research no measures, who explains the
needed concepts of customer satisfaction and revenue, are found. These variables are measured by a
self-made index.
To measure and analyze the relationships between the different current leadership styles and the
performance indicators, hypotheses are needed. The hypotheses of the job satisfaction concept and
the different leadership styles, and the revenue concept and the different leadership concepts are
made on basis of the literature research in the previous chapter. The hypotheses of the customer
satisfaction concept and the different leadership styles could not been made on basis of the
literature research, these hypotheses are made on basis of the legal service organizations research.
The goal of the legal service organizations research is twofold. This research is first of all designed to
measure the current leadership styles and chosen performance indicators in legal service
organizations. This research is at last designed to formulate the hypotheses of the customer
satisfaction concept and the different leadership styles..
This chapter explains first of all how the legal service organizations research is conducted, followed
by the explanation of the operationalization of this research. Last of all is the method of analyses
described.
3.1 Sample legal service organizations research
The legal service organizations research is taken by 38 lawyers from 10 different legal service
organizations in the period November 2013. The questions and details of this research are explained
in Appendix 2 and 3. The choice of the legal service organizations is based on the connection within
the researchers` social network. In every organization one person is working who knows the
researcher personally. These persons were the contact persons for the organization and they were
asked for more lawyers to fill in the survey in their organization. In every organization that has more
than 20 lawyers, the survey is filled in by one of every ten lawyers. In every organizations who has
less than 20 lawyers the survey is filled in by one of every five lawyers. The research is taken in a web
survey with open and closed questions.

Master Business Administration Lilian van de Water
University Twente s 0182273
25
To measure the first goal of this legal service organizations research, the 38 lawyers from the
different legal service organizations rated their leader on the different leadership styles and
performance indicators by different questions. The questions of the leadership styles and
performance indicators need to be filled in by a Likert scale (Vennix, 2006). These questions are
described in Appendix 2 (Question 9, 10, 11, 14, 15 and 17). All these questions are taken in Dutch,
therefore the English methods to measure authentic leadership, ethical leadership, servant
leadership, and job satisfaction had to be translated. In the next paragraph the usage of the different
measures are explained.
To measure the second goal of this legal service organizations research, the 38 lawyers from the
different legal service organizations rated their leader on two different questions about customer
satisfaction. These questions need to be filled in by a Likert scale (Vennix, 2006). These questions are
described in Appendix 2 (Question 16 and 18).
3.2. Operationalization legal service organizations research
3.2.1 Measurement authentic leadership
In this research is the ALQ being used as measure for authentic leadership. The reason for using this
measure is based on three aspects. First, the ALQ measure is most similar to the subject that will be
measured in this research. Second, the ALQ is the most frequent measure of authentic leadership
(Gardner et al., 2011), and at last the researches of the ALQ were seen as the key writers of the
authentic leadership concept. The ALQ measure is based on the definition of Walumbwa et al.
(2008), displayed in the previous chapter. In this definition are four components described, namely;
self-awareness, relational transparency, internalized moral perspective, and balances processing.
These four components were in Walumbwa et al. (2008) defined as:
Self-awareness refers to demonstrating an understanding of how one derives and makes meaning of
the world and how that meaning making process impacts the way one views himself or herself over
time. It also refers to showing an understanding of one’s strengths and weaknesses and the
multifaceted nature of the self, which includes gaining insight into the self through exposure to
others, and being cognizant of one’s impact on other people.
Relational transparency refers to presenting one’s authentic self (as opposed to a fake or distorted
self) to others. Such behavior promotes trust through disclosures that involve openly sharing
information and expressions of one’s true thoughts and feelings while trying to minimize displays of
inappropriate emotions.
Balanced processing refers to leaders who show that they objectively analyze all relevant data before
coming to a decision. Such leaders also solicit views that challenge their deeply held positions.
Internalized moral perspective refers to an internalized and integrated form of self-regulation. This
sort of self-regulation is guided by internal moral standards and values versus group, organizational,
and societal pressures, and it results in expressed decision making and behavior that is consistent
with these internalized values. (pp. 95, 96)

Master Business Administration Lilian van de Water
University Twente s 0182273
26
Walumbwa et al. (2008) generated sixteen items for incorporation into the ALQ after a deductive and
inductive content analysis process, followed by assessments of their instrument`s construct validity.
However, the appendix in the article of Walumbwa et al. (2008) shows only eight sample items, in
contrast to the sixteen used in the instrument. The full instrument is commercially copyrighted
(Neider & Schriesheim, 2011) and not usable for this research. But, Neider & Schriesheim (2011)
developed the 14 item Authentic Leadership Inventory (ALI) (Appendix 4), whereby the measure
items were based on the theoretical foundation, dimensions, and eight available items of the ALQ
established by Walumbwa et al. (2008).
In this research the ALI is measured by 38 lawyers from 10 different legal service organizations. These
lawyers rated their leader, by a likert scale, on the 14 different items. Self-awareness is measured by
4 items, relational transparency by 2 items, balanced processing by 4 items, and internalized moral
perspective by 4 items (Neider & Schriesheim, 2011). The likert scale is divided into always, often,
sometimes, seldom, and never. In this research the distance between the numbers of the likert scale
are expected to be equal in size.
3.2.2 Measurement ethical leadership
In this research is the multi-dimensional measure of Karlshoven et al. (2011b) being used to measure
ethical leadership. The choice for this measure is first of all based on the equality of the subject that
will be measured in this research. Thereby this measure is based on a broad addition of different
literature, uses different forms of ethical leadership, is empirically tested, and the implementation of
the construct validity and internal consistency were positively measured (Karlshoven et al., 2011b).
Karlshoven et al. (2011b) developed the theory-based multi-dimensional Ethical Leadership at Work
(ELW) questionnaire (Appendix 5). This ELW questionnaire measured seven items; fairness, role
clarification, ethical guidance, people orientation, power sharing, integrity and concern for
sustainability. These items resulted in a measure of 38 items. This items were only in the measure
explained, Karlshoven et. al (2011b) does not give a definition of these items.
In this research the ELW is measured by 38 lawyers from 10 different legal service organizations.
These lawyers rated their leader, by a likert scale, on the 38 different items. People orientation is
measured by 7 items, fairness by 6 items, power sharing by 6 items, concern for sustainability by 3
items, ethical guidance by 7 items, role clarification by 5 items, and integrity by 4 items (Karlshoven
et al. 2011b). The likert scale is divided into always, often, sometimes, seldom, and never. In this
research the distance between the numbers of the likert scale are expected to be equal in size.
3.2.3 Measurement servant leadership
Given the complexity of the servant leadership concept, the multiple measures who were developed
in recent years, and the lack of a measure to focus on, goes the concentration to a model where
multiple dimensions of servant leadership were validated in empirical research. The studies of
Patterson (2003), Russel & Stone (2002), Spears (1995), and Van Dierendonck (2011) were not
empirically tested, so these were not useable for this research. The other studies have all their
advantages and disadvantages, but in this research we chose the eight dimensional measure of Van

Master Business Administration Lilian van de Water
University Twente s 0182273
27
Dierendonck & Nuijten (2011). While other measures are concentrated on the people side of servant
leadership, the measure of Van Dierendonck & Nuijten (2011) focuses on both the people and leader
aspects of servant leadership. Another reason for the usage of this measure is that the construct
validity and the internal consistency were positively related.
The eight dimensions, measured in the Servant Leadership Survey (SLS) (Appendix 6), are
empowerment, accountability, standing back, humility, authenticity, courage, forgiveness, and
stewardship. These dimensions are in Van Dierendonck & Nuijten (2011) defined as:
Empowerment: A motivational concept focused on enabling people and encouraging personal
development. Empowerment aims at fostering a pro-active, self-confident attitude among followers
and gives them a sense of personal power. Empowering leadership behavior includes aspects like
encouraging self-directed decision making, information sharing, and coaching for innovative
performance. The servant leader’s belief in the intrinsic value of each individual is the central issue in
empowerment; it is all about recognition, acknowledgment, and the realization of each person’s
abilities and what the person can still learn.
Accountability: Holding people accountable for performance they can control. This makes
accountability a mechanism by which responsibility for outcomes is given to individuals and teams. It
ensures that people know what is expected of them, which is beneficial for both employees and the
organization. It is a powerful tool to show confidence in one’s followers; it provides boundaries within
which one is free to achieve one’s goals. Although popular literature on servant leadership
emphasizes accountability as very relevant, it has often been neglected by scholars and has never
been incorporated in any of the other measures of servant leadership.
Standing back: Is about the extent to which a leader gives priority to the interest of others first and
gives them the necessary support and credits. Standing back is also about retreating into the
background when a task has successfully been accomplished. Standing back should be closely related
to most other aspects of servant leadership such as authenticity, empowerment, humility, and
stewardship.
Humility: The ability to put one’s own accomplishments and talents in a proper perspective. Humility
in leadership focuses on daring to admit that one is not infallible and does make mistakes. Humility
arises from a proper understanding of one’s strong and weak points. Servant leaders acknowledge
their limitations and therefore actively seek the contributions of others in order to overcome those
limitations.
Authenticity: Is closely related to expressing the ‘true self’, expressing oneself in ways that are
consistent with inner thoughts and feelings. Authenticity is about being true to oneself, accurately
representing—privately and publicly—internal states, intentions, and commitments. From an
organizational perspective it can be defined as behaving in such a way that professional roles remain
secondary to whom the individual is as a person.
Courage: Daring to take risks and trying out new approaches to old problems. According to Greenleaf
(1991) courage is an important characteristic that distinguishes the servant leader from other
leaders. Within the organizational context, courage is about challenging conventional models of
working behaviors; it is essential for innovation and creativity. Courage is related to pro-active

Master Business Administration Lilian van de Water
University Twente s 0182273
28
behavior and implies creating new ways. To do so, means strongly relying on values and convictions
that govern one’s actions.
Interpersonal acceptance: The ability to understand and experience the feelings of others,
understand where people come from, and the ability to let go of perceived wrongdoings and not carry
a grudge into other situations. In other words, interpersonal acceptance is about empathy: being able
to cognitively adopt the psychological perspective of other people and experience feelings of warmth
and compassion. Furthermore, interpersonal acceptance is about being able to forgive when
confronted with offenses, arguments, and mistakes. For servant leaders it is important to create an
atmosphere of trust where people feel accepted, are free to make mistakes and know that they will
not be rejected. Hence, it facilitates the development of high-quality interpersonal relationships
through a better understanding of the behavior of others. Servant leaders are not revengeful or eager
to get even, this creates a setting that brings out the best in people.
Stewardship: The willingness to take responsibility for the larger institution and go for service instead
of control and self-interest. Leaders should not only act as caretakers, but also act as role models. By
setting the right example, leaders can stimulate others to act in the common interest. Stewardship is
closely related to social responsibility, loyalty, and team work. These constructs all represent a feeling
of identification with and sense of obligation to a common good that includes the self but that
stretches beyond one’s own self-interest (p. 256).
In this research is the SLS measured by 38 lawyers from 10 different legal service organizations.
These lawyers rated their leader, by a likert scale, on the 30 different items. Empowerment is
measured by 7 items, standing back by 3 items, accountability by 3 items, forgiveness by 3 items,
courage by 2 items, authenticity by 4 items, humility by 5 items, and stewardship by 3 items (Van
Dierendonck & Nuijten, 2011). The likert scale is divided into always, often, sometimes, seldom, and
never. In this research the distance between the numbers of the likert scale are expected to be equal
in size.
3.2.4 Measurement customer satisfaction
In the literature research no useful measure of the customer satisfaction concept is found. Customer
satisfaction is measured by a 5 item self-made index (Customer Satisfaction Index, CSI, Appendix 7).
The construct validity and the internal consistency of this index is not measured.
In this research is the CSI measured by 38 lawyers from 10 different legal service organizations. These
lawyers rated their leader, by a likert scale, on the 5 different items. The likert scale is divided into
very true, true, medium true, seldom true, and not true. In this research the distance between the
numbers of the likert scale are expected to be equal in size.
3.2.5 Measurement job satisfaction
In this research is job satisfaction measured by the 5-item version of Brayfield and Rothe’s (1951) Job
Satisfaction Index (JSI). The choice for this measure is based on the reliability of the instrument and
the context of the subject that will be measured. The JSI is originally developed as an 18-item index

Master Business Administration Lilian van de Water
University Twente s 0182273
29
and captured an overall attitudinal feeling toward a job (Brayfield & Rothe, 1951). The JSI is
considered as an effective job satisfaction measure and different researchers used a shorter version
because the JSI was too long for many research purposes (Thompson & Phua, 2012). The 5-item
version (Appendix 8) is reliable and initially used by Judge, Locke & Durham (1998) (Thompson &
Phua, 2012). Recently, the 5-item version is used by Judge and colleagues (Bono & Judge, 2003;
Judge, Bono & Locke 2000; Judge & Colquitt, 2004), Walumbwa et al., (2008) and Mayer, Bardes &
Picollo (2008).
In this research is the JSI measured by 38 lawyers from 10 different legal service organizations. These
lawyers rated their leader, by a likert scale, on the 5 different items. The likert scale is divided into
very true, true, medium true, seldom true, and not true. In this research the distance between the
numbers of the likert scale are expected to be equal in size.
3.2.6 Measurement revenue
In the literature research no useful measure of the revenue concept is found. Revenue is measured
by a 6 item self-made index (Revenue Index, RI, Appendix 9). The construct validity and the internal
consistency of this index is not measured.
In this research is the RI measured by 38 lawyers from 10 different legal service organizations. These
lawyers rated their leader, by a likert scale, on the 6 different items. The likert scale is divided into
very strong, strong, medium, weak, and very weak. In this research the distance between the
numbers of the likert scale are expected to be equal in size.
3.2.7 Measurement relationship leadership styles and customer satisfaction
In the legal service organization research 2 general questions about the relationship between
customer satisfaction and leadership styles were asked. The first question is related to the degree of
contact between the leader and the customer. This question is measured by 38 lawyers from 10
different legal service organizations. These lawyers rated their leader, by a likert scale, on this
question. The likert scale is divided into very often, often, sometimes, seldom, and never. In this
research the distance between the numbers of the likert scale are expected to be equal in size.
The second question is related to the degree of influence from the leadership style on customer
satisfaction. This question is measured by 5 different items (Appendix 2, question 18). These items
are measured by 38 lawyers from 10 different legal service organizations. These lawyers rated their
leader, by a likert scale, on the 5 different items. The likert scale is divided into very true, true,
medium true, seldom true, and not true. In this research the distance between the numbers of the
likert scale are expected to be equal in size.
3.3 Method of analysis legal service organizations research
The relationships between the different leadership styles and the performance indicators are
analyzed by multiple regression analyses. The multiple regression analysis measured the relationship
between the leadership style, the performance indicator and one control variable, number of

Master Business Administration Lilian van de Water
University Twente s 0182273
30
leaders. The multiple regression analysis measured the variance of the performance indicator
explained by the leadership style, the unexplained variance, the explained variance, the coefficients
of the relationship, and the signification of the relationship.

Master Business Administration Lilian van de Water
University Twente s 0182273
31
4.0 Research findings
4.1 Findings legal service organizations research
In this chapter the results of the legal service organizations research are explained. The goal of this
legal service organizations research is twofold. This research is first of all designed to measure which
current leadership styles leads to most effective leadership in legal service organizations. This
research is at last designed to formulate the hypotheses of the customer satisfaction concept and the
different leadership styles.
This chapter starts with basic results of the different leadership styles and the different performance
indicators, followed by the results of the relationships between the different leadership styles and
customer satisfaction. These results are used as input to formulate hypothesis. This chapter
continues with the results of the main goal of this research, the relationships between the different
leadership styles and the performance indicators.
4.2 Basic results
4.2.1 Authentic leadership
The authentic leadership style is measured on the ALI (Appendix 4). In this research the ALI is
measured by 38 lawyers from 10 different legal service organizations. These lawyers rated their
leader, by a likert scale, on the 14 different items. The likert scale is divided into always, often,
sometimes, seldom, and never. In Appendix 10 (part 10.1) are the rankings on these items described.
This description is given in numbers: always=1, often=2, sometimes=3, seldom=4, and never=5. A
summary of this results is shown in Figure 1.
Figure 1: Findings authentic leadership
The 38 leaders of the 10 different legal service organizations are most rated on the sometimes part
of the likert scale, followed by often, seldom, never and always. The 38 leaders of the 10 different
legal service organizations scored an average of 2,84 on the ALI with a standard deviation of 0,79.
In the next paragraph the 38 leaders are rated on the average scores of the 14 items from the ALI.
Thereby, each leader scored one number on the ALI. Figure 2 & 3 show these results.
Authentic leadership Average Standard deviation
Count Percent Count Percent Count Percent Count Percent Count Percent
Self-awareness 3,00 1,97 35,00 23,03 64,00 42,11 36,00 23,68 14,00 9,21 3,15 0,90
Relational transparency 10,00 13,16 43,00 56,58 21,00 27,63 2,00 2,63 0,00 0,00 2,20 0,70
Balanced processing 4,00 2,63 42,00 27,63 64,00 42,11 35,00 23,03 7,00 4,61 2,99 0,81
Internalized moral perspective 3,00 1,97 62,00 40,79 64,00 42,11 23,00 15,13 0,00 0,00 2,70 0,72
General 20,00 3,76 182,00 34,21 213,00 40,04 96,00 18,05 21,00 3,95 2,84 0,79
Always = 1 Often = 2 Sometimes = 3 Seldom = 4 Never = 5

Master Business Administration Lilian van de Water
University Twente s 0182273
32
Figure 3: Statics average ALI
The average score of the 38 leaders rated on the ALI is 2,84, with a standard deviation of 0,23. The
minimum average score is 2,36 and the maximum average score is 3,36.
4.2.2 Ethical leadership
The ethical leadership style is measured on the ELW (Appendix 5). In this research the ELW is
measured by 38 lawyers from 10 different legal service organizations. These lawyers rated their
leader, by a likert scale, on the 38 different items. The likert scale is divided into always, often,
sometimes, seldom, and never. In Appendix 10 (part 10.2) are the rankings on these items described.
This description is given in numbers: always=1, often=2, sometimes=3, seldom=4, and never=5. A
summary of this results is shown in Figure 4.
Figure 4: Findings ethical leadership
The 38 leaders of the 10 different legal service organizations are most rated on the sometimes part
of the likert scale, followed by often, seldom, never and always. The 38 leaders of the 10 different
legal service organizations scored an average of 2,97 on the ELW with a standard deviation of 0,75.
In the next paragraph the 38 leaders are rated on the average scores of the 38 items from the ELW.
Thereby, each leader scored one number on the ELW. Figure 5 & 6 show these results.
Authentic leadership
Valid 38,00
Missing 0,00
2,84
2,82
0,23
0,05
1,00
2,36
3,36
Variance
Range
Minimum
Maximum
N
Mean
Median
Std. Deviation
Ethical leadership Average Standard deviation
Count Percent Count Percent Count Percent Count Percent Count Percent
People orientation 2,00 0,75 90,00 33,83 125,00 46,99 41,00 15,41 8,00 3,01 2,86 0,73
Fairness 4,00 1,75 58,00 25,44 117,00 51,32 44,00 19,30 5,00 2,19 2,95 0,77
Power sharing 0,00 0,00 55,00 24,12 94,00 41,23 69,00 30,26 10,00 4,39 3,15 0,83
Concern for sustainability 0,00 0,00 17,00 14,91 66,00 57,89 24,00 21,05 7,00 6,14 3,18 0,72
Ethical guidance 1,00 0,38 80,00 30,08 104,00 39,10 70,00 26,32 11,00 4,14 3,04 0,87
Role clarification 4,00 2,11 55,00 28,95 102,00 53,68 25,00 13,16 4,00 2,11 2,84 0,71
Integrity 0,00 0,00 45,00 29,61 95,00 62,50 12,00 7,89 0,00 0,00 2,78 0,53
General 11,00 0,76 400,00 27,70 703,00 48,68 285,00 19,74 45,00 3,12 2,97 0,75
Always = 1 Often = 2 Sometimes = 3 Seldom = 4 Never = 5
Figure 2: Statics average ALI
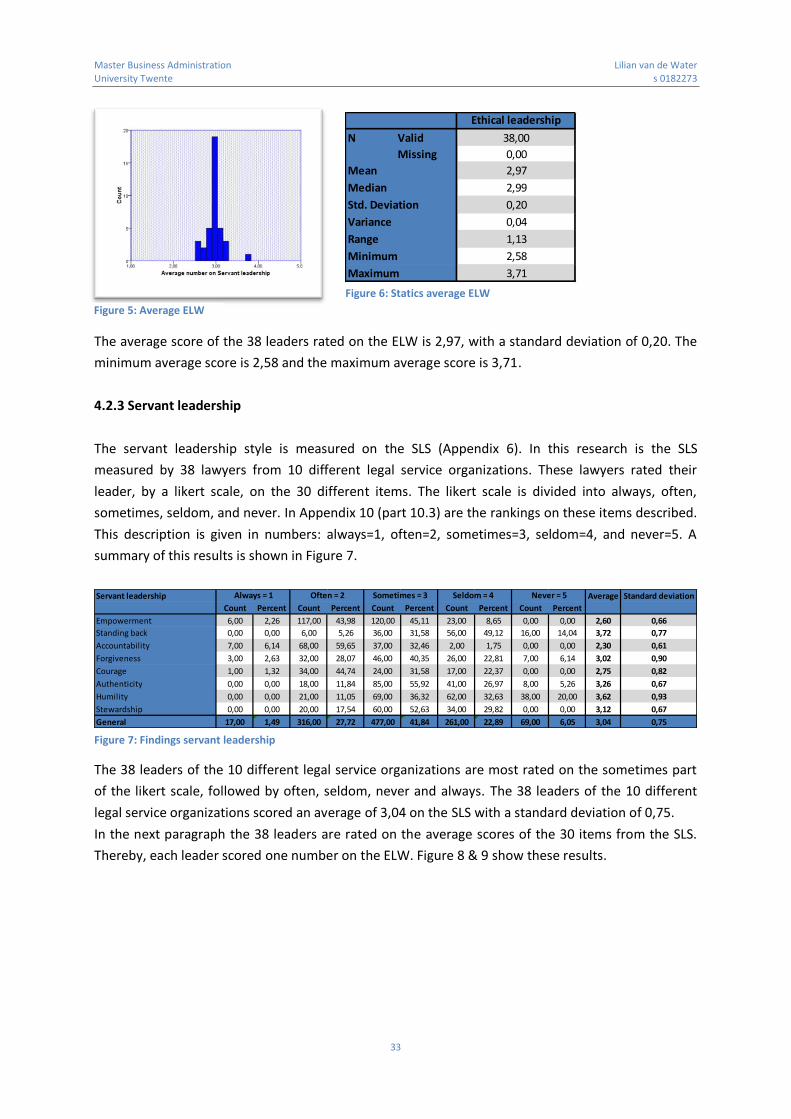
Master Business Administration Lilian van de Water
University Twente s 0182273
33
Figure 6: Statics average ELW
The average score of the 38 leaders rated on the ELW is 2,97, with a standard deviation of 0,20. The
minimum average score is 2,58 and the maximum average score is 3,71.
4.2.3 Servant leadership
The servant leadership style is measured on the SLS (Appendix 6). In this research is the SLS
measured by 38 lawyers from 10 different legal service organizations. These lawyers rated their
leader, by a likert scale, on the 30 different items. The likert scale is divided into always, often,
sometimes, seldom, and never. In Appendix 10 (part 10.3) are the rankings on these items described.
This description is given in numbers: always=1, often=2, sometimes=3, seldom=4, and never=5. A
summary of this results is shown in Figure 7.
Figure 7: Findings servant leadership
The 38 leaders of the 10 different legal service organizations are most rated on the sometimes part
of the likert scale, followed by often, seldom, never and always. The 38 leaders of the 10 different
legal service organizations scored an average of 3,04 on the SLS with a standard deviation of 0,75.
In the next paragraph the 38 leaders are rated on the average scores of the 30 items from the SLS.
Thereby, each leader scored one number on the ELW. Figure 8 & 9 show these results.
Ethical leadership
Valid 38,00
Missing 0,00
2,97
2,99
0,20
0,04
1,13
2,58
3,71
Variance
Range
Minimum
Maximum
N
Mean
Median
Std. Deviation
Servant leadership Average Standard deviation
Count Percent Count Percent Count Percent Count Percent Count Percent
Empowerment 6,00 2,26 117,00 43,98 120,00 45,11 23,00 8,65 0,00 0,00 2,60 0,66
Standing back 0,00 0,00 6,00 5,26 36,00 31,58 56,00 49,12 16,00 14,04 3,72 0,77
Accountability 7,00 6,14 68,00 59,65 37,00 32,46 2,00 1,75 0,00 0,00 2,30 0,61
Forgiveness 3,00 2,63 32,00 28,07 46,00 40,35 26,00 22,81 7,00 6,14 3,02 0,90
Courage 1,00 1,32 34,00 44,74 24,00 31,58 17,00 22,37 0,00 0,00 2,75 0,82
Authenticity 0,00 0,00 18,00 11,84 85,00 55,92 41,00 26,97 8,00 5,26 3,26 0,67
Humility 0,00 0,00 21,00 11,05 69,00 36,32 62,00 32,63 38,00 20,00 3,62 0,93
Stewardship 0,00 0,00 20,00 17,54 60,00 52,63 34,00 29,82 0,00 0,00 3,12 0,67
General 17,00 1,49 316,00 27,72 477,00 41,84 261,00 22,89 69,00 6,05 3,04 0,75
Always = 1 Often = 2 Sometimes = 3 Seldom = 4 Never = 5
Figure 5: Average ELW
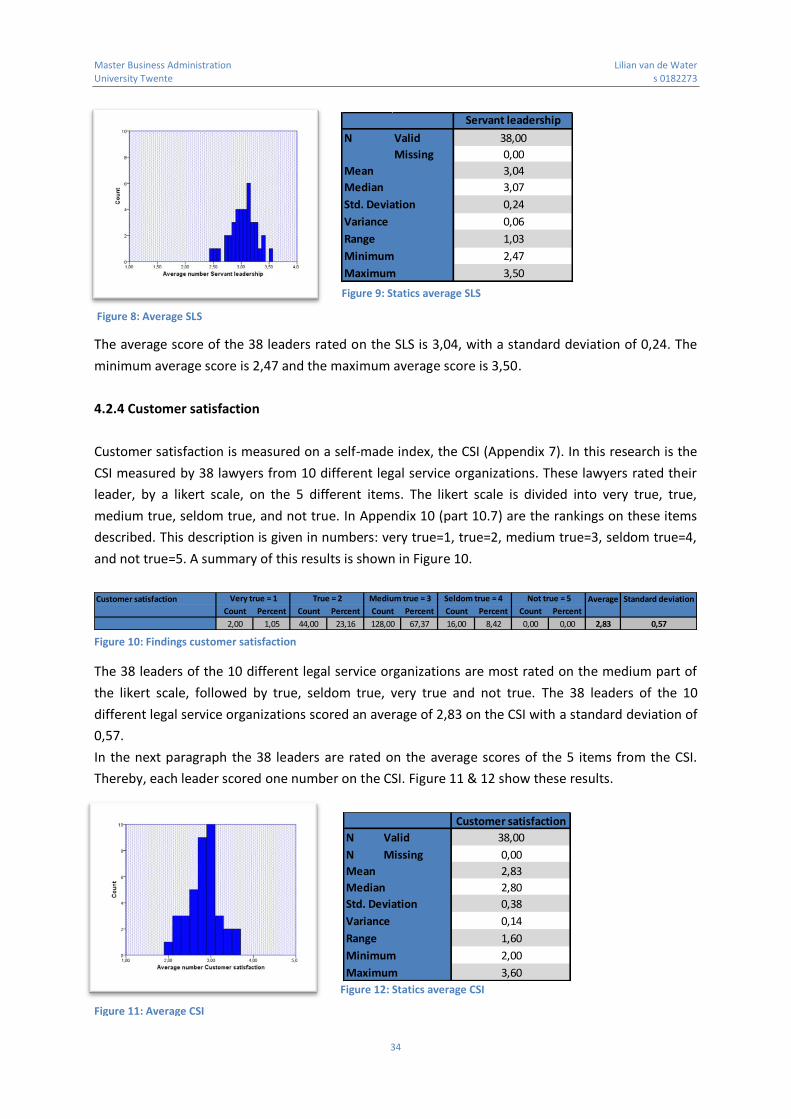
Master Business Administration Lilian van de Water
University Twente s 0182273
34
Figure 9: Statics average SLS
The average score of the 38 leaders rated on the SLS is 3,04, with a standard deviation of 0,24. The
minimum average score is 2,47 and the maximum average score is 3,50.
4.2.4 Customer satisfaction
Customer satisfaction is measured on a self-made index, the CSI (Appendix 7). In this research is the
CSI measured by 38 lawyers from 10 different legal service organizations. These lawyers rated their
leader, by a likert scale, on the 5 different items. The likert scale is divided into very true, true,
medium true, seldom true, and not true. In Appendix 10 (part 10.7) are the rankings on these items
described. This description is given in numbers: very true=1, true=2, medium true=3, seldom true=4,
and not true=5. A summary of this results is shown in Figure 10.
Figure 10: Findings customer satisfaction
The 38 leaders of the 10 different legal service organizations are most rated on the medium part of
the likert scale, followed by true, seldom true, very true and not true. The 38 leaders of the 10
different legal service organizations scored an average of 2,83 on the CSI with a standard deviation of
0,57.
In the next paragraph the 38 leaders are rated on the average scores of the 5 items from the CSI.
Thereby, each leader scored one number on the CSI. Figure 11 & 12 show these results.
Figure 12: Statics average CSI
Servant leadership
Valid 38,00
Missing 0,00
3,04
3,07
0,24
0,06
1,03
2,47
3,50
N
Mean
Median
Std. Deviation
Variance
Range
Minimum
Maximum
Customer satisfaction Average Standard deviation
Count Percent Count Percent Count Percent Count Percent Count Percent
2,00 1,05 44,00 23,16 128,00 67,37 16,00 8,42 0,00 0,00 2,83 0,57
Very true = 1 True = 2 Medium true = 3 Seldom true = 4 Not true = 5
Customer satisfaction
N Valid 38,00
N Missing 0,00
Mean 2,83
Median 2,80
Std. Deviation 0,38
Variance 0,14
Range 1,60
Minimum 2,00
Maximum 3,60
Figure 11: Average CSI
Figure 8: Average SLS

Master Business Administration Lilian van de Water
University Twente s 0182273
35
The average score of the 38 leaders rated on the CSI is 2,83, with a standard deviation of 0,38. The
minimum average score is 2,00 and the maximum average score is 3,60.
4.2.5 Job satisfaction
Job satisfaction is measured on the JSI (Appendix 8). In this research is the JSI measured by 38
lawyers from 10 different legal service organizations. These lawyers rated their leader, by a likert
scale, on the 5 different items. The likert scale is divided into very true, true, medium true, seldom
true, and not true. In Appendix 10 (part 10.6) are the rankings on these items described. This
description is given in numbers: very true=1, true=2, medium true=3, seldom true=4, and not true=5.
Item 3 and 5 are reversed scores and converted in normal scores, so that all items can be combined.
A summary of this results is shown in Figure 13.
Figure 13: Findings job satisfaction
The 38 leaders of the 10 different legal service organizations are most rated on the medium part of
the likert scale, followed by seldom true, true, very true and not true. The 38 leaders of the 10
different legal service organizations scored an average of 2,60 on the JSI with a standard deviation of
0,73.
In the next paragraph the 38 are leaders rated on the average scores of the 5 items from the JSI.
Thereby, each leader scored one number on the JSI. Figure 14 & 15 show these results.
Figure 15: Statics average JSI
The average score of the 38 leaders rated on the JSI is 2,60, with a standard deviation of 0,54. The
minimum average score is 1,60 and the maximum average score is 3,80.
4.2.6 Revenue
Revenue is measured on a self-made index, the RI (Appendix 9). In this research is the RI measured
by 38 lawyers from 10 different legal service organizations. These lawyers rated their leader, by a
likert scale, on the 6 different items. The likert scale is divided into very strong, strong, medium,
weak, and very weak. In Appendix 10 (part 10.5) are the rankings on these items described. This
Job satisfaction Average Standard deviation
Count Percent Count Percent Count Percent Count Percent Count Percent
6,00 3,16 43,00 22,63 83,00 43,68 55,00 28,95 3,00 1,58 2,60 0,73
Not true = 5True = 2Very true = 1 Medium true = 3 Seldom true = 4
Job satisfaction
N Valid 38,00
N Missing 0,00
Mean 2,60
Median 2,60
Std. Deviation 0,54
Variance 0,29
Range 2,20
Minimum 1,60
Maximum 3,80
Figure 14: Average JSI

Master Business Administration Lilian van de Water
University Twente s 0182273
36
description is given in numbers: very strong=1, strong=2, medium=3, weak=4, and very weak=5. A
summary of this results is shown in Figure 16.
Figure 16: Findings Revenue
The 38 leaders of the 10 different legal service organizations are most rated on the medium part of
the likert scale, followed by strong, weak, very weak and very strong. The 38 leaders of the 10
different legal service organizations scored an average of 2,96 on the JSI with a standard deviation of
0,56.
In the next paragraph the 38 leaders are rated on the average scores of the 6 items from the RI.
Thereby, each leader scored one number on the RI. Figure 17 & 18 show these results.
Figure 18: Statics average RI
The average score of the 38 leaders rated on the RI is 2,96, with a standard deviation of 0,45. The
minim um average score is 2,00 and the maximum average score is 4,00.
4.2.7 Relationship between leadership styles and customer satisfaction
In the legal service organization research 2 general questions about the relationship between
customer satisfaction and leadership styles were asked. The first question is related to the degree of
contact between the leader and the customer (Appendix 2, question 16). This question is measured
by 38 lawyers from 10 different legal service organizations. These lawyers rated their leader, by a
likert scale, on this question. The likert scale is divided into very often, often, sometimes, seldom,
and never. In Appendix 10 (part 10.7) are the rankings on these items described. This description is
given in numbers: very often=1, often=2, sometimes=3, seldom=4, and never=5. A summary of this
results is shown in Figure 19.
Figure 19: Findings direct contact clients
Revenue Average Standard deviation
Count Percent Count Percent Count Percent Count Percent Count Percent
0,00 0,00 41,00 17,98 156,00 68,42 30,00 13,16 1,00 0,44 2,96 0,56
Very strong = 1 Strong = 2 Medium = 3 Weak = 4 Very weak = 5
Revenue
N Valid 38,00
N Missing 0,00
Mean 2,96
Median 3,00
Std. Deviation 0,45
Variance 0,20
Range 2,00
Minimum 2,00
Maximum 4,00
Direct contact clients Average Standard deviation
Count Percent Count Percent Count Percent Count Percent Count Percent
1,00 2,63 20,00 52,63 9,00 23,68 7,00 18,42 1,00 2,63 2,66 0,91
Very often = 1 Often = 2 Sometimes = 3 Seldom = 4 Never = 5
Figure 17: Average RI

Master Business Administration Lilian van de Water
University Twente s 0182273
37
The 38 leaders of the 10 different legal service organizations are most rated on the often part of the
likert scale, followed by sometimes, seldom, and very often & never. The 38 leaders of the 10
different legal service organizations scored an average of 2,66 on this question with a standard
deviation of 0,91.
The second question is related to the degree of influence from the leadership style on customer
satisfaction. This question is measured by 5 different items (Appendix 2, question 18). These items
are measured by 38 lawyers from 10 different legal service organizations. These lawyers rated their
leader, by a likert scale, on the 5 different items. The likert scale is divided into very true, true,
medium true, seldom true, and not true. In Appendix 10 (part 10.7) are the rankings on these items
described. This description is given in numbers: very true=1, true=2, medium true=3, seldom true=4,
and not true=5. A summary of this results is shown in Figure 20.
Figure 20: Findings leadership style and customer satisfaction
The 38 leaders of the 10 different legal service organizations are most rated on the medium part of
the likert scale, followed by seldom, true, and very true & not true. The 38 leaders of the 10 different
legal service organizations scored an average of 3,04 on this question with a standard deviation of
0,60.
Based on these results are the hypothesis (previous chapter) between the different leadership styles
and customer satisfaction formulated.
4.3 Main results
In the following paragraphs the relationships between the different leadership styles and the
performance indicators are analyzed. These relationships are analyzed on correlation analyses and
multiple regression analyses.
4.3.1 Correlation analysis
In Appendix 11 the major assumptions of the correlation analysis are given. Appendix 11.1 to 11.9
show scatterplots as evidence for an assumption of the correlation analysis, the relation between
authentic leadership and customer satisfaction, authentic leadership and job satisfaction, authentic
leadership and revenue, ethical leadership and customer satisfaction, ethical leadership and job
satisfaction, ethical leadership and revenue, servant leadership and customer satisfaction, servant
leadership and job satisfaction, servant leadership and revenue are linear.
Leadership style and Average Standard deviation
customer satisfaction Count Percent Count Percent Count Percent Count Percent Count Percent
0,00 0,00 30,00 15,79 122,00 64,21 38,00 20,00 0,00 0,00 3,04 0,60
Very true = 1 True = 2 Medium true = 3 Seldom true = 4 Not true = 5

Master Business Administration Lilian van de Water
University Twente s 0182273
38
Figure 21: Correlation analysis
In Figure 21 the relationships between the leadership styles and the performance indicators are
given. Authentic leadership and customer satisfaction are very weak positive related to each other, R
is 0,006. The consistency between these two variables is not significant, Sig. (2-tailed) is 0,973.
Authentic leadership and job satisfaction are very weak positive related to each other, R is 0,170. The
consistency between these two variables is not significant, Sig. (2-tailed) is 0,308. Authentic
leadership and revenue are very weak positive related to each other, R is 0,164. The consistency
between these two variables is not significant, Sig. (2-tailed) is 0,325. Ethical leadership and customer
satisfaction are very weak negative related to each other, R is -0,367. The consistency between these
two variables is significant, Sig. (2-tailed) is 0,023. Ethical leadership and job satisfaction are very
weak positive related to each other, R is 0,027. The consistency between these two variables is not
significant, Sig. (2-tailed) is 0,871. Ethical leadership and revenue are very weak negative related to
each other, R is -0,111. The consistency between these two variables is not significant, Sig. (2-tailed)
is 0,508. Servant leadership and customer satisfaction are very weak positive related to each other,
R is 0,104. The consistency between these two variables is not significant, Sig. (2-tailed) is 0,535.
Servant leadership and job satisfaction are very weak positive related to each other, R is 0,183. The
consistency between these two variables is not significant, Sig. (2-tailed) is 0,273. Servant leadership
and revenue are very weak negative related to each other, R is -0,111. The consistency between
these two variables is not significant, Sig. (2-tailed) is 0,508.
4.3.2 Multiple regression analyses
In the following paragraphs the multiple linear regression analyses between the leadership styles and
the performance indicators are given. By the multiple regression analysis is one control variable used,
the number of leaders in the legal service organizations.
4.3.2.1 Authentic leadership and customer satisfaction
In Appendix 11 the major assumptions of the multiple linear regression analyses are given. Appendix
11.10 shows a histogram and scatterplot of the residuals from the dependent variable customer
Authenticleadership Ethicalleadership Servantleadership Jobsatisfaction Customersatisfaction Revenue
Pearson Correlation 1 -,010 ,292 ,170 ,006 ,164
Sig. (2-tailed) ,952 ,076 ,308 ,973 ,325
N 38 38 38 38 38 38
Pearson Correlation -,010 1 ,163 ,027 -,367* -,177
Sig. (2-tailed) ,952 ,328 ,871 ,023 ,287
N 38 38 38 38 38 38
Pearson Correlation ,292 ,163 1 ,183 ,104 -,111
Sig. (2-tailed) ,076 ,328 ,273 ,535 ,508
N 38 38 38 38 38 38
Pearson Correlation ,170 ,027 ,183 1 ,578** ,640**
Sig. (2-tailed) ,308 ,871 ,273 ,000 ,000
N 38 38 38 38 38 38
Pearson Correlation ,006 -,367* ,104 ,578** 1 ,582**
Sig. (2-tailed) ,973 ,023 ,535 ,000 ,000
N 38 38 38 38 38 38
Pearson Correlation ,164 -,177 -,111 ,640** ,582** 1
Sig. (2-tailed) ,325 ,287 ,508 ,000 ,000
N 38 38 38 38 38 38
Correlations
Authenticleadership
Ethicalleadership
Servantleadership
Jobsatisfaction
Customersatisfaction
Revenue
*. Correlation is significant at the 0.05 level (2-tailed).
**. Correlation is significant at the 0.01 level (2-tailed).

Master Business Administration Lilian van de Water
University Twente s 0182273
39
satisfaction as assumption for the multiple linear regression analysis between authentic leadership,
customer satisfaction, and the control variable number of leaders. The model is linear and the
residuals are normally distributed and homoscedasticity. Another assumption of the multiple linear
regression analysis is showed in Appendix 11.11, there is no multicollinearity between the
independent variable and the control variable. In the multiple linear analysis are 2 outliners found
(Appendix 11.12). The standardized residuals are -2,147 and 2,004 standard deviations removed from
the middle of the distribution. These outliners are not very high and are not removed from the
analysis.
Figure 22: Model summary multiple regression analysis
The independent variable authentic leadership and the control variable number of leaders are very
weak related to the dependent variable customer satisfaction, R is 0,008. The variance in customer
satisfaction is for 0,00 % (R square) explained by the variance in authentic leadership and number of
leaders (Figure 22).
Figure 23: ANOVA multiple regression analysis
In Figure 23 the variance analysis of the dependent variable customer satisfaction is described. The
total variance of customer satisfaction is divided into unexplained variance and explained variance.
The unexplained variance is 5,242 (Sum of squares residual) and the explained variance is 0,000 (Sum
of squares regression). The multiple regression between authentic leadership, number of leaders and
customer satisfaction is not significant (F is 0,001 and Sig. is 0,999).
Figure 24: Coefficients multiple regression analysis
R R Square Adjusted R Square Std. Error of the Estimate
1 ,008a ,000 -,057 ,38700
Model Summaryb
Model
a. Predictors: (Constant), Numberofleaders, Authenticleadership
b. Dependent Variable: Customersatisfaction
Sum of Squares df Mean Square F Sig.
Regression ,000 2 ,000 ,001 ,999b
Residual 5,242 35 ,150
Total 5,242 37
ANOVAa
Model
1
a. Dependent Variable: Customersatisfaction
b. Predictors: (Constant), Numberofleaders, Authenticleadership
Standardized Coefficients
B Std. Error Beta
(Constant) 2,810 ,808 3,479 ,001
Authenticleadership ,009 ,279 ,005 ,031 ,975
Numberofleaders ,000 ,012 -,005 -,030 ,976
1
a. Dependent Variable: Customersatisfaction
Coefficientsa
Model
Unstandardized
Coefficients
t Sig.

Master Business Administration Lilian van de Water
University Twente s 0182273
40
In Figure 24 the components of the multiple regression analysis are given. The multiple regression
analysis is defined as: Customer satisfaction = 2,810 (B constant) + 0,009 (B authentic leadership) *
Authentic leadership + 0,000 (B number of leaders) * Number of leaders. Authentic leadership and
number of leaders are both not significant (authentic leadership t is 0,031 and Sig. is 0,975, number
of leaders t is -0,030 and Sig. is 0,976) related to customer satisfaction. The absolute standardized
coefficients of authentic leadership and number of leaders are the same (Beta authentic leadership
and Beta number of leaders is 0,005). These variables have the same influence on the dependent
variable customer satisfaction.
4.3.2.2 Authentic leadership and job satisfaction
In Appendix 11 the major assumptions multiple linear regression analyses are given. Appendix 11.13
shows a histogram and scatterplot of the residuals from the dependent variable job satisfaction as
assumption for the multiple linear regression analysis between authentic leadership, job satisfaction,
and the control variable number of leaders. The model is linear and the residuals are normally
distributed and homoscedasticity. Another assumption of the multiple linear regression analysis is
showed in Appendix 11.14, there is no multicollinearity between the independent variable and the
control variable. In the multiple linear analysis is 1 outliner found (Appendix 11.15). The standardized
residual is 2,010 standard deviations removed from the middle of the distribution. This outliners is
not very high and is not removed from the analysis.
Figure 25: Model summary multiple regression analysis
The independent variable authentic leadership and the control variable number of leaders are very
weak related to the dependent variable job satisfaction, R is 0,263. The variance in job satisfaction is
for 6,90 % (R square) explained by the variance in authentic leadership and number of leaders (Figure
25).
Figure 26: ANOVA multiple regression analysis
In Figure 26 the variance analysis of the dependent variable job satisfaction is described. The total
variance of job satisfaction is divided into unexplained variance and explained variance. The
R R Square Adjusted R Square Std. Error of the Estimate
1 ,263a ,069 ,016 ,53198
Model Summaryb
Model
a. Predictors: (Constant), Numberofleaders, Authenticleadership
b. Dependent Variable: Jobsatisfaction
Sum of Squares df Mean Square F Sig.
Regression ,735 2 ,367 1,299 ,286b
Residual 9,905 35 ,283
Total 10,640 37
a. Dependent Variable: Jobsatisfaction
b. Predictors: (Constant), Numberofleaders, Authenticleadership
ANOVAa
Model
1

Master Business Administration Lilian van de Water
University Twente s 0182273
41
unexplained variance is 9,905 (Sum of squares residual) and the explained variance is 0,735 (Sum of
squares regression). The multiple regression between authentic leadership, number of leaders and
job satisfaction is not significant (F is 1,299 and Sig. is 0,286).
Figure 27: Coefficients multiple regression analysis
In Figure 27 the components of the multiple regression analysis are given. The multiple regression
analysis is defined as: Job satisfaction = 1,203 (B constant) + 0,432 (B authentic leadership) *
Authentic leadership + 0,020 (B number of leaders) * Number of leaders. Authentic leadership and
number of leaders are both not significant (authentic leadership t is 1,128 and Sig. is 0,267, number
of leaders t is 1,230 and Sig. is 0,227) related to job satisfaction. The absolute standardized
coefficients of authentic leadership and number of leaders are 0,185 and 0,201 (Beta authentic
leadership and Beta number of leaders). Number of leaders has more influence on the dependent
variable job satisfaction.
4.3.2.3 Authentic leadership and revenue
In Appendix 11 the major assumptions of the multiple linear regression analyses are given. Appendix
11.16 shows a histogram and scatterplot of the residuals from the dependent variable revenue as
assumption for the multiple linear regression analysis between authentic leadership, revenue, and
the control variable number of leaders. The model is linear and the residuals are normally distributed
and homoscedasticity. Another assumption of the multiple linear regression analysis is showed in
Appendix 11.17, there is no multicollinearity between the independent variable and the control
variable. In the multiple linear analysis are 3 outliners found (Appendix 11.18). The standardized
residuals are -2,047, -2,073 and 2,077 standard deviations removed from the middle of the
distribution. These outliners are not very high and are not removed from the analysis.
Figure 28: Model summary multiple regression analysis
The independent variable authentic leadership and the control variable number of leaders are very
weak related to the dependent variable revenue, R is 0,167. The variance in revenue is for 2,80 % (R
square) explained by the variance in authentic leadership and number of leaders (Figure 28).
Standardized Coefficients
B Std. Error Beta
(Constant) 1,203 1,110 1,083 ,286
Authenticleadership ,432 ,383 ,185 1,128 ,267
Numberofleaders ,020 ,016 ,201 1,230 ,227
Coefficientsa
Model
Unstandardized
Coefficients
t Sig.
1
a. Dependent Variable: Jobsatisfaction
R R Square Adjusted R Square Std. Error of the Estimate
1 ,167a ,028 -,028 ,45209
Model Summaryb
Model
a. Predictors: (Constant), Numberofleaders, Authenticleadership
b. Dependent Variable: Revenue

Master Business Administration Lilian van de Water
University Twente s 0182273
42
Figure 29: ANOVA multiple regression analysis
In Figure 29 the variance analysis of the dependent variable revenue is described. The total variance
of revenue is divided into unexplained variance and explained variance. The unexplained variance is
7,153 (Sum of squares residual) and the explained variance is 0,204 (Sum of squares regression). The
multiple regression between authentic leadership, number of leaders and revenue is not significant
(F is 0,499 and Sig. is 0,611).
Figure 30: Coefficients multiple regression analysis
In Figure 30 the components of the multiple regression analysis are given. The multiple regression
analysis is defined as: Revenue = 2,083 (B constant) + 0,316 (B authentic leadership) * Authentic
leadership - 0,002 (B number of leaders) * Number of leaders. Authentic leadership and number of
leaders are both not significant (authentic leadership t is 0,970 and Sig. is 0,339, number of leaders t
is -0,167 and Sig. is 0,896) related to revenue. The absolute standardized coefficients of authentic
leadership and number of leaders are 0,162 and 0,028 (Beta authentic leadership and Beta number
of leaders). Authentic leadership has more influence on the dependent variable revenue.
4.3.2.4 Ethical leadership and customer satisfaction
In Appendix 11 the major assumptions of the multiple linear regression analyses are given. Appendix
11.19 shows a histogram and scatterplot of the residuals from the dependent variable customer
satisfaction as assumption for the multiple linear regression analysis between ethical leadership,
customer satisfaction, and the control variable number of leaders. The model is linear and the
residuals are normally distributed and homoscedasticity. Another assumption of the multiple linear
regression analysis is showed in Appendix 11.20, there is no multicollinearity between the
independent variable and the control variable. In the multiple linear analysis is 1 outliner found
(Appendix 11.21). The standardized residual is 2,016 standard deviations removed from the middle
of the distribution. This outliners is not very high and is not removed from the analysis.
Sum of Squares df Mean Square F Sig.
Regression ,204 2 ,102 ,499 ,611b
Residual 7,153 35 ,204
Total 7,357 37
a. Dependent Variable: Revenue
b. Predictors: (Constant), Numberofleaders, Authenticleadership
ANOVAa
Model
1
Standardized Coefficients
B Std. Error Beta
(Constant) 2,083 ,944 2,207 ,034
Authenticleadership ,316 ,325 ,162 ,970 ,339
Numberofleaders -,002 ,014 -,028 -,167 ,869
Coefficientsa
Model
Unstandardized
Coefficients
t Sig.
1
a. Dependent Variable: Revenue

Master Business Administration Lilian van de Water
University Twente s 0182273
43
Figure 31: Model summary multiple regression analysis
The independent variable ethical leadership and the control variable number of leaders are very
weak related to the dependent variable customer satisfaction, R is 0,378. The variance in customer
satisfaction is for 14,30 % (R square) explained by the variance in ethical leadership and number of
leaders (Figure 31).
Figure 32: ANOVA multiple regression analysis
In Figure 32 the variance analysis of the dependent variable customer satisfaction is described. The
total variance of customer satisfaction is divided into unexplained variance and explained variance.
The unexplained variance is 4,493 (Sum of squares residual) and the explained variance is 0,749 (Sum
of squares regression). The multiple regression between ethical leadership, number of leaders and
customer satisfaction is not significant (F is 2,919 and Sig. is 0,067).
Figure 33: Coefficients multiple regression analysis
In Figure 33 the components of the multiple regression analysis are given. The multiple regression
analysis is defined as: Customer satisfaction = 5,013 (B constant) – 0,754 (B ethical leadership) *
Ethical leadership + 0,007 (B number of leaders) * Number of leaders. Ethical leadership is significant
and number of leaders is not significant (ethical leadership t is -2,416 and Sig. is 0,021, number of
leaders t is 0,578 and Sig. is 0,567) related to customer satisfaction. The absolute standardized
coefficients of ethical leadership and number of leaders are 0,391 and 0,094 (Beta ethical leadership
and Beta number of leaders). Ethical leadership has more influence on the dependent variable
customer satisfaction.
R R Square Adjusted R Square Std. Error of the Estimate
1 ,378a ,143 ,094 ,35828
Model Summaryb
Model
a. Predictors: (Constant), Numberofleaders, Ethicalleadership
b. Dependent Variable: Customersatisfaction
Sum of Squares df Mean Square F Sig.
Regression ,749 2 ,375 2,919 ,067b
Residual 4,493 35 ,128
Total 5,242 37
a. Dependent Variable: Customersatisfaction
b. Predictors: (Constant), Numberofleaders, Ethicalleadership
ANOVAa
Model
1
Standardized Coefficients
B Std. Error Beta
(Constant) 5,013 ,908 5,520 ,000
Ethicalleadership -,754 ,312 -,391 -2,416 ,021
Numberofleaders ,007 ,011 ,094 ,578 ,567
Coefficientsa
Model
Unstandardized
Coefficients
t Sig.
1
a. Dependent Variable: Customersatisfaction

Master Business Administration Lilian van de Water
University Twente s 0182273
44
4.3.2.5 Ethical leadership and job satisfaction
In Appendix 11 the major assumptions of multiple linear regression analyses are given. Appendix
11.22 shows a histogram and scatterplot of the residuals from the dependent variable job
satisfaction as assumption for the multiple linear regression analysis between ethical leadership, job
satisfaction, and the control variable number of leaders. The model is linear and the residuals are
normally distributed and homoscedasticity. Another assumption of the multiple linear regression
analysis is showed in Appendix 11.23, there is no multicollinearity between the independent variable
and the control variable. In the multiple linear analysis is 1 outliners found (Appendix 11.24). The
standardized residual is 2,097 standard deviations removed from the middle of the distribution. This
outliners is not very high and is not removed from the analysis.
Figure 34: Model summary multiple regression analysis
The independent variable ethical leadership and the control variable number of leaders are very
weak related to the dependent variable job satisfaction, R is 0,189. The variance in job satisfaction is
for 3,60 % (R square) explained by the variance in ethical leadership and number of leaders (Figure
34).
Figure 35: ANOVA multiple regression analysis
In Figure 35 the variance analysis of the dependent variable job satisfaction is described. The total
variance of job satisfaction is divided into unexplained variance and explained variance. The
unexplained variance is 10,261 (Sum of squares residual) and the explained variance is 0,379 (Sum of
squares regression). The multiple regression between ethical leadership, number of leaders and job
satisfaction is not significant (F is 0,647 and Sig. is 0,530).
R R Square Adjusted R Square Std. Error of the Estimate
1 ,189a ,036 -,019 ,54144
Model Summaryb
Model
a. Predictors: (Constant), Numberofleaders, Ethicalleadership
b. Dependent Variable: Jobsatisfaction
Sum of Squares df Mean Square F Sig.
Regression ,379 2 ,190 ,647 ,530b
Residual 10,261 35 ,293
Total 10,640 37
a. Dependent Variable: Jobsatisfaction
b. Predictors: (Constant), Numberofleaders, Ethicalleadership
ANOVAa
Model
1

Master Business Administration Lilian van de Water
University Twente s 0182273
45
Figure 36: Coefficients multiple regression analysis
In Figure 36 the components of the multiple regression analysis are given. The multiple regression
analysis is defined as: Job satisfaction = 2,615 (B constant) - 0,060 (B ethical leadership) * Ethical
leadership + 0,019 (B number of leaders) * Number of leaders. Ethical leadership and number of
leaders are both not significant (ethical leadership t is -0,127 and Sig. is 0,900, number of leaders t is
1,126 and Sig. is 0,268) related to job satisfaction. The absolute standardized coefficients of ethical
leadership and number of leaders are 0,022 and 0,193 (Beta ethical leadership and Beta number of
leaders). Number of leaders has more influence on the dependent variable job satisfaction.
4.3.2.6 Ethical leadership and revenue
In Appendix 11 the major assumptions of the multiple linear regression analyses are given. Appendix
11.25 shows a histogram and scatterplot of the residuals from the dependent variable revenue as
assumption for the multiple linear regression analysis between ethical leadership, revenue, and the
control variable number of leaders. The model is linear and the residuals are normally distributed
and homoscedasticity. Another assumption of the multiple linear regression analysis is showed in
Appendix 11.26, there is no multicollinearity between the independent variable and the control
variable. In the multiple linear analysis are 2 outliners found (Appendix 11.27). The standardized
residuals are -2,359 and -2,163 standard deviations removed from the middle of the distribution.
These outliners are not very high and are not removed from the analysis.
Figure 37: Model summary multiple regression analysis
The independent variable ethical leadership and the control variable number of leaders are very
weak related to the dependent variable revenue, R is 0,177. The variance in revenue is for 3,10 % (R
square) explained by the variance in ethical leadership and number of leaders (Figure 37).
Standardized Coefficients
B Std. Error Beta
(Constant) 2,615 1,373 1,905 ,065
Ethicalleadership -,060 ,472 -,022 -,127 ,900
Numberofleaders ,019 ,017 ,193 1,126 ,268
Coefficientsa
Model
Unstandardized
Coefficients
t Sig.
1
a. Dependent Variable: Jobsatisfaction
R R Square Adjusted R Square Std. Error of the Estimate
1 ,177a ,031 -,024 ,45122
a. Predictors: (Constant), Numberofleaders, Ethicalleadership
b. Dependent Variable: Revenue
Model Summaryb
Model
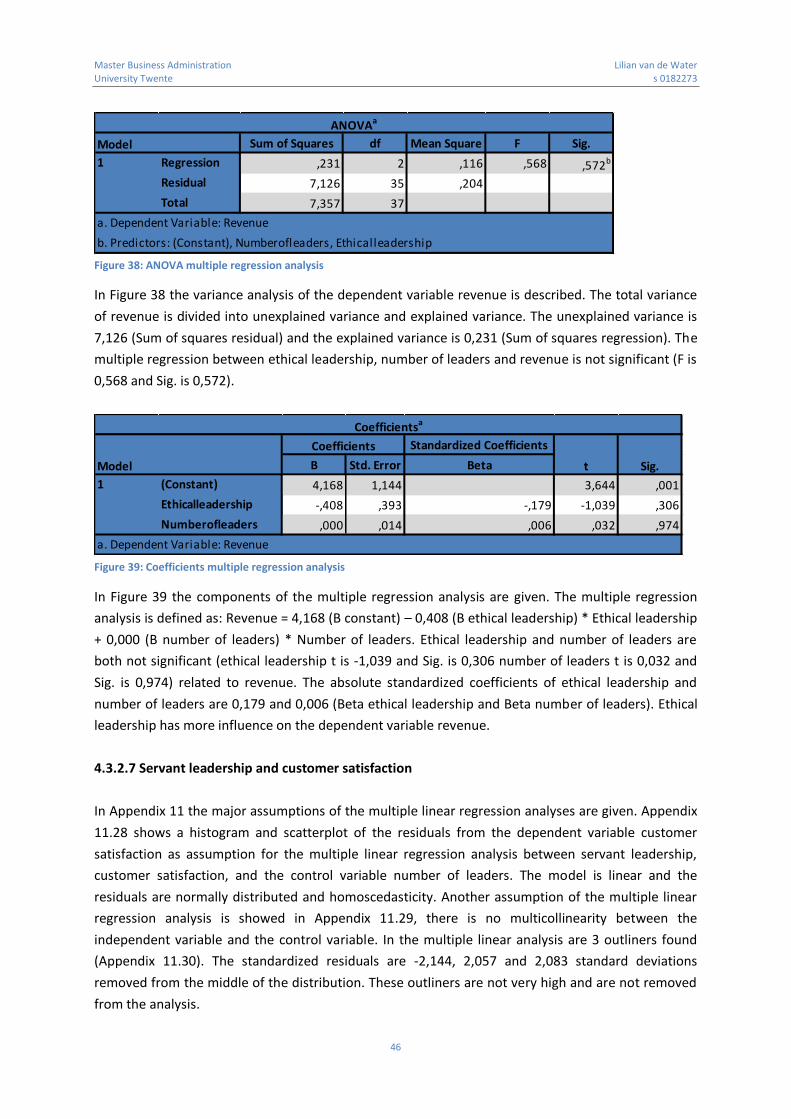
Master Business Administration Lilian van de Water
University Twente s 0182273
46
Figure 38: ANOVA multiple regression analysis
In Figure 38 the variance analysis of the dependent variable revenue is described. The total variance
of revenue is divided into unexplained variance and explained variance. The unexplained variance is
7,126 (Sum of squares residual) and the explained variance is 0,231 (Sum of squares regression). The
multiple regression between ethical leadership, number of leaders and revenue is not significant (F is
0,568 and Sig. is 0,572).
Figure 39: Coefficients multiple regression analysis
In Figure 39 the components of the multiple regression analysis are given. The multiple regression
analysis is defined as: Revenue = 4,168 (B constant) – 0,408 (B ethical leadership) * Ethical leadership
+ 0,000 (B number of leaders) * Number of leaders. Ethical leadership and number of leaders are
both not significant (ethical leadership t is -1,039 and Sig. is 0,306 number of leaders t is 0,032 and
Sig. is 0,974) related to revenue. The absolute standardized coefficients of ethical leadership and
number of leaders are 0,179 and 0,006 (Beta ethical leadership and Beta number of leaders). Ethical
leadership has more influence on the dependent variable revenue.
4.3.2.7 Servant leadership and customer satisfaction
In Appendix 11 the major assumptions of the multiple linear regression analyses are given. Appendix
11.28 shows a histogram and scatterplot of the residuals from the dependent variable customer
satisfaction as assumption for the multiple linear regression analysis between servant leadership,
customer satisfaction, and the control variable number of leaders. The model is linear and the
residuals are normally distributed and homoscedasticity. Another assumption of the multiple linear
regression analysis is showed in Appendix 11.29, there is no multicollinearity between the
independent variable and the control variable. In the multiple linear analysis are 3 outliners found
(Appendix 11.30). The standardized residuals are -2,144, 2,057 and 2,083 standard deviations
removed from the middle of the distribution. These outliners are not very high and are not removed
from the analysis.
Sum of Squares df Mean Square F Sig.
Regression ,231 2 ,116 ,568 ,572b
Residual 7,126 35 ,204
Total 7,357 37
ANOVAa
Model
1
a. Dependent Variable: Revenue
b. Predictors: (Constant), Numberofleaders, Ethicalleadership
Standardized Coefficients
B Std. Error Beta
(Constant) 4,168 1,144 3,644 ,001
Ethicalleadership -,408 ,393 -,179 -1,039 ,306
Numberofleaders ,000 ,014 ,006 ,032 ,974
Coefficientsa
Model
Unstandardized
Coefficients
t Sig.
1
a. Dependent Variable: Revenue
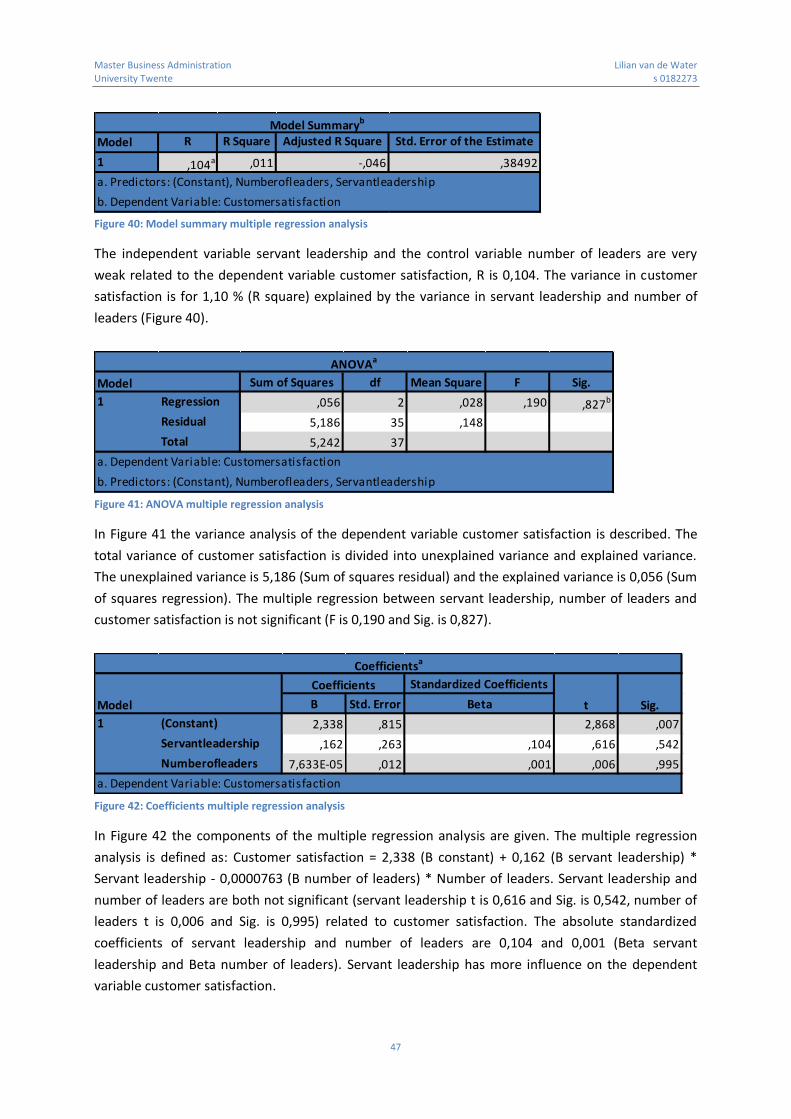
Master Business Administration Lilian van de Water
University Twente s 0182273
47
Figure 40: Model summary multiple regression analysis
The independent variable servant leadership and the control variable number of leaders are very
weak related to the dependent variable customer satisfaction, R is 0,104. The variance in customer
satisfaction is for 1,10 % (R square) explained by the variance in servant leadership and number of
leaders (Figure 40).
Figure 41: ANOVA multiple regression analysis
In Figure 41 the variance analysis of the dependent variable customer satisfaction is described. The
total variance of customer satisfaction is divided into unexplained variance and explained variance.
The unexplained variance is 5,186 (Sum of squares residual) and the explained variance is 0,056 (Sum
of squares regression). The multiple regression between servant leadership, number of leaders and
customer satisfaction is not significant (F is 0,190 and Sig. is 0,827).
Figure 42: Coefficients multiple regression analysis
In Figure 42 the components of the multiple regression analysis are given. The multiple regression
analysis is defined as: Customer satisfaction = 2,338 (B constant) + 0,162 (B servant leadership) *
Servant leadership - 0,0000763 (B number of leaders) * Number of leaders. Servant leadership and
number of leaders are both not significant (servant leadership t is 0,616 and Sig. is 0,542, number of
leaders t is 0,006 and Sig. is 0,995) related to customer satisfaction. The absolute standardized
coefficients of servant leadership and number of leaders are 0,104 and 0,001 (Beta servant
leadership and Beta number of leaders). Servant leadership has more influence on the dependent
variable customer satisfaction.
R R Square Adjusted R Square Std. Error of the Estimate
1 ,104a ,011 -,046 ,38492
Model Summaryb
Model
a. Predictors: (Constant), Numberofleaders, Servantleadership
b. Dependent Variable: Customersatisfaction
Sum of Squares df Mean Square F Sig.
Regression ,056 2 ,028 ,190 ,827b
Residual 5,186 35 ,148
Total 5,242 37
a. Dependent Variable: Customersatisfaction
b. Predictors: (Constant), Numberofleaders, Servantleadership
ANOVAa
Model
1
Standardized Coefficients
B Std. Error Beta
(Constant) 2,338 ,815 2,868 ,007
Servantleadership ,162 ,263 ,104 ,616 ,542
Numberofleaders 7,633E-05 ,012 ,001 ,006 ,995
Coefficientsa
Model
Unstandardized
Coefficients
t Sig.
1
a. Dependent Variable: Customersatisfaction

Master Business Administration Lilian van de Water
University Twente s 0182273
48
4.3.2.8 Servant leadership and job satisfaction
In Appendix 11 the major assumptions of the multiple linear regression analyses are given. Appendix
11.31 shows a histogram and scatterplot of the residuals from the dependent variable job
satisfaction as assumption for the multiple linear regression analysis between servant leadership, job
satisfaction, and the control variable number of leaders. The model is linear and the residuals are
normally distributed and homoscedasticity. Another assumption of the multiple linear regression
analysis is showed in Appendix 11.32, there is no multicollinearity between the independent variable
and the control variable. In the multiple linear analysis is 1 outliner found (Appendix 11.33). The
standardized residual is 2,114 standard deviations removed from the middle of the distribution. This
outliner is not very high and is not removed from the analysis.
Figure 43: Model summary multiple regression analysis
The independent variable servant leadership and the control variable number of leaders are very
weak related to the dependent variable job satisfaction, R is 0,271. The variance in job satisfaction is
for 7,30 % (R square) explained by the variance in servant leadership and number of leaders (Figure
43).
Figure 44: ANOVA multiple regression analysis
In Figure 44 the variance analysis of the dependent variable job satisfaction is described. The total
variance of job satisfaction is divided into unexplained variance and explained variance. The
unexplained variance is 9,861 (Sum of squares residual) and the explained variance is 0,779 (Sum of
squares regression). The multiple regression between servant leadership, number of leaders and job
satisfaction is not significant (F is 1,382 and Sig. is 0,264).
R R Square Adjusted R Square Std. Error of the Estimate
1 ,271a ,073 ,020 ,53080
a. Predictors: (Constant), Numberofleaders, Servantleadership
b. Dependent Variable: Jobsatisfaction
Model Summaryb
Model
Sum of Squares df Mean Square F Sig.
Regression ,779 2 ,389 1,382 ,264b
Residual 9,861 35 ,282
Total 10,640 37
ANOVAa
Model
1
a. Dependent Variable: Jobsatisfaction
b. Predictors: (Constant), Numberofleaders, Servantleadership

Master Business Administration Lilian van de Water
University Twente s 0182273
49
Figure 45: Coefficients multiple regression analysis
In Figure 45 the components of the multiple regression analysis are given. The multiple regression
analysis is defined as: Job satisfaction = 1,110 (B constant) + 0,434 (B servant leadership) * Servant
leadership + 0,020 (B number of leaders) * Number of leaders. Servant leadership and number of
leaders are both not significant (servant leadership t is 1,198 and Sig. is 0,239, number of leaders t is -
1,227 and Sig. is 0,228) related to job satisfaction. The absolute standardized coefficients of servant
leadership and number of leaders are 0,195 and 0,200 (Beta servant leadership and Beta number of
leaders). Number of leaders has more influence on the dependent variable job satisfaction.
4.3.2.9 Servant leadership and revenue
In Appendix 11 the major assumptions of the multiple linear regression analyses are given. Appendix
11.34 shows a histogram and scatterplot of the residuals from the dependent variable revenue as
assumption for the multiple linear regression analysis between servant leadership, revenue, and the
control variable number of leaders. The model is linear and the residuals are normally distributed
and homoscedasticity. Another assumption of the multiple linear regression analysis is showed in
Appendix 11.35, there is no multicollinearity between the independent variable and the control
variable. In the multiple linear analysis are 3 outliners found (Appendix 11.36). The standardized
residuals are -2,120, -2,363 and 2,197 standard deviations removed from the middle of the
distribution. These outliners are not very high and are not removed from the analysis.
Figure 46: Model summary multiple regression analysis
The independent variable servant leadership and the control variable number of leaders are very
weak related to the dependent variable revenue, R is 0,120. The variance in revenue is for 1,40 % (R
square) explained by the variance in servant leadership and number of leaders (Figure 46).
Standardized Coefficients
B Std. Error Beta
(Constant) 1,110 1,124 ,987 ,330
Servantleadership ,434 ,363 ,195 1,198 ,239
Numberofleaders ,020 ,016 ,200 1,227 ,228
Coefficientsa
Model
Unstandardized
Coefficients
t Sig.
1
a. Dependent Variable: Jobsatisfaction
R R Square Adjusted R Square Std. Error of the Estimate
1 ,120a ,014 -,042 ,45516
Model Summaryb
Model
a. Predictors: (Constant), Numberofleaders, Servantleadership
b. Dependent Variable: Revenue

Master Business Administration Lilian van de Water
University Twente s 0182273
50
Figure 47: ANOVA multiple regression analysis
In Figure 47 the variance analysis of the dependent variable revenue is described. The total variance
of revenue is divided into unexplained variance and explained variance. The unexplained variance is
7,251 (Sum of squares residual) and the explained variance is 0,107 (Sum of squares regression). The
multiple regression between servant leadership, number of leaders and revenue is not significant (F
is 0,257 and Sig. is 0,775).
Figure 48: Coefficients multiple regression analysis
In Figure 48 the components of the multiple regression analysis are given. The multiple regression
analysis is defined as: Revenue = 3,634 (B constant) – 0,211 (B servant leadership) * Servant
leadership - 0,014 (B number of leaders) * Number of leaders. Servant leadership and number of
leaders are both not significant (servant leadership t is -0,667 and Sig. is 0,503, number of leaders t is
-0,280 and Sig. is 0,781) related to revenue. The absolute standardized coefficients of servant
leadership and number of leaders are 0,114 and 0,047 (Beta servant leadership and Beta number of
leaders). Servant leadership has more influence on the dependent variable revenue.
4.3.2.10 Summary authentic leadership
Authentic leadership is very weak positive related to customer satisfaction. The influence of
authentic leadership on customer satisfaction is less than the influence of authentic leadership and
number of leaders on customer satisfaction. The variance of customer satisfaction is by the multiple
regression analysis for 0,00% explained by the variance in authentic leadership and number of
leaders. The models of authentic leadership and customer satisfaction, and authentic leadership,
number of leaders and customer satisfaction are both not significant. Authentic leadership and
number of leaders have the same influence on the variable customer satisfaction. These variables are
both not significant related to customer satisfaction.
Authentic leadership is very weak positive related to job satisfaction. The influence of authentic
leadership on job satisfaction is less than the influence of authentic leadership and number of
Sum of Squares df Mean Square F Sig.
Regression ,107 2 ,053 ,257 ,775b
Residual 7,251 35 ,207
Total 7,357 37
ANOVAa
Model
1
a. Dependent Variable: Revenue
b. Predictors: (Constant), Numberofleaders, Servantleadership
Standardized Coefficients
B Std. Error Beta
(Constant) 3,634 ,964 3,771 ,001
Servantleadership -,211 ,311 -,114 -,677 ,503
Numberofleaders -,004 ,014 -,047 -,280 ,781
Coefficientsa
Model
Unstandardized
Coefficients
t Sig.
1
a. Dependent Variable: Revenue

Master Business Administration Lilian van de Water
University Twente s 0182273
51
leaders on job satisfaction. The variance of job satisfaction is by the multiple regression analysis for
6,90% explained by the variance in authentic leadership and number of leaders. The models of
authentic leadership and job satisfaction, and authentic leadership, number of leaders and job
satisfaction are both not significant. Number of leaders has more influence on the variable job
satisfaction than authentic leadership. These variables are both not significant related to job
satisfaction.
Authentic leadership is very weak positive related to revenue. The influence of authentic leadership
on revenue is less than the influence of authentic leadership and number of leaders on revenue. The
variance of revenue is by the multiple regression analysis for 2,80% explained by the variance in
authentic leadership and number of leaders. The models of authentic leadership and revenue, and
authentic leadership, number of leaders and revenue are both not significant. Authentic leadership
has more influence on the variable revenue than number of leaders. These variables are both not
significant related to revenue.
4.3.2.11 Summary ethical leadership
Ethical leadership is very weak negative related to customer satisfaction. The influence of ethical
leadership on customer satisfaction is less than the influence of ethical leadership and number of
leaders on customer satisfaction. The variance of customer satisfaction is by the multiple regression
analysis for 14,30% explained by the variance in ethical leadership and number of leaders. The model
of ethical leadership and customer satisfaction is significant, but the model of ethical leadership,
number of leaders and customer satisfaction is not significant. Ethical leadership has more influence
on the variable customer satisfaction than number of leaders. The variable of customer satisfaction is
significant related to customer satisfaction, but the variable number of leaders is not significant
related to customer satisfaction.
Ethical leadership is very weak positive related to job satisfaction. The influence of ethical leadership
on job satisfaction is less than the influence of ethical leadership and number of leaders on job
satisfaction. The variance of job satisfaction is by the multiple regression analysis for 3,60% explained
by the variance in ethical leadership and number of leaders. The models of ethical leadership and job
satisfaction, and ethical leadership, number of leaders and job satisfaction are both not significant.
Number of leaders has more influence on the variable job satisfaction than ethical leadership. These
variables are both not significant related to job satisfaction.
Ethical leadership is very weak negative related to revenue. The influence of ethical leadership on
revenue, and the influence of ethical leadership and number of leaders on revenue are the same. The
variance of revenue is by the multiple regression analysis for 3,10% explained by the variance in
ethical leadership and number of leaders. The models of ethical leadership and revenue, and ethical
leadership, number of leaders and revenue are both not significant. Ethical leadership has more
influence on the variable revenue than number of leaders. These variables are both not significant
related to revenue.

Master Business Administration Lilian van de Water
University Twente s 0182273
52
4.3.2.12 Summary servant leadership
Servant leadership is very weak positive related to customer satisfaction. The influence of leadership
on customer satisfaction, and the influence of servant leadership and number of leaders on customer
satisfaction are the same. The variance of customer satisfaction is by the multiple regression analysis
for 1,10% explained by the variance in servant leadership and number of leaders. The models of
servant leadership and customer satisfaction, and servant leadership, number of leaders and
customer satisfaction are both not significant. Servant leadership has more influence on the variable
customer satisfaction than number of leaders. These variables are both not significant related to
customer satisfaction.
Servant leadership is very weak positive related to job satisfaction. The influence of servant
leadership on job satisfaction is less than the influence of servant leadership and number of leaders
on job satisfaction. The variance of job satisfaction is by the multiple regression analysis for 7,30%
explained by the variance in servant leadership and number of leaders. The models of servant
leadership and job satisfaction, and servant leadership, number of leaders and job satisfaction are
both not significant. Number of leaders has more influence on the variable job satisfaction than
servant leadership. These variables are both not significant related to job satisfaction.
Servant leadership is very weak negative related to revenue. The influence of servant leadership on
revenue is less than the influence of servant leadership and number of leaders revenue. The
variance of revenue is by the multiple regression analysis for 1,40% explained by the variance in
servant leadership and number of leaders. The models of servant leadership and revenue, and
servant leadership, number of leaders and revenue are both not significant. Servant leadership has
more influence on the variable revenue than number of leaders. These variables are both not
significant related to revenue.

Master Business Administration Lilian van de Water
University Twente s 0182273
53
5.0 Conclusion
In this chapter the conclusion of the research is given. The main question of this research is defined
as: Which current leadership styles lead to most effective leadership in legal service organizations?
The current leadership styles are characterized as authentic, ethical, and servant leadership styles
and effective leadership is defined by the performance indicators customer satisfaction, job
satisfaction, and revenue.
In the previous chapters, the basis of this research is explained. Based on the results from the
different legal service organizations has only one leadership style significant influence on one
performance indicator. This leadership style is the ethical leadership style and the performance
indicator is customer satisfaction. Ethical leadership leads to most customer satisfaction in the
different legal service organizations, the other measured leadership styles and performance
indicators are not significant related to each other.
In the literature were no studies or theories found who were related to the relationship between
customer satisfaction and ethical leadership. It was not to be expected that this relationship was the
only significant relationship. In the literature were studies and/or theories found who suggested the
direct/indirect relationship between the different leadership styles and the job satisfaction and
revenue concept. It was to be expected that one of these relationships was the best, but not a
relationship related to the customer satisfaction concept.
5.1 Implications for further research
This paragraph gives implications for further research. In the literature chapter, the concepts of
authentic, ethical, and servant leadership were analyzed. All these concepts has different definitions,
operationalization’s and measures. These concepts should be further developed to get more
generally accepted definitions, operationalization’s and measure of these concepts. Nowadays the
different aspects of the leadership concepts are very different.
In this research the authentic leadership, ethical leadership and servant leadership styles are
measured by the ALI, ELW, and SLS. All these instruments are valid and reliable to measure the
described leadership styles. The performance indicators customer satisfaction, job satisfaction, and
revenue are measured by the CSI, JSI, and RI. Only the JSI is a valid and reliable measure. In the
literature were no measures found who measured the described concepts of customer satisfaction
and revenue. The CSI and RI are based on a self-made index. These instruments need to be
developed to get a more reliable instrument to the measured concepts of customer satisfaction and
revenue.
Although there has been considerable interest focused on the topics authentic, ethical, and servant
leadership in recent years, empirical research on these concepts has been limited. The relations
between the different leadership styles and other indicators can be further developed to get a good
view on the effectiveness of the different leadership styles. Especially on the influence of the
different leadership styles on customer satisfaction. In the literature is no information about this
subject available. In this research are the direct relationships between the different leadership styles

Master Business Administration Lilian van de Water
University Twente s 0182273
54
and performance indicators measured, but there are a lot of aspects who has a possible influence of
these relationships. Further research need to be developed.
The variables of this research are investigated in legal service organizations, further research can be
investigated in other sectors.
5.2 Limitations
In this research the relationships between the different leadership styles and the performance
indicators are measured by 38 lawyers, who rated their 38 leaders on the different concepts. The
sample size (38 leaders) is relatively small, a larger sample size would allow for more reliable analysis
that could capture the relationships that exist in most legal service organizations.
Another aspect is that the 38 leader in this research were rated by 38 lawyers on their leadership
style, and these lawyers give their own meaning on the performance indicators. One leader is rated
by one lawyer. This research is more reliable if more lawyers rated one leader. The answers are now
dependent on one meaning.
5.3 Implications for practice
Based on the results from the different legal service organizations has only one leadership style
significant influence on one performance indicator. This leadership style is the ethical leadership style
and the performance indicator is customer satisfaction. Ethical leadership leads to most customer
satisfaction in the measured legal service organizations. Legal service organizations should adopt
more ethical leadership aspects to the leadership style of their leaders to get more satisfied
customers. Ethical leaders were seen as fair and principle centered decision-makers, and were
characterized as honest, caring, and principles leaders. These leaders do not only care about their
subordinates, but also about society. The ethical leader influenced the ethical and unethical
behaviors of subordinates by means of proactive efforts. This means that the ethical leader
frequently communicate with their subordinates about ethics and ethical standards, and use rewards
and punishments for the correct performing of these standards.

Master Business Administration Lilian van de Water
University Twente s 0182273
55
References
Books:
Bass, B. M., & Bass R. (2009). The Bass Handbook of Leadership: Theory, Research, and Managerial
Applications. New York: Free Press.
Bass, B. M., & Stogdill, R.M. (1990). Bass en Stogdill`s Handbook of Leadership: Theory, Research, and
Managerial Applications. New York: The Free Press.
Cranny, C. J., Smith, P. C., & Stone, E. F. (1992). Job satisfaction: how people feel about their jobs and how it affects their performance. New York: Lexington Press.
George, W. (2003). Authentic leadership: Rediscovering the secrets to creating lasting value. San
Francisco: Jossey-Bass.
Greenleaf, R. K. (1970). The servant as a leader. Indianapolis: Greenleaf Center.
Greenleaf, R. K. (1977). Servant leadership: A journey into the nature of legitimate power and
greatness. New York: Paulist Press.
Kernis, M. H., & Goldman, B. M. (2005). From thought and experience to behavior and interpersonal
relationships: A multicomponent conceptualization of authenticity. In Tesser, A., Wood J. V., &
Stapel, D.A. (Eds.), On building, defending, and regulating the self: A psychological perspective (pp.
31–52). New York: Psychology Press.
Kernis, M. H., & Goldman, B. M. (2006). A multicomponent conceptualization of authenticity: Theory
and research. In Zanna, M. P. (Ed.), Advances in experimental social psychology. (Vol. 38, pp. 283–
357). San Diego: Academic Press.
Laub, J. A. (1999). Assessing the servant orgnization; Development of the Organizational Leadership
Assessment (OLA) model. Dissertation Abstracts International, 60 (02), 308A.
Luthans, F., & Avolio, B. J. (2003). Authentic leadership development. In K. S. Cameron, J. E. Dutton, &
R. E. Quinn (Eds.), Positive organizational scholarship: Foundations of a new discipline (pp. 241–261).
San Francisco: Barrett-Koehler.
Patterson, K. A. (2003). Servant leadership: A theoretical model, Doctoral dissertation. Regent
University.
Spears, L. C. (1995). Reflections on leadership: How Robert K. Greenleaf’s theory of servant-leadership
influenced today’s top management thinkers. New York, John Wiley.

Master Business Administration Lilian van de Water
University Twente s 0182273
56
Vennix, J. (2006). Theorie en praktijk van empirisch onderzoek. Essex, Pearson custom publishing.
Wong, P. T. P., & Davey, D. (2007). Best practices in servant leadership. Paper presented at the
Servant Leadership Research Roundtable. Regent University, Virginia Beach.
Articles:
Algera, P. M., & Lips-Wiersma, M. (2012). Radical Authentic Leadership: Co-creating the Conditions
Under Which All Members of the Organization Can Be Authentic. The Leadership Quarterly, 23, no. 1,
118–131.
Alvesson, M. & Sveningsson, S. (2003). Good Visions, Bad Micro-management and Ugly Ambiguity:
Contradictions of (Non-)Leadership in a Knowledge-Intensive Organization. Organization Studies, 24,
6, 961–988.
Amagoh, F. (2009). Leadership Development and Leadership Effectiveness. Management Decision,
47, no. 6, 989–999.
Avolio, B. J., & Gardner, W. L. (2005). Authentic leadership development: Getting to the root of
positive forms of leadership. The Leadership Quarterly, 16, 315–338
Avolio, B. J., Kahai, S., & Dodge G. E. (2001). E-leadership: Implications for Theory, Research, and
Practice. The Leadership Quarterly, 11, no. 4, 615–668.
Avolio, B. J., Walumbwa, F. O., and Weber, T. J., (2009). Leadership: Current Theories, Research, and
Future Directions. Annual Review of Psychology, 60, 421–449.
Barbuto, J. E. & Wheeler, D.W. (2006). Scale Development and Construct Clarification of Servant
Leadership. Group & Organization Management, 31, no. 3, 300-326.
Bono, J. E., & Judge, T. A. (2003). Self-concordance at work: Toward understanding the motivational effects of transformational leaders. Academy of Management Journal, 46, 554-571. Brayfield, A. H., & Rothe, H. F. (1951). An index of job satisfaction. Journal of Applied Psychology, 35, 307-311.
Brown, M. E., & Treviño L. K. (2006). Ethical Leadership: A Review and Future Directions. The
Leadership Quarterly 17, no. 6, 595–616.
Brown, M. E., Treviño L. K., & Harrison D. A. (2005). Ethical Leadership: A Social Learning Perspective
for Construct Development and Testing. Organizational Behavior and Human Decision Processes, 97,
no. 2, 117–134.

Master Business Administration Lilian van de Water
University Twente s 0182273
57
Carter, S. M., & Greer, C.R. (2013). Strategic Leadership: Values, Styles, and Organizational
Performance. Journal of Leadership & Organizational Studies.
Chan, P. H., Ng P.K., & Jee K.S. (2012). Identifying the Link between Leadership Styles and TQM
Practices: A Conceptual Framework. 2nd International Conference on Design and Concurrent
Engineering, 40–44.
Clapp-Smith, R., Vogelgesang, G. R., & Avey J. B. (2009). Authentic Leadership and Positive
Psychological Capital The Mediating Role of Trust at the Group Level of Analysis. Journal of
Leadership & Organizational Studies, 15, no. 3, 227–240.
Cummings, G. G., MacGregor, T., Davey, M., Lee, H., Wong C. C., Lo E., Muise M., & Stafford E. (2010).
Leadership Styles and Outcome Patterns for the Nursing Workforce and Work Environment: A
Systematic Review. International Journal of Nursing Studies, 47, no. 3, 363–385.
De Hoogh, A. H. B., & Den Hartog, D. N. (2008). Ethical and despotic leadership, relationships with
leader's social responsibility, top management team effectiveness and subordinates' optimism: A
multi-method study. Leadership Quarterly, 19, 297−311.
Dennis, R. S. & Bocarnea, M. (2005). Development of the Servant Leadership Assessment Instrument,
Leadership & Organization Development, 26, no. 8, 600-615.
Ehrhart, M. G. (2004). Leadership and procedural justice climate as antecedents of unit-level
organizational citizenship behavior. Personnel Psychology, 57, 61-94.
Giallonardo, L. M., Wong C. A, & Iwasiw C. L. (2010). Authentic Leadership of Preceptors: Predictor of
New Graduate Nurses’ Work Engagement and Job Satisfaction. Journal of Nursing Management, 18,
no. 8, 993–1003.
Gardner, W. L., Cogliser, C.C., Davis K. M., & Dickens M.P. (2011). Authentic Leadership: A Review of
the Literature and Research Agenda. The Leadership Quarterly, 22, no. 6, 1120–1145.
Gardner, W. L., Avolio, B. J., Luthans, F., May, D. R., & Walumbwa, F. O. (2005). “ Can you see the
real me?” A self-based model of authentic leader and follower development. The Leadership
Quarterly, 16, 343–372.
Hale, J. R., & Fields D. L. (2007). Exploring Servant Leadership Across Cultures: A Study of Followers in
Ghana and the USA. Leadership 3, no. 4, 397–417.
Hartog, D. N., Muijen, J. J., & Koopman P. L. (1997). Transactional Versus Transformational
Leadership: An Analysis of the MLQ. Journal of Occupational and Organizational Psychology 70, no. 1,
19–34.

Master Business Administration Lilian van de Water
University Twente s 0182273
58
Henderson, J. E., & Hoy, W. K. (1983). Leader authenticity: The development and test of an
operational measure. Educational and Psychological Research, 3, 2, 63–75.
Higgs, M. (2003). How Can We Make Sense of Leadership in the 21st Century? Leadership &
Organization Development Journal 24, no. 5, 273–284.
Hmieleski, K. M., Cole, M. S., & Baron R. A. (2012). Shared Authentic Leadership and New Venture Performance. Journal of Management, 38, no. 5, 1476–1499.
Ilies, R., Morgeson, F.P., and Nahrgang, J. D. (2005). Authentic Leadership and Eudaemonic Well-
being: Understanding Leader–follower Outcomes. The Leadership Quarterly, 16, no. 3, 373–394.
Jaramillo, F., Grisaffe, D. B., Chonko, L. B., & Roberts, J. A. (2009). Examining the impact of servant
leadership on salesperson’s turnover intention. Journal of Personal Selling and Sales Management,
29: 351-365.
Jensen, S. M., & Luthans, F. (2006). Entrepreneurs as Authentic Leaders: Impact on Employees’
Attitudes.` Leadership & Organization Development Journal, 27, no. 8, 646–666.
Jing, F. F., & Avery G.C. (2011). Missing Links in Understanding the Relationship between Leadership
and Organizational Performance. International Business & Economics Research Journal, 7, no. 5.
Johnson, M. D., Gustafsson, A., Andreassen, T.W., Lervik, L., & Cha, J. (2001). The evolution and
future of national customer satisfaction index models. Journal of Economic Psychology, 22, Issue 2,
217–245
Jones, D., (2011). Servant leadership`s impact on profit, employee satisfaction, and empowerment
within the framework of a participate culture in business, Proceedings of the Academy for Studies in
Business, 3, 2, 9-12.
Judge, T. A., Bono, J. E., & Locke, E. A. (2000). Personality and job satisfaction: The mediating role of job characteristics. Journal of Applied Psychology, 85, 237-249. Judge, T. A., & Colquitt J. A. (2004)Organizational justice and stress: The mediating role of work-family conflict. Journal of Applied Psychology, 89, 395-404.
Judge, T. A., Locke, E. A., Durham, C. C., & Kluger, A. N. (1998). Dispositional effects on job and life satisfaction: The role of core evaluations. Journal of Applied Psychology, 83, 17-34.
Kalshoven, K., Den Hartog, D.N., & De Hoogh, A.H.B. (2011a). Ethical Leader Behavior and Big Five
Factors of Personality. Journal of Business Ethics, 100, no. 2, 349–366.
Master Business Administration Lilian van de Water
University Twente s 0182273
59
Kalshoven, K., Den Hartog, D.N., & De Hoogh, A.H.B. (2011b). Ethical Leadership at Work
Questionnaire (ELW): Development and Validation of a Multidimensional Measure. The Leadership
Quarterly, 22, no. 1, 51–69.
Kim, S. (2007). Learning Goal Orientation, Formal Mentoring, and Leadership Competence in HRD: a
Conceptual Model. Journal of European Industrial Training, 31, no. 3, 181–194.
Kim, W. G., & Brymer, R. A. (2011) The effects of ethical leadership on manager job satisfaction,
commitment, behavioral outcomes, and firm performance. International Journal of Hospitality
Management, 30, 4, 1020–1026.
Liden, R. C., Wayne, S.J., Zhao, H., & Henderson, D. (2008). Servant Leadership: Development of a
Multidimensional Measure and Multi-level Assessment. The Leadership Quarterly, 19, no. 2, 161-177.
Mayer, D. M., Bardes, M., & Piccolo, R. F. (2008). Do servant-leaders help satisfy follower needs? An
organizational justice perspective. European Journal of Work and Organizational Psychology, 17, 180-
197.
Neider, L. L. & Schriesheim, C. A. (2011). The Authentic Leadership Inventory (ALI): Development and
Empirical Tests. The Leadership Quarterly, 22, no. 6, 1146–1164.
Neubert, M. J., Carlson D. S., Kacmar K. M., Roberts J. A., and Chonko L. B. (2009). The Virtuous Influence of Ethical Leadership Behavior: Evidence from the Field. Journal of Business Ethics, 90, no. 2, 157–170.
Nienaber, H. (2011). Conceptualization of Management and Leadership. Management Decision, 48,
no. 5, 661–675.
Politis, J. D. (2001). The relationship of various leadership styles to knowledge management,
Leadership & Organization Development Journal, Vol. 22, 8, 354–364.
Popova, V., & Sharpanskykh A. (2010). Modeling Organizational Performance Indicators. Information
Systems, 35, no. 4, 505–527.
Reinke, S. J. (2003). Does the form really matter? Leadership, trust, and acceptance of the
performance appraisal process. Review of Public Personnel Administration, no. 23, 23-37.
Reinke, S. J. (2004). Service before self: Towards a theory of servant-leadership. Global Virtue Ethics
Review, 3, 30-57.
Resick, C. J., Hanges, P. J., Dickson, M. W., & Mitchelson, J. K. (2006). A cross-cultural examination of the endorsement of ethical leadership. Journal of Business Ethics, 63, 345−359.

Master Business Administration Lilian van de Water
University Twente s 0182273
60
Richard, P. J., Devinney T.M., Yip G.S., & Johnson G. (2009). Measuring Organizational Performance:
Towards Methodological Best Practice. Journal of Management, 35, no. 3, 718–804.
Russell, R. F., & Stone A. G. (2002). A Review of Servant Leadership Attributes: Developing a Practical
Model. Leadership & Organization Development Journal, 23, no. 3, 145-157.
Schwepker Jr, C. H. (2010). Ethical Climate’s Relationship to Job Satisfaction, Organizational Commitment, and Turnover Intention in the Salesforce. Journal of Business Research, 54, no. 1, 39–52.
Sendjaya, S., Sarros, J. C., & Santora, J. C. (2008). Defining and measuring servant leadership
behaviour in organizations. Journal of Management Studies, 45, no. 2, 402–424.
Shamir, B., & Eilam, G. (2005). What’s Your Story?’ A Life-stories Approach to Authentic Leadership
Development. The Leadership Quarterly, 16, no. 3, 395–417.
Sureshchandar, G. S., Rajendran C., & Anantharaman R.N. (2002). The Relationship between Service
Quality and Customer Satisfaction–a Factor Specific Approach. Journal of Services Marketing 16, no.
4, 363–379.
Thompson, E. R., & Phua F. T.T. (2012). A Brief Index of Affective Job Satisfaction. Group & Organization Management, 37, no. 3, 275–307.
Uhl-Bien, M., Marion R., & McKelvey B. (2007). Complexity Leadership Theory: Shifting Leadership
from the Industrial Age to the Knowledge Era. The Leadership Quarterly 18, no. 4.
Van Dierendonck, D. (2011). Servant Leadership: A Review and Synthesis. Journal of Management,
37, no. 4, 1228-1261.
Van Dierendonck, D., & Nuijten I. (2011). The Servant Leadership Survey: Development and
Validation of a Multidimensional Measure. Journal of Business and Psychology, 26, no. 3, 249-267.
Vardiman, P. D., Houghton, J. D., & Jinkerson D. L. (2006). Environmental Leadership Development:
Toward a Contextual Model of Leader Selection and Effectiveness. Leadership & Organization
Development Journal, 27, no. 2, 93–105.
Walumbwa, F. O., Avolio, B. J., Gardner, W. L., Wernsing, T. S., & Peterson, S. J. (2008). Authentic
leadership: Development and validation of a theory-based measure. Journal of Management, 34, 89–
126.
Walumbwa, F. O., Wang, P., Wang, H., Schaubroeck J., & Avolio B.J. (2010). Psychological Processes
Linking Authentic Leadership to Follower Behaviors. The Leadership Quarterly, 21, no. 5, 901–914.

Master Business Administration Lilian van de Water
University Twente s 0182273
61
Weiss, H. M., (2002). Deconstructing Job Satisfaction: Separating Evaluations, Beliefs and Affective
Experiences. Human Resource Management Review, 12, no. 2, 173–194.
West, G. R. B., Bocarnea, M., & Maranon, D. (2009). Servant-leadership as a predictor of job
satisfaction and organizational commitment with the moderating effects of organizational support
and role clarity among Filippino engineering, manufacturing, and technology workers. International
Journal of Servant-Leadership, 5, 129-162
Zhu, W., May D. R., and Avolio B.J. (2004).The Impact of Ethical Leadership Behavior on Employee
Outcomes: The Roles of Psychological Empowerment and Authenticity. Journal of Leadership &
Organizational Studies, 11, no. 1, 16–26.

Master Business Administration Lilian van de Water
University Twente s 0182273
62
Appendix 1: Research performance indicators
1.1 Performance indicators research
The performance indicator research is designed to determine the current performance indicators of
modern leaders. These performance indicators are translated into the most important performance
indicators where a leader in an organization is rated on. Leaders from six organizations are
interviewed in the period September 2012 until October 2013. The choice for this leaders and the
associated organization is first of all based on the connection within the researchers` social network.
The second and last choice is based on the context of the organization, the leaders are managing a
knowledge-intensive organization or a part of a knowledge-organization. This is a descriptive
research to determine the current performance indicators where a leader in an organization is rated
on. The chosen method for this research is a qualitative method, interviews with open questions.
The interview questions are based on general questions of the organization and the leader, and
specific questions about the most important current performance indicators were the leader is rated
on. The interviews are conducted in the Dutch language, by an standardized open-ended face-to-
face interview. After the face-to-face interviews, the interviews are elaborated and for control
mailed to the leaders (Vennix, 2006). The controlled version is translated in English and used in this
research.
1.2 Research questions performance indicators research
Introductie:
Doel van het onderzoek: Mijn onderzoek is gebaseerd op de effectiviteit van moderne
leiderschapsstijlen in organisaties. Leiderschap en management zijn hierbij als gelijke termen
aangenomen (allebei omschreven als leiderschap). De effectiviteit van de leider wordt gezien als het
succes van een leider om zijn volgelingen te beïnvloeden om de organisatie doelstellingen te
behalen. Om de doelstellingen van de organisatie te kunnen vertalen wordt er vaak gebruik gemaakt
van prestatie indicatoren. Ik wil graag weten op welke prestatie indicatoren u als leidinggevende
wordt beoordeeld.
Algemeen onderzoek:
- Open vragen
- Ongeveer 30 minuten.
- Het interview wordt opgenomen, indien niet gewenst worden er aantekeningen gemaakt.
- Anonimiteit kan worden gewaarborgd.
- Het gehele interview wordt terug gestuurd, waarop de ondervraagde kan nalezen of alles
juist is geïnterpreteerd. Feedback is welkom.

Master Business Administration Lilian van de Water
University Twente s 0182273
63
Vragen:
1 Wat is de naam van de organisatie?
2 Tot welke sector en branche wordt de organisatie gerekend?
3 Wat zijn in het kort de activiteiten van de organisatie?
4 Welke functie heeft u binnen de organisatie?
5 Wat zijn in het kort u werkzaamheden?
6 Hoeveel managementlagen zijn er binnen de organisatie en waar staat u?
7 Wat zijn de 5 belangrijkste prestatie indicatoren waarop u als leider wordt beoordeeld?
8 Wat houden deze prestatie indicatoren in?
Einde interview:
- Bedanken.
- Locatie, tijd en datum vastleggen.
- Interview wordt zo snel mogelijk uitgewerkt.
- Einde van het document opsturen voor commentaar.
1.3 Interview details performance indicators research
1. Freaky Piano Bar
Location: Arnhem, 23.09.2013, 12.00 AM
Interviewee: Anonymous
Function: Leader of the Freaky Piano Bar
Student: Lilian van de Water
Time: 17 minutes
2. Ardea Auto Soest
Location: Arnhem, 25.09.2013, 18.00 AM
Interviewee: Anonymous
Function: Leader of Ardea Auto Soest
Student: Lilian van de Water
Time: 16 minutes
3. Large German insurance organization
Location: Arnhem, 27.09.2013, 10.00 AM
Interviewee: Anonymous
Function: Leader of large German insurance organization
Student: Lilian van de Water

Master Business Administration Lilian van de Water
University Twente s 0182273
64
Time: 14 minutes
4. Esdal College Emmen
Location: Emmen, 29.09.2013, 14.00 AM
Interviewee: Anonymous
Function: Leader of Esdal College te Emmen
Student: Lilian van de Water
Time: 17 minutes
5. Manager Vivare
Location: Velp, 3.10.2013, 16.30 AM
Interviewee: Anonymous
Function: Leader of Vivare
Student: Lilian van de Water
Time: 13 minutes
6. Manager of an large broker organization
Location: Arnhem, 14.10.2013, 18.00 AM
Interviewee: Anonymous
Function: Leader of large broker organization
Student: Lilian van de Water
Time: 13 minutes
1.4 Findings performance indicators research
1.4.1 Leadership catering
General organization: The organization of the leader is part of an umbrella catering company and
belongs to the catering industry in the commercial service sector. This umbrella catering company
consists of 20 restaurants/pubs in the areas of Nijmegen, Arnhem and Enschede. The organization of
the leader is a pub and ensures that guests have a great evening through music, hospitality and
entertainment. The pub is ideal for guests between 18 and 35 years.
Leadership: On top of the umbrella catering company a board is available, in which two people
participate. Under the board are two regional leaders working, one for the restaurants/pubs in
Arnhem and one for the restaurants/pubs in Nijmegen and Enschede. Below the regional leaders are
the leaders of the various restaurants/pubs participating, where certain leaders have one or more
assistant leaders. The interviewed leader is leader of a pub in Arnhem. The tasks of the leader
include: keeping the costs as low as possible, getting the highest possible revenues, coaching, guiding

Master Business Administration Lilian van de Water
University Twente s 0182273
65
and correcting staff, booking pianists, ordering drinks and accessories, making the staff schedules
and preparing weekly management meetings.
Performance indicators: The leader will be measured on the following performance indicators: cost
savings, revenue increasing, staff satisfaction, organizational, and creativity. The performance
indicators are defined as:
Cost savings: The aim is to earn as much as possible by spending as little as possible. Every week the
main cost are discussed. The main cost are personnel costs. The personnel costs are translated into a
percentage of the revenues and this percentage should be as low as possible. There is little budget
for other expenses.
Revenue increasing: The intention is to obtain revenues as much as possible. This will be done by
devising actions, retaining guests and getting contact with the guests. The pub is only open a few
days in the week and in this days the money need to be earned.
Staff satisfaction: In the pub work are a lot of part-timers based on a zero hour contract. Many of the
employees are visiting school also or have another (full-time) job. The working conditions are not
ideal. The employees must often wait until it is busy enough before they can start working and be
cashed out for the work. For this reason the satisfaction of the employees is very important,
otherwise they will leave the organization after a short period.
Organizational: In the organization certain things are last minute decisions. The leaders need some
organizational talent to manage these changes. Consider the fact that the pub must be open, the
employees need to be working at the right place, that there is a pianist and there are dj`s, and that
the drinks order is inside. The right conditions will make a pub successful.
Creativity: Leaders need to be creative to increase the revenues and reduce costs. A lot happened
here on the basis of last minute decisions, so the leader must be creative in finding all kinds of
solutions. The leaders need some creativity to make sure that everything runs well. Creativity is also
measured on the marketing and theme weekends.
1.4.2 Leadership automotive
General organization: The organization is part of an umbrella holding and belongs to the automotive
industry in the commercial service sector. Between this holding, different cars are being sold, rent,
and leased. The holding also provides insurance, financings, and vehicle equipments. The
organization of the leader primarily offers one car brand, associated with insurance and financing.
The cars are divided into new and used private cars, company cars, cars for lease, and fleets. The
organization of the leaders also repair and maintain cars.
Leadership: On top of the holding company presides the board of directors. The organization of the
interviewed leader belongs to one of the five activities of the umbrella holding company. In this
activity the interview leader is manager of one establishment. Between this two leadership layers the
cluster leader and the general leader are participating. The leader of the establishment is primarily
responsible for the sales of the cars. The cars are thereby divided into new cars, used cars, lease cars,
and company cars. The leader is also responsible for setting up the showroom, and pricing,
advertising, invoicing, and marketing of the cars.

Master Business Administration Lilian van de Water
University Twente s 0182273
66
Performance indicators: The leader will be measured on the following performance indicators:
revenue cars, financing products, accessories, costs and gross profit. The performance indicators are
defined as:
Revenue cars: For the leader of the establishment a revenue is rated, this revenue should be
achieved. This revenue is rated for new cars, used cars, lease cars, and company cars.
Financing products: Financing products are loans to customers who cannot or will not pay for a car in
one time. The financings products are measured as a percentage of the revenues from the sold cars.
Accessories: The accessories are calculated as a percentage of the average car price. Accessories
means everything that is installed afterwards on the car, like radios, navigations, tow bars, and
wheels.
Gross profit: The leader makes a budget in which the sales number and gross profit of the cars are
calculated. This gross profit number must be achieved. The prices from new cars are imposed by the
importer of the new car. These prices are the basic prices, but the leader has a little change approach
on these prices. This little change approach is related to the bill margin. The leader can determine
how large the bill margin is by the sale of the car. Prices of used cars are determined by the leader
himself.
Costs: The leader gets often used cars from customers who sold a new car. The customers want to
change the used car for a part of the price from the new car. The trade-in price is determined by the
leader and is counting among the costs. The leader should also be noted that the car should be
repaired. The revenues of these cars were removed from the costs. Costs should be as low as
possible.
1.4.3 Leadership insurance
General organization: The organization is a large German insurance company and belongs to the
insurance industry in the financial service sector. The organization is internationally oriented and one
of the largest financial institutions in the world. The activities of this organization are mainly focused
on insurance, life insurance and asset management. The organization of the leader is located in the
Netherlands.
Leadership: In the Dutch organization four levels of leadership can be distinguished. On top of the
Dutch organization presides the board of directors. Below the board of directors other directors are
participating, who control each a group of 5 till 15 specialist. Some directors control a group of 100
specialist, these directors have an extra layer of leadership in their group. The lowest layer of
leadership consists of team leaders in the groups with specialists. The interviewed leader is part of
the board of directors and is responsible for the results of the organization. The results are measured
by profits, revenues, technical results, customer satisfaction/loyalty, and employee satisfaction.
Performance indicators: The effectiveness of the leader will be measured on the following
performance indicators: profit, revenues, technical results, customer satisfaction/loyalty, and
employee satisfaction. The performance indicators are defined as:
Profit: The profit is measured by income minus costs of the various insurances and other activities
within the organization.
Revenues: Revenues of sold insurances and other activities of the organization.
Master Business Administration Lilian van de Water
University Twente s 0182273
67
Technical results: Technical results are the net results about the actual activities of the organization,
no secondary activities of the organization. For example, the organization also invests their money. In
a good year that should be positive, but this money cannot be used in bad activities of the
organization. This is not accepted. At the end everything is compensated, but in the technical results
all parts are separately viewed.
Customer satisfaction/loyalty: Customer satisfaction is divided into two aspects. First of all the
satisfaction of the end customer is measured, and secondly the satisfaction of the distribution
channel, the intermediary. Thereby is measured what the opinion of the customers and the agents
about the organization are. Finally, there is also measured over what time the customers are loyal to
the organization.
Employee satisfaction: The employee satisfaction is measured by an engagement survey. Once a year
the employees are asked 100 questions. Questions includes themes like; what do they think of the
company, how do we deal with innovation, how well do we deal with integrity, how well can the
leader manage etc.
1.4.4 Leadership education
General organization: The organization is a high school and belongs to the education industry in the
non-commercial services sector. This organization provides education to 3670 high school students
from the level of vmbo to gymnasium. The organization is divided into six locations.
Leadership: In this organization three leadership layers are distinguishable. On top of the
organization presides the board, in which two people participate. The second layer is filled in by the
location directors with their own boards. The lowest layer belongs to the team leaders, who
participate below the location directors. The interviewed leader is one of the two board members,
and responsible for the overall organization. The portfolio of the leader mainly consists of external
relations, managing location directors, formation, and education.
Performance indicators: The leader will be measured on the following performance indicators:
education quality, financial health, anticipate on future developments, responsible employees, and
satisfaction of students and parents. The performance indicators are defined as:
Education quality: The education on the high school needs to be sufficient. This is assessed by the
inspection on the basis of a monitoring and assessment framework.
Financial health: The organization need to be financially healthy. This is assessed by the accountant
and the inspection.
Anticipate on future developments: The organization needs to anticipate on future developments,
such as ICT, appropriate education, and shrinkage in the population, to meet all requirements in the
future.
Responsible employees: This subject supports the quality of the education. The responsibility of the
employees are evaluated by the school council, inspection, and unions. In the organization are also
internal satisfaction surveys conducted to measure the satisfaction of the employees.
Satisfaction of students and parents: The satisfaction of the students and parents is internally
measured by satisfaction surveys. The satisfaction survey measures the satisfactions of these groups
and if these groups are involved enough.
Master Business Administration Lilian van de Water
University Twente s 0182273
68
1.4.5 Leadership housing corporation
General organization: The organization is a housing corporation and belongs to the housing industry
in the non-commercial services sector. The activities of this organization are mainly focused on the
rent, sell, manage and maintain of rental houses. The organization is also focused on building new
houses, which are later be rented or sold. The organization is divided over 6 locations.
Leadership: The top of the organization provides the board, followed by leaders and team leaders.
The interviewed leader is one of the leaders and responsible for four of the five locations where
customer processes are taking place. The customer processes are divided into rental processes,
maintenance, collections, and nuisance processes. The leader is responsible for the region `s Duiven,
Elst, Velp and Renkum. The region Arnhem also has customer processes, but this location has his own
leader. The leader ensures that everything runs smoothly in her four locations and controlled 7 team
leaders.
Performance indicators: The leader will be measured on the following performance indicators: lack of
occupancy, backlog figures, satisfaction residents, employee satisfaction, and sales targets. These
performance indicators are defined as:
Lack of occupancy: The houses should be rented out as soon as possible. The time between the
change of different residents should be as short as possible.
Backlog figures: The backlog figures should not increase tremendously. These figures are related to
residents who do not pay their rent. There are targets established for the height of the backlog
figures.
Employee satisfaction: The organization measured by the residents the satisfaction of the houses and
neighborhoods.
Sales targets: Some houses have to be sold, because there is decided that these houses do not longer
belong to the portfolio of the organization. For the sale of these houses sales targets are rated.
1.4.6 Leadership brokerage
General organization: The organization is part of an umbrella broker company and belongs to the
housing industry in the commercial service sector. The organizations are located in Gelderland and
Overijssel and are focused on the areas of business broker, private broker, mortgages and
insurances. The interviewed leader is working at one of the establishments of this umbrella
brokerage company.
Leadership: On top of the umbrella broker company provides the board, followed by the leaders
form the different establishments and leaders by a specific specialization. The last layer of leadership
is only applicable in the larger establishments. The interviewed leader is leader of an establishment
and is responsible for the results of the establishment. This means that there are enough houses to
be sold, the margin on the houses are achieved, and that the number of customers should be kept
and expanded.
Performance indicators: The leader will be measured on the following performance indicators: sale
numbers, input new houses, run time, sales prices, and customer satisfaction. The performance
indicators are defined as:

Master Business Administration Lilian van de Water
University Twente s 0182273
69
Sale numbers: This indicator is determined on basis of the number of houses sold.
Input new houses: It is very important that the leader builds a network and that this network is
maintained. The work of a broker depends on new houses that can be sold.
Run time: The run time is calculated on the time that a house is up for sale. It is very important that a
house is resold very quick. At this time it is more difficult than in previous years.
Sale prices: This is the price for how much the houses are sold. The establishment gets a percentage
of the selling price of every house. In some cases the establishment gets a fixed price. These incomes
are the turnover of the organization.
Customer satisfaction: Customer satisfaction is measured by the organization. It is very important
that customers think positively about the establishment and receive a good service.
1.4.7 Summery and tables performance indicators research
Figure 49 & 50 give an overview of the results from the 6 interviewed leaders. In Figure 49 are the
different current performance indicators described. In Figure 50 is general information given about
the organizations of the 6 interviewed leaders.
Figure 49: Summery performance indicators
Figure 50: Summery general information
1.4.8 Current performance indicators
The goal of this research is to determine the most common current performance indicators. All the 6
interviewed leaders give 5 current performance indicators. These current performance indicators are
shown in Figure 51, summarized and based on common categories. These common categories are
costs, revenue, employee satisfaction, organizational, creativity, financing products, accessories,
gross profit, technical results, customer satisfaction, quality, financial health, anticipate on future
developments, lack of occupancy, backlog figures, sales targets, sale numbers, input new houses, and
run time.
The categories customer satisfaction, employee satisfaction, and revenue are all 4 times specified.
These categories are the most common performance indicators measured by the 6 interviewed
Leader PI 1 PI 2 PI 3 PI 4 PI 5
Catering Cost savings Revenue increasing Staff satisfaction Organizational Creativity
Automotive Revenue cars Financing products Accessories Gross profit Costs
Insurance Profit Revenues Technical results Customer satisfaction/loyalty Emloyee satisfaction
Education Education quality Financial health Anticipate on future developments Responsible employees Satisfaction of students and parents
Housing corporation Lack of occupancy Backlog figures Satisfaction residents Employee satisfaction Sales targets
Brokerage Sale numbers Input new houses Run time Sale prices Customer satisfaction
General data Industry Sector Number of leadership layers Leadership layer interviewed leader
Catering Catering Commercial service sector 4 3
Automotive Automotive Commercial service sector 4 4
Insurance Insurance Financial service sector 4 1
Education Education Non-commercial service sector 3 1
Housing corporation Housing Non-commercial service sector 3 2
Brokerage Housing Commercial service sector 3 2

Master Business Administration Lilian van de Water
University Twente s 0182273
70
leaders and used for input in the literature chapter and main research. Based on a short literature
review employee satisfaction is translated in job satisfaction, because this definition better reflects
the described definition of the 4 interviewed leaders. Summarized are customer satisfaction, job
satisfaction, and revenue the chosen current performance indicators.
Figure 51: Chosen performance indicators
General performance indicators Number Leader Specific performance indicator
Costs 2 Catering Cost savings
Automotive Costs
Revenue 4 Catering Revenue increasing
Automotive Revenue cars
Insurance Revenues
Brokerage Sale prices
Employee satisfaction 4 Catering Staff satisfaction
Insurance Emloyee satisfaction
Education Responsible employees
Housing corporation Employee satisfaction
Organizational 1 Catering Organizational
Creativity 1 Catering Creativity
Financing products 1 Automotive Financing products
Accessories 1 Automotive Accessories
Gross profit 2 Automotive Gross profit
Insurance Profit
Technical results 1 Insurance Technical results
Customer satisfaction 4 Insurance Customer satisfaction/loyalty
Education Satisfaction of students and parents
Housing corporation Satisfaction residents
Brokerage Customer satisfaction
Quality 1 Education Education quality
Financial health 1 Education Financial health
Anticipate on future developments 1 Education Anticipate on future developments
Lack of occupancy 1 Housing corporation Lack of occupancy
Backlog figures 1 Housing corporation Backlog figures
Sales targets 1 Housing corporation Sales targets
Sale numbers 1 Brokerage Sale numbers
Input new houses 1 Brokerage Input new houses
Run time 1 Brokerage Run time

Master Business Administration Lilian van de Water
University Twente s 0182273
71
Appendix 2: Research questions
Effectief leiderschap
Het doel van deze enquête is te onderzoeken welke moderne leiderschapsstijl leidt tot het meest
effectieve leiderschap in de juridische branche. Leiderschap en management zijn hierbij als gelijke
termen aangenomen (allebei omschreven als leiderschap). De effectiviteit van een leidinggevende
wordt gezien als het succes van deze leidinggevende om zijn medewerkers te beïnvloeden om de
organisatie doelstellingen te behalen. Om de doelstellingen van de organisatie te kunnen vertalen
wordt er gebruik gemaakt van prestatie indicatoren.
Het eerste gedeelte van het onderzoek bestaat uit algemene vragen over het kantoor waar u
werkzaam bent. In het tweede gedeelte van het onderzoek worden verschillende moderne
leiderschapsstijlen uiteengezet om te onderzoeken in welke mate deze binnen uw kantoor
voorkomen. In het derde en laatste gedeelte worden verschillende prestatie indicatoren onderzocht.
Deze gegevens worden alleen voor dit onderzoek gebruikt en alles blijft volledig anoniem. Het
onderzoek zal ongeveer 30-45 minuten in beslag nemen.
Algemene vragen.
Dit eerste onderdeel van het onderzoek bevat algemene vragen. Deze vragen zijn alleen van
toepassing op het kantoor waar u zelf werkzaam bent.
1. In welke plaats is uw kantoor gevestigd?
Open vraag
2. Is het kantoor onderdeel van een internationale onderneming?
Gesloten vraag Ja/Nee
3. Tot welke sector wordt het kantoor gerekend?
Open vraag
4. Tot welke branche wordt het kantoor gerekend?
Open vraag
5. Wat zijn in het kort de hoofdactiviteiten van het kantoor?
Open vraag
6. Hoeveel mensen zijn er in totaal werkzaam op het kantoor?
Gesloten vraag 0-15/15-30/30-45/45-60/60 of meer
7. Hoeveel juristen zijn er werkzaam op het kantoor?
Gesloten vraag 0-10/10-20/20-30/30-40/40 of meer
8. Hoeveel leidinggevenden zijn er binnen de juridische kant van het kantoor werkzaam?
(Leidinggevenden en managers zijn als gelijke termen aangenomen, zie introductie enquête)
Open vraag

Master Business Administration Lilian van de Water
University Twente s 0182273
72
Moderne leiderschapsstijlen
Dit onderdeel van het onderzoek geeft aspecten van verschillende moderne leiderschapsstijlen weer.
Deze moderne leiderschapsstijlen zijn vertaald in eigenschappen/aspecten van een leidinggevende.
Deze eigenschappen/aspecten moeten worden beoordeeld op uw leidinggevende.
9. In hoeverre komen deze aspecten/eigenschappen voor bij uw leidinggevende?
10. In hoeverre komen deze aspecten/eigenschappen voor bij uw leidinggevende?
11. In hoeverre komen deze aspecten/eigenschappen voor bij uw leidinggevende?
Altijd Vaak Soms Zelden Nooit
1. Mijn leidinggevende zegt duidelijk wat hij/zij bedoelt.
2. Mijn leidinggevende toont samenhang tussen zijn/haar overtuigingen en handelingen.
3. Mijn leidinggevende vraagt om ideeën die zijn/haar kern overtuigingen uitdagen.
4. Mijn leidinggevende beschrijft nauwkeurig de manier waarop anderen zijn/haar capaciteiten bekijken.
5. Mijn leidinggevende maakt gebruik van zijn/haar kern overtuigingen om beslissingen te nemen.
6. Mijn leidinggevende luistert aandachtig naar alternatieve perspectieven voordat er een conclusie wordt genomen.
7. Mijn leidinggevende laat zien dat hij/zij zijn/haar sterke en zwakke punten begrijpt.
8. Mijn leidinggevende deelt openlijk informatie met anderen.
9. Mijn leidinggevende weerstaat de druk op hem/haar om dingen in tegenstelling tot zijn/haar overtuigingen te doen.
10. Mijn leidinggevende analyseert objectief relevante gegevens alvorens hij/zij een beslissing neemt.
11. Mijn leidinggevende is zich duidelijk bewust van de impact die hij/zij heeft op anderen.
12. Mijn leidinggevende drukt zijn/haar ideeën en gedachten duidelijk uit naar anderen.
13. Mijn leidinggevende wordt door interne morele standaarden geleid in zijn/haar activiteiten.
14. Mijn leidinggevende moedigt anderen aan om tegengestelde standpunten aan te dragen.
Altijd Vaak Soms Zelden Nooit
1. Mijn leidinggevende is geïnteresseerd in hoe ik mijzelf voel en hoe ik het doe.
2. Mijn leidinggevende neemt de tijd voor persoonlijk contact.
3. Mijn leidinggevende besteedt aandacht aan mijn persoonlijke behoeften.
4. Mijn leidinggevende neemt de tijd om te praten over werk -gerelateerde emoties.
5. Mijn leidinggevende is oprecht geinteresseerd in mijn persoonlijke ontwikkeling.
6. Mijn leidinggevende sympathiseert met me als ik problemen heb.
7. Mijn leidinggevende geeft om zijn/haar volgelingen.
8. Mijn leidinggevende houdt mij verantwoordelijk voor problemen waar ik geen controle over heb.
9. Mijn leidinggevende houdt mij verantwoordelijk voor werk waar ik geen controle over heb.
10. Mijn leidinggevende houdt mij verantwoordelijk voor dingen die niet mijn schuld zijn.
11. Mijn leidinggevende voert zijn/haar eigen succes ten koste van anderen.
12. Mijn leidinggevende is vooral gericht op het bereiken van zijn/haar eigen doelen.
13. Mijn leidinggevende manipuleert ondergeschikten.
14. Mijn leidinggevende staat het toe om ondergeschikten belangrijke beslissingen te laten beïnvloeden.
15. Mijn leidinggevende staat niet toe dat anderen deelnemen aan de besluitvorming.
16. Mijn leidinggevende wint advies in bij ondergeschikten met betrekking tot de organisatiestrategie.
17. Mijn leidinggevende zal een besluit heroverwegen op basis van aanbevelingen die door diegenen worden gemaakt die aan hem/haar rapporteren.
18. Mijn leidinggevende delegeert uitdagende verantwoordelijkheden aan ondergeschikten.
19. Mijn leidinggevende staat toe dat ik een sleutelrol speel bij het vaststellen van mijn eigen prestatiedoelen.
20. Mijn leidinggevende zou op een milieuvriendelijke manier willen werken.
21. Mijn leidinggevende toont zorg voor duurzaamheidsvraagstukken.
22. Mijn leidinggevende stimuleert de recycling van producten en materialen op onze afdeling.
23. Mijn leidinggevende legt duidelijk de aan integriteit gerelateerde gedragscodes uit.
24. Mijn leidinggevende legt uit wat er van de medewerkers wordt verwacht in termen van gedrag met integriteit.
25. Mijn leidinggevende verduidelijkt integriteitsrichtlijnen.
26. Mijn leidinggevende zorgt ervoor dat medewerkers de codes van integriteit volgen.
27. Mijn leidinggevende verduidelijkt de waarschijnlijke gevolgen van eventueel onethisch gedrag door mijzelf en mijn collega's.
28. Mijn leidinggevende stimuleert de discussie over integriteit bij medewerkers.
29. Mijn leider geeft complimenten aan medewerkers die zich gedragen volgens de integriteit richtlijnen.
30. Mijn leidinggevende geeft aan wat de verwachte prestaties van elk lid van de groep zijn.
31. Mijn leidinggevende legt uit wat er van elk groepslid wordt verwacht.
32. Mijn leider legt uit wat er van mij en mijn collega's wordt verwacht.
33. Mijn leidinggevende verduidelijkt prioriteiten.
34. Mijn leidinggevende verduidelijkt wie waar verantwoordelijk voor is.
35. Mijn leidinggevende houdt zijn/haar beloften.
36. Mijn leidinggevende kan worden vertrouwd door te doen wat hij/zij zegt.
37. Mijn leider kan worden ingeroepen om zijn/haar verplichtingen na te komen.
38. Mijn leidinggevende houdt altijd zijn/haar woord.
Altijd Vaak Soms Zelden Nooit
1. Mijn leidinggevende geeft mij de informatie die ik nodig heb om mijn werk goed te doen.
2. Mijn leidinggevende moedigt me aan om mijn talenten te gebruiken.
3. Mijn leidinggevende helpt mij om mijzelf verder te ontwikkelen.
4. Mijn leidinggevende stimuleert zijn/haar medewerkers om met nieuwe ideeën te komen.
5. Mijn leidinggevende houdt zichzelf op de achtergrond en geeft credits aan anderen.
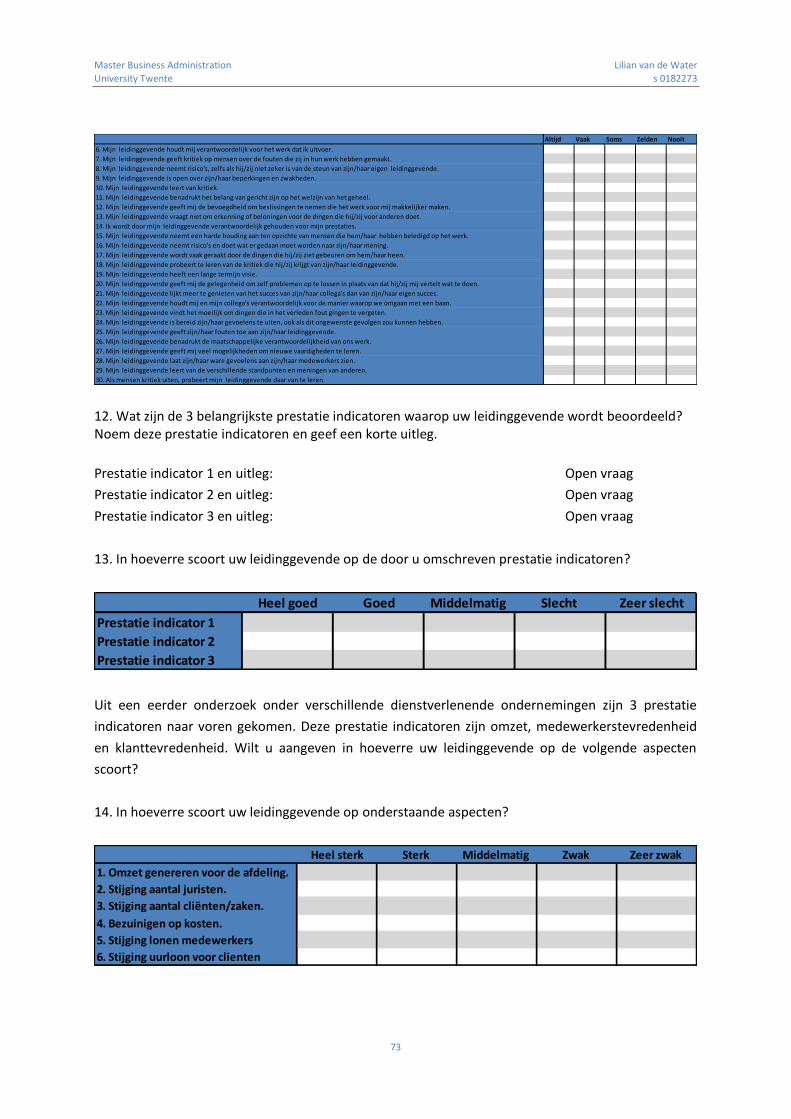
Master Business Administration Lilian van de Water
University Twente s 0182273
73
12. Wat zijn de 3 belangrijkste prestatie indicatoren waarop uw leidinggevende wordt beoordeeld? Noem deze prestatie indicatoren en geef een korte uitleg.
Prestatie indicator 1 en uitleg: Open vraag
Prestatie indicator 2 en uitleg: Open vraag
Prestatie indicator 3 en uitleg: Open vraag
13. In hoeverre scoort uw leidinggevende op de door u omschreven prestatie indicatoren?
Uit een eerder onderzoek onder verschillende dienstverlenende ondernemingen zijn 3 prestatie
indicatoren naar voren gekomen. Deze prestatie indicatoren zijn omzet, medewerkerstevredenheid
en klanttevredenheid. Wilt u aangeven in hoeverre uw leidinggevende op de volgende aspecten
scoort?
14. In hoeverre scoort uw leidinggevende op onderstaande aspecten?
Altijd Vaak Soms Zelden Nooit
6. Mijn leidinggevende houdt mij verantwoordelijk voor het werk dat ik uitvoer.
7. Mijn leidinggevende geeft kritiek op mensen over de fouten die zij in hun werk hebben gemaakt.
8. Mijn leidinggevende neemt risico's, zelfs als hij/zij niet zeker is van de steun van zijn/haar eigen leidinggevende.
9. Mijn leidinggevende is open over zijn/haar beperkingen en zwakheden.
10. Mijn leidinggevende leert van kritiek.
11. Mijn leidinggevende benadrukt het belang van gericht zijn op het welzijn van het geheel.
12. Mijn leidinggevende geeft mij de bevoegdheid om beslissingen te nemen die het werk voor mij makkelijker maken.
13. Mijn leidinggevende vraagt niet om erkenning of beloningen voor de dingen die hij/zij voor anderen doet.
14. Ik wordt door mijn leidinggevende verantwoordelijk gehouden voor mijn prestaties.
15. Mijn leidinggevende neemt een harde houding aan ten opzichte van mensen die hem/haar hebben beledigd op het werk.
16. Mijn leidinggevende neemt risico's en doet wat er gedaan moet worden naar zijn/haar mening.
17. Mijn leidinggevende wordt vaak geraakt door de dingen die hij/zij ziet gebeuren om hem/haar heen.
18. Mijn leidinggevende probeert te leren van de kritiek die hij/zij krijgt van zijn/haar leidinggevende.
19. Mijn leidinggevende heeft een lange termijn visie.
20. Mijn leidinggevende geeft mij de gelegenheid om zelf problemen op te lossen in plaats van dat hij/zij mij vertelt wat te doen.
21. Mijn leidinggevende lijkt meer te genieten van het succes van zijn/haar collega's dan van zijn/haar eigen succes.
22. Mijn leidinggevende houdt mij en mijn collega's verantwoordelijk voor de manier waarop we omgaan met een baan.
23. Mijn leidinggevende vindt het moeilijk om dingen die in het verleden fout gingen te vergeten.
24. Mijn leidinggevende is bereid zijn/haar gevoelens te uiten, ook als dit ongewenste gevolgen zou kunnen hebben.
25. Mijn leidinggevende geeft zijn/haar fouten toe aan zijn/haar leidinggevende.
26. Mijn leidinggevende benadrukt de maatschappelijke verantwoordelijkheid van ons werk.
27. Mijn leidinggevende geeft mij veel mogelijkheden om nieuwe vaardigheden te leren.
28. Mijn leidinggevende laat zijn/haar ware gevoelens aan zijn/haar medewerkers zien.
29. Mijn leidinggevende leert van de verschillende standpunten en meningen van anderen.
30. Als mensen kritiek uiten, probeert mijn leidinggevende daar van te leren.
Heel goed Goed Middelmatig Slecht Zeer slecht
Prestatie indicator 1
Prestatie indicator 2
Prestatie indicator 3
Heel sterk Sterk Middelmatig Zwak Zeer zwak
1. Omzet genereren voor de afdeling.
2. Stijging aantal juristen.
3. Stijging aantal cliënten/zaken.
4. Bezuinigen op kosten.
5. Stijging lonen medewerkers
6. Stijging uurloon voor clienten

Master Business Administration Lilian van de Water
University Twente s 0182273
74
15. In hoeverre bent u als medewerker tevreden over uw leidinggevende in het afgelopen jaar?
16. Tevredenheid van de cliënten.
17. In hoeverre zijn de cliënten tevreden over uw leidinggevende in het afgelopen jaar?
18. In hoeverre beïnvloed de leiderschapsstijl van uw leidinggevende de tevredenheid van de
cliënten in het afgelopen jaar?
U bent nu klaar met de enquête. Dank u wel voor uw deelname. U kunt het venster nu sluiten.
Zeer waar Waar Redelijk waar Soms waar Niet waar
1. Ik voel me redelijk tevreden met mijn huidige
2. De meeste dagen ben ik enthousiast over mijn
3. Elke dag op het werk lijkt alsof het nooit zal
4. Ik heb echt plezier in mijn werk.
5. Ik beschouw mijn werk als nogal onaangenaam.
Heel vaak Vaak Soms Zelden Nooit
In hoeverre heeft uw leidinggevende direct te maken met cliënten?
Zeer waar Waar Redelijk waar Soms waar Niet waar
1. De cliënten geven aan dat zij tevreden zijn over de geleverde diensten van mijn leidinggevende.
2. De cliënten weten wat zij van de diensten van mijn leidinggevende kunnen verwachten.
3. Mijn leidinggevende voldoet aan de klantverwachtingen die naar buiten kenbaar worden gemaakt.
4. Mijn leidinggevende doet er alles aan om aan de klantverwachtingen te voldoen.
5. Mijn leidinggevende krijgt weinig klachten van cliënten binnen.
Zeer waar Waar Redelijk waar Soms waar Niet waar1. De leiderschapsstijl van mijn leidinggevende heeft een positieve invloed op geleverde diensten aan cliënten.
2. De leiderschapsstijl van mijn leidinggevende heeft een positieve invloed op de verwachtingen van de cliënten.
3. De leiderschapsstijl van mijn leidinggevende heeft een positieve invloed op de klantverwachtingen die naar buiten kenbaar worden gemaakt.
4. De leiderschapsstijl van mijn leidinggevende heeft een positieve invloed op de manier waarop er aan de klantverwachtingen wordt voldaan.
5. De leiderschapsstijl van mijn leidinggevende heeft weinig invloed op de klachten die er over mijn leidinggevende binnenkomen.

Master Business Administration Lilian van de Water
University Twente s 0182273
75
Appendix 3: Interview details
1. First organization:
Sector: Legal services
Industry: Insurance
Number of people: 60 or more
Number of lawyers: 40 or more
Number of leaders: 14
Main activities organization: Giving legal assistance to insured people
Survey filled in by: 7 lawyers
Numbers in research: Survey numbers 1, 2, 8, 11, 15, 17, and 35
2. Second organization:
Sector: Legal services
Industry: Advocacy
Number of people: 60 or more
Number of lawyers: 40 or more
Number of leaders: 16
Main activities organization: Giving legal services
Survey filled in by: 7 lawyers
Numbers in research: Survey numbers 3, 12, 18, 19, 25, 27, and 37
3. Third organization:
Sector: Legal services
Industry: Advocacy
Number of people: 30-45
Number of lawyers: 10-20
Number of leaders: 5
Main activities organization: Giving legal services
Survey filled in by: 3 lawyers
Numbers in research: Survey numbers 4, 10, and 38
4. Fourth organization:
Sector: Legal services
Industry: Insurance
Number of people: 45-60
Number of lawyers: 20-30
Number of leaders: 6
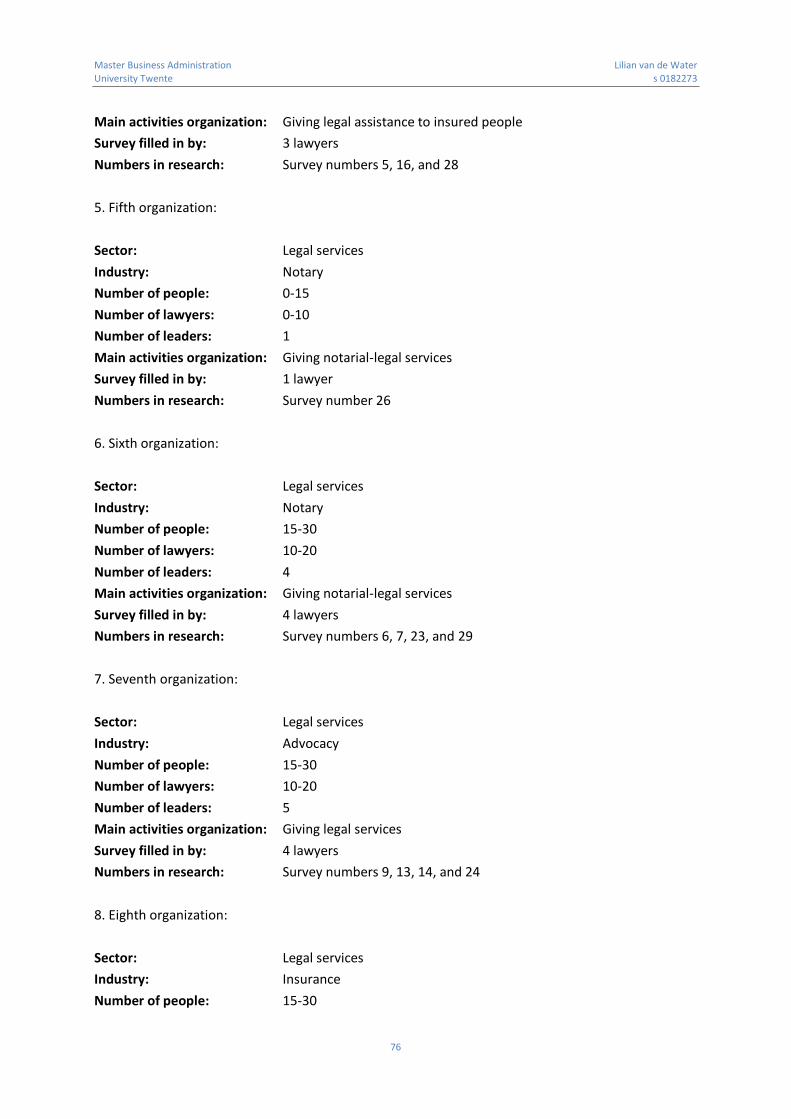
Master Business Administration Lilian van de Water
University Twente s 0182273
76
Main activities organization: Giving legal assistance to insured people
Survey filled in by: 3 lawyers
Numbers in research: Survey numbers 5, 16, and 28
5. Fifth organization:
Sector: Legal services
Industry: Notary
Number of people: 0-15
Number of lawyers: 0-10
Number of leaders: 1
Main activities organization: Giving notarial-legal services
Survey filled in by: 1 lawyer
Numbers in research: Survey number 26
6. Sixth organization:
Sector: Legal services
Industry: Notary
Number of people: 15-30
Number of lawyers: 10-20
Number of leaders: 4
Main activities organization: Giving notarial-legal services
Survey filled in by: 4 lawyers
Numbers in research: Survey numbers 6, 7, 23, and 29
7. Seventh organization:
Sector: Legal services
Industry: Advocacy
Number of people: 15-30
Number of lawyers: 10-20
Number of leaders: 5
Main activities organization: Giving legal services
Survey filled in by: 4 lawyers
Numbers in research: Survey numbers 9, 13, 14, and 24
8. Eighth organization:
Sector: Legal services
Industry: Insurance
Number of people: 15-30

Master Business Administration Lilian van de Water
University Twente s 0182273
77
Number of lawyers: 10-20
Number of leaders: 6
Main activities organization: Giving legal assistance to insured people
Survey filled in by: 4 lawyers
Numbers in research: Survey numbers 20, 21, 22, and 30
9. Ninth organization:
Sector: Legal services
Industry: Notary
Number of people: 15-30
Number of lawyers: 10-20
Number of leaders: 3
Main activities organization: Giving notarial-legal services
Survey filled in by: 3 lawyer
Numbers in research: Survey number 33, 34, and 36
10. Tenth organization:
Sector: Legal services
Industry: Notary
Number of people: 0-15
Number of lawyers: 0-10
Number of leaders: 2
Main activities organization: Giving notarial-legal services
Survey filled in by: 2 lawyer
Numbers in research: Survey number 31, and 32

Master Business Administration Lilian van de Water
University Twente s 0182273
78
Appendix 4: The Authentic Leadership Inventory (ALI)
Self-awareness
4. My leader describes accurately the way that others view his/her abilities.
7. My leader shows that he/she understands his/her strengths and weaknesses.
11. My leader is clearly aware of the impact he/she has on others.
12. My leader expresses his/her ideas and thoughts clearly to others.
Relational transparency
1. My leader clearly states what he/she means.
8. My leader openly shares information with others.
Balanced processing
3. My leader asks for ideas that challenge his/her core beliefs.
6. My leader carefully listens to alternative perspectives before reaching a conclusion.
10. My leader objectively analyzes relevant data before making a decision.
14. My leader encourages others to voice opposing points of view.
Internalized moral perspective
2. My leader shows consistency between his/her beliefs and actions.
5. My leader uses his/her core beliefs to make decisions.
9. My leader resists pressures on him/her to do things contrary to his/her beliefs.
13. My leader is guided in his/her actions by internal moral standards. (Neider & Schriesheim, 2011,
p. 1149)

Master Business Administration Lilian van de Water
University Twente s 0182273
79
Appendix 5: The Ethical Leadership at Work (ELW) questionnaire
People orientation
1. Is interested in how I feel and how I am doing.
2. Takes time for personal contact.
3. Pays attention to my personal needs.
4. Takes time to talk about work-related emotions.
5. Is genuinely concerned about my personal development.
6. Sympathizes with me when I have problems.
7. Cares about his/her followers.
Fairness
8. Holds me accountable for problems over which I have no control.
9. Holds me responsible for work that I gave no control over.
10. Holds me responsible for things that are not my fault.
11. Pursues his/her own success at the expense of others.
12. Is focused mainly on reaching his/her own goals.
13. Manipulates subordinates.
Power sharing
14. Allows subordinates to influence critical decisions.
15. Does not allow others to participate in decision making.
16. Seeks advice from subordinates concerning organizational strategy.
17. Will reconsider decisions on the basis of recommendations by those who report to him/her.
18. Delegates challenging responsibilities to subordinates.
19. Permits me to play a key role in setting my own performance goals.
Concern for sustainability
20. Would like to work in an environmentally friendly manner.
21. Shows concern for sustainability issues.
22. Stimulates recycling of items and materials in our department.
Ethical guidance
23. Clearly explains integrity related codes of conduct.
24. Explains what is expected from employees in terms of behaving with integrity.
25. Clarifies integrity guidelines.
26. Ensures that employees follow codes of integrity.
27. Clarifies the likely consequences of possible unethical behavior by myself and my colleagues.
28. Stimulates the discussion of integrity issues among employees.
29. Compliments employees who behave according to the integrity guidelines.
Role clarification
30. Indicates what the performance expectations of each group member are.
31. Explains what is expected of each group member.
32. Explains what is expected of me and my colleagues.
33. Clarifies priorities.
34. Clarifies who is responsible for what.

Master Business Administration Lilian van de Water
University Twente s 0182273
80
Integrity
35. Keeps his/her promises.
36. Can be trusted to do the things he/she says.
37. Can be relied on to honour his/her commitments.
38. Always keeps his/her words. (Karlshoven et al. 2011b, p. 58)

Master Business Administration Lilian van de Water
University Twente s 0182273
81
Appendix 6: The Servant Leadership Survey (SLS)
Empowerment
1. My manager gives me the information I need to do my work well.
2. My manager encourages me to use my talents.
3. My manager helps me to further develop myself.
4. My manager encourages his/her staff to come up with new ideas.
12. My manager gives me the authority to take decisions which make work easier for me.
20. My manager enables me to solve problems myself instead of just telling me what to do.
27. My manager offers me abundant opportunities to learn new skills.
Standing back
5. My manager keeps himself/herself in the background and gives credits to others.
13. My manager is not chasing recognition or rewards for the things he/she does for others.
21. My manager appears to enjoy his/her colleagues’ success more than his/her own.
Accountability
6. My manager holds me responsible for the work I carry out.
14. I am held accountable for my performance by my manager.
22. My manager holds me and my colleagues responsible for the way we handle a job.
Forgiveness
7. My manager keeps criticizing people for the mistakes they have made in their work.
15. My manager maintains a hard attitude towards people who have offended him/her at work
23. My manager finds it difficult to forget things that went wrong in the past
Courage
8. My manager takes risks even when he/she is not certain of the support from his/her own manager.
16. My manager takes risks and does what needs to be done in his/her view.
Authenticity
9. My manager is open about his/her limitations and weaknesses.
17. My manager is often touched by the things he/she sees happening around him/her.
24. My manager is prepared to express his/her feelings even if this might have undesirable
consequences.
28. My manager shows his/her true feelings to his/her staff.
Humility
10. My manager learns from criticism.
18. My manager tries to learn from the criticism he/she gets from his/her superior.
25. My manager admits his/her mistakes to his/her superior.
29. My manager learns from the different views and opinions of others.
30. If people express criticism, my manager tries to learn from it.
Stewardship
11. My manager emphasizes the importance of focusing on the good of the whole.
19. My manager has a long-term vision.
26. My manager emphasizes the societal responsibility of our work. (Van Dierendonck & Nuijten,
2011, p. 256)
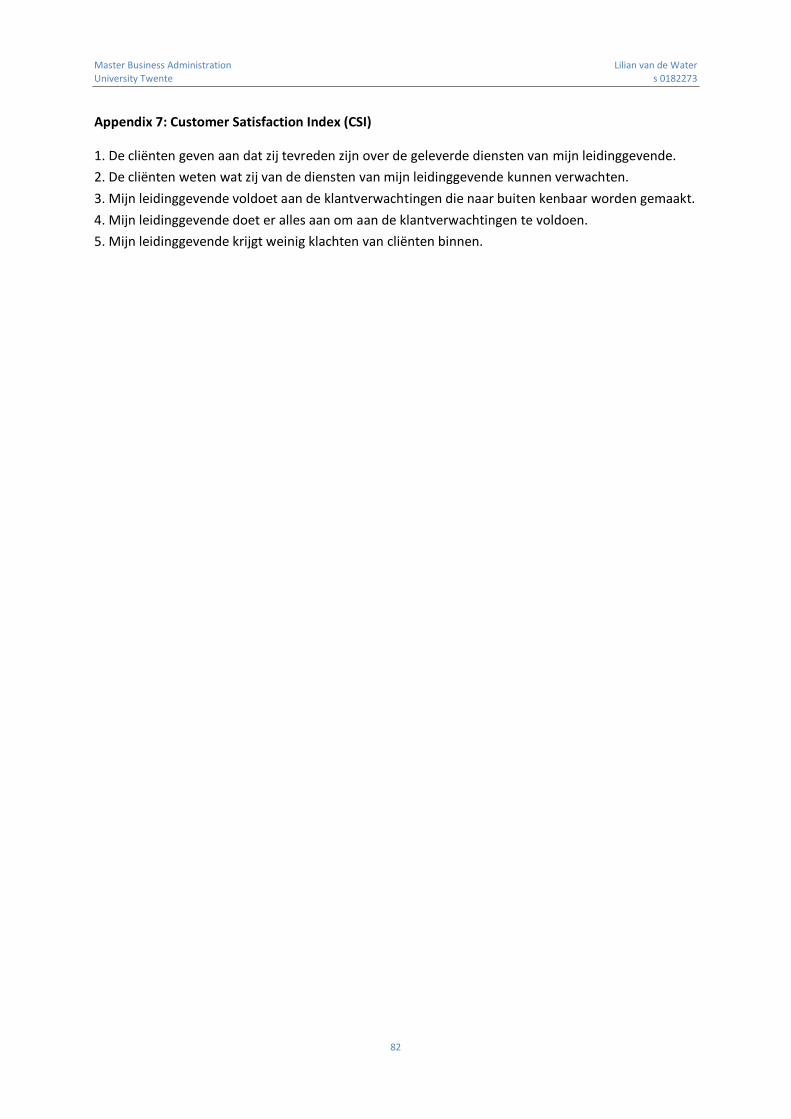
Master Business Administration Lilian van de Water
University Twente s 0182273
82
Appendix 7: Customer Satisfaction Index (CSI)
1. De cliënten geven aan dat zij tevreden zijn over de geleverde diensten van mijn leidinggevende.
2. De cliënten weten wat zij van de diensten van mijn leidinggevende kunnen verwachten.
3. Mijn leidinggevende voldoet aan de klantverwachtingen die naar buiten kenbaar worden gemaakt.
4. Mijn leidinggevende doet er alles aan om aan de klantverwachtingen te voldoen.
5. Mijn leidinggevende krijgt weinig klachten van cliënten binnen.

Master Business Administration Lilian van de Water
University Twente s 0182273
83
Appendix 8: Job Satisfaction Index (JSI) 5-item version
1. I feel fairly satisfied with my present job.
2. Most days I am enthusiastic about my work.
3. Each day at work seems like it will never end.
4. I find real enjoyment in my work.
5. I consider my job to be rather unpleasant. (Thompson & Phua, 2012, p. 286)

Master Business Administration Lilian van de Water
University Twente s 0182273
84
Appendix 9: Revenue Index (RI)
1. Omzet genereren voor de afdeling.
2. Stijging aantal juristen.
3. Stijging aantal cliënten/zaken.
4. Bezuinigen op kosten.
5. Stijging lonen medewerkers.
6. Stijging uurloon voor cliënten.

Master Business Administration Lilian van de Water
University Twente s 0182273
85
Appendix 10: Research results
10.1 Authentic leadership (question 9 in Appendix 2)
10.2 Ethical leadership (question 10 in Appendix 2)
Authentic leadership 1 2 3 4 5 6 7 8 9 10 11 12 13 14 15 16 17 18 19 20 21 22 23 24 25 26 27 28 29 30 31 32 33 34 35 36 37 38
Self-awareness
Question 4 4 3 5 5 3 4 4 5 4 4 5 3 4 4 3 4 2 3 2 3 2 3 3 3 3 2 3 3 3 3 4 4 5 5 3 3 4 3
Question 7 2 5 4 5 4 2 2 4 5 3 3 3 3 2 5 2 2 4 4 3 3 2 2 2 4 2 2 4 3 3 3 5 4 2 4 4 3 2
Question 11 3 2 4 2 3 3 3 3 4 4 4 3 2 3 4 4 3 2 2 2 4 4 3 3 4 3 4 3 4 3 2 3 4 3 4 5 3 4
Question 12 1 3 3 1 2 2 2 3 4 2 2 3 3 3 3 2 3 2 4 1 2 3 3 3 5 3 2 2 2 3 3 3 4 3 3 3 3 3
Relational transparency
Question 1 2 3 2 2 2 2 2 2 3 3 2 4 3 3 4 3 2 2 2 2 1 2 1 1 1 2 2 2 3 2 3 2 3 2 1 2 1 2
Question 8 2 2 3 1 2 2 2 3 3 3 3 2 3 3 2 3 2 2 2 2 3 2 1 1 3 2 2 2 2 2 1 2 3 2 3 2 2 2
Balanced processing
Question 3 3 3 5 3 4 4 4 4 3 4 3 2 2 4 3 4 3 4 5 5 4 4 4 3 2 2 5 4 5 4 4 4 3 2 3 3 2 4
Question 6 3 4 2 2 3 2 3 4 4 4 3 4 3 2 2 2 3 4 3 3 3 3 5 4 4 3 2 3 2 3 3 3 3 3 2 2 3 2
Question 10 3 3 2 3 2 2 2 2 2 3 3 3 4 3 2 2 1 2 1 2 1 2 3 3 3 3 2 2 3 3 3 3 1 2 3 3 3 3
Question 14 2 5 2 4 4 4 3 3 2 3 2 3 3 4 3 3 4 3 4 2 2 2 2 3 4 3 3 4 4 3 4 3 2 2 3 3 2 3
Internalized moral perspective
Question 2 2 4 2 2 3 4 4 4 3 2 2 3 3 3 2 2 3 3 2 3 4 4 3 2 2 2 2 2 3 4 4 3 3 3 4 2 1 2
Question 5 2 2 3 2 2 3 2 2 3 3 3 2 2 4 4 3 4 3 4 2 2 3 3 3 2 4 3 4 3 4 3 4 3 2 2 2 2 2
Question 9 3 3 3 3 3 3 3 2 4 3 3 3 2 2 2 2 2 3 3 3 3 3 4 4 3 4 3 4 3 4 2 3 2 2 3 3 2 2
Question 13 2 2 3 2 2 2 3 3 3 3 3 2 2 2 1 2 3 2 2 3 3 3 3 3 2 3 2 2 2 3 2 3 3 2 2 2 2 1
Note: 1= Always, 2 = Often, 3 = Sometimes, 4 = Seldom, 5 = Never
Ethical leadership 1 2 3 4 5 6 7 8 9 10 11 12 13 14 15 16 17 18 19 20 21 22 23 24 25 26 27 28 29 30 31 32 33 34 35 36 37 38
People orientation
Question 1 3 2 4 2 2 3 3 2 2 2 3 3 2 3 3 3 2 2 3 2 3 2 4 2 2 3 3 4 1 2 3 2 3 2 2 3 3 3
Question 2 3 3 4 2 2 3 3 4 3 3 3 2 3 2 3 3 3 3 2 3 2 3 3 3 4 3 4 2 3 2 2 2 3 3 4 3 4 3
Question 3 3 3 4 2 2 2 3 4 2 3 3 3 3 3 3 2 2 2 3 2 3 2 3 2 3 4 3 3 1 3 2 3 3 2 2 3 3 2
Question 4 2 2 3 2 3 3 4 3 3 3 4 3 4 3 3 2 3 3 2 4 3 3 3 3 3 2 3 4 2 2 3 3 2 3 2 2 2 3
Question 5 3 2 4 4 5 4 4 3 4 3 4 3 3 3 4 3 3 2 2 4 5 4 5 4 3 2 2 2 3 4 5 4 5 5 4 5 3 2
Question 6 4 3 3 2 3 3 3 2 2 2 3 3 3 3 2 2 3 2 2 2 2 4 2 2 2 3 3 3 3 4 3 3 2 3 4 2 3 2
Question 7 3 3 3 4 3 2 3 3 2 3 2 3 4 4 4 2 3 2 3 2 3 2 2 2 2 3 4 5 2 2 3 3 4 4 3 2 3 2
Fairness
Question 8 4 4 4 4 2 3 3 4 2 2 3 3 3 3 3 3 2 3 4 2 2 2 3 3 3 3 4 3 3 3 3 2 2 2 3 3 3 3
Question 9 4 4 4 4 3 4 4 3 3 3 3 2 4 2 4 3 2 4 4 3 3 2 3 3 4 3 3 4 4 2 2 3 3 2 4 3 3 3
Question 10 5 4 5 3 3 2 3 2 4 3 3 3 2 3 3 3 2 3 4 3 3 3 3 3 4 3 2 3 2 2 2 2 3 3 3 3 3 4
Question 11 4 1 5 2 1 2 2 2 2 3 3 4 4 3 2 2 2 4 3 3 2 3 2 3 2 4 3 3 2 2 2 3 3 2 3 3 3 4
Question 12 2 3 3 3 2 3 3 2 4 3 3 3 3 4 3 3 3 3 4 3 3 3 3 3 4 2 2 2 2 2 3 2 2 3 3 3 4 4
Question 13 4 4 3 4 2 3 2 3 3 3 3 2 2 3 3 3 3 3 4 3 3 3 3 3 3 3 3 3 2 2 2 3 2 3 4 4 4 3
Power sharing
Question 14 4 4 4 3 3 4 3 3 4 3 3 3 4 3 4 4 5 5 3 3 4 3 3 4 4 4 3 4 5 3 3 2 2 2 3 3 3 3
Question 15 4 3 4 4 2 3 4 2 2 4 4 3 3 3 3 3 4 4 3 2 4 2 2 2 4 3 4 3 2 2 3 3 3 3 2 4 4 2
Question 16 3 5 3 4 3 2 4 3 2 2 2 2 2 3 2 2 3 4 4 3 4 2 3 3 2 2 3 3 2 3 3 2 2 5 3 4 2 3
Question 17 3 4 3 3 4 5 4 2 2 4 4 2 2 4 2 4 4 4 3 4 4 2 3 2 4 2 2 3 2 3 3 3 4 3 3 2 2 4
Question 18 3 3 3 4 4 4 3 4 4 3 2 4 2 4 3 3 3 4 4 3 2 2 4 3 3 4 3 2 3 2 3 5 4 3 3 3 4 4
Question 19 3 3 3 5 3 3 2 3 4 2 4 5 3 3 3 2 3 4 4 3 2 3 3 4 3 3 2 3 2 3 4 4 4 5 3 4 2 2
Concern for sustainability
Question 20 3 3 5 4 2 3 2 3 3 4 3 3 3 4 3 3 3 2 3 3 3 4 3 3 3 3 3 2 3 4 3 3 4 3 3 3 3 3
Question 21 3 3 5 4 4 5 5 5 4 3 3 3 3 3 2 3 2 3 3 3 4 3 3 2 4 4 4 3 2 2 4 5 4 4 4 4 4 4
Question 22 4 3 5 3 3 2 3 2 4 3 3 3 3 3 3 3 4 3 3 3 4 3 2 3 3 3 3 3 3 2 3 2 2 2 2 3 3 3
Ethical guidance
Question 23 2 2 3 3 2 3 2 2 2 2 3 3 4 4 4 4 4 3 3 3 3 4 3 3 4 3 2 4 3 4 2 4 4 4 4 2 2 3
Question 24 2 2 3 3 3 4 3 2 3 2 4 4 3 2 3 3 3 3 4 4 4 3 3 3 4 2 2 2 2 2 4 4 4 4 3 2 3 2
Question 25 2 2 5 3 2 3 4 2 4 3 4 2 2 2 4 3 2 2 3 4 4 4 3 3 3 4 3 2 3 4 4 4 4 4 2 2 3 2
Question 26 2 2 5 4 3 4 2 3 4 3 3 3 3 3 2 2 2 4 3 5 5 2 3 3 4 2 4 2 2 3 3 3 4 3 2 4 3 2
Question 27 2 3 5 4 2 4 2 4 4 3 3 3 3 2 3 2 3 2 3 5 5 2 3 4 3 2 4 4 2 1 3 4 4 3 2 3 2 3
Question 28 3 5 3 4 3 4 2 4 3 3 3 3 3 4 2 2 3 2 3 3 5 2 4 4 2 3 4 3 2 2 2 3 3 2 2 3 3 3
Question 29 3 5 3 4 2 3 3 4 2 3 3 3 4 3 3 2 3 2 3 4 5 3 4 3 2 4 4 2 2 2 4 3 3 3 2 3 3 3

Master Business Administration Lilian van de Water
University Twente s 0182273
86
10.3 Servant leadership (question 11 in Appendix 2)
Ethical leadership 1 2 3 4 5 6 7 8 9 10 11 12 13 14 15 16 17 18 19 20 21 22 23 24 25 26 27 28 29 30 31 32 33 34 35 36 37 38
Role clarification
Question 30 2 3 2 2 3 2 3 2 3 2 3 2 2 2 2 1 2 2 2 3 3 2 1 2 2 3 3 3 3 3 2 3 2 2 3 3 3 1
Question 31 3 3 3 3 3 3 2 3 3 3 4 5 4 2 3 2 4 4 4 4 3 2 2 3 3 3 3 3 3 3 3 3 3 3 3 3 3 3
Question 32 2 3 3 3 3 2 3 3 3 4 3 4 3 3 4 3 3 3 2 2 2 2 3 2 2 3 2 4 4 3 3 2 3 3 4 2 4 3
Question 33 3 2 3 3 3 3 2 3 3 5 4 4 3 4 3 3 3 3 3 3 2 2 2 2 2 3 2 3 4 3 3 3 3 3 4 2 3 4
Question 34 3 2 3 2 3 2 2 3 2 5 5 4 3 4 3 3 3 3 3 2 2 3 1 2 2 3 3 3 3 3 3 3 3 4 4 3 3 3
Integrity
Question 35 3 4 3 2 2 2 2 3 3 3 3 2 3 3 3 3 2 2 2 3 3 2 3 2 3 2 2 2 2 2 3 2 3 2 3 2 2 2
Question 36 3 4 2 3 2 3 4 2 3 3 3 2 3 2 3 3 2 3 2 2 3 2 2 3 3 2 3 2 3 2 3 2 3 3 3 2 2 3
Question 37 3 4 2 3 3 2 4 3 3 3 3 3 4 3 3 3 3 3 2 3 3 2 3 3 3 3 3 3 3 3 3 3 4 3 3 3 3 3
Question 38 3 4 2 3 3 3 4 3 3 3 3 2 4 2 2 3 3 3 2 3 3 3 3 3 3 3 3 3 3 3 3 4 4 3 3 3 3 3
Note: 1= Always, 2 = Often, 3 = Sometimes, 4 = Seldom, 5 = Never
Servant leadership 1 2 3 4 5 6 7 8 9 10 11 12 13 14 15 16 17 18 19 20 21 22 23 24 25 26 27 28 29 30 31 32 33 34 35 36 37 38
Empowerment
Question 1 2 3 2 1 2 3 2 4 3 3 3 3 2 3 2 3 2 2 1 2 3 3 2 1 3 2 3 2 2 2 1 3 3 2 3 2 3 2
Question 2 2 2 3 2 2 2 3 4 3 3 3 2 2 2 3 2 3 3 2 2 2 2 3 3 4 3 4 2 1 2 2 3 3 3 2 3 4 3
Question 3 2 2 3 2 2 2 3 2 2 2 2 3 2 3 3 2 2 2 2 2 3 3 2 2 3 3 3 4 1 2 2 2 3 2 2 2 3 2
Question 4 3 3 2 2 3 4 3 4 2 3 4 3 4 3 4 3 2 2 2 4 2 3 2 2 2 2 3 4 2 2 3 3 2 3 2 2 2 3
Question 12 2 3 3 3 2 2 4 4 2 3 2 2 2 3 3 2 2 4 2 4 3 3 2 3 2 3 3 3 3 3 3 3 3 3 2 3 4 2
Question 20 3 3 3 3 3 3 3 2 3 3 4 3 3 3 2 3 3 2 3 2 2 2 4 2 3 2 2 3 3 2 4 2 2 2 3 3 3 3
Question 27 2 3 3 3 2 3 3 2 2 3 4 3 3 3 3 3 4 3 2 2 3 3 3 2 2 2 3 3 2 2 3 2 3 2 2 3 2 3
Standing back
Question 5 4 5 3 4 5 5 5 5 4 4 4 3 3 3 4 5 4 2 3 4 5 2 5 4 4 2 3 3 3 4 4 4 3 4 3 3 3 2
Question 13 4 4 3 4 4 4 4 3 4 4 4 4 4 4 3 5 5 3 4 5 4 3 4 5 3 4 4 4 4 3 3 2 4 4 3 4 3 3
Question 21 4 5 4 4 5 4 4 3 4 5 4 3 3 4 4 4 4 2 3 4 5 3 4 4 3 4 4 3 3 4 4 3 4 4 3 3 3 3
Accountability
Question 6 2 3 2 2 2 2 2 2 2 2 3 2 2 3 2 2 3 2 2 2 2 2 2 2 2 3 4 3 3 3 3 3 2 2 3 2 3 2
Question 14 3 3 2 2 2 2 3 2 3 2 3 2 2 2 2 1 2 2 2 3 3 2 1 2 2 3 3 3 3 3 2 3 2 2 3 3 3 1
Question 22 3 2 2 3 2 2 3 3 2 2 2 2 1 2 2 2 2 2 2 3 3 1 2 2 3 2 4 2 3 2 2 2 1 1 2 3 2 2
Forgiveness
Question 7 5 3 3 4 3 2 4 3 2 4 2 3 4 4 4 5 3 2 3 2 3 3 2 2 2 3 4 5 2 2 3 4 5 4 3 2 3 2
Question 15 4 1 4 3 4 1 2 3 3 3 3 4 4 5 1 2 3 3 3 3 4 5 3 2 4 3 3 3 3 4 5 4 4 4 3 4 3 2
Question 23 2 2 3 2 3 3 3 3 3 2 3 2 3 2 2 2 2 2 2 2 3 3 3 3 4 3 3 4 3 2 4 3 4 4 2 2 3 2
Courage
Question 8 4 2 3 3 4 2 2 2 3 3 3 3 3 4 2 2 3 4 3 2 2 2 2 3 2 2 2 4 3 2 4 3 2 3 4 3 2 1
Question 16 2 2 3 2 4 2 2 2 4 4 2 2 2 4 3 3 4 4 3 2 2 2 3 3 2 2 3 4 2 3 4 3 4 4 3 2 2 2
Authenticity
Question 9 4 5 4 5 3 2 2 4 4 3 3 3 3 2 4 2 2 4 4 3 3 3 2 2 3 2 2 4 2 3 3 5 3 3 4 4 3 3
Question 17 4 4 4 4 3 4 3 3 4 4 3 4 5 4 3 4 5 3 5 4 4 4 4 4 3 3 3 3 3 3 4 3 4 3 3 4 4 4
Question 24 3 3 3 3 3 3 3 3 4 3 4 3 3 3 2 3 3 3 4 3 3 3 2 3 3 3 2 2 3 2 3 3 3 3 3 3 2 3
Question 28 3 5 3 4 3 3 4 4 3 3 3 3 4 4 3 4 3 3 3 4 4 3 3 3 3 2 3 3 4 3 4 3 3 3 3 3 2 3
Humility
Question 10 4 5 3 4 4 5 3 5 3 5 2 4 5 5 4 3 4 5 4 3 4 5 2 3 3 2 4 5 4 3 4 5 4 4 3 3 3 2
Question 18 3 5 3 4 3 5 4 5 3 4 3 3 4 4 3 3 5 4 4 3 5 4 2 2 3 2 4 4 3 3 5 4 4 4 2 4 3 3
Question 25 4 5 3 4 3 5 3 5 3 5 2 4 5 5 4 4 3 3 4 3 4 4 2 4 2 3 2 3 4 3 3 4 3 4 2 3 3 2
Question 29 3 5 3 3 4 5 4 4 4 5 2 3 4 5 3 5 3 4 4 3 4 5 3 4 3 2 2 3 4 4 3 4 3 4 2 3 3 3
Question 30 3 5 3 4 3 5 3 4 3 5 2 4 5 5 4 3 4 4 4 3 4 5 2 2 3 3 3 5 5 3 4 3 5 5 3 3 4 3
Stewardship
Question 11 3 4 3 3 4 3 4 2 3 3 3 3 3 3 4 4 4 3 3 3 4 4 3 4 2 3 4 2 3 4 4 4 4 4 3 3 3 3
Question 19 3 3 3 4 3 4 2 3 3 4 4 4 4 3 3 3 3 2 2 3 3 4 2 3 3 3 3 3 3 4 4 3 2 2 3 2 2 2
Question 26 2 3 4 4 2 3 2 3 3 3 3 4 3 4 4 3 3 2 2 3 3 4 3 3 4 3 3 2 4 4 3 3 4 3 3 2 2 3
Note: 1= Always, 2 = Often, 3 = Sometimes, 4 = Seldom, 5 = Never

Master Business Administration Lilian van de Water
University Twente s 0182273
87
10.4 Performance indicators and scores (question 12 & 13 in Appendix 2)
10.5 Revenue (question 14 in Appendix 2)
Vraag 1 Vraag 2 Vraag 3 Vraag 4 Vraag 5 Vraag 6
1 2 2 3 2 3 3
2 3 3 3 3 2 3
3 2 3 3 2 3 3 4 2 3 2 3 3 3
5 3 3 3 3 3 3 6 2 3 3 3 3 3
7 2 2 3 2 3 2 8 3 3 3 3 3 3
9 2 3 3 3 3 3
10 2 3 3 3 3 3
Prestatie indicator 1 Score Prestatie indicator 2 Score Prestatie indicator 3 Score
1 Persoonlijke capaciteiten 3 Het geven van service 4 Behalen van organisatie doelstellingen 4
2 Afhandeling klachten van clienten 3 Prestaties van het team 2 Feedback van het team 3
3 Acquisitie 4 Begeleiding van het team 3 Marketing/ondernemers positie 4
4 Acquisitie 4 Kennis van zaken 3 Correcte afhandeling zaken 4
5 Loyaliteit 3 Kennis ontwikkeling 3
6 Acquisitie 3 Kwaliteit van het werk 3 Effectiviteit van werken 2
7 Afhandeling aantal dossiers 3 Prestaties van het team 3 Kennis ontwikkeling 2
8 Afhandeling aantal dossiers 4 Prestaties van het team 3 Persoonlijke ontwikkeling 4
9 Kennis van zaken 3 Acquisitie 3 Omzet 3
10 Maken van fouten in het werk 3 Tevredenheid van het team 4
11 Correcte afhandeling zaken 3 Tevredenheid van het team 3 Probleem oplossend vermogen 4
12 Omzet 3 Marketing/ondernemers positie 3 Ontwikkelen beleid 3
13 Prestaties van het team 3 Kennis ontwikkeling 3 Begeleiding van het team 3
14 Acquisitie 4 Kennis van zaken 3 Behalen aantal norm uren 2
15 Acquisitie 3 Tevredenheid van de clienten 2 Tevredenheid van het team 3
16 Acquisitie 3 Kwaliteit van het werk 2 Omzet 3
17 Omzet 2 Prestaties van het team 2 Tevredenheid van het team 3
18 Kwaliteit van het werk 3 Afhandeling aantal dossiers 2 Prestaties van het team 3
19 Prestaties van het team 3 Acquisitie 3 Samenwerken met collega`s 2
20 Tevredenheid van de clienten 4 Tevredenheid van het team 3 Kennis ontwikkeling 2
21 Begeleiding van het team 4 Managementcapaciteiten 4 Effectiviteit van werken 2
22 Omzet 3 Acquisitie 2 Prestaties van het team 2
23 Omzet 2 Behalen aantal norm uren 3 Kwaliteit van het werk 3
24 Omzet 3 Kwaliteit van het werk 3 Managementcapaciteiten 3
25 Tevredenheid van het team 4 Afhandeling aantal dossiers 2 Persoonlijke ontwikkeling 3
26 Prestaties van het team 3 Tevredenheid van het team 4 Acquisitie 3
27 Vergaderkwaliteiten 4 Afhandeling aantal dossiers 3 Tevredenheid van de clienten 3
28 Liquiditeit van de organisatie 3 Kennis ontwikkeling 2 Tevredenheid van de clienten 3
29 Behalen aantal norm uren 4 Begeleiding van het team 3
30 Acquisitie 3 Tevredenheid van de clienten 2 Kwaliteit van het werk 2
31 Prestaties van het team 3 Acquisitie 3 Probleem oplossend vermogen 3
32 Acquisitie 3 Kennis van zaken 1 Begeleiding van het team 3
33 Prestaties van het team 2
34 Prestaties van het team 3 Afhandeling klachten van clienten 3 Tevredenheid van de clienten 4
35 Behalen aantal norm uren 2 Tevredenheid van de clienten 4 Begeleiding van het team 3
36 Communicatie capaciteiten 3 Het geven van service 3 Houding 2
37 Kennis ontwikkeling 1 Prestaties van het team 4 Kennis van zaken 2
38 Tevredenheid van de clienten 2

Master Business Administration Lilian van de Water
University Twente s 0182273
88
10.6 Job satisfaction (question 15 in Appendix 2)
Vraag 1 Vraag 2 Vraag 3 Vraag 4 Vraag 5 Vraag 6
11 3 3 3 3 3 3
12 2 3 2 3 3 3
13 3 3 3 3 3 3
14 2 2 3 3 2 3
15 3 3 3 3 3 3
16 2 2 2 2 2 2
17 3 3 3 3 3 3
18 3 3 3 3 3 3
19 3 3 2 3 3 3
20 2 3 3 3 3 3
21 2 3 2 3 3 3
22 2 3 2 3 3 3
23 3 3 3 3 3 3
24 3 3 3 3 3 3
25 3 3 3 3 3 3
26 2 2 2 2 2 2
27 3 2 3 3 3 3
28 2 2 3 3 3 3
29 4 4 4 3 4 3
30 4 4 3 4 5 4
31 4 3 4 4 4 4
32 3 3 4 4 4 3
33 3 4 3 4 4 3
34 4 3 3 4 4 3
35 3 4 3 4 3 4
36 3 3 4 3 3 3
37 4 4 3 3 4 4
38 3 3 3 3 3 3
Vraag 1 Vraag 2 Vraag 3 Vraag 4 Vraag 5
1 2 2 2 2 2
2 4 4 2 3 3
3 3 3 2 3 2
4 2 2 2 2 2
5 2 2 3 3 3
6 2 2 2 2 2
7 2 2 1 2 2
8 3 3 3 2 3
9 2 2 2 2 2
10 2 2 3 3 3

Master Business Administration Lilian van de Water
University Twente s 0182273
89
10.7 Customer satisfaction (question 16, 17 & 18 in Appendix 2)
11 3 3 2 2 3
12 1 1 3 2 2
13 3 3 3 3 3
14 3 3 2 2 3
15 3 3 3 3 2
16 3 2 2 1 1
17 3 3 3 3 3
18 4 4 4 4 3
19 3 2 3 4 3
20 3 3 2 2 2
21 3 3 3 3 3
22 2 2 2 2 1
23 2 2 2 1 2
24 2 2 3 3 3
25 3 3 2 3 2
26 2 1 2 1 2
27 3 2 3 4 2
28 2 2 3 3 3
29 3 4 4 3 2
30 3 4 3 4 2
31 2 3 3 4 3
32 4 4 3 4 3
33 3 3 2 4 3
34 3 4 3 2 3
35 3 2 2 3 2
36 3 3 2 2 3
37 4 3 2 4 2
38 3 3 2 3 2
Vraag 3 en 5 zijn de waarden omgekeerd
Q 16 Q 17 Q 18
Vraag 1 Vraag 1 Vraag 2 Vraag 3 Vraag 4 Vraag 5 Vraag 1 Vraag 2 Vraag 3 Vraag 4 Vraag 5
1 3 2 3 3 1 2 3 3 3 3 3
2 5 3 3 3 3 3 3 3 3 3 3
3 2 2 2 2 2 2 3 3 3 3 3
4 2 2 1 3 3 4 3 2 3 4 4
5 2 3 3 2 3 3 3 3 3 2 3
6 2 3 2 2 3 2 3 2 3 3 2
7 2 2 2 3 3 2 2 2 2 2 3
8 2 2 3 3 2 3 3 3 3 3 3
9 2 3 2 3 2 2 3 3 3 2 3
10 2 3 3 2 3 3 2 2 3 3 3
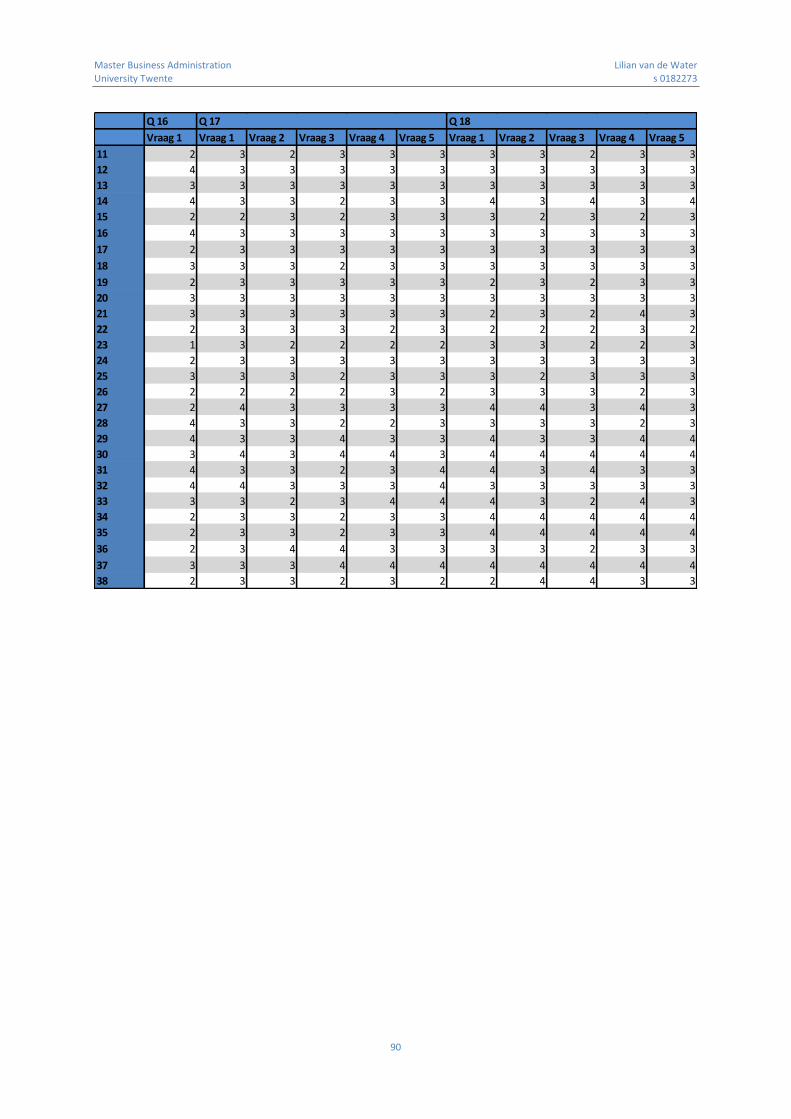
Master Business Administration Lilian van de Water
University Twente s 0182273
90
Q 16 Q 17 Q 18
Vraag 1 Vraag 1 Vraag 2 Vraag 3 Vraag 4 Vraag 5 Vraag 1 Vraag 2 Vraag 3 Vraag 4 Vraag 5
11 2 3 2 3 3 3 3 3 2 3 3
12 4 3 3 3 3 3 3 3 3 3 3
13 3 3 3 3 3 3 3 3 3 3 3
14 4 3 3 2 3 3 4 3 4 3 4
15 2 2 3 2 3 3 3 2 3 2 3
16 4 3 3 3 3 3 3 3 3 3 3
17 2 3 3 3 3 3 3 3 3 3 3
18 3 3 3 2 3 3 3 3 3 3 3
19 2 3 3 3 3 3 2 3 2 3 3
20 3 3 3 3 3 3 3 3 3 3 3
21 3 3 3 3 3 3 2 3 2 4 3
22 2 3 3 3 2 3 2 2 2 3 2
23 1 3 2 2 2 2 3 3 2 2 3
24 2 3 3 3 3 3 3 3 3 3 3
25 3 3 3 2 3 3 3 2 3 3 3
26 2 2 2 2 3 2 3 3 3 2 3
27 2 4 3 3 3 3 4 4 3 4 3
28 4 3 3 2 2 3 3 3 3 2 3
29 4 3 3 4 3 3 4 3 3 4 4
30 3 4 3 4 4 3 4 4 4 4 4
31 4 3 3 2 3 4 4 3 4 3 3
32 4 4 3 3 3 4 3 3 3 3 3
33 3 3 2 3 4 4 4 3 2 4 3
34 2 3 3 2 3 3 4 4 4 4 4
35 2 3 3 2 3 3 4 4 4 4 4
36 2 3 4 4 3 3 3 3 2 3 3
37 3 3 3 4 4 4 4 4 4 4 4
38 2 3 3 2 3 2 2 4 4 3 3

Master Business Administration Lilian van de Water
University Twente s 0182273
91
Appendix 11: Assumptions correlation and multiple linear regression analyses
11.1 Scatterplot authentic leadership and customer satisfaction
11.2 Scatterplot authentic leadership and job satisfaction
11.3 Scatterplot authentic leadership and revenue
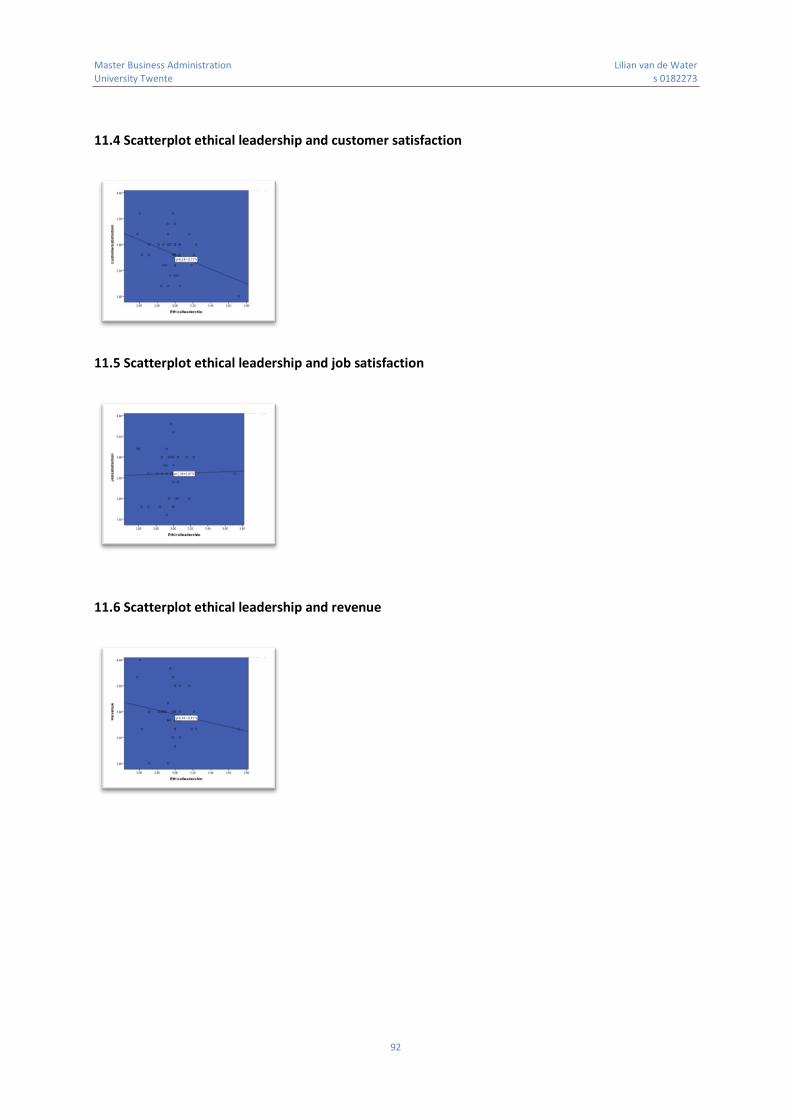
Master Business Administration Lilian van de Water
University Twente s 0182273
92
11.4 Scatterplot ethical leadership and customer satisfaction
11.5 Scatterplot ethical leadership and job satisfaction
11.6 Scatterplot ethical leadership and revenue

Master Business Administration Lilian van de Water
University Twente s 0182273
93
11.7 Scatterplot servant leadership and customer satisfaction
11.8 Scatterplot servant leadership and job satisfaction
11.9 Scatterplot servant leadership and revenue
11.10 Residual analysis authentic leadership, customer satisfaction and number of leaders

Master Business Administration Lilian van de Water
University Twente s 0182273
94
11.11 Correlation analysis authentic leadership and number of leaders
11.12 Outliners authentic leadership, customer satisfaction and number of leaders
11.13 Residual analysis authentic leadership, job satisfaction and number of leaders
11.14 Correlation analysis authentic leadership and number of leaders
Authenticleadership Numberofleaders
Pearson Correlation 1 -,073
Sig. (2-tailed) ,662
N 38 38
Pearson Correlation -,073 1
Sig. (2-tailed) ,662
N 38 38
Authenticleadership
Numberofleaders
Std. Residual Customersatisfaction Predicted Value Residual
3 -2,147 2,00 2,8308 -,83078
37 2,004 3,60 2,8246 ,77542
Casewise Diagnosticsa
Case Number
a. Dependent Variable: Customersatisfaction
Authenticleadership Numberofleaders
Pearson Correlation 1 -,073
Sig. (2-tailed) ,662
N 38 38
Pearson Correlation -,073 1
Sig. (2-tailed) ,662
N 38 38
Authenticleadership
Numberofleaders

Master Business Administration Lilian van de Water
University Twente s 0182273
95
11.15 Outliners authentic leadership, job satisfaction and number of leaders
11.16 Residual analysis authentic leadership, revenue and number of leaders
11.17 Correlation analysis authentic leadership and number of leaders
11.18 Outliners authentic leadership, revenue and number of leaders
Std. Residual Jobsatisfaction Predicted Value Residual
18 2,010 3,80 2,7310 1,06904
Case Number
a. Dependent Variable: Jobsatisfaction
Casewise Diagnosticsa
Authenticleadership Numberofleaders
Pearson Correlation 1 -,073
Sig. (2-tailed) ,662
N 38 38
Pearson Correlation -,073 1
Sig. (2-tailed) ,662
N 38 38
Authenticleadership
Numberofleaders
Std. Residual Revenue Predicted Value Residual
16 -2,047 2,00 2,9256 -,92564
26 -2,073 2,00 2,9373 -,93732
30 2,077 4,00 3,0609 ,93906
Casewise Diagnosticsa
Case Number
a. Dependent Variable: Revenue

Master Business Administration Lilian van de Water
University Twente s 0182273
96
11.19 Residual analysis ethical leadership, customer satisfaction and number of leaders
11.20 Correlation analysis ethical leadership and number of leaders
11.21 Outliners ethical leadership, customer satisfaction and number of leaders
11.22 Residual analysis ethical leadership, job satisfaction and number of leaders
Ethicalleadership Numberofleaders
Pearson Correlation 1 ,254
Sig. (2-tailed) ,124
N 38 38
Pearson Correlation ,254 1
Sig. (2-tailed) ,124
N 38 38
Correlations
Ethicalleadership
Numberofleaders
Std. Residual Customersatisfaction Predicted Value Residual
37 2,016 3,60 2,8776 ,72240
Casewise Diagnosticsa
Case Number
a. Dependent Variable: Customersatisfaction
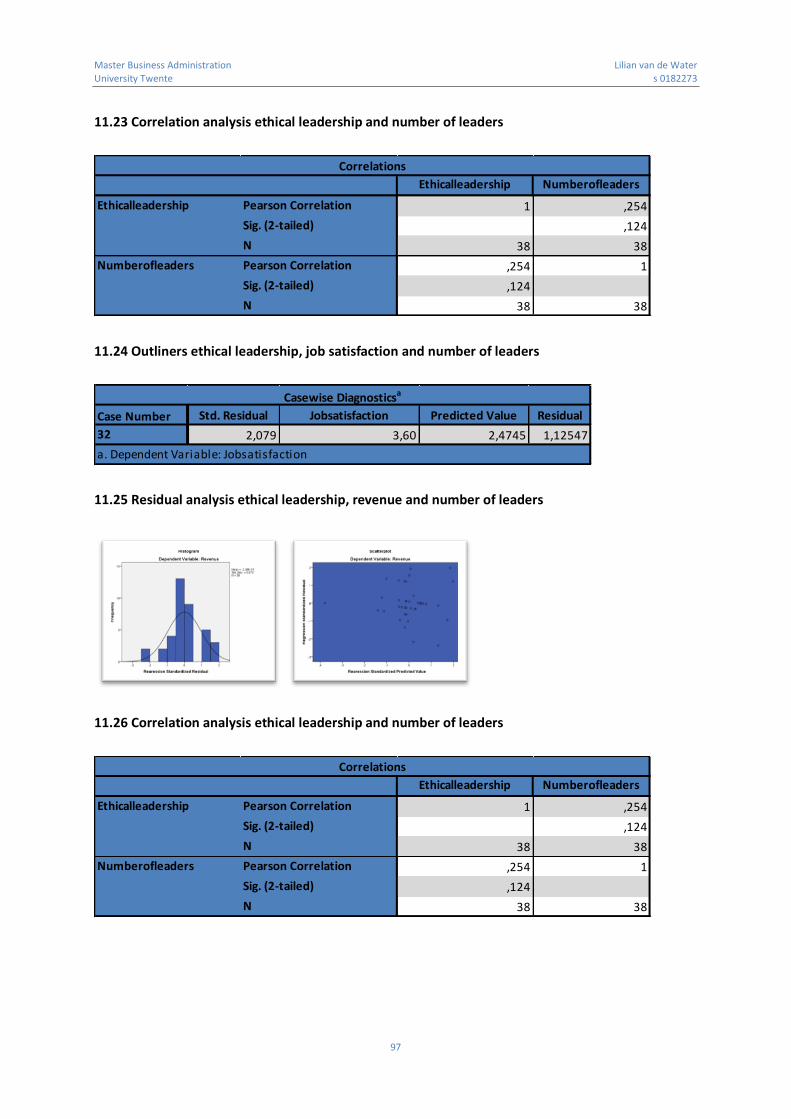
Master Business Administration Lilian van de Water
University Twente s 0182273
97
11.23 Correlation analysis ethical leadership and number of leaders
11.24 Outliners ethical leadership, job satisfaction and number of leaders
11.25 Residual analysis ethical leadership, revenue and number of leaders
11.26 Correlation analysis ethical leadership and number of leaders
Ethicalleadership Numberofleaders
Pearson Correlation 1 ,254
Sig. (2-tailed) ,124
N 38 38
Pearson Correlation ,254 1
Sig. (2-tailed) ,124
N 38 38
Correlations
Ethicalleadership
Numberofleaders
Std. Residual Jobsatisfaction Predicted Value Residual
32 2,079 3,60 2,4745 1,12547
Casewise Diagnosticsa
Case Number
a. Dependent Variable: Jobsatisfaction
Ethicalleadership Numberofleaders
Pearson Correlation 1 ,254
Sig. (2-tailed) ,124
N 38 38
Pearson Correlation ,254 1
Sig. (2-tailed) ,124
N 38 38
Correlations
Ethicalleadership
Numberofleaders

Master Business Administration Lilian van de Water
University Twente s 0182273
98
11.27 Outliners ethical leadership, revenue and number of leaders
Casewise Diagnosticsa
Case Number Std. Residual Revenu Predicted Value Residual
16 -2,359 2,00 3,0643 -1,06432
26 -2,163 2,00 2,9760 -,97604
a. Dependent Variable: Revenu
11.28 Residual analysis servant leadership, customer satisfaction and number of leaders
11.29 Correlation analysis servant leadership and number of leaders
11.30 Outliners servant leadership, customer satisfaction and number of leaders
Servantleadership Numberofleaders
Pearson Correlation 1 -,064
Sig. (2-tailed) ,704
N 38 38
Pearson Correlation -,064 1
Sig. (2-tailed) ,704
N 38 38
Correlations
Servantleadership
Numberofleaders
Std. Residual Customersatisfaction Predicted Value Residual
3 -2,144 2,00 2,8252 -,82520
30 2,057 3,60 2,8082 ,79178
37 2,083 3,60 2,7982 ,80182
Casewise Diagnosticsa
Case Number
a. Dependent Variable: Customersatisfaction
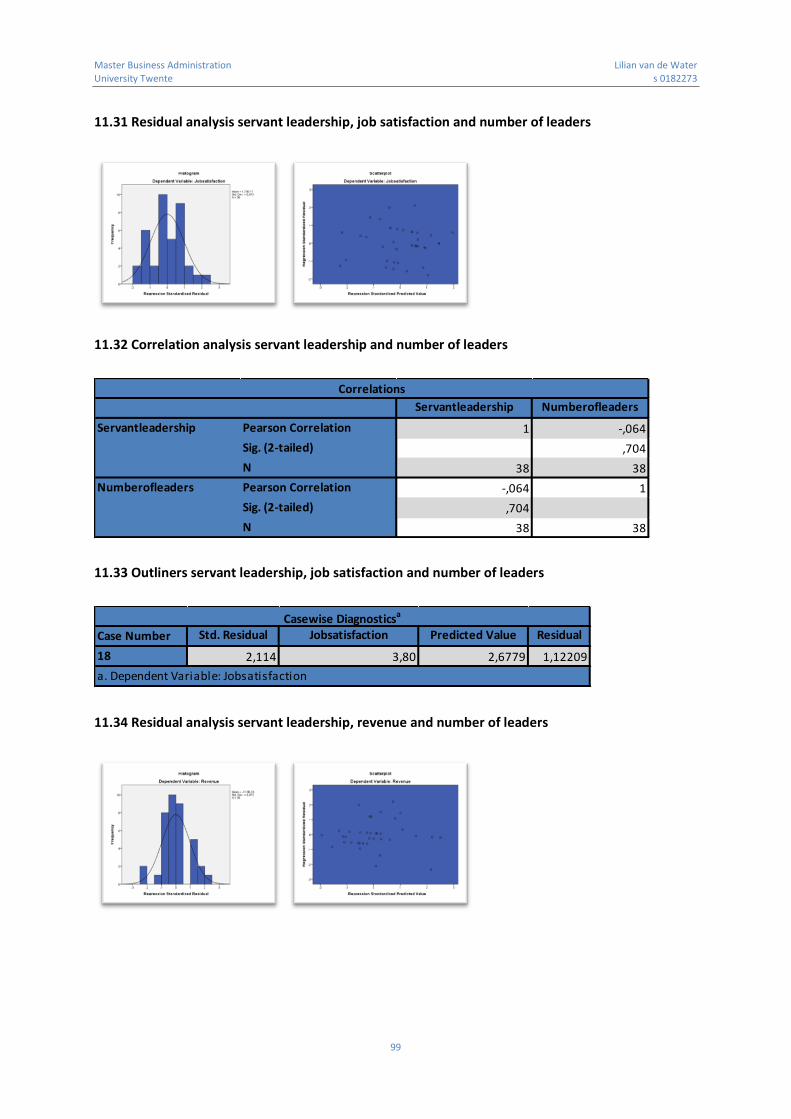
Master Business Administration Lilian van de Water
University Twente s 0182273
99
11.31 Residual analysis servant leadership, job satisfaction and number of leaders
11.32 Correlation analysis servant leadership and number of leaders
11.33 Outliners servant leadership, job satisfaction and number of leaders
11.34 Residual analysis servant leadership, revenue and number of leaders
Servantleadership Numberofleaders
Pearson Correlation 1 -,064
Sig. (2-tailed) ,704
N 38 38
Pearson Correlation -,064 1
Sig. (2-tailed) ,704
N 38 38
Correlations
Servantleadership
Numberofleaders
Std. Residual Jobsatisfaction Predicted Value Residual
18 2,114 3,80 2,6779 1,12209
Casewise Diagnosticsa
Case Number
a. Dependent Variable: Jobsatisfaction

Master Business Administration Lilian van de Water
University Twente s 0182273
100
11.35 Correlation analysis servant leadership and number of leaders
11.36 Outliners servant leadership, revenue and number of leaders
Servantleadership Numberofleaders
Pearson Correlation 1 -,064
Sig. (2-tailed) ,704
N 38 38
Pearson Correlation -,064 1
Sig. (2-tailed) ,704
N 38 38
Correlations
Servantleadership
Numberofleaders
Std. Residual Revenue Predicted Value Residual
16 -2,120 2,00 2,9648 -,96477
26 -2,363 2,00 3,0757 -1,07574
30 2,197 4,00 2,9999 1,00013
Casewise Diagnosticsa
Case Number
a. Dependent Variable: Revenue