Embed Size (px)
Citation preview
First Empire Securities, Inc.(800) 645-5424 www.1empire.com
Effective Liquidity Management
Presented by: Frank Santucci
Managing Director ALM [email protected]
CUNA CFO Council Conference
New Orleans, LouisianaMay 2015
First Empire Securities, Inc.(800) 645-5424 www.1empire.com
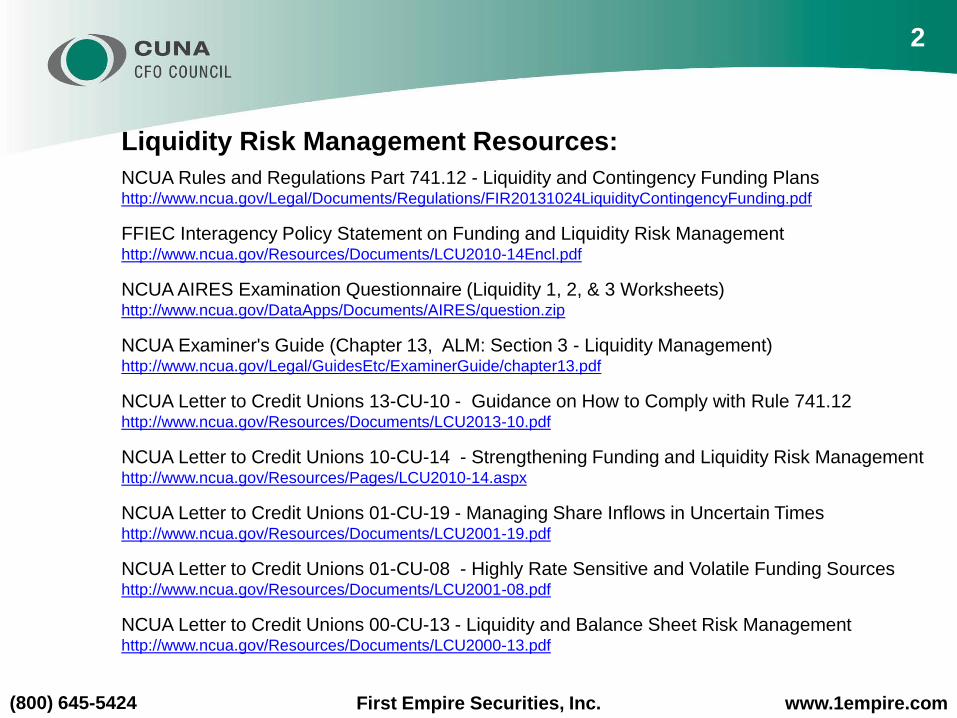
Liquidity Risk Management Resources:
NCUA Rules and Regulations Part 741.12 - Liquidity and Contingency Funding Planshttp://www.ncua.gov/Legal/Documents/Regulations/FIR20131024LiquidityContingencyFunding.pdf
FFIEC Interagency Policy Statement on Funding and Liquidity Risk Managementhttp://www.ncua.gov/Resources/Documents/LCU2010-14Encl.pdf
NCUA AIRES Examination Questionnaire (Liquidity 1, 2, & 3 Worksheets)http://www.ncua.gov/DataApps/Documents/AIRES/question.zip
NCUA Examiner's Guide (Chapter 13, ALM: Section 3 - Liquidity Management) http://www.ncua.gov/Legal/GuidesEtc/ExaminerGuide/chapter13.pdf
NCUA Letter to Credit Unions 13-CU-10 - Guidance on How to Comply with Rule 741.12http://www.ncua.gov/Resources/Documents/LCU2013-10.pdf
NCUA Letter to Credit Unions 10-CU-14 - Strengthening Funding and Liquidity Risk Managementhttp://www.ncua.gov/Resources/Pages/LCU2010-14.aspx
NCUA Letter to Credit Unions 01-CU-19 - Managing Share Inflows in Uncertain Timeshttp://www.ncua.gov/Resources/Documents/LCU2001-19.pdf
NCUA Letter to Credit Unions 01-CU-08 - Highly Rate Sensitive and Volatile Funding Sources http://www.ncua.gov/Resources/Documents/LCU2001-08.pdf
NCUA Letter to Credit Unions 00-CU-13 - Liquidity and Balance Sheet Risk Managementhttp://www.ncua.gov/Resources/Documents/LCU2000-13.pdf
2
First Empire Securities, Inc.(800) 645-5424 www.1empire.com
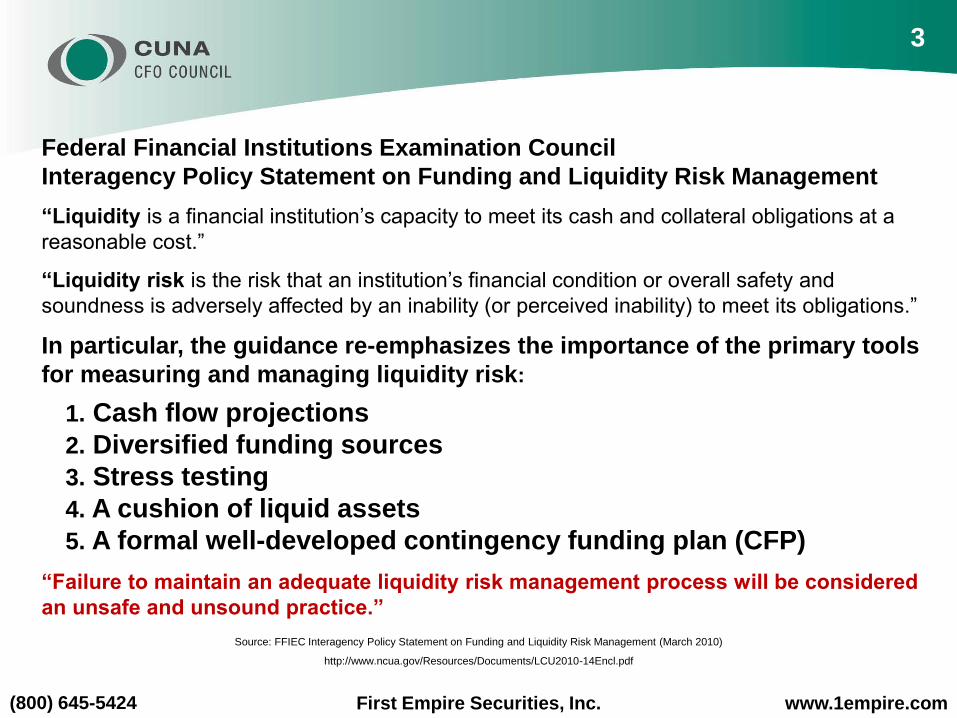
Federal Financial Institutions Examination Council
Interagency Policy Statement on Funding and Liquidity Risk Management
“Liquidity is a financial institution’s capacity to meet its cash and collateral obligations at a
reasonable cost.”
“Liquidity risk is the risk that an institution’s financial condition or overall safety and
soundness is adversely affected by an inability (or perceived inability) to meet its obligations.”
In particular, the guidance re-emphasizes the importance of the primary tools
for measuring and managing liquidity risk:
1. Cash flow projections
2. Diversified funding sources
3. Stress testing
4. A cushion of liquid assets
5. A formal well-developed contingency funding plan (CFP)
“Failure to maintain an adequate liquidity risk management process will be considered
an unsafe and unsound practice.”
Source: FFIEC Interagency Policy Statement on Funding and Liquidity Risk Management (March 2010)
http://www.ncua.gov/Resources/Documents/LCU2010-14Encl.pdf
3

First Empire Securities, Inc.(800) 645-5424 www.1empire.com
Liquidity Examination Ratios
NCUA AIRES Examination Questionnaire (Liquidity 1, 2, & 3 Worksheets)
http://www.ncua.gov/DataApps/Documents/AIRES/question.zip
NCUA Liquidity Examination Questionnaire Ratios Sep-13 Dec-13 Mar-14 Jun-14 Sep-14 Dec-14
Borrow ing+Non-member Deposits/ Shares and Liabilities 3.54% 3.61% 3.50% 4.03% 4.48% 4.51%
Cash & Short Term Assets-to-Total Assets 15.24% 14.93% 16.27% 14.53% 13.10% 13.67%
Regular Shares & Drafts / Total Shares and Borrow ings 25.05% 25.34% 26.58% 26.02% 25.75% 26.58%
Contingent Liabilities/Cash and Investments 44.96% 46.39% 44.52% 47.47% 50.03% 51.13%
Net Liquid Assets / Total Liabilities & Shares 33.24% 32.42% 34.17% 31.94% 29.65% 28.94%
Volatile Liabilities/ Cash+Investments <1yr 144.27% 225.14% 198.57% 224.53% 253.24% 241.20%
Year-over-Year Grow th in Volatile Liabilities/ Assets 0.48% 0.57% 0.55% 0.81% 0.88% 0.87%
Investment Loss Ratio -0.79% -1.06% -0.59% 0.00% -0.21% 0.00%
Estimated Loan Maturity 30 Mo 32 Mo 31 Mo 29 Mo 33 Mo 30 Mo
NCUA AIRES Examination Questionnaire – Liquidity
NCUA has published on their website a copy of the AIRES Examination
Questionnaire. The questionnaire is an Excel workbook containing over one hundred
worksheets/questionnaires the examiner may use in the course of their examination.
These questionnaires cover every aspect of the exam, including liquidity.
In the three liquidity questionnaires there are nine liquidity ratios the examiner will
calculate as well as 123 questions the examiner may ask as part of the examination.
In addition, most of these questions also have an “embedded comment” attached to
the cell. These comments provide additional guidance from NCUA to the examiner,
often describe “best practices,” and highlight various red flags or potential problems.
4
First Empire Securities, Inc.(800) 645-5424 www.1empire.com
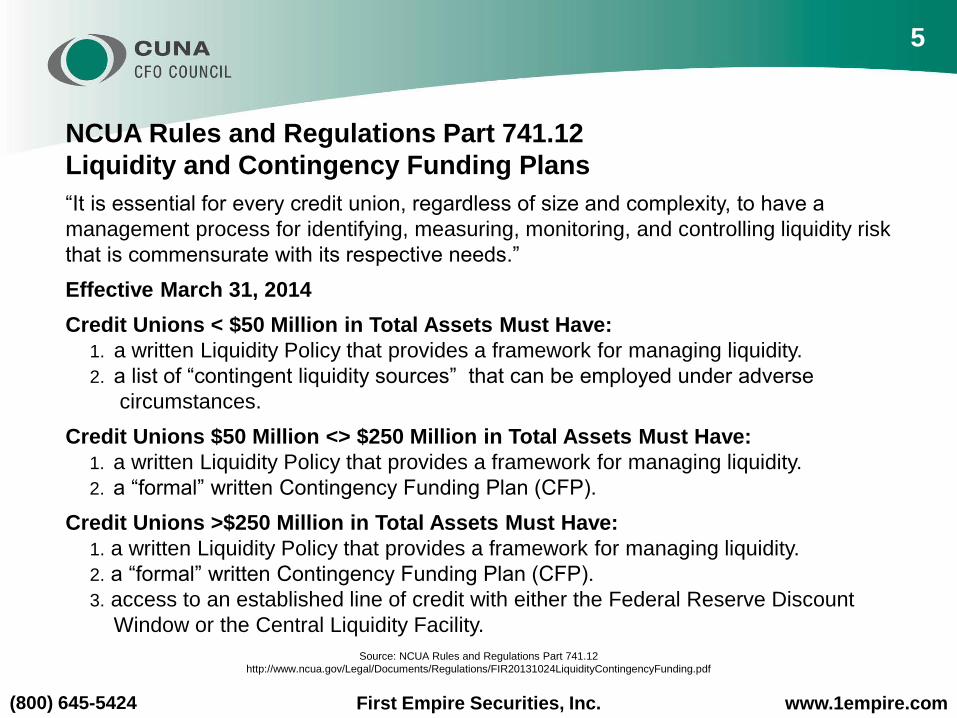
NCUA Rules and Regulations Part 741.12
Liquidity and Contingency Funding Plans
“It is essential for every credit union, regardless of size and complexity, to have a
management process for identifying, measuring, monitoring, and controlling liquidity risk
that is commensurate with its respective needs.”
Effective March 31, 2014
Credit Unions < $50 Million in Total Assets Must Have:
1. a written Liquidity Policy that provides a framework for managing liquidity.
2. a list of “contingent liquidity sources” that can be employed under adverse
circumstances.
Credit Unions $50 Million <> $250 Million in Total Assets Must Have:
1. a written Liquidity Policy that provides a framework for managing liquidity.
2. a “formal” written Contingency Funding Plan (CFP).
Credit Unions >$250 Million in Total Assets Must Have:
1. a written Liquidity Policy that provides a framework for managing liquidity.
2. a “formal” written Contingency Funding Plan (CFP).
3. access to an established line of credit with either the Federal Reserve Discount
Window or the Central Liquidity Facility.
Source: NCUA Rules and Regulations Part 741.12
http://www.ncua.gov/Legal/Documents/Regulations/FIR20131024LiquidityContingencyFunding.pdf
5
First Empire Securities, Inc.(800) 645-5424 www.1empire.com
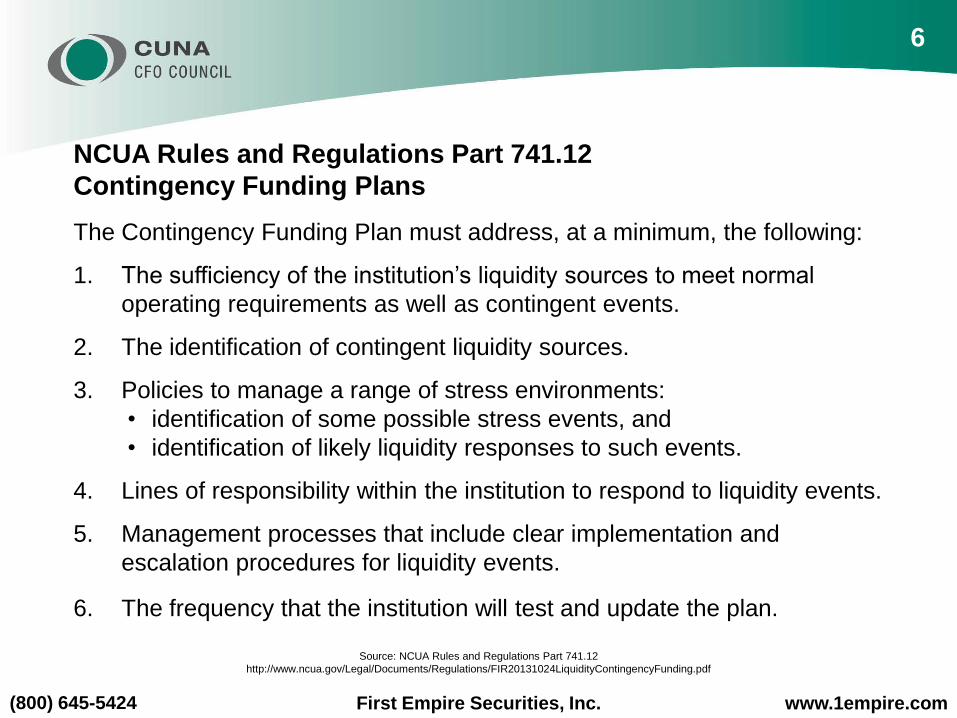
NCUA Rules and Regulations Part 741.12
Contingency Funding Plans
The Contingency Funding Plan must address, at a minimum, the following:
1. The sufficiency of the institution’s liquidity sources to meet normal
operating requirements as well as contingent events.
2. The identification of contingent liquidity sources.
3. Policies to manage a range of stress environments:
• identification of some possible stress events, and
• identification of likely liquidity responses to such events.
4. Lines of responsibility within the institution to respond to liquidity events.
5. Management processes that include clear implementation and
escalation procedures for liquidity events.
6. The frequency that the institution will test and update the plan.
Source: NCUA Rules and Regulations Part 741.12
http://www.ncua.gov/Legal/Documents/Regulations/FIR20131024LiquidityContingencyFunding.pdf
6
First Empire Securities, Inc.(800) 645-5424 www.1empire.com
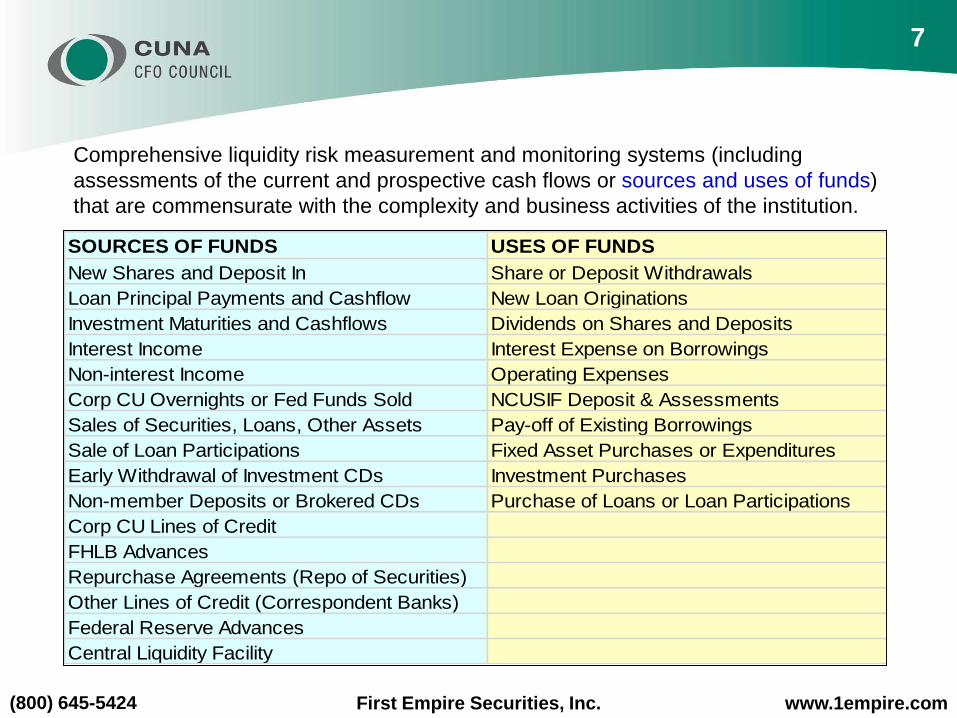
SOURCES OF FUNDS USES OF FUNDS
New Shares and Deposit In Share or Deposit Withdrawals
Loan Principal Payments and Cashflow New Loan Originations
Investment Maturities and Cashflows Dividends on Shares and Deposits
Interest Income Interest Expense on Borrowings
Non-interest Income Operating Expenses
Corp CU Overnights or Fed Funds Sold NCUSIF Deposit & Assessments
Sales of Securities, Loans, Other Assets Pay-off of Existing Borrowings
Sale of Loan Participations Fixed Asset Purchases or Expenditures
Early Withdrawal of Investment CDs Investment Purchases
Non-member Deposits or Brokered CDs Purchase of Loans or Loan Participations
Corp CU Lines of Credit
FHLB Advances
Repurchase Agreements (Repo of Securities)
Other Lines of Credit (Correspondent Banks)
Federal Reserve Advances
Central Liquidity Facility
Comprehensive liquidity risk measurement and monitoring systems (including
assessments of the current and prospective cash flows or sources and uses of funds)
that are commensurate with the complexity and business activities of the institution.
7
First Empire Securities, Inc.(800) 645-5424 www.1empire.com
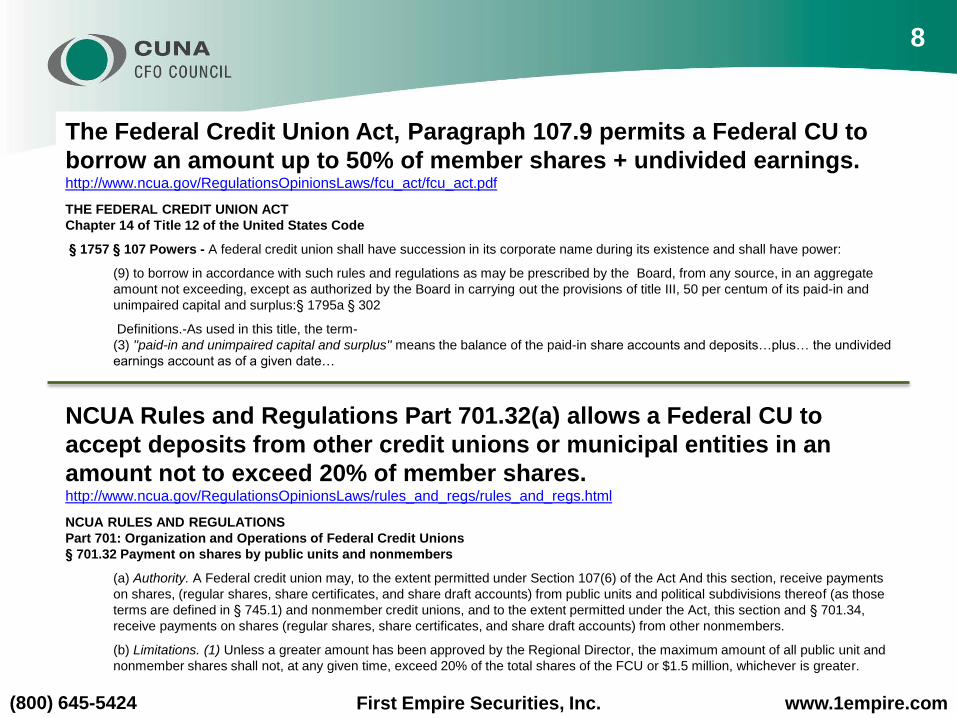
The Federal Credit Union Act, Paragraph 107.9 permits a Federal CU to
borrow an amount up to 50% of member shares + undivided earnings.http://www.ncua.gov/RegulationsOpinionsLaws/fcu_act/fcu_act.pdf
THE FEDERAL CREDIT UNION ACT
Chapter 14 of Title 12 of the United States Code
§ 1757 § 107 Powers - A federal credit union shall have succession in its corporate name during its existence and shall have power:
(9) to borrow in accordance with such rules and regulations as may be prescribed by the Board, from any source, in an aggregate
amount not exceeding, except as authorized by the Board in carrying out the provisions of title III, 50 per centum of its paid-in and
unimpaired capital and surplus:§ 1795a § 302
Definitions.-As used in this title, the term-
(3) ''paid-in and unimpaired capital and surplus'' means the balance of the paid-in share accounts and deposits…plus… the undivided
earnings account as of a given date…
NCUA Rules and Regulations Part 701.32(a) allows a Federal CU to
accept deposits from other credit unions or municipal entities in an
amount not to exceed 20% of member shares. http://www.ncua.gov/RegulationsOpinionsLaws/rules_and_regs/rules_and_regs.html
NCUA RULES AND REGULATIONS
Part 701: Organization and Operations of Federal Credit Unions
§ 701.32 Payment on shares by public units and nonmembers
(a) Authority. A Federal credit union may, to the extent permitted under Section 107(6) of the Act And this section, receive payments
on shares, (regular shares, share certificates, and share draft accounts) from public units and political subdivisions thereof (as those
terms are defined in § 745.1) and nonmember credit unions, and to the extent permitted under the Act, this section and § 701.34,
receive payments on shares (regular shares, share certificates, and share draft accounts) from other nonmembers.
(b) Limitations. (1) Unless a greater amount has been approved by the Regional Director, the maximum amount of all public unit and
nonmember shares shall not, at any given time, exceed 20% of the total shares of the FCU or $1.5 million, whichever is greater.
8
First Empire Securities, Inc.(800) 645-5424 www.1empire.com
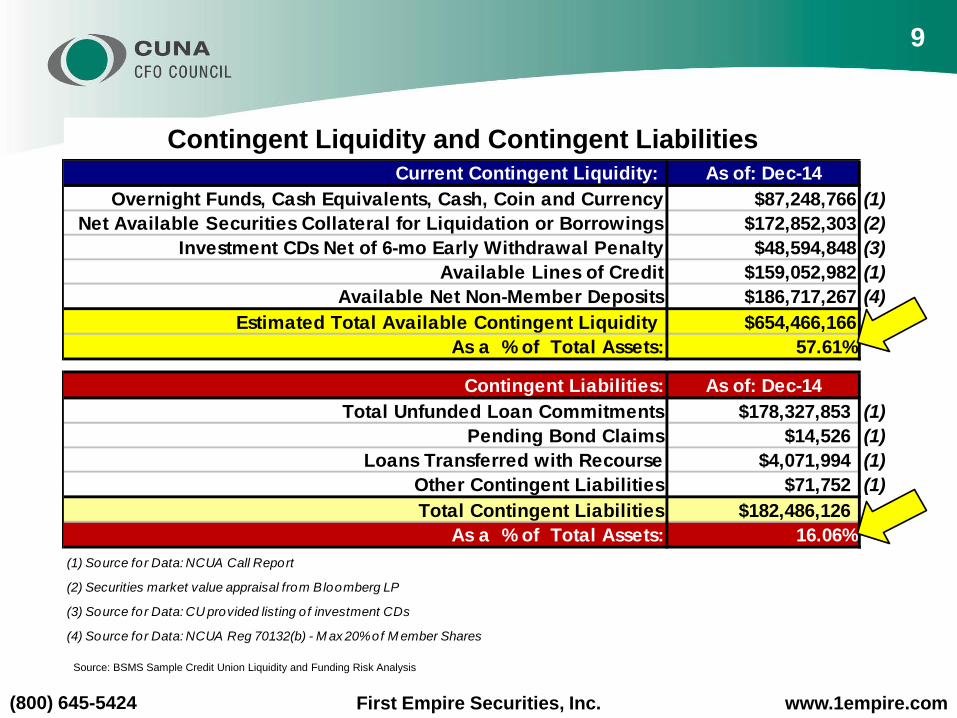
Contingent Liquidity and Contingent Liabilities
Source: BSMS Sample Credit Union Liquidity and Funding Risk Analysis
Current Contingent Liquidity: As of: Dec-14
Overnight Funds, Cash Equivalents, Cash, Coin and Currency $87,248,766 (1)
Net Available Securities Collateral for Liquidation or Borrowings $172,852,303 (2)
Investment CDs Net of 6-mo Early Withdrawal Penalty $48,594,848 (3)
Available Lines of Credit $159,052,982 (1)
Available Net Non-Member Deposits $186,717,267 (4)
Estimated Total Available Contingent Liquidity $654,466,166
As a % of Total Assets: 57.61%
Contingent Liabilities: As of: Dec-14
Total Unfunded Loan Commitments $178,327,853 (1)
Pending Bond Claims $14,526 (1)
Loans Transferred with Recourse $4,071,994 (1)
Other Contingent Liabilities $71,752 (1)
Total Contingent Liabilities $182,486,126 (1)
As a % of Total Assets: 16.06%
(1 ) Source for Data: NCUA Call Report
(2) Securities market value appraisal from Bloomberg LP
(3) Source for Data: CU provided listing of investment CDs
(4) Source for Data: NCUA Reg 701.32(b) - M ax 20% of M ember Shares
9
First Empire Securities, Inc.(800) 645-5424 www.1empire.com
• A critical element of a Contingency Funding Plan is
the quantitative projection and evaluation of expected
funding needs.
• Measuring liquidity risk should include robust
methods for comprehensively projecting cash flows
arising from assets, liabilities, and off-balance-sheet
items over an appropriate set of time horizons.
o Cash flow projections can range from simple spreadsheets to very
detailed reports depending upon the complexity and sophistication
of the institution and its liquidity risk profile.
10
Source: FFIEC Interagency Policy Statement on Funding and Liquidity Risk Management (March 2010)
http://www.ncua.gov/Resources/Documents/LCU2010-14Encl.pdf
First Empire Securities, Inc.(800) 645-5424 www.1empire.com
Year
Ending
Period Ending
Balance
Net Share &
Deposit
Growth
Dec-99 $356,918,613
Dec-00 $379,240,583 $22,321,970
Dec-01 $437,009,915 $57,769,332
Dec-02 $484,195,318 $47,185,403
Dec-03 $538,282,139 $54,086,820
Dec-04 $567,453,973 $29,171,834
Dec-05 $589,177,564 $21,723,590
Dec-06 $615,303,070 $26,125,506
Dec-07 $646,819,665 $31,516,596
Dec-08 $691,766,240 $44,946,574
Dec-09 $763,341,587 $71,575,348
Dec-10 $797,303,427 $33,961,840
Dec-11 $838,505,580 $41,202,153
Dec-12 $889,579,460 $51,073,880
Dec-13 $922,033,767 $32,454,307
Dec-14 $963,116,398 $41,082,631
TOTAL/AVG. $606,197,785
SHARES AND DEPOSITS
Year
Ending
Period Ending
Balance
Net Share &
Deposit
Growth
Period Ending
Balance
Net Loan
Growth
Annualized
Excess
(Needed)
Funding
Avg. Monthly
Excess
(Needed)
Funding
Annualized Net
Liquidity as a %
of Total Assets
Dec-99 $356,918,613 $271,538,145
Dec-00 $379,240,583 $22,321,970 $301,335,556 $29,797,411 ($7,475,440) ($622,953) -1.82%
Dec-01 $437,009,915 $57,769,332 $322,339,765 $21,004,209 $36,765,123 $3,063,760 8.39%
Dec-02 $484,195,318 $47,185,403 $344,608,343 $22,268,578 $24,916,825 $2,076,402 4.97%
Dec-03 $538,282,139 $54,086,820 $383,812,814 $39,204,471 $14,882,349 $1,240,196 2.67%
Dec-04 $567,453,973 $29,171,834 $423,479,114 $39,666,299 ($10,494,465) ($874,539) -1.69%
Dec-05 $589,177,564 $21,723,590 $468,678,608 $45,199,494 ($23,475,904) ($1,956,325) -3.56%
Dec-06 $615,303,070 $26,125,506 $506,686,445 $38,007,837 ($11,882,331) ($990,194) -1.72%
Dec-07 $646,819,665 $31,516,596 $539,545,694 $32,859,249 ($1,342,653) ($111,888) -0.18%
Dec-08 $691,766,240 $44,946,574 $575,814,366 $36,268,672 $8,677,902 $723,159 1.13%
Dec-09 $763,341,587 $71,575,348 $582,791,344 $6,976,978 $64,598,370 $5,383,197 7.84%
Dec-10 $797,303,427 $33,961,840 $575,664,231 ($7,127,114) $41,088,953 $3,424,079 4.58%
Dec-11 $838,505,580 $41,202,153 $582,287,640 $6,623,409 $34,578,743 $2,881,562 3.73%
Dec-12 $889,579,460 $51,073,880 $610,290,341 $28,002,701 $23,071,179 $1,922,598 2.37%
Dec-13 $922,033,767 $32,454,307 $655,006,161 $44,715,820 ($12,261,513) ($1,021,793) -1.18%
Dec-14 $963,116,398 $41,082,631 $723,431,574 $68,425,414 ($27,342,783) ($2,278,565) -2.54%
TOTAL/AVG. $606,197,785 TOTAL/AVG. $451,893,429 $9,570,996 $797,583 1.53%
LOANSSHARES AND DEPOSITS NET LIQUIDITY
Source: BSMS Sample Credit Union Liquidity and Funding Risk Analysis
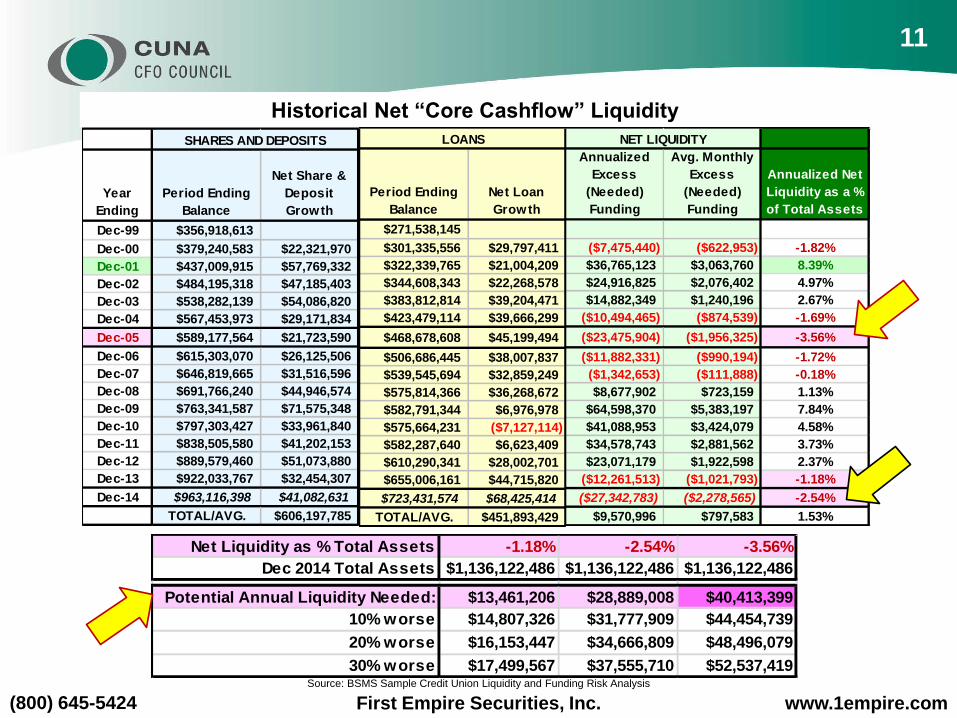
Historical Net “Core Cashflow” Liquidity
Net Liquidity as % Total Assets -1.18% -2.54% -3.56%
Dec 2014 Total Assets $1,136,122,486 $1,136,122,486 $1,136,122,486
Potential Annual Liquidity Needed: $13,461,206 $28,889,008 $40,413,399
10% worse $14,807,326 $31,777,909 $44,454,739
20% worse $16,153,447 $34,666,809 $48,496,079
30% worse $17,499,567 $37,555,710 $52,537,419
11
Period Ending
Balance
Net Loan
Growth
$271,538,145
$301,335,556 $29,797,411
$322,339,765 $21,004,209
$344,608,343 $22,268,578
$383,812,814 $39,204,471
$423,479,114 $39,666,299
$468,678,608 $45,199,494
$506,686,445 $38,007,837
$539,545,694 $32,859,249
$575,814,366 $36,268,672
$582,791,344 $6,976,978
$575,664,231 ($7,127,114)
$582,287,640 $6,623,409
$610,290,341 $28,002,701
$655,006,161 $44,715,820
$723,431,574 $68,425,414
TOTAL/AVG. $451,893,429
LOANS
Annualized
Excess
(Needed)
Funding
Avg. Monthly
Excess
(Needed)
Funding
Annualized Net
Liquidity as a %
of Total Assets
($7,475,440) ($622,953) -1.82%
$36,765,123 $3,063,760 8.39%
$24,916,825 $2,076,402 4.97%
$14,882,349 $1,240,196 2.67%
($10,494,465) ($874,539) -1.69%
($23,475,904) ($1,956,325) -3.56%
($11,882,331) ($990,194) -1.72%
($1,342,653) ($111,888) -0.18%
$8,677,902 $723,159 1.13%
$64,598,370 $5,383,197 7.84%
$41,088,953 $3,424,079 4.58%
$34,578,743 $2,881,562 3.73%
$23,071,179 $1,922,598 2.37%
($12,261,513) ($1,021,793) -1.18%
($27,342,783) ($2,278,565) -2.54%
$9,570,996 $797,583 1.53%
NET LIQUIDITY
First Empire Securities, Inc.(800) 645-5424 www.1empire.com
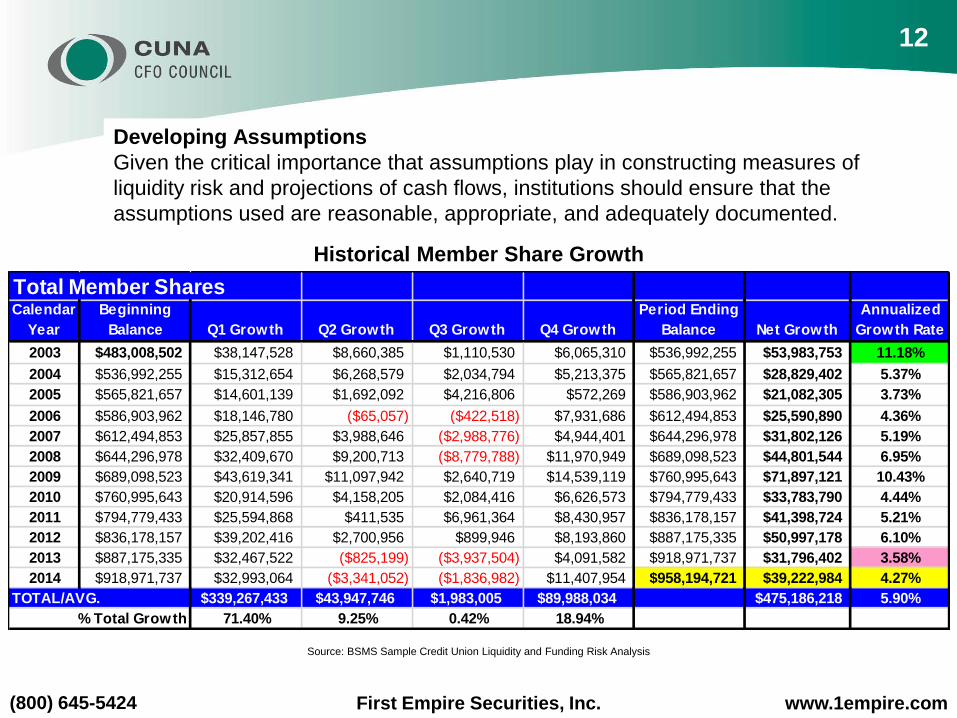
Total Member SharesCalendar
Year
Beginning
Balance Q1 Growth Q2 Growth Q3 Growth Q4 Growth
Period Ending
Balance Net Growth
Annualized
Growth Rate
2003 $483,008,502 $38,147,528 $8,660,385 $1,110,530 $6,065,310 $536,992,255 $53,983,753 11.18%
2004 $536,992,255 $15,312,654 $6,268,579 $2,034,794 $5,213,375 $565,821,657 $28,829,402 5.37%
2005 $565,821,657 $14,601,139 $1,692,092 $4,216,806 $572,269 $586,903,962 $21,082,305 3.73%
2006 $586,903,962 $18,146,780 ($65,057) ($422,518) $7,931,686 $612,494,853 $25,590,890 4.36%
2007 $612,494,853 $25,857,855 $3,988,646 ($2,988,776) $4,944,401 $644,296,978 $31,802,126 5.19%
2008 $644,296,978 $32,409,670 $9,200,713 ($8,779,788) $11,970,949 $689,098,523 $44,801,544 6.95%
2009 $689,098,523 $43,619,341 $11,097,942 $2,640,719 $14,539,119 $760,995,643 $71,897,121 10.43%
2010 $760,995,643 $20,914,596 $4,158,205 $2,084,416 $6,626,573 $794,779,433 $33,783,790 4.44%
2011 $794,779,433 $25,594,868 $411,535 $6,961,364 $8,430,957 $836,178,157 $41,398,724 5.21%
2012 $836,178,157 $39,202,416 $2,700,956 $899,946 $8,193,860 $887,175,335 $50,997,178 6.10%
2013 $887,175,335 $32,467,522 ($825,199) ($3,937,504) $4,091,582 $918,971,737 $31,796,402 3.58%
2014 $918,971,737 $32,993,064 ($3,341,052) ($1,836,982) $11,407,954 $958,194,721 $39,222,984 4.27%
TOTAL/AVG. $339,267,433 $43,947,746 $1,983,005 $89,988,034 $475,186,218 5.90%
% Total Growth 71.40% 9.25% 0.42% 18.94%
Developing Assumptions
Given the critical importance that assumptions play in constructing measures of
liquidity risk and projections of cash flows, institutions should ensure that the
assumptions used are reasonable, appropriate, and adequately documented.
Source: BSMS Sample Credit Union Liquidity and Funding Risk Analysis
Historical Member Share Growth
12
First Empire Securities, Inc.(800) 645-5424 www.1empire.com
Source: BSMS Sample Credit Union Liquidity and Funding Risk Analysis
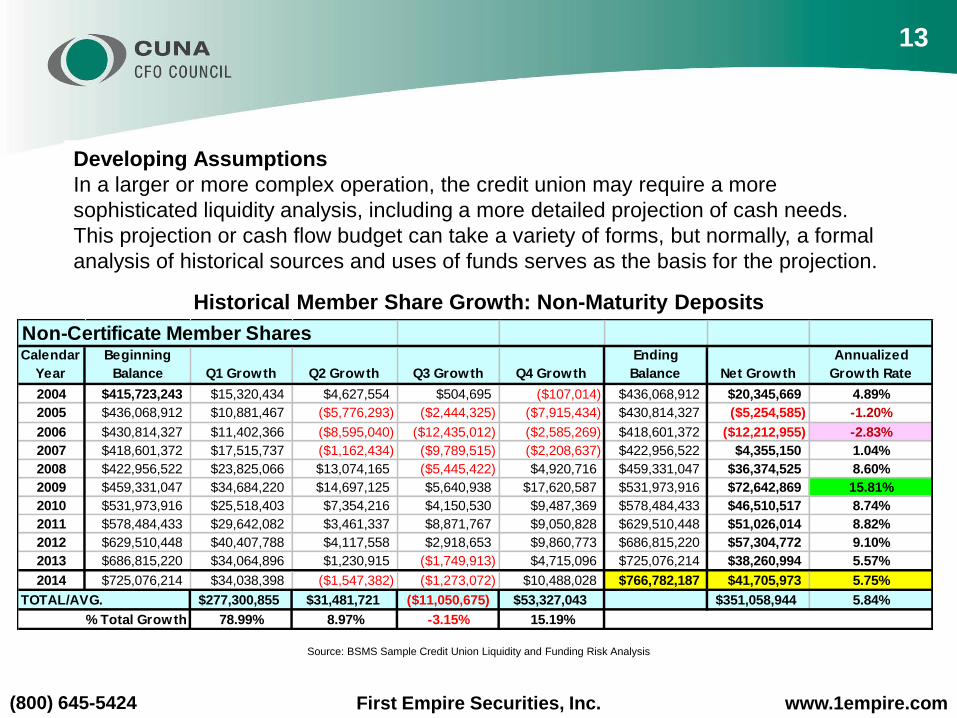
Historical Member Share Growth: Non-Maturity Deposits
Non-Certificate Member SharesCalendar
Year
Beginning
Balance Q1 Growth Q2 Growth Q3 Growth Q4 Growth
Ending
Balance Net Growth
Annualized
Growth Rate
2004 $415,723,243 $15,320,434 $4,627,554 $504,695 ($107,014) $436,068,912 $20,345,669 4.89%
2005 $436,068,912 $10,881,467 ($5,776,293) ($2,444,325) ($7,915,434) $430,814,327 ($5,254,585) -1.20%
2006 $430,814,327 $11,402,366 ($8,595,040) ($12,435,012) ($2,585,269) $418,601,372 ($12,212,955) -2.83%
2007 $418,601,372 $17,515,737 ($1,162,434) ($9,789,515) ($2,208,637) $422,956,522 $4,355,150 1.04%
2008 $422,956,522 $23,825,066 $13,074,165 ($5,445,422) $4,920,716 $459,331,047 $36,374,525 8.60%
2009 $459,331,047 $34,684,220 $14,697,125 $5,640,938 $17,620,587 $531,973,916 $72,642,869 15.81%
2010 $531,973,916 $25,518,403 $7,354,216 $4,150,530 $9,487,369 $578,484,433 $46,510,517 8.74%
2011 $578,484,433 $29,642,082 $3,461,337 $8,871,767 $9,050,828 $629,510,448 $51,026,014 8.82%
2012 $629,510,448 $40,407,788 $4,117,558 $2,918,653 $9,860,773 $686,815,220 $57,304,772 9.10%
2013 $686,815,220 $34,064,896 $1,230,915 ($1,749,913) $4,715,096 $725,076,214 $38,260,994 5.57%
2014 $725,076,214 $34,038,398 ($1,547,382) ($1,273,072) $10,488,028 $766,782,187 $41,705,973 5.75%
TOTAL/AVG. $277,300,855 $31,481,721 ($11,050,675) $53,327,043 $351,058,944 5.84%
% Total Growth 78.99% 8.97% -3.15% 15.19%
Developing Assumptions
In a larger or more complex operation, the credit union may require a more
sophisticated liquidity analysis, including a more detailed projection of cash needs.
This projection or cash flow budget can take a variety of forms, but normally, a formal
analysis of historical sources and uses of funds serves as the basis for the projection.
13
First Empire Securities, Inc.(800) 645-5424 www.1empire.com
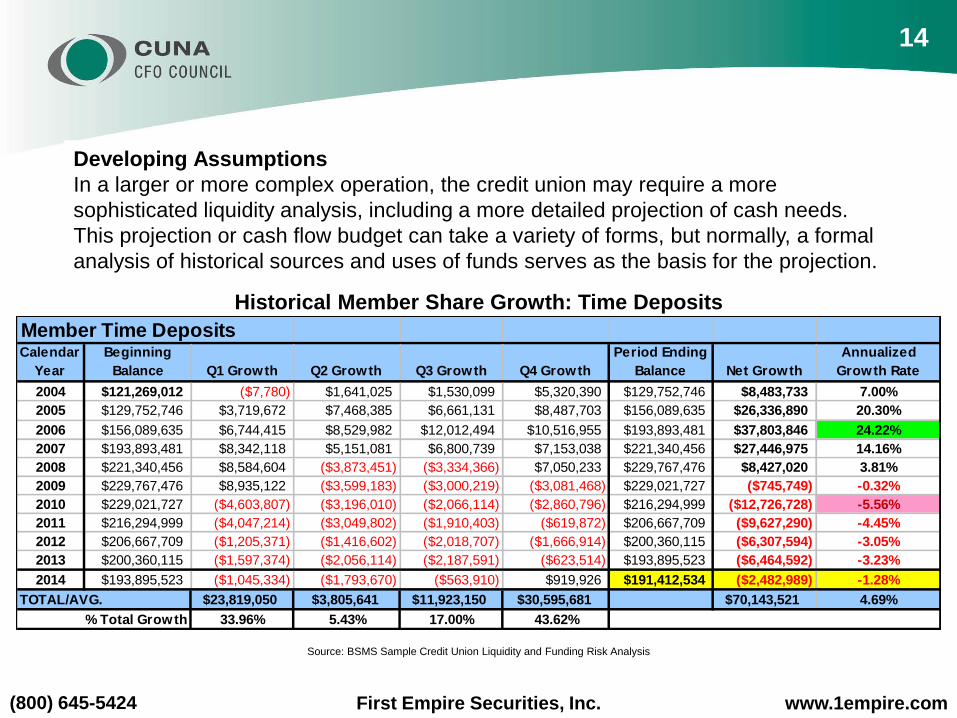
Source: BSMS Sample Credit Union Liquidity and Funding Risk Analysis
Member Time DepositsCalendar
Year
Beginning
Balance Q1 Growth Q2 Growth Q3 Growth Q4 Growth
Period Ending
Balance Net Growth
Annualized
Growth Rate
2004 $121,269,012 ($7,780) $1,641,025 $1,530,099 $5,320,390 $129,752,746 $8,483,733 7.00%
2005 $129,752,746 $3,719,672 $7,468,385 $6,661,131 $8,487,703 $156,089,635 $26,336,890 20.30%
2006 $156,089,635 $6,744,415 $8,529,982 $12,012,494 $10,516,955 $193,893,481 $37,803,846 24.22%
2007 $193,893,481 $8,342,118 $5,151,081 $6,800,739 $7,153,038 $221,340,456 $27,446,975 14.16%
2008 $221,340,456 $8,584,604 ($3,873,451) ($3,334,366) $7,050,233 $229,767,476 $8,427,020 3.81%
2009 $229,767,476 $8,935,122 ($3,599,183) ($3,000,219) ($3,081,468) $229,021,727 ($745,749) -0.32%
2010 $229,021,727 ($4,603,807) ($3,196,010) ($2,066,114) ($2,860,796) $216,294,999 ($12,726,728) -5.56%
2011 $216,294,999 ($4,047,214) ($3,049,802) ($1,910,403) ($619,872) $206,667,709 ($9,627,290) -4.45%
2012 $206,667,709 ($1,205,371) ($1,416,602) ($2,018,707) ($1,666,914) $200,360,115 ($6,307,594) -3.05%
2013 $200,360,115 ($1,597,374) ($2,056,114) ($2,187,591) ($623,514) $193,895,523 ($6,464,592) -3.23%
2014 $193,895,523 ($1,045,334) ($1,793,670) ($563,910) $919,926 $191,412,534 ($2,482,989) -1.28%
TOTAL/AVG. $23,819,050 $3,805,641 $11,923,150 $30,595,681 $70,143,521 4.69%
% Total Growth 33.96% 5.43% 17.00% 43.62%
Historical Member Share Growth: Time Deposits
Developing Assumptions
In a larger or more complex operation, the credit union may require a more
sophisticated liquidity analysis, including a more detailed projection of cash needs.
This projection or cash flow budget can take a variety of forms, but normally, a formal
analysis of historical sources and uses of funds serves as the basis for the projection.
14
First Empire Securities, Inc.(800) 645-5424 www.1empire.com
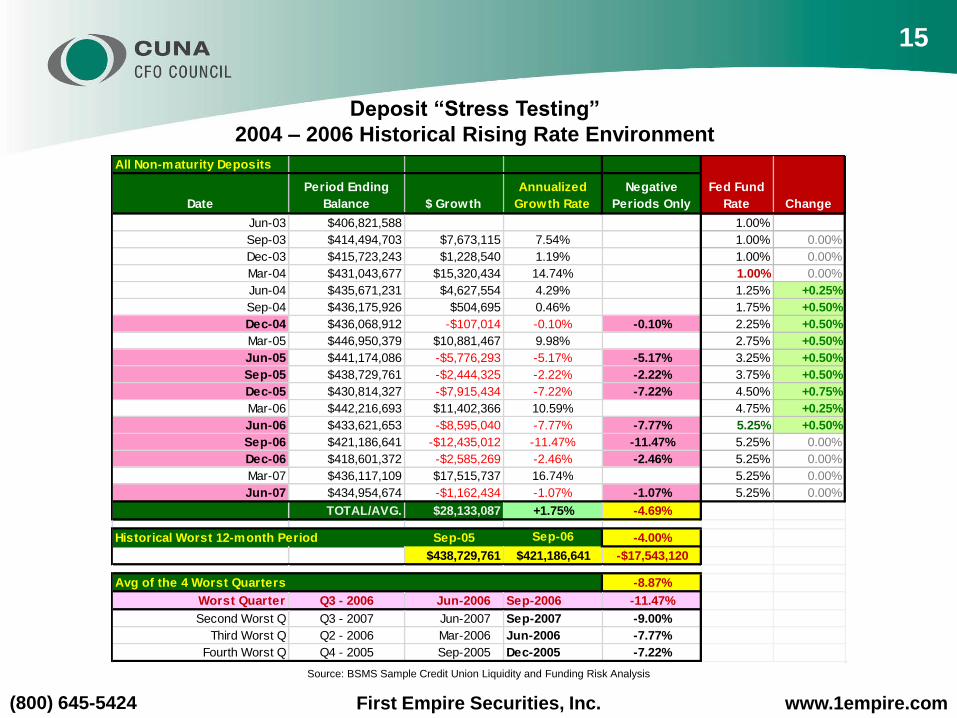
All Non-maturity Deposits
Date
Period Ending
Balance $ Growth
Annualized
Growth Rate
Negative
Periods Only
Fed Fund
Rate Change
Jun-03 $406,821,588 1.00%
Sep-03 $414,494,703 $7,673,115 7.54% 1.00% 0.00%
Dec-03 $415,723,243 $1,228,540 1.19% 1.00% 0.00%
Mar-04 $431,043,677 $15,320,434 14.74% 1.00% 0.00%
Jun-04 $435,671,231 $4,627,554 4.29% 1.25% +0.25%
Sep-04 $436,175,926 $504,695 0.46% 1.75% +0.50%
Dec-04 $436,068,912 -$107,014 -0.10% -0.10% 2.25% +0.50%
Mar-05 $446,950,379 $10,881,467 9.98% 2.75% +0.50%
Jun-05 $441,174,086 -$5,776,293 -5.17% -5.17% 3.25% +0.50%
Sep-05 $438,729,761 -$2,444,325 -2.22% -2.22% 3.75% +0.50%
Dec-05 $430,814,327 -$7,915,434 -7.22% -7.22% 4.50% +0.75%
Mar-06 $442,216,693 $11,402,366 10.59% 4.75% +0.25%
Jun-06 $433,621,653 -$8,595,040 -7.77% -7.77% 5.25% +0.50%
Sep-06 $421,186,641 -$12,435,012 -11.47% -11.47% 5.25% 0.00%
Dec-06 $418,601,372 -$2,585,269 -2.46% -2.46% 5.25% 0.00%
Mar-07 $436,117,109 $17,515,737 16.74% 5.25% 0.00%
Jun-07 $434,954,674 -$1,162,434 -1.07% -1.07% 5.25% 0.00%
TOTAL/AVG. $28,133,087 +1.75% -4.69%
Historical Worst 12-month Period Sep-05 Sep-06 -4.00%
$438,729,761 $421,186,641 -$17,543,120
Avg of the 4 Worst Quarters -8.87%
Worst Quarter Q3 - 2006 Jun-2006 Sep-2006 -11.47%
Second Worst Q Q3 - 2007 Jun-2007 Sep-2007 -9.00%
Third Worst Q Q2 - 2006 Mar-2006 Jun-2006 -7.77%
Fourth Worst Q Q4 - 2005 Sep-2005 Dec-2005 -7.22%
Source: BSMS Sample Credit Union Liquidity and Funding Risk Analysis
Deposit “Stress Testing”
2004 – 2006 Historical Rising Rate Environment
15
First Empire Securities, Inc.(800) 645-5424 www.1empire.com
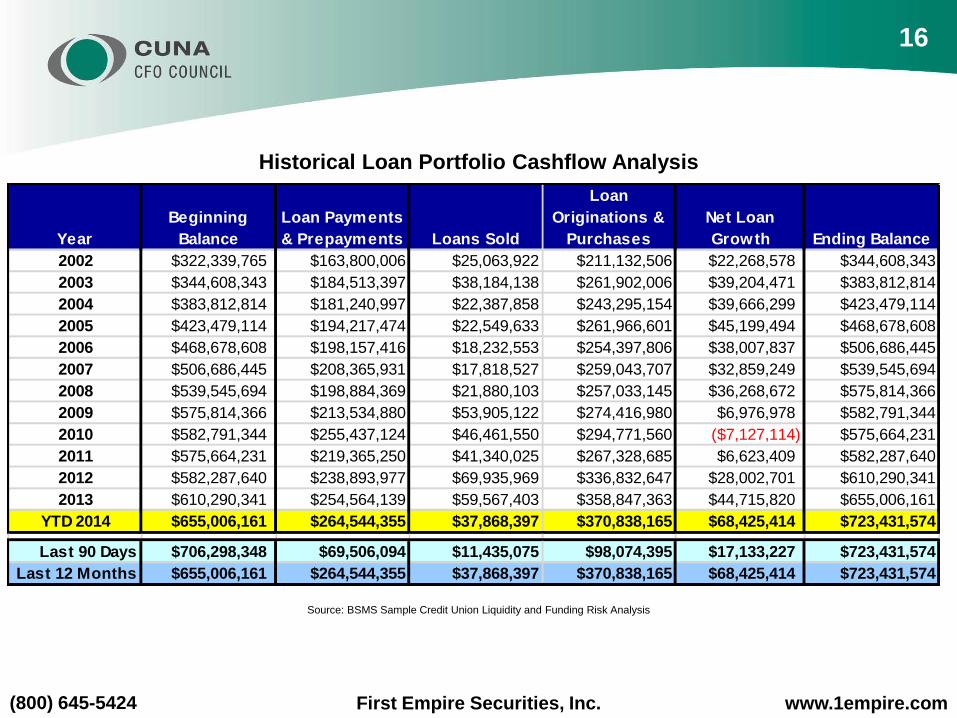
Year
Beginning
Balance
Loan Payments
& Prepayments Loans Sold
Loan
Originations &
Purchases
Net Loan
Growth Ending Balance
2002 $322,339,765 $163,800,006 $25,063,922 $211,132,506 $22,268,578 $344,608,343
2003 $344,608,343 $184,513,397 $38,184,138 $261,902,006 $39,204,471 $383,812,814
2004 $383,812,814 $181,240,997 $22,387,858 $243,295,154 $39,666,299 $423,479,114
2005 $423,479,114 $194,217,474 $22,549,633 $261,966,601 $45,199,494 $468,678,608
2006 $468,678,608 $198,157,416 $18,232,553 $254,397,806 $38,007,837 $506,686,445
2007 $506,686,445 $208,365,931 $17,818,527 $259,043,707 $32,859,249 $539,545,694
2008 $539,545,694 $198,884,369 $21,880,103 $257,033,145 $36,268,672 $575,814,366
2009 $575,814,366 $213,534,880 $53,905,122 $274,416,980 $6,976,978 $582,791,344
2010 $582,791,344 $255,437,124 $46,461,550 $294,771,560 ($7,127,114) $575,664,231
2011 $575,664,231 $219,365,250 $41,340,025 $267,328,685 $6,623,409 $582,287,640
2012 $582,287,640 $238,893,977 $69,935,969 $336,832,647 $28,002,701 $610,290,341
2013 $610,290,341 $254,564,139 $59,567,403 $358,847,363 $44,715,820 $655,006,161
YTD 2014 $655,006,161 $264,544,355 $37,868,397 $370,838,165 $68,425,414 $723,431,574
Last 90 Days $706,298,348 $69,506,094 $11,435,075 $98,074,395 $17,133,227 $723,431,574
Last 12 Months $655,006,161 $264,544,355 $37,868,397 $370,838,165 $68,425,414 $723,431,574
Source: BSMS Sample Credit Union Liquidity and Funding Risk Analysis
Historical Loan Portfolio Cashflow Analysis
16
First Empire Securities, Inc.(800) 645-5424 www.1empire.com
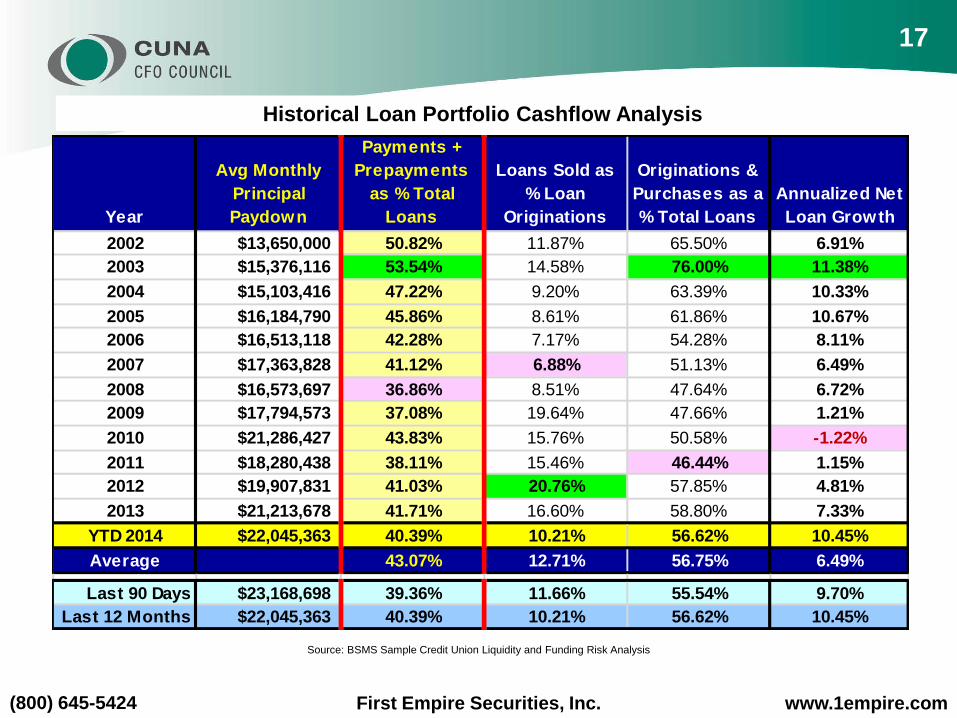
Year
Avg Monthly
Principal
Paydown
Payments +
Prepayments
as % Total
Loans
Loans Sold as
% Loan
Originations
Originations &
Purchases as a
% Total Loans
Annualized Net
Loan Growth
2002 $13,650,000 50.82% 11.87% 65.50% 6.91%
2003 $15,376,116 53.54% 14.58% 76.00% 11.38%
2004 $15,103,416 47.22% 9.20% 63.39% 10.33%
2005 $16,184,790 45.86% 8.61% 61.86% 10.67%
2006 $16,513,118 42.28% 7.17% 54.28% 8.11%
2007 $17,363,828 41.12% 6.88% 51.13% 6.49%
2008 $16,573,697 36.86% 8.51% 47.64% 6.72%
2009 $17,794,573 37.08% 19.64% 47.66% 1.21%
2010 $21,286,427 43.83% 15.76% 50.58% -1.22%
2011 $18,280,438 38.11% 15.46% 46.44% 1.15%
2012 $19,907,831 41.03% 20.76% 57.85% 4.81%
2013 $21,213,678 41.71% 16.60% 58.80% 7.33%
YTD 2014 $22,045,363 40.39% 10.21% 56.62% 10.45%
Average 43.07% 12.71% 56.75% 6.49%
Last 90 Days $23,168,698 39.36% 11.66% 55.54% 9.70%
Last 12 Months $22,045,363 40.39% 10.21% 56.62% 10.45%
Source: BSMS Sample Credit Union Liquidity and Funding Risk Analysis
Historical Loan Portfolio Cashflow Analysis
17

First Empire Securities, Inc.(800) 645-5424 www.1empire.com
Scenario Yr 1 Yr 2 Yr 3 Yr 4 Yr 5 Yr 6 Yr 7 Yr 8 Yr 9 Yr 10
+300bps Shock $51,696 $55,821 $55,071 $42,781 $31,738 $22,526 $20,042 $22,905 $20,120 $20,620
Flat Rate $74,757 $59,521 $43,367 $33,951 $25,202 $17,896 $14,814 $12,542 $10,171 $8,283
-300bps Shock $116,769 $63,166 $41,541 $28,035 $16,884 $9,020 $6,575 $5,089 $3,801 $2,999
$0
$20,000
$40,000
$60,000
$80,000
$100,000
$120,000
$140,000
Yr 1 Yr 2 Yr 3 Yr 4 Yr 5 Yr 6 Yr 7 Yr 8 Yr 9 Yr 10
+300bps Shock Flat Rate -300bps Shock
Source: BSMS Sample Credit Union Liquidity and Funding Risk Analysis
Investment Cashflow Forecast and Rate-Shocks
18
First Empire Securities, Inc.(800) 645-5424 www.1empire.com
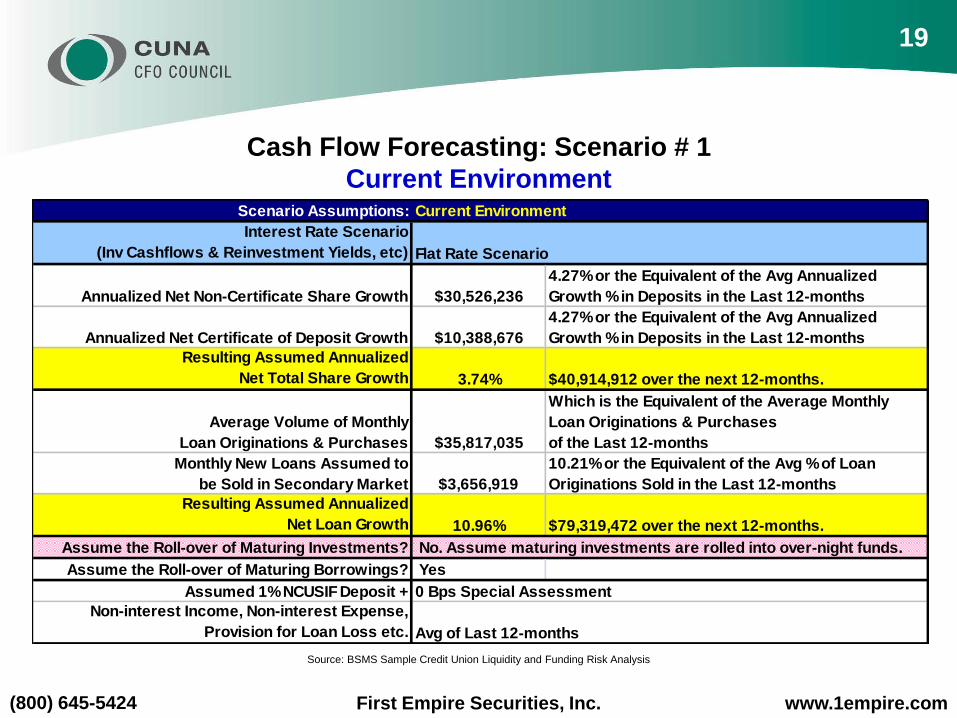
Cash Flow Forecasting: Scenario # 1
Current EnvironmentScenario Assumptions: Current Environment
Interest Rate Scenario
(Inv Cashflows & Reinvestment Yields, etc) Flat Rate Scenario
Annualized Net Non-Certificate Share Growth $30,526,236
4.27% or the Equivalent of the Avg Annualized
Growth % in Deposits in the Last 12-months
Annualized Net Certificate of Deposit Growth $10,388,676
4.27% or the Equivalent of the Avg Annualized
Growth % in Deposits in the Last 12-months
Resulting Assumed Annualized
Net Total Share Growth 3.74% $40,914,912 over the next 12-months.
Average Volume of Monthly
Loan Originations & Purchases $35,817,035
Which is the Equivalent of the Average Monthly
Loan Originations & Purchases
of the Last 12-months
Monthly New Loans Assumed to
be Sold in Secondary Market $3,656,919
10.21% or the Equivalent of the Avg % of Loan
Originations Sold in the Last 12-months
Resulting Assumed Annualized
Net Loan Growth 10.96% $79,319,472 over the next 12-months.
Assume the Roll-over of Maturing Investments? No. Assume maturing investments are rolled into over-night funds.
Assume the Roll-over of Maturing Borrowings? Yes
Assumed 1% NCUSIF Deposit + 0 Bps Special Assessment
Non-interest Income, Non-interest Expense,
Provision for Loan Loss etc. Avg of Last 12-months
Source: BSMS Sample Credit Union Liquidity and Funding Risk Analysis
19
First Empire Securities, Inc.(800) 645-5424 www.1empire.com
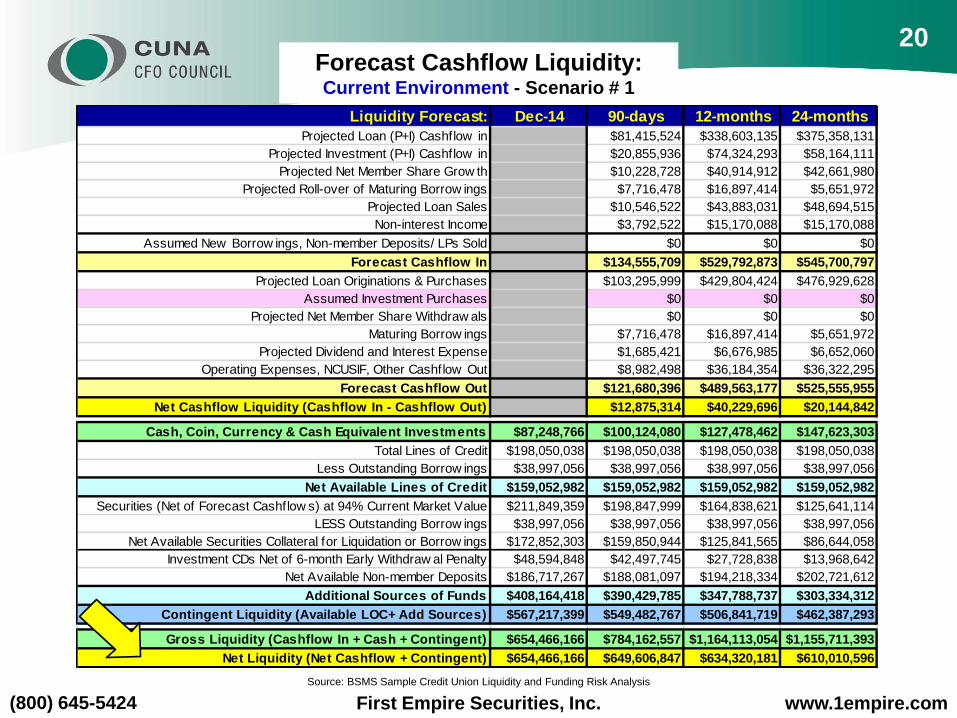
Liquidity Forecast: Dec-14 90-days 12-months 24-months
Projected Loan (P+I) Cashflow in $81,415,524 $338,603,135 $375,358,131
Projected Investment (P+I) Cashflow in $20,855,936 $74,324,293 $58,164,111
Projected Net Member Share Grow th $10,228,728 $40,914,912 $42,661,980
Projected Roll-over of Maturing Borrow ings $7,716,478 $16,897,414 $5,651,972
Projected Loan Sales $10,546,522 $43,883,031 $48,694,515
Non-interest Income $3,792,522 $15,170,088 $15,170,088
Assumed New Borrow ings, Non-member Deposits/ LPs Sold $0 $0 $0
Forecast Cashflow In $134,555,709 $529,792,873 $545,700,797
Projected Loan Originations & Purchases $103,295,999 $429,804,424 $476,929,628
Assumed Investment Purchases $0 $0 $0
Projected Net Member Share Withdraw als $0 $0 $0
Maturing Borrow ings $7,716,478 $16,897,414 $5,651,972
Projected Dividend and Interest Expense $1,685,421 $6,676,985 $6,652,060
Operating Expenses, NCUSIF, Other Cashflow Out $8,982,498 $36,184,354 $36,322,295
Forecast Cashflow Out $121,680,396 $489,563,177 $525,555,955
Net Cashflow Liquidity (Cashflow In - Cashflow Out) $12,875,314 $40,229,696 $20,144,842
Cash, Coin, Currency & Cash Equivalent Investments $87,248,766 $100,124,080 $127,478,462 $147,623,303
Total Lines of Credit $198,050,038 $198,050,038 $198,050,038 $198,050,038
Less Outstanding Borrow ings $38,997,056 $38,997,056 $38,997,056 $38,997,056
Net Available Lines of Credit $159,052,982 $159,052,982 $159,052,982 $159,052,982
Securities (Net of Forecast Cashflow s) at 94% Current Market Value $211,849,359 $198,847,999 $164,838,621 $125,641,114
LESS Outstanding Borrow ings $38,997,056 $38,997,056 $38,997,056 $38,997,056
Net Available Securities Collateral for Liquidation or Borrow ings $172,852,303 $159,850,944 $125,841,565 $86,644,058
Investment CDs Net of 6-month Early Withdraw al Penalty $48,594,848 $42,497,745 $27,728,838 $13,968,642
Net Available Non-member Deposits $186,717,267 $188,081,097 $194,218,334 $202,721,612
Additional Sources of Funds $408,164,418 $390,429,785 $347,788,737 $303,334,312
Contingent Liquidity (Available LOC+ Add Sources) $567,217,399 $549,482,767 $506,841,719 $462,387,293
Gross Liquidity (Cashflow In + Cash + Contingent) $654,466,166 $784,162,557 $1,164,113,054 $1,155,711,393
Net Liquidity (Net Cashflow + Contingent) $654,466,166 $649,606,847 $634,320,181 $610,010,596
Forecast Cashflow Liquidity: Current Environment - Scenario # 1
Source: BSMS Sample Credit Union Liquidity and Funding Risk Analysis
20

First Empire Securities, Inc.(800) 645-5424 www.1empire.com
Liquidity Ratios: Dec-14 90-days 12-months 24-months
Forecast Cashflow In as % Total Assets 11.72% 44.69% 44.04%
Forecast Cashflows Out as % Total Assets 10.60% 41.29% 42.42%
Net Cashflow Liquidity % Total Assets 1.12% 3.39% 1.63%
Cash & Cash Equivalents as % of Total Assets 7.68% 8.72% 10.75% 11.91%
Available Lines of Credit as % Total Assets 14.00% 13.85% 13.42% 12.84%
Additional Sources of Funds as % Total Assets 35.93% 34.00% 29.34% 24.48%
Total Contingent Liquidity as % of Total Assets 49.93% 47.85% 42.75% 37.32%
Gross Liquidity as % of Total Assets 57.61% 68.29% 98.19% 93.28%
Net Liquidity as % of Total Assets 57.61% 56.57% 53.51% 49.23%
Source: BSMS Sample Credit Union Liquidity and Funding Risk Analysis
Forecast Cashflow – Scenario # 1
Current Environment: Liquidity Ratios
21
First Empire Securities, Inc.(800) 645-5424 www.1empire.com
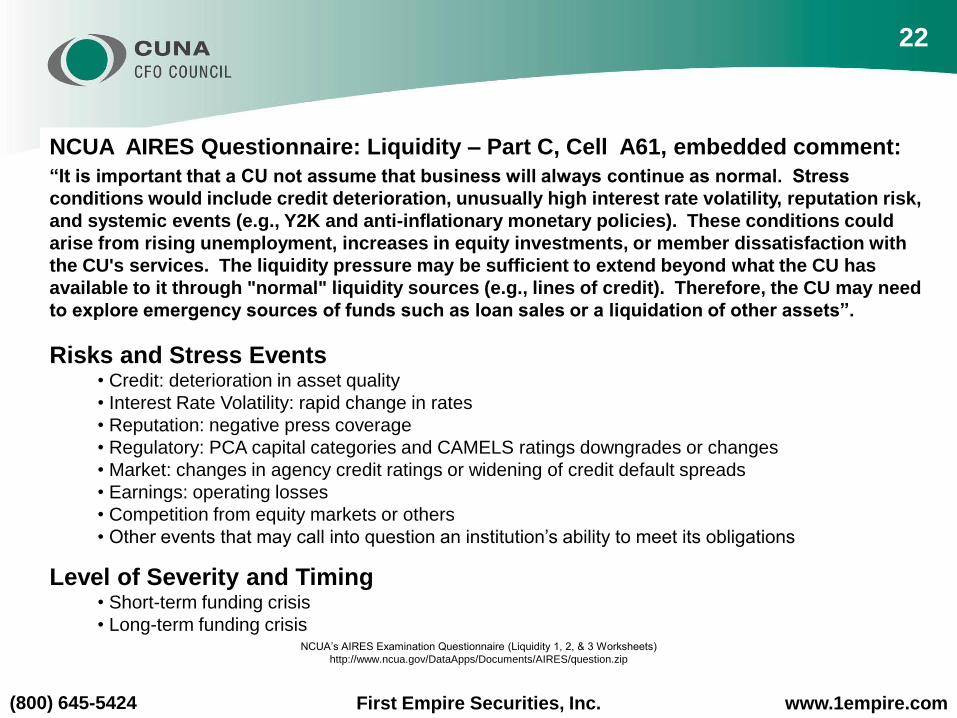
NCUA AIRES Questionnaire: Liquidity – Part C, Cell A61, embedded comment:
“It is important that a CU not assume that business will always continue as normal. Stress
conditions would include credit deterioration, unusually high interest rate volatility, reputation risk,
and systemic events (e.g., Y2K and anti-inflationary monetary policies). These conditions could
arise from rising unemployment, increases in equity investments, or member dissatisfaction with
the CU's services. The liquidity pressure may be sufficient to extend beyond what the CU has
available to it through "normal" liquidity sources (e.g., lines of credit). Therefore, the CU may need
to explore emergency sources of funds such as loan sales or a liquidation of other assets”.
Risks and Stress Events• Credit: deterioration in asset quality
• Interest Rate Volatility: rapid change in rates
• Reputation: negative press coverage
• Regulatory: PCA capital categories and CAMELS ratings downgrades or changes
• Market: changes in agency credit ratings or widening of credit default spreads
• Earnings: operating losses
• Competition from equity markets or others
• Other events that may call into question an institution’s ability to meet its obligations
Level of Severity and Timing• Short-term funding crisis
• Long-term funding crisisNCUA’s AIRES Examination Questionnaire (Liquidity 1, 2, & 3 Worksheets)
http://www.ncua.gov/DataApps/Documents/AIRES/question.zip
22
“It is important that a CU not assume that business will always continue as normal. Stress
conditions would include credit deterioration, unusually high interest rate volatility, reputation risk,
and systemic events (e.g., Y2K and anti-inflationary monetary policies). These conditions could
arise from rising unemployment, increases in equity investments, or member dissatisfaction with
the CU's services. The liquidity pressure may be sufficient to extend beyond what the CU has
available to it through "normal" liquidity sources (e.g., lines of credit). Therefore, the CU may need
to explore emergency sources of funds such as loan sales or a liquidation of other assets”.
Risks and Stress Events• Credit: deterioration in asset quality
• Interest Rate Volatility: rapid change in rates
• Reputation: negative press coverage
• Regulatory: PCA capital categories and CAMELS ratings downgrades or changes
• Market: changes in agency credit ratings or widening of credit default spreads
• Earnings: operating losses
• Competition from equity markets or others
• Other events that may call into question an institution’s ability to meet its obligations
Level of Severity and Timing• Short-term funding crisis
• Long-term funding crisis
First Empire Securities, Inc.(800) 645-5424 www.1empire.com
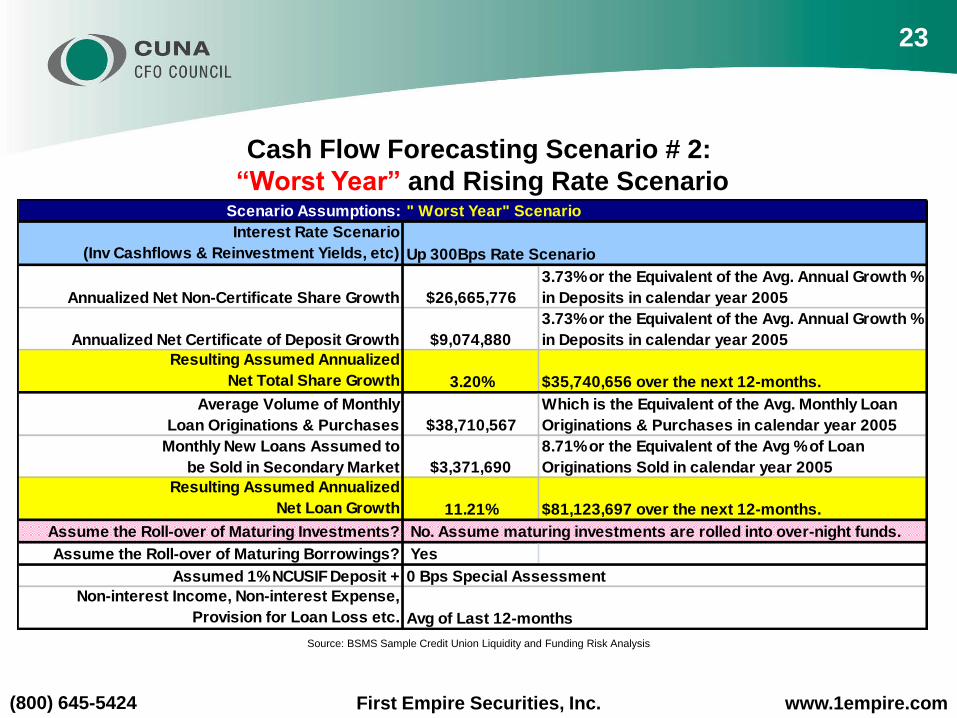
Cash Flow Forecasting Scenario # 2:
“Worst Year” and Rising Rate ScenarioScenario Assumptions: " Worst Year" Scenario
Interest Rate Scenario
(Inv Cashflows & Reinvestment Yields, etc) Up 300Bps Rate Scenario
Annualized Net Non-Certificate Share Growth $26,665,776
3.73% or the Equivalent of the Avg. Annual Growth %
in Deposits in calendar year 2005
Annualized Net Certificate of Deposit Growth $9,074,880
3.73% or the Equivalent of the Avg. Annual Growth %
in Deposits in calendar year 2005
Resulting Assumed Annualized
Net Total Share Growth 3.20% $35,740,656 over the next 12-months.
Average Volume of Monthly
Loan Originations & Purchases $38,710,567
Which is the Equivalent of the Avg. Monthly Loan
Originations & Purchases in calendar year 2005
Monthly New Loans Assumed to
be Sold in Secondary Market $3,371,690
8.71% or the Equivalent of the Avg % of Loan
Originations Sold in calendar year 2005
Resulting Assumed Annualized
Net Loan Growth 11.21% $81,123,697 over the next 12-months.
Assume the Roll-over of Maturing Investments? No. Assume maturing investments are rolled into over-night funds.
Assume the Roll-over of Maturing Borrowings? Yes
Assumed 1% NCUSIF Deposit + 0 Bps Special Assessment
Non-interest Income, Non-interest Expense,
Provision for Loan Loss etc. Avg of Last 12-months
Source: BSMS Sample Credit Union Liquidity and Funding Risk Analysis
23
First Empire Securities, Inc.(800) 645-5424 www.1empire.com
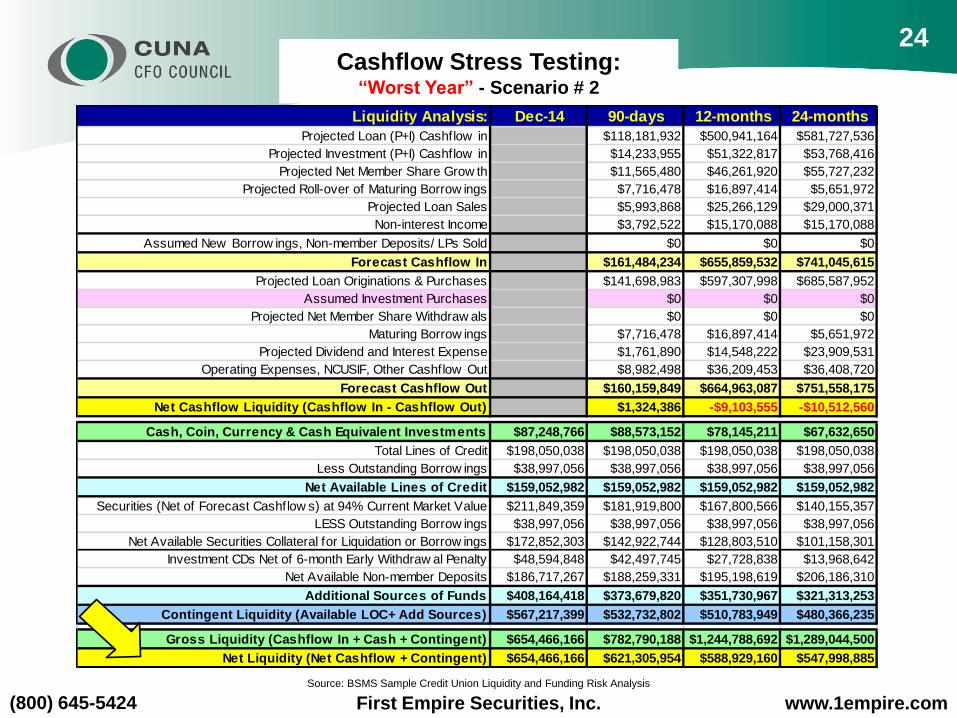
Source: BSMS Sample Credit Union Liquidity and Funding Risk Analysis
Cashflow Stress Testing:“Worst Year” - Scenario # 2
Liquidity Analysis: Dec-14 90-days 12-months 24-months
Projected Loan (P+I) Cashflow in $118,181,932 $500,941,164 $581,727,536
Projected Investment (P+I) Cashflow in $14,233,955 $51,322,817 $53,768,416
Projected Net Member Share Grow th $11,565,480 $46,261,920 $55,727,232
Projected Roll-over of Maturing Borrow ings $7,716,478 $16,897,414 $5,651,972
Projected Loan Sales $5,993,868 $25,266,129 $29,000,371
Non-interest Income $3,792,522 $15,170,088 $15,170,088
Assumed New Borrow ings, Non-member Deposits/ LPs Sold $0 $0 $0
Forecast Cashflow In $161,484,234 $655,859,532 $741,045,615
Projected Loan Originations & Purchases $141,698,983 $597,307,998 $685,587,952
Assumed Investment Purchases $0 $0 $0
Projected Net Member Share Withdraw als $0 $0 $0
Maturing Borrow ings $7,716,478 $16,897,414 $5,651,972
Projected Dividend and Interest Expense $1,761,890 $14,548,222 $23,909,531
Operating Expenses, NCUSIF, Other Cashflow Out $8,982,498 $36,209,453 $36,408,720
Forecast Cashflow Out $160,159,849 $664,963,087 $751,558,175
Net Cashflow Liquidity (Cashflow In - Cashflow Out) $1,324,386 -$9,103,555 -$10,512,560
Cash, Coin, Currency & Cash Equivalent Investments $87,248,766 $88,573,152 $78,145,211 $67,632,650
Total Lines of Credit $198,050,038 $198,050,038 $198,050,038 $198,050,038
Less Outstanding Borrow ings $38,997,056 $38,997,056 $38,997,056 $38,997,056
Net Available Lines of Credit $159,052,982 $159,052,982 $159,052,982 $159,052,982
Securities (Net of Forecast Cashflow s) at 94% Current Market Value $211,849,359 $181,919,800 $167,800,566 $140,155,357
LESS Outstanding Borrow ings $38,997,056 $38,997,056 $38,997,056 $38,997,056
Net Available Securities Collateral for Liquidation or Borrow ings $172,852,303 $142,922,744 $128,803,510 $101,158,301
Investment CDs Net of 6-month Early Withdraw al Penalty $48,594,848 $42,497,745 $27,728,838 $13,968,642
Net Available Non-member Deposits $186,717,267 $188,259,331 $195,198,619 $206,186,310
Additional Sources of Funds $408,164,418 $373,679,820 $351,730,967 $321,313,253
Contingent Liquidity (Available LOC+ Add Sources) $567,217,399 $532,732,802 $510,783,949 $480,366,235
Gross Liquidity (Cashflow In + Cash + Contingent) $654,466,166 $782,790,188 $1,244,788,692 $1,289,044,500
Net Liquidity (Net Cashflow + Contingent) $654,466,166 $621,305,954 $588,929,160 $547,998,885
24
First Empire Securities, Inc.(800) 645-5424 www.1empire.com
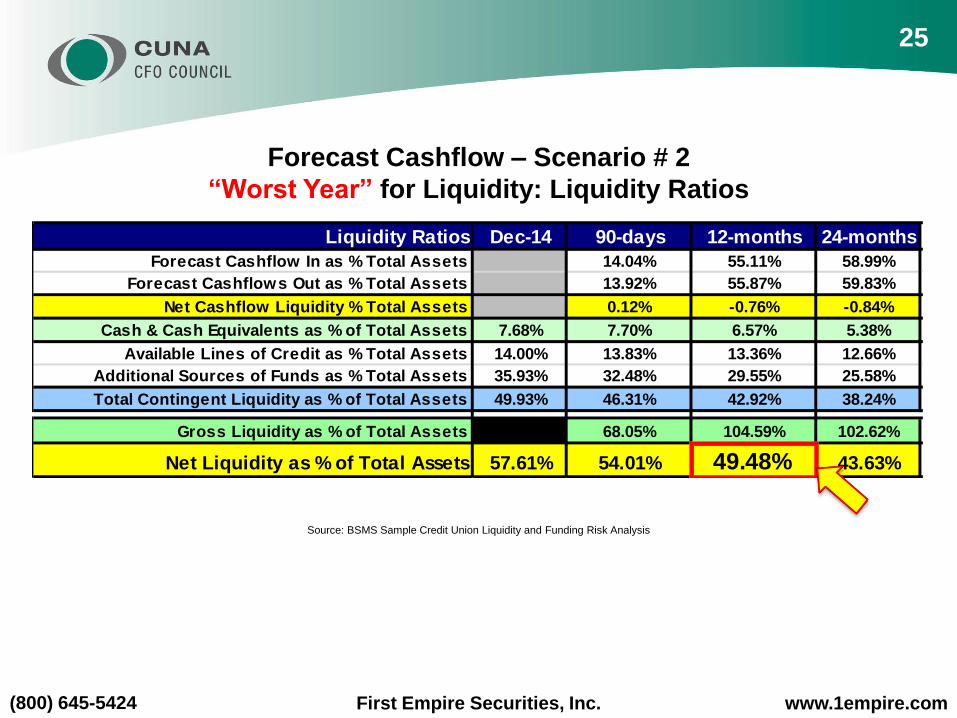
Liquidity Ratios Dec-14 90-days 12-months 24-months
Forecast Cashflow In as % Total Assets 14.04% 55.11% 58.99%
Forecast Cashflows Out as % Total Assets 13.92% 55.87% 59.83%
Net Cashflow Liquidity % Total Assets 0.12% -0.76% -0.84%
Cash & Cash Equivalents as % of Total Assets 7.68% 7.70% 6.57% 5.38%
Available Lines of Credit as % Total Assets 14.00% 13.83% 13.36% 12.66%
Additional Sources of Funds as % Total Assets 35.93% 32.48% 29.55% 25.58%
Total Contingent Liquidity as % of Total Assets 49.93% 46.31% 42.92% 38.24%
Gross Liquidity as % of Total Assets 57.61% 68.05% 104.59% 102.62%
Net Liquidity as % of Total Assets 57.61% 54.01% 49.48% 43.63%
Source: BSMS Sample Credit Union Liquidity and Funding Risk Analysis
Forecast Cashflow – Scenario # 2
“Worst Year” for Liquidity: Liquidity Ratios
25
First Empire Securities, Inc.(800) 645-5424 www.1empire.com
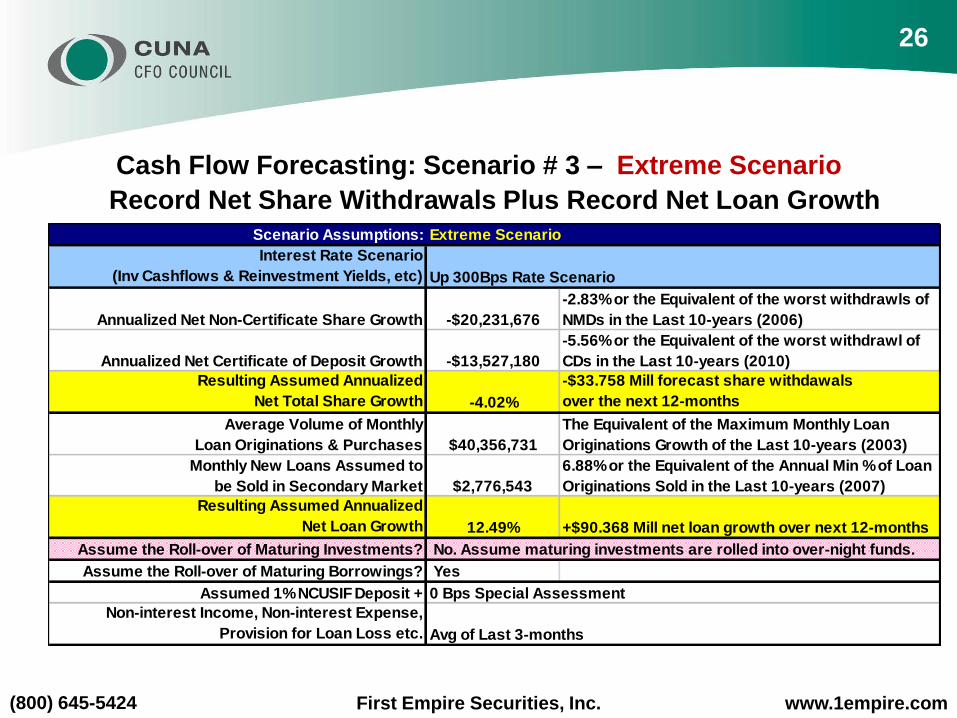
Cash Flow Forecasting: Scenario # 3 – Extreme Scenario
Scenario Assumptions: Extreme Scenario
Interest Rate Scenario
(Inv Cashflows & Reinvestment Yields, etc) Up 300Bps Rate Scenario
Annualized Net Non-Certificate Share Growth -$20,231,676
-2.83% or the Equivalent of the worst withdrawls of
NMDs in the Last 10-years (2006)
Annualized Net Certificate of Deposit Growth -$13,527,180
-5.56% or the Equivalent of the worst withdrawl of
CDs in the Last 10-years (2010)
Resulting Assumed Annualized
Net Total Share Growth -4.02%
-$33.758 Mill forecast share withdawals
over the next 12-months
Average Volume of Monthly
Loan Originations & Purchases $40,356,731
The Equivalent of the Maximum Monthly Loan
Originations Growth of the Last 10-years (2003)
Monthly New Loans Assumed to
be Sold in Secondary Market $2,776,543
6.88% or the Equivalent of the Annual Min % of Loan
Originations Sold in the Last 10-years (2007)
Resulting Assumed Annualized
Net Loan Growth 12.49% +$90.368 Mill net loan growth over next 12-months
Assume the Roll-over of Maturing Investments? No. Assume maturing investments are rolled into over-night funds.
Assume the Roll-over of Maturing Borrowings? Yes
Assumed 1% NCUSIF Deposit + 0 Bps Special Assessment
Non-interest Income, Non-interest Expense,
Provision for Loan Loss etc. Avg of Last 3-months
26
Record Net Share Withdrawals Plus Record Net Loan Growth
First Empire Securities, Inc.(800) 645-5424 www.1empire.com
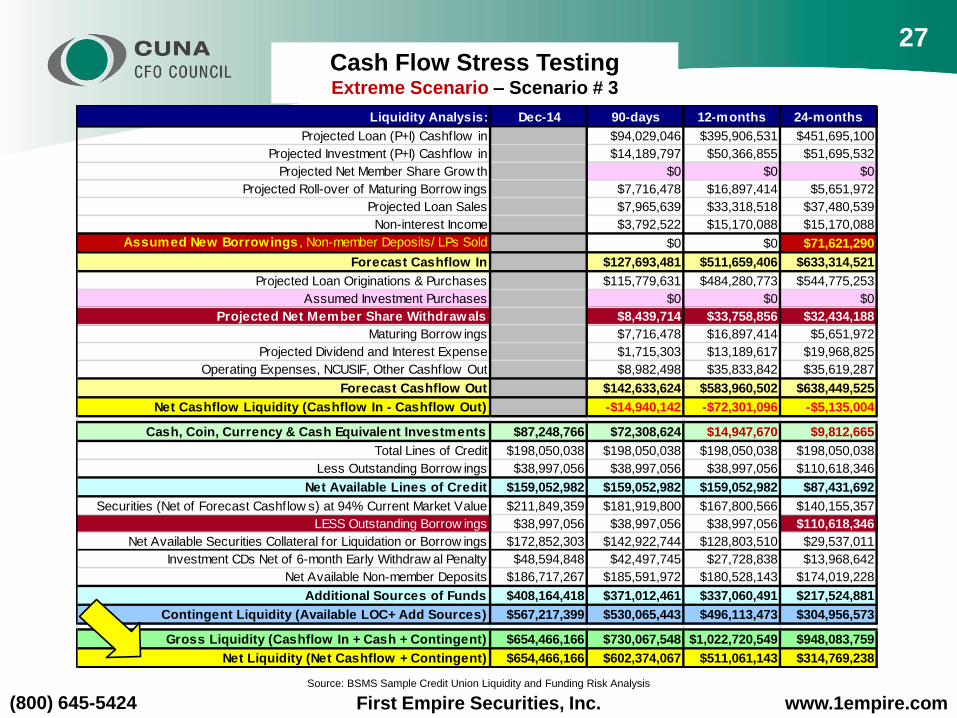
Cash Flow Stress Testing Extreme Scenario – Scenario # 3
Source: BSMS Sample Credit Union Liquidity and Funding Risk Analysis
Liquidity Analysis: Dec-14 90-days 12-months 24-months
Projected Loan (P+I) Cashflow in $94,029,046 $395,906,531 $451,695,100
Projected Investment (P+I) Cashflow in $14,189,797 $50,366,855 $51,695,532
Projected Net Member Share Grow th $0 $0 $0
Projected Roll-over of Maturing Borrow ings $7,716,478 $16,897,414 $5,651,972
Projected Loan Sales $7,965,639 $33,318,518 $37,480,539
Non-interest Income $3,792,522 $15,170,088 $15,170,088
Assumed New Borrowings , Non-member Deposits/ LPs Sold $0 $0 $71,621,290
Forecast Cashflow In $127,693,481 $511,659,406 $633,314,521
Projected Loan Originations & Purchases $115,779,631 $484,280,773 $544,775,253
Assumed Investment Purchases $0 $0 $0
Projected Net Member Share Withdrawals $8,439,714 $33,758,856 $32,434,188
Maturing Borrow ings $7,716,478 $16,897,414 $5,651,972
Projected Dividend and Interest Expense $1,715,303 $13,189,617 $19,968,825
Operating Expenses, NCUSIF, Other Cashflow Out $8,982,498 $35,833,842 $35,619,287
Forecast Cashflow Out $142,633,624 $583,960,502 $638,449,525
Net Cashflow Liquidity (Cashflow In - Cashflow Out) -$14,940,142 -$72,301,096 -$5,135,004
Cash, Coin, Currency & Cash Equivalent Investments $87,248,766 $72,308,624 $14,947,670 $9,812,665
Total Lines of Credit $198,050,038 $198,050,038 $198,050,038 $198,050,038
Less Outstanding Borrow ings $38,997,056 $38,997,056 $38,997,056 $110,618,346
Net Available Lines of Credit $159,052,982 $159,052,982 $159,052,982 $87,431,692
Securities (Net of Forecast Cashflow s) at 94% Current Market Value $211,849,359 $181,919,800 $167,800,566 $140,155,357
LESS Outstanding Borrow ings $38,997,056 $38,997,056 $38,997,056 $110,618,346
Net Available Securities Collateral for Liquidation or Borrow ings $172,852,303 $142,922,744 $128,803,510 $29,537,011
Investment CDs Net of 6-month Early Withdraw al Penalty $48,594,848 $42,497,745 $27,728,838 $13,968,642
Net Available Non-member Deposits $186,717,267 $185,591,972 $180,528,143 $174,019,228
Additional Sources of Funds $408,164,418 $371,012,461 $337,060,491 $217,524,881
Contingent Liquidity (Available LOC+ Add Sources) $567,217,399 $530,065,443 $496,113,473 $304,956,573
Gross Liquidity (Cashflow In + Cash + Contingent) $654,466,166 $730,067,548 $1,022,720,549 $948,083,759
Net Liquidity (Net Cashflow + Contingent) $654,466,166 $602,374,067 $511,061,143 $314,769,238
27

First Empire Securities, Inc.(800) 645-5424 www.1empire.com
Cash Flow Forecasting: Scenario # 3 – Extreme Scenario
Record Net Share Withdrawals Plus Record Net Loan Growth
Liquidity Ratios Dec-14 90-days 12-months 24-months
Forecast Cashflow In as % Total Assets 11.30% 46.09% 54.62%
Forecast Cashflows Out as % Total Assets 12.62% 52.61% 55.06%
Net Cashflow Liquidity % Total Assets -1.32% -6.51% -0.44%
Cash & Cash Equivalents as % of Total Assets 7.68% 6.40% 1.35% 0.85%
Available Lines of Credit as % Total Assets 14.00% 14.07% 14.33% 7.54%
Additional Sources of Funds as % Total Assets 35.93% 32.82% 30.36% 18.76%
Total Contingent Liquidity as % of Total Assets 49.93% 46.90% 44.69% 26.30%
Gross Liquidity as % of Total Assets 57.61% 64.59% 92.13% 81.76%
Net Liquidity as % of Total Assets 57.61% 53.29% 46.04% 27.15%
Source: BSMS Sample Credit Union Liquidity and Funding Risk Analysis
28
First Empire Securities, Inc.(800) 645-5424 www.1empire.com
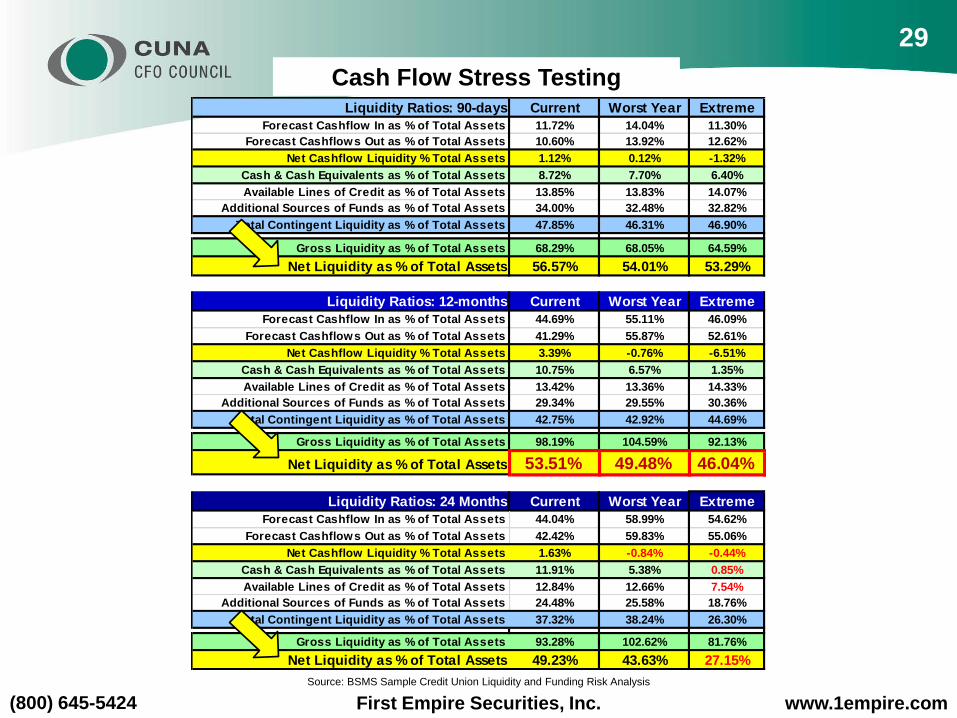
Liquidity Ratios: 90-days Current Worst Year Extreme
Forecast Cashflow In as % of Total Assets 11.72% 14.04% 11.30%
Forecast Cashflows Out as % of Total Assets 10.60% 13.92% 12.62%
Net Cashflow Liquidity % Total Assets 1.12% 0.12% -1.32%
Cash & Cash Equivalents as % of Total Assets 8.72% 7.70% 6.40%
Available Lines of Credit as % of Total Assets 13.85% 13.83% 14.07%
Additional Sources of Funds as % of Total Assets 34.00% 32.48% 32.82%
Total Contingent Liquidity as % of Total Assets 47.85% 46.31% 46.90%
Gross Liquidity as % of Total Assets 68.29% 68.05% 64.59%
Net Liquidity as % of Total Assets 56.57% 54.01% 53.29%
Liquidity Ratios: 12-months Current Worst Year Extreme
Forecast Cashflow In as % of Total Assets 44.69% 55.11% 46.09%
Forecast Cashflows Out as % of Total Assets 41.29% 55.87% 52.61%
Net Cashflow Liquidity % Total Assets 3.39% -0.76% -6.51%
Cash & Cash Equivalents as % of Total Assets 10.75% 6.57% 1.35%
Available Lines of Credit as % of Total Assets 13.42% 13.36% 14.33%
Additional Sources of Funds as % of Total Assets 29.34% 29.55% 30.36%
Total Contingent Liquidity as % of Total Assets 42.75% 42.92% 44.69%
Gross Liquidity as % of Total Assets 98.19% 104.59% 92.13%
Net Liquidity as % of Total Assets 53.51% 49.48% 46.04%
Liquidity Ratios: 24 Months Current Worst Year Extreme
Forecast Cashflow In as % of Total Assets 44.04% 58.99% 54.62%
Forecast Cashflows Out as % of Total Assets 42.42% 59.83% 55.06%
Net Cashflow Liquidity % Total Assets 1.63% -0.84% -0.44%
Cash & Cash Equivalents as % of Total Assets 11.91% 5.38% 0.85%
Available Lines of Credit as % of Total Assets 12.84% 12.66% 7.54%
Additional Sources of Funds as % of Total Assets 24.48% 25.58% 18.76%
Total Contingent Liquidity as % of Total Assets 37.32% 38.24% 26.30%
Gross Liquidity as % of Total Assets 93.28% 102.62% 81.76%
Net Liquidity as % of Total Assets 49.23% 43.63% 27.15%
Source: BSMS Sample Credit Union Liquidity and Funding Risk Analysis
Cash Flow Stress Testing
29
First Empire Securities, Inc.(800) 645-5424 www.1empire.com
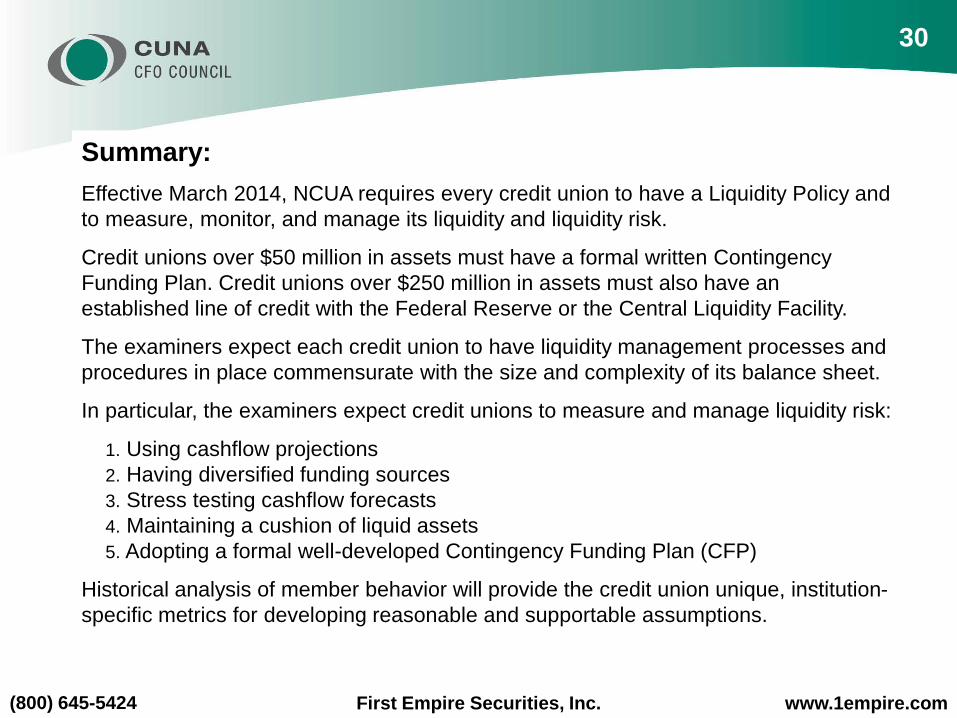
Summary:
Effective March 2014, NCUA requires every credit union to have a Liquidity Policy and
to measure, monitor, and manage its liquidity and liquidity risk.
Credit unions over $50 million in assets must have a formal written Contingency
Funding Plan. Credit unions over $250 million in assets must also have an
established line of credit with the Federal Reserve or the Central Liquidity Facility.
The examiners expect each credit union to have liquidity management processes and
procedures in place commensurate with the size and complexity of its balance sheet.
In particular, the examiners expect credit unions to measure and manage liquidity risk:
1. Using cashflow projections
2. Having diversified funding sources
3. Stress testing cashflow forecasts
4. Maintaining a cushion of liquid assets
5. Adopting a formal well-developed Contingency Funding Plan (CFP)
Historical analysis of member behavior will provide the credit union unique, institution-
specific metrics for developing reasonable and supportable assumptions.
30

First Empire Securities, Inc.(800) 645-5424 www.1empire.com
Thank You!
The information in this document has been obtained from sources we believe to be reliable, however, we do not guarantee it is accurate or
complete. From time to time officers, employees of the firm, or the firm itself holds a position in the securities referred herein, or acts as principal
in transactions referred to herein. Parts of this document are based on assumptions, which we believe to be reasonable and supportable,
however, future events may influence actual performance. The projections contained herein are hypothetical in nature, and do not reflect actual
balance sheet or investment results and are not guarantees of future results. This document is not and should not be construed as an offer or
solicitation of an offer to buy or sell any security or securities. Securities have inherent risk, including credit, prepayment, extension and market
risk. This information is subject to change without notice. Clients of First Empire Securities, Inc. may also be clients of FESI’s affiliated
companies. Affiliated companies may receive compensation or fees from clients and, as a result, the affiliated companies may have conflicted
interests, loyalties and responsibilities. Balance Sheet Management Services, LPC Services and First Empire CD Management are affiliates of
First Empire Securities, Inc. The affiliates are not a member of FINRA/SIPC. First Empire Securities, Inc., is solely a member of FINRA/SIPC.
31


![NCUA SIF Presentation Mar 2014 [Read-Only]](https://img.pdfslide.net/doc/110x75/6251de20917ba076b31e8dc3/ncua-sif-presentation-mar-2014-read-only.jpg)