Embed Size (px)
Citation preview
NBER WORKING PAPER SERIES
EFFECTIVE SCHOOLS:TEACHER HIRING, ASSIGNMENT, DEVELOPMENT, AND RETENTION
Susanna LoebDemetra Kalogrides
Tara Béteille
Working Paper 17177http://www.nber.org/papers/w17177
NATIONAL BUREAU OF ECONOMIC RESEARCH1050 Massachusetts Avenue
Cambridge, MA 02138June 2011
This research was supported by grants from the Hewlett Foundation and the Spencer Foundation. Theviews expressed herein are those of the authors and do not necessarily reflect the views of the NationalBureau of Economic Research.
NBER working papers are circulated for discussion and comment purposes. They have not been peer-reviewed or been subject to the review by the NBER Board of Directors that accompanies officialNBER publications.
© 2011 by Susanna Loeb, Demetra Kalogrides, and Tara Béteille. All rights reserved. Short sectionsof text, not to exceed two paragraphs, may be quoted without explicit permission provided that fullcredit, including © notice, is given to the source.
Effective Schools: Teacher Hiring, Assignment, Development, and RetentionSusanna Loeb, Demetra Kalogrides, and Tara BéteilleNBER Working Paper No. 17177June 2011JEL No. I21
ABSTRACT
The literature on effective schools emphasizes the importance of a quality teaching force in improvingeducational outcomes for students. In this paper, we use value-added methods to examine the relationshipbetween a school’s effectiveness and the recruitment, assignment, development and retention of itsteachers. We ask whether effective schools systematically recruit more effective teachers; whetherthey assign teachers to students more effectively; whether they do a better job of helping their teachersimprove; whether they retain more effective teachers; or whether they do a combination of these processes.Our results reveal four key findings. First, we find that more effective schools are able to attract andhire more effective teachers from other schools when vacancies arise. Second, we find that more effectiveschools assign novice teachers to students in a more equitable fashion. Third, we find that teacherswho work in schools that were more effective at raising achievement in a prior period improve morerapidly in a subsequent period than do those in less effective schools. Finally, we find that more effectiveschools are better able to retain higher-quality teachers, though they are not differentially able to removeineffective teachers. The results point to the importance of personnel, and perhaps, school personnelpractices, for improving student outcomes.
Susanna Loeb524 CERAS, 520 Galvez MallStanford UniversityStanford, CA 94305and [email protected]
Demetra KalogridesStanford University520 Galvez Mall DriveStanford CA, [email protected]
Tara BéteilleWorld BankMSN M9A-0071900 Pennsylvania Avenue, NW Washington, DC [email protected]
3
INTRODUCTION
The literature on effective schools emphasizes the importance of a quality teaching force
in improving educational outcomes for students. The effect of teachers on student achievement is
well established. Quality teachers are one of the most important school-related factors found to
facilitate student learning (Nye, Konstantopoulos, and Hedges 2004; Rockoff 2004). Not all
schools are able to attract and retain the same caliber of teachers (Lankford, Loeb, and Wyckoff
2002). Teacher preferences for student characteristics and school location explain some of the
sorting (Boyd, Lankford, Loeb, and Wyckoff 2005; Hanushek, Kain, and Rivkin 2004; Scafidi,
Sjoquist, and Stinebrickner 2008); however, school personnel practices are also likely to play an
important role. Schools can control the quality of their teaching force through at least three
mechanisms: recruiting quality teachers, strategically retaining quality teachers (and removing
low-quality teachers) and developing the teachers already at their school. In addition, they can
allocate teachers more or less effectively across classrooms. In this paper, we examine the extent
to which more effective schools are better able to recruit, assign, develop, and retain effective
teachers and remove less effective teachers.
To examine the relationship between school effectiveness and teachers’ careers, we use
seven years of administrative data on all district staff and students in one of the largest public
school districts in the United States, Miami-Dade County Public Schools (M-DCPS). From
these data we generate measures of school and teacher value-added and use these two
effectiveness measures to better understand the importance of personnel practices. Our results
reveal four key findings. First, among teachers who switch schools, higher value-added teachers
transfer to schools with higher school-level value-added. Second, we find that more effective
schools provide more equitable class assignments to their novice teachers. Novice teachers in
4
more effective schools receive students with similar average prior achievement to their
colleagues, which is not the case in less effective schools. Third, we find that more effective
schools are better able to develop their teachers’ ability to raise student achievement. Teachers’
value-added improves more between years when they work in schools that were more effective
in a prior period. Fourth and finally, we find that more effective schools are better able to retain
effective teachers. Teachers who are in the top quartile of teacher value-added are substantially
less likely to leave when employed in more effective schools than when employed in less
effective schools. These schools, however, are not differentially better at removing less effective
teachers.
BACKGROUND
Although academic ability and family backgrounds of students are important
determinants of achievement, schools with similar student profiles can vary widely in the
learning gains of their students (Sammons, Hillman, and Mortimore 1995; Willms and
Raudenbush 1989). Quality teachers are one of the most important school-related factors found
to facilitate student learning, and likely explain at least some of the difference in effectiveness
across schools (Aaronson, Barrow, and Sander 2007; Kane, Rockoff, and Staiger 2008; Nye,
Konstantopoulos, and Hedges 2004; Rivkin, Hanushek, and Kain 2005; Rockoff 2004; Sanders
and Rivers 1996). Aaronson, Barrow, and Sander (2007) find that a one standard deviation
improvement in math teacher quality, as measured by the test score gains of their students, raises
students’ math scores by the equivalent of 0.13 grade equivalents per semester. Kane, Rockoff,
and Staiger (2008) find that the difference in effectiveness between the top and bottom quartile
of elementary school teachers leads to a 0.33 standard deviation difference in student test score
5
gains in a school year. For middle school teachers the standard deviation difference is about 0.20
standard deviations (Kane, Rockoff, and Staiger 2008).
Teachers are clearly one of schools’ most important resources. Teachers are not,
however, randomly assigned to schools or students. Schools vary considerably in the types of
teachers they employ. Some of these differences are largely outside of a school’s control and due
to teachers’ preferences for certain types of students or for schools located in certain geographic
areas. Teacher preferences make it easier for some types of schools to attract candidates for open
positions (Boyd, Lankford, Loeb, Ronfeldt, and Wyckoff 2011) and easier for some types of
schools to retain their effective teachers because they are more appealing places to work.
Though the quality of a school’s teaching force is partially driven by teachers’
preferences for certain types of schools, it is also likely to be at least partially the result of school
policies and practices of school leaders. School leaders can control the quality of the teaching
force at their school by hiring high-quality teachers; by strategically retaining good teachers and
removing poor teachers; and by developing the teachers already at their school. Moreover, they
can maximize the effectiveness of their available teachers by assigning them to classes for which
they are best suited and through which provides the most benefit to their school. Schools are
likely to vary in their capacity to engage in each of these personnel practices. We know little
about the extent to which these practices are defining features of effective schools.
A first step in effective personnel practices is an ability to identify strengths and
weaknesses of teachers and teacher candidates. There is evidence that many school leaders can
distinguish highly effective teachers both during the hiring process and from among the teachers
currently employed at their school. While, Rockoff, Jacob, Kane, and Staiger (2008) point out
that information available on candidates at the time of hire may be limited making it difficult for
6
school administrators to recognize a good teacher when they are looking to hire one, (Boyd,
Lankford, Loeb, Ronfeldt, and Wyckoff, forthcoming) find that, on average, school leaders are
able to recognize teacher effectiveness in the hiring process, especially when hiring teachers with
prior teaching experience. There is even stronger evidence that school administrators can identify
differences between the effectiveness of teachers currently working at their school. Jacob and
Lefgren (2008) find that principals can identify the teachers at their school who are most and
least effective at raising student achievement, though they have less ability to distinguish
between teachers in the middle of the quality distribution. Jacob (2010) examines the weight that
school administrators place on a variety of teacher characteristics when deciding which teachers
to dismiss. He finds that principals consider teacher absences, value-added to student
achievement and several demographic characteristics when making dismissal decisions.
Of course, even if school administrators are able to identify their least-effective teachers,
dismissing weak teachers is not always possible, particularly once teachers obtain tenure. Very
few teachers are dismissed from schools, though dismissal rates are higher for less experienced
teachers and may have risen slightly recently. Yet, dismissal is not the only, or even the primary,
way that schools can facilitate the turnover of less effective teachers. Counseling out, less-than-
prime class assignments and the manipulation of other working conditions can all encourage
teachers to leave particular schools, either by prompting them to transfer to other schools or to
leave teaching all together (Balu, Beteille, and Loeb 2010). While these processes are
acknowledged in the research literature, no study that we know of has documented systematic
differences in the differential turnover of high and low quality teachers across schools, which is a
key component of our analyses.
7
Another way that schools can control the average quality of the teachers at their school is
by providing professional development or other avenues to develop the instructional skills of
their teaching staff. Prior research suggests that teachers can improve substantially as they
acquire more experience, particularly in their first few years of teaching(Rockoff 2004).
Developing the skills of the teachers at a school through professional development may be both
the most viable and the most effective option for schools looking to improve the quality of their
teaching force. Teacher development is likely to be an important part of teacher quality in all
schools but may be particularly important in schools serving many low-achieving, poor, and
minority students. These schools often face more difficulty attracting and retaining effective
teachers (Ferguson 1998; Krei 1998; Lankford, Loeb, and Wyckoff 2002).
The process by which teachers are assigned to students is another component of
personnel practices that may distinguish more effective schools from less effective schools.
There is evidence from prior research that, within schools, teachers with certain characteristics
are systematically sorted to lower-achieving and more disadvantaged students than their
colleagues (Clotfelter, Ladd, and Vigdor 2006; Feng 2010; Rothstein 2009). This type of
allocation of teachers to students does not always seem to be done with students’ best interests in
mind (e.g., it is often based on seniority) and is likely to have negative implications for within-
school achievement gaps and for teacher retention (Feng 2010; Kalogrides, Loeb, and Béteille
2011). The processes by which teachers are allocated to students within schools may vary
considerably across schools and, in particular, may happen more equitably in more effective
schools.
In this paper we examine whether there are differences in teacher hiring, assignment,
development and retention in more effective schools compared to less effective schools. We do
8
not attempt to distinguish the part of recruitment and retention that is driven by school personnel
practices from that driven by teacher preferences. Instead we measure the extent to which highly
effective schools attract, assign, develop and retain teachers differently than less effective
schools. If they tend to recruit more effective teachers, but not retain them, then we can
conclude that in the current system recruitment is a more salient factor in determining school
effectiveness. If they retain their good teachers but do not develop them, we can, again conclude
that retention is more of a driving force in effective schooling. If they develop their teachers but
do not differentially assign, we would conclude that unequal assignment of students to new
teachers is not a reflection of less effective schooling. In fact, we find that more effective
schools are better able to hire high-quality teachers, that they allocate their teachers to students
more equitably, that they better develop the teachers already at their school, and that they
differentially retain high-quality teachers, though they do not differentially loose less effective
teachers. In what follows, we first describe the data and methods, then present the results and
conclude with a discussion of the implications of the analyses.
DATA
To examine the role of personnel practices in school effectiveness, we use data from
administrative files on all staff and students in the Miami-Dade County Public Schools (M-
DCPS) district from the 2003-04 through the 2009-10 school years. M-DCPS is the largest
school district in Florida and the fourth largest in the country, trailing only New York City, Los
Angeles Unified, and the City of Chicago School District. In 2008, M-DCPS enrolled almost
352,000 students, more than 200,000 of whom were Hispanic. With more than 350 schools

9
observed over a seven-year time frame, the data provide substantial variation for examining
differences in school and teacher effectiveness.
We use measures of teacher and school effectiveness based on the achievement gains in
math and reading of students at a school or in a teacher’s classroom. The test score data include
math and reading scores from the Florida Comprehensive Assessment Test (FCAT). The FCAT
is given in math and reading to students in grades 3-10. It is also given in writing and science to
a subset of grades, though we use only math and reading tests for this paper. The FCAT includes
criterion referenced tests measuring selected benchmarks from the Sunshine State Standards
(SSS). We standardize students’ test scores to have a mean of zero and a standard deviation of
one within each grade and school-year.
We combine the test score data with demographic information including student race,
gender, free/reduced price lunch eligibility, and whether students are limited English proficient.
We also link students to their teachers via a database that lists the course title, classroom
identifier, and teacher of every course in which a student was enrolled in each year (including
elementary school students who simply have the same teacher and classroom listed for each
subject). We use the classroom identifier to generate classroom measures such as the percent of
minority students, the percent of students receiving free or reduced priced lunches, and average
student achievement in the prior school year. We obtain M-DCPS staff information from a
database that includes demographic measures, prior experience in the district, highest degree
earned, current position, and current school for all district staff.
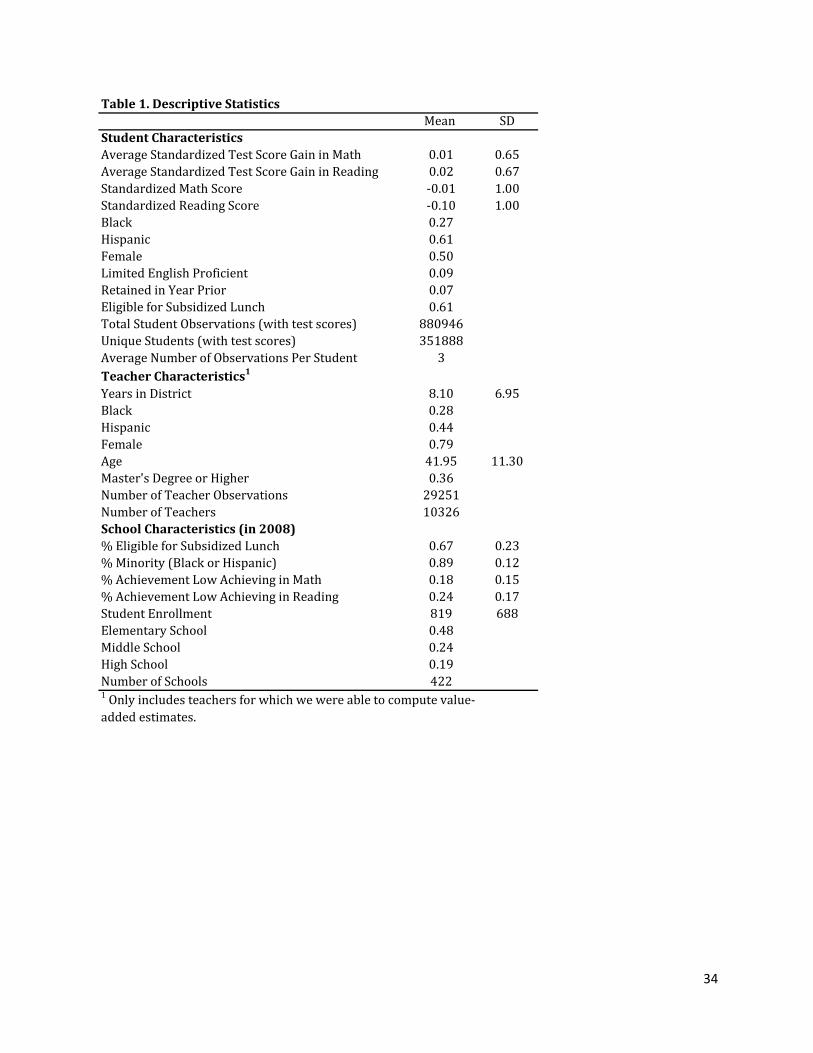
Table 1 lists the means and standard deviations of all variables used in our analyses.
There are 351,888 unique tested students included in our estimation of value-added, each of
whom is included for an average of three years. Nearly 90 percent of students in the district are
10
black or Hispanic and more than 60 percent qualify for free or reduced-price lunches. We were
able to compute value-added estimates for about 10,000 teachers who taught students who were
tested in math and reading. These teachers average approximately eight years of experience in
the district; they are predominantly female (79 percent); and their racial composition is similar to
that of students in that the majority are Hispanic.
METHODS
Estimating Value-Added
The goal of value-added models is to statistically isolate the contribution of schools or
teachers to student outcomes from all other factors that may influence outcomes (Meyer 1997;
Rubin, Stuart, and Zanutto 2004). Isolating causal effects is important given that differences in
student and family characteristics account for more of the variation in student outcomes than
school-related factors (Coleman 1990; Downey, Hippel, and Broh 2004) and that students are not
randomly assigned to teachers or schools (Lankford, Loeb, and Wyckoff 2002; Rothstein 2009).
A student’s achievement level in any given year is a cumulative function of current and
prior school, family, and neighborhood experiences. While researchers seldom have access to
complete information on all factors that would predict a student’s current achievement level
(Rivkin, Hanushek, and Kain 2005), much of the confounding influence of unobserved student
academic and family characteristics can be eliminated by focusing on gains in student
achievement over specific time periods, usually of one school year. The inclusion of prior
achievement as a way of controlling for prior student or family experiences reduces the potential
for unobserved factors to introduce bias in the estimation of teacher or school effectiveness. Yet,
there still may be unobservable differences between students that influence the amount they learn
11
each year in addition to their score at the beginning of the year. Factors such as innate ability,
motivation, familial support for education, or parental education could all have an impact on
student learning gains. We can control for some of these differences by including student-level
covariates in the model; however, the information available in administrative datasets such as
ours is limited. One way of controlling for all observed and unobserved student characteristics
that may be associated with achievement gains is to include a student fixed effect in the value-
added estimation. Such a specification is appealing because it allows for the examination of
differences in learning within the same student in years they are in a class with a different
teacher or in years they are in different schools.
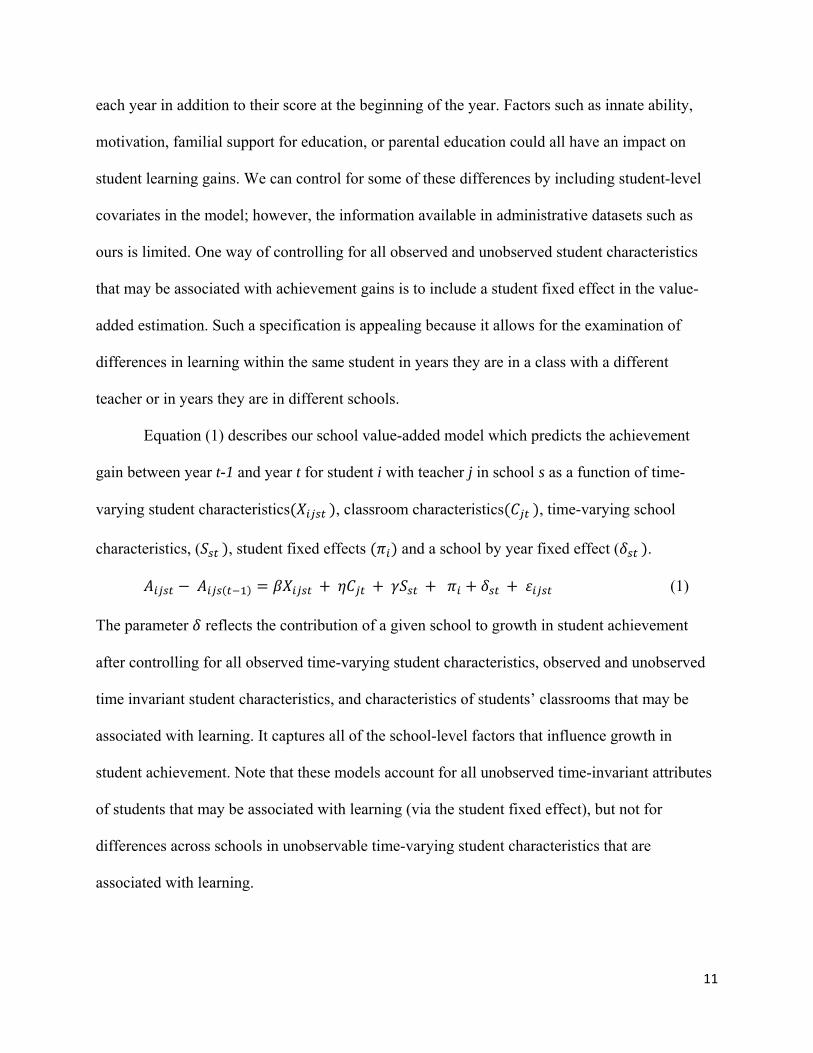
Equation (1) describes our school value-added model which predicts the achievement
gain between year t-1 and year t for student i with teacher j in school s as a function of time-
varying student characteristics , classroom characteristics , time-varying school
characteristics, ( , student fixed effects and a school by year fixed effect ( .
(1)
The parameter reflects the contribution of a given school to growth in student achievement
after controlling for all observed time-varying student characteristics, observed and unobserved
time invariant student characteristics, and characteristics of students’ classrooms that may be
associated with learning. It captures all of the school-level factors that influence growth in
student achievement. Note that these models account for all unobserved time-invariant attributes
of students that may be associated with learning (via the student fixed effect), but not for
differences across schools in unobservable time-varying student characteristics that are
associated with learning.
12
The model in Equation 1 is identified from students who attend multiple schools during
the observation period. Students may attend multiple schools for a variety of reasons including
residential relocation, expulsion, or transfers that result when students transition away from a
school after completing the final offered grade. Since we have seven years of test data and
students are tested in a wide range of grades (3-10), we observe over half of tested students (52
percent) in two or more schools. However, given concerns that this group of students may not be
representative of the full population of tested students, we compare the estimates derived from
Equation 1 with those derived from a similar model that excludes the student fixed effect. Our
school fixed effects estimates from these two specifications correlate quite highly at .84 in math
and .74 in reading. In what follows, we present estimates from models that use the measure of
school value-added that is estimated with the student fixed effect. However, in results not shown
we also estimate all of our models using the measure of school value-added that is estimated
without a student fixed-effect. The results are substantively similar.
We estimate teacher value-added using a similar model as described by Equation 1. We
replace the school by year fixed effect with a teacher by year fixed effect. In the teacher value-
added equation the parameter reflects the contribution of a given teacher to growth in student
achievement each year, conditional on the characteristics described above. In addition to the
specification of teacher value-added with a student fixed effect, we also generate measures of
teacher value-added from models that include a school fixed effect (without a student fixed
effect) and that include neither student nor school fixed effects. In the analysis presented below,
we compare the results using all three measures of teacher value-added.
The test scores used to generate the value-added estimates are the scaled scores from the
FCAT, standardized to have a mean of zero and a standard deviation of one for each grade in

13
each year. Subscripts for subjects are omitted for simplicity but we estimate Equation 1
separately for student achievement gains in math and reading. Since we use a lagged test score
to construct our dependent variables, the youngest tested grade (grade 3) and the first year of
data we have (2003) are omitted from the analyses though their information is used to compute a
learning gain in grade 4 and in 2004. The time-varying student characteristics used in our
analyses are whether the student qualifies for free or reduced priced lunch, whether they are
currently classified as limited English proficient, whether they are repeating the grade in which
they are currently enrolled, and the number of days they missed school in a given year due to
absence or suspension. Student race and gender are absorbed by the student fixed effect but are
included in models that exclude the student fixed effect. The class and school-level controls used
in the models include average prior achievement, proportion black, Hispanic, female, receiving
free or reduced priced lunches, and limited English proficient, and the average number of days
that students in the school/class missed school in the prior year due to absence or suspension.
The school-level controls used in the models include average prior achievement, and proportion
black, Hispanic and receiving free or reduced priced lunches.
After estimating Equation 1 we save the school by year and teacher by year fixed effects
and their corresponding standard errors. The estimated coefficients for these fixed effects include
measurement error as well as real differences in achievement gains associated with teachers or
schools. We therefore shrink the estimates using the empirical Bayes method to bring imprecise
estimates closer to the mean (see Appendix 1). There is greater imprecision in our estimates of
teacher value-added than school value-added since teachers’ class sizes are smaller than the total
school enrollment in a given year. The number of students per teacher varies meaningfully.
Teachers who teach small or few classes tend to have more imprecise estimates since their
14
estimates are based on fewer students. In addition to shrinking the estimates, we limit the sample
to teachers who have at least 10 students in a given year. Shrinking the school fixed effects tends
not to change the estimates very much given large samples in each school but does change the
teacher fixed effects measures somewhat. The correlation between our original school by year
fixed effect estimate and the shrunken estimate is about .99 for both math and reading. The
correlation between our original teacher by year estimate and the shrunken estimate is .84 for
math and .81 for reading for the teacher value-added estimates that include a student fixed effect.
After shrinking the value-added estimates, we standardize them to have a mean of 0 and a
standard deviation of 1 in each year to facilitate interpretation.
Teacher and school value-added as measured by student achievement gains on state tests
are clearly not perfect measures of effectiveness. While measuring effectiveness by how much
students learn makes sense if we care about student learning, current test scores are a limited
measure of students’ learning outcomes that we care about. There also may be bias in attributing
student test score gains to teachers even though our measures adjust for a rich set of student and
classroom characteristics. On the positive side, recent research has demonstrated that higher
value-added teachers, as measured in ways similar to those employed here, tend to exhibit
stronger classroom practices as measured by observational protocol such at the Classroom
Assessment Scoring System (CLASS) (La Paro, Pianta, and Stuhlman 2004) and Protocol for
Language Arts Teaching Observation (PLATO) (Grossman, Loeb, Cohen, Hammerness,
Wyckoff, Boyd, and Lankford 2010). Nonetheless, there is clearly measurement error in our
estimates of teacher effectiveness and there may be bias as some teachers teach a higher
proportion of students with negative shocks to their learning in that year and some teachers likely
teach relatively better in areas not covered as well by the standardized tests.
15
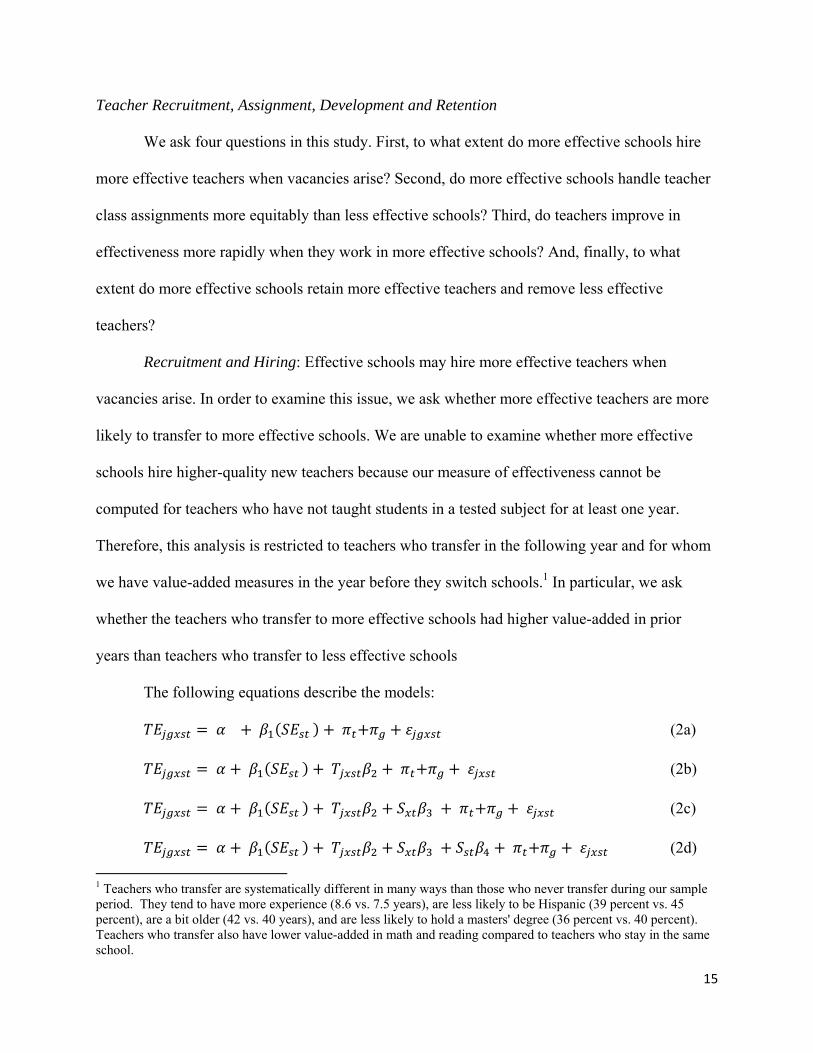
Teacher Recruitment, Assignment, Development and Retention
We ask four questions in this study. First, to what extent do more effective schools hire
more effective teachers when vacancies arise? Second, do more effective schools handle teacher
class assignments more equitably than less effective schools? Third, do teachers improve in
effectiveness more rapidly when they work in more effective schools? And, finally, to what
extent do more effective schools retain more effective teachers and remove less effective
teachers?
Recruitment and Hiring: Effective schools may hire more effective teachers when
vacancies arise. In order to examine this issue, we ask whether more effective teachers are more
likely to transfer to more effective schools. We are unable to examine whether more effective
schools hire higher-quality new teachers because our measure of effectiveness cannot be
computed for teachers who have not taught students in a tested subject for at least one year.
Therefore, this analysis is restricted to teachers who transfer in the following year and for whom
we have value-added measures in the year before they switch schools.1 In particular, we ask
whether the teachers who transfer to more effective schools had higher value-added in prior
years than teachers who transfer to less effective schools
The following equations describe the models:
(2a)
(2b)
(2c)
(2d)
1 Teachers who transfer are systematically different in many ways than those who never transfer during our sample period. They tend to have more experience (8.6 vs. 7.5 years), are less likely to be Hispanic (39 percent vs. 45 percent), are a bit older (42 vs. 40 years), and are less likely to hold a masters' degree (36 percent vs. 40 percent). Teachers who transfer also have lower value-added in math and reading compared to teachers who stay in the same school.
16
In the base model, Equation 2a, the effectiveness (TE) in year t of teacher j who started in school
x in time t and transferred to school s in time t+1 is a function simply of the effectiveness of the
school he or she transferred to (SE) measured in year t, as well as year and grade indicators. The
coefficient on SE measures whether more effective schools differentially attract more effective
teachers. We cluster the standard errors by the level of the hiring school, since school value-
added is measured at that level. Since teacher value-added is the outcome variable in these
analyses, we use the raw (standardized) fixed effects for teachers in this analysis as opposed to
the shrunk estimates. Using the empirical Bayes shrinkage to account for measurement error in
the teacher fixed effects is only necessary for unbiased estimates when these measures are used
on the right-hand side of our equations.
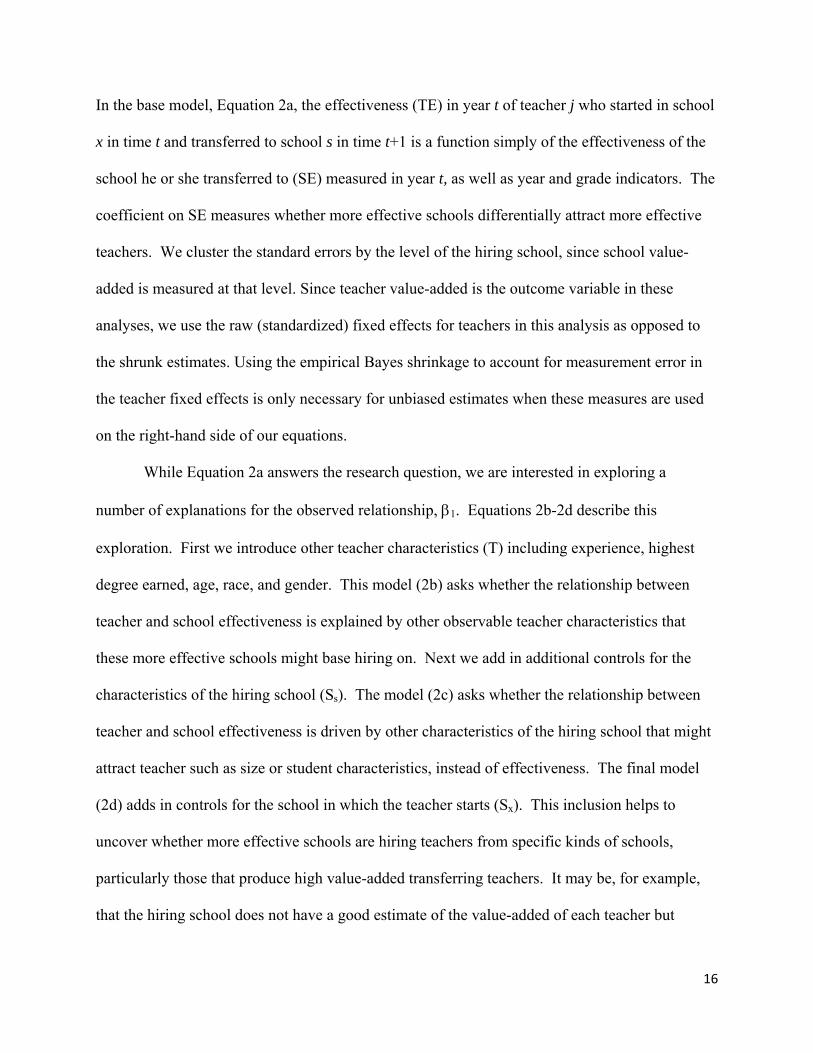
While Equation 2a answers the research question, we are interested in exploring a
number of explanations for the observed relationship, 1. Equations 2b-2d describe this
exploration. First we introduce other teacher characteristics (T) including experience, highest
degree earned, age, race, and gender. This model (2b) asks whether the relationship between
teacher and school effectiveness is explained by other observable teacher characteristics that
these more effective schools might base hiring on. Next we add in additional controls for the
characteristics of the hiring school (Ss). The model (2c) asks whether the relationship between
teacher and school effectiveness is driven by other characteristics of the hiring school that might
attract teacher such as size or student characteristics, instead of effectiveness. The final model
(2d) adds in controls for the school in which the teacher starts (Sx). This inclusion helps to
uncover whether more effective schools are hiring teachers from specific kinds of schools,
particularly those that produce high value-added transferring teachers. It may be, for example,
that the hiring school does not have a good estimate of the value-added of each teacher but
17
judges them based on the school from which they came and, in that way is able to identify more
effective teachers.
While models 2b-2c provide suggestive evidence on some of the mechanisms behind the
univariate relationship between school value-added and the value-added of transfers, we do not
have data on applications and offers and, thus, we are not able to discern whether more effective
schools hire more effective transferring teachers because more effective teachers apply to more
effective schools or because more effective schools are better able to identify the most effective
teachers out of their pool of applications.
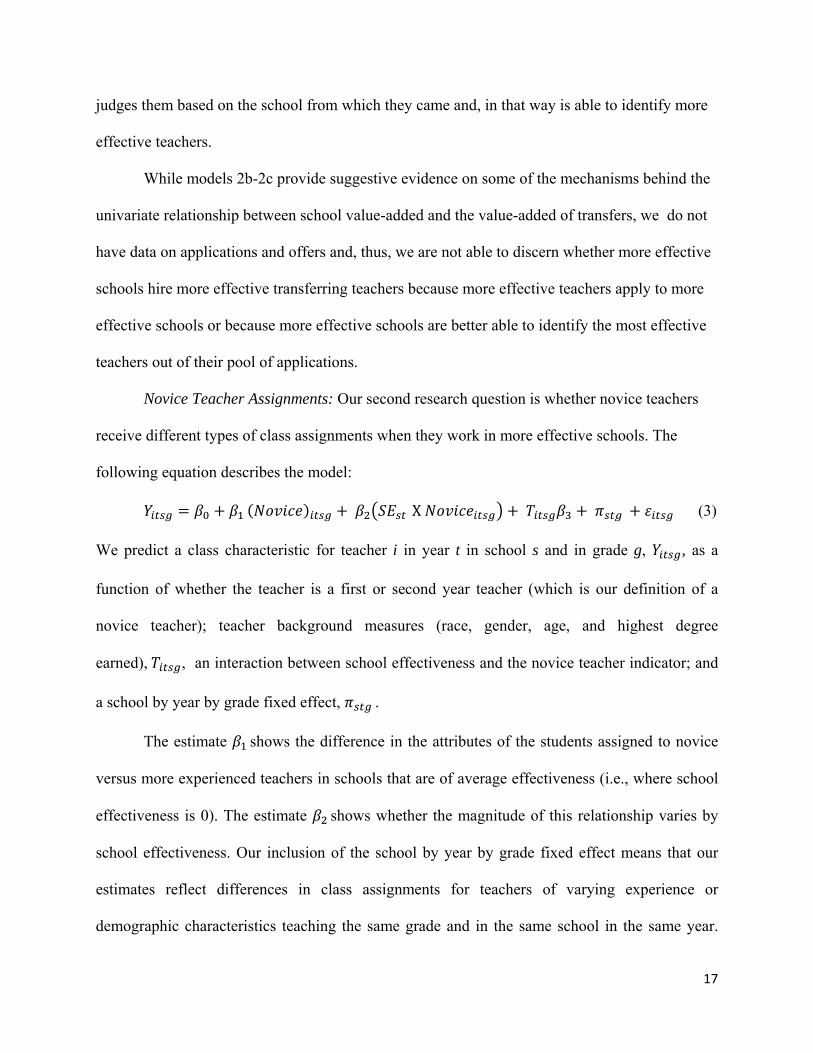
Novice Teacher Assignments: Our second research question is whether novice teachers
receive different types of class assignments when they work in more effective schools. The
following equation describes the model:
X (3)
We predict a class characteristic for teacher i in year t in school s and in grade g, , as a
function of whether the teacher is a first or second year teacher (which is our definition of a
novice teacher); teacher background measures (race, gender, age, and highest degree
earned), , an interaction between school effectiveness and the novice teacher indicator; and
a school by year by grade fixed effect, .
The estimate shows the difference in the attributes of the students assigned to novice
versus more experienced teachers in schools that are of average effectiveness (i.e., where school
effectiveness is 0). The estimate shows whether the magnitude of this relationship varies by
school effectiveness. Our inclusion of the school by year by grade fixed effect means that our
estimates reflect differences in class assignments for teachers of varying experience or
demographic characteristics teaching the same grade and in the same school in the same year.

18
The main effect on school value-added is absorbed by the school by year by grade fixed effect.
Our outcomes include the average prior achievement of teachers’ current students in math and
reading and the proportion of teachers’ current students scoring in the highest and lowest FCAT
proficiency levels in the prior year in math and reading.
Teacher Development: Our third set of models tests whether the value-added of teachers
changes more across years when they are in an effective school. To examine this we test whether
teachers’ value-added changes more between years when they are employed at a school that was
more effective in a prior period. We regress teacher value-added in the current year on teacher
value-added in the prior year and school value-added measured two years prior. We use a two
year lag of the school’s value added so that school and teacher effectiveness are not estimated
from the same test score data. For example, suppose the outcome (teacher value-added) is
measured in 2008: 2007 and 2008 test data are used to compute teacher value-added in 2008;
2006 and 2007 data are used to compute prior year’s (2007) teacher value-added; and 2005 and
2006 data are used to compute school value-added two years ago (2006). Although school value-
added fluctuates over time either due to real changes in school performance or to measurement
error, the correlation between current and prior year school value-added is between .65 and .80
as is the correlation between current year and twice lagged school value-added. Since we control
for the lag of teacher value-added, the coefficients on the other variables in the model indicate
change in their value-added as a function of a covariate. All specifications control for school
year, grade taught, and teacher experience which is entered as dummy variables. We control for
grade taught since students may exhibit lower learning gains in some grades than in others and
control for teacher experience since prior studies suggest that the rate at which teachers improve
tends to flatten after their first few years of teaching.
19
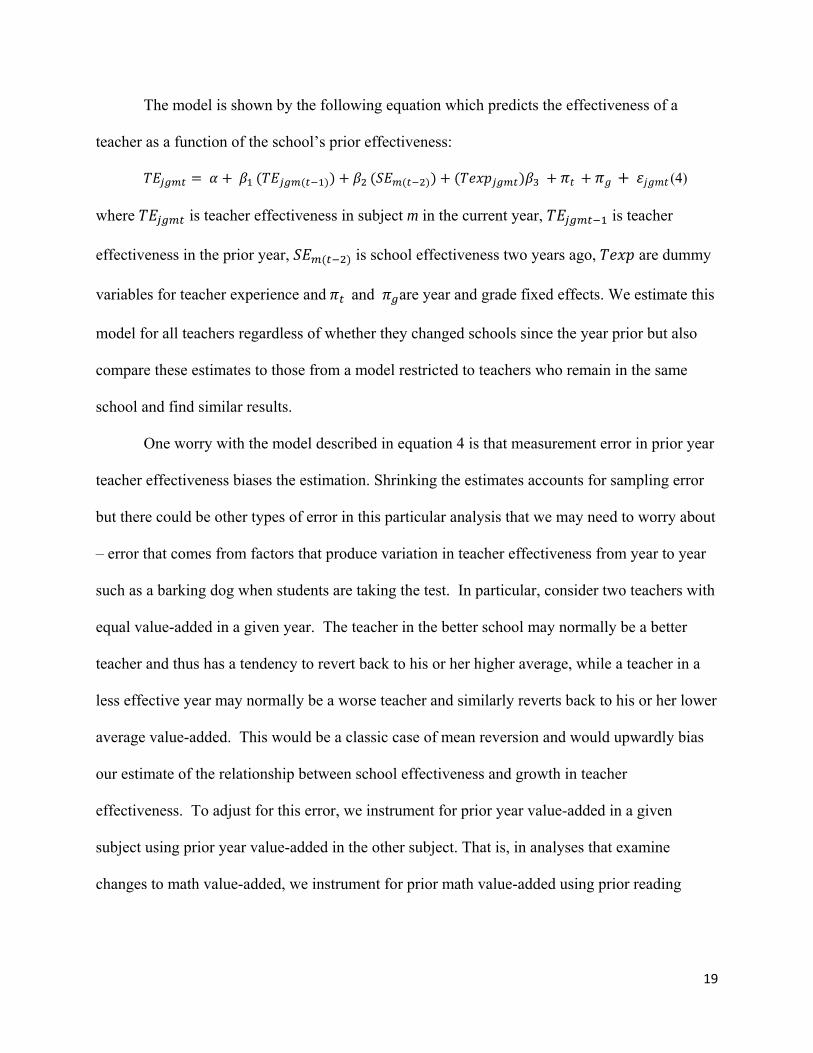
The model is shown by the following equation which predicts the effectiveness of a
teacher as a function of the school’s prior effectiveness:
(4)
where is teacher effectiveness in subject m in the current year, is teacher
effectiveness in the prior year, is school effectiveness two years ago, are dummy
variables for teacher experience and and are year and grade fixed effects. We estimate this
model for all teachers regardless of whether they changed schools since the year prior but also
compare these estimates to those from a model restricted to teachers who remain in the same
school and find similar results.
One worry with the model described in equation 4 is that measurement error in prior year
teacher effectiveness biases the estimation. Shrinking the estimates accounts for sampling error
but there could be other types of error in this particular analysis that we may need to worry about
– error that comes from factors that produce variation in teacher effectiveness from year to year
such as a barking dog when students are taking the test. In particular, consider two teachers with
equal value-added in a given year. The teacher in the better school may normally be a better
teacher and thus has a tendency to revert back to his or her higher average, while a teacher in a
less effective year may normally be a worse teacher and similarly reverts back to his or her lower
average value-added. This would be a classic case of mean reversion and would upwardly bias
our estimate of the relationship between school effectiveness and growth in teacher
effectiveness. To adjust for this error, we instrument for prior year value-added in a given
subject using prior year value-added in the other subject. That is, in analyses that examine
changes to math value-added, we instrument for prior math value-added using prior reading
20
value-added and vice versa. These analyses are necessarily restricted to elementary school
teachers who have classes with students tested in both subjects.
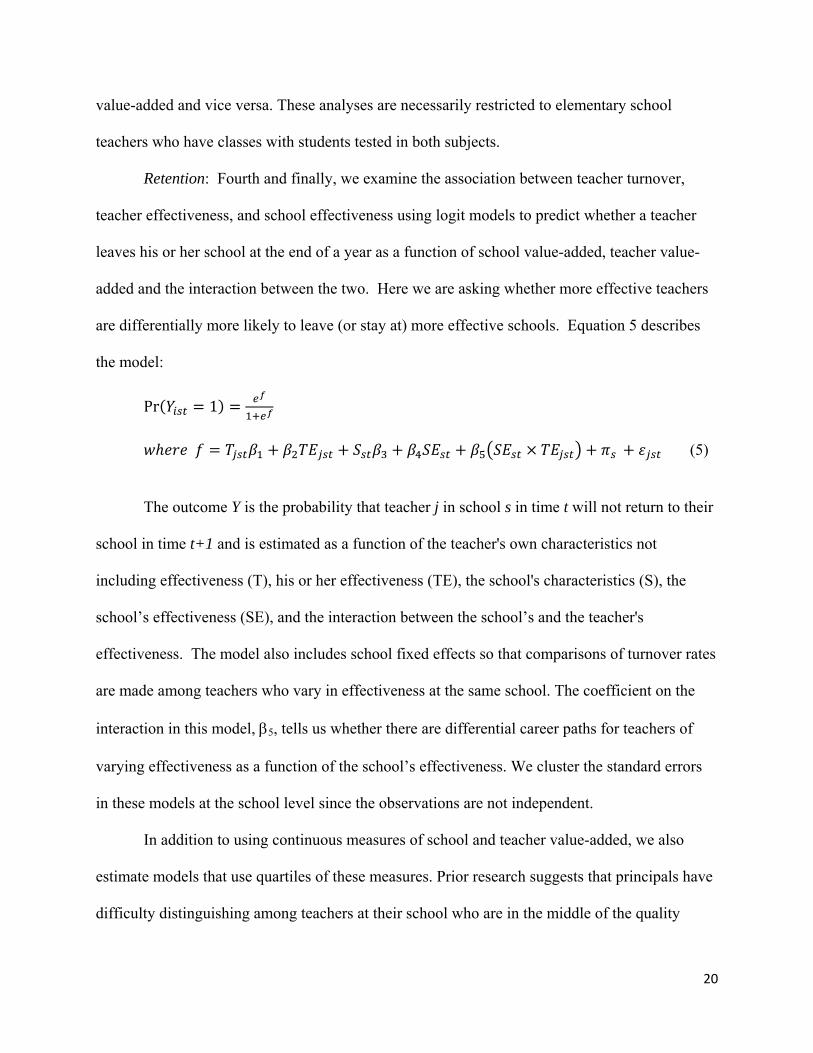
Retention: Fourth and finally, we examine the association between teacher turnover,
teacher effectiveness, and school effectiveness using logit models to predict whether a teacher
leaves his or her school at the end of a year as a function of school value-added, teacher value-
added and the interaction between the two. Here we are asking whether more effective teachers
are differentially more likely to leave (or stay at) more effective schools. Equation 5 describes
the model:
Pr 1
(5)
The outcome Y is the probability that teacher j in school s in time t will not return to their
school in time t+1 and is estimated as a function of the teacher's own characteristics not
including effectiveness (T), his or her effectiveness (TE), the school's characteristics (S), the
school’s effectiveness (SE), and the interaction between the school’s and the teacher's
effectiveness. The model also includes school fixed effects so that comparisons of turnover rates
are made among teachers who vary in effectiveness at the same school. The coefficient on the
interaction in this model, 5, tells us whether there are differential career paths for teachers of
varying effectiveness as a function of the school’s effectiveness. We cluster the standard errors
in these models at the school level since the observations are not independent.
In addition to using continuous measures of school and teacher value-added, we also
estimate models that use quartiles of these measures. Prior research suggests that principals have
difficulty distinguishing among teachers at their school who are in the middle of the quality
21
distribution but that they are able to distinguish between those at the top and bottom in terms of
effectiveness (Jacob and Lefgren 2008). If principals are to target their retention efforts on
particular teachers, then they must be able to distinguish among the best and worst teachers at
their school. We therefore generate quartiles of teacher value-added (within each school) and
include dummy variables flagging teachers in the top and bottom quartiles. For this analysis we
also use a measure that distinguishes schools that are in the top quartile of school value-added
(generated within each year and school-level) instead of using the continuous measure.
Since teacher and school value-added are each measured separately in each year, these
estimates tell us whether schools that were more effective in one year are better able to keep their
more effective teachers and remove their less effective teachers the following year. Our use of
measures of value-added that vary by year is important for our estimation strategy. Though
pooling value-added measures across years may be preferable given small samples for some
teachers and measurement error in tests (McCaffrey, Sass, Lockwood, and Mihaly 2009), in our
case this makes the causal ordering of these measures ambiguous. In the teacher turnover
analyses, for example, we want to test whether more effective schools are able to keep good
teachers and remove ineffective ones. We also want to be able to rule out an alternative
explanation (of a reversal in causal ordering) that schools look like they have higher value-added
only because they happened to have particularly good teachers. For example, if we estimated
school value-added in the year after less-effective teachers left and more effective teachers
stayed, the school would look more effective regardless of its practices in the prior years that led
to this differential turnover. While the year-by-year measures of school and teacher
effectiveness are less precise than measures averaged over all years, the value-added based on
22
prior years allows us to examine how school effectiveness in a given period influences teacher
turnover behavior in a subsequent period and helps us avoid the problems described above. 2
RESULTS
Recruitment and Hiring: More effective schools may hire higher value-added teachers
when vacancies arise. This differential hiring may be driven by pro-active recruitment efforts by
such schools, better ability to distinguish among job candidates, or by teachers' preferences for
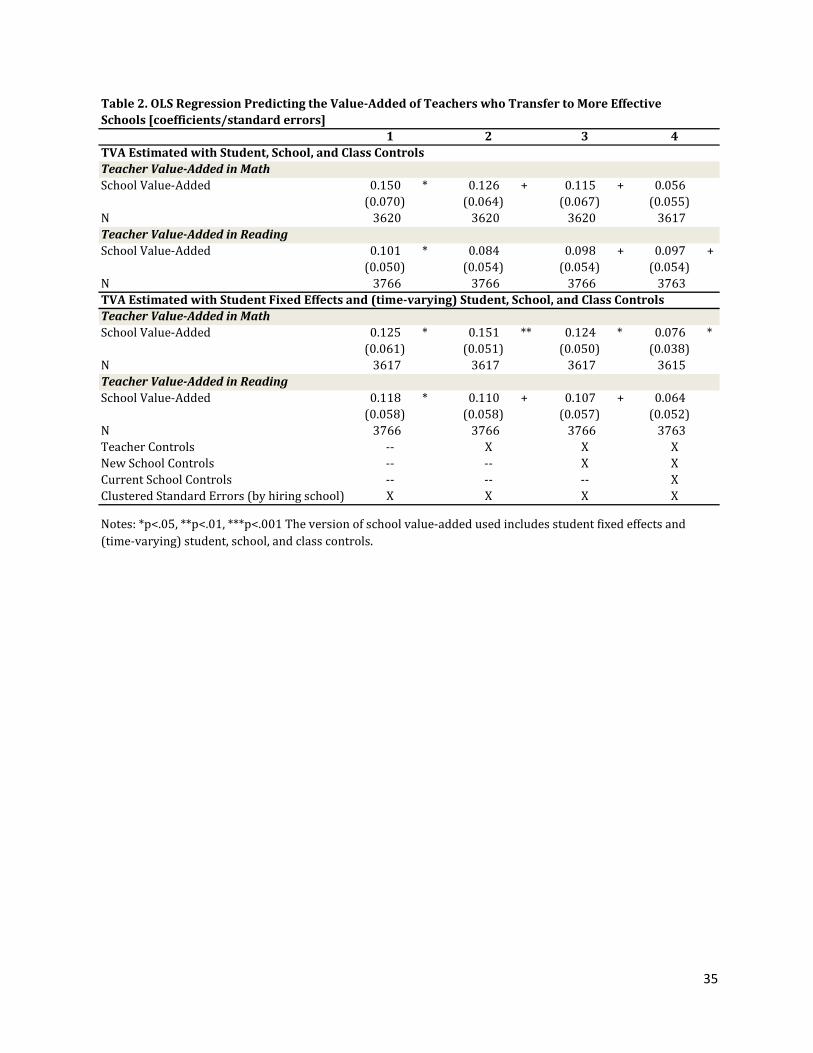
more effective schools. While we can't separate the possible mechanisms, Table 2 shows
evidence of differential hiring. In these models we take all teachers who transfer and regress the
value-added of the teacher who transfers (measured in the year prior to their transfer) on the
effectiveness of the school to which they transfer (measured in the year prior to the teacher’s
transfer). We estimate each of these models for the version of teacher value-added that include
and exclude student fixed effects. We do not show estimates using the version of teacher value-
added that includes school fixed effects because we are not interested in comparing teachers in
the same school for these analyses.
The coefficients on the interactions between teacher and school value-added are positive
across all specifications suggesting that higher value-added teachers tend to transfer to more
effective schools. Model 1 is the simple bivariate association between teacher and school value-
added. Here we find a positive association between transferring teachers’ value-added and the
value-added of the school to which they transfer. For example, the top panel for math value-
2 There is some concern in the value-added literature about issues with non-persistent teacher effects (McCaffrey, Sass, Lockwood, and Mihaly 2009). McCaffrey et al. (2009), for example, find that between 30-60 percent of the variation in measured teacher effectiveness is due to “noise” in student test scores rather than to real differences between teachers. The proposed solution is to either average teacher effects over multiple years or to take teacher by year fixed effects and estimate the true signal variance by the covariance of these effects across years. However, this method will not work in our case. For the analyses described below we require measures of value-added for teachers and schools that are estimated separately in each year to avoid problems such as circularity and reverse causation.
23
added shows that a one standard deviation increase in the value-added of hiring schools is
associated with a 0.15 standard deviation in the value-added of the transferring teacher. The
relationship is 0.10 for reading value-added.
These relationships remain positive in model 2 when we add controls for other teacher
characteristics. The magnitude of the estimates is reduced somewhat, however, suggesting that
teacher effectiveness may be associated with other teacher characteristics that more effective
schools look for when hiring (e.g., teacher experience). Adding additional controls for
characteristics of schools to which teachers transfer in model 3 does little to change the
estimates. This suggests that observable school characteristics that might influence teachers’
transfer decisions bear little association with school value-added. This result is expected given
that school effectiveness is estimated via value-added where other school characteristics are
controlled. The magnitude of the coefficients is reduced somewhat when controlling for the
characteristics of teachers’ initial schools in model 4. This reduction may suggest that school
hiring authorities consider the characteristics of a teacher’s prior school when hiring.
Taken together, these findings suggest that more effective teachers tend to move to more
effective schools, though we cannot discern whether this results from differential personnel
practices or from teachers’ preferences for more effective schools.
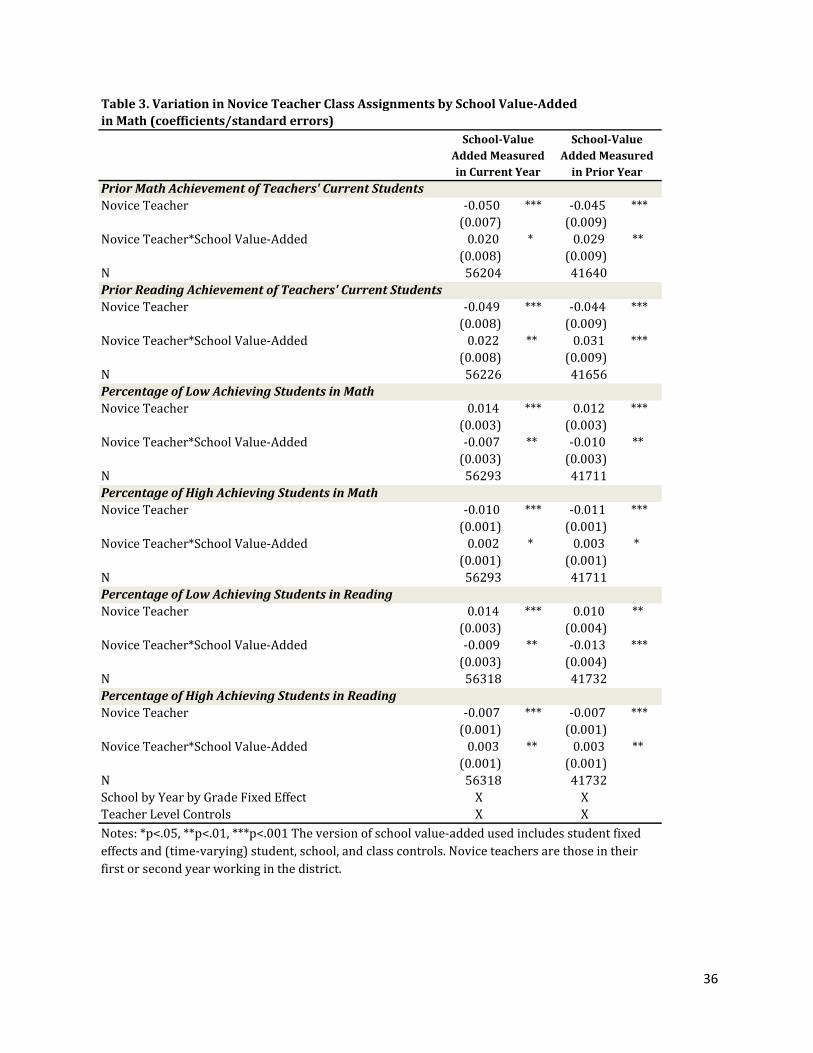
Novice Teacher Assignments: Table 3 describes variation in novice teachers’ class
assignments by school effectiveness. We show the results using both current school value-added
to predict class assignments and prior year school value-added, in case current effectiveness is
influenced by the distribution of teachers to students. The results are largely the same in direction
and magnitude.
24
The table shows consistent evidence that novice teachers are assigned lower achieving
students than their colleagues across all types of schools. However, the magnitudes of these
relationships are weaker in more effective schools. For example, the main effect on novice
teacher in the first column under the first panel shows that novice teachers are assigned students
whose average prior achievement in math is .05 standard deviations lower than the average prior
achievement of their more experienced colleagues at their school (in schools at the mean of
effectiveness). The interaction between novice teacher and school value-added in this model is a
positive .02 suggesting that the effect is only about half as large in schools that are one standard
deviation above the mean of school value-added. The results are similar for the average prior
reading achievement of teachers’ students as well as for the percentage of teachers’ students who
scored at the highest and lowest proficiency level on the FCAT in the prior year.3 These results
provide clear and consistent evidence that more equitable assignments for novice teachers
distinguishes effective schools from less effective schools.
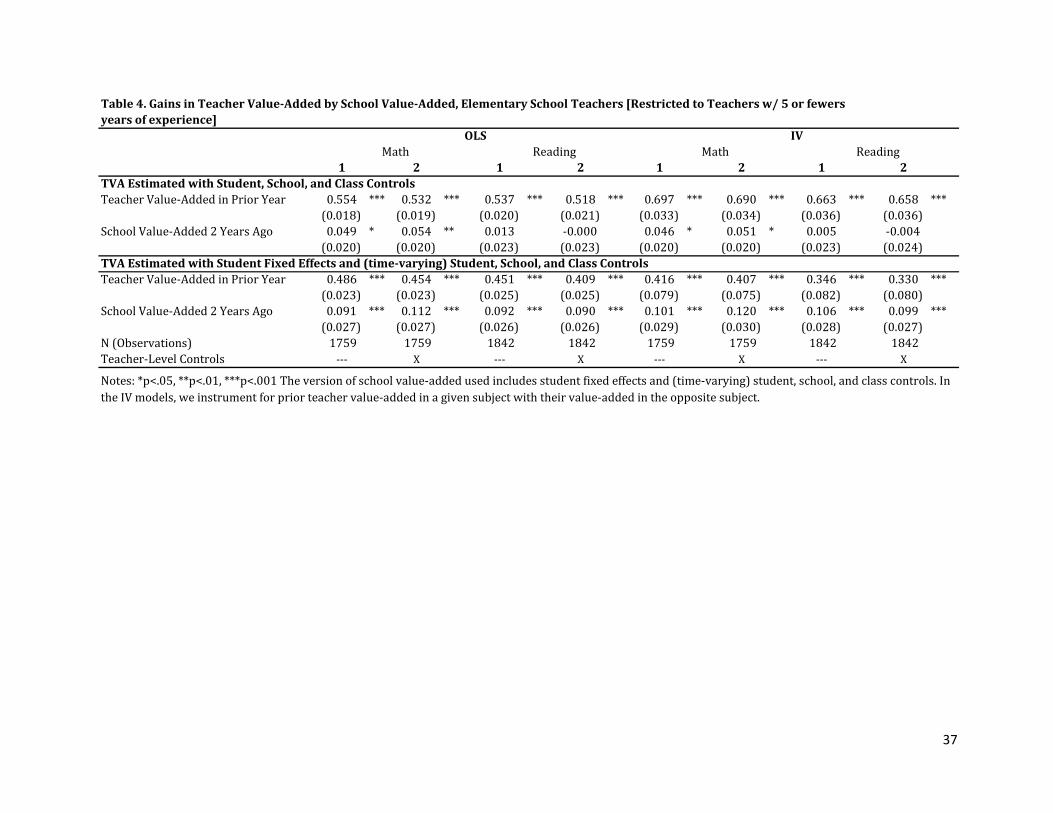
Teacher Development: Next, we investigate whether teachers improve their ability to
raise student achievement more rapidly when working in effective schools. Table 4 provides the
results of these models. In Table 4 we examine the relationship between the change in teacher
value-added between the current and prior year and the school’s effectiveness two years ago. The
reason we measure school value-added two years ago is that we worry that if we used concurrent
value-added the effects might be circular since the teacher’s value-added in the prior year is also
in the model and the teacher and school measures were estimated on the same data. We use
measures of teacher value-added that are estimated with and without student fixed effects. We
3 One factor that could influence the extent to which schools assign novice teachers to lower achieving students is the standard deviation of achievement within schools. We found only a very weak relationship between school value-added and the standard deviation of math achievement. The correlations are -.04 in elementary schools and -.10 in high schools.

25
exclude the version of teacher value-added estimated using school fixed effects because in these
analyses we are not interested in comparing teachers within the same school but, rather, teachers
who teach in different schools (i.e., more and less effective schools). We present both OLS
estimates (in the first four columns of Table 4) and the IV estimates (in the final four columns of
Table 4).
Both the OLS and IV estimates show a fairly consistent relationship between school
effectiveness and teacher improvement in math value-added. The estimates are positive and
significant for reading value-added when we use the version of teacher value-added that includes
student fixed effects but are about 0 and not significant in the version of teacher value-added that
excludes student fixed effects. When we look at the IV estimates for the version of teacher value-
added estimated with student fixed effects (bottom panel of Table 4), we find that a one standard
deviation increase school value-added (measured 2 years ago) is associated with a .10-.12 greater
increase in teacher value-added over a one year period. These results are consistent when we
restrict the models to teachers who taught at the same school in the years in which we measure
change in their value-added.
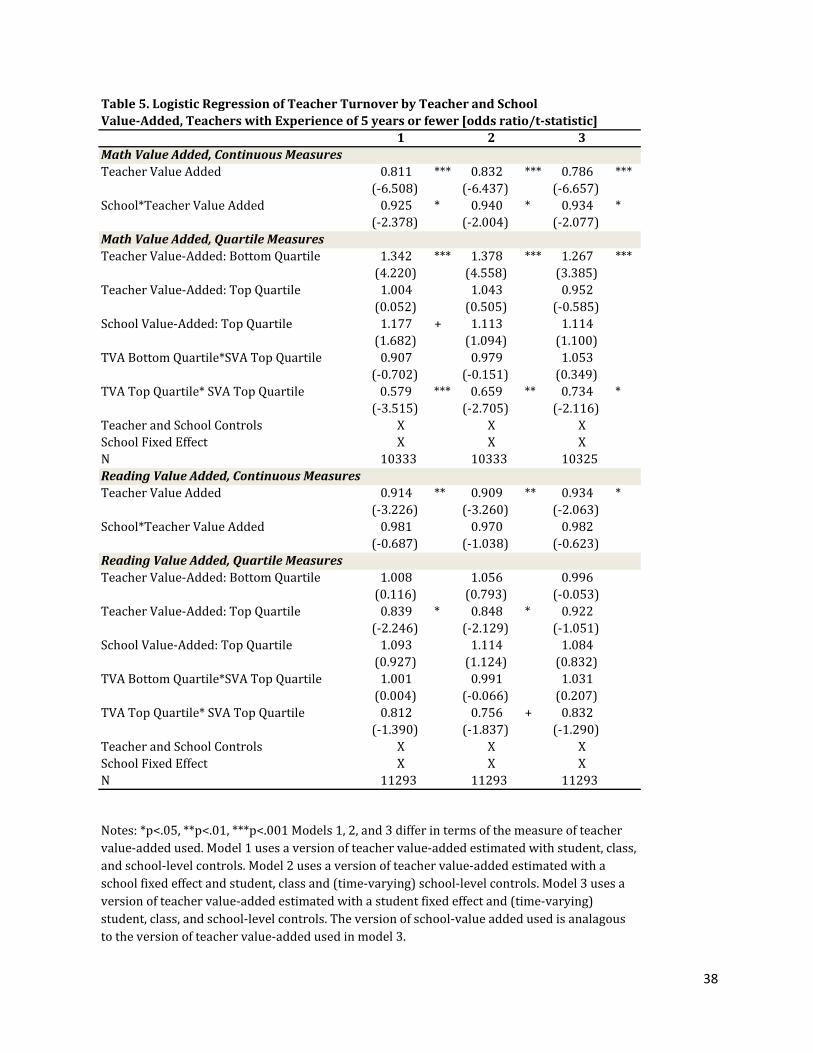
Retention: Finally, we examine whether more effective schools are better able to retain
their best teachers and remove their least effective teachers. In Table 5 we show results from
logistic regression models that predict whether a teacher leaves their school at the end of the year
as a function of their own value-added, their school value-added, and the interaction between the
two. The table reports odds ratios and t-statistics. All models include controls for teacher and
school characteristics and school fixed effects. We control for teacher and school characteristics
to adjust for factors that might be associated with teacher turnover and teacher effectiveness. We
include the school fixed effect so our comparisons are made only among teachers who vary in
26
effectiveness within schools. Both school and teacher value-added have been standardized to
have a mean of 0 and a standard deviation of 1 within each school year. We restrict these
analyses to teachers who have been employed in the district for five years or fewer. Rates of
transfer and attrition from the district are more than twice as large for less experienced teachers
relative to older and more experienced teachers. The latter set of teachers is much less likely to
leave their school or the district.4 In addition to using continuous measures of value-added, we
also break these measures into quartiles and examine the retention of low (bottom quartile) and
high (top quartile) teachers in the most effective schools (top quartile). As with the previous
analyses, we show these results using three different measures of teacher value-added.
The models that use the continuous measures of math value-added suggest that teachers
who are more effective at raising math achievement are less likely to leave their school, which is
consistent with prior research (Boyd, Grossman, Lankford, Loeb, and Wyckoff 2008; Goldhaber,
Gross, and Player 2007; Hanushek, Kain, O'Brien, and Rivkin 2005). For example, the main
effect on teacher value-added in the first column suggests that a one standard deviation in teacher
math value-added is associated with a 20 percent decline in the odds of leaving one’s current
school (in schools that are of average effectiveness).
The table also shows that the likelihood that more effective teachers leave their school is
even lower when they work in more effective schools—i.e., the school-by-teacher value-added
interactions are all negative and statistically significant for math. The interactions are also
negative for reading value-added but are not statistically significant. These findings hold across
all three methods of computing teacher value-added. The results are similar when we break
teacher value-added up into quartiles. Here we find that the most effective schools (top quartile)
4 The findings discussed here are similar in direction when all teachers are included (i.e., experienced and novice) but smaller in magnitude and generally not statistically significant.
27
are better able to keep their best (top quartile) teachers. They are not, however, differentially able
to remove their least effective (bottom quartile) teachers. These results hold across all versions of
teacher value-added for math and are in the expected direction but not statistically significant for
reading.
DISCUSSION
Not surprisingly, teachers in more effective schools demonstrate more positive career
trajectories. The results presented above have shown that more effective schools are able to
attract more effective teachers when teachers transfer across schools. In fact, a school that is one
standard deviation above the mean of effectiveness attracts teachers who are 10 to 15 percent of
a standard deviation more effective. These schools also assign teachers to students more
equitably. While novice teachers systematically teach students with lower entering test scores
than their more senior colleagues, these relationships are approximately half as large in schools
that are one standard deviation more effective. Teachers in more effective schools also improve
more rapidly from year to year. On average, in schools that are one standard deviation more
effective, teachers’ value-added increases by up to 10 percent of a standard deviation more in a
given year, though these results vary by specification. Finally these schools differentially retain
more effective teachers. The probably that a teacher who is in the top quartile of effectiveness
will leave in a given year is 30 to 40 percent lower in top quartile school. We do not find
differential attrition of less effective teachers relative to teachers demonstrating average value-
added in more effective schools.
Two caveats are warranted in interpreting these results. First, the results we found, while
in the same direction when effectiveness is defined in terms of value added to students’ reading

28
achievement as they are when value-added is defined by math achievement, the results for
reading are not as consistently statistically different from zero. This is not the first study to find
clearer effects for mathematics than for English language arts, however, the difference is still
worth noting.
The second caveat is that we have not attempted to identify the cause of the patterns we
observe. While the more equitable assignment of teachers to classrooms is likely to be the result
of school practices, we do not know whether these practices are driven by teachers or by the
school leadership. The differential hiring of more effective transferring teachers might not even
be driven by school practices. Teachers may be attracted to these schools because they are more
effective. Similarly, less effective teachers may choose to leave these more effective schools not
because they are encouraged to leave but because they feel out of place.
Nonetheless, while we cannot definitely attribute the patterns of recruitment, assignment,
development and retention to school leadership, the results suggest that school leadership and
particular school personnel practices may be a driving force in effective schooling. Not only are
school leaders responsible for personnel practices, but recent prior work has highlighted the
importance of personnel practices and other organizational management practices for
distinguishing (if not causing) effective schools (Grissom and Loeb 2009; Horng, Klasik, and
Loeb 2010). The results are also not surprising. Teachers strongly affect students’ educational
opportunities. Higher performing schools seem better able to build a staff of strong teachers
through differential retention of good teachers, through recruitment and hiring, and through
providing supports for teacher improvement. This paper provides some empirical evidence that
more effective schools are doing all three. In addition, these schools appear to use their teaching
resources more efficiently, not assigning new teachers to lower performing students.
29
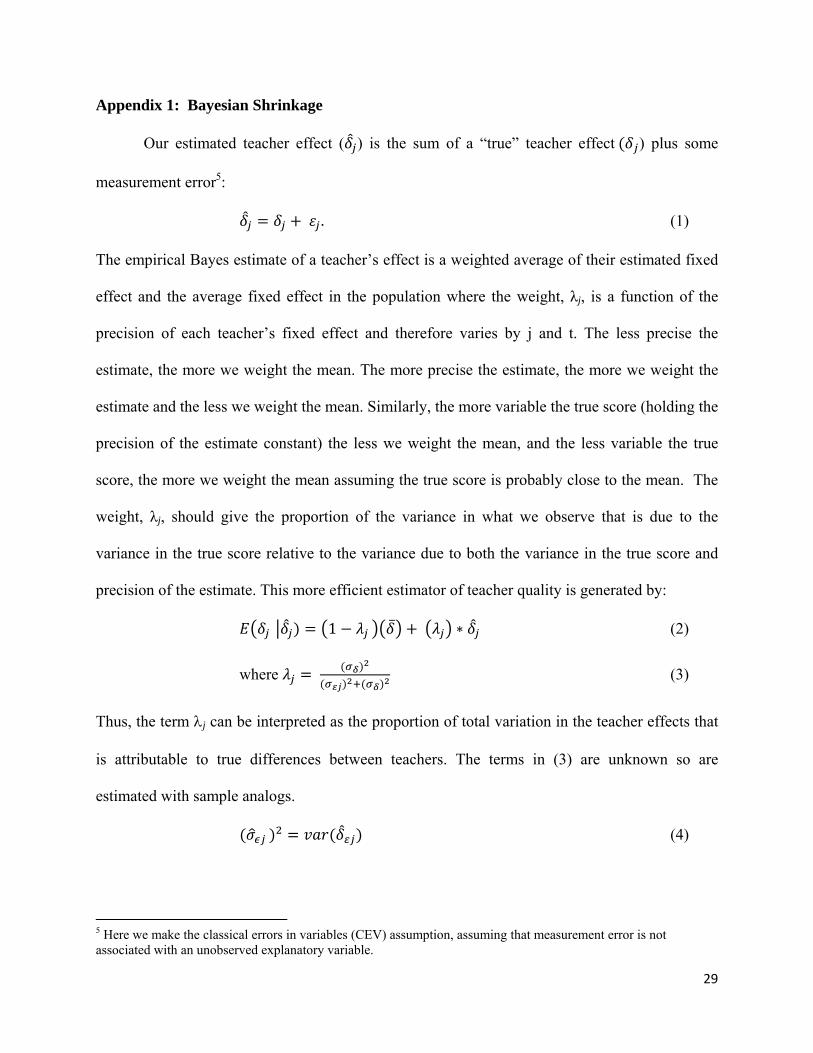
Appendix 1: Bayesian Shrinkage
Our estimated teacher effect ( ) is the sum of a “true” teacher effect ) plus some
measurement error5:
. (1)
The empirical Bayes estimate of a teacher’s effect is a weighted average of their estimated fixed
effect and the average fixed effect in the population where the weight, λj, is a function of the
precision of each teacher’s fixed effect and therefore varies by j and t. The less precise the
estimate, the more we weight the mean. The more precise the estimate, the more we weight the
estimate and the less we weight the mean. Similarly, the more variable the true score (holding the
precision of the estimate constant) the less we weight the mean, and the less variable the true
score, the more we weight the mean assuming the true score is probably close to the mean. The
weight, λj, should give the proportion of the variance in what we observe that is due to the
variance in the true score relative to the variance due to both the variance in the true score and
precision of the estimate. This more efficient estimator of teacher quality is generated by:
1 (2)
where (3)
Thus, the term j can be interpreted as the proportion of total variation in the teacher effects that
is attributable to true differences between teachers. The terms in (3) are unknown so are
estimated with sample analogs.
(4)
5 Here we make the classical errors in variables (CEV) assumption, assuming that measurement error is not associated with an unobserved explanatory variable.
30
which is the square of the standard error of the teacher fixed effects. The variance of the true
fixed effect is determined by:
(5)
where is the variance of the estimated teacher fixed effects (Gordon, Kane, and Staiger
2006; Jacob and Lefgren 2005). We shrink the school value-added estimates in the same manner
described above.
31
References Aaronson, Daniel, Lisa Barrow, and William Sander. 2007. "Teachers and Student Achievement
in Chicago Public High Schools." Journal of Labor Economics 25:95-135. Balu, Rekha, Tara Beteille, and Susanna Loeb. 2010. "Examining Teacher Turnover: The Role
of School Leadership." Politique Americaine 15:55-79. Boyd, Donald, Pam Grossman, Hamilton Lankford, Susanna Loeb, and James Wyckoff. 2008.
"Who Leaves? Teacher Attrition and Student Achievement." National Bureau of Economic Research, Working Paper 14022: http://www.nber.org/papers/w14022.pdf, Cambridge, MA.
Boyd, Donald, Hamilton Lankford, Susanna Loeb, Matthew Ronfeldt, and James Wyckoff. 2011. "The Role of Teacher Quality in Retention and Hiring: Using Applications-to-Transfer to Uncover Preferences of Teachers and Schools." Journal of Policy Analysis and Management 30:88-110.
Boyd, Donald, Hamilton Lankford, Susanna Loeb, Matthew Ronfeldt, and James Wyckoff. forthcoming. "The Role of Teacher Quality in Retention and Hiring: Using Applications-to-Transfer to Uncover Preferences of Teachers and Schools." Journal of Policy Analysis and Management.
Boyd, Donald, Hamilton Lankford, Susanna Loeb, and James Wyckoff. 2005. "The Draw of Home: How Teachers' Preferences for Proximity Disadvantage Urban Schools." Journal of Policy Analysis and Management 24:113-132.
Clotfelter, Charles T., Helen Ladd, and Jacob L. Vigdor. 2006. "Teacher-Student Matching and the Assessment of Teacher Effectiveness." Journal of Human Resources 41:778-820.
Coleman, James S. 1990. "Equality of Educational Opportunity." in Equality and Achievement in Education, edited by J. S. Coleman. Boulder: Westview Press.
Downey, Douglas B., Paul T. von Hippel, and Beckett A. Broh. 2004. "Are Schools the Great Equalizer? Cognitive Inequality During the Summer Months and the School Year." American Sociological Review 69:613-635.
Feng, Li. 2010. "Hire Today, Gone Tomorrow: New Teacher Classroom Assignments and Teacher Mobility." Education Finance and Policy 5:278-316.
Ferguson, Ronald. 1998. "Can Schools Narrow the Black-White Test Score Gap?" Pp. 318-374 in The Black-White Test Score Gap, edited by C. Jencks and M. Phillips. Washington, DC: Brookings.
Goldhaber, Dan, Betheny Gross, and Daniel Player. 2007. "Are Public Schools Really Losing Their Best? Assessing the Career Transitions of Teachers and Their Implications for the Quality of the Teacher Workforce." National Center for Analysis of Longitudinal Data in Education Research (CALDER): http://www.caldercenter.org/PDF/1001115_Public_Schools.pdf.
Gordon, Robert, Thomas J. Kane, and Douglas O. Staiger. 2006. "Identifying Effective Teachers Using Performance on the Job."
Grissom, Jason and Susanna Loeb. 2009. "Triangulating Principal Effectiveness: How Perspectives of Parents, Teachers, and Assistant Principals Identify the Central Importance of Managerial Skills." National Center for Analysis of Longitudinal Data in Education Research (CALDER) Working Paper 35.
Grossman, Pamela, Susanna Loeb, Julia Cohen, Karen Hammerness, James Wyckoff, Donald Boyd, and Hamilton Lankford. 2010. "Measure for Measure: The Relationship betweeen
32
Measures of Instructional Practice in Middle School English Language Arts and Teachers' Value-Added Scores." National Bureau of Economic Research Working Paper #16015, Cambridge, MA.
Hanushek, Eric A., John F. Kain, Daniel M. O'Brien, and Steven G. Rivkin. 2005. "The Market for Teacher Quality." National Bureau of Economic Research, Working Paper 11154, Cambridge.
Hanushek, Eric, John F. Kain, and Steven G. Rivkin. 2004. "Why Public Schools Lose Teachers." Journal of Human Resources 39:326-354.
Horng, Eileen, Daniel Klasik, and Susanna Loeb. 2010. "Principal's Time Use and School Effectiveness." American Journal of Education 116:491-523.
Jacob, Brian A and Lars Lefgren. 2005. "Principals As agents: Subjective performance measurement in education." in NBER Working Paper Series. Cambridge: NBER.
Jacob, Brian A. and Lars Lefgren. 2008. "Can Principals Identify Effective Teachers? Evidence on Subjective Performance Evaluation in Education." Journal of Labor Economics 26:101-136.
Kalogrides, Demetra, Susanna Loeb, and Tara Béteille. 2011. "Power Play? Teacher Characteristics and Class Assignments." in Annual Meetings of the Association for Education Finance and Policy. Seattle, WA.
Kane, Thomas J., Jonah E. Rockoff, and Douglas O. Staiger. 2008. "What Does Certification Tell Us About Teacher Effectiveness? Evidence from New York City." Economics of Education Review 27:615-631.
Krei, Melinda. 1998. "Intensifying the Barriers: The Problem of Inequitable Teacher Allocation in Low-Income Urban Schools." Urban Education 33:71-94.
La Paro, Karen M., Robert C. Pianta, and Megan Stuhlman. 2004. "Classroom Assessment Scoring System (CLASS): Findings from the Pre-K Year." Elementary School Journal 104:409-426.
Lankford, Hamilton, Susanna Loeb, and James Wyckoff. 2002. "Teacher Sorting and the Plight of Urban Schools: A Descriptive Analysis." Educational Evaluation and Policy Analysis 24:37-62.
McCaffrey, Daniel F., Tim R. Sass, J.R. Lockwood, and Kata Mihaly. 2009. "The Intertemporal Variability of Teacher Effect Estimates." Education Finance and Policy 4:572-606.
Meyer, Robert H. 1997. "Value-Added Indicators of School Performance: A Primer." Economics of Education Review 16:283-301.
Nye, Barbara, Spyros Konstantopoulos, and Larry V. Hedges. 2004. "How Large Are Teacher Effects?" Educational Evaluation and Policy Analysis 26:237-257.
Rivkin, Steven G., Erik A. Hanushek, and John F. Kain. 2005. "Teachers, Schools, and Academic Achievement." Econometrica 73:417-458.
Rockoff, Jonah. 2004. "The impact of individual teachers on student achievement: Evidence from panel data." American Economic Review 94:247-252.
Rothstein, Jesse. 2009. "Student Sorting and Bias in Value-Added Estimation: Selection on Observables and Unobservables." Education Finance and Policy 4:537-571.
Rubin, Donald, Elizabeth A Stuart, and Elaine L. Zanutto. 2004. "A Potential Outcomes View of Value-Added Assessment in Education." Journal of Educational and Behavioral Statistics 29:103-116.
Sammons, Pam, Josh Hillman, and Peter Mortimore. 1995. "Key Characteristics of Effective Schools: A Review of School Effectiveness Research." International School
33
Effectiveness and Improvement Center. Institute of Education, University of London., London.
Sanders, William and June Rivers. 1996. "Cumulative and Residual Effects of Teachers on Future Student Academic Achievement." Knoxville: University of Tennessee Value-Added Research and Assessment Center.
Scafidi, Benjamin, David L. Sjoquist, and Todd R. Stinebrickner. 2008. "Race, Poverty, and Teacher Mobility." Economics of Education Review 26:145-159.
Willms, J Douglas and Stephen W. Raudenbush. 1989. "A Longitudinal Hierarchical Linear Model for Estimating School Effects and their Stability." Journal of Educational Measurement 26:209-232.
34
Table 1. Descriptive StatisticsMean SD
Student CharacteristicsAverage Standardized Test Score Gain in Math 0.01 0.65Average Standardized Test Score Gain in Reading 0.02 0.67Standardized Math Score ‐0.01 1.00Standardized Reading Score ‐0.10 1.00Black 0.27Hispanic 0.61Female 0.50Limited English Proficient 0.09Retained in Year Prior 0.07Eligible for Subsidized Lunch 0.61Total Student Observations (with test scores) 880946Unique Students (with test scores) 351888Average Number of Observations Per Student 3Teacher Characteristics1
Years in District 8.10 6.95Black 0.28Hispanic 0.44Female 0.79Age 41.95 11.30Master's Degree or Higher 0.36Number of Teacher Observations 29251Number of Teachers 10326School Characteristics (in 2008)% Eligible for Subsidized Lunch 0.67 0.23% Minority (Black or Hispanic) 0.89 0.12% Achievement Low Achieving in Math 0.18 0.15% Achievement Low Achieving in Reading 0.24 0.17Student Enrollment 819 688Elementary School 0.48Middle School 0.24High School 0.19Number of Schools 4221 Only includes teachers for which we were able to compute value‐added estimates.
35
Table 2. OLS Regression Predicting the ValueAdded of Teachers who Transfer to More Effective Schools [coefficients/standard errors]
1 2 3 4TVA Estimated with Student, School, and Class ControlsTeacher ValueAdded in MathSchool Value‐Added 0.150 * 0.126 + 0.115 + 0.056
(0.070) (0.064) (0.067) (0.055)N 3620 3620 3620 3617Teacher ValueAdded in ReadingSchool Value‐Added 0.101 * 0.084 0.098 + 0.097 +
(0.050) (0.054) (0.054) (0.054) N 3766 3766 3766 3763TVA Estimated with Student Fixed Effects and (timevarying) Student, School, and Class ControlsTeacher ValueAdded in MathSchool Value‐Added 0.125 * 0.151 ** 0.124 * 0.076 *
(0.061) (0.051) (0.050) (0.038) N 3617 3617 3617 3615Teacher ValueAdded in ReadingSchool Value‐Added 0.118 * 0.110 + 0.107 + 0.064
(0.058) (0.058) (0.057) (0.052)N 3766 3766 3766 3763Teacher Controls ‐‐ X X XNew School Controls ‐‐ ‐‐ X XCurrent School Controls ‐‐ ‐‐ ‐‐ XClustered Standard Errors (by hiring school) X X X X
Notes: *p<.05, **p<.01, ***p<.001 The version of school value‐added used includes student fixed effects and (time‐varying) student, school, and class controls.
36
in Math (coefficients/standard errors)
Prior Math Achievement of Teachers' Current StudentsNovice Teacher ‐0.050 *** ‐0.045 *** (0.007) (0.009) Novice Teacher*School Value‐Added 0.020 * 0.029 ** (0.008) (0.009) N 56204 41640 Prior Reading Achievement of Teachers' Current StudentsNovice Teacher ‐0.049 *** ‐0.044 *** (0.008) (0.009) Novice Teacher*School Value‐Added 0.022 ** 0.031 *** (0.008) (0.009) N 56226 41656Percentage of Low Achieving Students in MathNovice Teacher 0.014 *** 0.012 *** (0.003) (0.003) Novice Teacher*School Value‐Added ‐0.007 ** ‐0.010 ** (0.003) (0.003) N 56293 41711Percentage of High Achieving Students in MathNovice Teacher ‐0.010 *** ‐0.011 *** (0.001) (0.001) Novice Teacher*School Value‐Added 0.002 * 0.003 * (0.001) (0.001) N 56293 41711Percentage of Low Achieving Students in ReadingNovice Teacher 0.014 *** 0.010 ** (0.003) (0.004) Novice Teacher*School Value‐Added ‐0.009 ** ‐0.013 *** (0.003) (0.004) N 56318 41732Percentage of High Achieving Students in ReadingNovice Teacher ‐0.007 *** ‐0.007 *** (0.001) (0.001) Novice Teacher*School Value‐Added 0.003 ** 0.003 ** (0.001) (0.001) N 56318 41732School by Year by Grade Fixed Effect X XTeacher Level Controls X X
Table 3. Variation in Novice Teacher Class Assignments by School ValueAdded
SchoolValue Added Measured in Current Year
SchoolValue Added Measured in Prior Year
Notes: *p<.05, **p<.01, ***p<.001 The version of school value‐added used includes student fixed effects and (time‐varying) student, school, and class controls. Novice teachers are those in their first or second year working in the district.
37
Table 4. Gains in Teacher ValueAdded by School ValueAdded, Elementary School Teachers [Restricted to Teachers w/ 5 or fewers years of experience]
1 2 1 2 1 2 1 2
TVA Estimated with Student, School, and Class ControlsTeacher Value‐Added in Prior Year 0.554 *** 0.532 *** 0.537 *** 0.518 *** 0.697 *** 0.690 *** 0.663 *** 0.658 *** (0.018) (0.019) (0.020) (0.021) (0.033) (0.034) (0.036) (0.036) School Value‐Added 2 Years Ago 0.049 * 0.054 ** 0.013 ‐0.000 0.046 * 0.051 * 0.005 ‐0.004
(0.020) (0.020) (0.023) (0.023) (0.020) (0.020) (0.023) (0.024) TVA Estimated with Student Fixed Effects and (timevarying) Student, School, and Class ControlsTeacher Value‐Added in Prior Year 0.486 *** 0.454 *** 0.451 *** 0.409 *** 0.416 *** 0.407 *** 0.346 *** 0.330 *** (0.023) (0.023) (0.025) (0.025) (0.079) (0.075) (0.082) (0.080) School Value‐Added 2 Years Ago 0.091 *** 0.112 *** 0.092 *** 0.090 *** 0.101 *** 0.120 *** 0.106 *** 0.099 ***
(0.027) (0.027) (0.026) (0.026) (0.029) (0.030) (0.028) (0.027) N (Observations) 1759 1759 1842 1842 1759 1759 1842 1842Teacher‐Level Controls ‐‐‐ X ‐‐‐ X ‐‐‐ X ‐‐‐ X
Notes: *p<.05, **p<.01, ***p<.001 The version of school value‐added used includes student fixed effects and (time‐varying) student, school, and class controls. In the IV models, we instrument for prior teacher value‐added in a given subject with their value‐added in the opposite subject.
OLS IVMath Reading Math Reading
38
Table 5. Logistic Regression of Teacher Turnover by Teacher and School ValueAdded, Teachers with Experience of 5 years or fewer [odds ratio/tstatistic]
1 2 3Math Value Added, Continuous MeasuresTeacher Value Added 0.811 *** 0.832 *** 0.786 ***
(‐6.508) (‐6.437) (‐6.657) School*Teacher Value Added 0.925 * 0.940 * 0.934 *
(‐2.378) (‐2.004) (‐2.077) Math Value Added, Quartile Measures Teacher Value‐Added: Bottom Quartile 1.342 *** 1.378 *** 1.267 *** (4.220) (4.558) (3.385) Teacher Value‐Added: Top Quartile 1.004 1.043 0.952 (0.052) (0.505) (‐0.585) School Value‐Added: Top Quartile 1.177 + 1.113 1.114
(1.682) (1.094) (1.100) TVA Bottom Quartile*SVA Top Quartile 0.907 0.979 1.053
(‐0.702) (‐0.151) (0.349) TVA Top Quartile* SVA Top Quartile 0.579 *** 0.659 ** 0.734 * (‐3.515) (‐2.705) (‐2.116) Teacher and School Controls X X XSchool Fixed Effect X X XN 10333 10333 10325Reading Value Added, Continuous MeasuresTeacher Value Added 0.914 ** 0.909 ** 0.934 *
(‐3.226) (‐3.260) (‐2.063) School*Teacher Value Added 0.981 0.970 0.982
(‐0.687) (‐1.038) (‐0.623) Reading Value Added, Quartile Measures Teacher Value‐Added: Bottom Quartile 1.008 1.056 0.996 (0.116) (0.793) (‐0.053) Teacher Value‐Added: Top Quartile 0.839 * 0.848 * 0.922 (‐2.246) (‐2.129) (‐1.051) School Value‐Added: Top Quartile 1.093 1.114 1.084
(0.927) (1.124) (0.832) TVA Bottom Quartile*SVA Top Quartile 1.001 0.991 1.031
(0.004) (‐0.066) (0.207) TVA Top Quartile* SVA Top Quartile 0.812 0.756 + 0.832 (‐1.390) (‐1.837) (‐1.290) Teacher and School Controls X X XSchool Fixed Effect X X XN 11293 11293 11293
Notes: *p<.05, **p<.01, ***p<.001 Models 1, 2, and 3 differ in terms of the measure of teacher value‐added used. Model 1 uses a version of teacher value‐added estimated with student, class, and school‐level controls. Model 2 uses a version of teacher value‐added estimated with a school fixed effect and student, class and (time‐varying) school‐level controls. Model 3 uses a version of teacher value‐added estimated with a student fixed effect and (time‐varying) student, class, and school‐level controls. The version of school‐value added used is analagous to the version of teacher value‐added used in model 3.