Embed Size (px)
Citation preview

Effective treatment. Changing lives
Treatment Outcomes Profile (TOP)
Overview of TOP reportsJanuary 2010

Effective treatment. Changing lives
Contents
Introduction Hierarchy of TOP reports
Level 1 Treatment start TOP report Level 1 Treatment start TOP discrepancy report
Level 1 Treatment Review TOP report Level 2 Treatment Exit TOP report Level 3 Outcomes – Treatment Review report
A guidance on comparing and contrasting reports Additional TOP reports
Monthly reporting suite
How to access TOP reports Feedback form

Effective treatment. Changing lives
Introduction
This presentation has been created to give a brief introduction on the TOP reports that are currently available
It presents an overview of the TOP reporting hierarchy and additional TOP reports
For each report, the following break down is provided• What the report shows• How the report can be utilised • How often the report is available • Who is eligible for the report• How it can be accessed
IntroductionHierarchy of TOP reports
Additional TOP reportsHow to access TOP reports
Comparing and contrasting reports
Feedback form

Effective treatment. Changing lives
Hierarchy of TOP reports
TOP reporting forms part of a hierarchical structure that includes both descriptive and outcome based reports
Within these categories a range of reports are available. The majority are dependent on the level of compliance achieved by the partnership
To maximise the potential of TOP data being representative of the local treatment system, a data completeness threshold has been set to 80% for reports that are Levels 2 and above
IntroductionHierarchy of TOP reports
Additional TOP reportsHow to access TOP reports
Comparing and contrasting reports
Feedback form
Effective treatment. Changing lives
Hierarchy of TOP reports
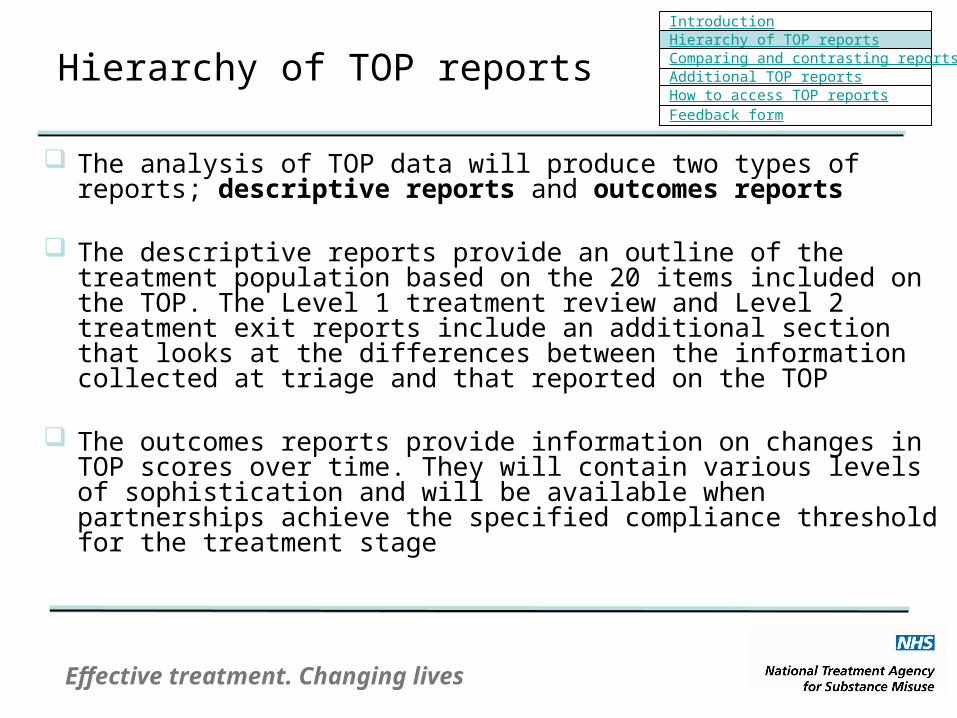
The analysis of TOP data will produce two types of reports; descriptive reports and outcomes reports
The descriptive reports provide an outline of the treatment population based on the 20 items included on the TOP. The Level 1 treatment review and Level 2 treatment exit reports include an additional section that looks at the differences between the information collected at triage and that reported on the TOP
The outcomes reports provide information on changes in TOP scores over time. They will contain various levels of sophistication and will be available when partnerships achieve the specified compliance threshold for the treatment stage
IntroductionHierarchy of TOP reports
Additional TOP reportsHow to access TOP reports
Comparing and contrasting reports
Feedback form

Effective treatment. Changing lives
Hierarchy of TOP reports
The format of the Hierarchy of TOP reports has changed. Previously the hierarchy structure looked like this…
IntroductionHierarchy of TOP reports
Additional TOP reportsHow to access TOP reports
Comparing and contrasting reports
Feedback form

Effective treatment. Changing lives
Report level Report type % Compliance
Change in mean TOP scores (linked)
Outcomes
80%
80%
Treatment Review
Treatment Exit
Treatment Review
Treatment Exit
Treatment Review
Treatment Exit
80%RCC (case mix adjusted)3b
Reliable Clinical Change (RCC)3a
3
80%
80%
80%
2
Treatment Start
Treatment Exit
Descriptive
0%
80%
Treatment Review 0%
80% compliance is not required
Report
level
Variations of reports within the reporting level
1 Profile reports 0%
3
3a
3b
Reliable Clinical Change (RCC)
RCC (case mix adjusted) 80%3b RCC (case mix adjusted)3b 80%RCC (case mix adjusted)3b
Reliable Clinical Change (RCC)
80%RCC (case mix adjusted)3b RCC (case mix adjusted)3b
3a
…and it has now changed to this format
The Level 0 treatment start report is re-labelled as The Level 1 treatment start report
Hierarchy of TOP reports IntroductionHierarchy of TOP reports
Additional TOP reportsHow to access TOP reports
Comparing and contrasting reports
Feedback form
Level 1 reports will now include the previously titled Level 2 Treatment review report.
Level 1 reports have no compliance requirements for eligibility
Effective treatment. Changing lives
Report level Report type % Compliance
Change in mean TOP scores (linked)
Outcomes
80%
80%
Treatment Review
Treatment Exit
Treatment Review
Treatment Exit
Treatment Review
Treatment Exit
80%RCC (case mix adjusted)3b
Reliable Clinical Change (RCC)3a
3
80%
80%
80%
2
Treatment Start
Treatment Exit
Descriptive
0%
80%
Treatment Review 0%
80% compliance is not required
Report
level
Variations of reports within the reporting level
1 Profile reports 0%
Hierarchy of TOP reports
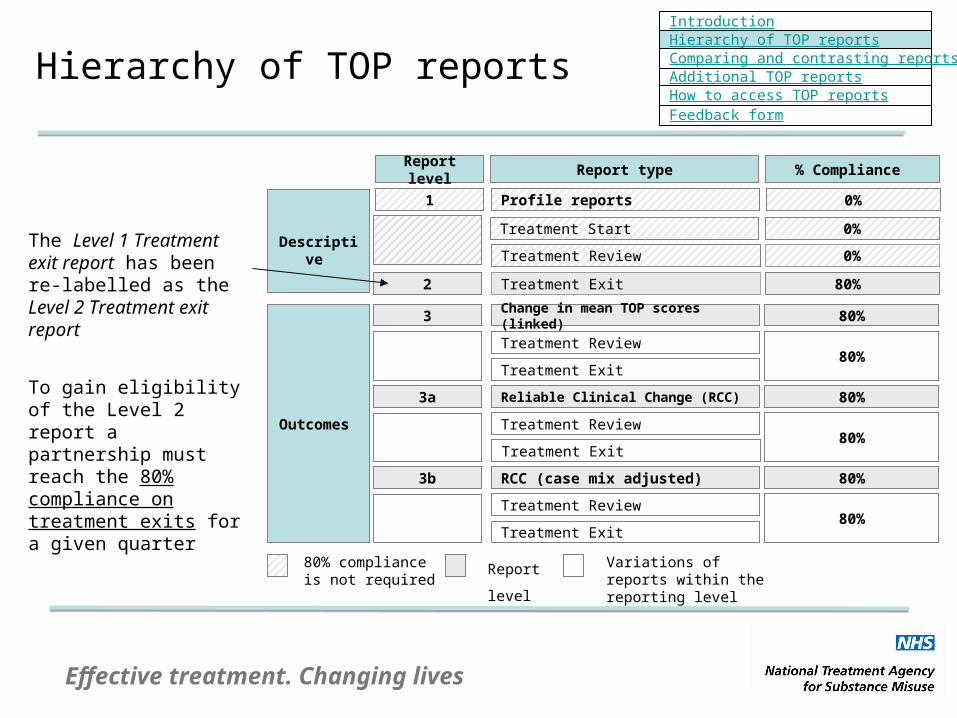
The Level 1 Treatment exit report has been re-labelled as the Level 2 Treatment exit report
IntroductionHierarchy of TOP reports
Additional TOP reportsHow to access TOP reports
Comparing and contrasting reports
Feedback form
To gain eligibility of the Level 2 report a partnership must reach the 80% compliance on treatment exits for a given quarter
Effective treatment. Changing lives
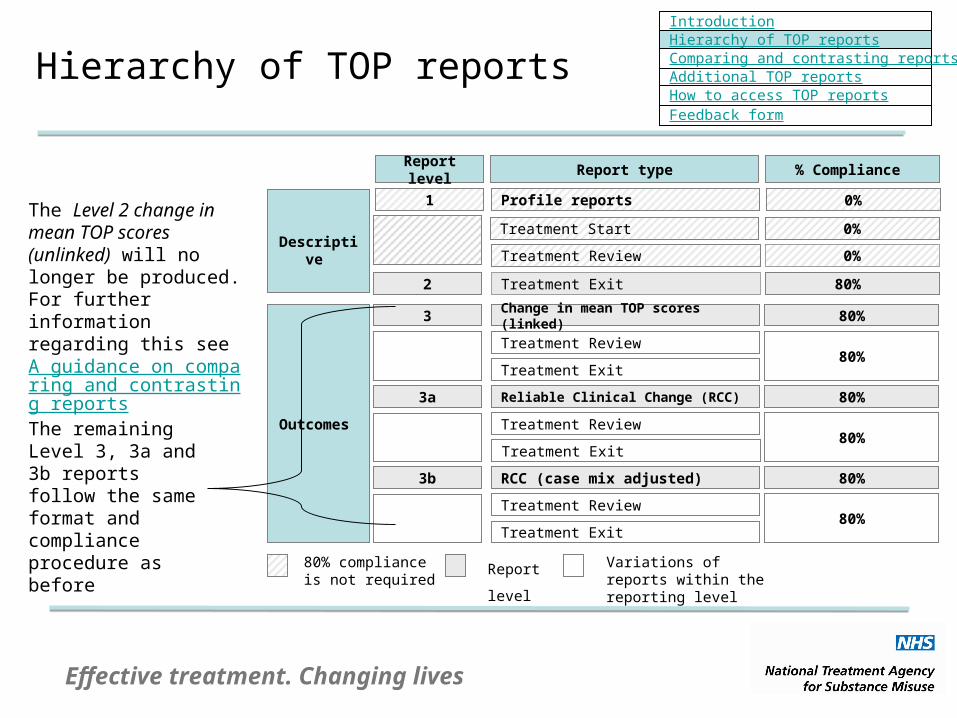
The Level 2 change in mean TOP scores (unlinked) will no longer be produced. For further information regarding this see A guidance on comparing and contrasting reports
The remaining Level 3, 3a and 3b reports follow the same format and compliance procedure as before
Hierarchy of TOP reports IntroductionHierarchy of TOP reports
Additional TOP reportsHow to access TOP reports
Comparing and contrasting reports
Feedback form
Report level Report type % Compliance
Change in mean TOP scores (linked)
Outcomes
80%
80%
Treatment Review
Treatment Exit
Treatment Review
Treatment Exit
Treatment Review
Treatment Exit
80%RCC (case mix adjusted)3b
Reliable Clinical Change (RCC)3a
3
80%
80%
80%
2
Treatment Start
Treatment Exit
Descriptive
0%
80%
Treatment Review 0%
80% compliance is not required
Report
level
Variations of reports within the reporting level
1 Profile reports 0%

Effective treatment. Changing lives
Report level Report type % Compliance
Change in mean TOP scores (linked)
Outcomes
80%
80%
Treatment Review
Treatment Exit
Treatment Review
Treatment Exit
Treatment Review
Treatment Exit
80%RCC (case mix adjusted)3b
Reliable Clinical Change (RCC)3a
3
80%
80%
80%
2
Treatment Start
Treatment Exit
Descriptive
0%
80%
Treatment Review 0%
80% compliance is not required
Report
level
Variations of reports within the reporting level
1 Profile reports 0%
Hierarchy of TOP reports IntroductionHierarchy of TOP reports
Additional TOP reportsHow to access TOP reports
Comparing and contrasting reports
Feedback form
The Level 3 Treatment exit and all Level 3a , 3b reports are not yet available.
All of these reports have been produced for various quarters and are available on NDTMS.net and DAMS (see slides How to access TOP reports)

Effective treatment. Changing lives
IntroductionHierarchy of TOP reports
Additional TOP reportsHow to access TOP reports
Comparing and contrasting reports
Feedback form
Report level Report type % Compliance
Change in mean TOP scores (linked)
Outcomes
80%
80%
Treatment Review
Treatment Exit
Treatment Review
Treatment Exit
Treatment Review
Treatment Exit
80%RCC (case mix adjusted)3b
Reliable Clinical Change (RCC)3a
3
80%
80%
80%
2
Treatment Start
Treatment Exit
Descriptive
0%
80%
Treatment Review 0%
80% compliance is not required
Report
level
Variations of reports within the reporting level
1 Profile reports 0%
The monthly exceptions reports are not formally part of the hierarchy of TOP reports, but do fit along side this structure.
The reports allow partnerships to monitor TOP compliance across the 3 TOP stages and check whether they have met the 80% compliance target therefore entitling them to the Level 2 and 3 reports
Exc
eptio
ns r
epor
t
Hierarchy of TOP reports TOP exceptions report
For further information on these report see the Exceptions report slide in Additional TOP reports
Effective treatment. Changing lives
Level 1 Treatment Start TOP report IntroductionHierarchy of TOP reports
Additional TOP reportsHow to access TOP reports
Comparing and contrasting reports
Feedback form
and Level 1 Treatment start TOP discrepancy report
Effective treatment. Changing lives
Level 1 Treatment Start TOP report and
IntroductionHierarchy of TOP reports
Additional TOP reportsHow to access TOP reports
Comparing and contrasting reports
Feedback form
Level 1 Treatment start TOP discrepancy report

Effective treatment. Changing lives
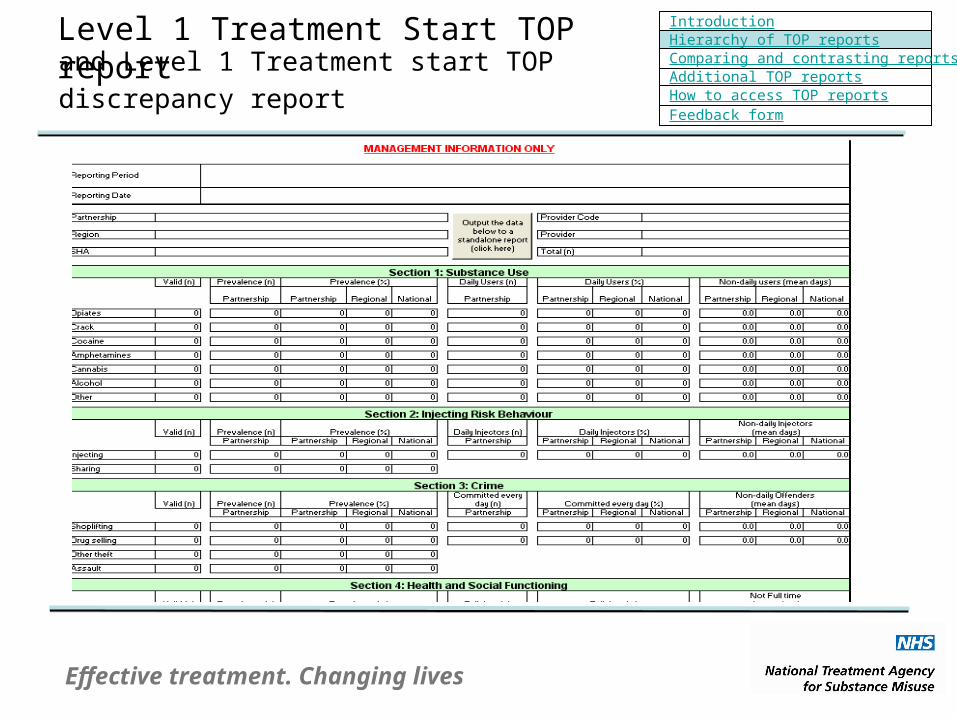
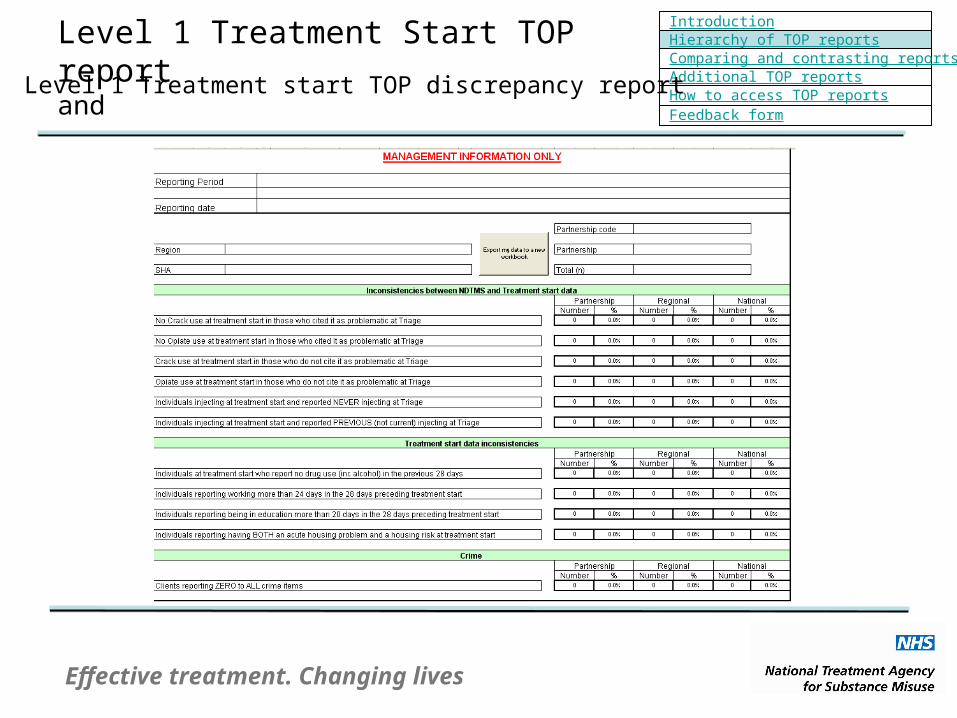
Level 1 Treatment Start TOP report and Level 1 Treatment start TOP discrepancy report
What does this report show? This report provides a profile of individuals starting treatment within a defined time-period (quarterly) for all providers that have submitted treatment start TOP data. All 20 TOP items are reported as well as national and regional averages. The discrepancy report is an additional report that accompanies the Level 1 treatment start report and highlights any inconsistencies that have occurred in the start TOP data
How can the report be utilised? The data reports on client behaviour in the 28 days before treatment started and presents a useful source of information on the profile of clients at the start of treatment in their local area and how this compares to national and regional averages. This is particularly helpful when thinking about which clients are presenting at different providers within a partnership. As a time sequence of reports is built up it will be possible to look at any trends in profiles of new clients starting treatment
How often is this report available? Quarterly
Who is eligible for this report and how can I access it?This report is available to all partnerships and providers, as there is no requirement to meet the 80% threshold of data completeness. See the How to access TOP reports section for further details
IntroductionHierarchy of TOP reports
Additional TOP reportsHow to access TOP reports
Comparing and contrasting reports
Feedback form
Effective treatment. Changing lives
Level 1 Treatment Review TOPIntroductionHierarchy of TOP reports
Additional TOP reportsHow to access TOP reports
Comparing and contrasting reports
Feedback form

Effective treatment. Changing lives
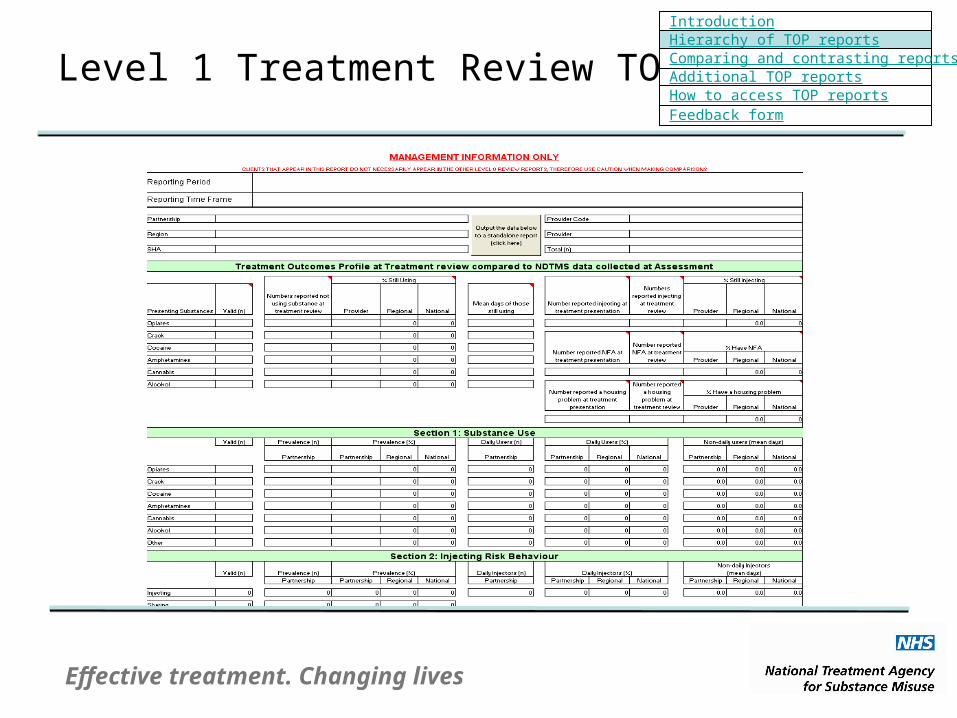
Level 1 Treatment Review TOP
What does this report show?This report offers a profile of all clients within a defined time-period, that have submitted treatment review TOP data. It is independent of whether a client has had a Treatment Start TOP or had subsequently been discharged. There are four reports which report on the latest Treatment review TOP completed for a client, 5 weeks - 6 months, 6 months -12 months, 1 to 4 years and 4 years plus, after the modality start date. The first section of the report compares data collected at triage (by NDTMS) to the treatment review TOP for the same set of individuals, enabling differences in behaviour to be identified. The second section looks at client behaviour on all 20 TOP items in the 28 days before their treatment review
How can the report be utilised? The first section will enable you to look at the number/percentage of clients that no longer use their presenting substance at treatment review or the number/percentage that continue to inject or have a housing problem. In the second section providers/partnerships can make comparisons in the 20 TOP items against regional and national averages. Also comparing each of the reports will enable you to see the long term change in reported client behaviour. Even though the same clients do not necessarily appear in each report, you can make general comparisons between the reported behaviour of clients that have been in treatment for a short period of time compared to those that have been in longer.
How often is this report available? Every 6 months
Who is eligible for this report and how can I access it?This report is available to all partnerships and providers, as there is no requirement to meet the 80% threshold of data completeness. See the How to access TOP reports section for further details
IntroductionHierarchy of TOP reports
Additional TOP reportsHow to access TOP reports
Comparing and contrasting reports
Feedback form

Effective treatment. Changing lives
Level 2 Treatment Exit TOPIntroductionHierarchy of TOP reports
Additional TOP reportsHow to access TOP reports
Comparing and contrasting reports
Feedback form

Effective treatment. Changing lives
Level 2 Treatment Exit TOP
What does this report show?This report provides information on clients that have had a planned exit from the treatment system and a treatment exit TOP completed. The TOP exit data is not linked to treatment start TOP data but the first section of the report does compare treatment start data collected at triage by NDTMS to treatment exit TOP data, for the same set of clients, so that some change in behaviour can be identified. The second section looks at client behaviour in the 28 days before treatment exit on each of the four TOP domains.
How can the report be utilised? While the information in this report is not linked to Treatment Start TOP, it does provide a useful description of what clients looked like across the 20 TOP items when exiting the treatment system. The comparison of triage data to the exit TOP, shows the number and percentage of clients that are still using their presenting substance at exit and how often. This percentage can be compared to regional and national averages. Similarly with the injecting and housing status, it is possible to see if clients have ceased injecting and no longer have an indentified housing need.
How often is this report available? Quarterly
Who is eligible for this report and how can I access it?This Level 1 report is only available to partnerships that have reached the 80% threshold for Treatment Exit TOP compliance (as indicated by the latest quarter) and providers in their area. See the How to access TOP reports section for further details
IntroductionHierarchy of TOP reports
Additional TOP reportsHow to access TOP reports
Comparing and contrasting reports
Feedback form

Effective treatment. Changing lives
Level 3 Outcomes – Treatment Reviewreport
IntroductionHierarchy of TOP reports
Additional TOP reportsHow to access TOP reports
Comparing and contrasting reports
Feedback form

Effective treatment. Changing lives
Level 3 Outcomes – Treatment Reviewreport
What does this report show?The Level 3 Outcomes Treatment Review report is the first of the TOP reports that is entirely about client outcomes. It compares changes in mean scores (e.g. average days use) at Treatment start and the latest 5-26 week Treatment review for the same clients on each of the 20 TOP items. Therefore showing changes, in using, injecting and social functioning between Treatment Start and Treatment review TOP. It also shows the percentage of clients that are abstinent from their presenting drug and the number (and percentage) of clients that reported not using treatment start but started reporting use during treatment.
How can the report be utilised? You may find it useful to look at the % of clients that become abstinent in a substance that they presented to treatment with, or one
that they showed use of at treatment start. These abstinent levels can be compared to regional and national performance. Also for those clients that have not become abstinent, average changes in use, injecting or social functioning can be observed and similar comparisons made. Is it worth noting here that for the majority of items in the level 3 report a reduction (days) is positive BUT for work and education (days) is not so good.
How often is this report made available? Quarterly
Who is this report available to and how can I access it?To qualify for the report, Partnerships must have completed a TOP for at least 80% of clients who started treatment as well as having completed a review TOP for 80% of those clients. The report will only be available for these qualifying partnerships and all of the providers in that partnership area. See the How to access TOP reports section for further details
The information contained in the Level 3 Outcomes report should NOT be used for the purpose of delivery assurance. All data is RESTRICTED and should not be disseminated beyond the partnership or provider
IntroductionHierarchy of TOP reports
Additional TOP reportsHow to access TOP reports
Comparing and contrasting reports
Feedback form

Effective treatment. Changing lives
A guidance on comparing and contrastingreports
Why change from a report to a guidance?As the Level 2 Contrast Reports would have effectively been the Level 1 (treatment start information) and Level 2 (treatment exit information) report side by side, the decision was made to cancel the report and instead produce a guidance which contains suggestions on the contrasts that can be made between the two reports
How can the guidance be utilised? The guidance illustrates how changes can be observed and interpreted in the cross-section of reported behaviours at different time points in the treatment journey. For example, comparisons between how daily (or Full time) engagement in a particular TOP item compares between clients starting treatment and those exiting treatment during the same quarter, may help to give a rough indication of the impact of treatment
Where can I access this guidance?The guidance is in the 2nd section of the Treatment exit TOP guidance. See the How to access TOP reports section for further details
IntroductionHierarchy of TOP reports
Additional TOP reportsHow to access TOP reports
Comparing and contrasting reports
Feedback form
Effective treatment. Changing lives
Additional TOP reports
As well as generating the TOP hierarchy of reports, the analysis team also produce 5 additional reports that have been developed to help improve TOP compliance, data quality and planned exits
Monthly reporting suite TOP exceptions treatment start (Adult and YP) TOP exceptions treatment review (Adult and YP) TOP exceptions treatment exit (Adult and YP) Drug use at exit TOP trend tool
IntroductionHierarchy of TOP reports
Additional TOP reportsHow to access TOP reports
Comparing and contrasting reports
Feedback form

Effective treatment. Changing lives
Additional TOP reports
TOP Exceptions – treatment start, treatment review and treatment exit report
What does this report show?The monthly exceptions report is made up of 3 reports which look at the: Treatment start TOP, Treatment review TOP* and Treatment exit TOP. The report is available in a 3 month and 1 month rolling format.For each treatment stage, the TOP exceptions report show the expected number of TOPs for a given time frame, the number and % that were completed within/outside of guidelines and the % and number of TOPs completed with NA (Not answered) only and questions populated with NA. (Start TOP has additional: % of crime questions answered with zero)
How can the report be utilised? The monthly exceptions report allows you to monitor how many TOP’s are being completed within guidelines in your region, partnership or provider and whether it is below or above the 80% threshold. Comparisons can be made against regional and national averages on performance and on quality assurance items such as the % of TOP completed outside of guidelines or % of NA on TOPs.
How often is this report available? Monthly
Who is this report available to and how can I access it? See the How to access TOP reports section for further details
* Currently the TOP exception treatment review reports on the first review period. This maybe extended to the second and third review period in the upcoming year
IntroductionHierarchy of TOP reports
Additional TOP reportsHow to access TOP reports
Comparing and contrasting reports
Feedback form
Effective treatment. Changing lives
Additional TOP reports
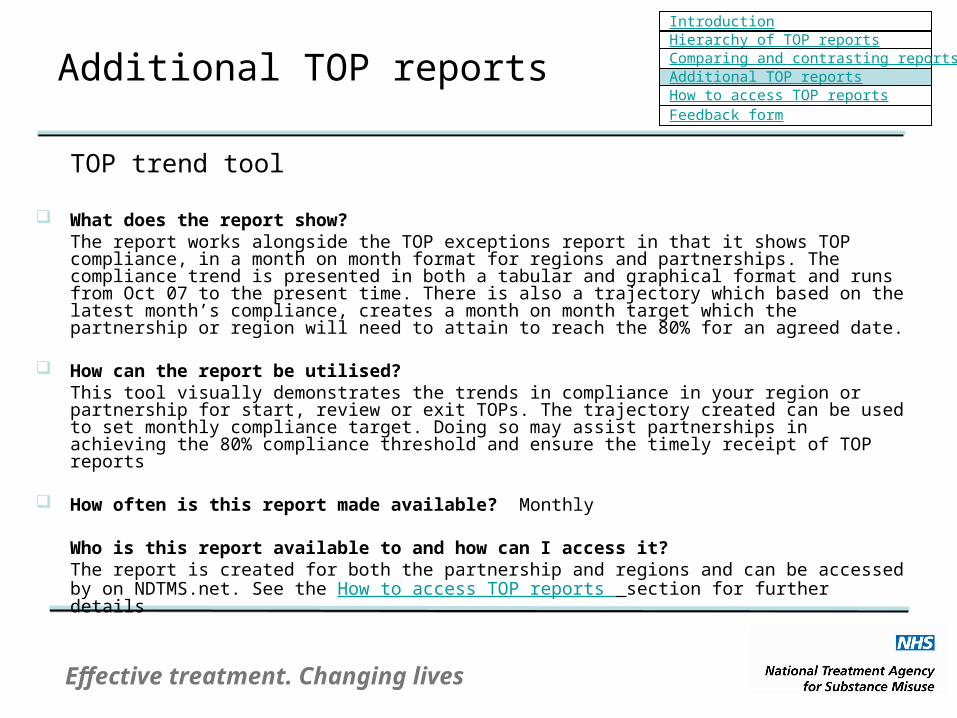
TOP trend tool
What does the report show?The report works alongside the TOP exceptions report in that it shows TOP compliance, in a month on month format for regions and partnerships. The compliance trend is presented in both a tabular and graphical format and runs from Oct 07 to the present time. There is also a trajectory which based on the latest month’s compliance, creates a month on month target which the partnership or region will need to attain to reach the 80% for an agreed date.
How can the report be utilised? This tool visually demonstrates the trends in compliance in your region or partnership for start, review or exit TOPs. The trajectory created can be used to set monthly compliance target. Doing so may assist partnerships in achieving the 80% compliance threshold and ensure the timely receipt of TOP reports
How often is this report made available? Monthly
Who is this report available to and how can I access it?The report is created for both the partnership and regions and can be accessed by on NDTMS.net. See the How to access TOP reports section for further details
IntroductionHierarchy of TOP reports
Additional TOP reportsHow to access TOP reports
Comparing and contrasting reports
Feedback form

Effective treatment. Changing lives
Additional TOP reports
Drug use at treatment exit
What does the report show?The report shows the levels of drug use at treatment exit. Specifically the number of clients that have had a planned discharge under the category of either Treatment completed drug free or Treatment completed occasional user (Not heroin or crack) and had a treatment exit TOP which reported Opiates or Crack use (i.e. they had taken the substance in the 28 days prior to treatment exit)
How can the report be utilised? The report can be used to identify providers or partnerships that have large numbers of clients that have had a planned discharge but continue to show use of problematic substances, opiate or crack, on exit and thus inform the discrepancy between clients leaving and the definitions of client exit
How often is this report made available? Monthly
Who is this report available to and how can I access it?The report is created for both the partnership and providers. See the How to access TOP reports section for further details
IntroductionHierarchy of TOP reports
Additional TOP reportsHow to access TOP reports
Comparing and contrasting reports
Feedback form

Effective treatment. Changing lives
How to access TOP reports
Partnerships can access the reports via NDTMS.net, by taking the following steps:
Go to the NDTMS website: https://www.ndtms.net/ Log into NDTMS.net using your normal log in details Select Restricted statistics (top centre) Then select TOP reports The reports are split by Quarterly and Monthly. The outcomes/descriptive reports are
located in the quarterly section, whilst the month reporting suite in the monthly section. Click on the report and save as in a location most appropriate for you. When opening any of the descriptive or outcome TOP reports, you will be prompted to
give a partnership code and password. Please use the unique TOP password that has been allocated to you
If you do not have a TOP password, please contact your regional NDTMS team http://www.nta.nhs.uk/areas/ndtms/regional_NDTMS_contacts.aspx
IntroductionHierarchy of TOP reports
Additional TOP reportsHow to access TOP reports
Comparing and contrasting reports
Feedback form

Effective treatment. Changing lives
How to access TOP reports
Provider can access the reports via DAMS, by taking the following steps:
Go to the DAMS website: https://www.ndtms.org/dams/Login.aspx Log into DAMS using your normal log in details Click onto the Reports button and then select Pre-generated reports On the left hand side you will see the heading Reports. Click on the TOP reports heading and
expand You will see some folders labeled with a financial year, within each one there are 2 sub-folders
labeled quarterly/monthly. All outcomes/descriptive reports can be found in the quarterly folders, whilst the monthly reports in the monthly folder.
Once you select the report, you will be prompted to open or save the file. Please click save Save the file in a location most appropriate for you Once the file has downloaded, please double click to open the folder When opening any of the descriptive or outcome TOP reports, you will be prompted to give an
agency code and password. Please use the unique TOP password that has been allocated to you If you do not have a TOP password, please contact your regional NDTMS team
http://www.nta.nhs.uk/areas/ndtms/regional_NDTMS_contacts.aspx
IntroductionHierarchy of TOP reports
Additional TOP reportsHow to access TOP reports
Comparing and contrasting reports
Feedback form

Effective treatment. Changing lives
Feedback form
We have now developed a feed back form that can be used by providers and partnerships to raise any concerns they may have about the data or any questions about the reports. The form will be available to download from the following locations by the beginning of March 2010.
Provider can access the form via DAMS, by taking the following steps:
Go to the DAMS website : https://www.ndtms.org/dams/Login.aspx Log into DAMS using your normal log in details Click onto the reports button (top centre) Click on pre-generated reports The feedback form will appear under the pre-generated reports
Partnerships can access the form via NDTMS.net, by taking the following steps:
Go to the NDTMS website : https://www.ndtms.net/ Log into NDTMS using your normal log in details Select RESTRICTED STATISTICS (top right) The feedback form will appear in the LATEST NEWS BOX
IntroductionHierarchy of TOP reports
Additional TOP reportsHow to access TOP reports
Comparing and contrasting reports
Feedback form


![0-World's Top-Class Water Treatment Technology [v]](https://img.pdfslide.net/doc/110x75/55cf98cf550346d03399c9e6/0-worlds-top-class-water-treatment-technology-v.jpg)