Embed Size (px)
Citation preview
1
Effectiveness of the Performance Evaluation System in the Public
Health Sector
Sabina [email protected]
PUHMA Seminar, Lugano, November 27°, 2012
Scuola Superiore Sant’Anna, Management & Health Laboratory (MeS Lab)
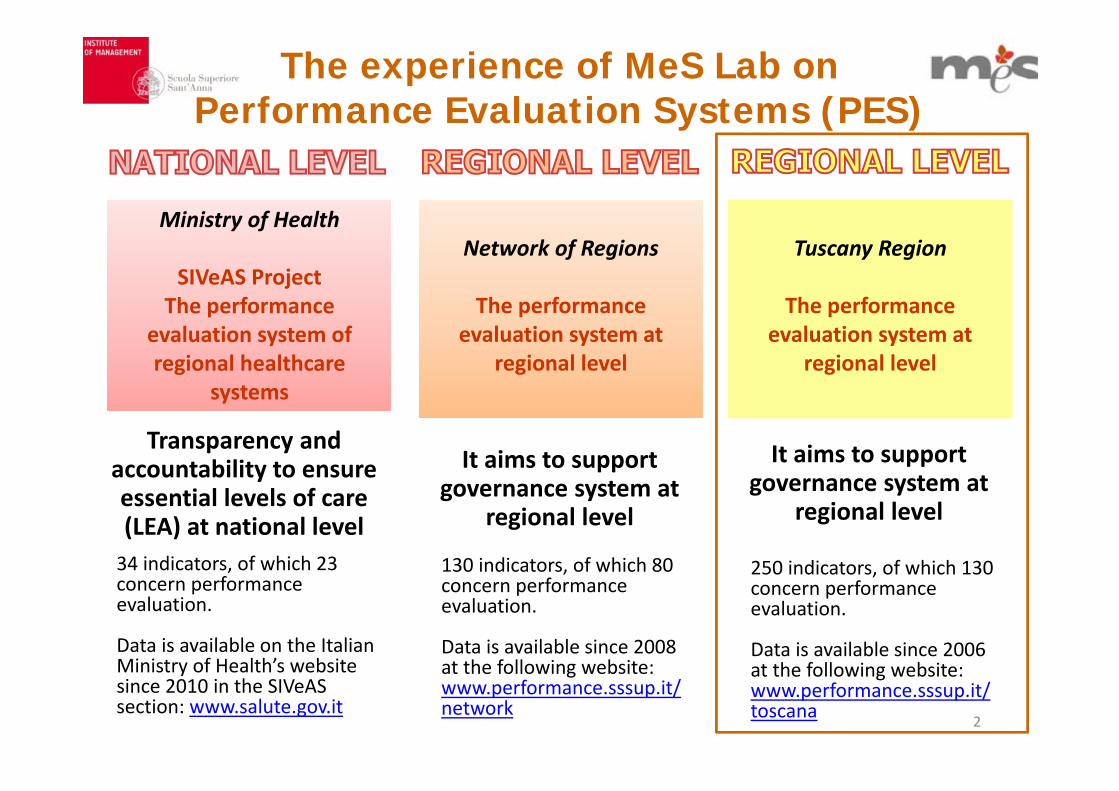
The experience of MeS Lab on Performance Evaluation Systems (PES)
It aims to support governance system at
regional level
34 indicators, of which 23 concern performance evaluation.
Data is available on the Italian Ministry of Health’s website since 2010 in the SIVeAS section: www.salute.gov.it
Network of Regions
The performance evaluation system at
regional level
Network of Regions
The performance evaluation system at
regional level
130 indicators, of which 80 concern performance evaluation.
Data is available since 2008 at the following website: www.performance.sssup.it/network
Transparency and accountability to ensure essential levels of care (LEA) at national level
Ministry of Health
SIVeAS ProjectThe performance
evaluation system of regional healthcare
systems
Ministry of Health
SIVeAS ProjectThe performance
evaluation system of regional healthcare
systems
2
It aims to support governance system at
regional level
Tuscany Region
The performance evaluation system at
regional level
Tuscany Region
The performance evaluation system at
regional level
250 indicators, of which 130 concern performance evaluation.
Data is available since 2006 at the following website:www.performance.sssup.it/toscana
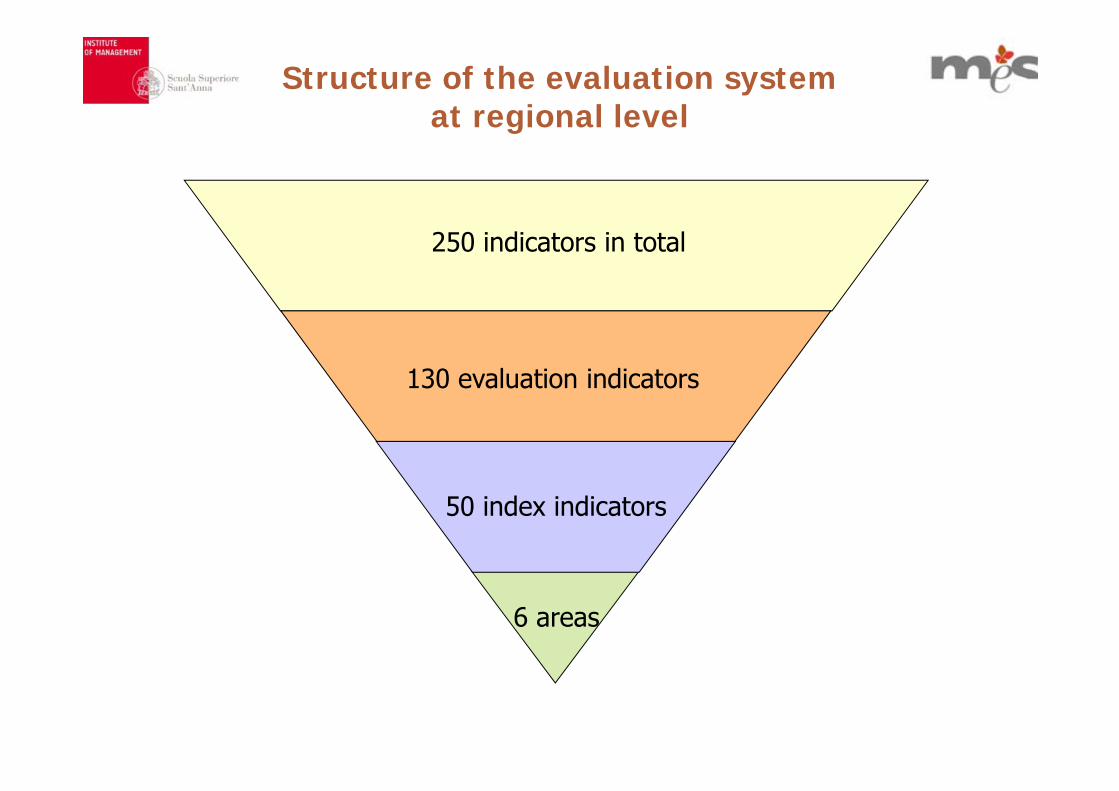
250 indicators in total
6 areas
50 index indicators
130 evaluation indicators
Structure of the evaluation system at regional level
4
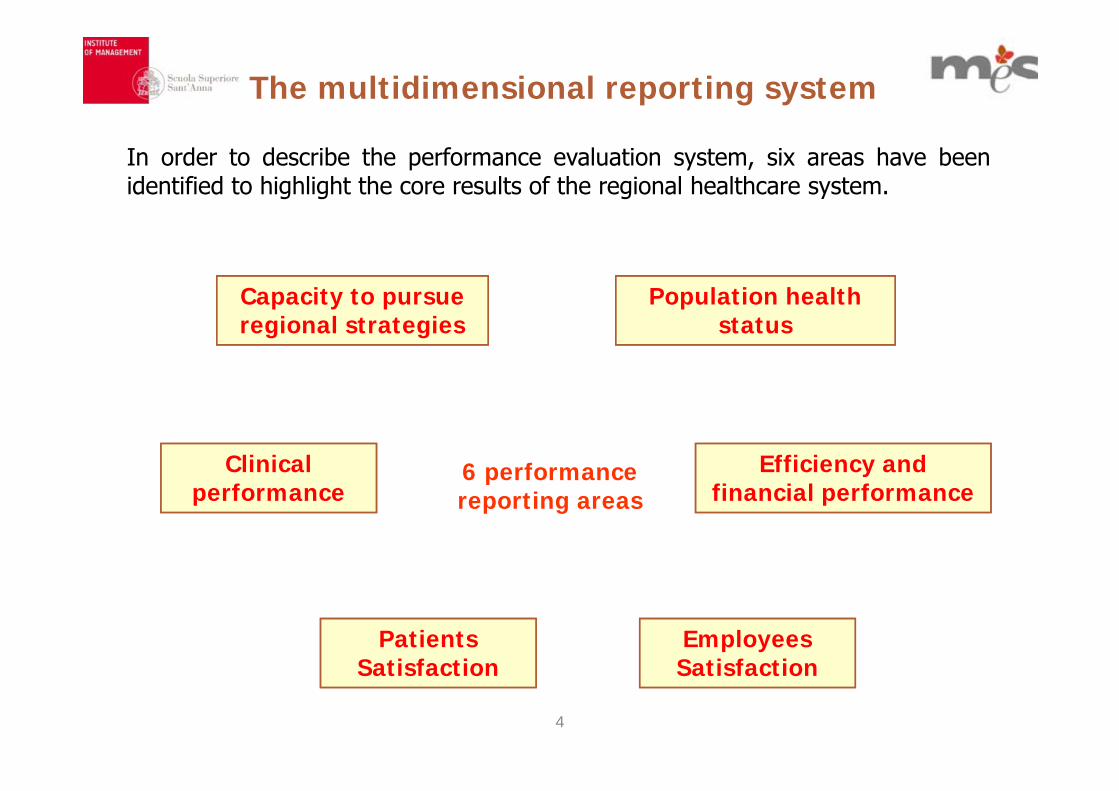
Efficiency and financial performance
Employees Satisfaction
Patients Satisfaction
Clinical performance
Capacity to pursue regional strategies
Population health status
The multidimensional reporting system
In order to describe the performance evaluation system, six areas have beenidentified to highlight the core results of the regional healthcare system.
6 performance reporting areas
5
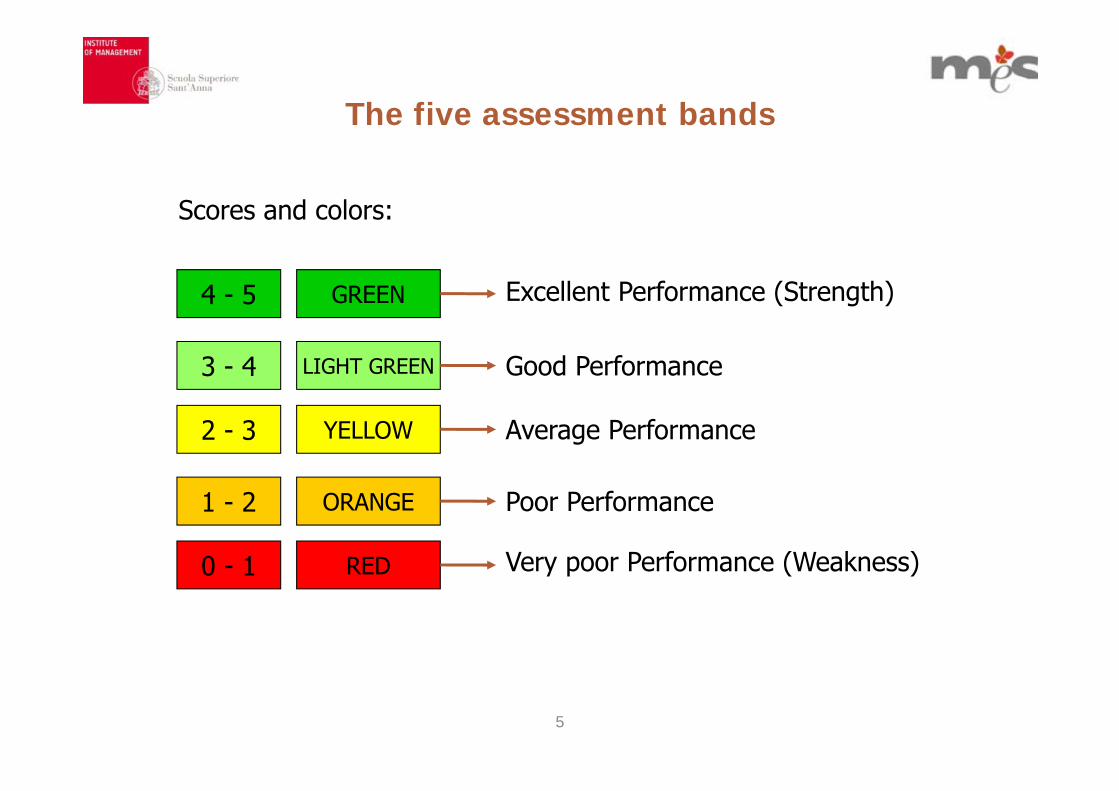
The five assessment bands
Scores and colors:
GREEN Excellent Performance (Strength)
LIGHT GREEN
YELLOW Average Performance
ORANGE Poor Performance
RED Very poor Performance (Weakness)
4 - 5
3 - 4
2 - 3
1 - 2
0 - 1
Good Performance
6
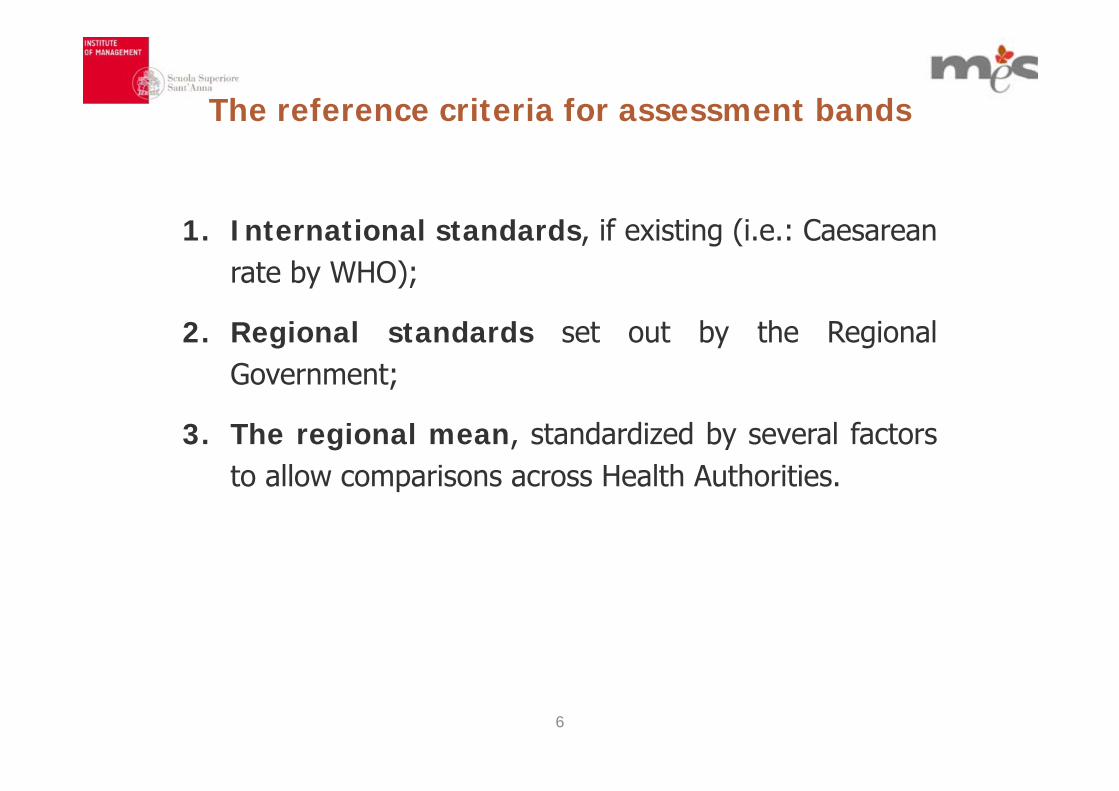
The reference criteria for assessment bands
1. International standards, if existing (i.e.: Caesareanrate by WHO);
2. Regional standards set out by the RegionalGovernment;
3. The regional mean, standardized by several factorsto allow comparisons across Health Authorities.
7
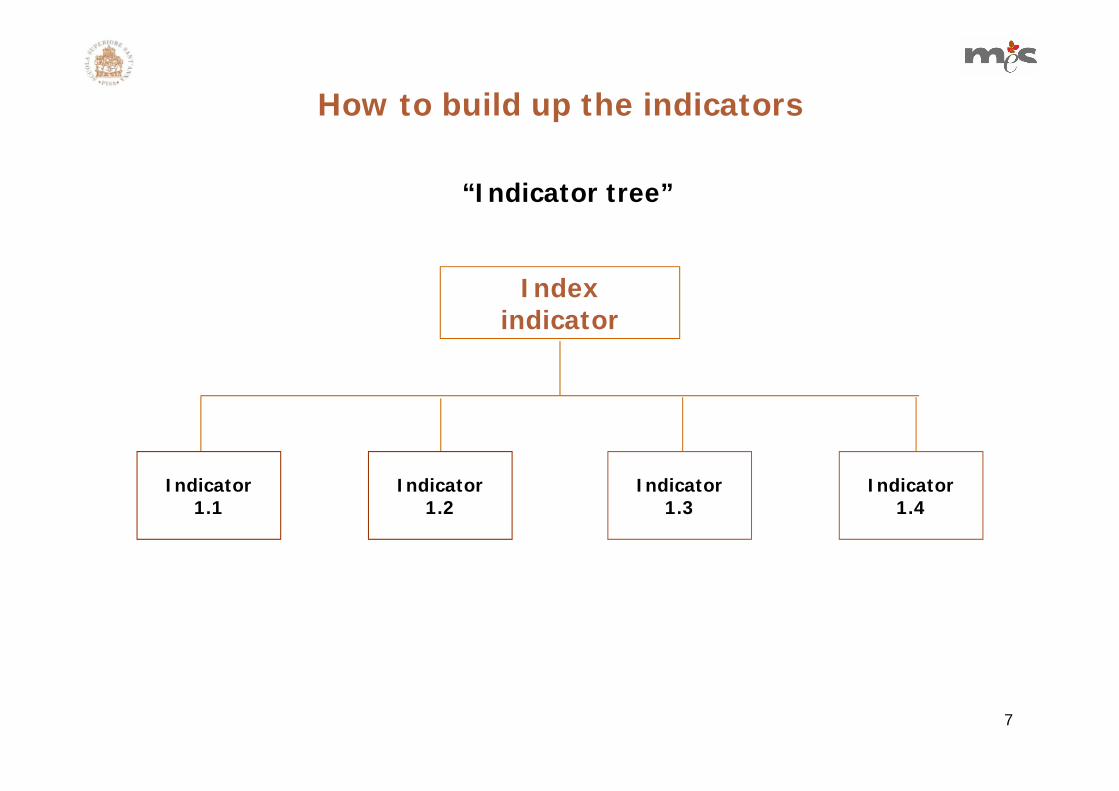
How to build up the indicators
Indicator 1.3
Indicator 1.4
Indicator 1.1
Indicator 1.2
Index indicator
“Indicator tree”
8
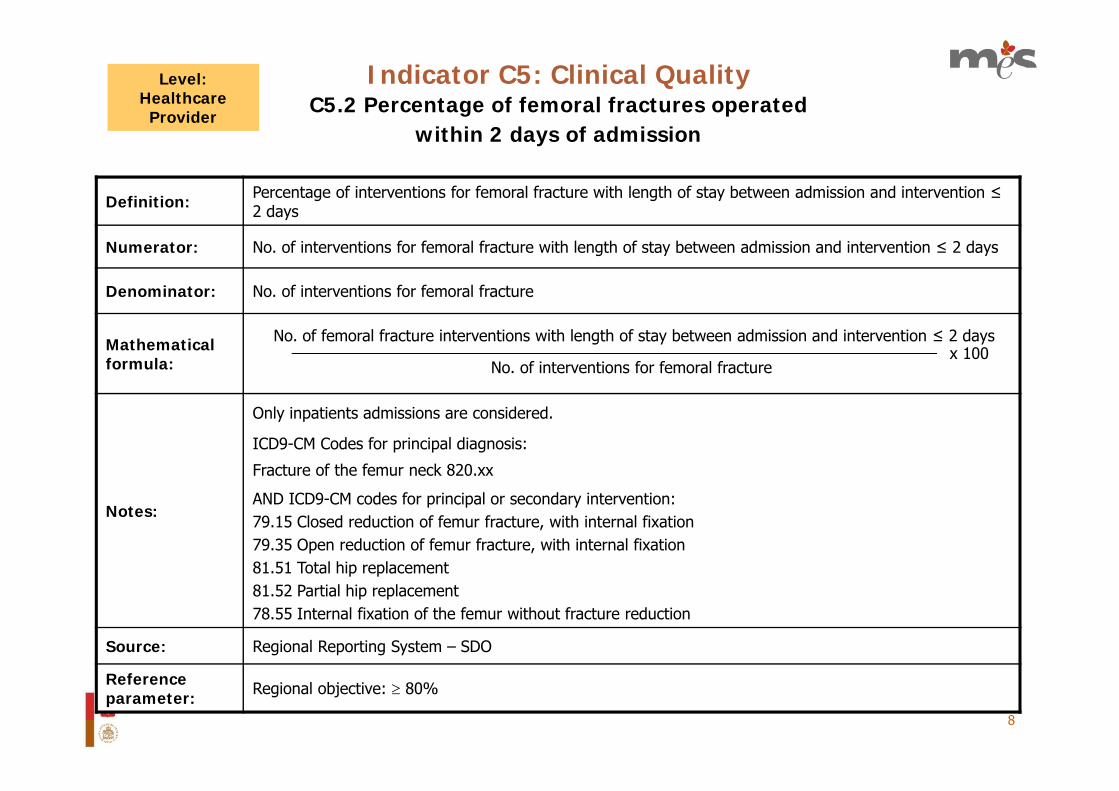
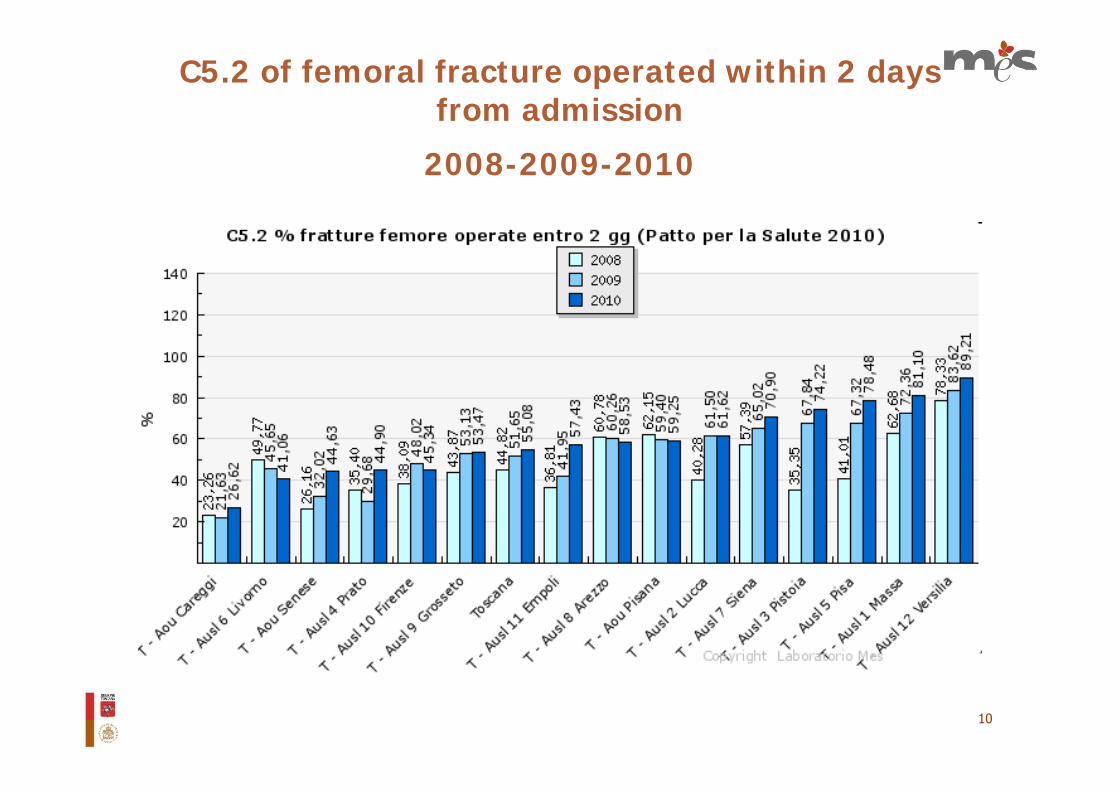
C5.2 Percentage of femoral fractures operatedwithin 2 days of admission
Indicator C5: Clinical Quality
Definition: Percentage of interventions for femoral fracture with length of stay between admission and intervention ≤ 2 days
Numerator: No. of interventions for femoral fracture with length of stay between admission and intervention ≤ 2 days
Denominator: No. of interventions for femoral fracture
Mathematical formula:
No. of femoral fracture interventions with length of stay between admission and intervention ≤ 2 days
No. of interventions for femoral fracture
Notes:
Only inpatients admissions are considered.
ICD9-CM Codes for principal diagnosis:
Fracture of the femur neck 820.xx
AND ICD9-CM codes for principal or secondary intervention: 79.15 Closed reduction of femur fracture, with internal fixation 79.35 Open reduction of femur fracture, with internal fixation 81.51 Total hip replacement81.52 Partial hip replacement78.55 Internal fixation of the femur without fracture reduction
Source: Regional Reporting System – SDO
Reference parameter: Regional objective: 80%
x 100
Level:Healthcare
Provider
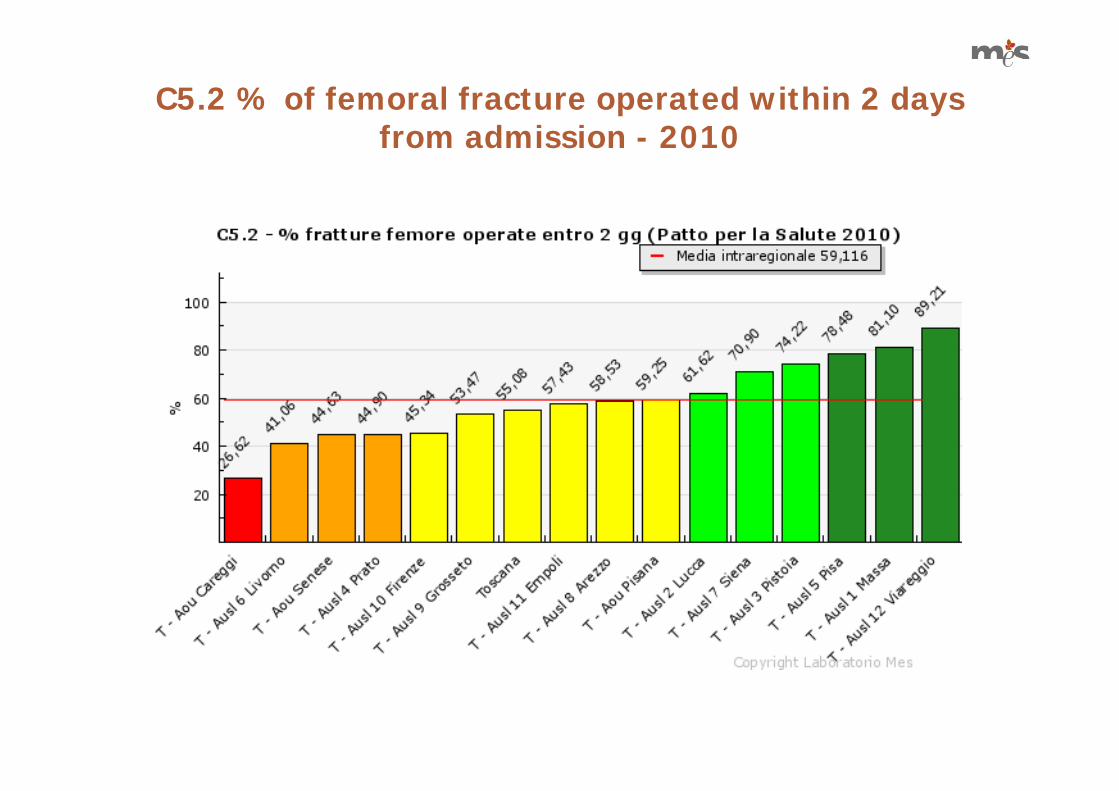
C5.2 % of femoral fracture operated within 2 days from admission - 2010
10
C5.2 of femoral fracture operated within 2 days from admission
2008-2009-2010
11
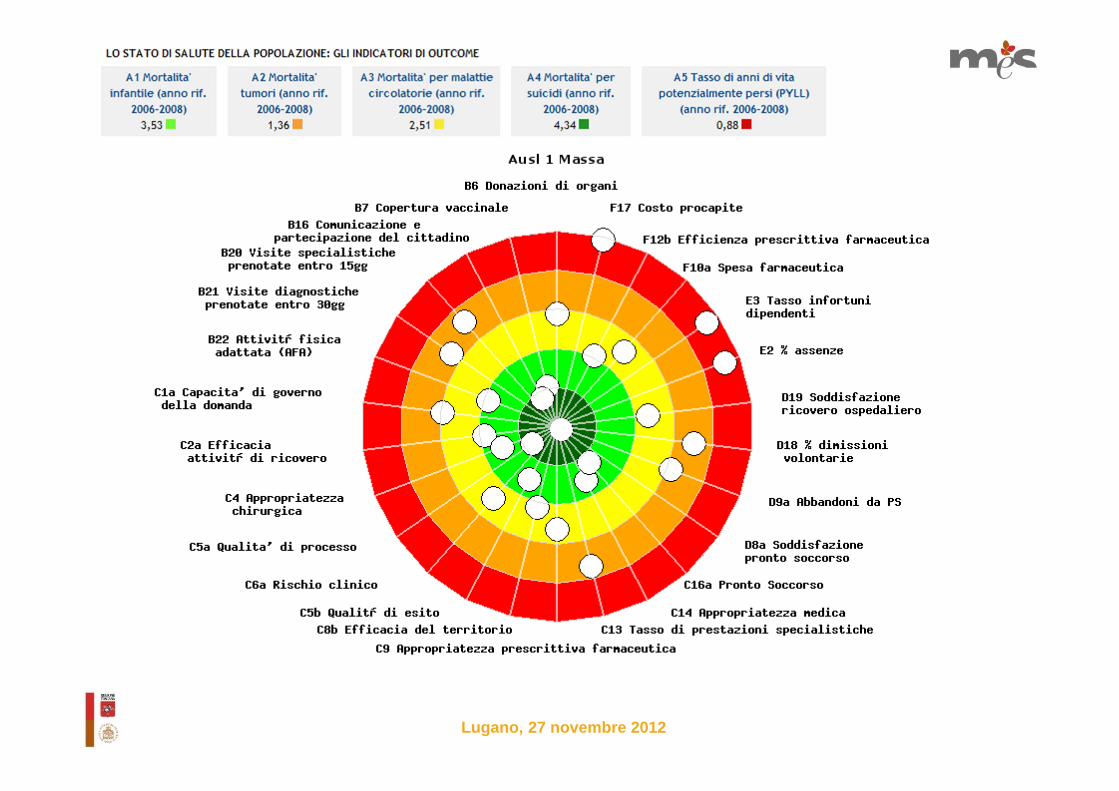
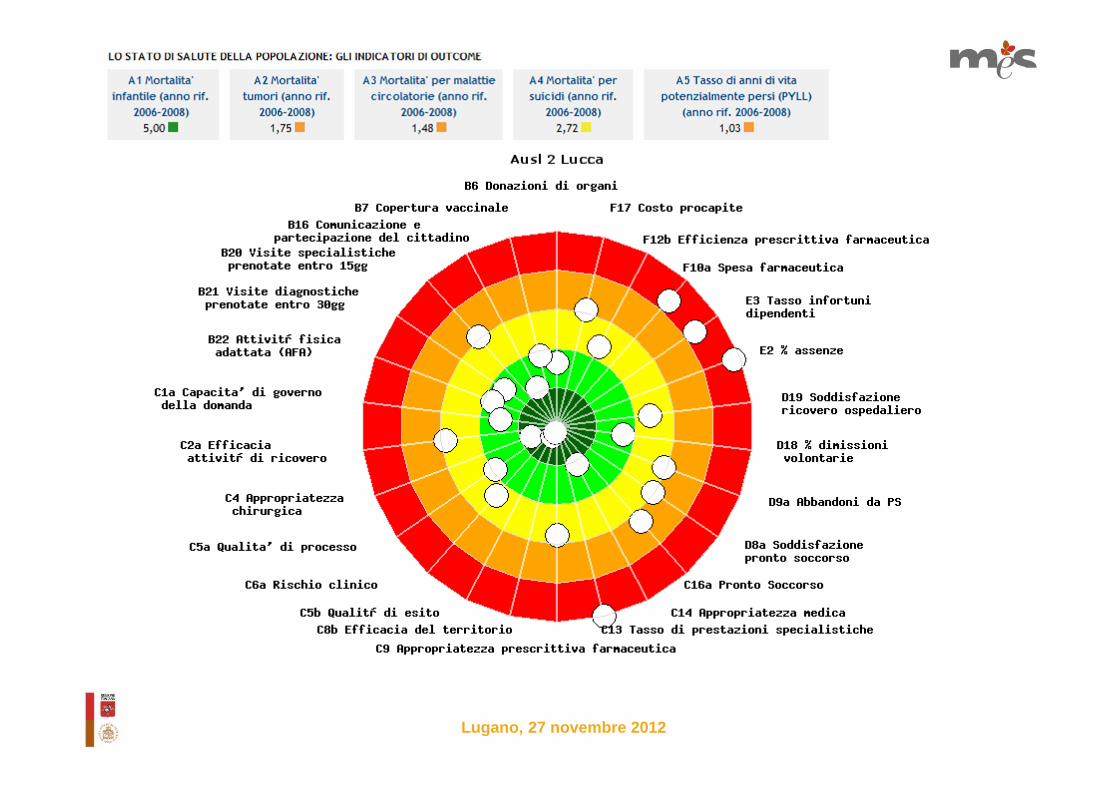
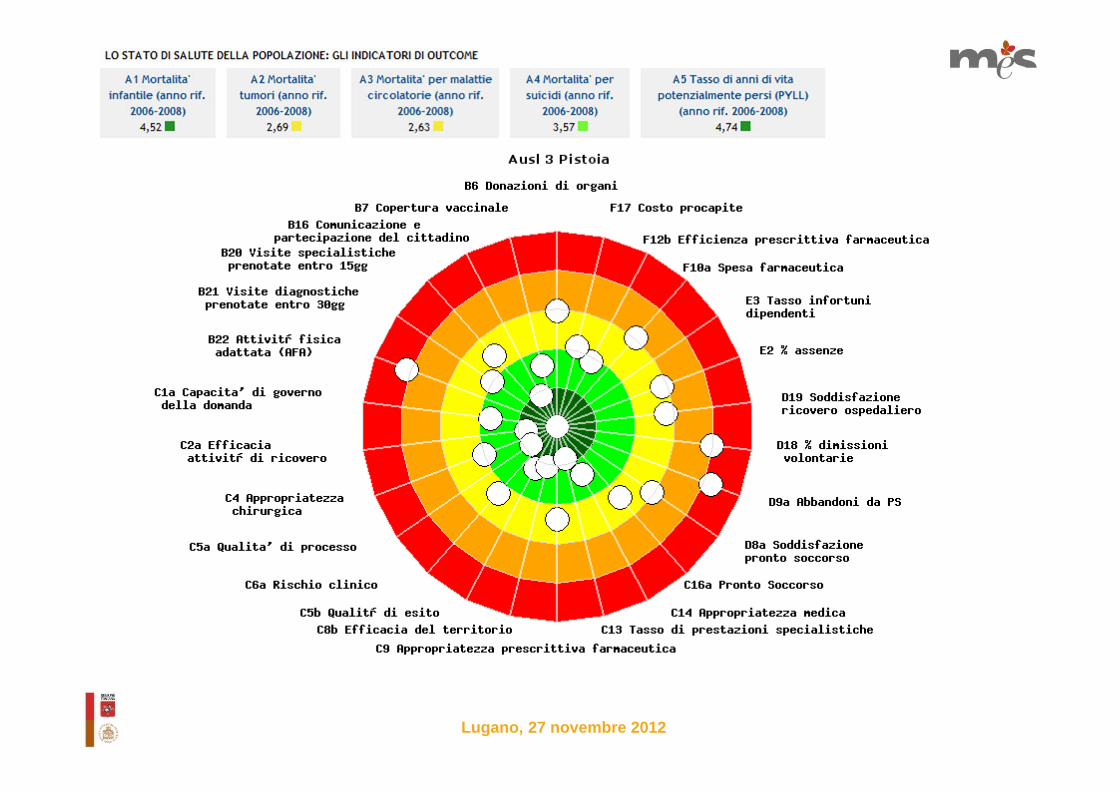
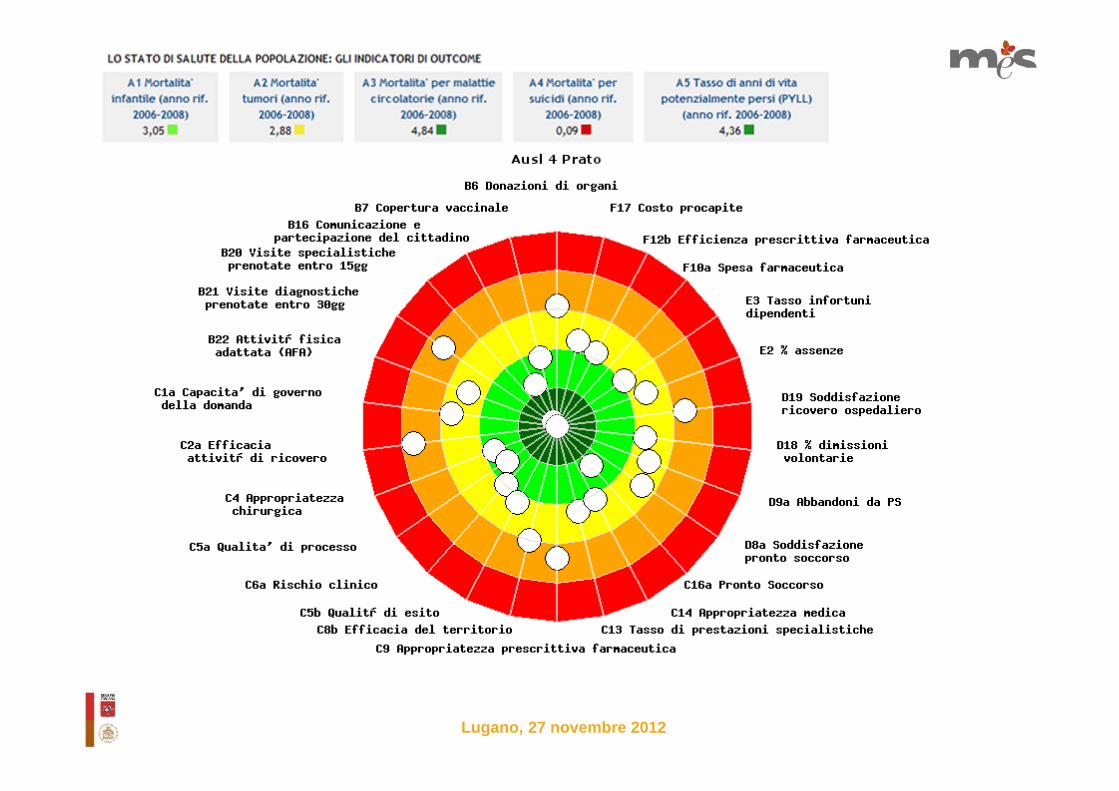
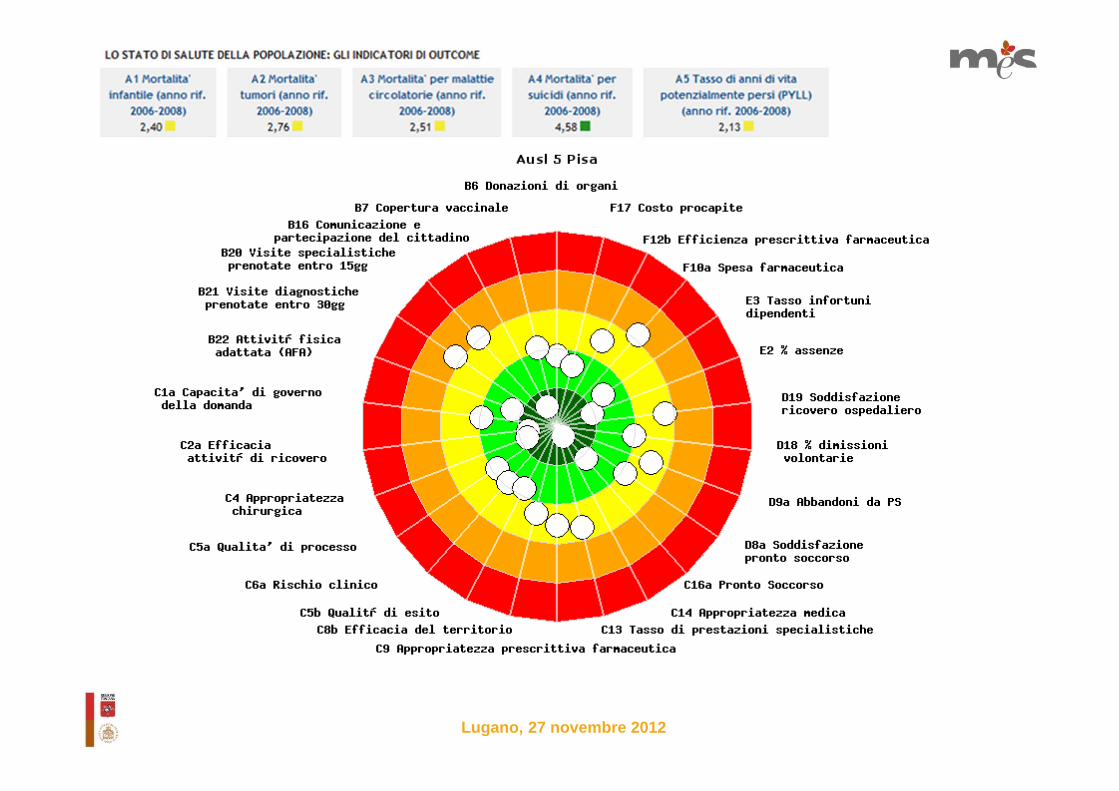
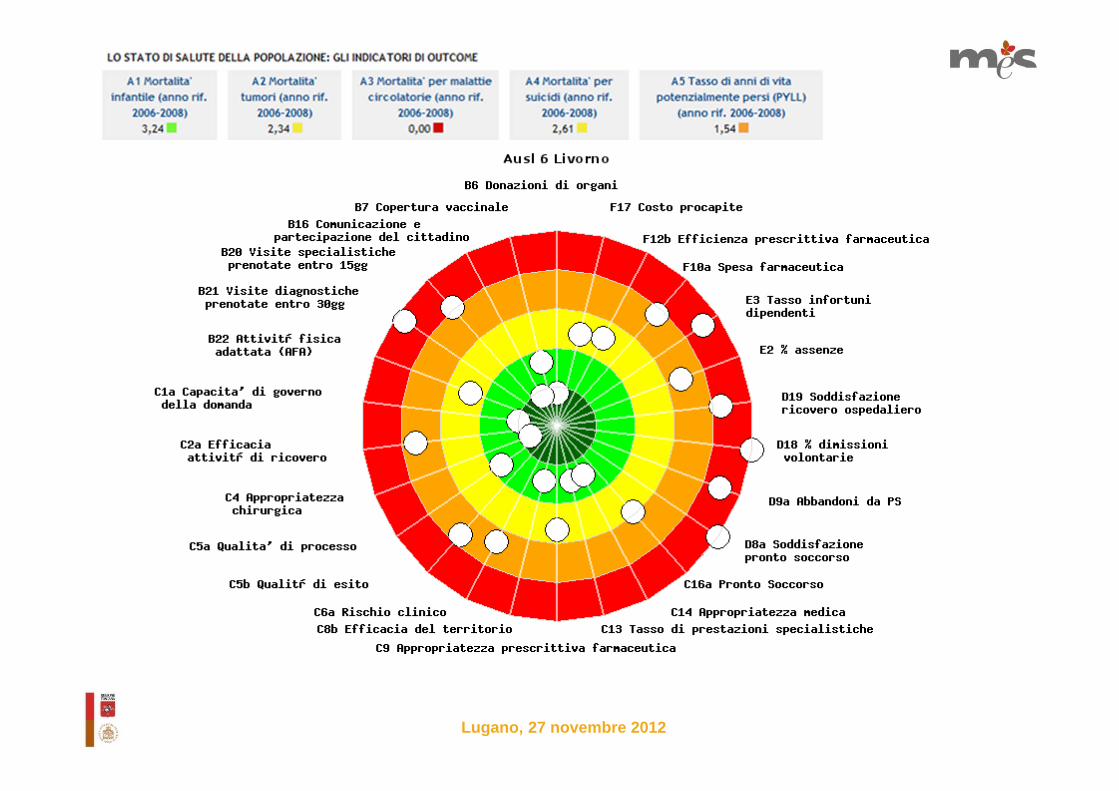
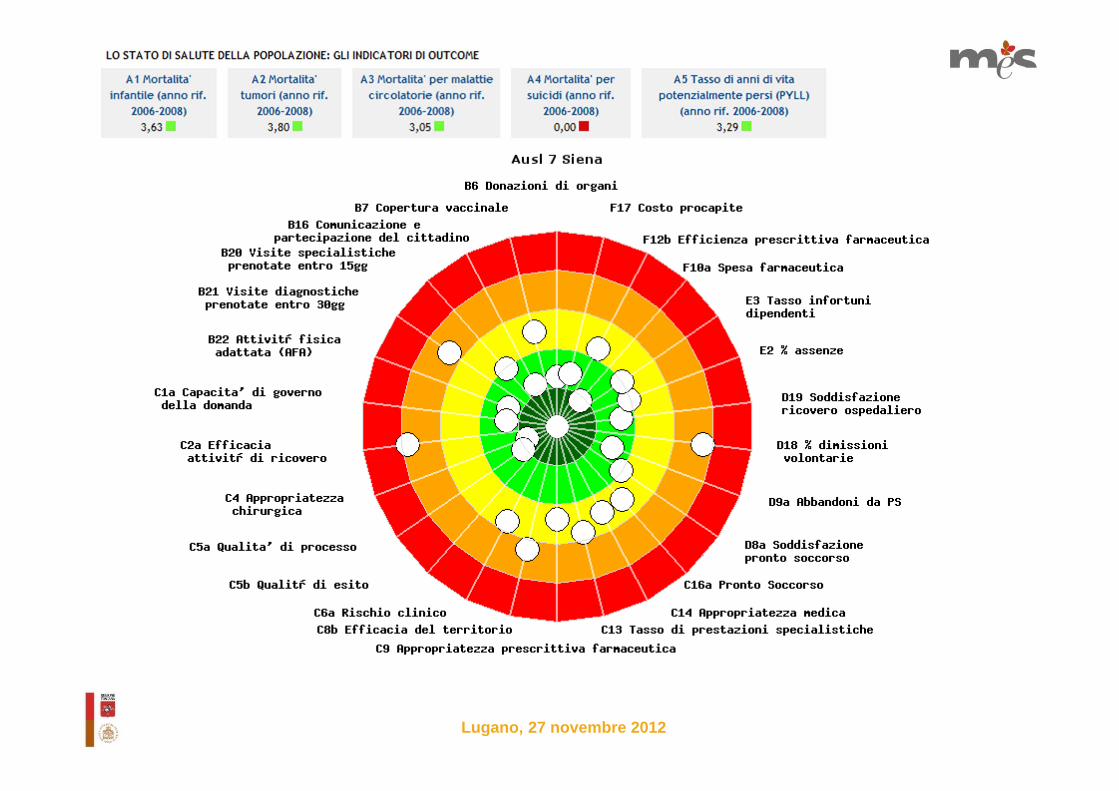
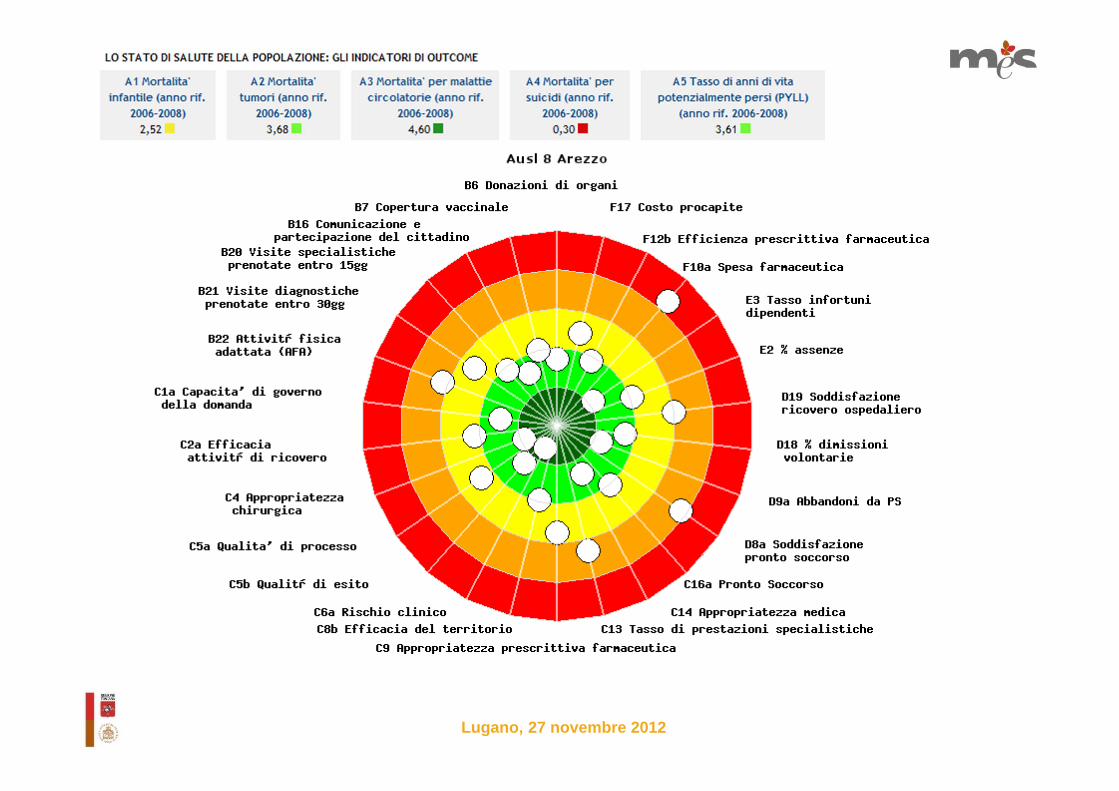
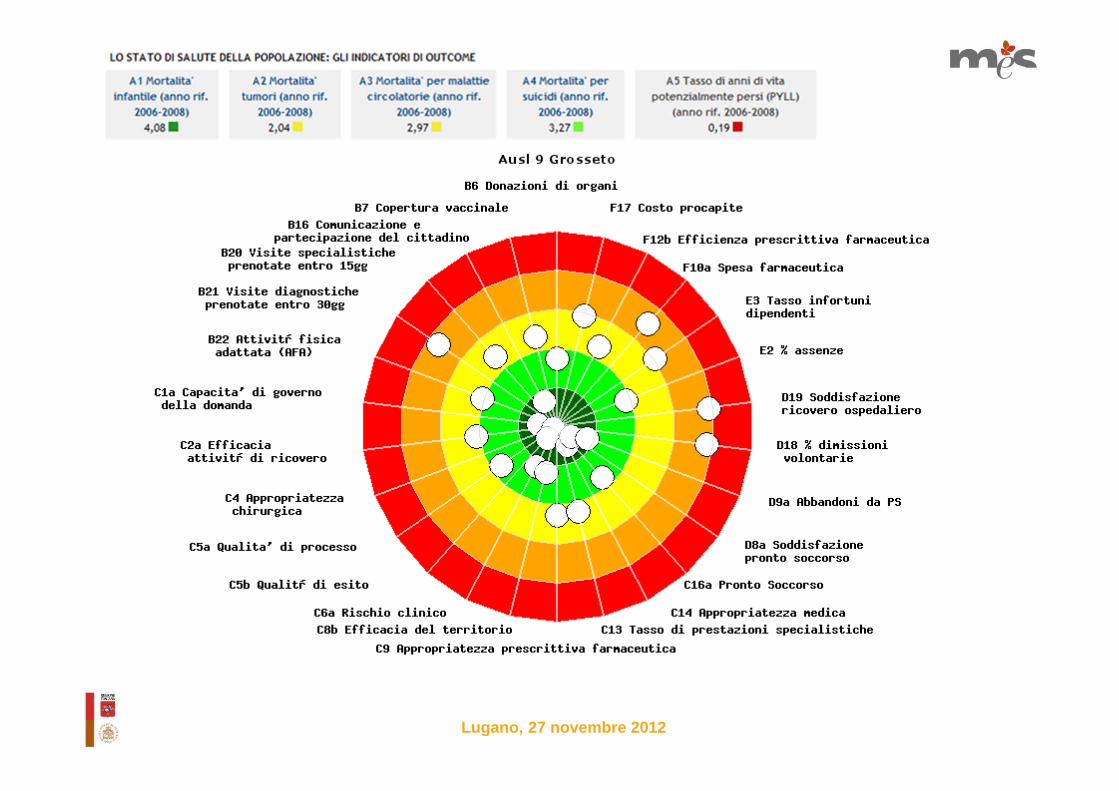
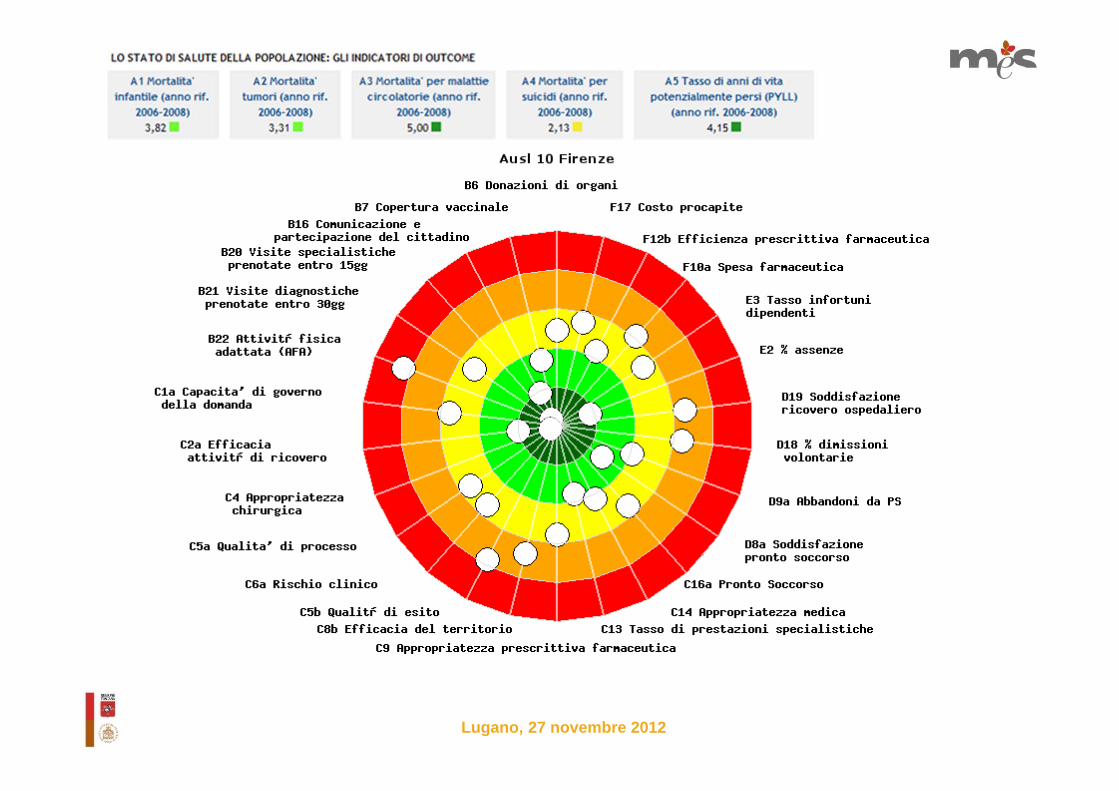
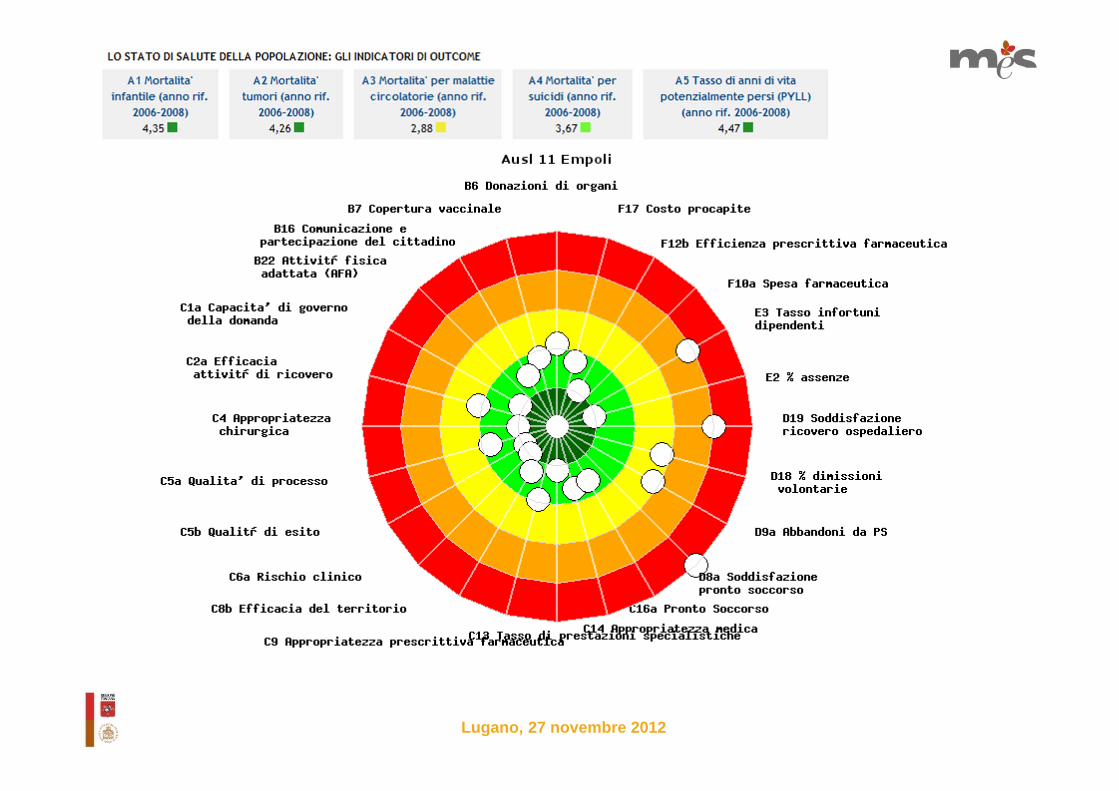
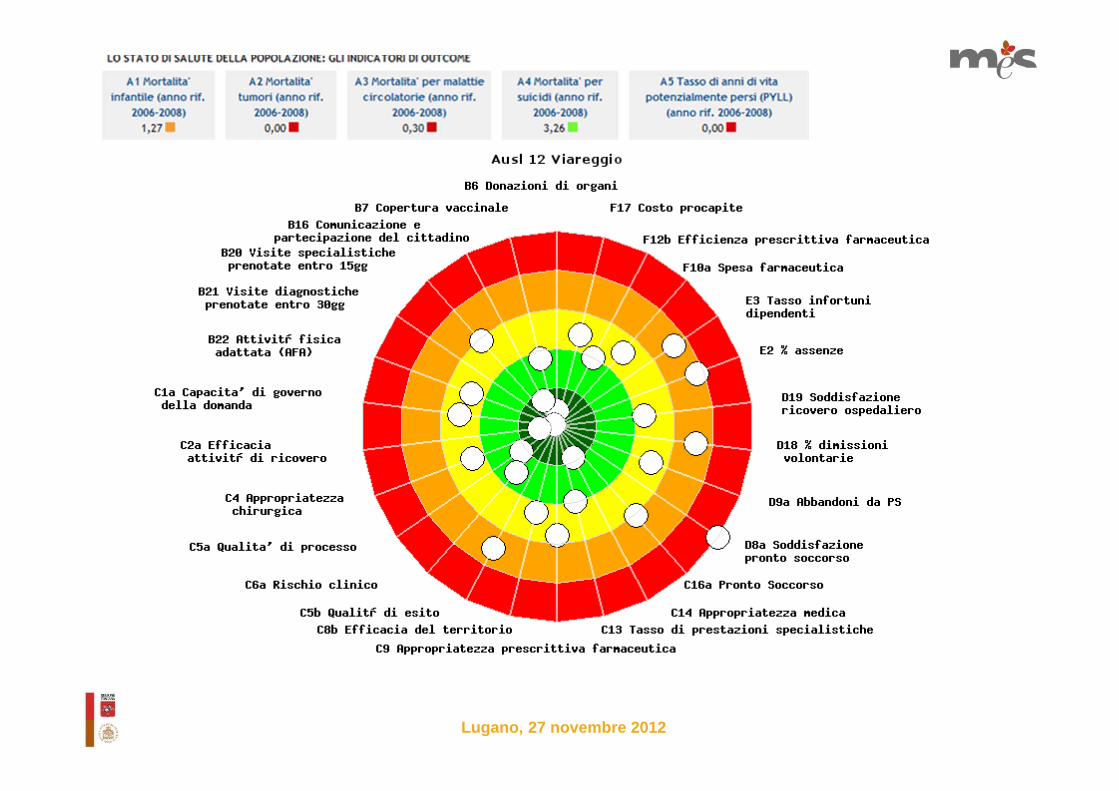
To visually represent the results of the six areas, each Health Authority has a personal “target” diagram,
divided in five assessment bands.
The more the Health Authority is able to reach objectives and obtain good results in each of the six areas, the nearer the performance indicator is to the
centre.
Lugano, 27 novembre 2012
Lugano, 27 novembre 2012
Lugano, 27 novembre 2012
Lugano, 27 novembre 2012
Lugano, 27 novembre 2012
Lugano, 27 novembre 2012
Lugano, 27 novembre 2012
Lugano, 27 novembre 2012
Lugano, 27 novembre 2012
Lugano, 27 novembre 2012
Lugano, 27 novembre 2012
Lugano, 27 novembre 2012
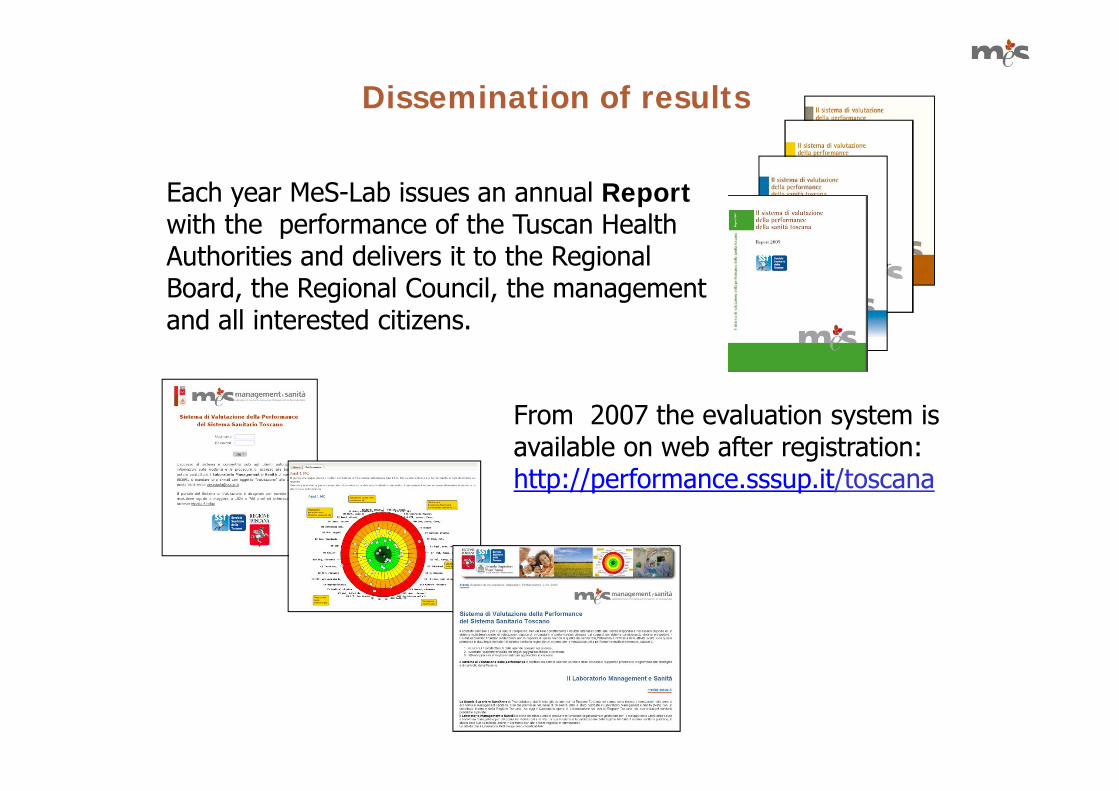
From 2007 the evaluation system isavailable on web after registration:http://performance.sssup.it/toscana
Each year MeS-Lab issues an annual Reportwith the performance of the Tuscan Health Authorities and delivers it to the Regional Board, the Regional Council, the management and all interested citizens.
Dissemination of results
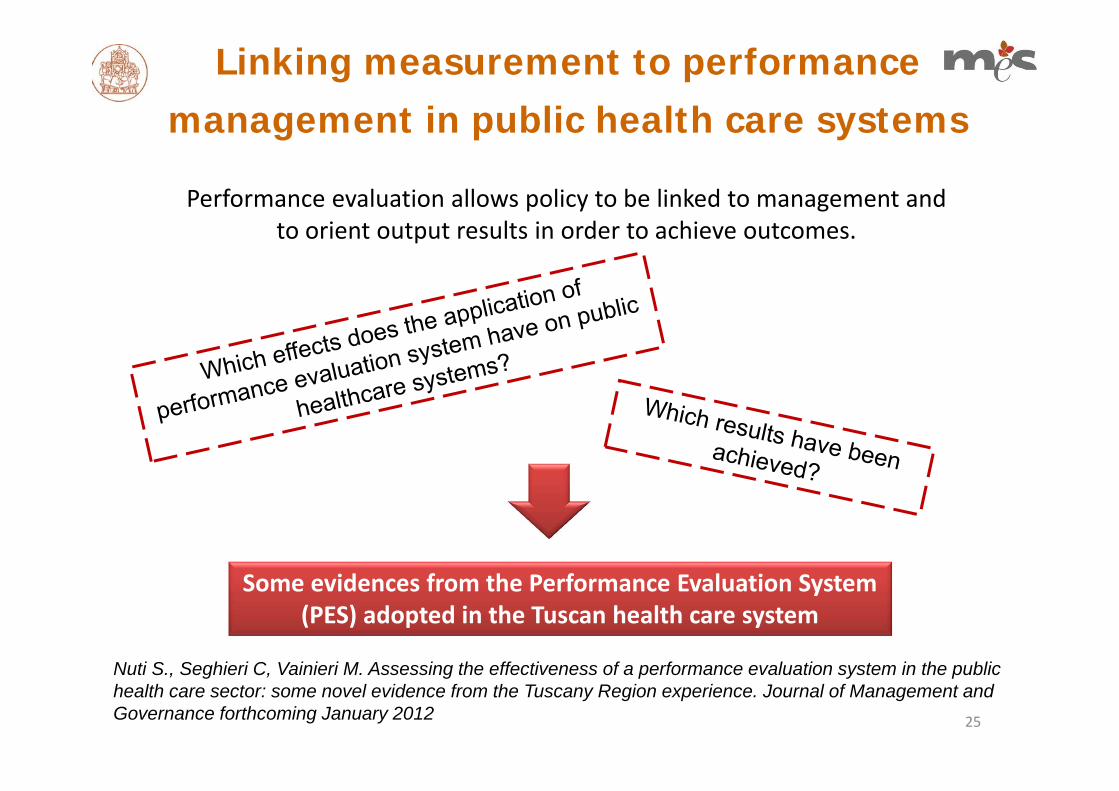
Linking measurement to performance management in public health care systems
Performance evaluation allows policy to be linked to management and to orient output results in order to achieve outcomes.
Some evidences from the Performance Evaluation System (PES) adopted in the Tuscan health care system
Nuti S., Seghieri C, Vainieri M. Assessing the effectiveness of a performance evaluation system in the public health care sector: some novel evidence from the Tuscany Region experience. Journal of Management and Governance forthcoming January 2012 25
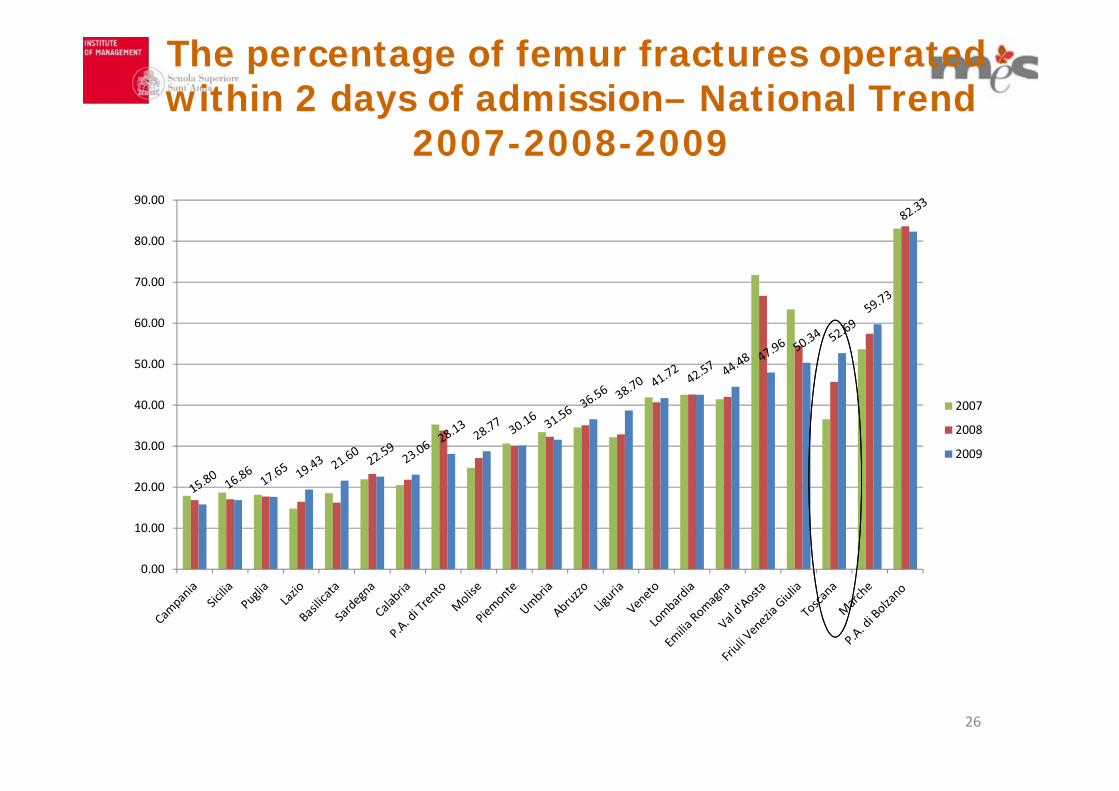
The percentage of femur fractures operated within 2 days of admission– National Trend
2007-2008-2009
0.00
10.00
20.00
30.00
40.00
50.00
60.00
70.00
80.00
90.00
2007
2008
2009
26
27
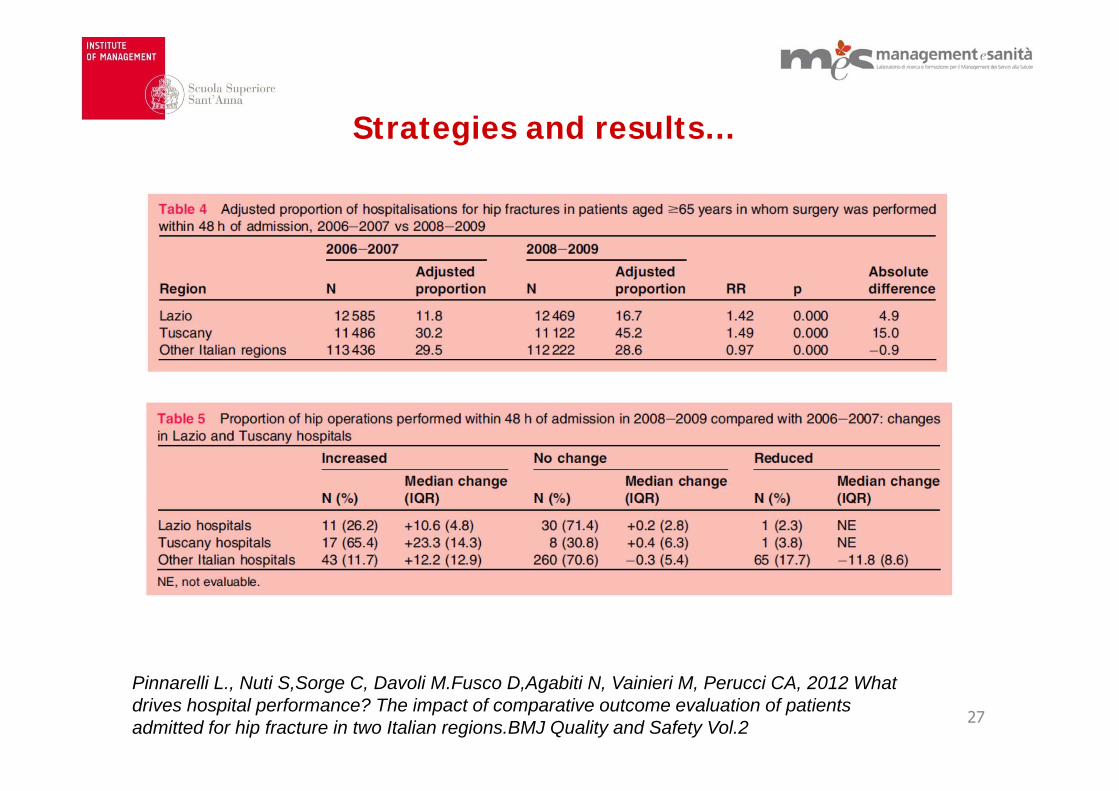
Pinnarelli L., Nuti S,Sorge C, Davoli M.Fusco D,Agabiti N, Vainieri M, Perucci CA, 2012 What drives hospital performance? The impact of comparative outcome evaluation of patients admitted for hip fracture in two Italian regions.BMJ Quality and Safety Vol.2
Strategies and results…
28
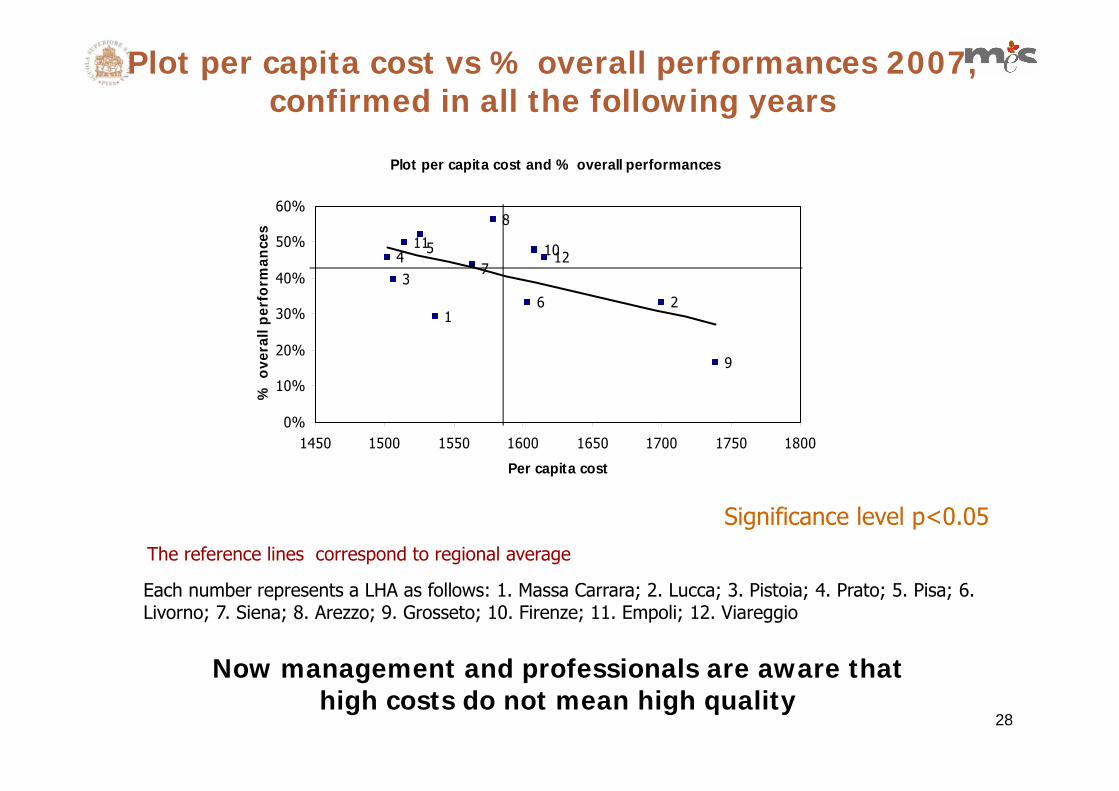
Plot per capita cost vs % overall performances 2007, confirmed in all the following years
The reference lines correspond to regional average
Each number represents a LHA as follows: 1. Massa Carrara; 2. Lucca; 3. Pistoia; 4. Prato; 5. Pisa; 6. Livorno; 7. Siena; 8. Arezzo; 9. Grosseto; 10. Firenze; 11. Empoli; 12. Viareggio
Significance level p<0.05
Plot per capita cost and % overall performances
1112
2
45
1
9
8
6
3
107
0%
10%
20%
30%
40%
50%
60%
1450 1500 1550 1600 1650 1700 1750 1800
Per capita cost
% o
vera
ll p
erfo
rman
ces
Now management and professionals are aware that high costs do not mean high quality
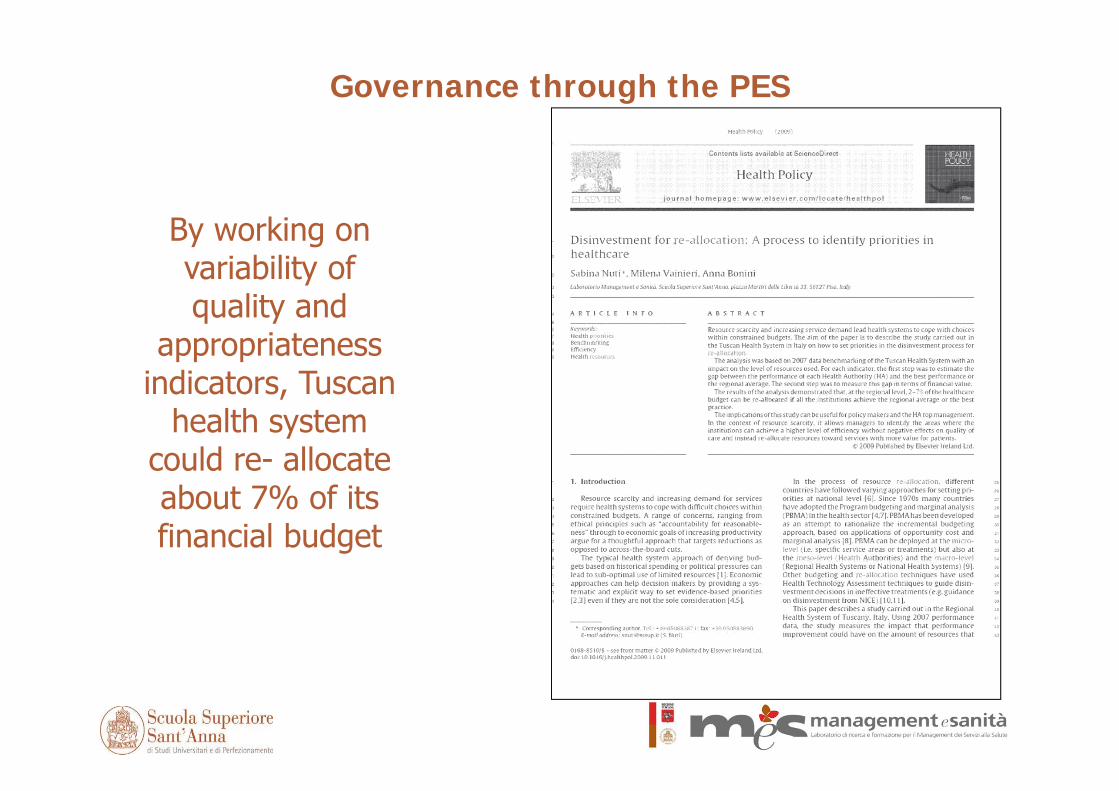
By working on variability of quality and
appropriateness indicators, Tuscan
health system could re- allocate about 7% of its financial budget
Governance through the PES
30
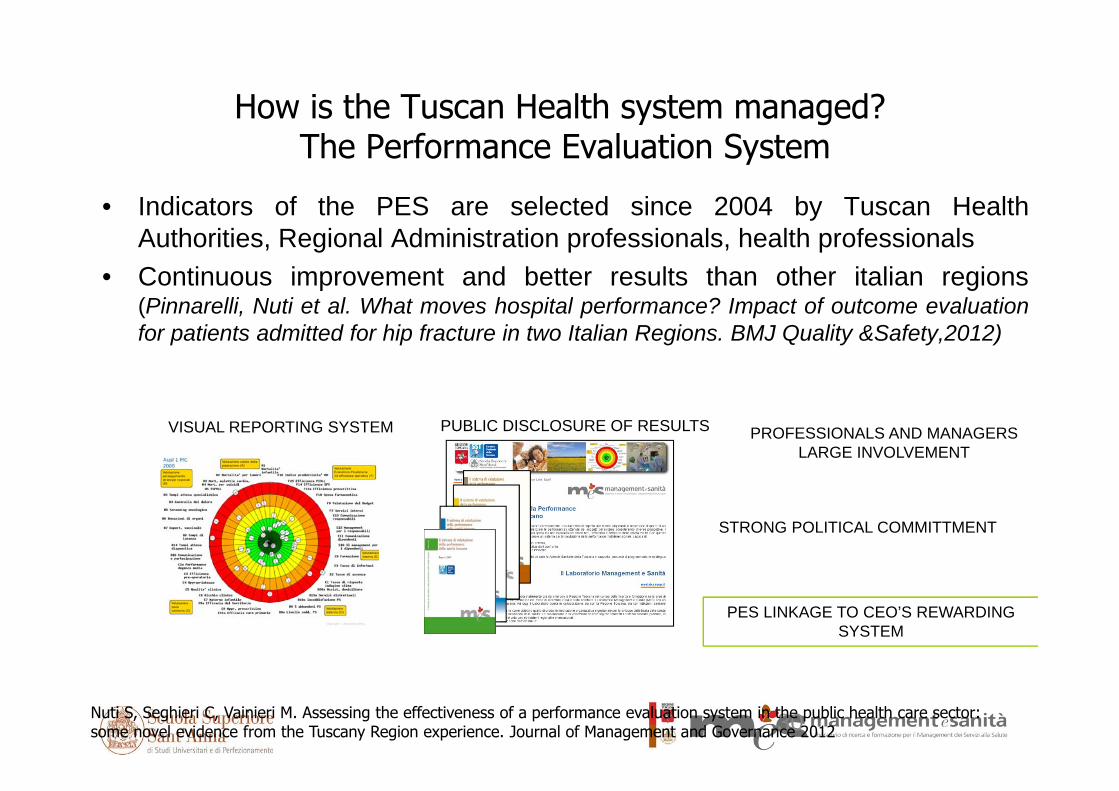
How is the Tuscan Health system managed?The Performance Evaluation System
• Indicators of the PES are selected since 2004 by Tuscan HealthAuthorities, Regional Administration professionals, health professionals
• Continuous improvement and better results than other italian regions(Pinnarelli, Nuti et al. What moves hospital performance? Impact of outcome evaluationfor patients admitted for hip fracture in two Italian Regions. BMJ Quality &Safety,2012)
VISUAL REPORTING SYSTEM PUBLIC DISCLOSURE OF RESULTS PROFESSIONALS AND MANAGERS LARGE INVOLVEMENT
STRONG POLITICAL COMMITTMENT
PES LINKAGE TO CEO’S REWARDING SYSTEM
Nuti S, Seghieri C, Vainieri M. Assessing the effectiveness of a performance evaluation system in the public health care sector:some novel evidence from the Tuscany Region experience. Journal of Management and Governance 2012
31
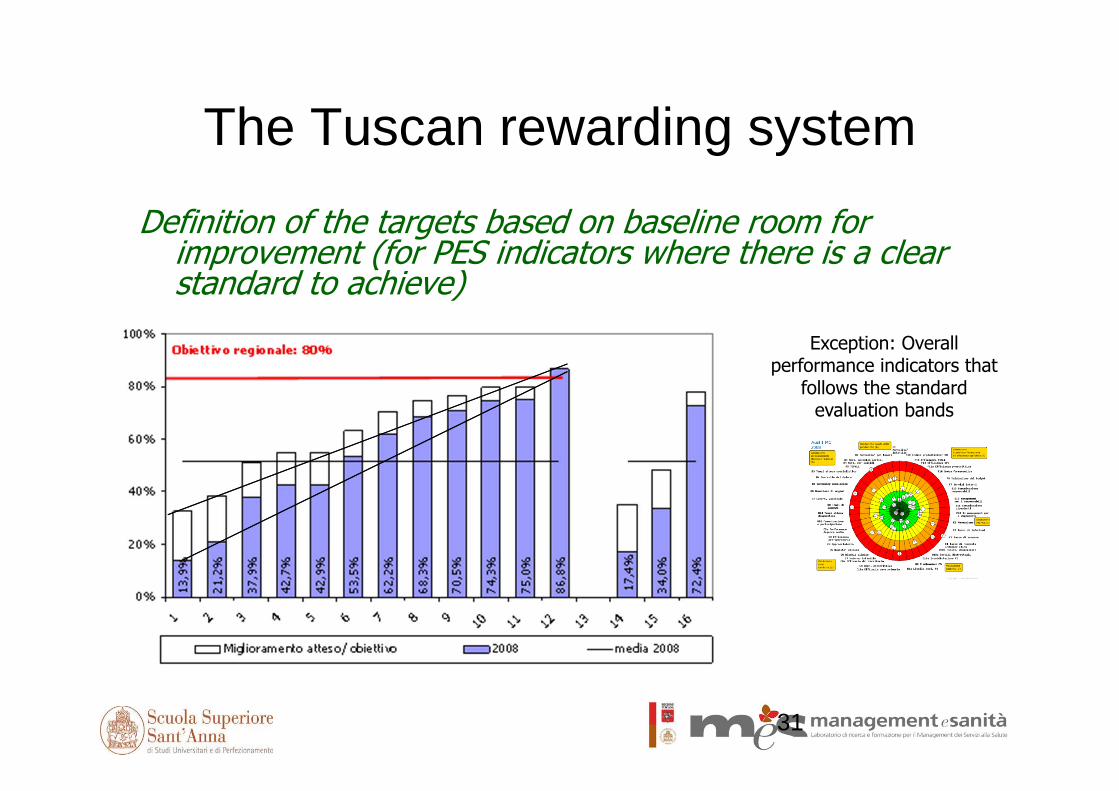
The Tuscan rewarding system Definition of the targets based on baseline room for
improvement (for PES indicators where there is a clear standard to achieve)
Exception: Overallperformance indicators that
follows the standard evaluation bands
32
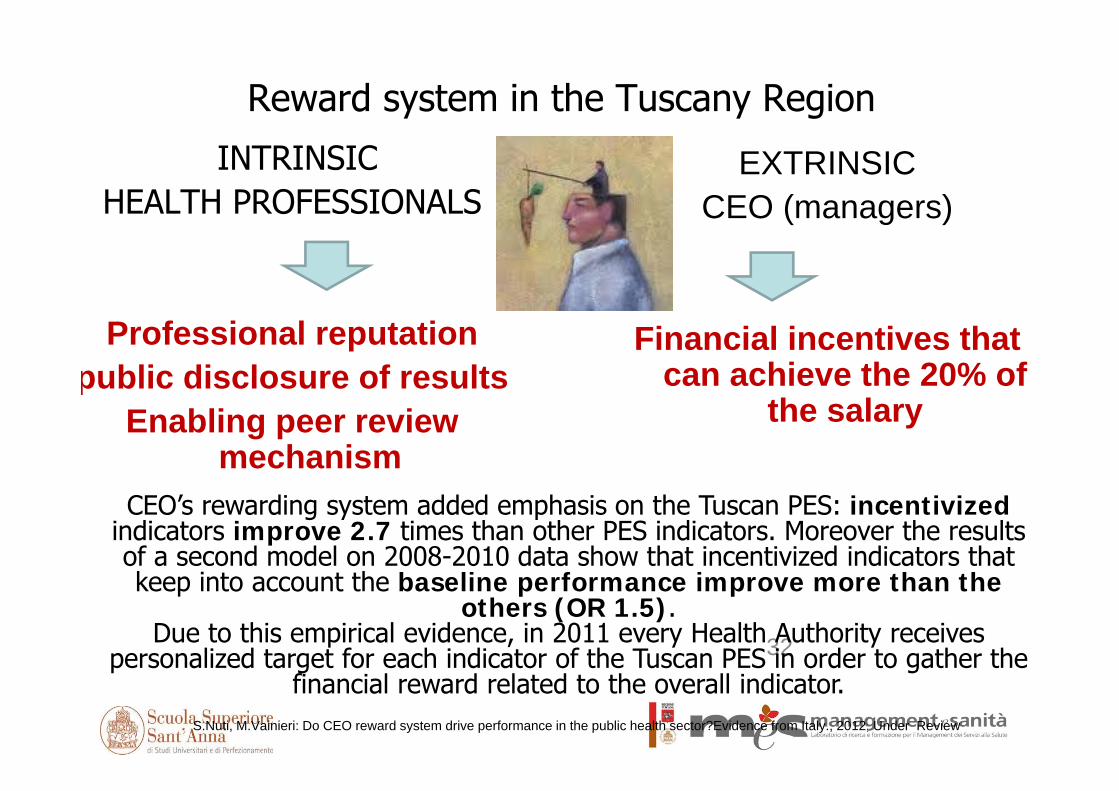
Reward system in the Tuscany Region
INTRINSIC HEALTH PROFESSIONALS
Professional reputationpublic disclosure of results
Enabling peer review mechanism
EXTRINSICCEO (managers)
Financial incentives that can achieve the 20% of
the salary
CEO’s rewarding system added emphasis on the Tuscan PES: incentivizedindicators improve 2.7 times than other PES indicators. Moreover the results of a second model on 2008-2010 data show that incentivized indicators that keep into account the baseline performance improve more than the
others (OR 1.5).Due to this empirical evidence, in 2011 every Health Authority receives
personalized target for each indicator of the Tuscan PES in order to gather the financial reward related to the overall indicator.
S.Nuti, M.Vainieri: Do CEO reward system drive performance in the public health sector?Evidence from Italy., 2012, Under Review
The performance evaluation system is able to drive improvement… but is it
also a tool to achieve equity?
The Pes shows that there is large variation not only between north and
south but also in each region.
Variation management across and within the regions should be included in the
governance system as a strategic tool at each level.
33
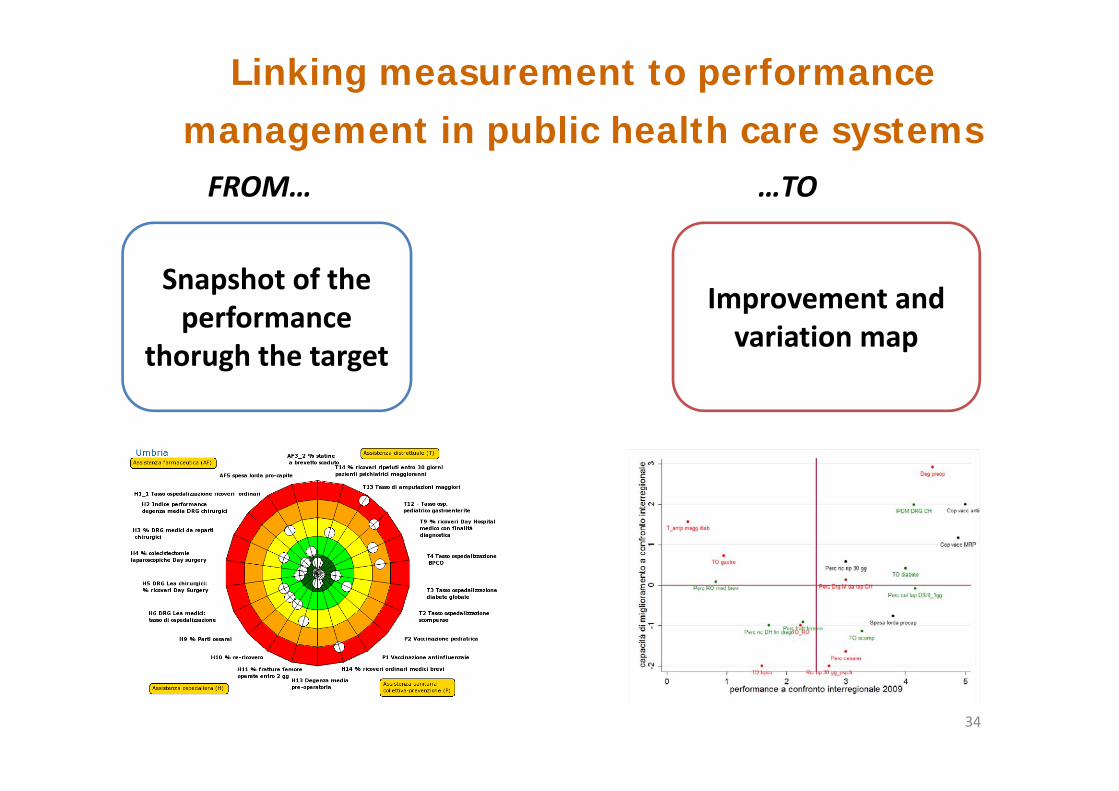
Snapshot of the performance
thorugh the target
Improvement and variation map
FROM… …TO
Linking measurement to performance management in public health care systems
34
35
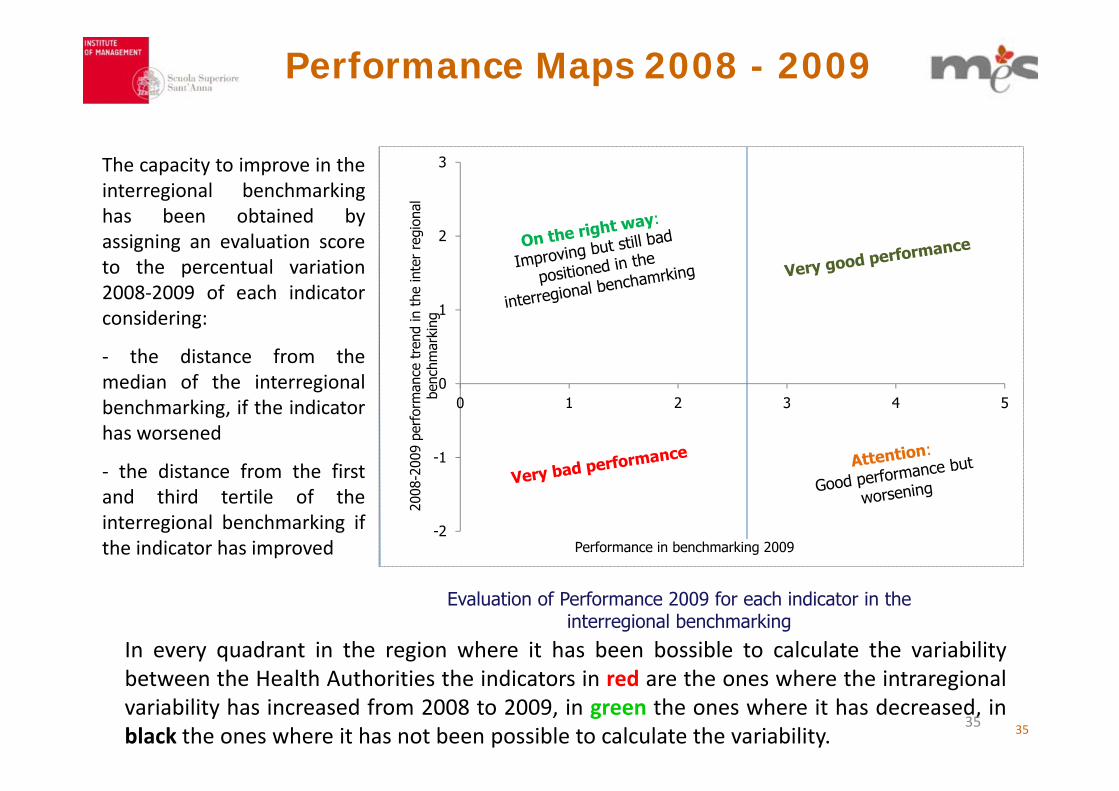
Performance Maps 2008 - 2009
The capacity to improve in theinterregional benchmarkinghas been obtained byassigning an evaluation scoreto the percentual variation2008‐2009 of each indicatorconsidering:
‐ the distance from themedian of the interregionalbenchmarking, if the indicatorhas worsened
‐ the distance from the firstand third tertile of theinterregional benchmarking ifthe indicator has improved
Evaluation of Performance 2009 for each indicator in the interregional benchmarking
-2
-1
0
1
2
3
0 1 2 3 4 520
08-2
009
perf
orm
ance
tre
nd in
the
inte
r re
gion
al
benc
hmar
king
Performance in benchmarking 2009
In every quadrant in the region where it has been bossible to calculate the variabilitybetween the Health Authorities the indicators in red are the ones where the intraregionalvariability has increased from 2008 to 2009, in green the ones where it has decreased, inblack the ones where it has not been possible to calculate the variability.
35
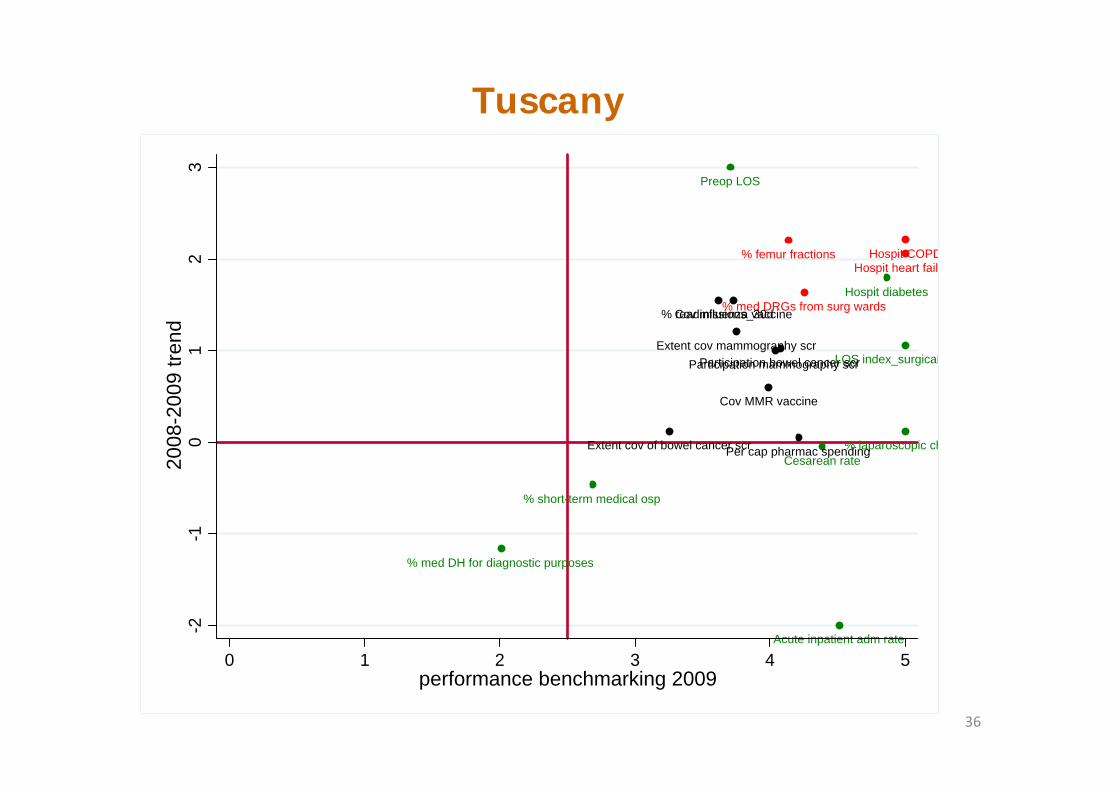
Tuscany
Preop LOS
% short-term medical osp
Acute inpatient adm rate
LOS index_surgical
% laparoscopic chCesarean rate
Hospit diabetes
% med DH for diagnostic purposes
% femur fractions
% med DRGs from surg wards
Hospit heart failHospit COPD
Per cap pharmac spending
% readmissions_30dCov influenza vaccine
Cov MMR vaccine
Extent cov mammography scrParticipation mammography scr
Extent cov of bowel cancer scr
Participation bowel cancer scr
-2-1
01
23
2008
-200
9 tre
nd
0 1 2 3 4 5performance benchmarking 2009
36
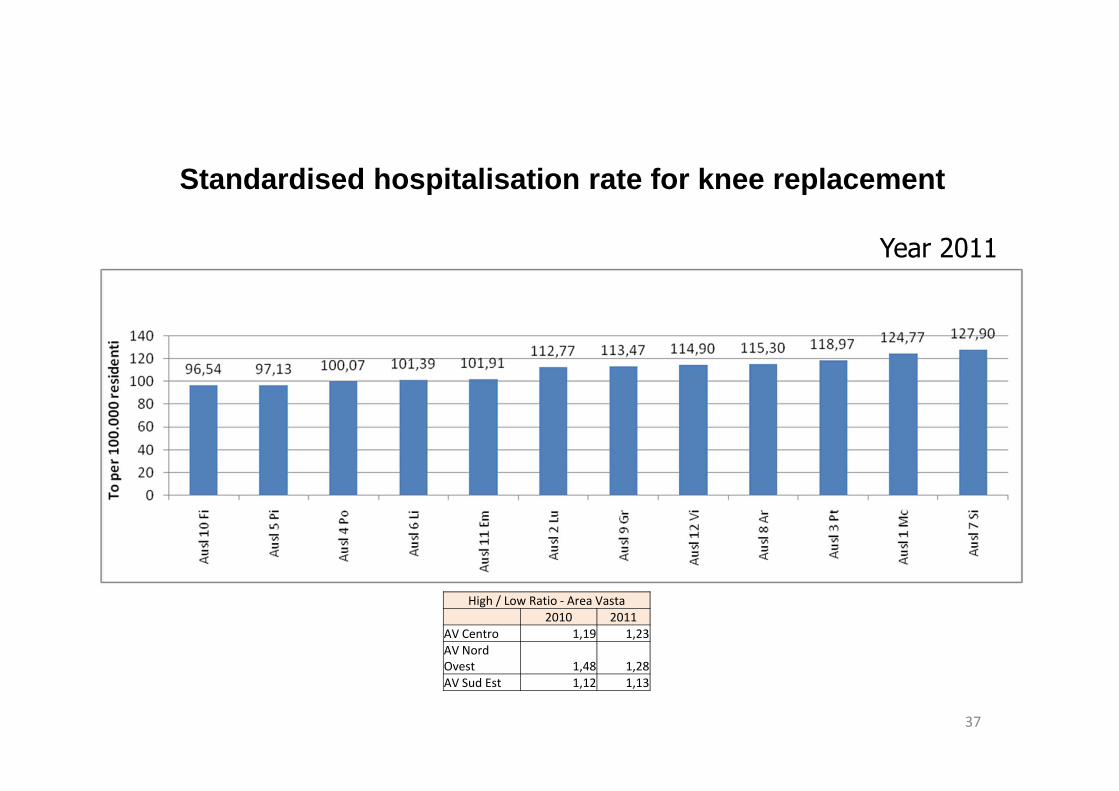
Year 2011
Standardised hospitalisation rate for knee replacement
High / Low Ratio ‐ Area Vasta2010 2011
AV Centro 1,19 1,23AV Nord Ovest 1,48 1,28AV Sud Est 1,12 1,13
37
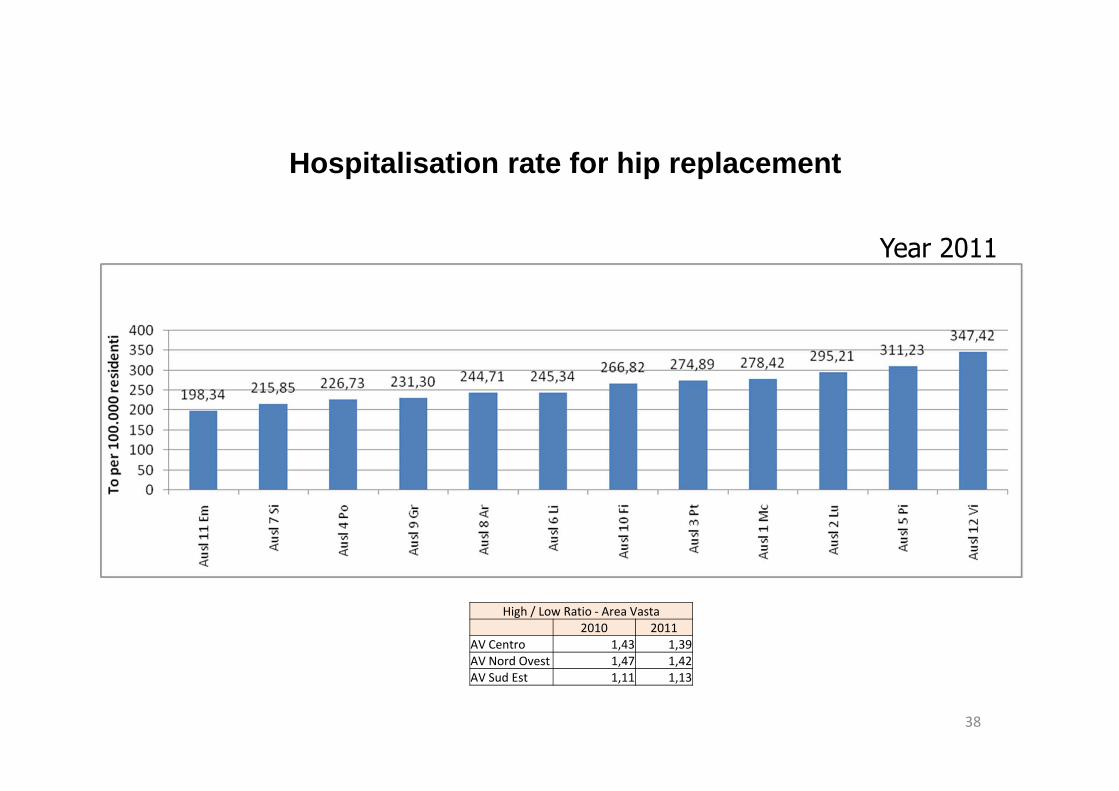
Hospitalisation rate for hip replacement
High / Low Ratio ‐ Area Vasta2010 2011
AV Centro 1,43 1,39AV Nord Ovest 1,47 1,42AV Sud Est 1,11 1,13
Year 2011
38
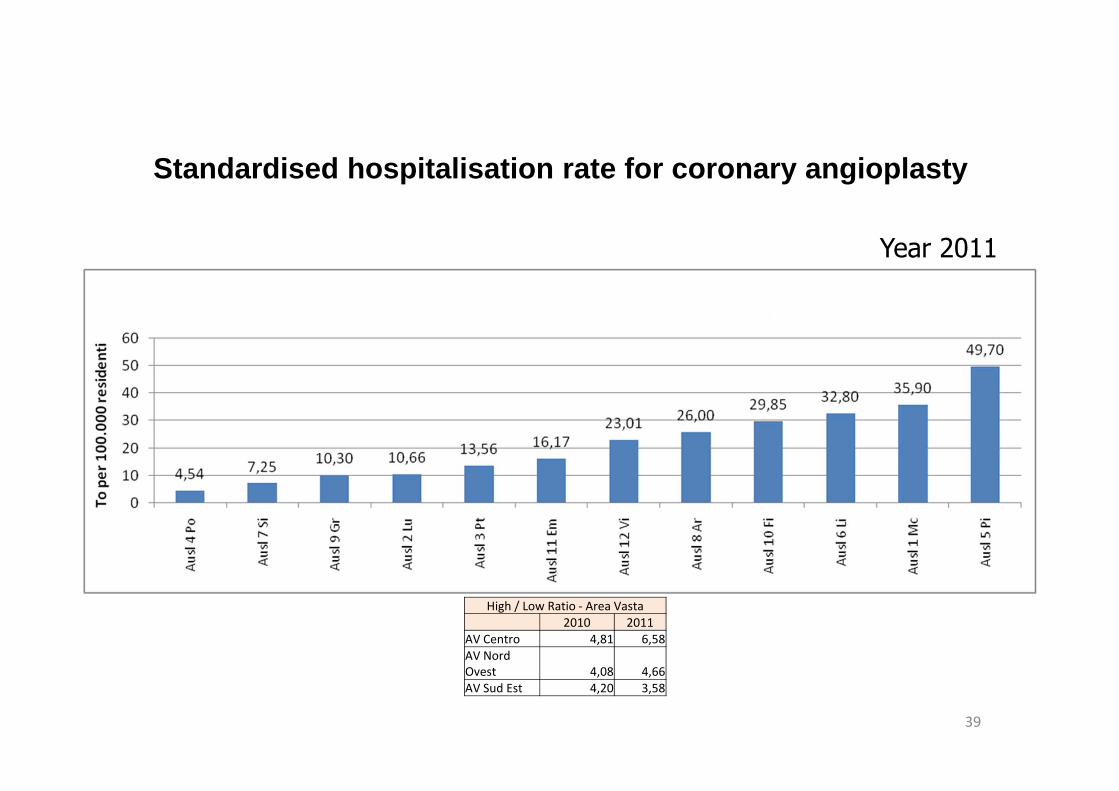
Standardised hospitalisation rate for coronary angioplasty
High / Low Ratio ‐ Area Vasta2010 2011
AV Centro 4,81 6,58AV Nord Ovest 4,08 4,66AV Sud Est 4,20 3,58
Year 2011
39
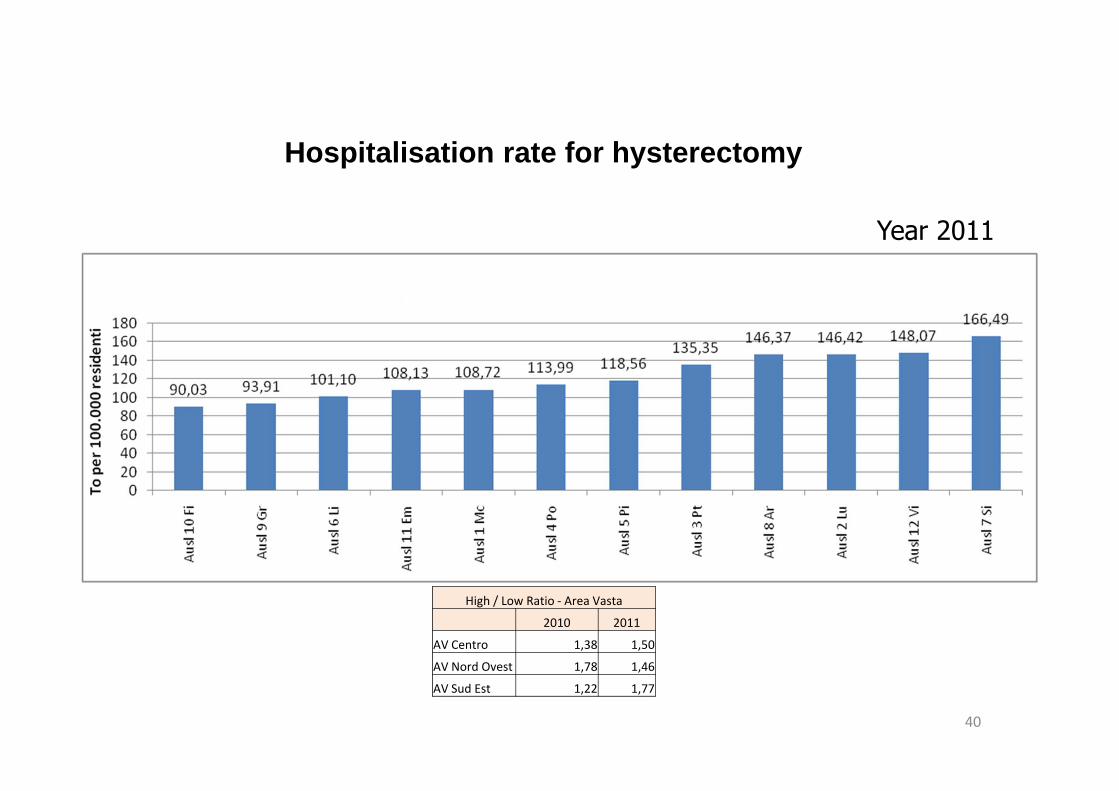
Hospitalisation rate for hysterectomy
High / Low Ratio ‐ Area Vasta
2010 2011
AV Centro 1,38 1,50
AV Nord Ovest 1,78 1,46
AV Sud Est 1,22 1,77
Year 2011
40
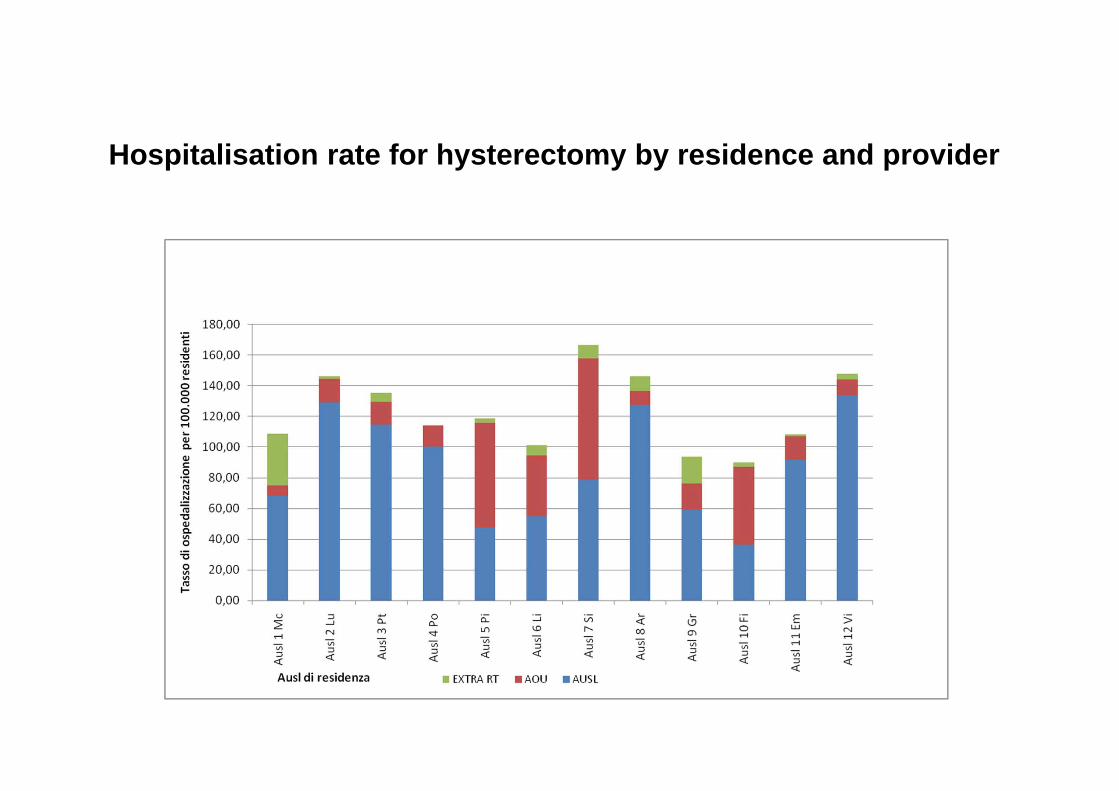
Hospitalisation rate for hysterectomy by residence and provider
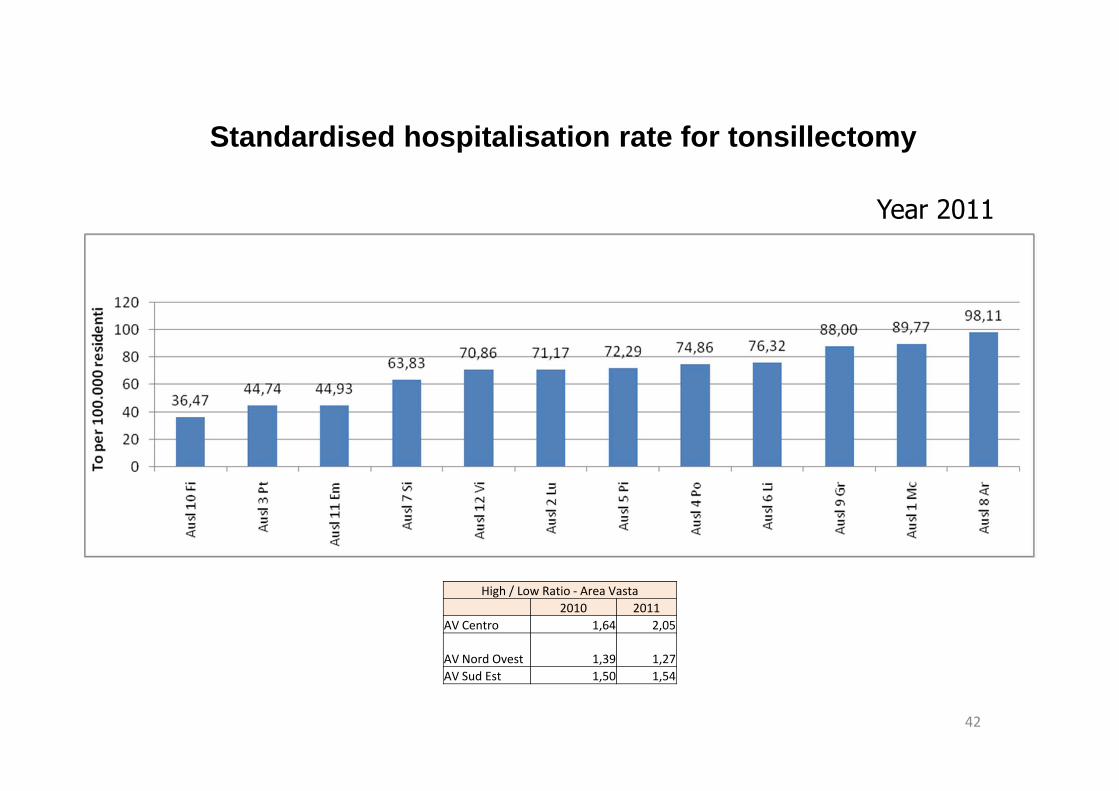
Standardised hospitalisation rate for tonsillectomy
High / Low Ratio ‐ Area Vasta2010 2011
AV Centro 1,64 2,05
AV Nord Ovest 1,39 1,27AV Sud Est 1,50 1,54
Year 2011
42
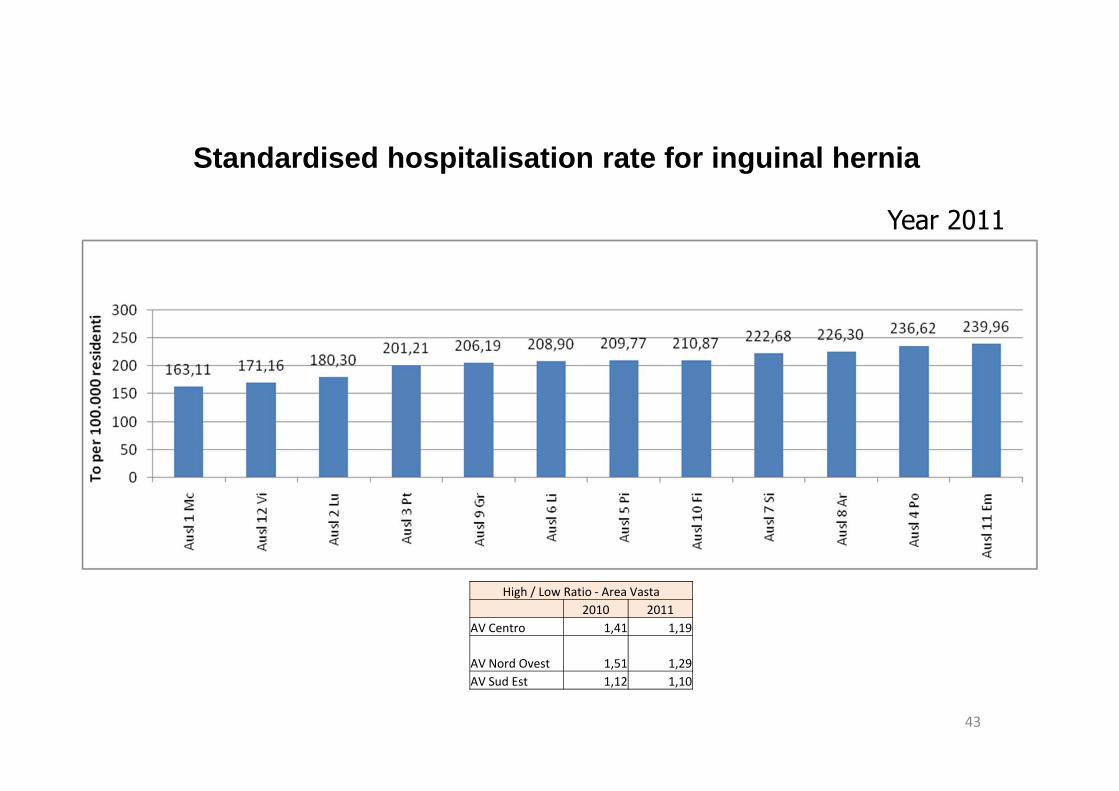
Standardised hospitalisation rate for inguinal hernia
High / Low Ratio ‐ Area Vasta2010 2011
AV Centro 1,41 1,19
AV Nord Ovest 1,51 1,29AV Sud Est 1,12 1,10
Year 2011
43
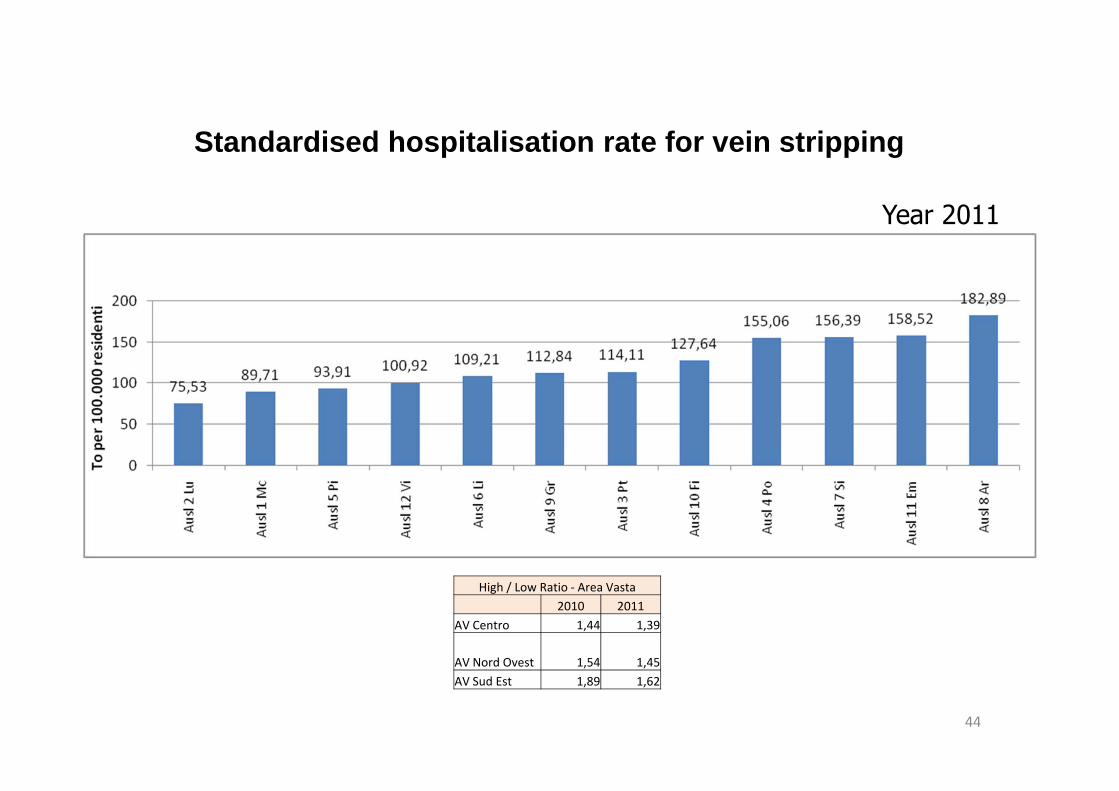
Standardised hospitalisation rate for vein stripping
High / Low Ratio ‐ Area Vasta2010 2011
AV Centro 1,44 1,39
AV Nord Ovest 1,54 1,45AV Sud Est 1,89 1,62
Year 2011
44
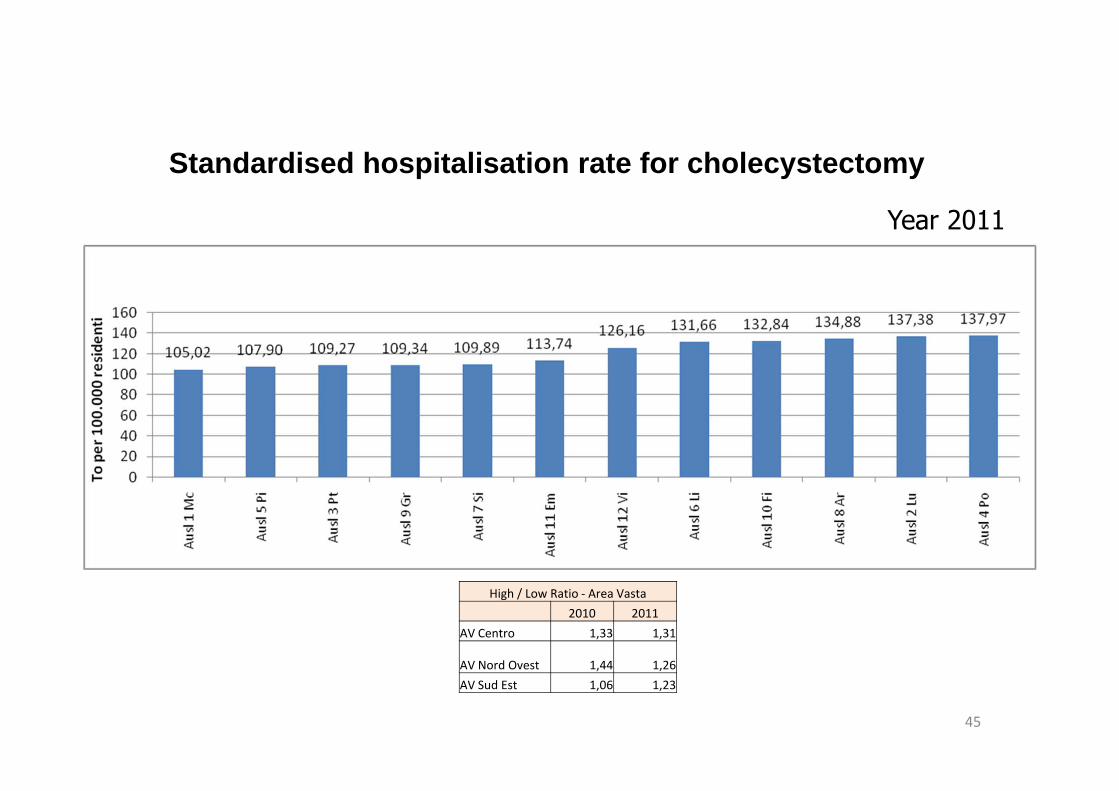
Standardised hospitalisation rate for cholecystectomy
High / Low Ratio ‐ Area Vasta2010 2011
AV Centro 1,33 1,31
AV Nord Ovest 1,44 1,26AV Sud Est 1,06 1,23
Year 2011
45
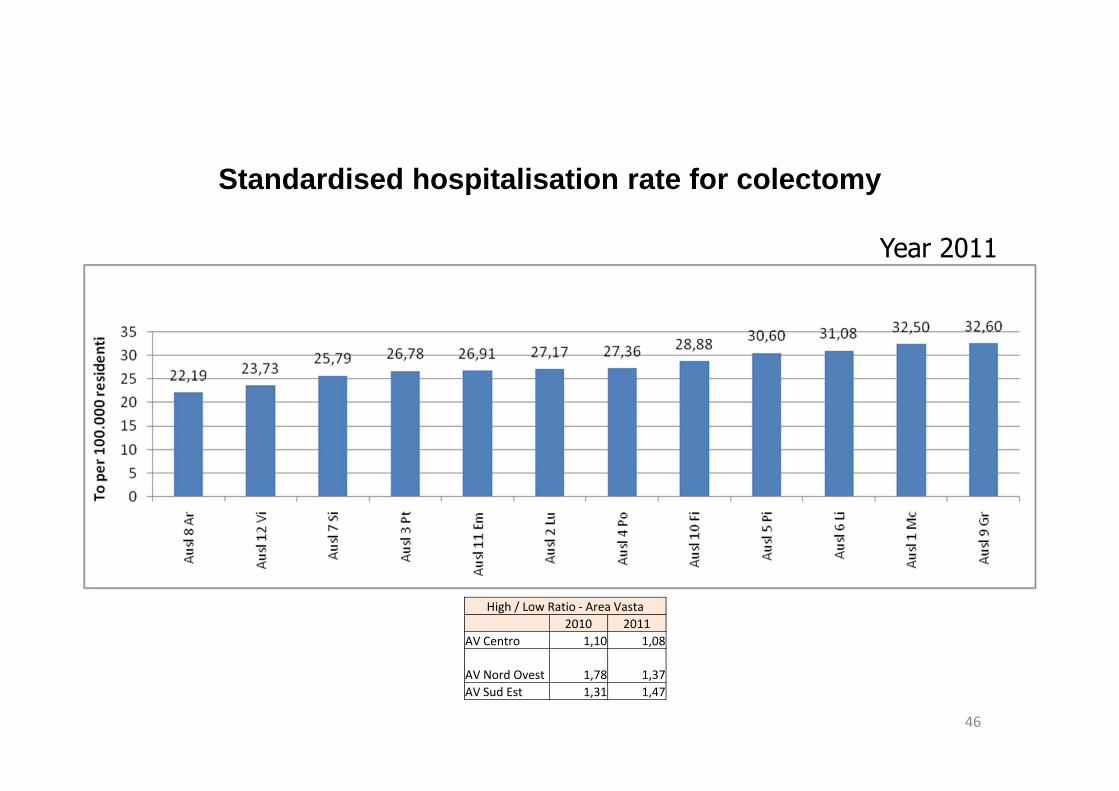
Standardised hospitalisation rate for colectomy
High / Low Ratio ‐ Area Vasta2010 2011
AV Centro 1,10 1,08
AV Nord Ovest 1,78 1,37AV Sud Est 1,31 1,47
Year 2011
46
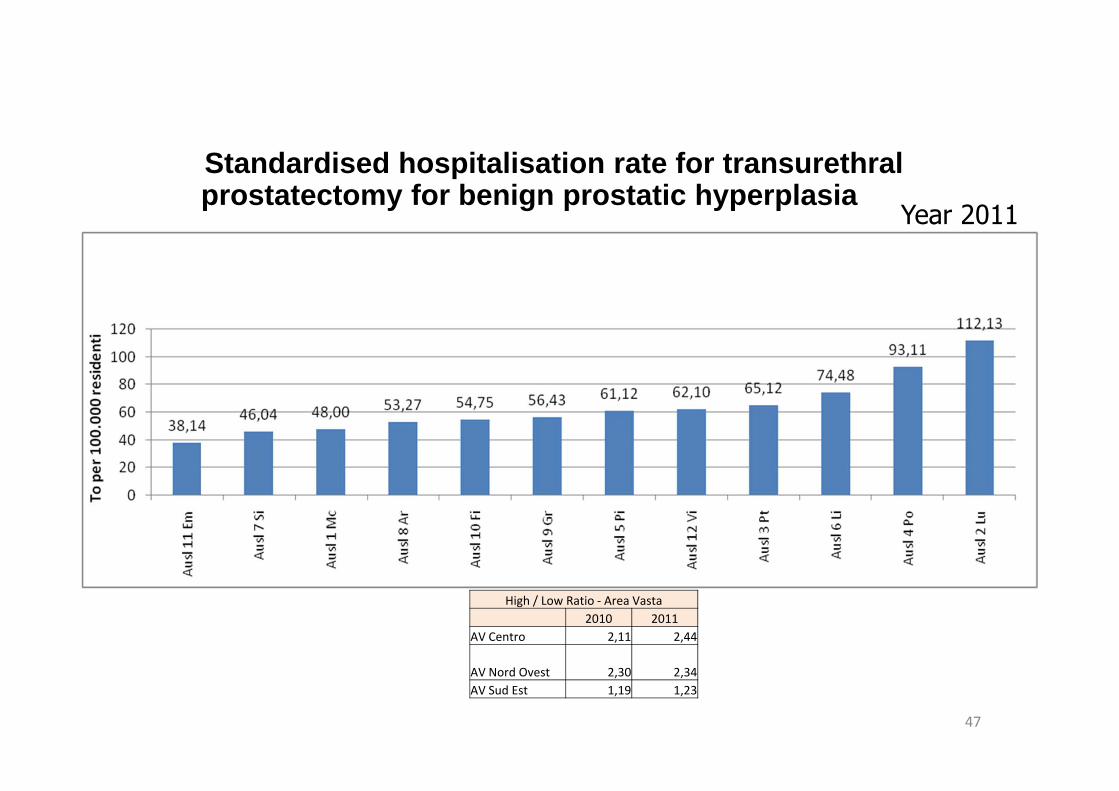
Standardised hospitalisation rate for transurethralprostatectomy for benign prostatic hyperplasia
High / Low Ratio ‐ Area Vasta2010 2011
AV Centro 2,11 2,44
AV Nord Ovest 2,30 2,34AV Sud Est 1,19 1,23
Year 2011
47
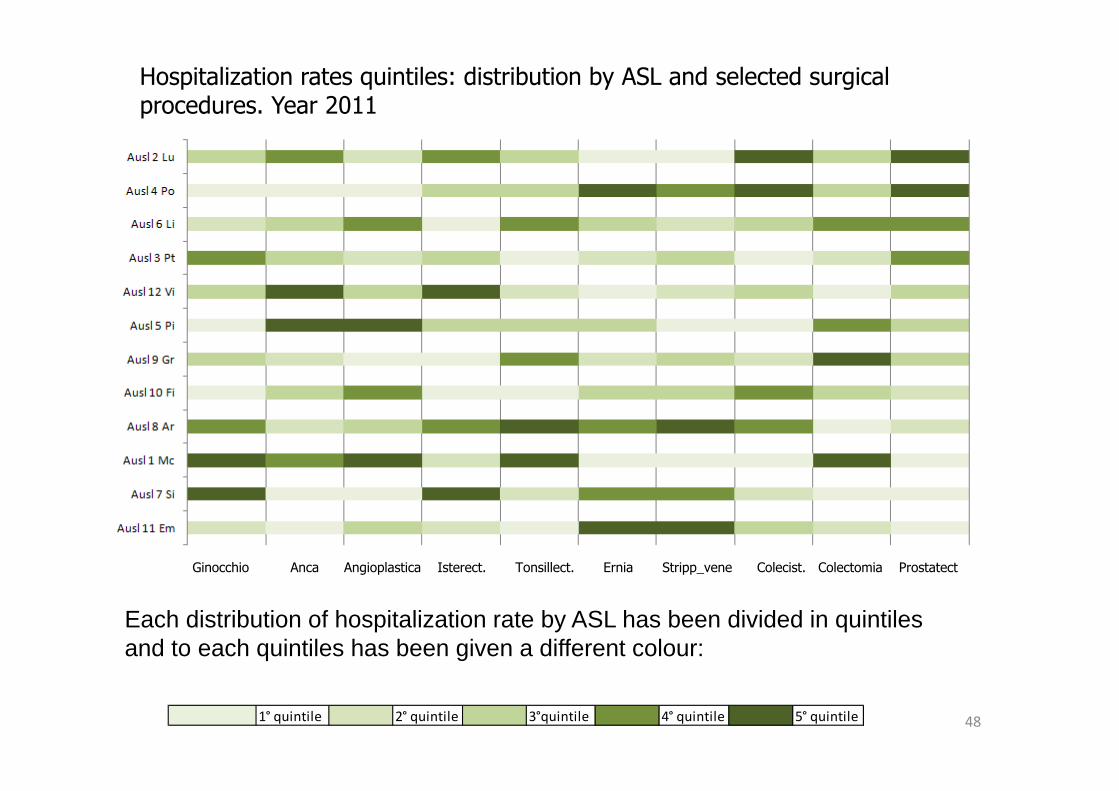
Ginocchio Anca Angioplastica Isterect. Tonsillect. Ernia Stripp_vene Colecist. Colectomia Prostatect
Hospitalization rates quintiles: distribution by ASL and selected surgical procedures. Year 2011
Each distribution of hospitalization rate by ASL has been divided in quintiles and to each quintiles has been given a different colour:
1° quintile 2° quintile 3°quintile 4° quintile 5° quintile 48
49
In literature, the high variation in this field is mostly explained either by thedistribution of supply which determines demand or by the servicesreimbursement system.Actually, in the Tuscan health care system hospitalizations are notreimbursed on the basis of the DRG system, nor are physiciansreimbursed for each service delivered.
However, there is still a significant variation which differs according to the
surgical service considered.
WHAT ARE THE CAUSES?HOW CAN IT BE MANAGED?
HOW POLICY MAKERS MAY REDUCE UNWARRENTED VARIATION?
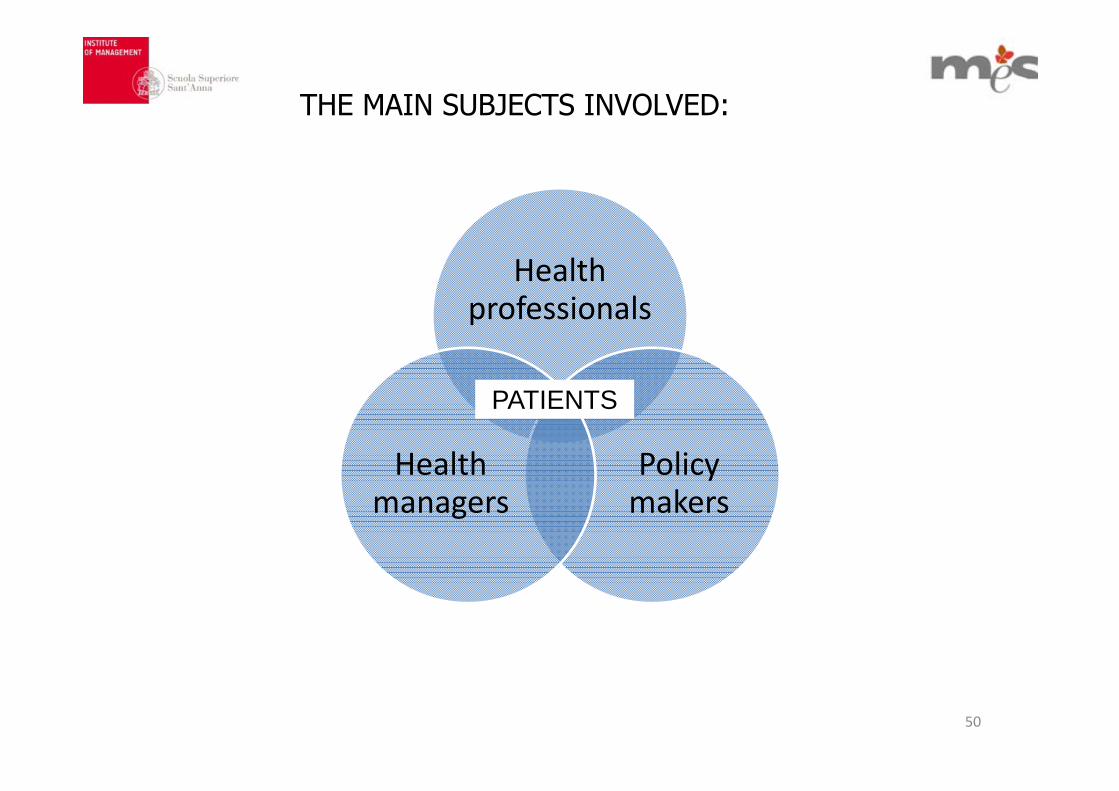
THE MAIN SUBJECTS INVOLVED:
Healthprofessionals
Policy makers
Healthmanagers
PATIENTS
50
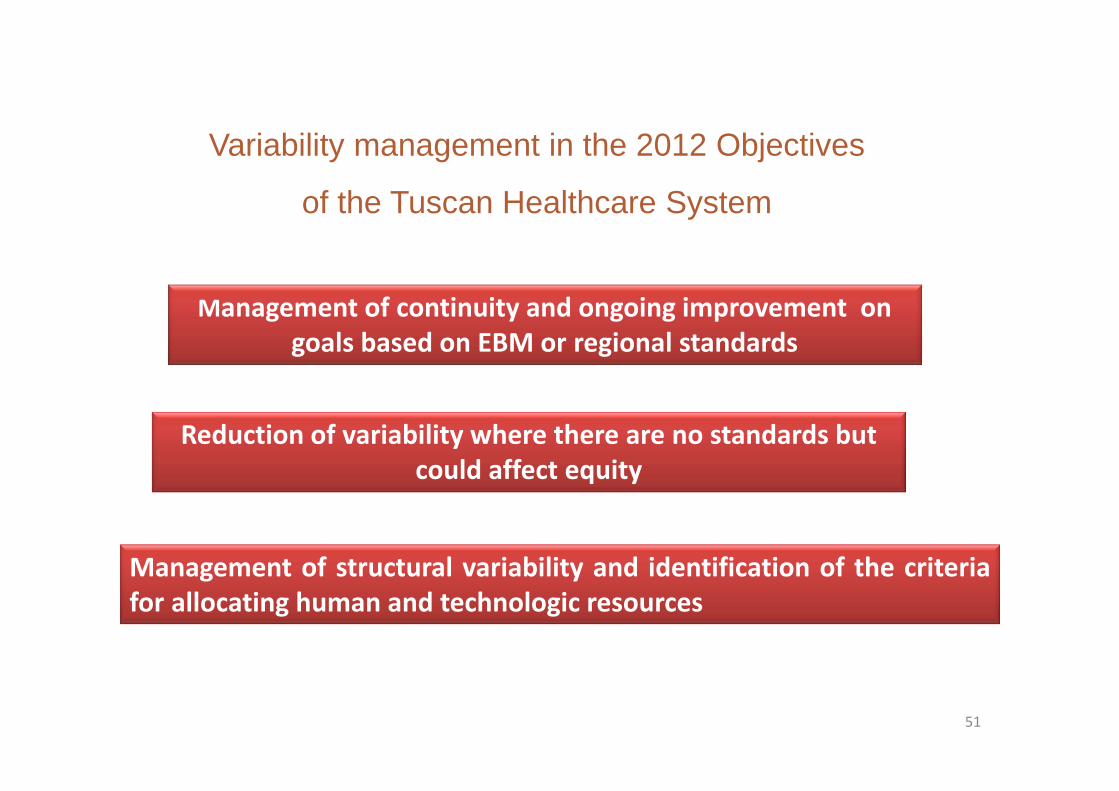
Management of continuity and ongoing improvement on goals based on EBM or regional standards
Reduction of variability where there are no standards but could affect equity
Management of structural variability and identification of the criteriafor allocating human and technologic resources
Variability management in the 2012 Objectives
of the Tuscan Healthcare System
51
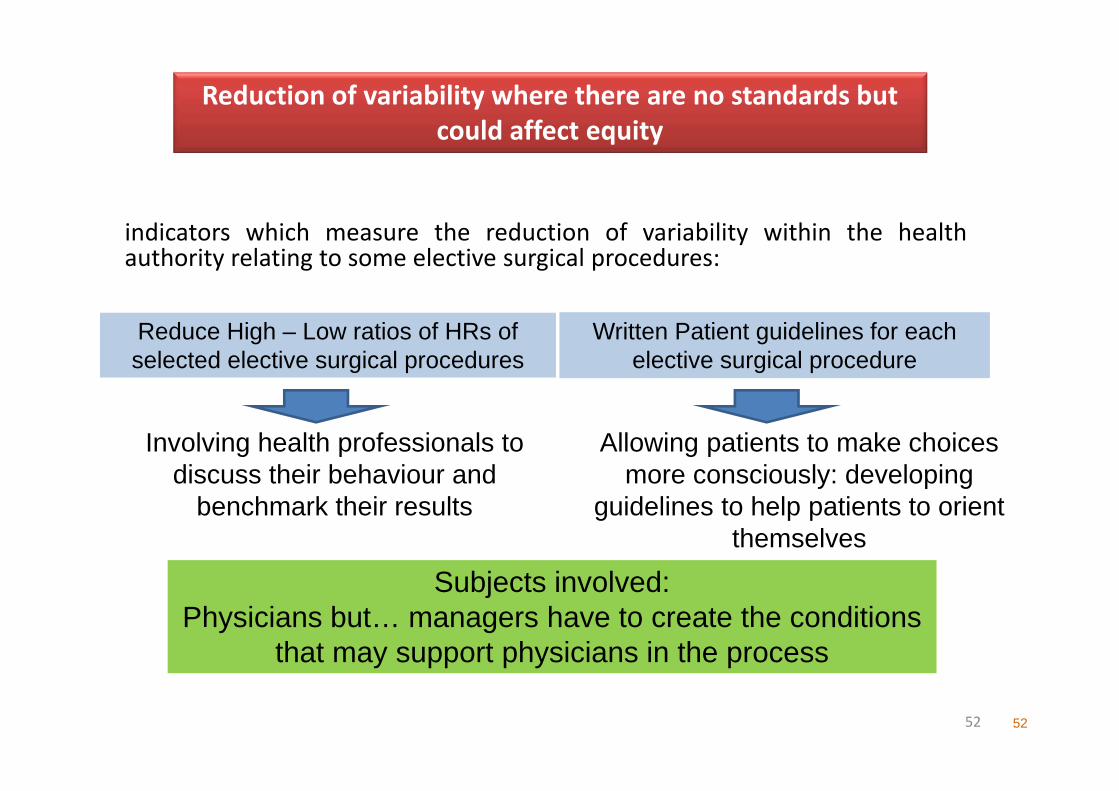
indicators which measure the reduction of variability within the healthauthority relating to some elective surgical procedures:
52
Reduce High – Low ratios of HRs ofselected elective surgical procedures
Written Patient guidelines for eachelective surgical procedure
Subjects involved:Physicians but… managers have to create the conditions
that may support physicians in the process
Allowing patients to make choices more consciously: developing
guidelines to help patients to orient themselves
Involving health professionals to discuss their behaviour and
benchmark their results
52
Reduction of variability where there are no standards but could affect equity
ConclusionsIncluding the variation dimension in the Tuscan PES is it going to work?
… we hope!
Avoiding unwarrented variation will be reached only if policy makers, physicians and patients collectively engage in a joint effort to reduce it.
This is even truer in today’s era of rising costs, when taking actions to reduce variation may not only benefit citizens in terms of healthcare quality but also
assure the economic sustainability of the whole healthcare system.
Thanks!
53