Embed Size (px)
Citation preview
Research ArticleEffect of -O- on Water Molecule Adsorption and AdsorptionMechanism of Lignite and Coke
Xue Bai1 Yue Yin Song1 Ying Yue Teng 12 Wen Lu Zhang1 Yin Min Song2
and Yun Fei Wang 3
1College of Chemical Engineering Inner Mongolia University of Technology Huhhot 010051 China2Inner Mongolia Key Laboratory of High-Value Functional Utilization of Low Rank Carbon ResourcesInner Mongolia University of Technology Huhhot 010051 China3College of Chemical Engineering Ordos Institute of Technology Ordos 017000 China
Correspondence should be addressed to Ying Yue Teng tengyingyue163com and Yun Fei Wang yunfeiwang111126com
Received 31 January 2021 Revised 31 August 2021 Accepted 13 September 2021 Published 21 October 2021
Academic Editor Jae Ryang Hahn
Copyright copy 2021 Xue Bai et al-is is an open access article distributed under the Creative Commons Attribution License whichpermits unrestricted use distribution and reproduction in any medium provided the original work is properly cited
-e high moisture content of lignite restricts its extensive and efficient use Furthermore the reabsorption of lignite is also a factorthat affects lignite spontaneous combustion -erefore it is of great importance to study the process and mechanism of watermolecule desorption and adsorption on lignite and coke (25ndash950degC) to achieve the clean and efficient utilization of lignite andenvironmental protection Proton nuclear magnetic resonance (1H-NMR) thermogravimetric analysis and other techniques wereused in this study to explore the water molecule absorption and desorption processes of lignite pyrolysis at different temperatures(25ndash950degC) and the special contributions of ether bonds to water molecule adsorption A mechanism of lignite water moleculeadsorption was proposed-e results showed that ether bonds played a special role in the water molecule adsorption by pyrolyzedlignite-e ether bond content was greater in the coal samples at 300 and 950degC which changed the trend of lignite water moleculeabsorption and the distribution of water (T2) detected in the 1H-NMR experiments and delayed the escape of water moleculesduring moisture desorption -e total amount of adsorbed water decreased first and then increased in the coal samples as thepyrolysis temperature increased However the maximum adsorption interactions of each coal sample increased first and thendecreased -is was the result of the interactions between the pores and the oxygen-containing functional groups Based on theabove analysis water molecule adsorption mechanism models of lignite and coke were constructed -is study offers a newapproach for investigating the water molecule adsorption and adsorption mechanisms of lignite and coke
1 Introduction
-e energy crisis is becomingmore andmore serious aroundthe world Lignite is an important coal reserve Howeverowing to its high moisture content low heat value easyweathering and spontaneous combustion the utilizationefficiency of lignite is relatively low [1] At present thecommon method to improve the utilization efficiency islignite upgrading but the current technologies fail to solvethe problems of moisture adsorption and spontaneouscombustion of lignite [2]
-e microstructural and adsorption characteristics oflignite have been the focus of many scholars Tao et al [3]compared the material composition pore structure and
adsorption capacity of lignite and candle coal and found thatlignite has a higher inertinite content larger pore volumebetter connectivity and greater specific surface area (SSA)than candle coal In another article a continuous distri-bution model of pore space was constructed for coal res-ervoirs based on the measured data of mercury intrusionporosimetry (MIP) and low-temperature nitrogen adsorp-tion (LTNA) experiments -is model can obtain thecomplete pore size distribution from nanopores to micro-fractures [4] Series and parallel seepage simulations of coalmatrix pore samples natural fracture samples and artificialfracture samples with three permeability ranges weredesigned and performed [5] Another analysis showed thatafter water immersion the content of hydroxyl and aromatic
HindawiJournal of ChemistryVolume 2021 Article ID 5573498 10 pageshttpsdoiorg10115520215573498
hydrocarbons in the coal increased significantly and thetemperature at which fat-based and oxygen-containingfunctional groups participated in the reaction decreased [6]-e monolayer water in soft brown coal comprises onlyabout one twentieth of the total water present and it isattached to coal by hydrogen bonds in suitable polarfunctional groups [7] Gutierrez-Rodriguez et al [8] esti-mated the hydrophobicity of coal In recent years the re-search on this subject has focused more on the adsorptioneffect of the functional groups on water Liu et al [9]suggested that the potential to formmore hydrogen bonds isthe key factor influencing the interaction energy betweenmodel compounds and water molecules -e behavior ofwater in coal depends on many factors such as intermo-lecular hydrogen bonding [10] Water molecules interactwith the oxygen-containing functional groups on the surfaceof coal by hydrogen bonds [11ndash14] -e research on themoisture adsorption of lignite has mainly focused on thewater occurrence state and the influence of -OH CO andother functional groups [7 15ndash17] However there are fewstudies on the effect of a single functional group such as -O-on water molecule adsorption in the existing literature
In this study the pore distribution the effect of oxygen-containing functional groups on water molecule adsorptionand the relationship between the oxygen-containing func-tional groups pores and water molecule adsorption wereexamined [18] Based on previous studies the influence ofether bonds on the water molecule adsorption in lignite andcoke (lt950degC) was investigated through proton nuclearmagnetic resonance (1H-NMR) and water molecule ab-sorption and desorption experiments to lay a foundation forthe inhibition of lignite reabsorption and spontaneouscombustion
2 Method
All of the data obtained in this experiment were collectedthrough three parallel experiments and their average valueswere calculated and reported as the final values
21 Sample Preparation Lignite samples were collectedfrom the Shengli Mine of China -e coal samples werecrushed and screened and those with particle sizes of200ndash400 mesh were stored for future use Raw coal wasstored directly at room temperature (25degC) and other coalsamples were extracted by pyrolysis in a fixed-bed reactorCoal samples were selected and heated to 50 75 105 200300 500 700 and 950degC at 5degCmin under a nitrogen at-mosphere for 1 h -e obtained sample was labeled with thecorresponding temperature and the temperature label of theraw coal (untreated coal sample) was 25degC Table 1 displaysthe results of the proximate and ultimate analyses of all coalsamples obtained by an industrial analyzer (5E-MAG6700)an element analyzer (5E-CHN2000) and an infrared sulfurmeter (5E-IRS II)
22 Moisture Adsorption and Desorption -e moistureadsorption experiments were performed in an SHBY-40B
standard curing box (manufactured by Jiangsu WuxiSouthern China Experimental Instrument Inc) -e coalsamples were spread on a 35mm culture dish which wasthen placed into a constant-temperature (30degC) and con-stant-humidity (85) box -e first 6 h was divided intothree phases with 2 h for each phase and an interval of30min -e samples were weighed every 1 or 2 h Equilib-rium moisture adsorption was reached if the differencebetween the two adjacent weights was smaller than 001 g-e adsorption of water and the equilibrium adsorptionratio were calculated as follows
adsorption of water mt minus m0
equilibrium adsorption ratio mt minus m0( 1113857
m0 times 100
(1)
wherem0 is the mass of the lignite sample andmt is the massof the lignite sample after water absorption
Lignite and coke samples after the adsorption of watermolecules were desorbed with a temperature rise rate of 2degCmin and a temperature range of 25ndash200degC A thermogra-vimetric analyzer was used to obtain the thermogravimetry(TG) derivative thermogravimetry (DTG) and differentialthermal analysis (DTA) curves of the desorbed lignite afteradsorption
23 Proton Nuclear Magnetic Resonance (1H-NMR)1H-NMR (VTMR20-010V-T Shanghai Niumag) was per-formed to test the water contents of the samples -e testingparameters were a resonance frequency of 21306MHzmagnetic intensity of 05 T coil diameter of 10mm and amagnetic temperature of 3500degC -e sample signal valueswere collected using NMR analysis software andCarrndashPurcellndashMeiboomndashGill (CPMG) sequences were ob-tained On this basis the T2 spectrum was obtained throughinversion with the simultaneous iterative reconstructiontechnique (SIRT) -e coal samples (1ndash125 g) were placedinto a detector oven and the detection limit of water was10mg
-e coal samples were immersed in water for 24 hunder standard conditions to fill all the pores with watersuch that they became saturated water samples -e coalsamples were placed in an environment with a specifiedhumidity and water was adsorbed to the surface of thelignite -is kind coal sample is called an adsorbed watersample
-e interaction strength between the lignite and watermolecules is expressed as a transverse relaxation time T2(ms) as follows [19]
Mxy M0 times expminust
T21113888 1113889 (2)
where Mxy is the component of the macroscopic magneti-zation vector on the x-y axis M0 is the initial magnetizationvector and T2 is the transverse relaxation time -e inter-action strength Mxy is related to the relaxation time t byequation (2)
2 Journal of Chemistry
24 Oxygen-Containing Functional Groups Oxygen-con-taining functional groups were tested using Fourier-transforminfrared spectroscopy (FTIR NEXUS670 American NicoletCorporation) -e KBr method was performed to prepare thesamples -e samples and KBr were mixed at a ratio of 1 120Infrared spectra were obtained within the range of400ndash4000 cmminus1 and the scanning time was set at 25 s -eresolving power and wavenumber accuracy were 0125 and0001 cmminus1 respectively -e calculation of the content ofoxygen-containing functional groups is shown in Supple-mentary Materials S1
25Microstructure of LigniteCoke -e specific surface areasand pore distributions of the coal samples were determinedby a low-temperature nitrogen adsorption method using a3H-2000PS2 tester from the Baystar Instrument Technology(Beijing) Co Ltd -e BrunauerndashEmmettndashTeller (BET) andBarrettndashJoynerndashHalenda (BJH) methods were used to cal-culate the specific surface area pore volume and poredistribution for each sample -e surface morphologies andparticle sizes of the coal samples were observed usingscanning electron microscopy (SEM s-3400N Hitachicompany) -e accelerating voltage was 20 kV and back-scattered electron imaging was performed
3 Results and Discussion
31 Abnormal Changes of Moisture Absorption andDesorption in Lignite
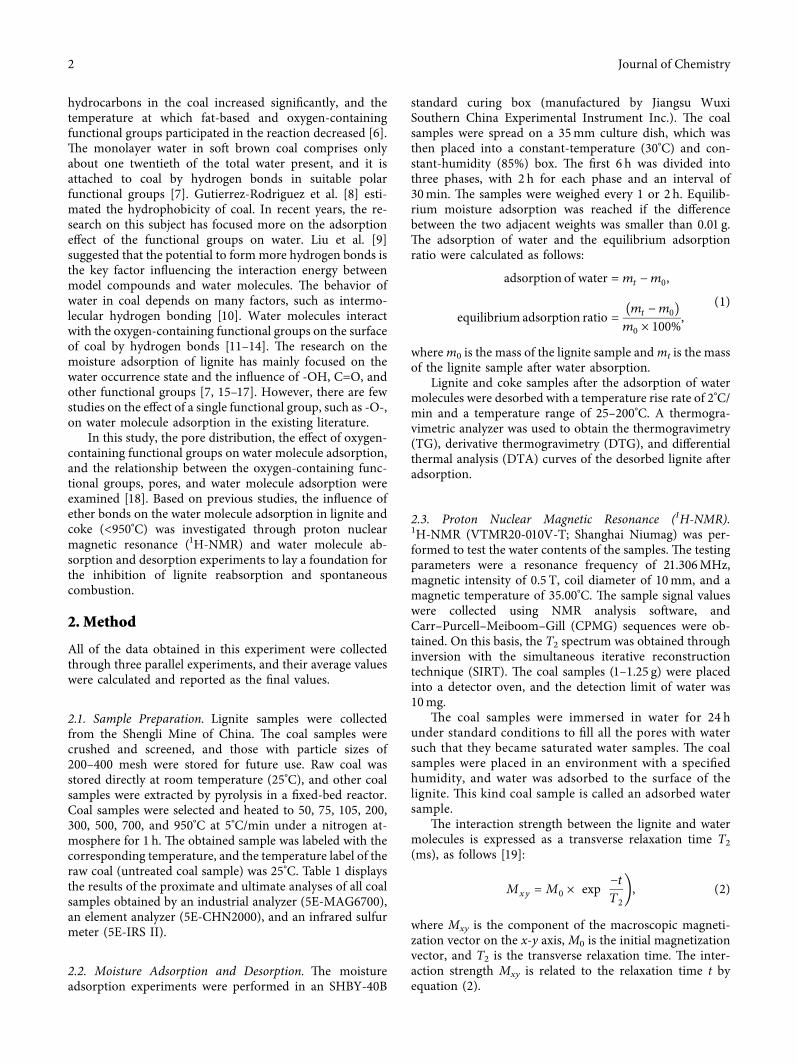
311 Moisture Content of Coal Samples after EquilibriumAdsorption in Difference Method In this study we foundthat under conditions with a constant temperature of 30degCand humidity of 85 and after the coal samples absorb waterto achieve equilibrium adsorption the moisture content ofcoal samples decreased first and then increased with theincrease in treatment temperature (Figure 1) -e moisturecontent of raw coal at 25degC is the highest reaching 2644-e moisture content of heat-treated coal sample at 105degCwas higher than that at 75degC which may be due to theexposure of functional groups after the escape of watermolecules with strong binding force Comparing Figure 1with Table 1 we can see that the coal sample heat treated at105degC achieved a maximum adsorption rate of 2280 At
higher heat-treatment temperatures the adsorption ratedecreased In the 200ndash300degC range the coal sample equi-librium adsorption rate was relatively low and at 700degC theheat-treated coal sample equilibrium adsorption rate was thelowest with a value of 1266 and the moisture content was1328 At 950degC the equilibrium adsorption rates of thecoal samples increased up to 2282 and the moisturecontent was 2329 -e moisture adsorption capacities ofthe coke at 300 and 950degC were abnormal as well (Figure 1A300 and B950)
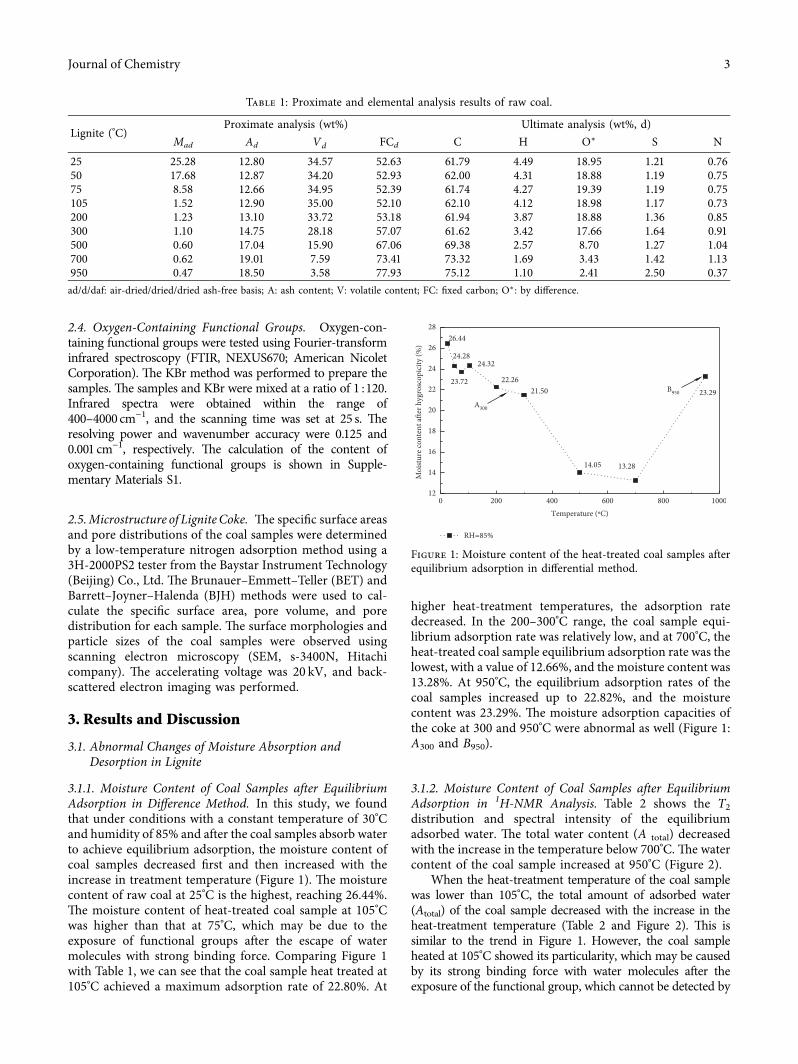
312 Moisture Content of Coal Samples after EquilibriumAdsorption in 1H-NMR Analysis Table 2 shows the T2distribution and spectral intensity of the equilibriumadsorbed water -e total water content (A total) decreasedwith the increase in the temperature below 700degC -e watercontent of the coal sample increased at 950degC (Figure 2)
When the heat-treatment temperature of the coal samplewas lower than 105degC the total amount of adsorbed water(Atotal) of the coal sample decreased with the increase in theheat-treatment temperature (Table 2 and Figure 2) -is issimilar to the trend in Figure 1 However the coal sampleheated at 105degC showed its particularity which may be causedby its strong binding force with water molecules after theexposure of the functional group which cannot be detected by
B950
A300
2329
13281405
21502226
2432
2372
2644
2428
12
14
16
18
20
22
24
26
28
Moi
sture
cont
ent a
fter h
ygro
scop
icity
()
200 400 600 800 10000Temperature (ordmC)
RH=85
Figure 1 Moisture content of the heat-treated coal samples afterequilibrium adsorption in differential method
Table 1 Proximate and elemental analysis results of raw coal
Lignite (degC)Proximate analysis (wt) Ultimate analysis (wt d)
Mad Ad Vd FCd C H Olowast S N
25 2528 1280 3457 5263 6179 449 1895 121 07650 1768 1287 3420 5293 6200 431 1888 119 07575 858 1266 3495 5239 6174 427 1939 119 075105 152 1290 3500 5210 6210 412 1898 117 073200 123 1310 3372 5318 6194 387 1888 136 085300 110 1475 2818 5707 6162 342 1766 164 091500 060 1704 1590 6706 6938 257 870 127 104700 062 1901 759 7341 7332 169 343 142 113950 047 1850 358 7793 7512 110 241 250 037adddaf air-drieddrieddried ash-free basis A ash content V volatile content FC fixed carbon Olowast by difference
Journal of Chemistry 3
1H-NMR When the heat-treatment temperature was105ndash700degC the amount of adsorbed water decreased the rateof decrease of the amount of adsorbed water of the coal sampleheated at 300degC slowed (Figure 2 A300) and the amount ofadsorbed water of the coal sample heated at 950degC increasedsharply (Figure 2 B950) With the increase in the heat-treat-ment temperature the coal samples for heat treatment at 300and 950degC showed abnormal moisture adsorption
313 Water Desorption -e TG curves of the water de-sorption from lignite after adsorption were obtained by de-sorption experiments (Figure 3) -e amount of desorbedwater of raw coal (25degC) after water absorption was thelargest approaching 20 As the pyrolysis temperature oflignite increased the amount of desorbed water of lignitedecreased gradually -e amounts of desorbed water of thecoal samples treated at 50 75 and 105degC were almost thesame and those of the coal samples treated at 300 and 950degCwere abnormal -e amount of desorbed water of the coalsample treated at 300degC was greater than that of coal sample
treated at 200degC and the amount of desorbed water of the coalsample treated at 950degC was greater than that of coal sampletreated at 500degC which was consistent with the results of theadsorption process described above (Figures 1 and 2)
-e corresponding DTA (Figure 4) and DTG (Figure 5)data were further analyzed Most of the adsorbed water wasremoved at 80degC Small amounts of water in the coal samplesat 300 and 950degC needed more energy to release from thesample surfaces and the removal temperature was around100degC Strong binding interactions occurred in the coalsamples heated at 300degC similar to that in the coal samplesheated at 950degC
In the moisture absorption and desorption experimentsof lignite coke with the increase in the heat-treatmenttemperature the equilibrium amount of adsorbed water ofthe coal coke increased first (lt105degC) then decreased(105ndash700degC) and then increased dramatically (700ndash950degC)At the same time the coal samples for heat treatment at 300and 950degC showed abnormal moisture adsorption behav-iors Water desorption experiments showed that some ofthe water in the coal samples for heat treatment at 300 and950degC was difficult to remove and the water had relativelystronger bonds
32 State of AdsorbedWater Occurrence 1H-NMR was usedto investigate the differences in the state of adsorbed waterunder saturated and unsaturated conditions -e primarymoisture adsorbed on the surfaces of the lignite and cokewas detected by 1H-NMR and the peak shifts of the ad-sorption curves were used to show the main binding in-teraction Figure 6 shows the water molecule adsorptioncapacities of the coke samples with different degrees ofpyrolysis When the treatment temperature was below500degC the relaxation time (T2) moved to the left as thetemperature increased (curve a-b in Figure 6) T2 showed adecreasing trend but the H2O adsorption capacity wasincreasing T2 reflects the degrees of freedom of the protonsin the binding interactions between coal and water mole-cules which was gradually increasing -e value of T2 at 700and 950degC shifted to the right (curve b-c in Figure 6) and thebinding interactions of coal samples with adsorbed watermolecules decreased In the pyrolysis process the oxygen-containing functional groups with weak binding interactionsescaped first as the temperature increased -e residualbinding interactions in coal were strong and the absorptionof water molecules was strong However the total amount ofadsorption was reduced -erefore the maximum adsorp-tion interactions of each coal sample increased first and thendecreased and this process was closely related to the evo-lution of oxygen-containing functional groups [20]
-e distribution T2 in the saturated water lignite sampleswas investigated (Figure 7)-e T2 values of the coal samplesat 700 and 950degC significantly shifted to the right indicatingthat the water molecule binding interactions in the coalsamples were weak and the relaxation times were long
Meanwhile the T2 of the coal sample heated at 950degCshifted to the left relative to that of the coal sample heated at700degC and there were significant peaks at relaxation times
Table 2 Amplitude (AU) and distribution of T2 spectra ofmoisture adsorption of the SLH
Temperature (degC)
25
50
75
105
200
300
500
700
950
T21ms
076
075
065
037
028
027
018
132
305
A21 (times103)
315
309
312
25
216
192
13
154
175
Aq (times102)
06
066
042
024
122
107
272
01
629
Atotal (times103)
321
316
316
252
228
203
157
155
238
T 2A
mpl
itude
(au
)
T2 Amplitude (AU)
2377
15451571
2130
2279
2523
320531583156
AB950
300
14001600180020002200240026002800300032003400
100 200 300 400 500 600 700 800 900 10000Temperature (ordmC)
Figure 2 Moisture content of the heat-treated coal samples afterequilibrium adsorption in 1H-NMR analysis
4 Journal of Chemistry
between 02 and 05ms (Figure 7(a) B950) -is indicatedthat the adsorption capacity of the coal sample heated at950degC was different from that of the coal sample heated at700degC -e T2 distribution in the adsorbed of lignite wasinvestigated (Figure 7(b)) -e peak of the coal sampleheated at 950degC was significantly different from that of thecoal sample heated at 700degC for relaxation times between 02and 05ms (Figure 7(b) B950) Based on these results and the1H-NMR results described above there were strong bindinginteractions in the coal sample heated at 950degC similar tothat in the coal sample heated at 300degC (Figure 7)
-e results of the 1H-NMR experiment and lignite cokeabsorption and desorption experiments had good
consistency With the increase in the heat-treatment tem-perature the structure of the lignite coke changed at around300 and 950degC which led to an enhanced binding effect ofthe lignite coke with some of the water molecules a rise inthe desorption temperature and a relative increase in theamount of moisture adsorbed
33 Physical and Chemical Structure Changes during LignitePyrolysis
331 Oxygen-Containing Functional Groups Infraredanalysis was used to detect the changes of the oxygen-containing functional groups in the lignite coke [21] -e
950degC300degC
700degC
500degC
25degC
50degC75degC
105degC
200degC
-4
-2
0
2
4
6
8
10
DTA
(uV
mg-1
)
160 20080 100 120 14040 6020 180Temperature (degC)
SL-50degCSL-75degC
SL-25degC SL-105degCSL-200degCSL-300degC
SL-500degCSL-700degCSL-950degC
(a)
950degC
300degC
4
5
6
7
DTA
(uV
mg-1
)
90 100 110 12080Temperature (degC)
SL-50degCSL-75degC
SL-25degC SL-105degCSL-200degCSL-300degC
SL-500degCSL-700degCSL-950degC
(b)
Figure 4 Desorption differential thermal analysis (DTA) curves of lignite and coke after adsorption
SL-50degCSL-200degCSL-700degC
SL-75degCSL-300degCSL-950degC
700degC
degdeg
300degC
105degC
25degC
50degC 75degC080
085
090
095
100
TG (
)
SL-25degCSL-105degCSL-500degC
40 60 80 100 120 140 160 180 20020Temperature (degC)
Figure 3 -ermogravimetry (TG) curves of H2O desorption of the thermally treated lignite samples after H2O adsorption
Journal of Chemistry 5
calculation of the content of oxygen-containing functionalgroups is shown in Supplementary Materials S1
-e oxygen-containing functional group content in thelignite increased first and then decreased (Figure 8) and thechange of the water molecule adsorption quantity (Fig-ures 1 and 2) was in good agreement In particular theether bonds at 300 and 950degC were abnormal In the py-rolysis process the content of ether bonds generallyshowed a downward trend but at 300 and 950degC thedownward trend slowed and even changed to an upwardtrend (Figure 8(c) A300 B950) which was consistent withprevious experimental results [22] -e moisture adsorp-tion capacity of the 300 and 950degC lignite coke (Figure 1A300 B950 Figure 2 A300 B950) was consistent with the
changes of the ether bond content -is indicated that theincrease in the ether bond contents in the coal samples at300 and 950degC was an important reason for the increase ofthe adsorbed moisture in the coal coke
Meanwhile the 1H-NMR data showed that a smallamount of moisture with strong adsorption was present inthe lignite coke at 300 and 950degC (Figure 7) and there wasalso a small amount of moisture present during the processof water desorption whose removal temperature was higherthan that of the other water (Figures 3 5 and 6) Based onthe above analysis the generation of ether bonds in thelignite coke at 300 and 950degC enhanced the binding of thelignite coke surface to some of the moisture
332 Pore Size Distribution -e pore distributions of coalsamples were determined by 1H-NMR and the pore sizedistribution is shown in Figure 9 and Table 3
-e microstructural evolution of the heat-treated lignitewas further investigated using SEM (Figure 10) -e lignitecoke below the heat-treatment temperature of 200degCexhibited no chemical differences from the raw coal Withthe removal of water in the pores more pores were exposedresulting in a significant increase in the pore content Whenthe heat-treatment temperature was higher than 200degC theheat-treatment process caused significant weight loss andgas escape [18] In particular condensation polymerizationoccurred at about 300degC resulting in ether bonds and porecontraction (Figure 10) Under 500degC heat treatment thenumber of lignite coke pores increased (Table 3 and Fig-ures 9 and 10) At this point the bridge bond fracturereached its maximum value -e porosity of lignite coketreated at 700degC continued to increase (Table 3 and Figures 9and 10) and it increased significantly which was caused bycondensation polymerization [23]When the heat-treatmenttemperature was 950degC the proportion of pores below 10 nmwas significantly reduced and the pore size distribution
a
b
c0
200
400
600
800
1000
1200
1400
1600
1800
T 2am
plitu
de (P
U)
1 1001T2 (ms)
SL-50degCSL-75degC
SL-25degC SL-105degCSL-200degCSL-300degC
SL-500degCSL-700degCSL-950degC
Figure 6 Coke adsorption capacities for H2O during differentpyrolysis stages
75degC
50degC
25degC
300degC950degC
500degC700degC
105degC
200degC
-0005
-0004
-0003
-0002
-0001
0000
DTG
(m
in)
8040 60 100 120 140 160 18020 200Temperature (degC)
SL-25degCSL-50degCSL-75degC
SL-105degCSL-200degCSL-300degC
SL-500degCSL-700degCSL-950degC
(a)
950degC
300degC
-0001
0000
DTG
(m
in)
100 12080Temperature (degC)
SL-25degCSL-50degCSL-75degC
SL-105degCSL-200degCSL-300degC
SL-500degCSL-700degCSL-950degC
(b)
Figure 5 Desorption derivative thermogravimetry (DTG) curves of lignite and coke after adsorption
6 Journal of Chemistry
moved toward the direction of large pores which also in-dicated that condensation polymerization and pore collapseoccurred at this stage
Based on the above changes of the amount of watermolecule adsorption and the water binding state in thelignite coke as well as the physical and chemical changesthat occurred in the lignite coke heat-treatment process itwas inferred that the abnormal changes of the watermolecule adsorption on the lignite coke heated at 300 and950degC were caused by the formation of ether bonds andpore changes
34 H2O Adsorption Mechanism of Lignite and CokeAccording to above analysis and previous research [18] thewater molecule adsorption mechanisms of lignite and cokewere determined and they are shown in Figure 11
When the heat-treatment temperature was below 105degCwith the increase in temperature moisture escaped andoxygen-containing functional groups were exposed in thelignite -e number of active sites or oxygen-containingfunctional groups was the highest [18] -e moisture wasabsorbed on the active sites which led to increased watermolecule absorption in lignite in this temperature rangeHowever most of the absorbed water molecules were singlelayered -is was associated with a strong absorption force
1000
1500
2000
2500
3000
3500
Abso
rptio
n pe
ak ar
ea
200 400 600 800 10000Temperature (degC)
mdashOH
(a)
200 400 600 800 10000Temperature (degC)
0
20
40
60
80
100
120
Abso
rptio
n pe
ak ar
ea
C=O
(b)
A300
B950
200 400 600 800 10000Temperature (degC)
56
63
70
77
84
91
Abso
rptio
n pe
ak ar
ea
mdashOmdash
(c)
Figure 8 Absorption peak areas of (a) -OH (b) CO and (c) -O- groups of thermally treated lignite
25degC
200degC950degC
50degC
75degC
105degC300degC
500degC
10 100 1000 10000 1000001Radius (nm)
00051015202530354045
Pore
size
dist
ribut
ion
()
001 01 1 10 100 1000Relaxation time (ms)
SL-25SL-50SL-75
SL-105SL-200SL-300
SL-500SL-700SL-950
Figure 9 Pore size distribution of heat treatments of the coalsamples at different temperatures from 1H-NMR
T 2Am
plitu
de (a
u)
25degC
700degC300degC950degC
B950
0
20
40
60
80
100
120
140
160
180
200
01 1 10 100 1000001T2 (ms)
SL-25degCSL-300degC
SL-700degCSL-950degC
(a)
T 2Am
plitu
de (a
u)
25degC
300degC950degC
700degCB950
0
50
100
150
200
01 1 10 100 1000001T2 (ms)
SL-25degCSL-300degC
SL-700degCSL-950degC
(b)
Figure 7 (a) T2 distribution of thermally treated lignite saturated water (b) T2 distribution of H2O on adsorbed water sample
Journal of Chemistry 7
-e relaxation time (T2) decreased and the preminus105degC heattreatment of the coal sample moisture relaxation time de-creased (Figure 6) When the heat-treatment temperaturewas 105ndash500degC the content of oxygen functional groups-OH and CO continued to decrease and the adsorbed
moisture decreased with the increase in temperatureHowever the bonding interactions of water molecules wererelatively strong with relaxation time decreasing (Figure 6)-e increase in the ether bonds in the coal samples at 300degCslowed the decreasing trend of water molecule absorption
(a) (b)
(c) (d)
(e)
Figure 10 Scanning electron microscopy (SEM) images of lignite coke pyrolyzed at different temperatures (a) 200degC (b) 300degC (c) 500degC(d) 700degC and (e) 950degC
Table 3 Different size pore ratios of lignite at different heat treatment temperatures (1H-NMR)
Temperature (degC)Pore ratios ()
lt10 nm 10ndash100 nm 100ndash1000 nm gt1000 nm25 251 4674 4727 34850 000 5496 4138 36675 208 4075 4396 1321105 000 2284 4741 2975200 152 3100 1143 5605300 917 2479 3294 3310500 655 2981 2503 3861700 333 1606 3153 4909950 000 833 4036 5131
8 Journal of Chemistry
(Figures 1 and 2) -e oxygen-containing functional groups(OH and -O-) of the coal samples heated at 500 and 700degCcontinued to decrease and CO disappeared (Figure 8) As aresult an insufficient number of water molecules wereadsorbed to form the first layer water Significant multilayerwater appears in 500degC coal samples (Figure 6) -e amountof water absorption in the 500degC and 700degC coal samples wasrelatively small for all the coal samples as the content ofoxygen functional groups in those two samples was small(Figures 1 and 2) However the T2 of the lignite coke heatedat 500degC was the shortest and the adsorption force was thestrongest (Figure 6) -e coal sample heated at 950degCcontained a certain number of ether bonds and the watermolecule absorption increased significantly (Figures 1 and2) However the maximum adsorption force was theweakest (Figure 6) because the functional groups were al-most gone (Figure 8)
-rough comprehensive consideration of the porechanges [18] it was found that the cracks were larger(Figures 7(a) and 9) and the multilayer water was not easy toretain -e moisture state of the coal sample heated at 700degCchanged and the amount of multilayer adsorption increased(Figure 7(b)) -ere should be a critical point between 500and 700degC at which the moisture adsorption changes from asingle layer to multiple layers (Figure 6) Although there waslittle -OH in 950degC coal samples the -O- content increased(Figure 8) Meanwhile large-aperture crannies disappeared(Figures 7(a) and 9) and the apertures (20ndash1000 nm) wereuniformly distributed (Figures 7(a) and 9) As the numbersof -OH and -O- groups were relatively small (1000 and 63respectively) there was less single-layer water and most ofthe adsorbed water was multilayer At the same time owingto the well-distributed apertures compared to those of thecoal sample treated at 700degC the multilayer water could beretained As a result the number of adsorbed water mole-cules of the coal sample heated at 950degC surpassed those ofthe samples heated at 700 and 500degC (Figures 1 and 2) -euniform distribution of pore diameters allowed the
multilayer water to be retained which was the body of theabsorbed water (Figure 7(a))
4 Conclusion
In summary in this study a new 1H-NMR method forstudying the water molecule adsorption of lignite and cokewas proposed -is method was used to explore the waterabsorption and desorption processes of lignite pyrolysis atdifferent temperatures (25ndash950degC) and the special contri-butions of ether bonds to the water adsorption -e ad-sorption was demonstrated to be dependent on the presenceof ldquoether bondsrdquo in the lignite pyrolysis process which couldsignificantly improve the adsorption effect of water -eincrease in the ether bond content (at 300 and 950degC)resulted in a significant increase in the water adsorptioncapacity and a significant decrease in the desorption ca-pacity -e reason for this phenomenon was the strongadsorption capacities of the ether bonds -e ether bondscould cause water molecules to form stable adsorption layersin a monolayer water state In the pyrolyzed coal samples at950degC the adsorption capacities of the ether bonds remainedhigh after the monolayer of water was saturated and thewater molecules underwent multilayer adsorption -isstudy offers a new approach for investigating the watermolecule adsorption and the adsorption mechanism oflignite and coke
Data Availability
-e data used to support the findings of this study areavailable from the corresponding author upon request
Conflicts of Interest
-e authors declare that they have no direct financial re-lationship with the commercial entities mentioned in thisstudy that might lead to conflicts of interest
105degC 200degC 300degC 500degC 950degC
-OHC=O-O-
H2Othe surface of lignite
(a)
34003200300028002600240022002000180016001400
0 100 200 300 400 500 600 700 800 900 1000Temperature (degC)
32053158
3156
2523
22792130
1571 1545
2377
I
II
III
IV V
VI
T 2i A
mpl
itude
(pu
)
T2i Amplitude (pu)
(b)
Figure 11 Change of H2O adsorption due to lignite pyrolysis (a) water molecule adsorption model on lignite surface and (b) adsorptionmodel of water molecules in pores of lignite
Journal of Chemistry 9
Acknowledgments
-is work was supported by grants from the NationalNatural Science Foundation of China (21766023) Scienceand Technology Program of Inner Mongolia (grant number2019GG268) Research Project of Inner Mongolia Universityof Technology (grant number ZZ201906) Science andTechnology Plan Project with Applied Technology ResearchandDevelopment of Ordos (grant number 2019501) Scienceand Technology Development Fund of Central Guide Placein 2020 (grant number 2020ZY00322) and Scientific Re-search Project for Higher Education Institution of InnerMongolia (grant number NJZY21150)
Supplementary Materials
As shown in Supplementary Materials S1 the FTIR spectraof the lignite samples treated under different temperaturesexhibited the same shapes but showed different intensities ofthe absorption peaks-e peak at 1700 cmminus1 is the stretchingvibration peak of aromatic CO and the peak at 1600 cmminus1
is the stretching vibration peak of aromatic CC-e peak at1110 cmminus1 is the stretching vibration peak of -O- -e in-tegral area was acquired by integrating the fitted FTIRspectra in the ranges of 3000ndash3700 cmminus1 (-OH)1550ndash1800 cmminus1 (CO) and 1100ndash1200 cmminus1 (-O-) (Sup-plementary Materials)
References
[1] Z Miao Y Wan Q He Z Pei and X Zhu ldquoPyrolysis be-haviors and product distribution of shengli lignite at differentheating rate and final temperature by TG-FTIR and Py-GC-MSrdquo Energy Sources Part A Recovery Utilization and Envi-ronmental Effects vol 43 no 10 pp 1ndash13 2019
[2] Y Zhang X Zhang Q Zhong S Hu and J P MathewsldquoStructural differences of spontaneous combustion proneinertinite-rich Chinese lignite coals insights fromXRD solid-state 13C NMR LDIMS and HRTEMrdquo Energy amp Fuelsvol 33 no 5 pp 4575ndash4584 2019
[3] S Tao S Chen D Tang X Zhao H Xu and S Li ldquoMaterialcomposition pore structure and adsorption capacity of low-rank coals around the first coalification jump a case of easternJunggar basin Chinardquo Fuel vol 211 no 1 pp 804ndash815 2018
[4] S Tao X Zhao D Tang C Deng Q Meng and Y Cui ldquoAmodel for characterizing the continuous distribution of gasstoring space in low-rank coalsrdquo Fuel vol 233 no 9pp 552ndash557 2018
[5] X Men S Tao Z Liu W Tian and S Chen ldquoExperimentalstudy on gas mass transfer process in a heterogeneous coalreservoirrdquo Fuel Processing Technology vol 216 no 1 pp 1ndash92021
[6] Z Huang Y Tian Y Gao Z Shao Y Zhang and X LiuldquoStudy on the oxidation kinetics and microreactivity of water-immersed coalrdquo ACS Omega vol 5 no 28 pp 17287ndash173032020
[7] J B Murray and D G Evans ldquo-e brown-coalwater systempart 3 thermal dewatering of brown coalrdquo Fuel vol 51 no 4pp 290ndash296 1972
[8] J A Gutierrez-Rodriguez R J Purcell Jr and F F AplanldquoEstimating the hydrophobicity of coalrdquo Colloids and Sur-faces vol 12 no 5 pp 1ndash25 1984
[9] J Liu X Jiang Y Cao et al ldquoExploring the effect of oxygen-containing functional groups on the water-holding capacity ofligniterdquo Journal of Molecular Modeling vol 24 no 6 p 1302018
[10] H-S Kim Y Nishiyama K Ideta et al ldquoAnalysis of water inloy yang brown coal using solid-state 1H NMRrdquo Journal ofIndustrial and Engineering Chemistry vol 19 no 5pp 1673ndash1679 2013
[11] J Liao Q Mo C Li Y Han L Chang and W BaoldquoClassification of water forms in lignite and analysis of energyconsumption on the drying processes by microwave and fixedbedrdquo Fuel vol 253 pp 580ndash587 2019
[12] W Yu J Yang X Wu et al ldquoStudy on dewaterability limitand energy consumption in sewage sludge electro-dewateringby in-situ linear sweep voltammetry analysisrdquo ChemicalEngineering Journal vol 317 no 8 pp 980ndash987 2017
[13] F Wei J Liao L Chang Y Han and W Bao ldquoTransfor-mation of functional groups during lignite heat-treatment andits effects on moisture re-adsorption propertiesrdquo Fuel Pro-cessing Technology vol 192 no 2 pp 210ndash219 2019
[14] L Hu G Wang and Q Wang ldquoEfficient drying and oxygen-containing functional groups characteristics of lignite duringmicrowave irradiation processrdquo Drying Technology an In-ternational Journal vol 36 no 10 pp 1086ndash1097 2018
[15] K Miura K Mae W Li T Kusakawa F Morozumi andA Kumano ldquoEstimation of hydrogen bond distribution incoal through the analysis of OH stretching bands in diffusereflectance infrared spectrum measured by in-situ techni-queflectance infrared spectrum measured by in-situ tech-niquerdquo Energy amp Fuels vol 15 no 3 pp 599ndash610 2001
[16] S K Rish A Tahmasebi and J Yu ldquoA DSC study on theimpact of low-temperature oxidation on the behavior anddrying of water in ligniterdquo Journal of gtermal Analysis andCalorimetry vol 139 no 6 pp 3507ndash3517 2019
[17] B Lv Z Luo B Zhang and C Chen ldquoDrying and moisturereadsorption characteristics of ligniterdquo International Journalof Coal Preparation and Utilization vol 40 no 10 pp 712ndash729 2020
[18] Y Teng S Lian Q Liu et al ldquoEvolvement behavior of mi-crostructure and H2O adsorption of lignite pyrolysisrdquo ChineseJournal of Chemical Engineering vol 24 no 6 pp 803ndash8102016
[19] W Liu and X Li Nuclear Magnetic Resonance Logging Pe-troleum Industry Press Beijing China 2011
[20] L M Duarte P R Filgueiras S R C Silva et al ldquoDeter-mination of some physicochemical properties in Braziliancrude oil by 1HNMR spectroscopy associated to chemometricapproachrdquo Fuel vol 181 no 10 pp 660ndash669 2016
[21] A Tahmasebi J Yu Y Han F Yin S Bhattacharya andD Stokie ldquoStudy of chemical structure changes of Chineselignite upon drying in superheated steam microwave and hotairrdquo Energy amp Fuels vol 26 no 6 pp 3651ndash3660 2012
[22] H Qiu Influence of Oxygen-Containing Functional GroupContent onMoisture Regain and Pyrolysis Reactivity of LigniteTaiyuan University of Technology Taiyuan China 2013
[23] J Gao Coal Pyrolysis Coking and Coal Tar ProcessingChemical Industry Press Beijing China 2010
10 Journal of Chemistry
hydrocarbons in the coal increased significantly and thetemperature at which fat-based and oxygen-containingfunctional groups participated in the reaction decreased [6]-e monolayer water in soft brown coal comprises onlyabout one twentieth of the total water present and it isattached to coal by hydrogen bonds in suitable polarfunctional groups [7] Gutierrez-Rodriguez et al [8] esti-mated the hydrophobicity of coal In recent years the re-search on this subject has focused more on the adsorptioneffect of the functional groups on water Liu et al [9]suggested that the potential to formmore hydrogen bonds isthe key factor influencing the interaction energy betweenmodel compounds and water molecules -e behavior ofwater in coal depends on many factors such as intermo-lecular hydrogen bonding [10] Water molecules interactwith the oxygen-containing functional groups on the surfaceof coal by hydrogen bonds [11ndash14] -e research on themoisture adsorption of lignite has mainly focused on thewater occurrence state and the influence of -OH CO andother functional groups [7 15ndash17] However there are fewstudies on the effect of a single functional group such as -O-on water molecule adsorption in the existing literature
In this study the pore distribution the effect of oxygen-containing functional groups on water molecule adsorptionand the relationship between the oxygen-containing func-tional groups pores and water molecule adsorption wereexamined [18] Based on previous studies the influence ofether bonds on the water molecule adsorption in lignite andcoke (lt950degC) was investigated through proton nuclearmagnetic resonance (1H-NMR) and water molecule ab-sorption and desorption experiments to lay a foundation forthe inhibition of lignite reabsorption and spontaneouscombustion
2 Method
All of the data obtained in this experiment were collectedthrough three parallel experiments and their average valueswere calculated and reported as the final values
21 Sample Preparation Lignite samples were collectedfrom the Shengli Mine of China -e coal samples werecrushed and screened and those with particle sizes of200ndash400 mesh were stored for future use Raw coal wasstored directly at room temperature (25degC) and other coalsamples were extracted by pyrolysis in a fixed-bed reactorCoal samples were selected and heated to 50 75 105 200300 500 700 and 950degC at 5degCmin under a nitrogen at-mosphere for 1 h -e obtained sample was labeled with thecorresponding temperature and the temperature label of theraw coal (untreated coal sample) was 25degC Table 1 displaysthe results of the proximate and ultimate analyses of all coalsamples obtained by an industrial analyzer (5E-MAG6700)an element analyzer (5E-CHN2000) and an infrared sulfurmeter (5E-IRS II)
22 Moisture Adsorption and Desorption -e moistureadsorption experiments were performed in an SHBY-40B
standard curing box (manufactured by Jiangsu WuxiSouthern China Experimental Instrument Inc) -e coalsamples were spread on a 35mm culture dish which wasthen placed into a constant-temperature (30degC) and con-stant-humidity (85) box -e first 6 h was divided intothree phases with 2 h for each phase and an interval of30min -e samples were weighed every 1 or 2 h Equilib-rium moisture adsorption was reached if the differencebetween the two adjacent weights was smaller than 001 g-e adsorption of water and the equilibrium adsorptionratio were calculated as follows
adsorption of water mt minus m0
equilibrium adsorption ratio mt minus m0( 1113857
m0 times 100
(1)
wherem0 is the mass of the lignite sample andmt is the massof the lignite sample after water absorption
Lignite and coke samples after the adsorption of watermolecules were desorbed with a temperature rise rate of 2degCmin and a temperature range of 25ndash200degC A thermogra-vimetric analyzer was used to obtain the thermogravimetry(TG) derivative thermogravimetry (DTG) and differentialthermal analysis (DTA) curves of the desorbed lignite afteradsorption
23 Proton Nuclear Magnetic Resonance (1H-NMR)1H-NMR (VTMR20-010V-T Shanghai Niumag) was per-formed to test the water contents of the samples -e testingparameters were a resonance frequency of 21306MHzmagnetic intensity of 05 T coil diameter of 10mm and amagnetic temperature of 3500degC -e sample signal valueswere collected using NMR analysis software andCarrndashPurcellndashMeiboomndashGill (CPMG) sequences were ob-tained On this basis the T2 spectrum was obtained throughinversion with the simultaneous iterative reconstructiontechnique (SIRT) -e coal samples (1ndash125 g) were placedinto a detector oven and the detection limit of water was10mg
-e coal samples were immersed in water for 24 hunder standard conditions to fill all the pores with watersuch that they became saturated water samples -e coalsamples were placed in an environment with a specifiedhumidity and water was adsorbed to the surface of thelignite -is kind coal sample is called an adsorbed watersample
-e interaction strength between the lignite and watermolecules is expressed as a transverse relaxation time T2(ms) as follows [19]
Mxy M0 times expminust
T21113888 1113889 (2)
where Mxy is the component of the macroscopic magneti-zation vector on the x-y axis M0 is the initial magnetizationvector and T2 is the transverse relaxation time -e inter-action strength Mxy is related to the relaxation time t byequation (2)
2 Journal of Chemistry
24 Oxygen-Containing Functional Groups Oxygen-con-taining functional groups were tested using Fourier-transforminfrared spectroscopy (FTIR NEXUS670 American NicoletCorporation) -e KBr method was performed to prepare thesamples -e samples and KBr were mixed at a ratio of 1 120Infrared spectra were obtained within the range of400ndash4000 cmminus1 and the scanning time was set at 25 s -eresolving power and wavenumber accuracy were 0125 and0001 cmminus1 respectively -e calculation of the content ofoxygen-containing functional groups is shown in Supple-mentary Materials S1
25Microstructure of LigniteCoke -e specific surface areasand pore distributions of the coal samples were determinedby a low-temperature nitrogen adsorption method using a3H-2000PS2 tester from the Baystar Instrument Technology(Beijing) Co Ltd -e BrunauerndashEmmettndashTeller (BET) andBarrettndashJoynerndashHalenda (BJH) methods were used to cal-culate the specific surface area pore volume and poredistribution for each sample -e surface morphologies andparticle sizes of the coal samples were observed usingscanning electron microscopy (SEM s-3400N Hitachicompany) -e accelerating voltage was 20 kV and back-scattered electron imaging was performed
3 Results and Discussion
31 Abnormal Changes of Moisture Absorption andDesorption in Lignite
311 Moisture Content of Coal Samples after EquilibriumAdsorption in Difference Method In this study we foundthat under conditions with a constant temperature of 30degCand humidity of 85 and after the coal samples absorb waterto achieve equilibrium adsorption the moisture content ofcoal samples decreased first and then increased with theincrease in treatment temperature (Figure 1) -e moisturecontent of raw coal at 25degC is the highest reaching 2644-e moisture content of heat-treated coal sample at 105degCwas higher than that at 75degC which may be due to theexposure of functional groups after the escape of watermolecules with strong binding force Comparing Figure 1with Table 1 we can see that the coal sample heat treated at105degC achieved a maximum adsorption rate of 2280 At
higher heat-treatment temperatures the adsorption ratedecreased In the 200ndash300degC range the coal sample equi-librium adsorption rate was relatively low and at 700degC theheat-treated coal sample equilibrium adsorption rate was thelowest with a value of 1266 and the moisture content was1328 At 950degC the equilibrium adsorption rates of thecoal samples increased up to 2282 and the moisturecontent was 2329 -e moisture adsorption capacities ofthe coke at 300 and 950degC were abnormal as well (Figure 1A300 and B950)
312 Moisture Content of Coal Samples after EquilibriumAdsorption in 1H-NMR Analysis Table 2 shows the T2distribution and spectral intensity of the equilibriumadsorbed water -e total water content (A total) decreasedwith the increase in the temperature below 700degC -e watercontent of the coal sample increased at 950degC (Figure 2)
When the heat-treatment temperature of the coal samplewas lower than 105degC the total amount of adsorbed water(Atotal) of the coal sample decreased with the increase in theheat-treatment temperature (Table 2 and Figure 2) -is issimilar to the trend in Figure 1 However the coal sampleheated at 105degC showed its particularity which may be causedby its strong binding force with water molecules after theexposure of the functional group which cannot be detected by
B950
A300
2329
13281405
21502226
2432
2372
2644
2428
12
14
16
18
20
22
24
26
28
Moi
sture
cont
ent a
fter h
ygro
scop
icity
()
200 400 600 800 10000Temperature (ordmC)
RH=85
Figure 1 Moisture content of the heat-treated coal samples afterequilibrium adsorption in differential method
Table 1 Proximate and elemental analysis results of raw coal
Lignite (degC)Proximate analysis (wt) Ultimate analysis (wt d)
Mad Ad Vd FCd C H Olowast S N
25 2528 1280 3457 5263 6179 449 1895 121 07650 1768 1287 3420 5293 6200 431 1888 119 07575 858 1266 3495 5239 6174 427 1939 119 075105 152 1290 3500 5210 6210 412 1898 117 073200 123 1310 3372 5318 6194 387 1888 136 085300 110 1475 2818 5707 6162 342 1766 164 091500 060 1704 1590 6706 6938 257 870 127 104700 062 1901 759 7341 7332 169 343 142 113950 047 1850 358 7793 7512 110 241 250 037adddaf air-drieddrieddried ash-free basis A ash content V volatile content FC fixed carbon Olowast by difference
Journal of Chemistry 3
1H-NMR When the heat-treatment temperature was105ndash700degC the amount of adsorbed water decreased the rateof decrease of the amount of adsorbed water of the coal sampleheated at 300degC slowed (Figure 2 A300) and the amount ofadsorbed water of the coal sample heated at 950degC increasedsharply (Figure 2 B950) With the increase in the heat-treat-ment temperature the coal samples for heat treatment at 300and 950degC showed abnormal moisture adsorption
313 Water Desorption -e TG curves of the water de-sorption from lignite after adsorption were obtained by de-sorption experiments (Figure 3) -e amount of desorbedwater of raw coal (25degC) after water absorption was thelargest approaching 20 As the pyrolysis temperature oflignite increased the amount of desorbed water of lignitedecreased gradually -e amounts of desorbed water of thecoal samples treated at 50 75 and 105degC were almost thesame and those of the coal samples treated at 300 and 950degCwere abnormal -e amount of desorbed water of the coalsample treated at 300degC was greater than that of coal sample
treated at 200degC and the amount of desorbed water of the coalsample treated at 950degC was greater than that of coal sampletreated at 500degC which was consistent with the results of theadsorption process described above (Figures 1 and 2)
-e corresponding DTA (Figure 4) and DTG (Figure 5)data were further analyzed Most of the adsorbed water wasremoved at 80degC Small amounts of water in the coal samplesat 300 and 950degC needed more energy to release from thesample surfaces and the removal temperature was around100degC Strong binding interactions occurred in the coalsamples heated at 300degC similar to that in the coal samplesheated at 950degC
In the moisture absorption and desorption experimentsof lignite coke with the increase in the heat-treatmenttemperature the equilibrium amount of adsorbed water ofthe coal coke increased first (lt105degC) then decreased(105ndash700degC) and then increased dramatically (700ndash950degC)At the same time the coal samples for heat treatment at 300and 950degC showed abnormal moisture adsorption behav-iors Water desorption experiments showed that some ofthe water in the coal samples for heat treatment at 300 and950degC was difficult to remove and the water had relativelystronger bonds
32 State of AdsorbedWater Occurrence 1H-NMR was usedto investigate the differences in the state of adsorbed waterunder saturated and unsaturated conditions -e primarymoisture adsorbed on the surfaces of the lignite and cokewas detected by 1H-NMR and the peak shifts of the ad-sorption curves were used to show the main binding in-teraction Figure 6 shows the water molecule adsorptioncapacities of the coke samples with different degrees ofpyrolysis When the treatment temperature was below500degC the relaxation time (T2) moved to the left as thetemperature increased (curve a-b in Figure 6) T2 showed adecreasing trend but the H2O adsorption capacity wasincreasing T2 reflects the degrees of freedom of the protonsin the binding interactions between coal and water mole-cules which was gradually increasing -e value of T2 at 700and 950degC shifted to the right (curve b-c in Figure 6) and thebinding interactions of coal samples with adsorbed watermolecules decreased In the pyrolysis process the oxygen-containing functional groups with weak binding interactionsescaped first as the temperature increased -e residualbinding interactions in coal were strong and the absorptionof water molecules was strong However the total amount ofadsorption was reduced -erefore the maximum adsorp-tion interactions of each coal sample increased first and thendecreased and this process was closely related to the evo-lution of oxygen-containing functional groups [20]
-e distribution T2 in the saturated water lignite sampleswas investigated (Figure 7)-e T2 values of the coal samplesat 700 and 950degC significantly shifted to the right indicatingthat the water molecule binding interactions in the coalsamples were weak and the relaxation times were long
Meanwhile the T2 of the coal sample heated at 950degCshifted to the left relative to that of the coal sample heated at700degC and there were significant peaks at relaxation times
Table 2 Amplitude (AU) and distribution of T2 spectra ofmoisture adsorption of the SLH
Temperature (degC)
25
50
75
105
200
300
500
700
950
T21ms
076
075
065
037
028
027
018
132
305
A21 (times103)
315
309
312
25
216
192
13
154
175
Aq (times102)
06
066
042
024
122
107
272
01
629
Atotal (times103)
321
316
316
252
228
203
157
155
238
T 2A
mpl
itude
(au
)
T2 Amplitude (AU)
2377
15451571
2130
2279
2523
320531583156
AB950
300
14001600180020002200240026002800300032003400
100 200 300 400 500 600 700 800 900 10000Temperature (ordmC)
Figure 2 Moisture content of the heat-treated coal samples afterequilibrium adsorption in 1H-NMR analysis
4 Journal of Chemistry
between 02 and 05ms (Figure 7(a) B950) -is indicatedthat the adsorption capacity of the coal sample heated at950degC was different from that of the coal sample heated at700degC -e T2 distribution in the adsorbed of lignite wasinvestigated (Figure 7(b)) -e peak of the coal sampleheated at 950degC was significantly different from that of thecoal sample heated at 700degC for relaxation times between 02and 05ms (Figure 7(b) B950) Based on these results and the1H-NMR results described above there were strong bindinginteractions in the coal sample heated at 950degC similar tothat in the coal sample heated at 300degC (Figure 7)
-e results of the 1H-NMR experiment and lignite cokeabsorption and desorption experiments had good
consistency With the increase in the heat-treatment tem-perature the structure of the lignite coke changed at around300 and 950degC which led to an enhanced binding effect ofthe lignite coke with some of the water molecules a rise inthe desorption temperature and a relative increase in theamount of moisture adsorbed
33 Physical and Chemical Structure Changes during LignitePyrolysis
331 Oxygen-Containing Functional Groups Infraredanalysis was used to detect the changes of the oxygen-containing functional groups in the lignite coke [21] -e
950degC300degC
700degC
500degC
25degC
50degC75degC
105degC
200degC
-4
-2
0
2
4
6
8
10
DTA
(uV
mg-1
)
160 20080 100 120 14040 6020 180Temperature (degC)
SL-50degCSL-75degC
SL-25degC SL-105degCSL-200degCSL-300degC
SL-500degCSL-700degCSL-950degC
(a)
950degC
300degC
4
5
6
7
DTA
(uV
mg-1
)
90 100 110 12080Temperature (degC)
SL-50degCSL-75degC
SL-25degC SL-105degCSL-200degCSL-300degC
SL-500degCSL-700degCSL-950degC
(b)
Figure 4 Desorption differential thermal analysis (DTA) curves of lignite and coke after adsorption
SL-50degCSL-200degCSL-700degC
SL-75degCSL-300degCSL-950degC
700degC
degdeg
300degC
105degC
25degC
50degC 75degC080
085
090
095
100
TG (
)
SL-25degCSL-105degCSL-500degC
40 60 80 100 120 140 160 180 20020Temperature (degC)
Figure 3 -ermogravimetry (TG) curves of H2O desorption of the thermally treated lignite samples after H2O adsorption
Journal of Chemistry 5
calculation of the content of oxygen-containing functionalgroups is shown in Supplementary Materials S1
-e oxygen-containing functional group content in thelignite increased first and then decreased (Figure 8) and thechange of the water molecule adsorption quantity (Fig-ures 1 and 2) was in good agreement In particular theether bonds at 300 and 950degC were abnormal In the py-rolysis process the content of ether bonds generallyshowed a downward trend but at 300 and 950degC thedownward trend slowed and even changed to an upwardtrend (Figure 8(c) A300 B950) which was consistent withprevious experimental results [22] -e moisture adsorp-tion capacity of the 300 and 950degC lignite coke (Figure 1A300 B950 Figure 2 A300 B950) was consistent with the
changes of the ether bond content -is indicated that theincrease in the ether bond contents in the coal samples at300 and 950degC was an important reason for the increase ofthe adsorbed moisture in the coal coke
Meanwhile the 1H-NMR data showed that a smallamount of moisture with strong adsorption was present inthe lignite coke at 300 and 950degC (Figure 7) and there wasalso a small amount of moisture present during the processof water desorption whose removal temperature was higherthan that of the other water (Figures 3 5 and 6) Based onthe above analysis the generation of ether bonds in thelignite coke at 300 and 950degC enhanced the binding of thelignite coke surface to some of the moisture
332 Pore Size Distribution -e pore distributions of coalsamples were determined by 1H-NMR and the pore sizedistribution is shown in Figure 9 and Table 3
-e microstructural evolution of the heat-treated lignitewas further investigated using SEM (Figure 10) -e lignitecoke below the heat-treatment temperature of 200degCexhibited no chemical differences from the raw coal Withthe removal of water in the pores more pores were exposedresulting in a significant increase in the pore content Whenthe heat-treatment temperature was higher than 200degC theheat-treatment process caused significant weight loss andgas escape [18] In particular condensation polymerizationoccurred at about 300degC resulting in ether bonds and porecontraction (Figure 10) Under 500degC heat treatment thenumber of lignite coke pores increased (Table 3 and Fig-ures 9 and 10) At this point the bridge bond fracturereached its maximum value -e porosity of lignite coketreated at 700degC continued to increase (Table 3 and Figures 9and 10) and it increased significantly which was caused bycondensation polymerization [23]When the heat-treatmenttemperature was 950degC the proportion of pores below 10 nmwas significantly reduced and the pore size distribution
a
b
c0
200
400
600
800
1000
1200
1400
1600
1800
T 2am
plitu
de (P
U)
1 1001T2 (ms)
SL-50degCSL-75degC
SL-25degC SL-105degCSL-200degCSL-300degC
SL-500degCSL-700degCSL-950degC
Figure 6 Coke adsorption capacities for H2O during differentpyrolysis stages
75degC
50degC
25degC
300degC950degC
500degC700degC
105degC
200degC
-0005
-0004
-0003
-0002
-0001
0000
DTG
(m
in)
8040 60 100 120 140 160 18020 200Temperature (degC)
SL-25degCSL-50degCSL-75degC
SL-105degCSL-200degCSL-300degC
SL-500degCSL-700degCSL-950degC
(a)
950degC
300degC
-0001
0000
DTG
(m
in)
100 12080Temperature (degC)
SL-25degCSL-50degCSL-75degC
SL-105degCSL-200degCSL-300degC
SL-500degCSL-700degCSL-950degC
(b)
Figure 5 Desorption derivative thermogravimetry (DTG) curves of lignite and coke after adsorption
6 Journal of Chemistry
moved toward the direction of large pores which also in-dicated that condensation polymerization and pore collapseoccurred at this stage
Based on the above changes of the amount of watermolecule adsorption and the water binding state in thelignite coke as well as the physical and chemical changesthat occurred in the lignite coke heat-treatment process itwas inferred that the abnormal changes of the watermolecule adsorption on the lignite coke heated at 300 and950degC were caused by the formation of ether bonds andpore changes
34 H2O Adsorption Mechanism of Lignite and CokeAccording to above analysis and previous research [18] thewater molecule adsorption mechanisms of lignite and cokewere determined and they are shown in Figure 11
When the heat-treatment temperature was below 105degCwith the increase in temperature moisture escaped andoxygen-containing functional groups were exposed in thelignite -e number of active sites or oxygen-containingfunctional groups was the highest [18] -e moisture wasabsorbed on the active sites which led to increased watermolecule absorption in lignite in this temperature rangeHowever most of the absorbed water molecules were singlelayered -is was associated with a strong absorption force
1000
1500
2000
2500
3000
3500
Abso
rptio
n pe
ak ar
ea
200 400 600 800 10000Temperature (degC)
mdashOH
(a)
200 400 600 800 10000Temperature (degC)
0
20
40
60
80
100
120
Abso
rptio
n pe
ak ar
ea
C=O
(b)
A300
B950
200 400 600 800 10000Temperature (degC)
56
63
70
77
84
91
Abso
rptio
n pe
ak ar
ea
mdashOmdash
(c)
Figure 8 Absorption peak areas of (a) -OH (b) CO and (c) -O- groups of thermally treated lignite
25degC
200degC950degC
50degC
75degC
105degC300degC
500degC
10 100 1000 10000 1000001Radius (nm)
00051015202530354045
Pore
size
dist
ribut
ion
()
001 01 1 10 100 1000Relaxation time (ms)
SL-25SL-50SL-75
SL-105SL-200SL-300
SL-500SL-700SL-950
Figure 9 Pore size distribution of heat treatments of the coalsamples at different temperatures from 1H-NMR
T 2Am
plitu
de (a
u)
25degC
700degC300degC950degC
B950
0
20
40
60
80
100
120
140
160
180
200
01 1 10 100 1000001T2 (ms)
SL-25degCSL-300degC
SL-700degCSL-950degC
(a)
T 2Am
plitu
de (a
u)
25degC
300degC950degC
700degCB950
0
50
100
150
200
01 1 10 100 1000001T2 (ms)
SL-25degCSL-300degC
SL-700degCSL-950degC
(b)
Figure 7 (a) T2 distribution of thermally treated lignite saturated water (b) T2 distribution of H2O on adsorbed water sample
Journal of Chemistry 7
-e relaxation time (T2) decreased and the preminus105degC heattreatment of the coal sample moisture relaxation time de-creased (Figure 6) When the heat-treatment temperaturewas 105ndash500degC the content of oxygen functional groups-OH and CO continued to decrease and the adsorbed
moisture decreased with the increase in temperatureHowever the bonding interactions of water molecules wererelatively strong with relaxation time decreasing (Figure 6)-e increase in the ether bonds in the coal samples at 300degCslowed the decreasing trend of water molecule absorption
(a) (b)
(c) (d)
(e)
Figure 10 Scanning electron microscopy (SEM) images of lignite coke pyrolyzed at different temperatures (a) 200degC (b) 300degC (c) 500degC(d) 700degC and (e) 950degC
Table 3 Different size pore ratios of lignite at different heat treatment temperatures (1H-NMR)
Temperature (degC)Pore ratios ()
lt10 nm 10ndash100 nm 100ndash1000 nm gt1000 nm25 251 4674 4727 34850 000 5496 4138 36675 208 4075 4396 1321105 000 2284 4741 2975200 152 3100 1143 5605300 917 2479 3294 3310500 655 2981 2503 3861700 333 1606 3153 4909950 000 833 4036 5131
8 Journal of Chemistry
(Figures 1 and 2) -e oxygen-containing functional groups(OH and -O-) of the coal samples heated at 500 and 700degCcontinued to decrease and CO disappeared (Figure 8) As aresult an insufficient number of water molecules wereadsorbed to form the first layer water Significant multilayerwater appears in 500degC coal samples (Figure 6) -e amountof water absorption in the 500degC and 700degC coal samples wasrelatively small for all the coal samples as the content ofoxygen functional groups in those two samples was small(Figures 1 and 2) However the T2 of the lignite coke heatedat 500degC was the shortest and the adsorption force was thestrongest (Figure 6) -e coal sample heated at 950degCcontained a certain number of ether bonds and the watermolecule absorption increased significantly (Figures 1 and2) However the maximum adsorption force was theweakest (Figure 6) because the functional groups were al-most gone (Figure 8)
-rough comprehensive consideration of the porechanges [18] it was found that the cracks were larger(Figures 7(a) and 9) and the multilayer water was not easy toretain -e moisture state of the coal sample heated at 700degCchanged and the amount of multilayer adsorption increased(Figure 7(b)) -ere should be a critical point between 500and 700degC at which the moisture adsorption changes from asingle layer to multiple layers (Figure 6) Although there waslittle -OH in 950degC coal samples the -O- content increased(Figure 8) Meanwhile large-aperture crannies disappeared(Figures 7(a) and 9) and the apertures (20ndash1000 nm) wereuniformly distributed (Figures 7(a) and 9) As the numbersof -OH and -O- groups were relatively small (1000 and 63respectively) there was less single-layer water and most ofthe adsorbed water was multilayer At the same time owingto the well-distributed apertures compared to those of thecoal sample treated at 700degC the multilayer water could beretained As a result the number of adsorbed water mole-cules of the coal sample heated at 950degC surpassed those ofthe samples heated at 700 and 500degC (Figures 1 and 2) -euniform distribution of pore diameters allowed the
multilayer water to be retained which was the body of theabsorbed water (Figure 7(a))
4 Conclusion
In summary in this study a new 1H-NMR method forstudying the water molecule adsorption of lignite and cokewas proposed -is method was used to explore the waterabsorption and desorption processes of lignite pyrolysis atdifferent temperatures (25ndash950degC) and the special contri-butions of ether bonds to the water adsorption -e ad-sorption was demonstrated to be dependent on the presenceof ldquoether bondsrdquo in the lignite pyrolysis process which couldsignificantly improve the adsorption effect of water -eincrease in the ether bond content (at 300 and 950degC)resulted in a significant increase in the water adsorptioncapacity and a significant decrease in the desorption ca-pacity -e reason for this phenomenon was the strongadsorption capacities of the ether bonds -e ether bondscould cause water molecules to form stable adsorption layersin a monolayer water state In the pyrolyzed coal samples at950degC the adsorption capacities of the ether bonds remainedhigh after the monolayer of water was saturated and thewater molecules underwent multilayer adsorption -isstudy offers a new approach for investigating the watermolecule adsorption and the adsorption mechanism oflignite and coke
Data Availability
-e data used to support the findings of this study areavailable from the corresponding author upon request
Conflicts of Interest
-e authors declare that they have no direct financial re-lationship with the commercial entities mentioned in thisstudy that might lead to conflicts of interest
105degC 200degC 300degC 500degC 950degC
-OHC=O-O-
H2Othe surface of lignite
(a)
34003200300028002600240022002000180016001400
0 100 200 300 400 500 600 700 800 900 1000Temperature (degC)
32053158
3156
2523
22792130
1571 1545
2377
I
II
III
IV V
VI
T 2i A
mpl
itude
(pu
)
T2i Amplitude (pu)
(b)
Figure 11 Change of H2O adsorption due to lignite pyrolysis (a) water molecule adsorption model on lignite surface and (b) adsorptionmodel of water molecules in pores of lignite
Journal of Chemistry 9
Acknowledgments
-is work was supported by grants from the NationalNatural Science Foundation of China (21766023) Scienceand Technology Program of Inner Mongolia (grant number2019GG268) Research Project of Inner Mongolia Universityof Technology (grant number ZZ201906) Science andTechnology Plan Project with Applied Technology ResearchandDevelopment of Ordos (grant number 2019501) Scienceand Technology Development Fund of Central Guide Placein 2020 (grant number 2020ZY00322) and Scientific Re-search Project for Higher Education Institution of InnerMongolia (grant number NJZY21150)
Supplementary Materials
As shown in Supplementary Materials S1 the FTIR spectraof the lignite samples treated under different temperaturesexhibited the same shapes but showed different intensities ofthe absorption peaks-e peak at 1700 cmminus1 is the stretchingvibration peak of aromatic CO and the peak at 1600 cmminus1
is the stretching vibration peak of aromatic CC-e peak at1110 cmminus1 is the stretching vibration peak of -O- -e in-tegral area was acquired by integrating the fitted FTIRspectra in the ranges of 3000ndash3700 cmminus1 (-OH)1550ndash1800 cmminus1 (CO) and 1100ndash1200 cmminus1 (-O-) (Sup-plementary Materials)
References
[1] Z Miao Y Wan Q He Z Pei and X Zhu ldquoPyrolysis be-haviors and product distribution of shengli lignite at differentheating rate and final temperature by TG-FTIR and Py-GC-MSrdquo Energy Sources Part A Recovery Utilization and Envi-ronmental Effects vol 43 no 10 pp 1ndash13 2019
[2] Y Zhang X Zhang Q Zhong S Hu and J P MathewsldquoStructural differences of spontaneous combustion proneinertinite-rich Chinese lignite coals insights fromXRD solid-state 13C NMR LDIMS and HRTEMrdquo Energy amp Fuelsvol 33 no 5 pp 4575ndash4584 2019
[3] S Tao S Chen D Tang X Zhao H Xu and S Li ldquoMaterialcomposition pore structure and adsorption capacity of low-rank coals around the first coalification jump a case of easternJunggar basin Chinardquo Fuel vol 211 no 1 pp 804ndash815 2018
[4] S Tao X Zhao D Tang C Deng Q Meng and Y Cui ldquoAmodel for characterizing the continuous distribution of gasstoring space in low-rank coalsrdquo Fuel vol 233 no 9pp 552ndash557 2018
[5] X Men S Tao Z Liu W Tian and S Chen ldquoExperimentalstudy on gas mass transfer process in a heterogeneous coalreservoirrdquo Fuel Processing Technology vol 216 no 1 pp 1ndash92021
[6] Z Huang Y Tian Y Gao Z Shao Y Zhang and X LiuldquoStudy on the oxidation kinetics and microreactivity of water-immersed coalrdquo ACS Omega vol 5 no 28 pp 17287ndash173032020
[7] J B Murray and D G Evans ldquo-e brown-coalwater systempart 3 thermal dewatering of brown coalrdquo Fuel vol 51 no 4pp 290ndash296 1972
[8] J A Gutierrez-Rodriguez R J Purcell Jr and F F AplanldquoEstimating the hydrophobicity of coalrdquo Colloids and Sur-faces vol 12 no 5 pp 1ndash25 1984
[9] J Liu X Jiang Y Cao et al ldquoExploring the effect of oxygen-containing functional groups on the water-holding capacity ofligniterdquo Journal of Molecular Modeling vol 24 no 6 p 1302018
[10] H-S Kim Y Nishiyama K Ideta et al ldquoAnalysis of water inloy yang brown coal using solid-state 1H NMRrdquo Journal ofIndustrial and Engineering Chemistry vol 19 no 5pp 1673ndash1679 2013
[11] J Liao Q Mo C Li Y Han L Chang and W BaoldquoClassification of water forms in lignite and analysis of energyconsumption on the drying processes by microwave and fixedbedrdquo Fuel vol 253 pp 580ndash587 2019
[12] W Yu J Yang X Wu et al ldquoStudy on dewaterability limitand energy consumption in sewage sludge electro-dewateringby in-situ linear sweep voltammetry analysisrdquo ChemicalEngineering Journal vol 317 no 8 pp 980ndash987 2017
[13] F Wei J Liao L Chang Y Han and W Bao ldquoTransfor-mation of functional groups during lignite heat-treatment andits effects on moisture re-adsorption propertiesrdquo Fuel Pro-cessing Technology vol 192 no 2 pp 210ndash219 2019
[14] L Hu G Wang and Q Wang ldquoEfficient drying and oxygen-containing functional groups characteristics of lignite duringmicrowave irradiation processrdquo Drying Technology an In-ternational Journal vol 36 no 10 pp 1086ndash1097 2018
[15] K Miura K Mae W Li T Kusakawa F Morozumi andA Kumano ldquoEstimation of hydrogen bond distribution incoal through the analysis of OH stretching bands in diffusereflectance infrared spectrum measured by in-situ techni-queflectance infrared spectrum measured by in-situ tech-niquerdquo Energy amp Fuels vol 15 no 3 pp 599ndash610 2001
[16] S K Rish A Tahmasebi and J Yu ldquoA DSC study on theimpact of low-temperature oxidation on the behavior anddrying of water in ligniterdquo Journal of gtermal Analysis andCalorimetry vol 139 no 6 pp 3507ndash3517 2019
[17] B Lv Z Luo B Zhang and C Chen ldquoDrying and moisturereadsorption characteristics of ligniterdquo International Journalof Coal Preparation and Utilization vol 40 no 10 pp 712ndash729 2020
[18] Y Teng S Lian Q Liu et al ldquoEvolvement behavior of mi-crostructure and H2O adsorption of lignite pyrolysisrdquo ChineseJournal of Chemical Engineering vol 24 no 6 pp 803ndash8102016
[19] W Liu and X Li Nuclear Magnetic Resonance Logging Pe-troleum Industry Press Beijing China 2011
[20] L M Duarte P R Filgueiras S R C Silva et al ldquoDeter-mination of some physicochemical properties in Braziliancrude oil by 1HNMR spectroscopy associated to chemometricapproachrdquo Fuel vol 181 no 10 pp 660ndash669 2016
[21] A Tahmasebi J Yu Y Han F Yin S Bhattacharya andD Stokie ldquoStudy of chemical structure changes of Chineselignite upon drying in superheated steam microwave and hotairrdquo Energy amp Fuels vol 26 no 6 pp 3651ndash3660 2012
[22] H Qiu Influence of Oxygen-Containing Functional GroupContent onMoisture Regain and Pyrolysis Reactivity of LigniteTaiyuan University of Technology Taiyuan China 2013
[23] J Gao Coal Pyrolysis Coking and Coal Tar ProcessingChemical Industry Press Beijing China 2010
10 Journal of Chemistry
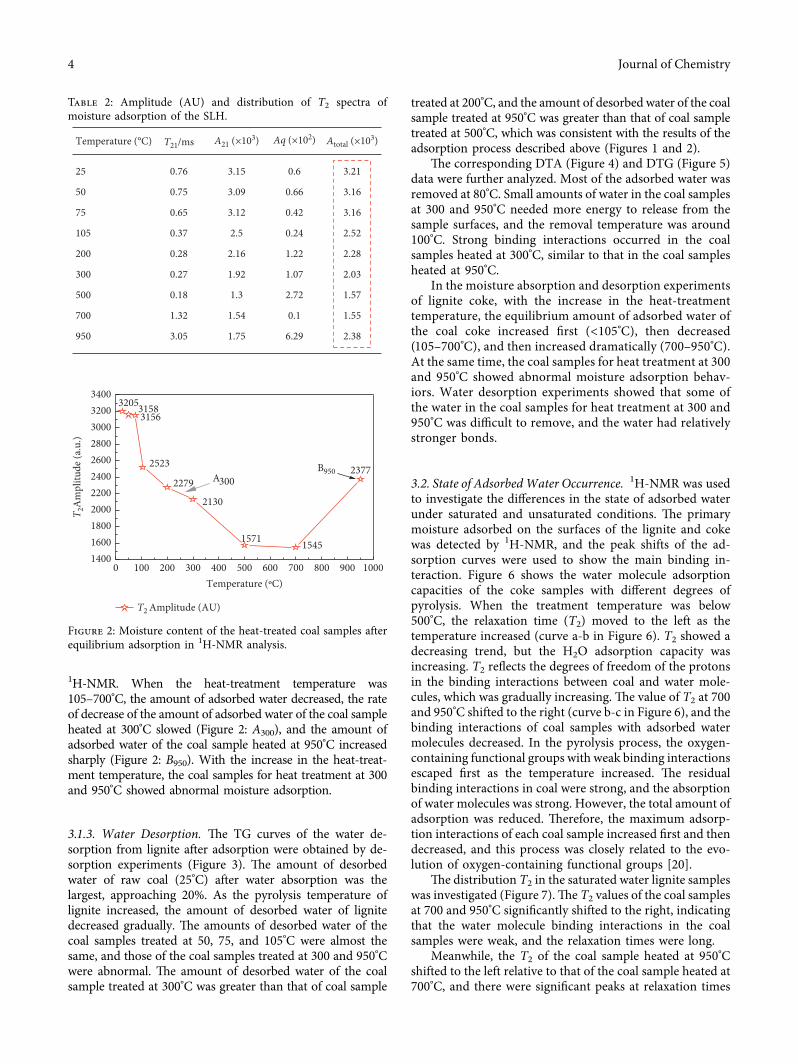
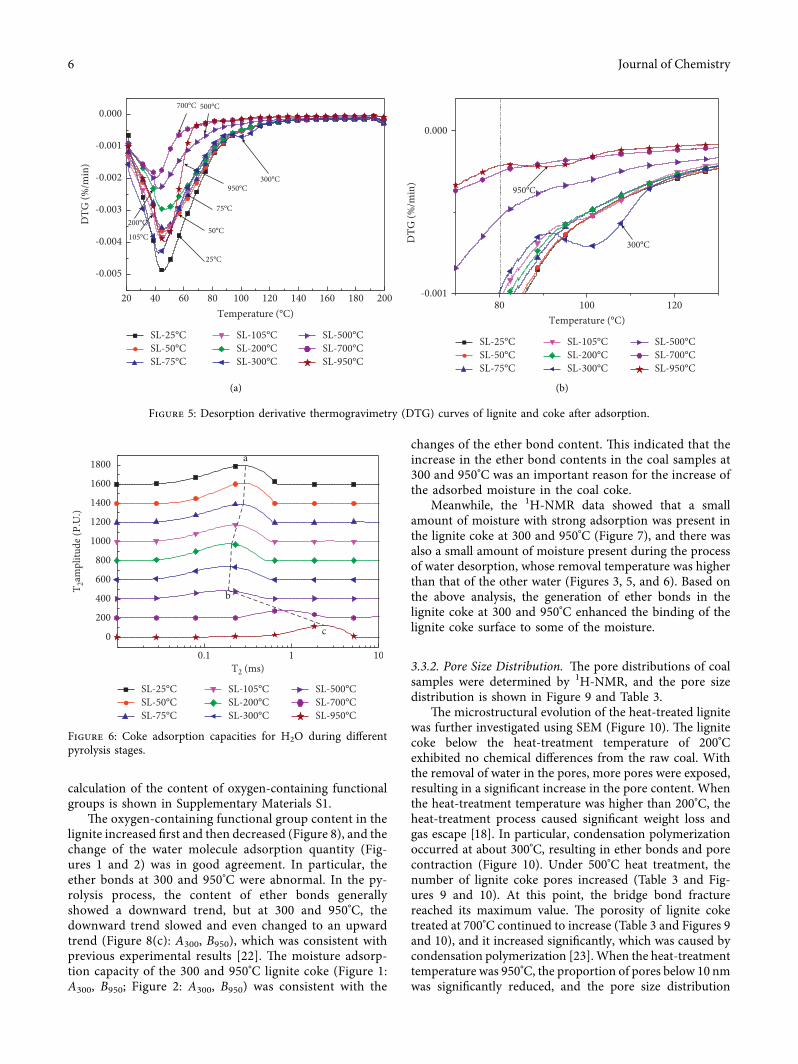
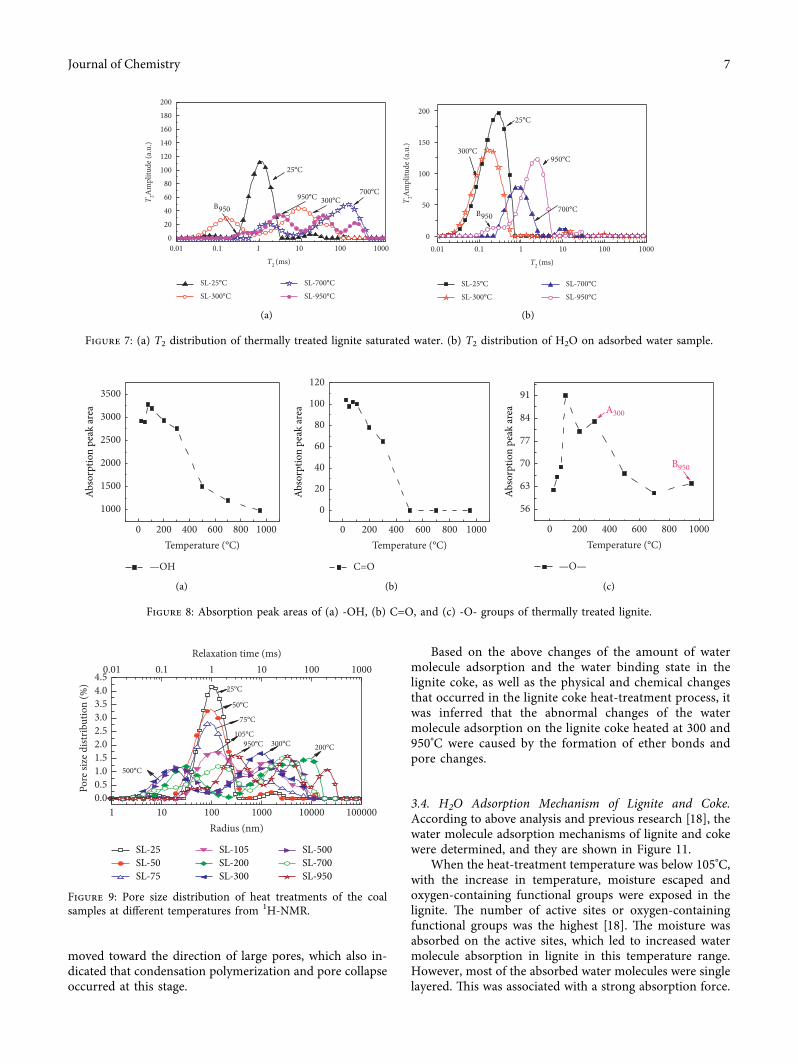
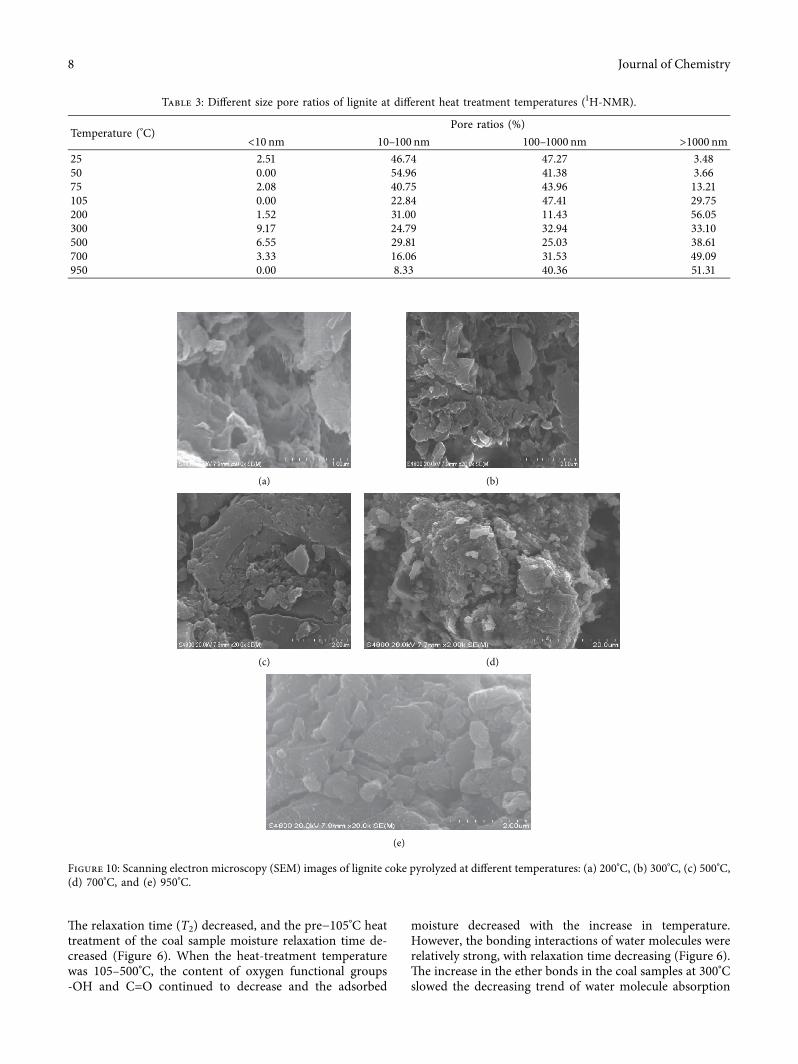
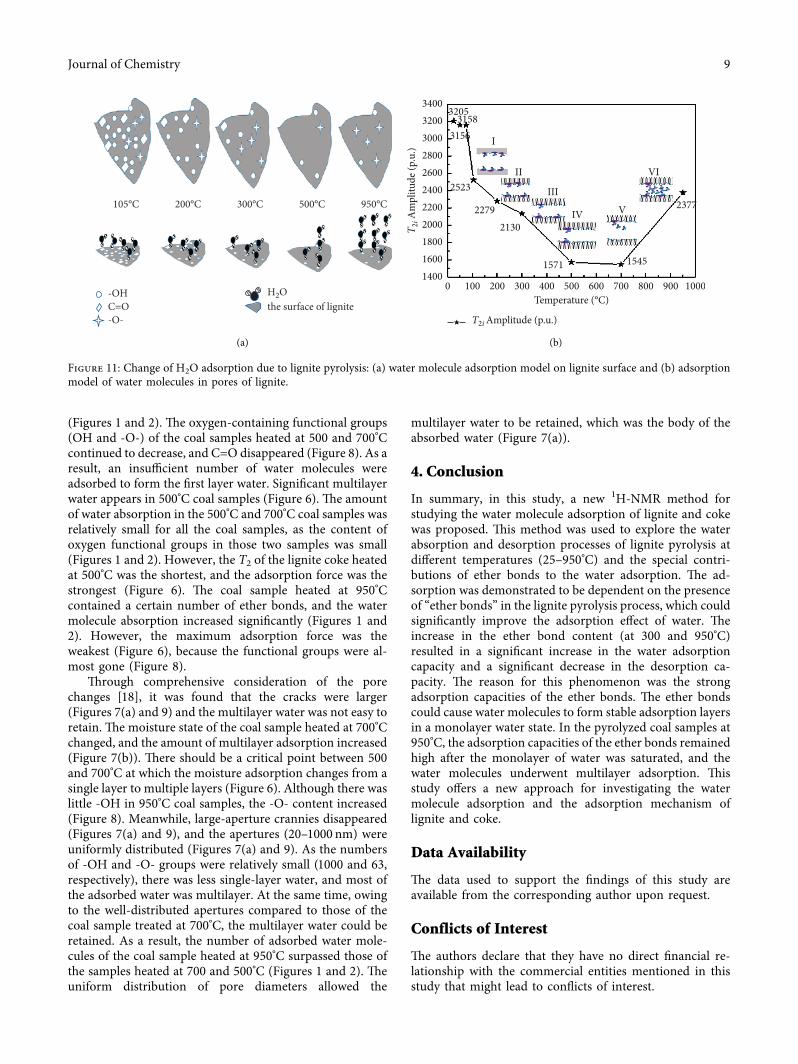


![EFFECTOF FORWARDMOTIONON ENGINE · _ EFFECTOF FORWARDMOTIONON ENGINE_NOISE - - JA'C_-IJ495g) EFFECT 9F FOPWARD _OTION N78-I009] ON FNGTNE NOISE (Douqlas _ircraft Co., Inc.) I18 p](https://img.pdfslide.net/doc/110x75/5eb50cc706367d39834df45e/effectof-forwardmotionon-engine-effectof-forwardmotionon-enginenoise-jac-ij495g.jpg)