Embed Size (px)
Citation preview

General rights Copyright and moral rights for the publications made accessible in the public portal are retained by the authors and/or other copyright owners and it is a condition of accessing publications that users recognise and abide by the legal requirements associated with these rights.
Users may download and print one copy of any publication from the public portal for the purpose of private study or research.
You may not further distribute the material or use it for any profit-making activity or commercial gain
You may freely distribute the URL identifying the publication in the public portal If you believe that this document breaches copyright please contact us providing details, and we will remove access to the work immediately and investigate your claim.
Downloaded from orbit.dtu.dk on: Nov 19, 2021
Effects of abrupt salinity increase on nitrification processes in freshwater moving bedbiofilters
Kinyage, John Peter Hewa; Pedersen, Per Bovbjerg; Pedersen, Lars-Flemming
Published in:Aquacultural Engineering
Link to article, DOI:10.1016/j.aquaeng.2018.12.005
Publication date:2019
Document VersionPeer reviewed version
Link back to DTU Orbit
Citation (APA):Kinyage, J. P. H., Pedersen, P. B., & Pedersen, L-F. (2019). Effects of abrupt salinity increase on nitrificationprocesses in freshwater moving bed biofilters. Aquacultural Engineering, 84, 91-98.https://doi.org/10.1016/j.aquaeng.2018.12.005

Accepted Manuscript
Title: Effects of abrupt salinity increase on nitrificationprocesses in a freshwater moving bed biofilter
Authors: John Peter Hewa Kinyage, Per Bovbjerg Pedersen,Lars-Flemming Pedersen
PII: S0144-8609(18)30094-3DOI: https://doi.org/10.1016/j.aquaeng.2018.12.005Reference: AQUE 1974
To appear in: Aquacultural Engineering
Received date: 7 July 2018Revised date: 13 December 2018Accepted date: 15 December 2018
Please cite this article as: Kinyage JPH, Bovbjerg Pedersen P, PedersenL-Flemming, Effects of abrupt salinity increase on nitrification processesin a freshwater moving bed biofilter, Aquacultural Engineering (2018),https://doi.org/10.1016/j.aquaeng.2018.12.005
This is a PDF file of an unedited manuscript that has been accepted for publication.As a service to our customers we are providing this early version of the manuscript.The manuscript will undergo copyediting, typesetting, and review of the resulting proofbefore it is published in its final form. Please note that during the production processerrors may be discovered which could affect the content, and all legal disclaimers thatapply to the journal pertain.

Effects of abrupt salinity increase on nitrification processes in a
freshwater moving bed biofilter
John Peter Hewa Kinyage ab*, Per Bovbjerg Pedersen b and Lars-Flemming Pedersen b
a Sokoine University of Agriculture, Department of Animal, Aquaculture and Range Sciences,
Section of Aquaculture, Morogoro, Tanzania
b Technical University of Denmark, National Institute of Aquatic Resources, DTU Aqua, Section of
Aquaculture, Hirtshals, Denmark
*Corresponding Author: Email Address; [email protected]
ABSTRACT The nitrification process is a widely used biological approach responsible for ammonia and nitrite
removal in recirculating aquaculture system (RAS) biofilters. Given this pivotal role, the influence
of different water quality parameter on nitrification efficiency is important information for RAS
operations. One influencing parameter is salinity, and salinity fluctuations in freshwater RAS
biofilters are reported to affect the nitrifying bacteria. This study investigated the effects of
abrupt increase in salinity in freshwater RAS on substrate-dependent (1’-order) as well as
substrate independent (0’-order) nitrification rates. A 100% inhibition was found for surface
specific removal (STR) of total ammonia nitrogen (TAN) and surface specific nitrite removal (SNR)
when salinity was abruptly increased to 25‰ and above. A fast turnover (i.e. steep decline in
[NH4-N+] and [NO2-N-]) were observed at lower salinities (≤10‰), while limited/no degradation
of either ammonia or nitrite was seen at salinities above 25‰. At low substrate loading (1’-order
process), removal rate constants (k1a) of 0.22 and 0.23 m·d-1 were observed for ammonia and
nitrite degradation, respectively, declining to 0.01 m·d-1when adding marine RAS water
increasing the salinity to 15‰. Similar observations followed at high nutrient loadings (0’-order
process) with STR and SNR of 0.10 and 0.12 g N·m-2·d-1, respectively, declining to 0.01 g N·m-2·d-
1 at 15‰. When salinities of 25‰ and 35‰ were applied, neither TAN nor nitrite degradation
was seen. The results thus demonstrate a pronounced effect of salinity changes when freshwater
RAS biofilters are subjected to fast/abrupt changes in salinity. RAS facility operators should be
aware of such potential effects and take relevant precautions.
Keywords: Nitrification, Salinity, RAS, Biofilter, STR, SNR, k1a
ACCEPTED MANUSCRIP
T

1. Introduction Total ammonia nitrogen (TAN) and nitrite accumulation in recirculating aquaculture systems
(RAS) poses risk to cultured organisms, and can be avoided by proper dimensioned biofilters
and correct management (Eding et al., 2006; Rusten et al., 2006; Timmons and Ebeling, 2010;
Terjesen et al., 2013). Nitrification, the oxidation of ammonia via nitrite to nitrate, is a
common microbially mediated process in RAS biofilters that additionally remove dissolved
organic matter (Hagopian and Riley, 1998; Suhr et al., 2013; Daims et al., 2015). Various
biofilter materials and different types of biofilters are applied in RAS (Eding et al., 2006;
Malone and Pfeiffer, 2006; Ødegaard, 2006; Summerfelt, 2006; Pfeiffer and Wills, 2011) in
order to ensure optimal performance and TAN removal. Being microbial ecosystems,
biological filters are vulnerable to environmental changes, which often occur in commercial
aquaculture systems. Various species are successfully reared in RAS, and recently, grow out
of e.g. salmon (Salmo salar) and king fish (Seriola lalandi) in land-based marine RAS have
started in Denmark (Dalsgaard, 2017). Sea bream (Sparus aurata) and sea bass (Dicentrarchus
labrax) are examples of RAS candidates reared in the Mediterranean region (Hochheimer
and Wheaton, 1997; Eshchar et al., 2006; Bregnballe, 2015). Emergence of these new
candidate species and production plans including brackish and marine environment require
knowledge of how the nitrification process is affected by salinity and changes therein.
Although the recent development of land-based RAS (Martins et al., 2010; Dalsgaard et al.,
2013) calls for more knowledge of potential implications caused by salinity, relatively limited
information is available on the effect of salinity and salinity changes on nitrification kinetics
(Chen et al., 2006). Deliberate salinity increases up to 10-15 ‰ during land-based Atlantic
salmon smolts production or periodically fluctuations in salinity due to salt addition to treat
for parasites (Aihua and Buchmann, 2001) may potentially compromise RAS operation since
impaired biofilter performance may lead to deteriorated water quality (Colt, 2006; Lyssenko
and Wheaton, 2006; Wolters et al., 2009; Yogev et al., 2017).
Salinity thus plays a central role in RAS design and dimensioning taking also other production-
related factors into consideration (Wolters et al., 2009; Diaz et al., 2012; Terjesen et al., 2013).
Previous studies have reported salinity effects on reaction rates for both ammonia oxidizing
bacteria (AOB) and nitrite-oxidizing bacteria (NOB) after addition of salt (NaCl) above 5 ‰
(Sánchez et al., 2004; Timmons and Ebeling, 2010). Another study reported severe effects of
salinity on NOB and nitrite oxidation removal rate and on ammonia removal to a minor
degree (Aslan and Simsek, 2012). At very low salinity, NaCl ≤ 3.7 ‰, only minor effects were
reported whereas complete inhibition was observed at a salinity of NaCl ≥ 24 ‰ (Cortés-
Lorenzo et al., 2015). Salinity changes and increases affect bacterial community and
composition in RAS biofilter, and Gonzalez-Silva et al. (2016) reported ceased activity of
nitrifying bacteria following a shock treatment of a NaCl-salinity > 22 ‰.
ACCEPTED MANUSCRIP
T
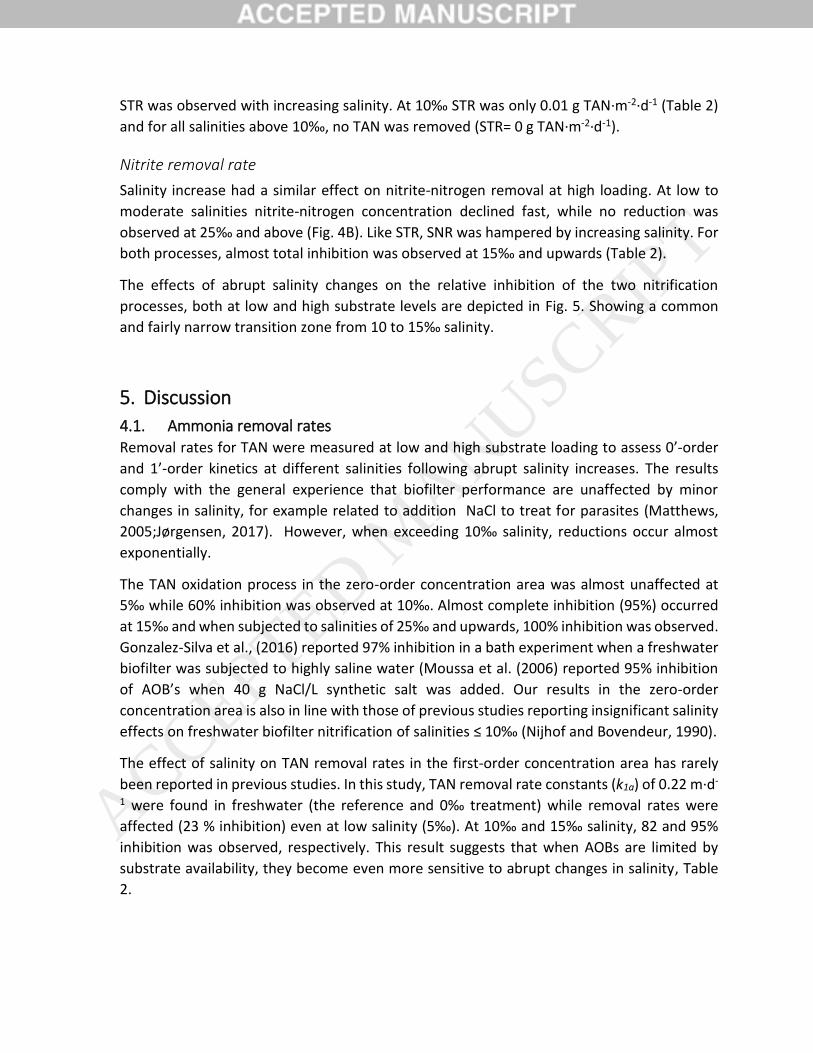
Previous studies have often applied synthetic salts and/or applied biofilter elements from
systems without fish and have mainly investigated TAN removal (Lyssenko and Wheaton,
2006). These results can be indicative of salinity effects, but are not easily extrapolated from
lab scale to commercial RAS biofilter systems (Lopato et al., 2013; Kamstra et al., 2017).
The aim of this study was to investigate the effects of abrupt salinity increase on both steps
of the nitrification process in substrate limited (1’-order) and substrate u unlimited (0’ -order)
concentrations. All experiments were carried out using moving bed biofilter-elements
obtained from a stable long term operating RAS in steady state. These elements were tested
controlled conditions (constant temperature, alkalinity, filling rate, elevation speed and
exposure time) and spiked with either TAN or nitrite at relevant dosages. The water used was
mixed from two operating RASs, a freshwater RAS and a brackish RAS with diluted seawater
(25 ‰) both holding rainbow trout (Oncorhynchus mykiss) with a feed loading to mimic
commercial model trout farms (Jokumsen and Svendsen, 2010).
5. Materials and Methods
4.1. RAS and biofilter media Moving bed biofilter media (RK BioElements® Neutral, RK Plast, Denmark, specific surface
area = 750 m2·m-3) were taken from an experimental freshwater RAS facility operated for
several month in steady-state at 12-14°C at DTU Aqua, Hirtshals, Denmark.
The 8.5 m3 experimental RAS was composed of a rearing tank stocked with 130 kg rainbow
trout (Oncorhynchus mykiss) fed 1000 gram feed per day and operated at a feed loading of 1
kg feed/m-3 make-up water. The RAS had two 0.40 m3 fixed bed and two 0.40 m3 moving bed
biofilters each filled with 200 l RK BioElements (Pedersen et al., 2015). Elements from the
moving bed biofilters were used for this study and freshwater was taken from this RAS as well
(Table 1). Saline water was collected from a RAS operated at 25‰ at DTU Aqua, Hirtshals,
Denmark. The system consisted of six individual 1000-L tanks with rainbow trout (20-25
kg/tank) each fed 250-300 g/day. The 25 ‰ saltwater RAS facility was operated at steady
state at 16°C, pH 7.5 - 8.0, and a feed loading of approximately 1 kg feed m-3.
4.2. Experimental setup and system water mixing A series of independent moving bed biofilter reactors operated as batch reactors were used
ensuring precise control of biofilter hydraulic conditions in each reactor (Colt, 2006). Each
6.4-L reactor was connected to a 8-W aquarium pump (Silence 1073.008, Tunze, Germany)
with a 20-mm hose pipe from the reactor’s top outlet to the suction part of the pump. From
there, water was returned into the bottom of the reactor through a flowmeter (SK-61, Georg
Fischer, Germany). The reactor set-up also included a common air pump (RESUN®LP40,
China), delivering air to each reactor controlled by a flowmeter set at 0.5 L/minute to ensure
consistent movement and aeration of the biomedia (Fig. 1).
ACCEPTED MANUSCRIP
T

To obtain a given salinity for the trials, water was mixed from the two RAS. The salinity levels
tested were: 0, 5, 10, 15, 25 and 35‰. The inclusion of brackish system water from the marine
RAS facility for each predefined salinity level was calculated as follows:
𝑆𝑤 = 𝑅‰
𝑆𝑤‰
x 100% (1)
Where, Sw is the amount of brackish RAS water in L, R‰ is the predefined required salinity
level in ppt and Sw‰ is the salinity of water from the marine RAS facility (in this case 25‰).
The percentage inclusion needed from the freshwater RAS facility was obtained by
subtracting the saltwater % in equation (1) from 100 % (Table 1). For 35‰, pure seawater
was used.
4.3. Experimental protocol
Six 6.4-L reactors were installed in a cooling room set at 12 ºC. Each experimental run
included a standardized procedure, where 5 L of RAS water was added to each reactor.
Hereafter, a volume of 2.4 L active bioelements were gently transferred from one of the
operating moving bed biofilters to each of the six reactors. A 50-mL syringe was used to inject
additional water into the hose connecting the reactor to the pump. Water and air pump were
then turned on to initiate water circulation inside the reactor. Water and airflow were set to
60 L/hour and 0.5 L/minute, respectively. The reactors were operated and acclimated for 1
hour before the first spiking to ensure that any residual TAN and nitrite in the transferred RAS
water were degraded.
Four sets of spiking experiments was performed: low concentration (1 mg ·L-1) TAN or nitrite
spikes and high concentration (5 mg ·L-1) TAN or nitrite spikes. Low concentration spikes were
used to evaluate substrate (TAN or nitrite) limited removal rates (1’-order kinetics). High
concentration spikes were used to evaluate substrate independent TAN and nitrite-N removal
rates (0’-order kinetics) (Hagopian and Riley, 1998; Pedersen et al., 2015; von Ahnen et al.,
2015). For analyses of TAN, nitrite and nitrate, a volume of 8 ml was sampled from each
reactor every 10 minutes and filtered using a 0.2µm sterile filter (Sartorius, Germany) and
stored at 2°C for later analysis. Water sampling was performed over a period of 120 minutes.
In a preliminary reference experiment, six reactors were used in two consecutive trials. For
both TAN and nitrite, triplicate spiking experiments were made (N=12) where either 5 ml or
25 ml 1000 mg ·L-1 TAN or Nitrite-N stock solutions were spiked into each reactor.
Assessment of low concentration (substrate dependent) ammonia and nitrite removal rates (1’
order kinetics)
Six reactors of six different salinities (0, 5, 10, 15, 25 and 35‰) at 12 °C (Fig. 2) were used. To
attain data set in true triplicates, randomized serial spikes (C0 equivalent to 1 mg ·L-1 TAN or
nitrite-N) were performed over six consecutive days (N=36) using newly transferred
ACCEPTED MANUSCRIP
T

bioelements for each trial. Water samples were collected every 10 minutes for 120 minutes
to assess substrate-dependent first-order removal rates.
Assessment of high concentration (substrate independent) ammonia and nitrite removal rates
(0’ order kinetics)
In direct continuation of the spiking trials at low substrate levels, five-fold stronger spikes
with TAN or nitrite-N were made to assess the substrate independent removal rates (0’
kinetics). Ninety-six ml of the specific salinity mixed RAS water was refilled into each reactor
to compensate for the samples water and obtain a fixed volume of 5 L in each reactor. After
one hour, each reactor was spiked with either 25 ml 1000 mg NH4-N·L-1 or 25 ml 1000 mg
NO2-N·L-1 respectively. As above, water samples were collected after 10, 20, 30, 40, 50, 60,
75, 90, 105, 120, 150, 180, 210, 240, 270, and 300 minutes. After finishing the sampling, all
reactors were emptied and refilled with new water and new biofilter elements for the next
experimental run.
4.4. Water chemistry analysis Samples were filtered through 0.20 μm syringe filters (Filtropur S 0.20 μm, Sarstedt,
Germany) prior to analyses of inorganic N forms including total ammonia nitrogen (TAN; (DS
224, 1975) and nitrite-N (DS 223, 1991) using a DR2800 Spectrophotometer (HACH®,
Germany). Nitrate-N was analysed in selected water samples using Ion Chromatograph
analysis (930 Compact IC Flex, Metrohm, Denmark). Water temperature, dissolved oxygen,
and pH were measured using a HQ40d multimeter (HACH®, Germany). Alkalinity was
measured as the equivalent acid titrant needed to reach pH 4.5 using Lab X auto titration T50
(Mettler Toledo, Denmark).
4.5. Calculations Substrate removal rates following spiking were calculated separately for concentration
ranges where degradation was limited by substrate concentration (first order), as well as for
higher concentration ranges where substrate was not limiting the degradation process (zero
order) (Henze et al., 2002).
First order nitrification kinetics
Data points (all below 1.3 mg/l) from the spiking with 5ml of 1000 mg TAN/L or 1000 mg NO2-
N/L solution were used to assess the substrate-dependent removal rates for ammonia and
nitrite, respectively. First-order degradation kinetics were described using least square linear
regression on ln-transformed substrate concentrations versus time as applied in Prehn et
al.,(2012). Regressions were fitted in the form y = ax + b where y is the ln-transformed
substrate concentration in the bulk water, x is the time after spiking, and a (slope) and b are
constants. The first-order rate constant k1a (m· d-1) was calculated from the slope of the
regression line of the ln-transformed data multiplied by the total water volume of the reactor
ACCEPTED MANUSCRIP
T

and divided by the total surface area of the biofilter media, (von Ahnen et al., 2015). Rate
constants are expressed as averages of the replicated spiking trials.
Zero order nitrification kinetics
The surface specific TAN removal (STR; g N·m-2·d-1) and the surface specific nitrite removal
(SNR; g N·m-2·d-1) were calculated according to Kinyage and Pedersen (2016) as described in
equation 2 and 3 below;
STR = 𝑆𝑇𝐴𝑁 𝑥 𝑉𝑤 𝑥 60 min ℎ−1 𝑥 24 ℎ 𝑑−1
𝐴𝑚 𝑥 1000 𝑚𝑔 𝑔−1 (2)
Where STAN is the volumetric TAN degradation rate in mg N·m-3·min-1; Vw is volume of water
in the reactor in m3; and Am is the total surface area of the biomedia in m2. Similarly, the
surface specific nitrite-nitrogen removal (SNR; g N·m-2·d-1 was calculated as:
SNR = 𝑆𝑁 𝑥 𝑉𝑤 𝑥 60 min ℎ−1 𝑥 24 ℎ 𝑑−1
𝐴𝑚 𝑥 1000 𝑚𝑔 𝑔−1 (3)
Where SN is the nitrite-nitrogen degradation rate in mg N·m3·min); Vw is volume of water in
the reactor in m3; Am is the total surface area of the bioelements in m2.
For both TAN and nitrite-N, only data values above 1.0 mg N·l-1 were used to assess the linear,
substrate unlimited zero-order removal (von Ahnen et al., 2015).
The relative inhibition (%) caused by salinity increases was calculated according to formula
(4) below:
Relative Inhibition = [(NR – NS)/NR]* 100% (4)
Where NR and NS are removal at the reference reactor and reactors with the respective
salinity levels, expressed in m · d-1 for k1a and N · m-2 · d-1 for STR and SNR.
4.6. Statistics Differences between treatments with different salinity levels for TAN and nitrite-nitrogen
removal for first and zero-order nitrification kinetics were tested using one-way ANOVA
followed by Tukey’s post-hoc test. Experimental data were obtained from a Completely
Randomized Design Experiment for each salinity level in triplicate. To test for significant
differences between salinity levels, a statistical level of significance of p < 0.05 was applied
for all analysis using GraphPad Prism 5 software. The relative inhibition of abrupt salinity
increase on k1a, STR, and SNR was analysed using Sigma-Stat® software. ACCEPTED MANUSCRIP
T

5. Results
4.1. First order nitrification kinetics
Ammonia removal
The freshwater (FW)-reference degradation, measured 1 day prior to the main experiment,
showed a reduction in ammonia concentration from the initial 1 mg TAN·L-1 to 0 mg TAN · l-1
in 90 minutes. A similar reduction in ammonium concentration was observed in the reactors
operated at 0‰ and 5‰ in all experimental runs (Fig. 3A). At 10‰, TAN removal was reduced
and at 15‰ almost no TAN degradation occurred. At 25‰ and 35‰, no reduction in TAN
concentration was observed (Fig. 3A).
While the first order rate constant k1a was similar (0.22 m·d-1) for the FW-reference and 0‰,
a minor decrease was observed at 5‰ (0.17 m·d-1), and a significant decrease was observed
with further increase in salinity. At 10‰, k1a was 0.04 m·d-1 and 15‰ only 0.01 m·d-1. At
higher salinities the rate constant was 0 m·d-1 (Table 2).
Nitrite removal
Similar results were obtained for the first-order removal of nitrite-nitrogen. Fig. 3B shows a
pronounced reduction in the nitrite-nitrogen concentration over time for the FW-reference,
as well as for reactors operated at 0‰ and 5‰. At 10‰ nitrite turnover was impaired by
about half, and at 15‰ was almost totally hampered. No nitrite removal was observed at the
higher salinity levels at 25 and 35‰.
As for TAN removal, reactors operated at 0‰ and 5‰ had similar nitrite removal rate
constants (k1a) of 0.24 m·d-1 and 0.25 m·d-1, respectively, in line with the FW reference of 0.23
m·d-1. With increasing salinity, a drastic drop in k1a values was observed. At 10‰ k1a was 0.05
m·d-1 and at 15‰ 0.01 m·d-1 (Table 2). At 25‰ and 35‰ no nitrite was removed and k1a
consequently was 0.00 m·d-1.
4.2. Zero-order nitrification kinetics
Ammonia removal rates
At high substrate loading, the initial TAN concentration at the second spike varied from one
salinity level to the other as incomplete nitrification in reactors operated at higher salinities
in the previous spike lead to residual TAN. In this case, a steep decline in TAN concentration
was observed in reactors operated in freshwater or in system water mixture with low salinity
levels (up to 5‰), while no reduction in TAN concentration was observed when bioelements
from a freshwater RAS biofilter were subjected to water with a salinity of 25‰ and above
(Fig. 4A).
As a result, the surface specific TAN removal (STR) was higher at lower salinities; 0.1 and 0.09
g TAN·m-2·d-1 for the FW reference and 5‰ salinity, respectively. A significant reduction in
ACCEPTED MANUSCRIP
T
STR was observed with increasing salinity. At 10‰ STR was only 0.01 g TAN·m-2·d-1 (Table 2)
and for all salinities above 10‰, no TAN was removed (STR= 0 g TAN·m-2·d-1).
Nitrite removal rate
Salinity increase had a similar effect on nitrite-nitrogen removal at high loading. At low to
moderate salinities nitrite-nitrogen concentration declined fast, while no reduction was
observed at 25‰ and above (Fig. 4B). Like STR, SNR was hampered by increasing salinity. For
both processes, almost total inhibition was observed at 15‰ and upwards (Table 2).
The effects of abrupt salinity changes on the relative inhibition of the two nitrification
processes, both at low and high substrate levels are depicted in Fig. 5. Showing a common
and fairly narrow transition zone from 10 to 15‰ salinity.
5. Discussion
4.1. Ammonia removal rates Removal rates for TAN were measured at low and high substrate loading to assess 0’-order
and 1’-order kinetics at different salinities following abrupt salinity increases. The results
comply with the general experience that biofilter performance are unaffected by minor
changes in salinity, for example related to addition NaCl to treat for parasites (Matthews,
2005;Jørgensen, 2017). However, when exceeding 10‰ salinity, reductions occur almost
exponentially.
The TAN oxidation process in the zero-order concentration area was almost unaffected at
5‰ while 60% inhibition was observed at 10‰. Almost complete inhibition (95%) occurred
at 15‰ and when subjected to salinities of 25‰ and upwards, 100% inhibition was observed.
Gonzalez-Silva et al., (2016) reported 97% inhibition in a bath experiment when a freshwater
biofilter was subjected to highly saline water (Moussa et al. (2006) reported 95% inhibition
of AOB’s when 40 g NaCl/L synthetic salt was added. Our results in the zero-order
concentration area is also in line with those of previous studies reporting insignificant salinity
effects on freshwater biofilter nitrification of salinities ≤ 10‰ (Nijhof and Bovendeur, 1990).
The effect of salinity on TAN removal rates in the first-order concentration area has rarely
been reported in previous studies. In this study, TAN removal rate constants (k1a) of 0.22 m·d-
1 were found in freshwater (the reference and 0‰ treatment) while removal rates were
affected (23 % inhibition) even at low salinity (5‰). At 10‰ and 15‰ salinity, 82 and 95%
inhibition was observed, respectively. This result suggests that when AOBs are limited by
substrate availability, they become even more sensitive to abrupt changes in salinity, Table
2.
ACCEPTED MANUSCRIP
T
4.2. Nitrite removal rates Nitrite build-up in RAS can have lethal effects on fish (Svobodova et al., 2005). The nitrification
process in a biofilter is complete only if the second step, nitrite to nitrate conversion, is
successful (Lekang, 2013). Similarly to ammonia removal rates a significant salinity effects on
nitrite removal was observed (Table 2). For zero and 1’ order kinetics, SNR and k1a of 0.12 g
N ·m-2·d-1 and 0.23/0.24 m·d-1, respectively, were observed in this study for reactors operated
with system freshwater. A similar range of SNR; 0.10 g N·m-2·d-1and 0.19 m·d-1 were reported
by von Ahnen et al.,(2015). A subsequent increase in salinity affected nitrite conversion
efficiency with inhibition reaching 100% when freshwater bioelements were abruptly
subjected to salinity levels of 25‰ and above. This immediate inhibition in NOB function may
primarily be related to homeostatic disturbances including cell shrinkage due to
hyperosmotic conditions(Cortés-Lorenzo et al., 2015). This will cause an acute effect on all
bacteria, and over time lead to or shift in microbial composition (Moussa et al., 2006; Rud et
al., 2017).
4.3. Nitrate concentration A complete nitrification process results in an increase in the nitrate concentration equivalent
to the ammonia and nitrite addition by the initial spike solution. In this study, net increases
in nitrate concentration of 1 and 5 mg N/L were observed for 1’ and 0’-order spiking,
respectively, in reactors operated at 0‰, demonstrating complete TAN-conversion. A similar
experiment showed a net increase of 7 mg N/L nitrate for complete nitrification when spiked
with 7 mg N/L initial ammonia concentration (Nijhof and Bovendeur, 1990). In our study, an
increase in salinity resulted in incomplete nitrification and concomitantly a reduced increase
in nitrate concentration in reactors operated at higher salinity levels (Table 3 and 4 in
Appendix).
The finding in this study stresses the effect of N-loading when determining STR and SNR at
higher loadings (Pedersen et al., 2012), and TAN and nitrite removal rate constants at low
loadings (Table 2); yet the relative salinity effects remained similar in all tests (Fig. 5).
Reactors operated in freshwater showed no inhibition, while complete inhibition was
observed in reactors operated with either brackish RAS system water at 25‰, or full strength
seawater at 35‰.
4.4. Salinity effect on microbial community Previous studies have reported diversity differences for AOB and NOB microbial communities
in freshwater and marine RAS biofilters. Salinity changes cause pronounced changes in
bacterial populations and activities (Ludzack and Noran, 1965). Lee et al. (2016) and Huang
et al. (2018) reported a diverse nitrifying bacteria community in seawater RAS facilities at
salinity levels between 20 and 35‰. Increase in salinity might affect cell volume regulation
in freshwater cells or lead to shrinkage affecting basal metabolic processes (Lefebvre and
Molleta, 2006; He et al., 2017). Salt-induced environmental change affects nitrifying bacteria,
as relative poor nitrification efficiency is reported in freshwater systems operated at salinity
ACCEPTED MANUSCRIP
T

levels of 22‰ and above due to poor adaptation of AOBs at increased salinity (Bakke et al.,
2017). Decreases in STR might be due to osmotic changes affecting the functions of
operational taxonomic units among the AOB microbiota on the MBB biofilm (Gonzalez-Silva
et al., 2016).
The mechanisms and extent to which microbial communities can potentially adapt to
different salinities are not fully known but practical experiences indicate that gradual and
even abrupt changes in salinity can be done with less dramatic effects on nitrification once
the biofilters have experienced such rises and falls in salinity several times. Future
aquaculture saltwater nitrification studies should include, but not be limited to i) investigate
mode of salinity change over prolonged periods of time (Navada, 2018) ii) test of combined
low temperature and salinity effects on nitrification, iii) potentials of bio-augmentation or
seeding new biofilter elements with colonized biofilter elements and iv) document and
compare STR and SNR rates of biofilter from commercial brackish and saltwater RAS.
5. Conclusion The results of this study demonstrated that abrupt changes in salinity have significant effect
on both steps of the nitrification process and that the effect is comparable in first- and zero-
order concentrations. Ammonia and nitrite removal rates were reduced by some 25% at 10‰
salinity and by some 93% at 15‰ salinity. This highlights the point that awareness is needed
if RAS salinities are rapidly increased above 10‰. A complete inhibition of ammonia as well
as nitrite removal, both in 1’- and 0’-order kinetics, were observed when biofilter elements
from freshwater RAS were acutely operated in seawater from a marine RAS at 25‰. As
brackish and saltwater RAS develop very rapidly, there is an urgent need for more research
into understanding and optimizing biofiltration at different salinities.
Acknowledgement This work was part of the Building Stronger Universities BSU II Project funded by DANIDA
(Danish Foreign Aid) and co-administered by Sokoine University of Agriculture, Tanzania, and
the Technical University of Denmark, DTU Aqua. The authors would like to extend their
appreciation to Prof. Sebastian Wilson Chenyambuga, Dr. Daniel Mushi, Dr. Kirsten Thomsen
and Mrs Lene Zohnesen for coordination of the pilot projects that lead to this work. We also
give special thanks to the laboratory technicians: Ulla Sproegel, Dorte Frandsen, Brian Møller,
and Melissa Lyng for their support in the lab and Ole Larsen, Rasmus Nielsen and Gunnar
Vestergaard for their tireless technical support. ACCEPTED MANUSCRIP
T

Reference Aihua, B.L., Buchmann, K., 2001. Temperature- and salinity-dependent development of a Nordic
strain of Ichthyophthirius multi ® liis from rainbow trout. J. Appl. Ichthyol. 17, 273–276.
Aslan, S., Simsek, E., 2012. Influence of salinity on partial nitrification in a submerged biofilter. Bioresour. Technol. 118, 24–29.
Bakke, I., Am, A.L., Kolarevic, J., Ytrestoyl, T., Vadstein, O., Attramadal, K.J.K., Terjesen, B.F., 2017. Microbial community dynamics in semi-commercial RAS for production of Atlantic salmon post-smolts at different salinities. Aquac. Eng. 78, 42–49.
Bregnballe, J., 2015. A Guide to Recirculation Aquaculture, FAO and Eurofish Report.
Chen, S., Ling, J., Blancheton, J.P., 2006. Nitrification kinetics of biofilm as affected by water quality factors. Aquac. Eng. 34, 179–197.
Colt, J., 2006. Water quality requirements for reuse systems. Aquac. Eng. 34, 143–156.
Colt, J., Lamoureux, J., Patterson, R., Rogers, G., 2006. Reporting standards for biofilter performance studies. Aquac. Eng. 34, 377–388.
Cortés-Lorenzo, C., Rodríguez-Díaz, M., Sipkema, D., Juárez-Jiménez, B., Rodelas, B., Smidt, H., González-López, J., 2015. Effect of salinity on nitrification efficiency and structure of ammonia-oxidizing bacterial communities in a submerged fixed bed bioreactor. Chem. Eng. J. 266, 233–240.
Daims, H., Lebedeva, E. V., Pjevac, P., Han, P., Herbold, C., Albertsen, M., Jehmlich, N., Palatinszky, M., Vierheilig, J., Bulaev, A., Kirkegaard, R.H., Von Bergen, M., Rattei, T., Bendinger, B., Nielsen, P.H., Wagner, M., 2015. Complete nitrification by Nitrospira bacteria. Nature 528, 504–509.
Dalsgaard, J., 2017. 4th NordicRAS Workshop on Recirculating Aquaculture Systems, in: Dalsgaard, J. (Ed.), DTU Aqua Report No. 321-2017. Aalborg, Denmark.
Dalsgaard, J., Lund, I., Thorarinsdottir, R., Drengstig, A., Arvonen, K., Pedersen, P.B., 2013. Farming different species in RAS in Nordic countries: Current status and future perspectives. Aquac. Eng. 53, 2–13.
Diaz, V., Ibanez, R., Gomez, P., Urtiaga, A.M., Ortiz, I., 2012. Kinetics of nitrogen compounds in a commercial marine recirculating aquaculture system. Aquac. Eng. 50, 20–27.
DS 223, 1991. Water Analysis — Determination of the Sum of Nitrite- and Nitrate-Nitrogen. Danish Standards Foundation, Charlottenlund, Denmark.
DS 224, 1975. Water Analysis — Determination of Ammonia-Nitrogen. DanishStandards Foundation, Charlottenlund, Denmark.
Eding, E.H., Kamstra, A., Verreth, J.A.J., Huisman, E.A., Klapwijk, A., 2006. Design and operation of nitrifying trickling filters in recirculating aquaculture: A review. Aquac. Eng. 34, 234–260.
ACCEPTED MANUSCRIP
T
Eshchar, M., Lahav, O., Mozes, N., Peduel, A., Ron, B., 2006. Intensive fish culture at high ammonium and low pH. Aquaculture 255, 301–313.
Gonzalez-Silva, B.M., Jonassen, K.R., Bakke, I., Østgaard, K., Vadstein, O., 2016. Nitrification at different salinities: Biofilm community composition and physiological plasticity. Water Res. 95, 48–58.
Hagopian, D.S., Riley, J.G., 1998. A closer look at the bacteriology of nitrification. Aquac. Eng. 18, 223–244.
He, H., Chen, Y., Li, X., Cheng, Y., Yang, C., Zeng, G., 2017. Influence of salinity on microorganisms in activated sludge processes : A review. Int. Biodeterior. Biodegradation 119, 520–527.
Henze, M., Harremoes, P., la Cour Jansen, J., Arvin, E., 2002. Wastewater Treatment: Biological and Chemical Processes, 3rd ed. Springer Verlag, Berlin and Heidelberg.
Hochheimer, J.N., Wheaton, F.W., 1997. Intensive culture of striped bass, In: Striped Bass and Other Morone Culture. Elsevier Masson SAS, pp. 127–168.
Huang, Z., Jiang, Y., Song, X., Hallerman, E., Peng, L., Dong, D., Ma, T., 2018. Ammonia ‑ oxidizing bacteria and archaea within biofilters of a commercial recirculating marine aquaculture system. AMB Express 8, 1–12.
Jokumsen, A., Svendsen, L.M., 2010. Farming of freshwater rainbow trout in Denmark. DTU Aqua Reports 219, 1–47.
Jørgensen, L.V.G., 2017. The fish parasite Ichthyophthirius multifiliis – Host immunology, vaccines and novel treatments. Fish Shellfish Immunol. doi:10.1016/j.fsi.2017.06.044
Kamstra, A., Blom, E., Terjesen, B.F., 2017. Mixing and scale affect moving bed biofilm reactor (MBBR) performance. Aquac. Eng. 78, 9–17.
Kinyage, J.P.H., Pedersen, L., 2016. Impact of temperature on ammonium and nitrite removal rates in RAS moving bed biofilters. Aquac. Eng. 75, 51–55.
Lee, D., Lee, J., Kim, Y., Myeong, J., Kim, K., 2016. Uncultured bacterial diversity in a seawater recirculating aquaculture system revealed by 16S rRNA gene amplicon sequencing. J. Microbiol. 54, 296–304.
Lekang, O.I., 2013. Aquaculture Engineering, Second. ed, Wiley & Sons, Ltd., New York.
Lopato, L., Röttgers, N., Binning, P.J., Arvin, E., 2013. Heterogeneous nitrification in a full-scale rapid sand filter treating groundwater. J. Environ. Eng. 139, 375–384.
Ludzack, A.F.J., Noran, D.K., 1965. Tolerance of high salinities by conventional wastewater treatment processes. Water Pollut. Control Fed. 37, 1404–1416.
Lyssenko, C., Wheaton, F., 2006. Impact of positive ramp short-term operating disturbances on ammonia removal by trickling and submerged-upflow biofilters for intensive recirculating
ACCEPTED MANUSCRIP
T
aquaculture. Aquac. Eng. 35, 26–37.
Malone, R.F., Pfeiffer, T.J., 2006. Rating fixed film nitrifying biofilters used in recirculating aquaculture systems. Aquac. Eng. 34, 389–402.
Martins, C.I.M., Eding, E.H., Verdegem, M.C.., Heinsbroek, L.T.., Schneider, O., Blancheton, J.P., Roque d’Orbcastel, E., Verreth, J.A.J., 2010. New developments in recirculating aquaculture systems in Europe: A perspective on environmental sustainability. Aquac. Eng. 43, 83–93.
Matthews, R.A., 2005. Ichthyophthirius multifiliis Fouquet and Ichthyophthiriosis in freshwater teleosts, in: ADVANCES IN PARASITOLOGY. pp. 160–241. Moussa, M.S., Sumanasekera, D.U., Ibrahim, S.H., Lubberding, H.J., Hooijmans, C.M., Gijzen, H.J., Van Loosdrecht, M.C.M., 2006. Long term effects of salt on activity, population structure and floc characteristics in enriched bacterial cultures of nitrifiers. Water Res. 40, 1377–1388.
Navada, S., 2018. Effect of change in water salinity on nitrification in MBBR.,Preseantation at: 5th Conference on recirculating aquaculture Sunndalsøra 23rd -24th October 2018.
Nijhof, M., Bovendeur, J., 1990. Fixed film nitrification characteristics in sea-water recirculation fish culture systems. Aquaculture 87, 133–143.
Ødegaard, H., 2006. Innovations in wastewater treatment: The moving bed biofilm process. Water Sci. Technol. 53, 17–33.
Pedersen, L.-F., Oosterveld, R., Pedersen, P.B., 2015. Nitrification performance and robustness of fixed and moving bed biofilters having identical carrier elements. Aquac. Eng. 65, 37–45.
Pedersen, L.-F., Suhr, K.I., Dalsgaard, J., Pedersen, P.B., Arvin, E., 2012. Effects of feed loading on nitrogen balances and fish performance in replicated recirculating aquaculture systems. Aquaculture 338–341, 237–245.
Pedersen, P.B., von Ahnen, M., Fernandes, P., Naas, C., Pedersen, L.F., Dalsgaard, J., 2017. Particle surface area and bacterial activity in recirculating aquaculture systems. Aquac. Eng. 78, 18–23.
Pfeiffer, T.J., Wills, P.S., 2011. Evaluation of three types of structured floating plastic media in moving bed biofilters for total ammonia nitrogen removal in a low salinity hatchery recirculating aquaculture system. Aquac. Eng. 45, 51–59.
Prehn, J., Waul, C.K., Pedersen, L.-F., Arvin, E., 2012. Impact of water boundary layer diffusion on the nitrification rate of submerged biofilter elements from a recirculating aquaculture system. Water Res. 46, 3516–24.
Rud, I., Kolarevic, J., Buran, A., Berget, I., Calabrese, S., 2017. Deep-sequencing of the bacterial microbiota in commercial-scale recirculating and semi-closed aquaculture systems for Atlantic salmon post-smolt production. Aquac. Eng. 78, 50–62.
Rusten, B., Eikebrokk, B., Ulgenes, Y., Lygren, E., 2006. Design and operations of the Kaldnes moving bed biofilm reactors. Aquac. Eng. 34, 322–331.
ACCEPTED MANUSCRIP
T

Sánchez, O., Aspé, E., Martí, M.C., Roeckel, M., 2004. The effect of sodium of the Chloride Nitrifying on the on the two-step kineticsof the nitrifying process. Water Environ. Res. 76, 73–80.
Suhr, K.I., Pedersen, P.B., Arvin, E., 2013. End-of-pipe denitrification using RAS effluent waste streams: Effect of C/N-ratio and hydraulic retention time. Aquac. Eng. 53, 57–64.
Summerfelt, S., 2006. Design and management of conventional fluidized-sand biofilters. Aquac. Eng. 34, 275–302.
Svobodova, Z., Machova, J., Poleszczuk, G., Hůda, J., Hamáčková, J., Kroupova, H., 2005. Nitrite poisoning of fish in aquaculture facilities with water-recirculating systems. Acta Vet. Brno 74, 129–137.
Terjesen, B.F., Summerfelt, S.T., Nerland, S., Ulgenes, Y., Fjæra, S.O., Megård Reiten, B.K., Selset, R., Kolarevic, J., Brunsvik, P., Bæverfjord, G., Takle, H., Kittelsen, A.H., Åsgård, T., 2013. Design, dimensioning, and performance of a research facility for studies on the requirements of fish in RAS environments. Aquac. Eng. 54, 49–63.
Timmons, M.B., Ebeling, J.M., 2010. Recirculating Aquaculture, Second ed. Cayuga AQUA VENTURES, New York.
von Ahnen, M., Pedersen, L., Pedersen, P.B., Dalsgaard, J., 2015. Degradation of urea, ammonia and nitrite in moving bed biofilters operated at different feed loadings. Aquac. Eng. 69, 50–59.
Wolters, W., Masters, A., Vinci, B., Summerfelt, S., 2009. Design, loading, and water quality in recirculating systems for Atlantic salmon (Salmo salar) at the USDA ARS National Cold Water Marine Aquaculture Center (Franklin, Maine). Aquac. Eng. 41, 60–70.
Yogev, U., Sowers, K.R., Mozes, N., Gross, A., 2017. Nitrogen and carbon balance in a novel near-zero water exchange saline recirculating aquaculture system. Aquaculture 467, 118–126.
ACCEPTED MANUSCRIP
T

Figures
Fig. 1: A sketch of the batch reactor system setup for the nitrification experiment at different salinity levels. 1, Water flowmeter; 2, Ball valve; 3, Water pump; 4, Air pump; 5, Air flowmeter;
6, Reactor with biofilter media; 7, reactor’s inlet and 8, reactor’s outlet.
1
2
3
4 5
6 7
8
ACCEPTED MANUSCRIP
T

Fig. 2: Photo of randomized reactors during the experiment with media and mixture of system water at different salinity levels, from right; 0, 25, 35, 5, 10 and 15‰.
ACCEPTED MANUSCRIP
T

0 20 40 60 80 100 120 1400.0
0.3
0.6
0.9
1.2
1.5Ref.
0‰
5‰
10‰
15‰
25‰
35‰
Time (Minutes)
NH
4-N
(m
g L
-1)
0 20 40 60 80 100 120 1400.0
0.3
0.6
0.9
1.2
1.5Ref.
0‰
5‰
10‰
15‰
25‰
35‰
Time (Minutes)
NO
2-N
(m
g L
-1)
A
B
Fig. 3: Total ammonia-nitrogen (TAN) concentration (A) and nitrite-nitrogen concentration (B) observed in reactors with different salinities after spiking with 5ml of 1000 mg TAN/L and 5 ml
of 1000 mg NO2 –N- /L solution, respectively (data = mean ± SD, n=3).
ACCEPTED MANUSCRIP
T

0 50 100 150 200 250 300 3500.0
1.8
3.6
5.4
7.2Ref.
0‰
5‰
10‰
15‰
25‰
35‰
Time (Minute)
NH
4-N
(m
g L
-1)
0 50 100 150 200 250 300 3500.0
1.8
3.6
5.4
7.2Ref.
0‰
5‰
10‰
15‰
25‰
35‰
Time (Minute)
NO
2-N
(m
g L
-1)
A
B
Fig. 4: Total ammonia-nitrogen (TAN) concentration (A) and nitrite-nitrogen concentration (B) observed in reactors with different salinities after spiking with 25ml of 1000 mg TAN/L and 25
ml of 1000 mg NO2 –N- /L solution, respectively (data = mean ± SD, n=3).
ACCEPTED MANUSCRIP
T

STR0
Salinity (ppt)
0 10 20 30 40
Rela
tive
inhib
itio
n (
%)
0
20
40
60
80
100
120
Salinty vs STR0 x column vs y column
STR - 1° order
Salinity (ppt)
0 10 20 30 40R
ela
tive
inhib
itio
n %
0
20
40
60
80
100
120
Salinity vs % Inh. STR1 x column vs y column
SNR0
Salinity (ppt)
0 10 20 30 40
Rela
tive
inhib
itio
n (
%)
0
20
40
60
80
100
120
Salinty vs SNR0 x column 1 vs y column 1
SNR1
Salinity (ppt)
0 10 20 30 40
Rela
tive
Inhib
itio
n (
%)
-20
0
20
40
60
80
100
120
Salinty vs SNR1 x column vs y column
Fig. 5. Relative Inhibition (%) of salinity on A) Surface specific TAN removal rate (STR), B) Ammonia removal rate constant k1a (STR 1), C) Surface specific nitrite removal rate (SNR) and D)
Nitrite removal rate constant k1a (SNR 1). Data = mean (n=3) at P < 0.0001, R2 = 0.9954.
ACCEPTED MANUSCRIP
T

Tables Table 1: The percentage inclusion of system marine and freshwater RAS at different predefined
salinity levels. Tap ocean water was used for full strength seawater (35‰).
Salinity level % System brackish RAS % System freshwater RAS Seawater Ref. - 100 -
0 - 100.0 - 5 20.0 80.0 -
10 40.0 60.0 - 15 60.0 40.0 - 25 100.0 - - 35 - - 100
ACCEPTED MANUSCRIP
T

Table 2: First- and zero-order removal rate constants, k1a (in m·d-1) and k0a (in g N·m-2·d-1),
respectively, for TAN and Nitrite-N oxidation in fresh water bioelements exposed to different
salinities (mean ± SD, n=3). Different superscripts within a column represent a significant
difference between different salinity levels calculated at α = 95% (P ≤ 0.05).
Error! Not a valid link.
Appendix Appendix Table 1: Nitrate-nitrogen concentration in the reactor at the beginning and end of
sampling following a 5 ml 1000 TAN/L solution addition.
Error! Not a valid link.
Appendix Table 2: Nitrate-nitrogen concentration in the reactor at the beginning and end of
sampling of a 25-ml 1000 mg TAN/L or 1000 mg NO2-N/L respectively.
Error! Not a valid link.
ACCEPTED MANUSCRIP
T

Table 2: First- and zero-order removal rate constants, k1a (in m·d-1) and k0a (in g N·m-2·d-1),
respectively, for TAN and Nitrite-N oxidation in fresh water bioelements exposed to different
salinities (mean ± SD, n=3). Different superscripts within a column represent a significant
difference between different salinity levels calculated at α = 95% (P ≤ 0.05).
Salinity level (‰)
First order rate constants, k1a
(m·d-1)
Zero order rate constants, k0a
(g N·m-2·d-1)
TAN NO2-N TAN NO2-N
Ref. 0.22 ± 0.053a 0.23 ± 0.120a 0.10 ± 0.002a 0.12 ± 0.003a
0 0.22 ± 0.038a 0.24 ± 0.016a 0.09 ± 0.003b 0.12 ± 0.009a
5 0.17 ± 0.027a 0.25 ± 0.023a 0.09 ± 0.005b 0.08 ± 0.006b
10 0.04 ± 0.006b 0.05 ± 0.012b 0.04 ± 0.004c 0.03 ± 0.003c
15 0.01 ± 0.002b 0.01 ± 0.002c 0.01 ± 0.003d 0.01 ± 0.002d
25 0.00 ± 0.001b 0.00 ± 0.001c 0.00 ± 0.002e 0.00 ± 0.003d
35 0.00 ± 0.002b 0.00 ± 0.001c 0.00 ± 0.001e 0.00 ± 0.001d
ACCEPTED MANUSCRIP
T

Appendix Appendix Table 1: Nitrate-nitrogen concentration in the reactor at the beginning and end of
sampling following a 5 ml 1000 TAN/L solution addition.
Salinity level (‰)
1 mg TAN/L spike
[NO3-N] 10 min [NO3-N] 120 min [NO3-N] rise
Ref. 39.9 40.6 0.7
0 39.5 40.8 1.3
5 40.4 41 0.6
10 41.2 41.7 0.5
15 40.9 41.2 0.3
25 43.4 43.1 -0.3
35 3.2 2.6 -0.6
Appendix Table 2: Nitrate-nitrogen concentration in the reactor at the beginning and end of
sampling of a 25-ml 1000 mg TAN/L or 1000 mg NO2-N/L respectively.
Salinity level (‰)
5 mg TAN/L spike 5 mg NO2-N/L spike
[NO3-N] 10 min
[NO3-N] 300 min
[NO3-N] rise
[NO3-N] 10 min
[NO3-N] 300 min
[NO3-N] rise
Ref. 40.3 45.7 5.4 41.2 46 4.8
0 40.2 45.7 5.5 40.7 45.8 5.1
5 41.5 45.5 4 40.5 46 5.5
10 41.7 44.1 2.4 41.2 43.4 2.2
15 40.8 42.2 1.4 40.5 41.5 1
25 42.8 43 0.2 41.1 42.7 1.6
35 2.5 2.6 0.1 0.6 0.7 0.1
ACCEPTED MANUSCRIP
T