Embed Size (px)
Citation preview
Effects of Adsorbate Properties on Heel Buildup on Activated Carbon Fiber Cloth during
Electrothermal Regeneration
by
Monisha Alam
A thesis submitted in partial fulfillment of the requirements for the degree of
Master of Science
in
Environmental Engineering
Department of Civil and Environmental Engineering
University of Alberta
© Monisha Alam, 2017

ii
ABSTRACT
Automotive painting booths are a major source of volatile organic compounds’ (VOCs)
in the automotive manufacturing sector. Adsorption on activated carbon (AC) has been widely
used as a low cost and energy efficient VOC control method. A major challenge associated with
the cyclic adsorption/desorption of VOCs on AC is the unwanted accumulation of adsorbates
known as irreversible adsorption or heel formation, which leads to significant decrease in
adsorbent capacity and lifetime. The objective of this study is to identify the effects of adsorbate
properties such as boiling point, kinetic diameter and thermal stability on heel buildup and
adsorption capacity loss of AC. For this purpose, five cycle adsorption/desorption tests were
completed using activated carbon fiber cloth (ACFC) as adsorbent and nine different
alkylbenzenes (toluene, ethylbenzene, p-xylene, m-xylene, o-xylene, isopropylbenzene, 1,2,4
trimethylbenzene (TMB), 1,3,5 TMB and neopentylbenzene) with different physical and
chemical properties were used as adsorbates. The ACFCs loaded with various adsorbates were
electrothermally regenerated at 400°C, with a heating rate of 70°C/ min and N2 purge flow of 0.1
standard liter per minute (SLPM). The obtained results indicate that heel formation was mainly
affected by the thermal stability of the adsorbates, whereas the adsorption capacity loss was
affected by heel formation and the kinetic diameter of the adsorbates. The principal mechanism
of heel formation was found to be the thermal decomposition of the adsorbates due to high
temperature desorption, while the adsorbates’ boiling points (or vapour pressure) and kinetic
diameters controlled their exposure to high temperature during desorption. The conversion rates
of the adsorbates in pyrolysis have been used as an indication of their thermal stability, and an
increase in conversion rate from less than 1% to more than 90% increased heel formation from
8.9% to 17.2%, showing that lower thermal stability of adsorbates causes higher decomposition

iii
and therefore higher heel. Bulkier compounds caused higher adsorption capacity loss exhibiting
an increase in capacity loss from 25.2% to 80.0% when kinetic diameter of adsorbate molecules
increased from 5.9 Å to > 7.5 Å. The results of this work will help understand how different
adsorbates in industrial air streams will affect heel formation on AC. This will help to take
proper measures and optimize regeneration conditions to control heel formation and extend the
lifetime of adsorbents.

iv
I dedicate this thesis to my beloved family. A special gratitude to my loving
parents, Anju and Jahangir, that this success would not be possible without their
endless love, invaluable support and encouragement for me in pursuing higher
education.
I would also like to dedicate this work to my lovely husband, Hasan, for providing
me with continuous support and encouragement and also for helping me in every
aspect to achieve this success
v
ACKNOWLEDGMENTS
First and foremost, I would like to express my deepest gratitude to my supervisor, Dr.
Zaher Hashisho, for his supervision, guidance and generous support throughout my course work
and research. I highly appreciate his invaluable comments and continuous feedback throughout
my MSc research. This work could not be accomplished without his profound knowledge,
expertise and guidance.
I would like to acknowledge the financial support from Ford Motor Company, and the
Natural Sciences and Engineering Research Council (NSERC) of Canada. I also acknowledge
the financial support from Queen Elizabeth II Graduate Scholarship - Master’s Level, Prairie
Mines & Royalty Ltd Graduate Scholarship in Environmental Engineering and Westmoreland
Coal Company Graduate Scholarship in Environmental Engineering.
I would also like to thank my colleagues in Air Quality Characterization Lab, especially
Saeid Niknaddaf and Masoud Jahandar Lashaki for their availability, suggestions and assistance
in my experiments.
I extend my appreciation to the technicians in the Department of Civil and Environmental
Engineering for their help and support.
vi
TABLE OF CONTENTS
CHAPTER 1. INTRODUCTION ................................................................................................... 1
1.1 Background ........................................................................................................................... 1
1.2 VOC Emission Sources and Control Regulations ................................................................. 2
1.3 VOC Mitigation Techniques ................................................................................................. 3
1.4 VOC Adsorption on Activated Carbon ................................................................................. 7
1.5 Problem Statement ................................................................................................................ 7
1.6 Objectives .............................................................................................................................. 8
1.7 Thesis Outline ....................................................................................................................... 9
CHAPTER 2. LITERATURE REVIEW ...................................................................................... 10
2.1 Adsorption ........................................................................................................................... 10
2.1.1 Types of Adsorption ..................................................................................................... 11
2.1.2 Adsorption Capacity and Isotherms ............................................................................. 11
2.2 Adsorbent Types and Properties ......................................................................................... 13
2.2.1 Non-carbonaceous adsorbates ...................................................................................... 14
2.2.2 Carbonaceous Adsorbents ............................................................................................ 15
2.3 Activated Carbon................................................................................................................. 16
2.3.1 Types of AC.................................................................................................................. 18
2.3.2 Activated Carbon Fiber Cloth....................................................................................... 21
2.4 Desorption/Regeneration ..................................................................................................... 23
2.4.1 Methods of Regeneration .............................................................................................. 24
2.4.2 Factors Affecting Desorption Behaviour of Activated Carbon .................................... 28
2.5 Irreversible Adsorption ....................................................................................................... 29
2.5.1 Mechanisms of Irreversible Adsorption ....................................................................... 29
2.5.2 Effects of Adsorption Conditions on Irreversible Adsorption...................................... 31
vii
2.5.3 Effects of Regeneration Conditions on Irreversible Adsorption .................................. 32
2.5.4 Effects of Adsorbent Properties on Irreversible Adsorption ........................................ 34
2.5.5 Effects of Adsorbate Properties on Irreversible Adsorption ........................................ 35
CHAPTER 3. MATERIALS AND METHODS .......................................................................... 36
3.1 Materials .............................................................................................................................. 36
3.1.1 Adsorbent...................................................................................................................... 36
3.1.2 Adsorbates .................................................................................................................... 36
3.2 Methods ............................................................................................................................... 39
3.2.1 Adsorption and Regeneration Experiments .................................................................. 39
3.2.2 Characterization Tests .................................................................................................. 43
CHAPTER 4. RESULTS AND DISCUSSIONS.......................................................................... 45
4.1 Breakthrough Curves........................................................................................................... 45
4.2 Cumulative Heel Buildup on ACFC Samples during 5-Cycle Adsorption and Regeneration
Experiments ............................................................................................................................... 48
4.3 Thermo-Gravimetric Analysis............................................................................................. 50
4.4 Desorption Profile and Applied Power during Regeneration Cycles .................................. 54
4.5 Micropore Surface Analysis ................................................................................................ 60
CHAPTER 5. CONCLUSIONS AND RECOMMENDATIONS ................................................ 63
5.1 Conclusions ......................................................................................................................... 63
5.2 Recommendations ............................................................................................................... 65
REFERENCES ............................................................................................................................. 66
APPENDICES .............................................................................................................................. 83
Appendix A: Environment Canada VOC concentration limit for automotive refinishing
products ..................................................................................................................................... 83
Appendix B: Detail of 5 cycle adsorption/desorption tests of toluene on ACFC ..................... 84
Appendix C: Detail of 5 cycle adsorption/desorption tests of p-xylene on ACFC ................... 86
viii
Appendix D: Detail of 5 cycle adsorption/desorption tests of m-xylene on ACFC .................. 88
Appendix E: Detail of 5 cycle adsorption/desorption tests of o-xylene on ACFC ................... 90
Appendix F: Detail of 5 cycle adsorption/desorption tests of 1,2,4 TMB on ACFC ................ 92
Appendix G: Detail of 5 cycle adsorption/desorption tests of 1,3,5 TMB on ACFC ............... 94
Appendix H: Detail of 5 cycle adsorption/desorption tests of ethylbenzene on ACFC ............ 96
Appendix I: Detail of 5 cycle adsorption/desorption tests of isopropylbenzene on ACFC ...... 98
Appendix J: Detail of 5 cycle adsorption/desorption tests of neopentylbenzene on ACFC ... 100
ix
LIST OF TABLES
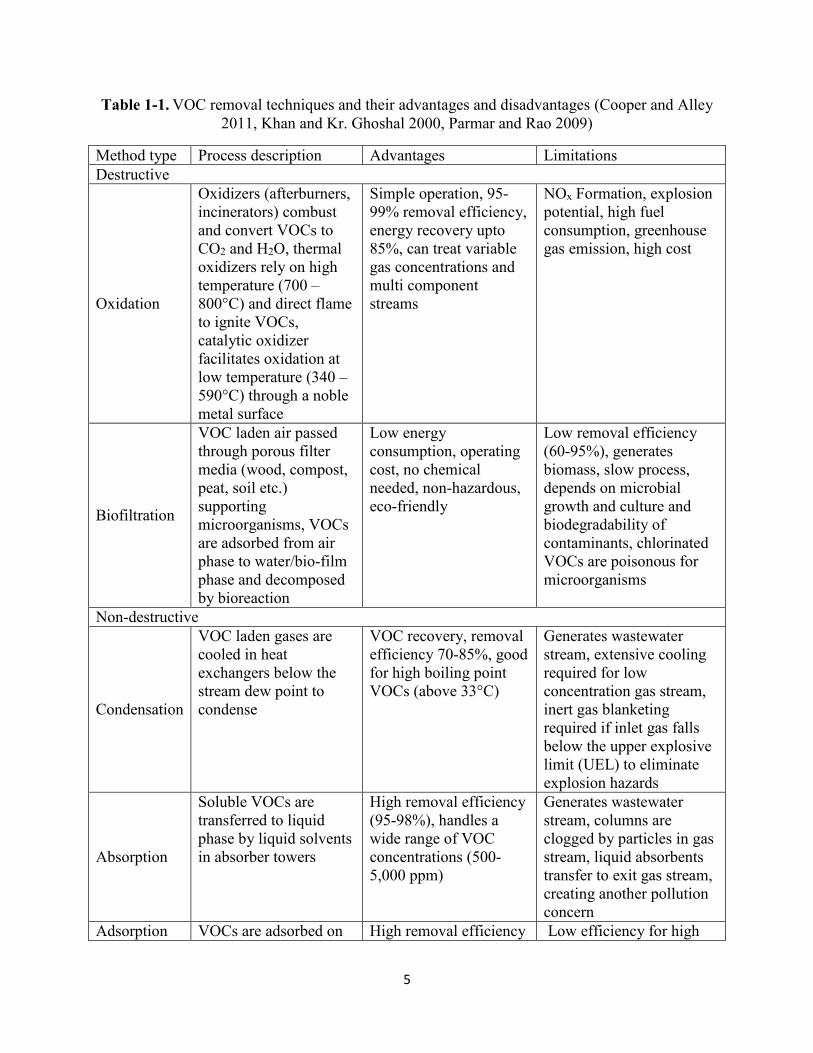
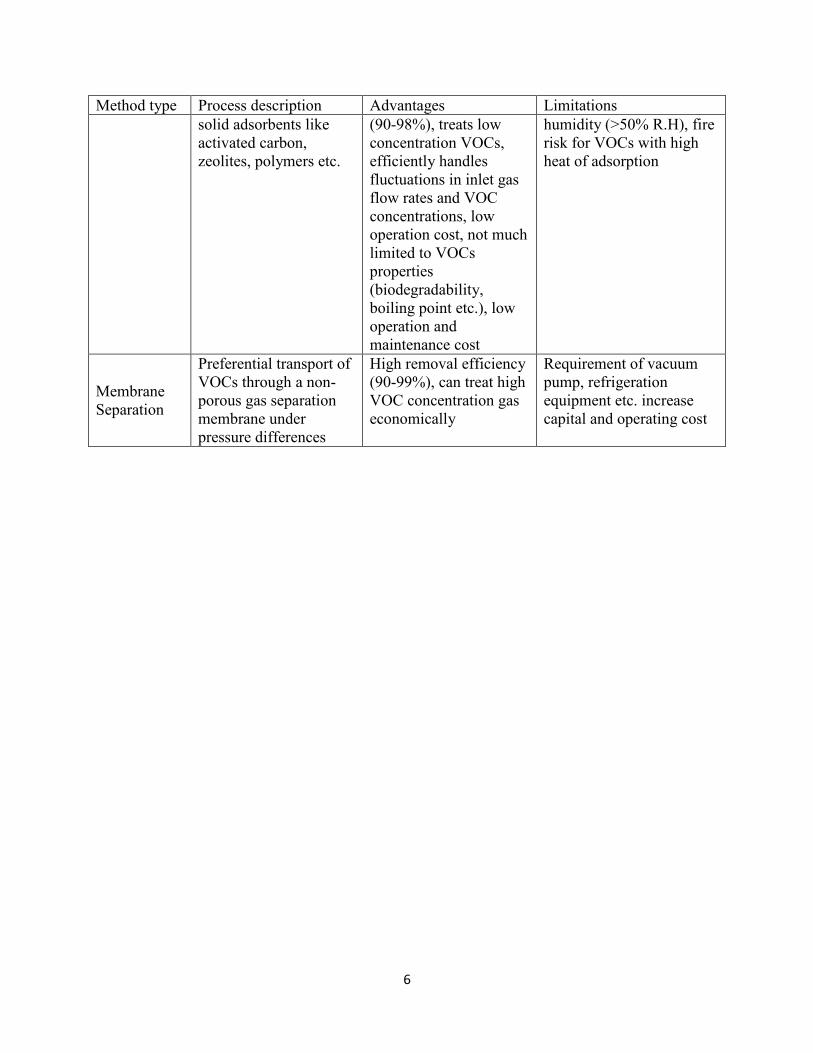
Table 1-1. VOC removal techniques and their advantages and disadvantages (Cooper and Alley
2011, Khan and Kr. Ghoshal 2000, Parmar and Rao 2009) ........................................................... 5
Table 2-1. Comparison between TSR and ESR for regeneration of activated carbon ................. 27
Table 3-1. Properties of the tested adsorbates .............................................................................. 38
Table 4-1. Reduction in 1% breakthrough time, cumulative heel and capacity loss of ACFC for 5
cycle adsorption/desorption of different adsorbates (Values are reported as mean ± standard
deviation of two experimental runs) ............................................................................................. 47
Table 4-2. Exposure of residual adsorbates to 400°C, 1st cycle and 5 cycle cumulative heel, 5
cycle capacity loss and 5 cycle average power applied during regeneration of ACFCs loaded with
different adsorbates. (Values are reported as mean ± standard deviation of two experimental
runs) .............................................................................................................................................. 59
Table 4-3. BET surface area, pore volume and micropore volume of heat treated and regenerated
ACFCs loaded with different adsorbates ...................................................................................... 60
x
LIST OF FIGURES
Figure 2-1. Pore size distribution of some commonly used adsorbents (Knaebel 2016) ............. 14
Figure 2-2. Schematic of Different types of pores in AC (Wu 2004) ........................................... 17
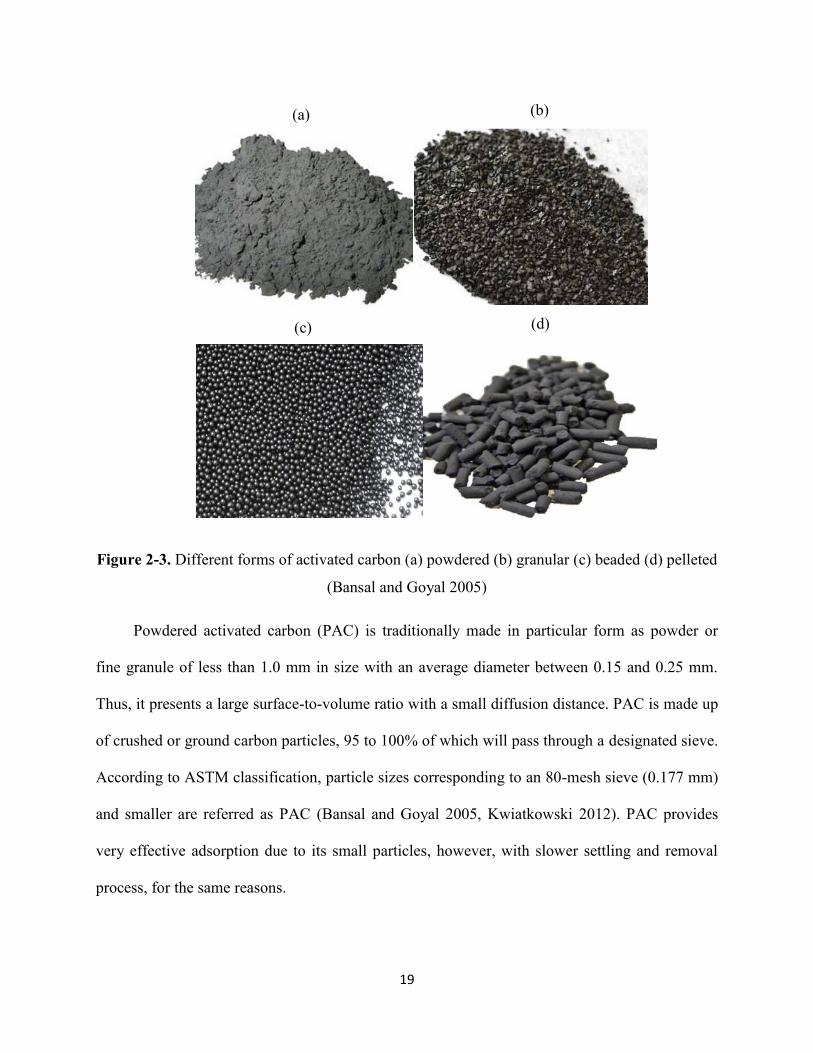
Figure 2-3. Different forms of activated carbon (a) powdered (b) granular (c) beaded (d) pelleted
....................................................................................................................................................... 19
Figure 2-4. ACFC from macro to micro scale .............................................................................. 23
Figure 2-5. Classification of methods used for regenerating activated carbon adsorbents .......... 25
Figure 3-1. Schematic of the experimental setup of the adsorption/regeneration experiments .... 41
Figure 3-2. ACFC cartridge used for adsorption/regeneration experiments................................. 41
Figure 4-1. Breakthrough curves for adsorption of (a) toluene, (b) p-xylene, (c) m-xylene, (d) o-
xylene, (e) 1,2,4 TMB, (f) 1,3,5 TMB, (g) ethylbenzene, (h) isopropylbenzene and (i)
neopentylbenzene. ......................................................................................................................... 46
Figure 4-2. Cumulative heel on ACFC samples loaded with different alkylbenzene adsorbates.
Values in parentheses indicate thermal conversion rates (as % weight) from literature .............. 48
Figure 4-3. TGA results of heat treated and regenerated ACFCs loaded with different adsorbates
....................................................................................................................................................... 51
Figure 4-4. DTG results of heat treated and regenerated ACFCs loaded with different adsorbates
....................................................................................................................................................... 51
Figure 4-5. Positions and dehydrogenation tendency of α and β-hydrogen in alkylbenzenes
[modified from .............................................................................................................................. 53
Figure 4-6. Desorption profiles for the 1st regeneration cycle of ACFC loaded with different
adsorbates ...................................................................................................................................... 55
Figure 4-7. Desorption profiles for the initial 30 min of the 1st regeneration cycle of ACFC
loaded with different adsorbates ................................................................................................... 56
xi
LIST OF ACRONYMS
AC Activated Carbon
ACFC Activated Carbon Fiber Cloth
ACC Activated Carbon Cloth
BAC Beaded Activated Carbon
BET Brunauer-Emmett-Teller
CEPA Canadian Environmental Protection Act
CFCs Chlorofluorocarbons
COP Critical Oxidation Potential
DAC Data Acquisition and Control
DFT Density Functional Theory
DO Dissolved Oxygen
DTG Derivative Thermo-Gravimetric
EAC Extruded Activated Carbon
EPA Environmental Protection Agency
ESA Electrothermal Swing Adsorption
ESR Electrothermal Swing Regeneration
FID Flame Ionization Detector
GAC Granular Activated Carbon
IUPAC International Union of Pure and Applied Chemistry
PAC Powdered Activated Carbon
PPB Parts Per Billion
PPMV Parts Per Million (Volume fractions)
PSA Pressure Swing Adsorption
PSR Pressure Swing Regeneration
PSD Pore Size Distribution
QSDFT Quenched Solid Density Functional Theory
SFG Surface Functional Groups
SLPM Standard Liter per Minute
TGA Thermo-Gravimetric Analysis

xii
USEPA United States Environmental Protection Agency
VOC Volatile Organic Compound
1
CHAPTER 1. INTRODUCTION
1.1 Background
Volatile organic compounds (VOCs) refer to a complex group of hydrocarbons with
relatively low boiling point (<260°C) and higher vapour pressure, including aromatic and
aliphatic hydrocarbons, ketones, esters, alcohols, and glycol ethers (Kennes and Veiga 2013,
Khan and Kr. Ghoshal 2000, Kim 2011). Definition of VOCs varies among different regulatory
systems based on their health and environmental impacts. The United States Environmental
Protection Agency (USEPA) defines VOCs as “any compound of carbon, excluding carbon
monoxide, carbon dioxide, carbonic acid, metallic carbides or carbonates, and ammonium
carbonate, which participates in atmospheric photochemical reactions” (US Environmental
Protection Agency 2016). According to Environment and Climate Change Canada, VOCs are
defined as “organic compounds containing one or more carbon atoms that have high vapour
pressures and therefore evaporate readily to the atmosphere” (Environment and Climate Change
Canada 2015). In the Environment and Climate Change Canada definition of VOCs under
Schedule 1 (item 65) of the Canadian Environmental Protection Act, 1999 (CEPA 1999),
compounds such as methane, ethane and the chlorofluorocarbons (CFCs) are excluded because
of their low photochemical reactivity. Most of the VOCs are toxic and have severe health and
environmental hazards. The health effects of VOCs exposure include eye, nose, and throat
irritations, headaches, nausea, dizziness etc. (Fiedler et al. 2005). Moreover, even at very low
concentration, the VOCs cause damage to lungs, liver, nervous system and may even cause
cancer and memory loss (Kampa and Castanas 2008, Khan and Kr. Ghoshal 2000, Pariselli et al.
2009). In presence of sunlight and in combination with NOx, VOCs undergo photochemical
2
oxidation, producing a photochemical smog that pollutes the environment by affecting plants’
growth and decay and it also adversely affect human and animal lives (Karatum and Deshusses
2016, Khan and Kr. Ghoshal 2000). Several halogenated VOCs are potential greenhouse gases
and depletes the stratospheric ozone layer (Robinson et al. 2007) and also helps in formation of
tropospheric or ground level ozone (Atkinson 2000). Therefore, it is highly important to restrict
the VOC emission for protecting our health and environment.
1.2 VOC Emission Sources and Control Regulations
VOC sources are classified as biogenic (natural) and anthropogenic (human-made).
Biogenic sources include woods, crops, oceans, and volcanic eruptions whereas industrial
activities involving paints, varnishes, chemical cleaners, solvents, lubricants, and liquid fuel are
the major anthropogenic sources of VOCs (Bari et al. 2016, Zhao et al. 2014). In 2014, VOC
emission in Canada were 2157 kilotonnes (kt), showing an increase of 13 kt (1%) from 2013
levels, among which, the oil gas industry, paints and solvents processing industry and
agricultural sector (livestock and fertilizer) were the biggest contributors of the national
emissions of VOC (34%, 15%, and 12% respectively) (Environment and Climate Change
Canada 2016). In North America, about 6.58 kg of VOC is used as paint solvents per vehicle in
typical car manufacturing plants (Kim 2011). Due to concerns about the health and
environmental impacts of VOC, many regulatory agencies issued regulations to control VOC
emissions to the atmosphere. Under Title I of the US Clean Air Act Amendment of 1990, VOC
emissions reduction is imposed if the VOC emission leads to an ozone concentration that
exceeds the current national ambient air quality standard for ozone of 0.12 ppm (USEPA 1991).
In Europe, organic vapour emission limit is 35 grams total organic compounds (TOC) per cubic
meter gasoline loaded (35 g TOC/m3), according to the recently passed European Community
3
stage. Environment Canada is also working to reduce VOC emissions, particularly resulting from
the use of solvents and solvent based products. On July 8, 2009, the VOC Concentration Limits
for Automotive Refinishing Products Regulations were published and it established
concentration limits for VOCs in 14 categories of automotive refinishing products. The VOC
concentration limits apply to all automotive refinishing products such as primers, paints,
coatings, surface cleaners etc. The VOC concentration limits in Canada applied to different
categories of automotive refinishing products are listed in Appendix A (Environment and
Climate Change Canada 2015). Therefore, the increasingly strict regulations on VOC emissions
warrant continuous research to develop effective technologies to limit emissions of VOC
pollutants.
1.3 VOC Mitigation Techniques
Several treatment technologies exist to control the emission of VOCs (Khan and Kr.
Ghoshal 2000, Kim 2011). Selection of a treatment technique depends on different parameters
such as the type, source, concentration and flow rate of the pollutant, presence of compounds
other than VOCs, reusability of captured compounds, regulatory limits etc. (Berenjian et al.
2012). Moreover, the process safety, location, cost, and operative possibility of the selected
technique should also be considered (Cooper and Alley 2011). VOC control techniques are
classified into two main categories: (i) process and equipment modification (VOCs emissions are
controlled by modifying the process, equipment or raw material) and (ii) add-on-control
techniques (additional control method is applied) (Parmar and Rao 2009). In spite of being more
effective and efficient, the applicability of the first type is limited since it is hard to do process
modification in most cases. Therefore, the add-on-control techniques are more applicable, and
are divided into two groups, destructive and non-destructive methods. Destructive methods are
4
preferred when VOC recovery is not technically or economically feasible, whereas non-
destructive methods allow VOC recovery and reuse (Berenjian et al. 2012). A summary of the
conventional add-on-control techniques for VOC abatement and their main merits and demerits
are provided in Table 1.1. The limitation of secondary waste generation is associated with most
of the conventional methods, including biomass formation in biological processes, production of
greenhouse gases in oxidative methods, condensate in condensation, and spent adsorbent in
adsorption (Parmar and Rao 2009). Besides these conventional techniques, in recent times, some
novel VOC abatement technologies have emerged, which include VOC treatment with spark-
generated carbon aerosol particles, mesoporous chromium oxide and silica fiber matrix, negative
air ions treatment, electrical discharge treatment, electron beam bombardment, and ultraviolet
(UV) photo-oxidation by heterogeneous photocatalyst particles (Parmar and Rao 2009). Though
a few of these newer methods have shown high removal efficiencies for industrial applications,
many of them are still being explored in bench-scale level, involve delicate operation and require
very high operating and maintenance cost (Parmar and Rao 2009). Because of the advantages of
adsorption process over other VOC mitigation techniques discussed in Table 1.1, adsorption has
been widely used as an energy efficient and inexpensive method for low concentration (< 10,000
ppm) VOCs removal from both gaseous and aqueous streams (Fletcher et al. 2006). Therefore,
adsorption was chosen as the VOC removal method in this research.
5
Table 1-1. VOC removal techniques and their advantages and disadvantages (Cooper and Alley
2011, Khan and Kr. Ghoshal 2000, Parmar and Rao 2009)
Method type Process description Advantages Limitations
Destructive
Oxidation
Oxidizers (afterburners,
incinerators) combust
and convert VOCs to
CO2 and H2O, thermal
oxidizers rely on high
temperature (700 –
800°C) and direct flame
to ignite VOCs,
catalytic oxidizer
facilitates oxidation at
low temperature (340 –
590°C) through a noble
metal surface
Simple operation, 95-
99% removal efficiency,
energy recovery upto
85%, can treat variable
gas concentrations and
multi component
streams
NOx Formation, explosion
potential, high fuel
consumption, greenhouse
gas emission, high cost
Biofiltration
VOC laden air passed
through porous filter
media (wood, compost,
peat, soil etc.)
supporting
microorganisms, VOCs
are adsorbed from air
phase to water/bio-film
phase and decomposed
by bioreaction
Low energy
consumption, operating
cost, no chemical
needed, non-hazardous,
eco-friendly
Low removal efficiency
(60-95%), generates
biomass, slow process,
depends on microbial
growth and culture and
biodegradability of
contaminants, chlorinated
VOCs are poisonous for
microorganisms
Non-destructive
Condensation
VOC laden gases are
cooled in heat
exchangers below the
stream dew point to
condense
VOC recovery, removal
efficiency 70-85%, good
for high boiling point
VOCs (above 33°C)
Generates wastewater
stream, extensive cooling
required for low
concentration gas stream,
inert gas blanketing
required if inlet gas falls
below the upper explosive
limit (UEL) to eliminate
explosion hazards
Absorption
Soluble VOCs are
transferred to liquid
phase by liquid solvents
in absorber towers
High removal efficiency
(95-98%), handles a
wide range of VOC
concentrations (500-
5,000 ppm)
Generates wastewater
stream, columns are
clogged by particles in gas
stream, liquid absorbents
transfer to exit gas stream,
creating another pollution
concern
Adsorption VOCs are adsorbed on High removal efficiency Low efficiency for high
6
Method type Process description Advantages Limitations
solid adsorbents like
activated carbon,
zeolites, polymers etc.
(90-98%), treats low
concentration VOCs,
efficiently handles
fluctuations in inlet gas
flow rates and VOC
concentrations, low
operation cost, not much
limited to VOCs
properties
(biodegradability,
boiling point etc.), low
operation and
maintenance cost
humidity (>50% R.H), fire
risk for VOCs with high
heat of adsorption
Membrane
Separation
Preferential transport of
VOCs through a non-
porous gas separation
membrane under
pressure differences
High removal efficiency
(90-99%), can treat high
VOC concentration gas
economically
Requirement of vacuum
pump, refrigeration
equipment etc. increase
capital and operating cost
7
1.4 VOC Adsorption on Activated Carbon
Among different adsorbent, activated carbon (AC) is one of the most widely used
adsorbent in both air and water treatment due to its high surface area, high adsorption capacity
and low cost (Fletcher et al. 2006, Hashisho et al. 2008). Moreover, AC can be regenerated, its
physical and chemical properties can be tailored, it has good thermal stability in absence of
oxygen, and can withstand acidic or basic conditions (Dabrowski et al. 2005). AC is available is
several physical forms such as granular, powdered, beads, fibers and monoliths. Activated
carbon fiber cloth (ACFC) has recently gained more attention because of some novel properties
such as ash-free and high microporous structure where the internal micropores are connected to
its external surface area, diminishing the mass and heat transfer limitations (Ramos et al. 2010).
ACFC is more compact due to its continuous fibers, which provides it with higher electrical
conductivity than other forms of AC, making it a suitable candidate for electrothermal swing
adsorption (ESA). ESA is an efficient regeneration technique due to its fast heating rate, less
purge gas consumption and minimal requirement to separate condensate water. (Niknaddaf et al.
2016). Therefore, in this research, ACFC is chosen as the VOC adsorbent and electrothermal
desorption by resistive heating has been selected as the regeneration method for ACFC.
1.5 Problem Statement
One major challenge during cyclic adsorption/desorption of VOCs on AC is the
irreversible adsorption, causing unwanted adsorbate accumulation (aka heel formation) on the
adsorbent, which significantly decreases the adsorption capacity and lifetime of the adsorbents
(Lashaki et al. 2012b, Niknaddaf et al. 2016). Irreversible adsorption increases the operation and
maintenance costs of adsorption system by requiring frequent replacement of the adsorbent to
8
maintain a sufficient adsorption capacity. Previous studies have shown that heel formation on
activated carbon is affected by several factors including the properties of the adsorbents and
adsorbates, as well as the regeneration conditions (Lashaki et al. 2012b, Niknaddaf et al. 2016,
Wang et al. 2012).
1.6 Objectives
The goal of this research is to investigate the effects of the properties of VOC adsorbates
on heel buildup during electrothermal desorption. The main objective of this research is to
investigate the effects of different adsorbate properties (kinetic diameter, boiling point, thermal
stability) on heel formation on ACFC during cyclic adsorption and electrothermal desorption of
alkylbenzenes on ACFC. ACFC was used in this study as the adsorbent because it has very high
microporosity which can highlight the heel formation, since heel formation occurs mainly in the
micropores. Besides, because of its electric resistivity, ACFC can be efficiently regenerated by
electrothermal regeneration. The adsorbates chosen in this research were based on their presence
in paint solvents and their potential for heel formation. Aadsorbates with benzene rings in their
structure, larger kinetic diameter and higher boiling points are expected to result in higher heel
formation. In addition, adsorbates with lower thermal stability may be prone for thermal
decomposition during desorption from ACFC at high temperature. Therefore, nine alkylbenzenes
with different kinetic diameters, boiling points and thermal stability were selected as adsorbates
in this research.
A better understanding of the factors contributing to the irreversible adsorption is
important in identifying ways to decrease heel buildup and increase the adsorbents’ lifetime.
Although there is some information on how adsorbate properties contribute to heel formation on
9
beaded activated carbon (BAC), there is not enough information on how ACFC is affected by
irreversible adsorption during electrothermal desorption. Results of this research include
information on the potential of different VOC adsorbates to form heel on ACFC during
subsequent adsorption/desorption. Therefore, based on these results, related industry can design
an effective VOC abatement system depending on the VOC constituents of the polluted gas
stream, which can effectively minimize irreversible adsorption on the adsorbent. This is expected
to reduce the cost for disposal and replacement of the adsorbent. Moreover, this research can also
help in bridging some of the knowledge gaps in the adsorption/desorption of VOC from polluted
gas streams onto ACFC.
1.7 Thesis Outline
This thesis consists of three chapters that will contribute to fulfill the goal of the research.
Chapter 1 provides an introduction about the topic including background, objective and
importance of the research. A detail literature review on adsorption process, different types of
adsorbents and adsorbates, regeneration process, different regeneration techniques, and factors
affecting irreversible adsorption is included in Chapter 2. Chapter 3 includes description of the
materials and methods used. Chapter 4 presents the experimental results and corresponding
discussions, and Chapter 5 provides the major conclusions obtained from this study and future
recommendations.
10
CHAPTER 2. LITERATURE REVIEW
2.1 Adsorption
Adsorption is a process in which atoms, ions or molecules of a gas, liquid or dissolved
solid get attached onto a surface (Bansal and Goyal 2005, Slejko 1985). Adsorption is a surface-
based phenomenon, and occurs mainly as a result of surface energy. The adsorbing surface
providing the adsorption sites is called adsorbent, whereas the substance that gets attached to the
surface is named as adsorbate (Slejko 1985). The nature of forces enhancing the adsorption
depends on the species involved. Adsorption of gaseous species on a solid or liquid medium
causes a decrease in the free energy of the system and the system entropy, therefore, adsorption
is always an exothermic process (Radecki and American Institute of Chemical Engineers 1999,
Zhou 2007). The reverse process of adsorption is known as desorption, when the adsorbates
come out or rebound back from the adsorbent surface and pores.
Adsorption process exists in many natural, physical, biological and chemical system
(Suffet and McGuire 1980). In addition, adsorption also has wide industrial applications, both in
liquid and gas-phase. Its liquid-phase applications include removal of organic compounds from
water or organic solutions, colored impurities from organics, moisture dissolved in gasoline,
pollutants in wastewater treatment processes etc. (Dou et al. 2015, Gupta and Verma 2002,
Slejko 1985). Examples of gas-phase applications of adsorption are removal of water vapor from
air and other gases, sulfur compounds form natural gas, recovery of solvent vapors from air-gas
mixture, VOC removal from polluted gas streams, etc. (Lapkin et al. 2004, Ramos et al. 2010,
Ratnasamy et al. 2012, Zheng et al. 2013)
11
2.1.1 Types of Adsorption
The type of adsorption between adsorbent and adsorbate depends on several factors such as
the surface reactivity, properties of adsorbent and adsorbates, and also the adsorption
temperature (Slejko 1985). Based on the type of forces participating in the process, adsorption is
mainly classified into two types: physical adsorption or physisorption and chemical adsorption or
chemisorption (Ramos et al. 2010, Slejko 1985). In physisorption, adsorbates are attached to
adsorbent surface through weak interaction forces (e.g. van der Waals forces) between the
adsorbent and adsorbate. In contrary, chemisorption involves strong interaction forces (usually
covalent bonds) and the sharing of electron between adsorbent and adsorbates leads to formation
of chemical reactions (Bansal and Goyal 2005, Do 1998). The heat of adsorption for
physisorption is from 10 to 20 KJ/mole, whereas in chemisorption it ranges between 40 to 400
KJ/mole (Bansal and Goyal 2005). Physisorption may occur at a faster rate at low temperature,
since no activation energy is required, but chemisorption need activation energy to take place,
therefore rate of chemisorption is temperature dependent (Do 1998). Besides, physisorption has a
multimolecular thickness of adsorbed phase, whereas in chemisorption, the thickness is
monomolecular (Bansal and Goyal 2005, Slejko 1985).
2.1.2 Adsorption Capacity and Isotherms
Adsorption capacity refers to the amount of adsorbate that can be adsorbed onto the surface
of an adsorbent before the adsorbent gets saturated (Zhou 2007). Adsorption capacity depends on
the equilibrium relationship between adsorbent and adsorbate (Bansal and Goyal 2005). At the
beginning of adsorption process, the rate of adsorption is high due to the higher exposure of solid
surface towards a liquid or gaseous adsorbate. The more the surface become covered with
adsorbate molecules, the availability of bare surface decreases, therefore the rate of adsorption
12
decreases and the rate of desorption, which is the rate at which adsorbates rebound back from
adsorbent surface, increases. With time, a stage is obtained when adsorption and desorption rates
are equal and both the adsorbent and adsorbate are in equilibrium, and this equilibrium condition
depends on the system pressure and temperature (Do 1998, Keller and Staudt 2005). If the
temperature is kept constant then the equilibrium only depends on the equilibrium pressure, it is
known as adsorption isotherms.
Adsorption isotherms are most widely used to represent the equilibrium condition, hence
the adsorption capacity of an adsorbent. Adsorption isotherms can help determine the
adsorbent’s surface area, pore volume and pore size distribution, heat of adsorption and the
relative absorbability of different adsorbates on a particular adsorbent (Bansal and Goyal 2005,
Foo and Hameed 2010, Tzabar and ter Brake, H. J. M. 2016). Some of the most important and
commonly used adsorption isotherms models include the Langmuir, Freundlich, Dubinin-
Radushkevich and Brunauer-Emmett-Teller (BET) isotherm models. The first two isotherms are
important particularly for chemisorption, though they are useful in physisorption as well. The
BET and Dubinin-Radushkevich equations are mostly used for analyzing gas physisorption on
solid adsorbent such as activated carbon (Brunauer et al. 1938). Brunauer-Emmett-Teller (BET)
adsorption isotherm model is a theoretical model and refers to multi-layer adsorption on gas-
solid systems with relative pressures between 0.05 and 0.35 (Brunauer et al. 1938). BET model
assumes no interaction between each adsorption layer and Langmuir model can be applied to
each layer (Brunauer et al. 1938, Rouquerol 2014).
13
2.2 Adsorbent Types and Properties
Adsorption largely depends on the type and properties of the adsorbents. Several types of
adsorbents are used for VOCs adsorption and the process is affected by the adsorbents’ physical
properties (e.g. surface area, pore size distribution) and chemical properties (e.g. surface
functional groups, polarity etc.) (Bhatnagar 2013, Rouquerol 2014, Strazhesko and Barouch
1973). Adsorbents are mainly porous materials with high surface area, and available in many
forms including spherical pellets, rods, moldings, or monoliths (Bhatnagar 2013). Adsorbents
can be microporous, mesoporous, macroporous or combination of all, depending on their uses.
According to the classification of The International Union of Pure and Applied Chemistry
(IUPAC), the diameter of micropores are less than 2 nm, whereas the mesopores’ diameter
ranges between 2 to 50 nm, and macropores have diameter more than 50 nm (Che and Védrine
2012, Rouquerol 2014, Zhou 2007). Micropores and mesopores primarily contribute to the gas
phase adsorption, by improving adsorption kinetics (Che and Védrine 2012). Besides,
adsorbents’ surface functional groups such as oxygen, nitrogen, sulphur and other acidic and
basic functional groups also influence their adsorptive behavior (Riccardi et al. 2014, Zhang et
al. 2016). The most common industrial adsorbents used for gaseous adsorbates mainly fall into
two categories: non-carbonaceous (silica gel, activated alumina, zeolites and polymers) and
carbonaceous adsorbents (activated carbon, graphite, carbon molecular sieves etc.) (Rouquerol
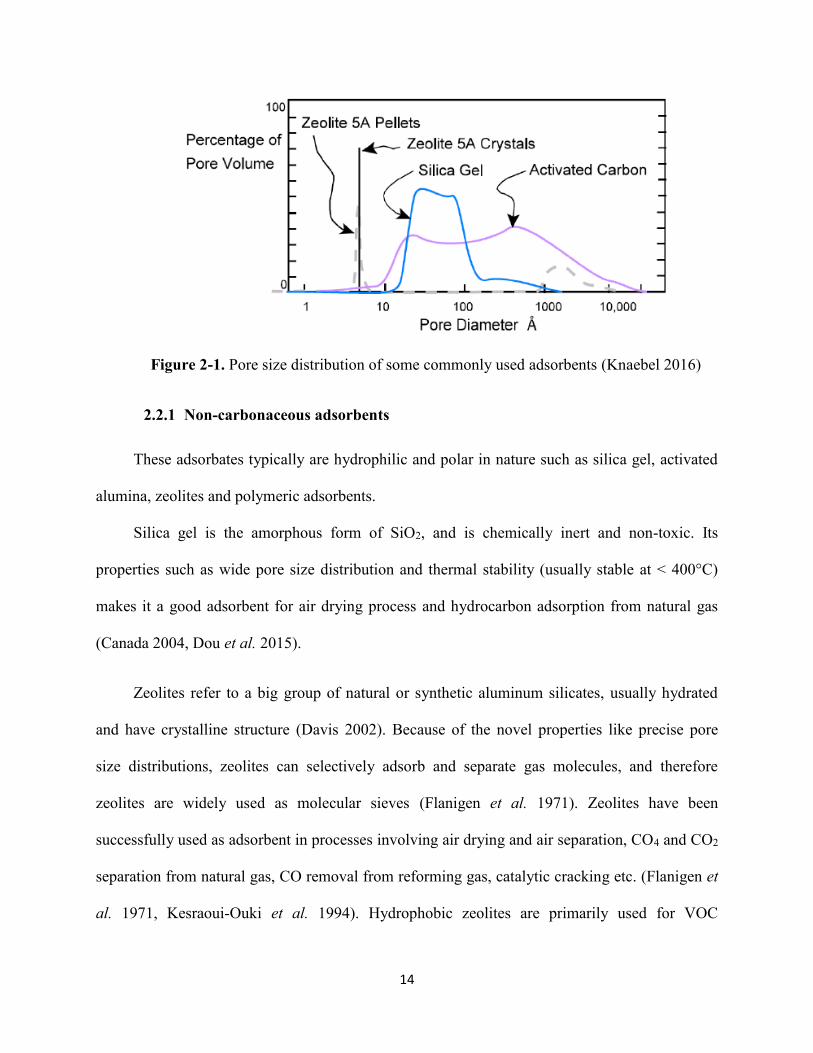
2014, Strazhesko and Barouch 1973), and are described in the following paragraph. Figure 2-1
shows the pore size distribution (PSD) of some common adsorbents used in industrial scale. It
shows that zeolites have very well defined PSD, whereas AC has a wide range of PSD.
14
Figure 2-1. Pore size distribution of some commonly used adsorbents (Knaebel 2016)
2.2.1 Non-carbonaceous adsorbents
These adsorbates typically are hydrophilic and polar in nature such as silica gel, activated
alumina, zeolites and polymeric adsorbents.
Silica gel is the amorphous form of SiO2, and is chemically inert and non-toxic. Its
properties such as wide pore size distribution and thermal stability (usually stable at < 400°C)
makes it a good adsorbent for air drying process and hydrocarbon adsorption from natural gas
(Canada 2004, Dou et al. 2015).
Zeolites refer to a big group of natural or synthetic aluminum silicates, usually hydrated
and have crystalline structure (Davis 2002). Because of the novel properties like precise pore
size distributions, zeolites can selectively adsorb and separate gas molecules, and therefore
zeolites are widely used as molecular sieves (Flanigen et al. 1971). Zeolites have been
successfully used as adsorbent in processes involving air drying and air separation, CO4 and CO2
separation from natural gas, CO removal from reforming gas, catalytic cracking etc. (Flanigen et
al. 1971, Kesraoui-Ouki et al. 1994). Hydrophobic zeolites are primarily used for VOC
15
capturing, and because of their good thermal stability and less flammability than other types of
adsorbents (such as AC) (Chung-Hwei Su et al. 2009).
Polymeric adsorbents have been emerging as an effective adsorbent due to their surface
area, mechanical strength, adjustable surface chemistry and pore size distribution, and feasible
regeneration under low temperature (Davankov and Tsyurupa 2011). Several applications of
polymeric adsorbents include adsorption of organic pollutants, namely phenolic compounds,
organic acids, aromatic and polyaromatic hydrocarbons, alkanes and their derivatives (Deosarkar
and Pangarkar 2004, Pan et al. 2009). Additional improvements like surface modification or
functionalization improved polymers’ performance towards adsorption of highly water-soluble
compounds and heavy metal ions, chlorinated pesticides and other poisonous compounds from
waste effluents and water supplies, therefore polymers are being used as highly efficient
adsorbents in water treatment and other pollution control applications (Garcia 1991, Hradil 2008,
Kunin 1977, Riccardi et al. 2014).
2.2.2 Carbonaceous Adsorbents
Carbon is a potential element of the periodic table for adsorption, since it can establish
bonds with almost any element, thus resulting in a wide spectrum of compounds. Carbon based
adsorbents are generally hydrophobic and non-polar in nature (Juan Carratalá-Abril et al. 2009).
The oldest and most widely used carbonaceous adsorbent is the activated carbon (AC), a
processed form of carbon with high porosity and surface area and amorphous solid structure
consisting of microcrystallites with a graphite lattice (Bansal and Goyal 2005, Kwiatkowski
2012). In recent time, a new generation of carbon structures built at the nanoscale (e.g.
nanofibers, nanotubes, fullerenes, graphene, graphene nanoribbons, nanodiamonds, etc.) have
16
also gained attraction due to their relatively large surface area, and novel electronic and chemical
properties, that can provide enhanced adsorption (Tascón 2012).
2.3 Activated Carbon
Activated carbon is the most significant carbonaceous adsorbent, due to its highly
developed wide range of porosity, large surface area (500 to 3000 m2/g), tailored physical (e.g.
pore size distribution and surface area) and chemical properties (e.g. surface groups), high
surface reactivity, and therefore ability to economically remove very low concentration
pollutants (Bansal and Goyal 2005, Kwiatkowski 2012, Rouquerol 2014). AC has proved to be a
versatile adsorbent, since it performs successfully in both liquid-phase and gas-phase adsorption
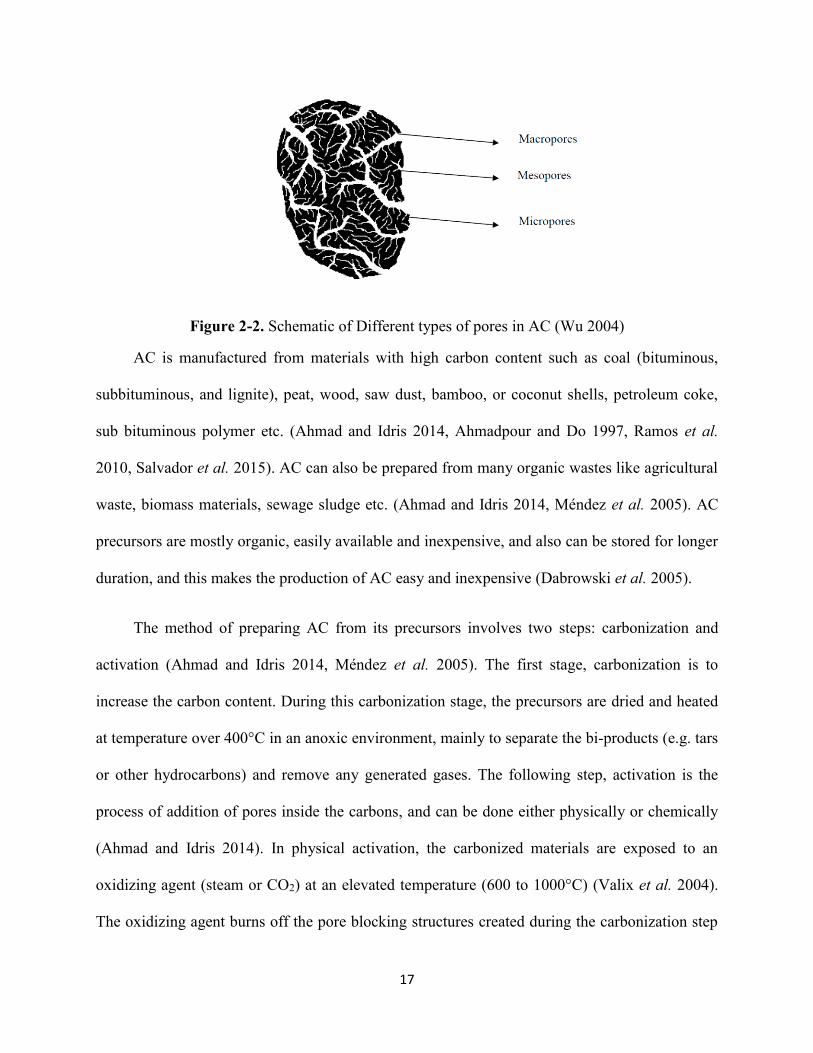
(Dabrowski et al. 2005, Juan Carratalá-Abril et al. 2009). The total number of pores, their shape
and size determine the adsorption capacity and adsorption rate of AC. A schematic of different
types of pores in AC is shown in Figure 2-2. The macropores act as transport pathways, through
which the adsorbate molecules travel to the mesopores, from where they finally enter the
micropores. The micropores usually constitute the largest proportion of the internal surface of the
AC and contribute most to the total pore volume (Kwiatkowski 2012). Most of the gaseous
adsorption occurs in the micropores, where the attractive forces are enhanced and the pores are
filled at low relative pressures. Thus, the total pore and micropore volume and the pore size
distribution determine the adsorption capacity.
17
Figure 2-2. Schematic of Different types of pores in AC (Wu 2004)
AC is manufactured from materials with high carbon content such as coal (bituminous,
subbituminous, and lignite), peat, wood, saw dust, bamboo, or coconut shells, petroleum coke,
sub bituminous polymer etc. (Ahmad and Idris 2014, Ahmadpour and Do 1997, Ramos et al.
2010, Salvador et al. 2015). AC can also be prepared from many organic wastes like agricultural
waste, biomass materials, sewage sludge etc. (Ahmad and Idris 2014, Méndez et al. 2005). AC
precursors are mostly organic, easily available and inexpensive, and also can be stored for longer
duration, and this makes the production of AC easy and inexpensive (Dabrowski et al. 2005).
The method of preparing AC from its precursors involves two steps: carbonization and
activation (Ahmad and Idris 2014, Méndez et al. 2005). The first stage, carbonization is to
increase the carbon content. During this carbonization stage, the precursors are dried and heated
at temperature over 400°C in an anoxic environment, mainly to separate the bi-products (e.g. tars
or other hydrocarbons) and remove any generated gases. The following step, activation is the
process of addition of pores inside the carbons, and can be done either physically or chemically
(Ahmad and Idris 2014). In physical activation, the carbonized materials are exposed to an
oxidizing agent (steam or CO2) at an elevated temperature (600 to 1000°C) (Valix et al. 2004).
The oxidizing agent burns off the pore blocking structures created during the carbonization step
18
and therefore, develop a porous, three-dimensional graphite lattice structure. The degree of
carbon burn-off depends on the gasification resulting from increased temperature and intensity of
the oxidizing atmosphere. The type and size of the pores developed during activation is a
function of the carbonization and gasification time, temperature and influence of the reactive gas
(Ahmad and Idris 2014, Bansal and Goyal 2005). Longer exposure times result in larger pore
sizes. For reactivation in CO2, higher burn-off from elevated temperature results in more
microporosity, whereas steam reactivation leads to wider pore size distribution and increased
mesoporosity (Zhang et al. 2004). In chemical activation, carbonization of the raw material and
activation is done simultaneously at lower temperatures (400 – 900°C). After impregnating with
a strongly reacting agent such as KOH, NaOH, ZnCl2, H3PO4, K2CO3, ammonia, or H2O2 etc.,
the precursor material is heated in an inert atmosphere (Ahmadpour and Do 1997, Wang and
Kaskel 2012). Temperature, chemical agent, and impregnation ratio affect the properties of the
activated material. Chemical activation helps to develop a desired pore size distribution more
easily and efficiently compared to physical activation (Ahmadpour and Do 1997).
2.3.1 Types of AC
Different types of activated carbon are available with different physical properties such as
pore size distributions, surface characteristics, and shapes (e.g., pelletized, granular, powdered,
spherical or beads, etc.). Figure 2-3 shows different forms and shapes of commercially available
AC. Based on the precursor material, activation method and conditions (e.g. temperature and
oxygen), and post-treatment reactions, AC has different porous structure and surface functional
groups. The most common forms of AC are the powdered and granular forms.
19
Figure 2-3. Different forms of activated carbon (a) powdered (b) granular (c) beaded (d) pelleted
(Bansal and Goyal 2005)
Powdered activated carbon (PAC) is traditionally made in particular form as powder or
fine granule of less than 1.0 mm in size with an average diameter between 0.15 and 0.25 mm.
Thus, it presents a large surface-to-volume ratio with a small diffusion distance. PAC is made up
of crushed or ground carbon particles, 95 to 100% of which will pass through a designated sieve.
According to ASTM classification, particle sizes corresponding to an 80-mesh sieve (0.177 mm)
and smaller are referred as PAC (Bansal and Goyal 2005, Kwiatkowski 2012). PAC provides
very effective adsorption due to its small particles, however, with slower settling and removal
process, for the same reasons.
(a) (b)
(c) (d)
20
Granular activated carbon (GAC) has a relatively larger particle size compared to PAC and
thus, possesses a smaller external surface per unit volume. Diffusion of the adsorbate is thus an
important concern. GAC is therefore preferred for gas and vapour phase adsorptions as their
rates of diffusion are faster than PAC. Granulated carbons are also used for water treatment,
deodorization and component separation in flow system (Bhatnagar 2013) and showed good
performance in removing large number of organic compounds (Dabrowski et al. 2005). GAC is
designated by sizes such as 8×20, 20×40, or 8×30 for liquid phase applications and 4×6, 4×8 or
4×10 for vapor phase applications (Bhatnagar 2013, Kwiatkowski 2012).
Recently, some novel types of AC such as beaded activated carbon (BAC), activated
carbon fiber cloth (ACFC), extruded activated carbon (EAC), impregnated and polymer coated
carbon are gaining attention because of their unique properties (Kwiatkowski 2012, Tascón
2012). BAC is prepared in spherical shape and has high void filling capability, flow-ability, high
strength and wear resistance and low ash content (Marsh and Rodríguez-Reinoso 2006). ACFC is
ash-free, and unlike BAC and PAC, it has continuous fiber structure providing it with higher
electrical conductivity compared to other forms of AC (Niknaddaf et al. 2016). Extruded
activated carbon (EAC) is combination of powdered activated carbon with a binder, fused
together and extruded into a cylindrical shaped activated carbon block, and has low pressure
drop, high mechanical strength and low ash content. Impregnated carbons are porous carbons
containing several inorganic impregnates, such as iodine and silver or cations such as Al, Mn,
Zn, Fe, Li, and Ca etc. Polymer coated carbons are porous carbon coated with a biocompatible
polymer in order to give a smooth and permeable coat without blocking the pores, and these
adsorbents are particularly useful in the field of medical treatment (Marsh and Rodríguez-
Reinoso 2006).
21
2.3.2 Activated Carbon Fiber Cloth
Activated carbon fiber cloth (ACFC) is a novel form of AC which is ash-free and has high
purity (Le Cloirec 2012). Compared to other commercial adsorbents such as GAC, alumina,
silica and zeolites, ACFC exhibits large surface area, high micropore volume and surface
reactivity, and therefore exhibits high adsorption capacity and faster adsorption kinetics
(Hashisho et al. 2009, Ramos et al. 2010, Yao et al. 2009). ACFC has showed good performance
as an alternative to conventional GAC in selective capture of VOCs (Le Cloirec 2012, Luo et al.
2006, Subrenat and Le Cloirec 2004). Some important properties of ACFC are discussed below:
2.3.2.1 Surface area and porosity: ACFC has a very high specific surface area (BET
surface) ranging from 900 to 2,300 m2/g (Le Cloirec 2012). ACFC is mainly microporous with a
micropore volume from 0.40 to 0.90 m3/g, which shows a microporosity of more than 90% of the
total porosity. Some experimental results show that, the internal micropores of ACFC are
directly connected to its external surface area, which provides a compact structure reducing the
mass and heat transfer limitations and pressure drop through ACFC (Luo et al. 2006, Subrenat
and Le Cloirec 2004). This provides faster adsorption/desorption of adsorbates through ACFC
and decreases fire potential inside the adsorption bed.
2.3.2.2 Chemical properties: ACFC’s structure is microcrystalline with an orientation of
graphitic layers less ordered than in graphite (Ramos et al. 2010). Elemental analysis on ACFC
showed high purity carbonaceous content with more than 99% carbon and hydrogen trace
amount of oxygen, nitrogen and other acidic or basic surface functional group. This high purity
of ACFC makes it a promising adsorbent in air and water treatment and purification applications
(Le Cloirec 2012).
22
2.3.2.3 Electrical and thermal properties: The most unique property of ACFC compared to
other adsorbents is its high electrical conductivity. Because of its crystalline structure (graphene),
ACFC exhibits low resistance when an electrical current is passed through it, and is heated up.
Therefore, ACFC can be regenerated by applying an electrical current and heating it up by
Joule’s heating (Johnsen et al. 2014, Son et al. 2016). ACFC has successfully captured industrial
solvents and recovered them using electrothermal regeneration. ACFC also performed well in
capturing VOCs at indoor level, which typically has low VOC concentration (Yao et al. 2009).
VOCs with highly fluctuating concentrations were adsorbed by ACFC and successfully
transformed into more well-defined concentrations with select gas velocities, which enabled the
organic vapour to be further processed by biofilters or oxidizers (Emamipour et al. 2007a,
Nabatilan et al. 2010).
2.3.2.4 ACFC precursors: ACFC can be prepared from several synthetic raw material
precursors including pitch, asfran, PAN, rayon (viscose), cellulose etc. (Kawashima et al. 2000,
Subrenat and Le Cloirec 2004). The surface functional groups and pore size distribution depends
on the precursor material. The ACFC tested in this research was made from novoloid (phenolic)
precursor produced by American Kynol. The preparation steps involve producing the novoloid
fibers from novolak resin by melt spinning process, where the fiber polymer is heated and melt
into a form suitable for extrusion. After that, the melt-spun fiber is cured with an acidic solution
of formaldehyde and acid-catalyzed cross-linking of melt-spun novolak resin is done to form a
fully cross-linked, three-dimensional, amorphous network polymer structure of novoloid fibers.
Finally, one-step carbonisation and activation is done to form novoloid-based ACFC (Niknaddaf
2015). Figure 2-4 shows ACFC from macro to micro scale. The structural properties of ACFC
mainly depend on the residence time in the production oven. These structural properties have a
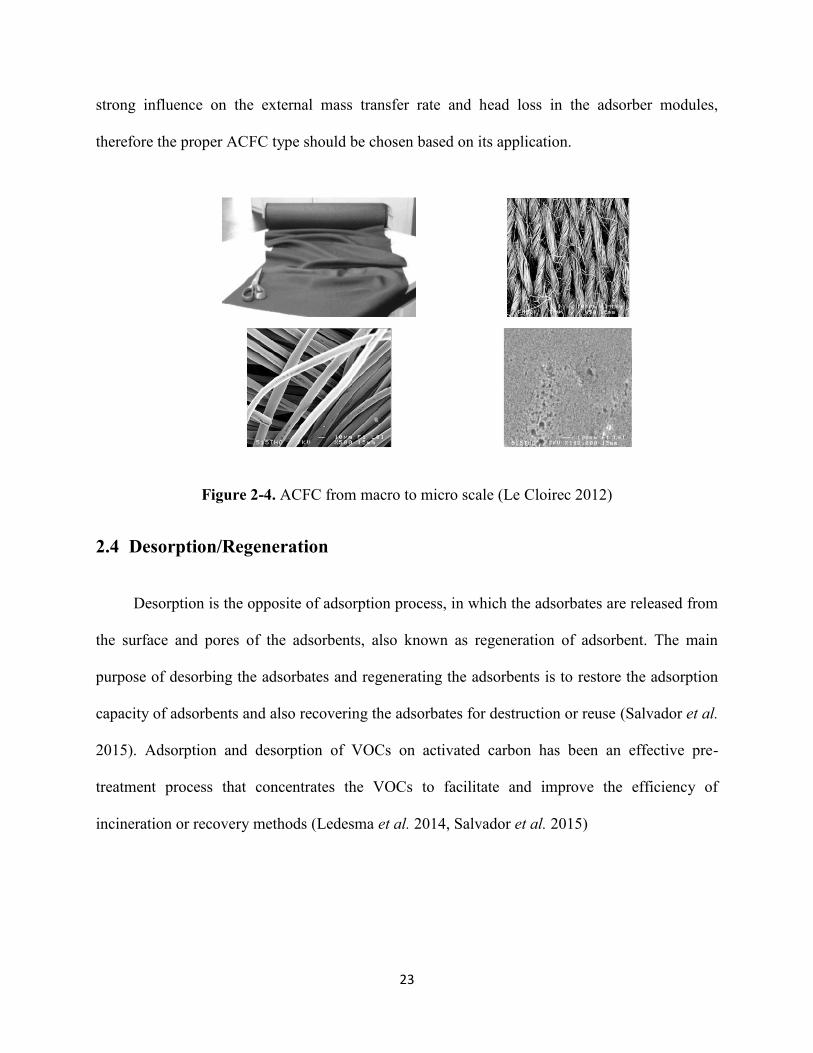
23
strong influence on the external mass transfer rate and head loss in the adsorber modules,
therefore the proper ACFC type should be chosen based on its application.
Figure 2-4. ACFC from macro to micro scale (Le Cloirec 2012)
2.4 Desorption/Regeneration
Desorption is the opposite of adsorption process, in which the adsorbates are released from
the surface and pores of the adsorbents, also known as regeneration of adsorbent. The main
purpose of desorbing the adsorbates and regenerating the adsorbents is to restore the adsorption
capacity of adsorbents and also recovering the adsorbates for destruction or reuse (Salvador et al.
2015). Adsorption and desorption of VOCs on activated carbon has been an effective pre-
treatment process that concentrates the VOCs to facilitate and improve the efficiency of
incineration or recovery methods (Ledesma et al. 2014, Salvador et al. 2015)
24
2.4.1 Methods of Regeneration
Regeneration can be classified based on the type of regeneration mechanism and the type
of regeneration agents used. There are different pathways through which regeneration may
proceed. In some AC regeneration methods, the adsorption equilibrium is shifted toward
desorption by applying heat (Ledesma et al. 2014), decreasing pressure or applying vacuum
(Ruthven et al. 1994), varying pH of the system (Leng and Pinto 1996), or changing the medium
surrounding the AC to a fluid that efficiently extracts the adsorbate (McLaughlin 1995). Other
desorption mechanism, such as gasification involves removing the adsorbates by converting it
into more easily removable products through chemical reactions or degradation processes.
Regeneration of AC adsorbents may also involve the use of different regeneration agents
such as inert chemical species (inert gases like N2) (Ruhl 2000), oxidizing agents (O2, CO2,
ozone) (Álvarez et al. 2004), chemical reagents (Ince and Apikyan 2000), solvents (organic
solvents, supercritical solvents) (McLaughlin 1995), electrical current (Niknaddaf et al. 2016),
microwaves (Hashisho et al. 2008), microorganisms (Scholz and Martin 1998), catalysts
(Sheintuch and Matatov-Meytal 1999), ultraviolet light etc. (Ince and Apikyan 2000).
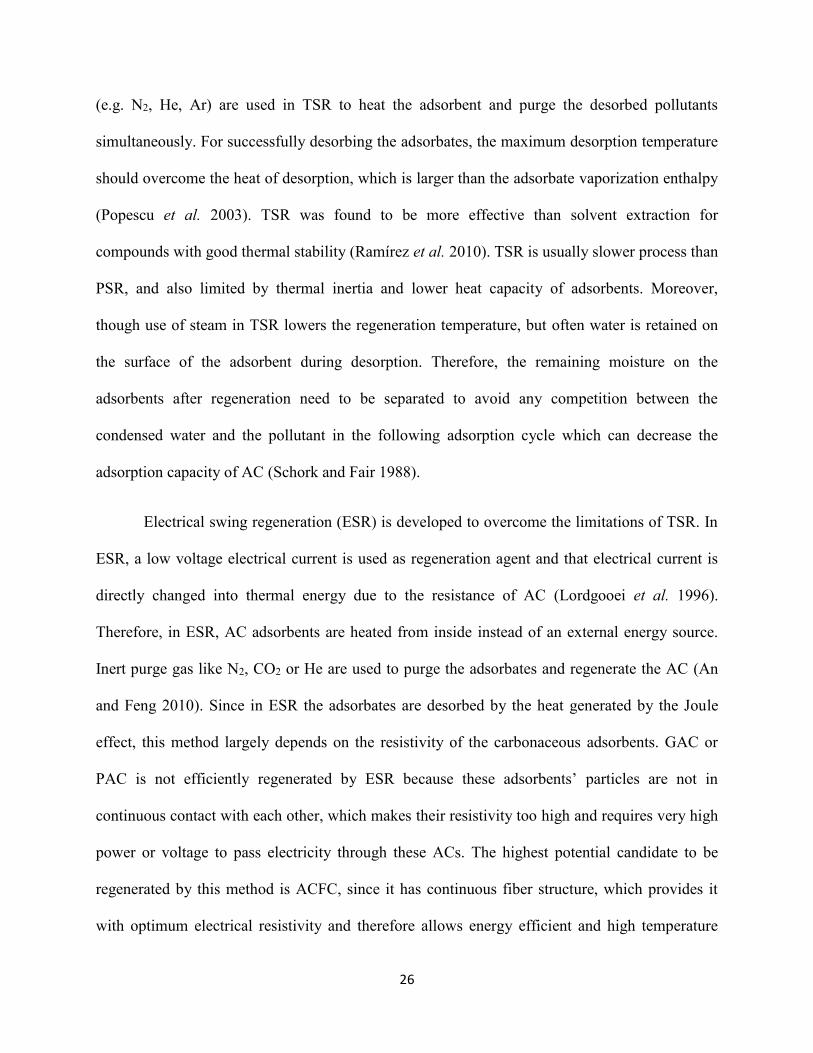
Therefore, some AC regeneration methods use the same regeneration agent but different
regeneration mechanisms (i.e., regeneration with supercritical CO2 and gasification with CO2
utilize the same regeneration agent but different mechanisms for regenerating the ACs) and vice
versa (i.e., temperature swing adsorption (TSA), steaming and electrothermal swing adsorption
(ESA) all use thermal regeneration mechanism, but different regeneration agents). Figure 2-5
shows the general classification of regeneration based on both the regeneration mechanism and
the regeneration agents used for desorption of the adsorbates.
25
Figure 2-5. Classification of methods used for regenerating activated carbon adsorbents
(Salvador et al. 2015)
In pressure swing regeneration (PSR) or vacuum regeneration, adsorbates are desorbed
by reducing the total pressure of an adsorbent bed and by applying vacuum. Though PSR is a fast
process, it is limited by mass transfer and fluidization limitations, therefore smaller beds are
recommended for this method. Moreover, this is a lossy process since the gas trapped in
adsorbent’s pores and voids are lost during blowdown and purging (Ruthven et al. 1994,
Shonnard and Hiew 2000).
Thermal Regeneration is the process of heating the saturated AC to provide the amount of
energy necessary to remove the retained adsorbate. In this method, sufficient amount of thermal
energy is provided to break the adsorbent–adsorbate interactions across all the adsorption sites
without degrading the adsorbates (Ledesma et al. 2014). Based on the source of the heat applied,
thermal regeneration can be classified into temperature swing regeneration (TSR), electrical
swing regeneration (ESR) and microwave regeneration.
In temperature swing regeneration (TSR), the adsorbent bed temperature is increased by
using hot gas or heating jackets, coils, furnaces etc. (Suzuki et al. 1978). Steam or hot inert gases
26
(e.g. N2, He, Ar) are used in TSR to heat the adsorbent and purge the desorbed pollutants
simultaneously. For successfully desorbing the adsorbates, the maximum desorption temperature
should overcome the heat of desorption, which is larger than the adsorbate vaporization enthalpy
(Popescu et al. 2003). TSR was found to be more effective than solvent extraction for
compounds with good thermal stability (Ramírez et al. 2010). TSR is usually slower process than
PSR, and also limited by thermal inertia and lower heat capacity of adsorbents. Moreover,
though use of steam in TSR lowers the regeneration temperature, but often water is retained on
the surface of the adsorbent during desorption. Therefore, the remaining moisture on the
adsorbents after regeneration need to be separated to avoid any competition between the
condensed water and the pollutant in the following adsorption cycle which can decrease the
adsorption capacity of AC (Schork and Fair 1988).
Electrical swing regeneration (ESR) is developed to overcome the limitations of TSR. In
ESR, a low voltage electrical current is used as regeneration agent and that electrical current is
directly changed into thermal energy due to the resistance of AC (Lordgooei et al. 1996).
Therefore, in ESR, AC adsorbents are heated from inside instead of an external energy source.
Inert purge gas like N2, CO2 or He are used to purge the adsorbates and regenerate the AC (An
and Feng 2010). Since in ESR the adsorbates are desorbed by the heat generated by the Joule
effect, this method largely depends on the resistivity of the carbonaceous adsorbents. GAC or
PAC is not efficiently regenerated by ESR because these adsorbents’ particles are not in
continuous contact with each other, which makes their resistivity too high and requires very high
power or voltage to pass electricity through these ACs. The highest potential candidate to be
regenerated by this method is ACFC, since it has continuous fiber structure, which provides it
with optimum electrical resistivity and therefore allows energy efficient and high temperature
27
regeneration (Niknaddaf et al. 2016). ESA is a more efficient regeneration method than the
other TSR techniques mainly due to its higher heating rate and lower carrier gas consumption
(An and Feng 2010, Mallouk et al. 2010). Since the thermal energy is directly delivered to the
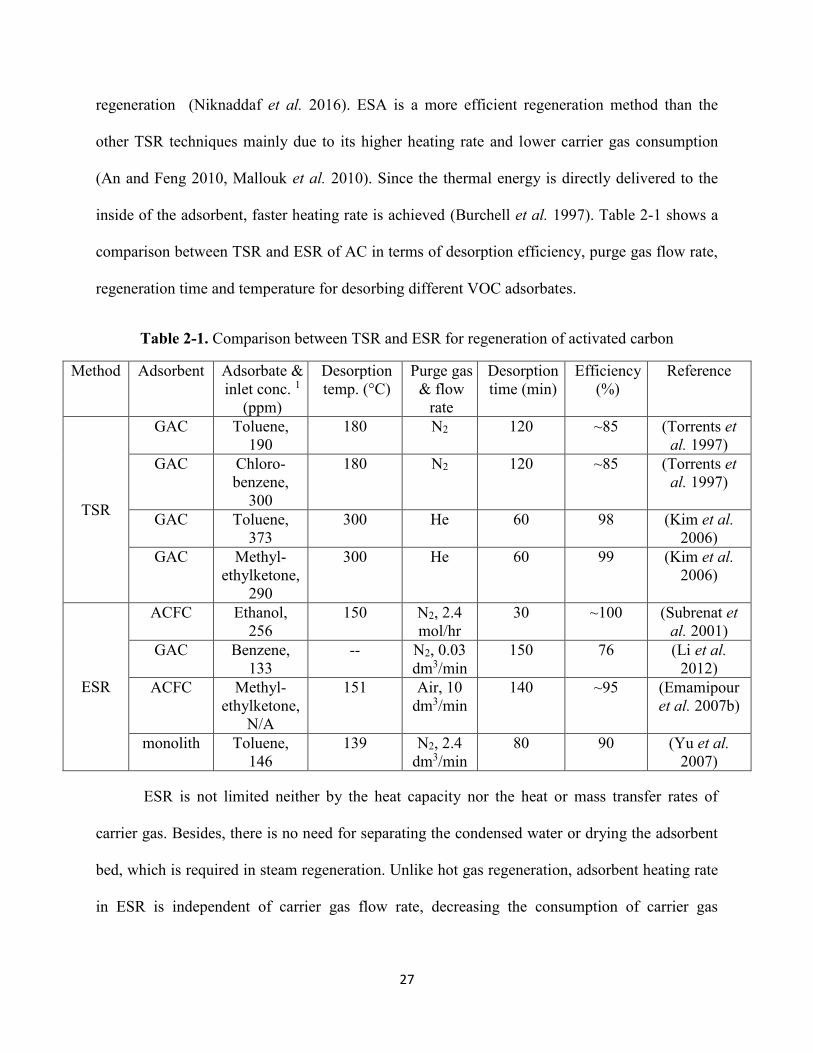
inside of the adsorbent, faster heating rate is achieved (Burchell et al. 1997). Table 2-1 shows a
comparison between TSR and ESR of AC in terms of desorption efficiency, purge gas flow rate,
regeneration time and temperature for desorbing different VOC adsorbates.
Table 2-1. Comparison between TSR and ESR for regeneration of activated carbon
Method Adsorbent Adsorbate &
inlet conc. 1
(ppm)
Desorption
temp. (°C)
Purge gas
& flow
rate
Desorption
time (min)
Efficiency
(%)
Reference
TSR
GAC Toluene,
190
180 N2 120 ~85 (Torrents et
al. 1997)
GAC Chloro-
benzene,
300
180 N2 120 ~85 (Torrents et
al. 1997)
GAC Toluene,
373
300 He 60 98 (Kim et al.
2006)
GAC Methyl-
ethylketone,
290
300 He 60 99 (Kim et al.
2006)
ESR
ACFC Ethanol,
256
150 N2, 2.4
mol/hr
30 ~100 (Subrenat et
al. 2001)
GAC Benzene,
133
-- N2, 0.03
dm3/min
150 76 (Li et al.
2012)
ACFC Methyl-
ethylketone,
N/A
151 Air, 10
dm3/min
140 ~95 (Emamipour
et al. 2007b)
monolith Toluene,
146
139 N2, 2.4
dm3/min
80 90 (Yu et al.
2007)
ESR is not limited neither by the heat capacity nor the heat or mass transfer rates of
carrier gas. Besides, there is no need for separating the condensed water or drying the adsorbent
bed, which is required in steam regeneration. Unlike hot gas regeneration, adsorbent heating rate
in ESR is independent of carrier gas flow rate, decreasing the consumption of carrier gas
28
consumption. This allows obtaining higher concentration of desorbed adsorbates and successful
adsorbate recovery from ESR (Ramirez et al. 2011, Sullivan et al. 2004).
Recently, microwave heating has emerged as an alternative AC regeneration technique
which provides high regeneration efficiencies with lower energy consumption (Cherbański et al.
2011, Hashisho et al. 2005). Microwave desorption was applied as a rapid regeneration method
to desorb organic compounds like phenol from AC without destructing the porous structure of
the adsorbent (Ania et al. 2004). However, microwave regeneration largely depends on the
properties of adsorbents and adsorbates (Reuss et al. 2002).
2.4.2 Factors Affecting Desorption Behaviour of Activated Carbon
The desorption of VOCs from AC is affected by the form, nature of pores, surface
functional groups (Jahandar Lashaki et al. 2016a) and surface reactivity of the adsorbents
(Boulinguiez and Le Cloirec 2010, Yapsaklı et al. 2009). PAC has higher diffusivity and showed
faster desorption kinetics, but higher tendency of irreversible adsorption (Akta and Çeçen 2006).
Lower catalytic activity, uniformity in pore structure and adsorption site distribution in AC lead
to better desorption of adsorbates (Rudling and Björkholm 1987). Mesoporous adsorbents show
low temperature desorption while higher temperature is required to desorb adsorbates from
microporous adsorbents (Boulinguiez and Le Cloirec 2010).
Moreover, the desorption isotherm and overall adsorption reversibility also depends on the
adsorbates’ concentration, as well as different physical and chemical properties of the adsorbates
(Fletcher et al. 2006, Suzuki et al. 1978). Different operational conditions such as desorption
temperature (Lashaki et al. 2012b, Wang et al. 2012), carrier gas flow rate and its oxygen
29
content (Jahandar Lashaki et al. 2016b), heating rate (Fayaz<i> et al.</i> 2015) etc. may affect
the desorption of VOCs from AC.
2.5 Irreversible Adsorption
Irreversible adsorption is the unwanted accumulation of adsorbates on the adsorbents’
surface or pores after desorption of adsorbates (Jahandar Lashaki et al. 2016b). This
phenomenon is also known as heel formation. Irreversible adsorption can be visible as a
hysteresis loop in an adsorption-desorption isotherm (Okazaki 1996). Irreversibly adsorbed
adsorbates on carbon are very hard to remove with a selected regeneration technique (Lashaki et
al. 2012b). Heel formation is a challenge in using activated carbon for VOC adsorption because
heel decreases the adsorbent’s capacity and lifespan, which largely increase the operation and
maintenance costs. Although many of the previous research on AC adsorption provide
information on irreversible adsorption of VOCs from aqueous solutions, but similar studies in
gas phase are limited. Both the aqueous phase and gas phase irreversible adsorption have been
reviewed due to similarity in adsorption fundamentals among both the phases.
2.5.1 Mechanisms of Irreversible Adsorption
Irreversible adsorption can result from mainly three types of scenarios. a) chemisorption or
chemical bonding between species, which leads to strong interactions between adsorbent and
adsorbate, b) oligomerization or oxidative coupling of adsorbate molecules inside the narrow
pores of AC, 3) decomposition of adsorbates during desorption resulting in coke formation inside
the pores of AC adsorbent. The different phenomena of irreversible adsorption are described in
detail below:
30
Chemisorption is due to chemical bonding (e.g. covalent bond) between the adsorbents and
adsorbates (Aktaş and Çeçen 2007, Khan and Kr. Ghoshal 2000). Therefore, chemisorption
produces very high heat of adsorption (up to 400 kJ/mol), approaching the energy of chemical
bonds. Gaseous or liquid adsorbates interact with the carbon’s surface or with the surface
functional group forming chemical bonds. Unlike physisorption, chemisorption does not rely on
carbon’s accessible pore volumes, rather bonds are formed between the active sites and
adsorbates, therefore only monolayer is formed during chemisorption (Langmuir 1916). To break
this kind of chemical bonds, high temperature or huge pressure reduction is often required which
increases the operational cost of the system. Example of chemisorption includes removal of trace
contaminants such as mercury removal via surface functionalized ACs (Liu<i> et al.</i> 1998)
and chlorine removal (Tobias and Soffer 1985). Loss of adsorption sites due to irreversible
chemisorbed species significantly reduces the adsorbent’s lifetime in successive adsorption
desorption cycles.
Oxidative coupling or oligomerization is the polymerization of organic adsorbates in
presence of oxygen (Brenner 1993, Suidan 1991). Oligomerization enhances reaction between
the adsorbates and AC, causing formation of higher molecular weight/boiling point compounds
that are difficult to desorb due to their large size. Several studies have reported that irreversible
adsorption occurred for aqueous phenolic compounds due to oxidative coupling (Brenner 1993,
Vidic et al. 1997). In oxidative coupling, a phenol molecule loses one hydrogen atom and is
converted into a phenoxy radical that oligomerize with other phenoxy radicals. The
oligomerization reaction can take place even at room temperature inside the carbon pores which
works as an oxidation catalyst (Vidic et al. 1997).
31
Decomposition of organic adsorbates may occur during high temperature (above 300°C)
regeneration of AC (Brandt and Donahue 2009). Adsorbate decomposition results in formation
of coke (carbonaceous specious) inside the pores of AC, which blocks the micropores and
subsequently decreases the adsorption capacity of AC (Ania et al. 2004, Niknaddaf et al. 2016).
Decomposition of adsorbates are mainly attributed to different regeneration conditions
(temperature, heating rate etc.) as well as the properties of the adsorbates (Wang et al. 2012).
Previous study on adsorbate decomposition in high temperature thermal regeneration shows that,
the adsorbed phenols decomposed into coke and remained inside the AC pores even at
temperatures as high as 800°C during thermogravimetric analysis (Suzuki et al. 1978). Steam
regeneration at temperatures > 600oC can create oxidizing environment and remove some of the
carbon deposits from the adsorbents (Liu et al. 1987), but this adds to the system operational
cost. Moreover, during cyclic adsorption/desorption, coke formation causes significant reduction
in the adsorption performance and lifetime of carbonaceous adsorbents (Niknaddaf et al. 2016).
2.5.2 Effects of Adsorption Conditions on Irreversible Adsorption
Irreversible adsorption is affected by various adsorption conditions including presence of
dissolved oxygen (DO) during adsorption, adsorption temperatures and duration of adsorption.
AC’s adsorption capacity for aqueous phase is increased by DO, which enhances oxidative
coupling, but consequently irreversible adsorption also increases. Regeneration efficiency of
adsorbent during solvent extraction decreased due to oligomerization of phenols under oxic
conditions (Vidic et al. 1997).
Adsorption temperature also affects irreversible adsorption, since high temperature
enhances polymerization and chemisorption, which caused irreversible adsorption (Nakhla et al.
32
1994). Effect of adsorption temperature on irreversible adsorption of gas phase VOCs were
investigated and results show that a 10 to 15°C increase in temperature from room temperature
(25°C) caused 30% increase of irreversible adsorption on BAC caused by chemisorption
(Lashaki et al. 2012b). The duration of adsorption is important since increased irreversible
adsorption has been reported in aqueous phase for longer adsorption period (Grant and King
1990). Gas phase irreversible adsorption was investigated for multi-component VOC adsorbate
stream (Wang et al. 2012). Smaller and lower boiling point compounds were adsorbed quickly,
whereas longer adsorption time passing breakthrough promoted adsorption of heavier and higher
boiling point compounds (Wang et al. 2012). As heavier compounds tend to accumulate more on
the AC surface, irreversible adsorption increases with increase in adsorption time (Wang et al.
2012).
2.5.3 Effects of Regeneration Conditions on Irreversible Adsorption
Several regeneration conditions including regeneration environment, regeneration
temperature and heating rate, and desorption purge gas flow rate affect irreversible adsorption.
For aqueous phase phenol desorption from AC, high temperature regeneration in oxidizing
environment (CO2) achieved > 90% efficiency (with 15% carbon burn off), whereas regeneration
in an inert environment (N2) could only recover < 50% of the initial adsorption capacity of the
spent AC (Álvarez et al. 2004).
In conductive heating regeneration of BAC loaded with mixture of VOC adsorbates,
increasing regeneration temperature from 288 to 400°C facilitated VOC desorption from narrow
micropores and therefore decreased heel formation by 61% (Lashaki et al. 2012b). But in case of
electrothermal regeneration of ACFC loaded with trimethylbenzene (TMB), higher heel was
observed in samples regenerated at 400 °C than samples regenerated at 288°C (Niknaddaf et al.
33
2016). Enhancement of endothermic decomposition of TMB due to high temperature exposure
caused higher heel formation on microporous ACFC (Niknaddaf et al. 2016).
Effects of regeneration heating rate on irreversible adsorption of VOCs typically emitted
from automotive painting operations was investigated (Fayaz et al. 2015b) for two BACs with
different microporosity. For higher regeneration temperature (400°C), higher heating rate
increased heel build up by 92% in mainly microporous (88% microporosity) BAC and by 169%
in partially microporous (46% microporosity) BAC. In contrary, lower regeneration temperature
(288°C) showed no significant effect on heel build up, since there was < 16% and < 10%
increase for the mainly microporous and partially microporous BACs, respectively (Fayaz et al.
2015b). Therefore, high regeneration temperature and high heating rate both can contribute to
adsorbate decomposition, which leads to coke formation inside the carbon pores resulting in
irreversible adsorption.
Regeneration purge gas constituent and flow rate can affect irreversible adsorption.
(Jahandar Lashaki et al. 2016b) investigated the effect of desorption purge gas oxygen content
on irreversible adsorption of mixtures of organic compounds on BAC. Results show 35%
increase in heel formation when oxygen content increased from 5 ppm to 10,000 ppm in
desorption purge gas, which is mainly attributed to the chemisorption of the VOCs.
Low purge gas flow may cause high adsorbate concentration inside carbon pores,
particularly for highly microporous carbons such as ACFC. Exposure of high concentration
adsorbates into high regeneration temperature may cause adsorbate decomposition and therefore
coke formation (Niknaddaf et al. 2016).
34
2.5.4 Effects of Adsorbent Properties on Irreversible Adsorption
Adsorbents’ pore size distributions and surface functional groups (SFGs) are the major
contributors affecting reversibility of adsorption (Li et al. 2011). Adsorbents’ narrow pore size
distribution hindered oligomerization of phenolic compounds and therefore decreased
irreversible adsorption (Yan and Sorial 2011). Contradictions were also found where adsorbents’
narrow pore size increased irreversible adsorption by enhancing adsorption energy (Wang et al.
2009). Five types of commercially available BAC with similar elemental composition but
different PSDs (30 to 88% microporous) were investigated for irreversible adsorption of organic
vapours (Lashaki et al. 2016). Linear correlation was observed between the amount of heel and
micropore volume of BAC, which confirmed the high energy micropores contributing more to
heel formation.
The impact of surface functional groups on the irreversible adsorption of aqueous phase
phenolic compounds was investigated in previous studies (Vidic et al. 1997). AC containing
carboxylic groups exhibited lower tendency of forming oligomers (Terzyk 2007). In contrast,
oligomerization can be enhanced by saturated SFGs such as methyl, ethyl, methoxy etc. (Yonge
et al. 1985). For gas phase adsorption, effect of surface oxygen groups was investigated for heel
formation in cyclic adsorption/regeneration of VOCs on BAC (Jahandar Lashaki et al. 2016a).
The tested BACs were chemically tailored in three different ways, two were oxygen deficient
(treated with heat and hydrogen respectively) and another was oxygen-rich (treated with nitric
acid). Compared to heat-treated BAC, both hydrogen and acid treated samples showed higher
heel. Oxygen functionalised BAC promoted chemisorption of adsorbates whereas physisorption
was the main heel formation mechanism for oxygen-deficient BACs.
35
2.5.5 Effects of Adsorbate Properties on Irreversible Adsorption
Several properties of an organic adsorbate including molecular weight, kinetic diameter,
boiling point, functional groups and thermal stability influence its irreversible adsorption on
carbon adsorbents. Phenols have clearly showed irreversible adsorption in aqueous phase
(Suzuki et al. 1978). Adsorbates’ critical oxidation potential (COP), that is the amount of energy
required to add or remove electron to or from an element or compound, largely controls the
potential of oxidative coupling on AC and consequent heel formation. Therefore, adsorbates with
electron donating group (methyl, ethyl etc.) reduce COP and increase irreversible adsorption. In
contrast, electron withdrawing groups (e.g. nitro, chloro etc.) can increase the COP and hinder
dehydrogenation of adsorbates, which minimizes irreversible adsorption (Grant and King 1990).
Aqueous phase adsorption of both electron donating and electron attracting compounds on AC
were compared and results showed irreversible adsorption in presence of electron-donating
groups (e.g. -NH2 and -OH), while electron-attracting groups (e.g. -NO2) adsorbed reversibly
(Tamon et al. 1990). In gas phase adsorption, higher molecular weight and higher boiling point
compounds tend to form higher heel on BAC (Wang et al. 2012) To best knowledge of the
author, effect of VOC adsorbate properties has not yet investigated for electrothermal
regeneration of microporous adsorbent ACFC.
36
CHAPTER 3. MATERIALS AND METHODS
This chapter provides the detail of the materials i. e. the adsorbents and adsorbates used, the
experimental setup and the methods used to fulfill the objectives of this research work.
3.1 Materials
3.1.1 Adsorbent
The adsorbent used in this research was activated carbon fiber cloth prepared from phenol-
formaldehyde resin precursor, supplied by Nippon Kynol Company. ACC-5092-15 (ACFC15
with nominal surface area of 1500 m2/g) was used as adsorbent in all experiments. Prior to use,
all ACFCs underwent 2 h of heat treatment at 400°C with a purge gas flow of 1 SLPM N2, to
remove any adsorbed water vapour and VOCs from the precursor. These treated samples are
labelled as “heat treated ACFC” and characterized by Brunauer–Emmett–Teller (BET) surface
area of 1503 m2/g, total pore volume of 0.59 cm3/g and micropore volume of 0.55 cm3/g, and
average pore diameter of 7.0 Å. The detail procedure of measuring the BET surface area and the
pore volume and micropore volume are provided in the Methods section.
3.1.2 Adsorbates
The adsorbates were selected from compounds commonly present in automotive paint
solvents, and based on their expected tendency for heel formation. Larger kinetic diameter and
high boiling point adsorbates with benzene ring are associated with heel formation (Wang et al.
2012), therefore alkylbenzenes with relatively high boiling point (>100°C) and large kinetic
diameter (>5 Å) were chosen as adsorbates. Since previous study (Niknaddaf et al. 2016) on heel
formation on ACFC during electrothermal regneration showed that adsorbate decomposition at
37
high temperature results in heel formation on ACFCs, therefore the thermal stability of the
adsorbates is another important property that affect heel formation during electrothermal
regeneration of ACFCs. Thermal stability of the adsorbates was estimated from the conversion
rates (weight percentages) of the tested adsorbates during pyrolysis at 595°C (Švob et al. 1974).
The ACFC was tested with nine different alkylbenzenes as adsorbates: toluene (99.8%, Fisher
Scientific) ethylbenzene (>95%, Fisher Scientific), p-xylene (>95%, Fisher Scientific), m-xylene
(>95%, Fisher Scientific), o-xylene (>95%, Fisher Scientific), isopropylbenzene (98%, Sigma
Aldrich) 1,3,5 trimethylbenzene (TMB) (99%, Acros Organics), 1,2,4 TMB (98%, Fisher
Scientific) and neopentylbenzene (85%, ChemSampCo). Different properties of the tested
adsorbates are provided in Table 3-1.
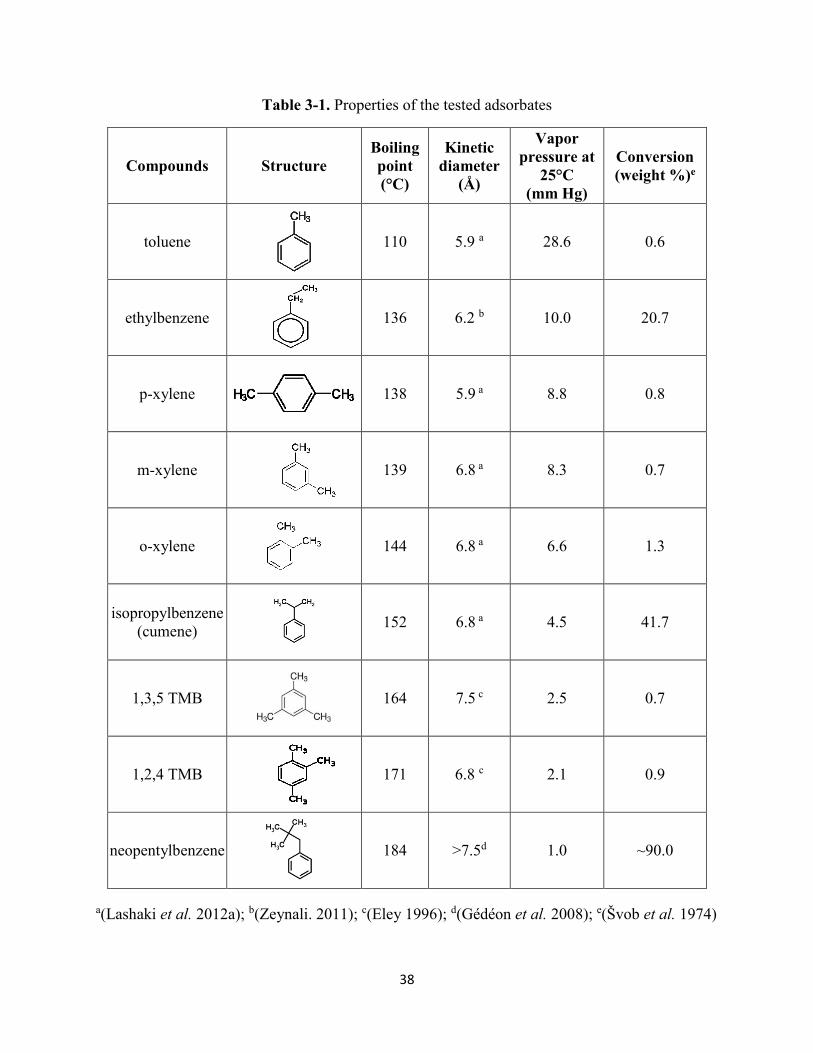
38
Table 3-1. Properties of the tested adsorbates
Compounds Structure
Boiling
point
(°C)
Kinetic
diameter
(Å)
Vapor
pressure at
25°C
(mm Hg)
Conversion
(weight %)e
toluene
110 5.9 a 28.6 0.6
ethylbenzene
136 6.2 b 10.0 20.7
p-xylene
138 5.9 a 8.8 0.8
m-xylene
139 6.8 a 8.3 0.7
o-xylene
144 6.8 a 6.6 1.3
isopropylbenzene
(cumene)
152 6.8 a 4.5 41.7
1,3,5 TMB
164 7.5 c 2.5 0.7
1,2,4 TMB
171 6.8 c 2.1 0.9
neopentylbenzene
184 >7.5d 1.0 ~90.0
a(Lashaki et al. 2012a); b(Zeynali. 2011); c(Eley 1996); d(Gédéon et al. 2008); e(Švob et al. 1974)
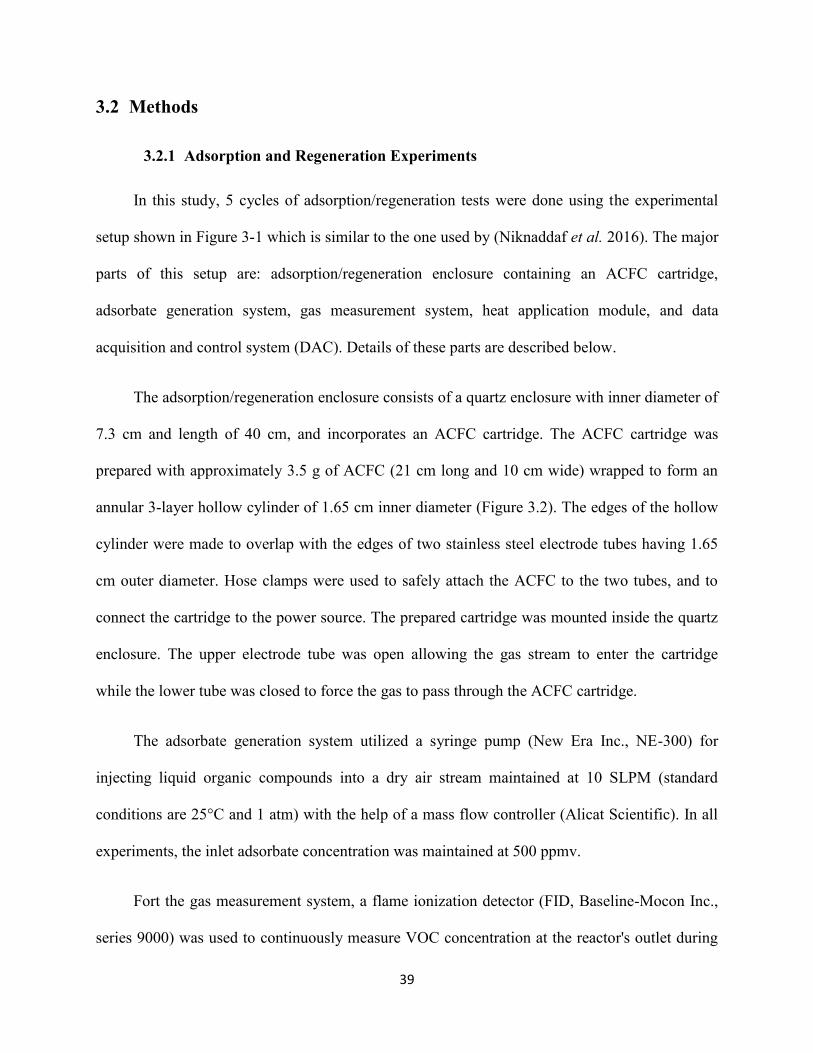
39
3.2 Methods
3.2.1 Adsorption and Regeneration Experiments
In this study, 5 cycles of adsorption/regeneration tests were done using the experimental
setup shown in Figure 3-1 which is similar to the one used by (Niknaddaf et al. 2016). The major
parts of this setup are: adsorption/regeneration enclosure containing an ACFC cartridge,
adsorbate generation system, gas measurement system, heat application module, and data
acquisition and control system (DAC). Details of these parts are described below.
The adsorption/regeneration enclosure consists of a quartz enclosure with inner diameter of
7.3 cm and length of 40 cm, and incorporates an ACFC cartridge. The ACFC cartridge was
prepared with approximately 3.5 g of ACFC (21 cm long and 10 cm wide) wrapped to form an
annular 3-layer hollow cylinder of 1.65 cm inner diameter (Figure 3.2). The edges of the hollow
cylinder were made to overlap with the edges of two stainless steel electrode tubes having 1.65
cm outer diameter. Hose clamps were used to safely attach the ACFC to the two tubes, and to
connect the cartridge to the power source. The prepared cartridge was mounted inside the quartz
enclosure. The upper electrode tube was open allowing the gas stream to enter the cartridge
while the lower tube was closed to force the gas to pass through the ACFC cartridge.
The adsorbate generation system utilized a syringe pump (New Era Inc., NE-300) for
injecting liquid organic compounds into a dry air stream maintained at 10 SLPM (standard
conditions are 25°C and 1 atm) with the help of a mass flow controller (Alicat Scientific). In all
experiments, the inlet adsorbate concentration was maintained at 500 ppmv.
Fort the gas measurement system, a flame ionization detector (FID, Baseline-Mocon Inc.,
series 9000) was used to continuously measure VOC concentration at the reactor's outlet during

40
adsorption (2 min sampling frequency). The FID was calibrated before each adsorption test using
the same gas generation system and with a bypass line.
The heat application module was used for adsorbent regeneration and includes a silicon-
controlled rectifier (SCR) (1032A-v12-20-0/10v-IL-20-amp maximum with a 0-10-volt control
signal) to apply voltage across the ACFC cartridge. One type-K ungrounded thermocouple
(Omega) with an outer diameter of 1.6 mm was used to measure the temperature at the center of
the ACFC cartridge during adsorption and regeneration.
The data acquisition and control system (DAC) has a data logger (National Instruments,
Compact DAQ) with analog input/output modules. A LabVIEW program (National Instruments)
recorded the enclosure’s outlet concentration, cartridge temperature and the power applied by the
SCR. A proportional-integral derivative control algorithm controlled the power applied to heat
the cartridge so that the measured temperature matches the set point temperature during
regeneration.
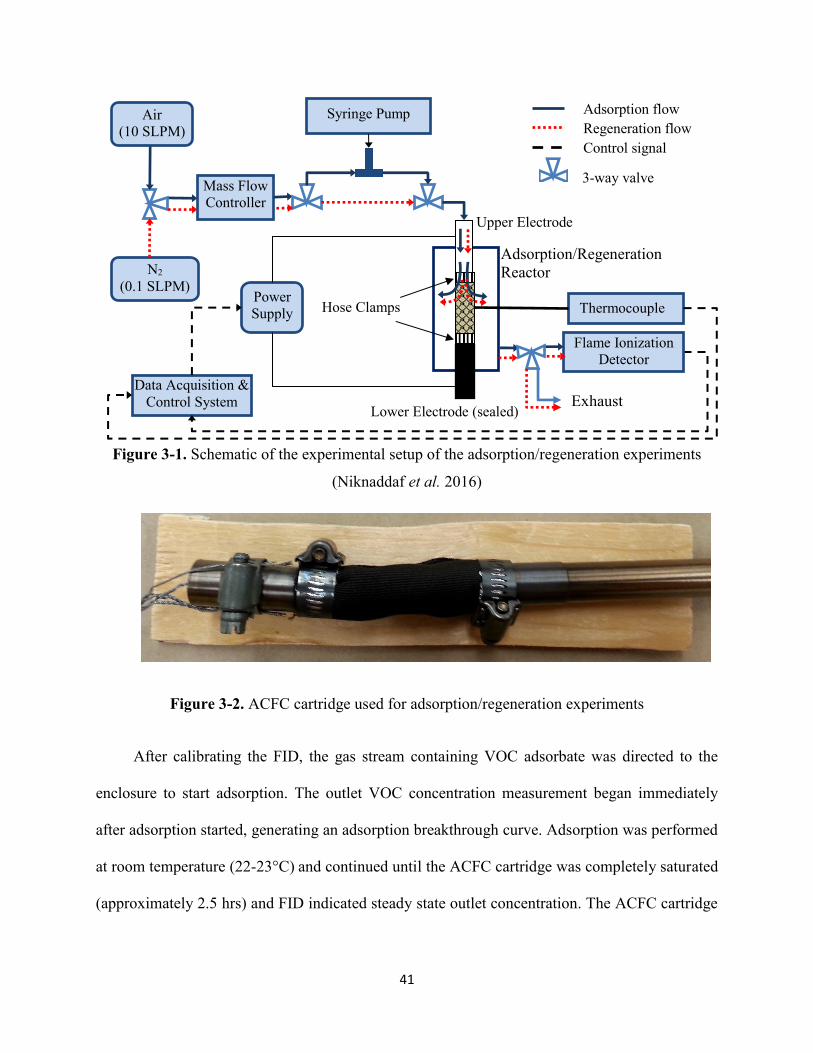
41
Figure 3-1. Schematic of the experimental setup of the adsorption/regeneration experiments
(Niknaddaf et al. 2016)
Figure 3-2. ACFC cartridge used for adsorption/regeneration experiments
After calibrating the FID, the gas stream containing VOC adsorbate was directed to the
enclosure to start adsorption. The outlet VOC concentration measurement began immediately
after adsorption started, generating an adsorption breakthrough curve. Adsorption was performed
at room temperature (22-23°C) and continued until the ACFC cartridge was completely saturated
(approximately 2.5 hrs) and FID indicated steady state outlet concentration. The ACFC cartridge
Mass Flow
Controller
Syringe Pump
Data Acquisition &
Control System
Power
Supply Thermocouple
N2
(0.1 SLPM)
Air
(10 SLPM)
Adsorption flow
Regeneration flow
Control signal
3-way valve
Upper Electrode
Lower Electrode (sealed)
Adsorption/Regeneration
Reactor
Exhaust
Flame Ionization
Detector
Hose Clamps

42
was weighed before and after adsorption and the adsorption capacity was measured in the
following way:
Amount adsorbed (wt%)
=Cartridge weight after adsorption − Cartridge weight before adsorption
Weight of heat treated ACFCX100
The adsorption capacity loss of ACFC from the 1st cycle to the 5th cycle was calculated as
follows:
𝐶𝑎𝑝𝑎𝑐𝑖𝑡𝑦 𝑙𝑜𝑠𝑠(%)
=Amount adsorbed after 1st cycle − Amount adsorbed after 5th cycle
Amount adsorbed after 1st cycle×100
Before starting regeneration, the saturated ACFC cartridge was purged with 1 SLPM of
high purity (99.998%) nitrogen (Praxair) for 5 min to purge oxygen out of the enclosure. Based
on the volume calculation of the quartz enclosure, 5 min purging with 1 SLPM N2 can
effectively remove the oxygen from the enclosure. The regeneration temperature and heating rate
were chosen based on a previous study on the effects of regeneration condition on heel formation
on ACFC (Niknaddaf 2015). (Niknaddaf 2015) showed that high heating temperature (400°C)
and higher heating rate (70°C/min) resulted in the highest heel, therefore to study the worst case
scenario and to amplify the heel formation, a regeneration temperature of 400°C and heating rate
of 70°C/min were chosen in this study. Regeneration was conducted for 100 min, with
simultaneous purge with 0.1 SLPM nitrogen. During desorption, the concentration of effluent
adsorbates was measured using a FID at a sampling frequency of 30 s. The concentration of the
adsorbates during desorption can rise beyond their saturation concentration which causes
condensation inside and at the outlet of the quartz enclosure, and also in the FID tubing. To
43
avoid this problem, a heating tape was wrapped around the wall of the quartz enclosure and
dilution with air was applied at the outlet of the enclosure. Adsorbates with higher vapour
pressure exhibited higher concentration during desorption, therefore required higher dilution.
Therefore 60-80-fold dilution with air was applied, based on the vapour pressure of the
compounds. After completing the regeneration, the ACFC cartridge was cooled down to room
temperature (25°) while the 0.1 SLPM purging with nitrogen continued till the end of cooling.
The ACFC cartridge was then taken out of the enclosure, and weighed. The difference between
weights before adsorption and after regeneration was used to calculate the amount of heel build
up for that cycle. The 1st cycle heel buildup was calculated as follows:
𝐻𝑒𝑒𝑙 𝑏𝑢𝑖𝑙𝑑𝑢𝑝 𝑎𝑓𝑡𝑒𝑟 1𝑠𝑡 𝑐𝑦𝑐𝑙𝑒 (wt%)
=Weight after 1𝑠𝑡 regeneration cycle − Weight before 1st adsorption cycle
Weight of heat treated ACFCX100
The cumulative heel buildup after five consecutive adsorption/regeneration cycles was
calculated as follow:
𝐶𝑢𝑚𝑢𝑙𝑎𝑡𝑖𝑣𝑒 𝐻𝑒𝑒𝑙 𝑏𝑢𝑖𝑙𝑑𝑢𝑝 (wt%)
=Weight after 5𝑡h regeneration cycle − Weight before 1st adsorption cycle
Weight of heat treated ACFCX100
3.2.2 Characterization Tests
Several characterization tests were conducted on the heat-treated and regenerated ACFCs
to determine the properties of the ACFCs before and after the 5-cycle adsorption/regeneration
experiments.
44
3.2.2.1 Thermogravimetric analysis: thermogravimetric analysis (TGA) (TGA/DSC 1,
Mettler Toledo) and derivative thermogravimetric analyses (DTG) was used to assess the
temperature stability of heat treated and regenerated ACFC samples. In each run, samples were
heated from 25°C to 100°C at a heating rate of 10°C/min, after that samples were isothermally
heated at 100°C for 15 min, then a temperature was ramp up from 100°C to 900°C at 5°C/min
heating rate. Throughout the test, a nitrogen flow of 50 mL/min was used to purge the desorbed
species.
3.2.2.2 Micropore surface analysis: ACFC samples were analyzed using a micropore
surface analyzer (Autosorb iQ2MP, Quantachrome). Nitrogen was used as probe molecule at
relative pressure ranging from 10-7 to 1 at 77K. To remove water vapour and volatiles from the
pores, ACFCs were cut into small pieces (2 mm × 2 mm), and 30 – 50 mg sample was added to a
6-mm cell, and de-gassed at 120°C for 5 hours before analysis. BET surface area (m2/g) and
micropore volume (cm3/g) were obtained over the relative pressure ranges of 0.01 to 0.07 and 0.2
to 0.4, respectively. V-t model was used to determine micropore volume. Total pore volume was
measured at a relative pressure of 0.975. Pore size distributions (PSDs) were obtained from the
isotherm of nitrogen adsorption using the quenched solid density functional theory (QSDFT) for
slit pores (Olivier 1998).
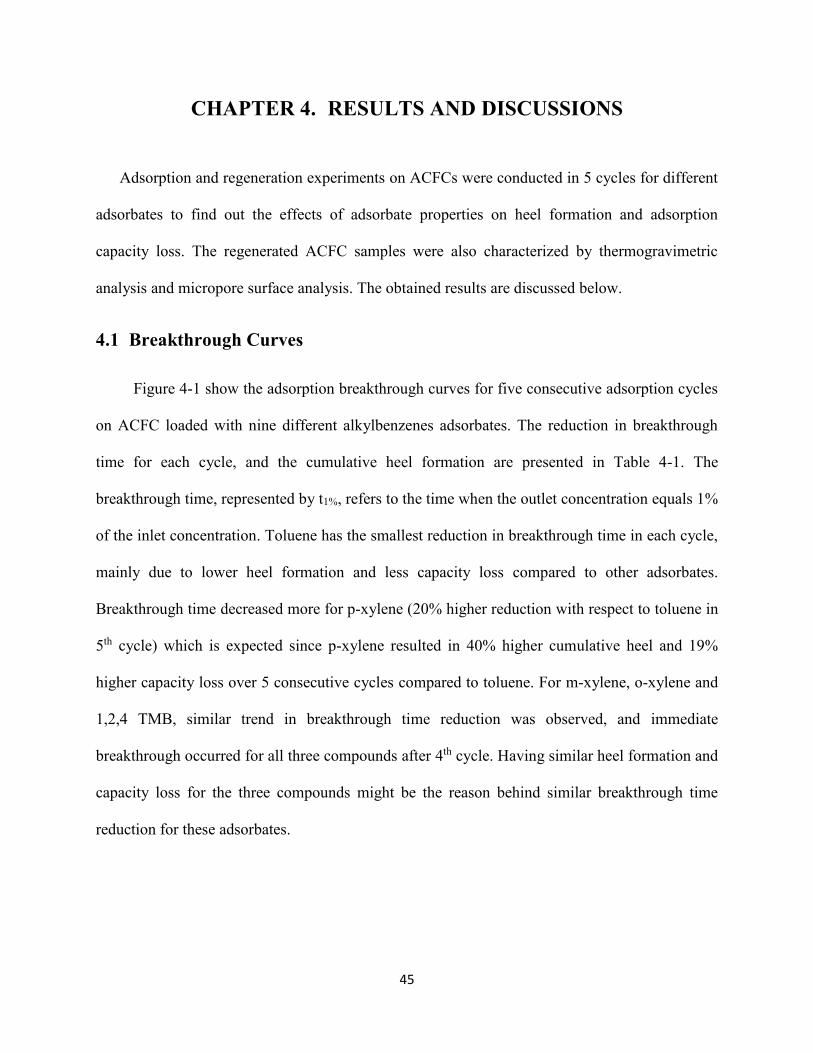
45
CHAPTER 4. RESULTS AND DISCUSSIONS
Adsorption and regeneration experiments on ACFCs were conducted in 5 cycles for different
adsorbates to find out the effects of adsorbate properties on heel formation and adsorption
capacity loss. The regenerated ACFC samples were also characterized by thermogravimetric
analysis and micropore surface analysis. The obtained results are discussed below.
4.1 Breakthrough Curves
Figure 4-1 show the adsorption breakthrough curves for five consecutive adsorption cycles
on ACFC loaded with nine different alkylbenzenes adsorbates. The reduction in breakthrough
time for each cycle, and the cumulative heel formation are presented in Table 4-1. The
breakthrough time, represented by t1%, refers to the time when the outlet concentration equals 1%
of the inlet concentration. Toluene has the smallest reduction in breakthrough time in each cycle,
mainly due to lower heel formation and less capacity loss compared to other adsorbates.
Breakthrough time decreased more for p-xylene (20% higher reduction with respect to toluene in
5th cycle) which is expected since p-xylene resulted in 40% higher cumulative heel and 19%
higher capacity loss over 5 consecutive cycles compared to toluene. For m-xylene, o-xylene and
1,2,4 TMB, similar trend in breakthrough time reduction was observed, and immediate
breakthrough occurred for all three compounds after 4th cycle. Having similar heel formation and
capacity loss for the three compounds might be the reason behind similar breakthrough time
reduction for these adsorbates.
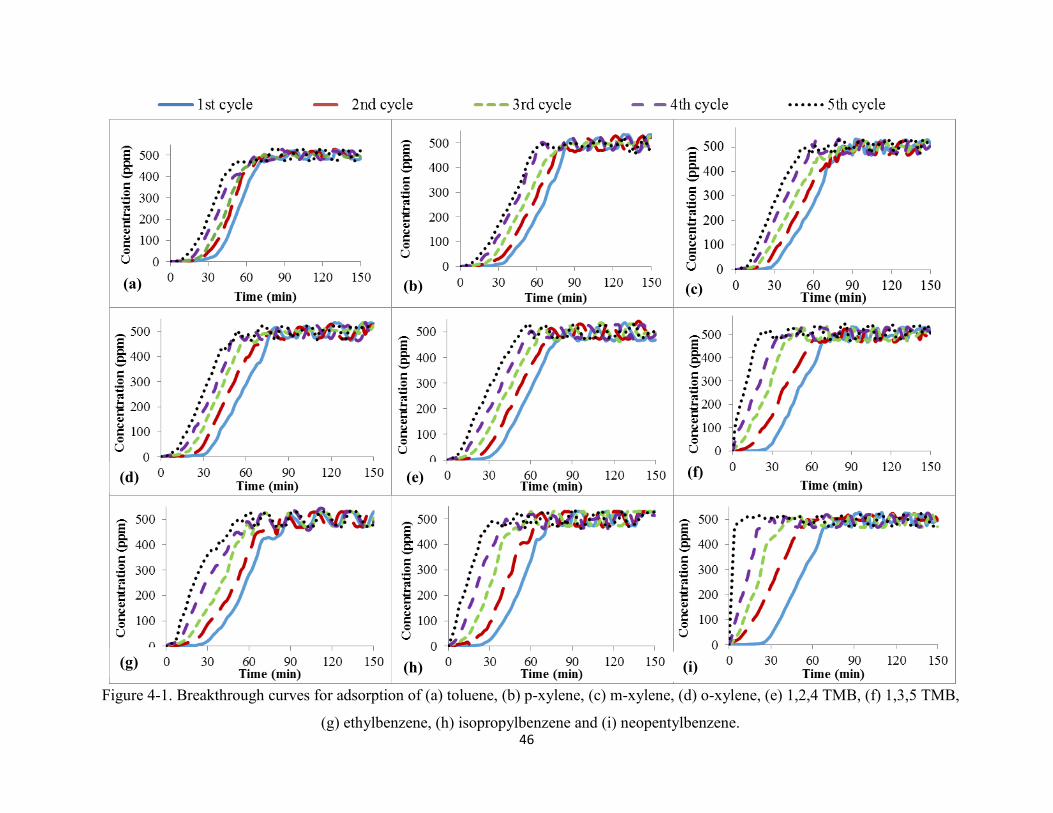
46
Figure 4-1. Breakthrough curves for adsorption of (a) toluene, (b) p-xylene, (c) m-xylene, (d) o-xylene, (e) 1,2,4 TMB, (f) 1,3,5 TMB,
(g) ethylbenzene, (h) isopropylbenzene and (i) neopentylbenzene.
(a) (b) (c)
(d) (e) (f)
(g) (h) (i)
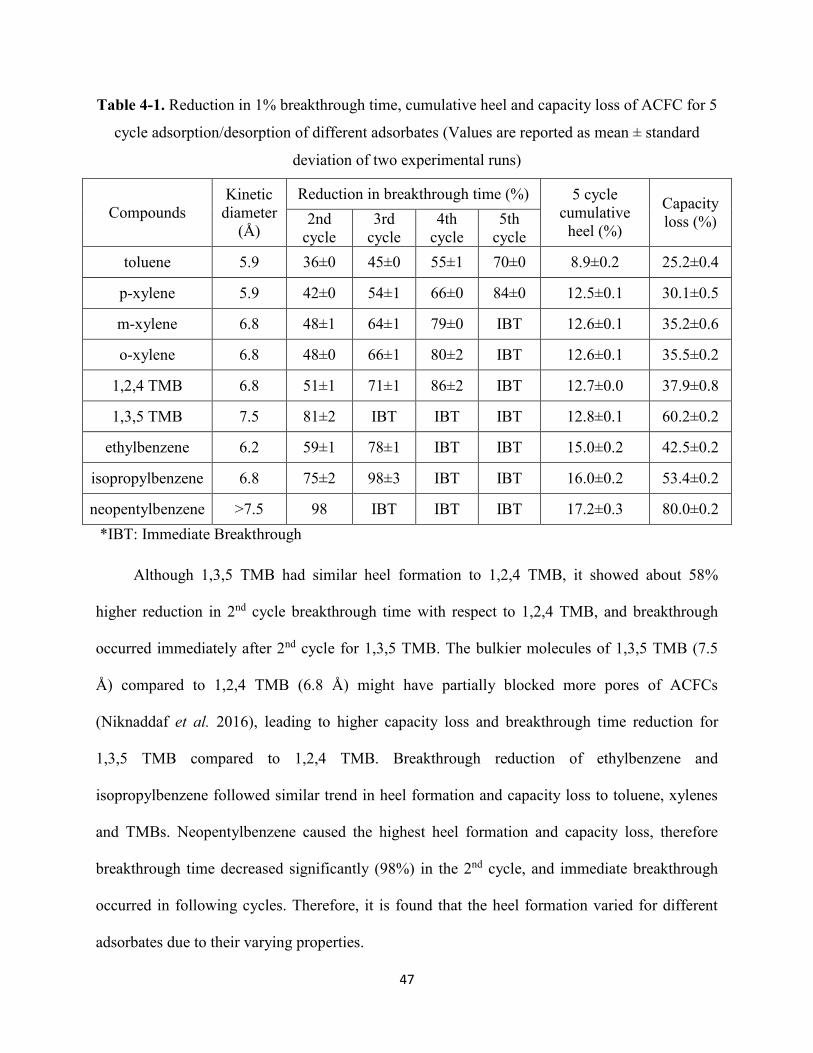
47
Table 4-1. Reduction in 1% breakthrough time, cumulative heel and capacity loss of ACFC for 5
cycle adsorption/desorption of different adsorbates (Values are reported as mean ± standard
deviation of two experimental runs)
Compounds
Kinetic
diameter
(Å)
Reduction in breakthrough time (%) 5 cycle
cumulative
heel (%)
Capacity
loss (%) 2nd
cycle
3rd
cycle
4th
cycle
5th
cycle
toluene 5.9 36±0 45±0 55±1 70±0 8.9±0.2 25.2±0.4
p-xylene 5.9 42±0 54±1 66±0 84±0 12.5±0.1 30.1±0.5
m-xylene 6.8 48±1 64±1 79±0 IBT 12.6±0.1 35.2±0.6
o-xylene 6.8 48±0 66±1 80±2 IBT 12.6±0.1 35.5±0.2
1,2,4 TMB 6.8 51±1 71±1 86±2 IBT 12.7±0.0 37.9±0.8
1,3,5 TMB 7.5 81±2 IBT IBT IBT 12.8±0.1 60.2±0.2
ethylbenzene 6.2 59±1 78±1 IBT IBT 15.0±0.2 42.5±0.2
isopropylbenzene 6.8 75±2 98±3 IBT IBT 16.0±0.2 53.4±0.2
neopentylbenzene >7.5 98 IBT IBT IBT 17.2±0.3 80.0±0.2
*IBT: Immediate Breakthrough
Although 1,3,5 TMB had similar heel formation to 1,2,4 TMB, it showed about 58%
higher reduction in 2nd cycle breakthrough time with respect to 1,2,4 TMB, and breakthrough
occurred immediately after 2nd cycle for 1,3,5 TMB. The bulkier molecules of 1,3,5 TMB (7.5
Å) compared to 1,2,4 TMB (6.8 Å) might have partially blocked more pores of ACFCs
(Niknaddaf et al. 2016), leading to higher capacity loss and breakthrough time reduction for
1,3,5 TMB compared to 1,2,4 TMB. Breakthrough reduction of ethylbenzene and
isopropylbenzene followed similar trend in heel formation and capacity loss to toluene, xylenes
and TMBs. Neopentylbenzene caused the highest heel formation and capacity loss, therefore
breakthrough time decreased significantly (98%) in the 2nd cycle, and immediate breakthrough
occurred in following cycles. Therefore, it is found that the heel formation varied for different
adsorbates due to their varying properties.
48
4.2 Cumulative Heel Buildup on ACFC Samples during 5-Cycle Adsorption
and Regeneration Experiments
Measurements of mass balance cumulative heel of ACFC samples after 5 cycle
adsorption/desorption of different adsorbates are compared in Figure 4-2. The detailed mass
balance results of all 5 cycle tests are provided in Appendices (from Appendix B to Appendix J).
All tested adsorbates were alkylbenzenes having different levels of thermal stability. The
conversion percentages of different alkylbenzenes from pyrolysis at 595°C (Švob et al. 1974)
have been used as an indication of the thermal stability of the adsorbates. The conversion values
(in percentage) has been included in parenthesis beside each compound’s name in Figure 4-2.
Figure 4-2. Cumulative heel on ACFC samples loaded with different alkylbenzene adsorbates.
Values in parentheses indicate thermal conversion rates (as % weight) from literature
Figure 4-2 shows that cumulative heel varied from 8.9% to 17.2% for different
alkylbenzene adsorbates. The lowest cumulative heel (8.9%) was observed for toluene, which is
0
5
10
15
20
5 c
ycl
e cu
mu
lati
ve
hee
l (%
)
Compounds with thermal conversion rates
8.9±.2
12.6±.1 12.8±.1 12.5±.1 12.7±.0 12.6±.115.0±.2
16.0±.217.2±.3
49
the most thermally stable compound with lowest conversion rate. Cumulative heel formation
increased from 8.9% for toluene to about 12.6% for xylenes and TMBs. Although the conversion
rates of these five compounds are comparable to that of toluene, the heel was higher than toluene
possibly due to toluene’s lower boiling point (110°C) compared to the three xylenes (138-144°C)
and TMBs (165-171°C), which caused faster desorption of toluene at a lower desorption
temperature. The average pore diameter of the tested ACFC is 7.0 Å, therefore toluene’s smaller
kinetic diameter (5.9 Å) compared to other tested compounds might have reduced the diffusion
resistance during desorption, leading to less heel formation. Ethylbenzene and p-xylene have
comparable kinetic diameters (6.2 Å and 5.9 Å respectively), and boiling points (136°C and
138°C respectively), yet ethylbenzene showed 21% higher heel than p-xylene. This is because of
ethylbenzene’s very high conversion rate (20.7%) in pyrolysis compared to p- xylene which has
conversion rates in the order of 1.0%. The low thermal stability of ethylbenzene might have
caused adsorbate decomposition during high temperature (400°C) regeneration of microporous
ACFC. Previous studies also confirmed that adsorbate decomposition causes irreversible
adsorption by forming coke which blocks the adsorbate micropores (Ania et al. 2004, Niknaddaf
et al. 2016). Coke (also known as char) is formed as a bi-product of the pyrolysis or
decomposition of hydrocarbons in the absence of oxygen (Basu 2013, Guisnet and Magnoux
2001). Char consists mainly of carbon and is highly stable at high temperature of about 800°C
(Banerjee et al. 1986, Guisnet and Magnoux 2001). The thermogravimetric analysis provided in
Section 4.3 will provide further information on the nature of the heel and will identify if material
decomposition as the main heel formation mechanism in this study. Isopropylbenzene’s
conversion rate is twice of that of ethylbenzene; however, it showed only 6% higher heel than
ethylbenzene. This is because, the thermal decomposition of organic compounds usually forms
50
smaller molecules, but the resulting fragments may further interact with each other and produce
larger compounds than the original one (Moldoveanu 2010). Therefore, the conversion rate
includes both formation of larger and smaller molecules than the adsorbate molecule, and only
the larger and high molecular weight compounds produced from the thermal degradation of the
adsorbates formed heel on ACFC. For similar reason, neopentylbenzene with 116% higher
conversion rate than isopropylbenzene caused only 6% higher heel than isopropylbenzene.
Therefore, it is observed that the heel caused by different adsorbates is affected by the thermal
stability of the compounds.
4.3 Thermo-Gravimetric Analysis
Thermogravimetric analysis and derivative thermogravimetric analysis were done by
exposing the heat treated and regenerated ACFC samples loaded with different adsorbates to
temperature up to 900°C. The temperature stability of the heel formed during the 5-cycle tests
was evaluated and is shown in the TGA and DTG results in Figure 4-3 and Figure 4-4
respectively. Though the ACFC samples were regenerated at 400°C, no mass loss occurred
before the temperature reached 520°C for any of the regenerated samples. Moreover, for the
adsorbates showing highest heel formation (e.g. isopropylbenzene and neopentylbenzene, with
16% and 17.2% heel respectively), no significant weight loss was observed at temperature as
high as 600°C.
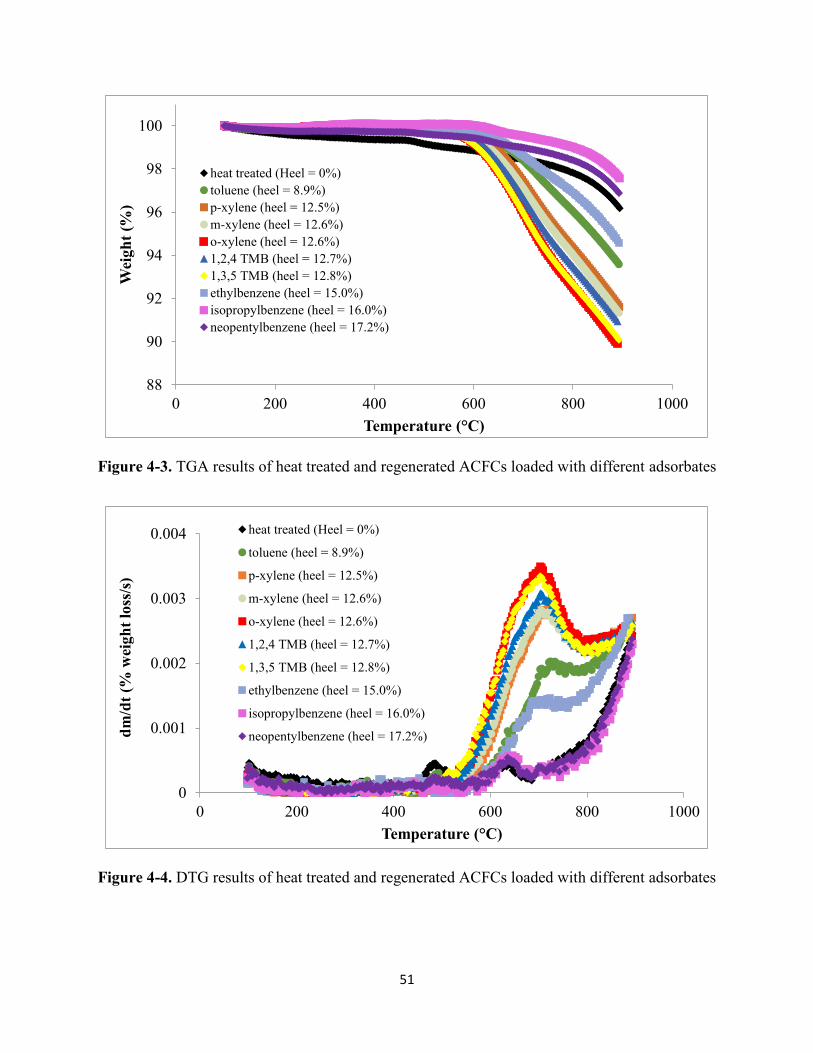
51
Figure 4-3. TGA results of heat treated and regenerated ACFCs loaded with different adsorbates
Figure 4-4. DTG results of heat treated and regenerated ACFCs loaded with different adsorbates
88
90
92
94
96
98
100
0 200 400 600 800 1000
Wei
gh
t (%
)
Temperature (°C)
heat treated (Heel = 0%)
toluene (heel = 8.9%)
p-xylene (heel = 12.5%)
m-xylene (heel = 12.6%)
o-xylene (heel = 12.6%)
1,2,4 TMB (heel = 12.7%)
1,3,5 TMB (heel = 12.8%)
ethylbenzene (heel = 15.0%)
isopropylbenzene (heel = 16.0%)
neopentylbenzene (heel = 17.2%)
0
0.001
0.002
0.003
0.004
0 200 400 600 800 1000
dm
/dt
(% w
eigh
t lo
ss/s
)
Temperature (°C)
heat treated (Heel = 0%)
toluene (heel = 8.9%)
p-xylene (heel = 12.5%)
m-xylene (heel = 12.6%)
o-xylene (heel = 12.6%)
1,2,4 TMB (heel = 12.7%)
1,3,5 TMB (heel = 12.8%)
ethylbenzene (heel = 15.0%)
isopropylbenzene (heel = 16.0%)
neopentylbenzene (heel = 17.2%)
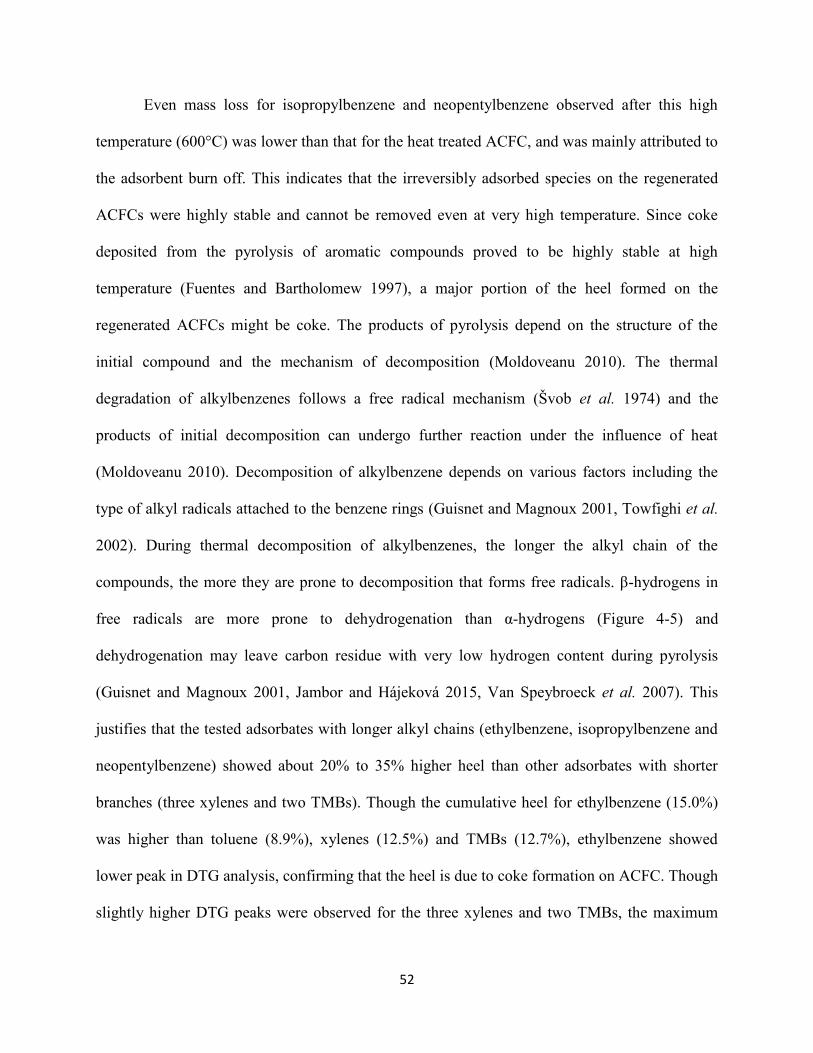
52
Even mass loss for isopropylbenzene and neopentylbenzene observed after this high
temperature (600°C) was lower than that for the heat treated ACFC, and was mainly attributed to
the adsorbent burn off. This indicates that the irreversibly adsorbed species on the regenerated
ACFCs were highly stable and cannot be removed even at very high temperature. Since coke
deposited from the pyrolysis of aromatic compounds proved to be highly stable at high
temperature (Fuentes and Bartholomew 1997), a major portion of the heel formed on the
regenerated ACFCs might be coke. The products of pyrolysis depend on the structure of the
initial compound and the mechanism of decomposition (Moldoveanu 2010). The thermal
degradation of alkylbenzenes follows a free radical mechanism (Švob et al. 1974) and the
products of initial decomposition can undergo further reaction under the influence of heat
(Moldoveanu 2010). Decomposition of alkylbenzene depends on various factors including the
type of alkyl radicals attached to the benzene rings (Guisnet and Magnoux 2001, Towfighi et al.
2002). During thermal decomposition of alkylbenzenes, the longer the alkyl chain of the
compounds, the more they are prone to decomposition that forms free radicals. β-hydrogens in
free radicals are more prone to dehydrogenation than α-hydrogens (Figure 4-5) and
dehydrogenation may leave carbon residue with very low hydrogen content during pyrolysis
(Guisnet and Magnoux 2001, Jambor and Hájeková 2015, Van Speybroeck et al. 2007). This
justifies that the tested adsorbates with longer alkyl chains (ethylbenzene, isopropylbenzene and
neopentylbenzene) showed about 20% to 35% higher heel than other adsorbates with shorter
branches (three xylenes and two TMBs). Though the cumulative heel for ethylbenzene (15.0%)
was higher than toluene (8.9%), xylenes (12.5%) and TMBs (12.7%), ethylbenzene showed
lower peak in DTG analysis, confirming that the heel is due to coke formation on ACFC. Though
slightly higher DTG peaks were observed for the three xylenes and two TMBs, the maximum
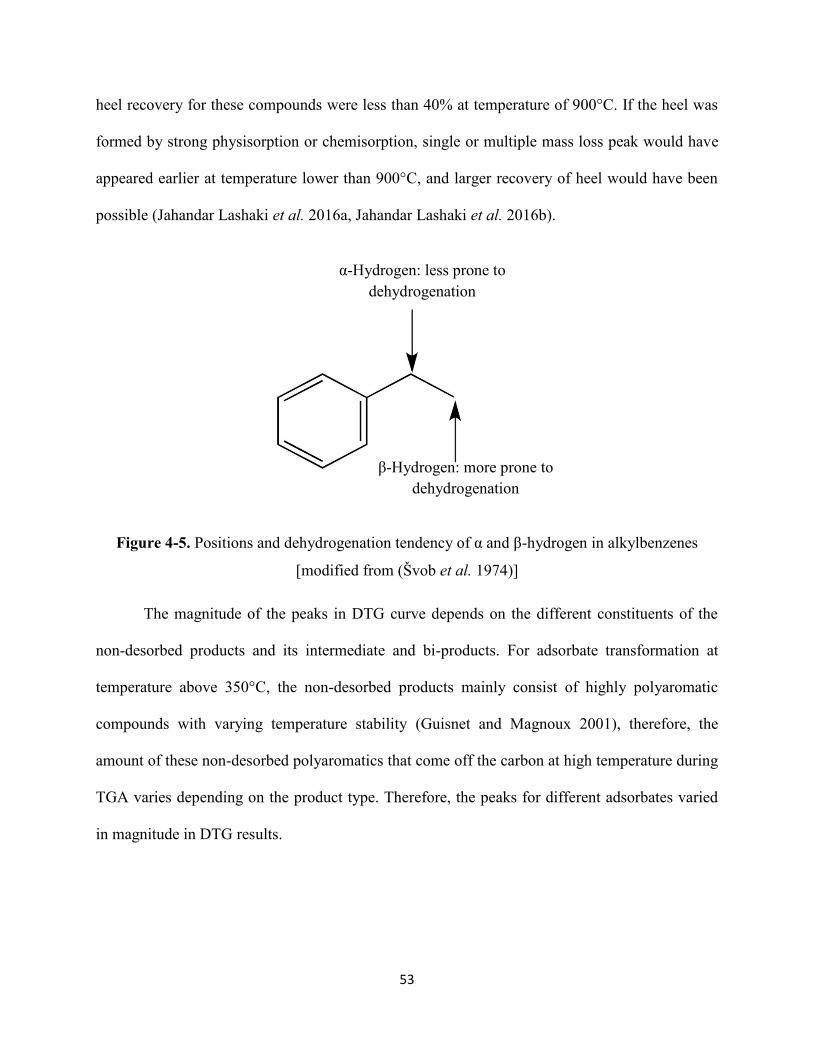
53
heel recovery for these compounds were less than 40% at temperature of 900°C. If the heel was
formed by strong physisorption or chemisorption, single or multiple mass loss peak would have
appeared earlier at temperature lower than 900°C, and larger recovery of heel would have been
possible (Jahandar Lashaki et al. 2016a, Jahandar Lashaki et al. 2016b).
Figure 4-5. Positions and dehydrogenation tendency of α and β-hydrogen in alkylbenzenes
[modified from (Švob et al. 1974)]
The magnitude of the peaks in DTG curve depends on the different constituents of the
non-desorbed products and its intermediate and bi-products. For adsorbate transformation at
temperature above 350°C, the non-desorbed products mainly consist of highly polyaromatic
compounds with varying temperature stability (Guisnet and Magnoux 2001), therefore, the
amount of these non-desorbed polyaromatics that come off the carbon at high temperature during
TGA varies depending on the product type. Therefore, the peaks for different adsorbates varied
in magnitude in DTG results.
α-Hydrogen: less prone to
dehydrogenation
β-Hydrogen: more prone to
dehydrogenation
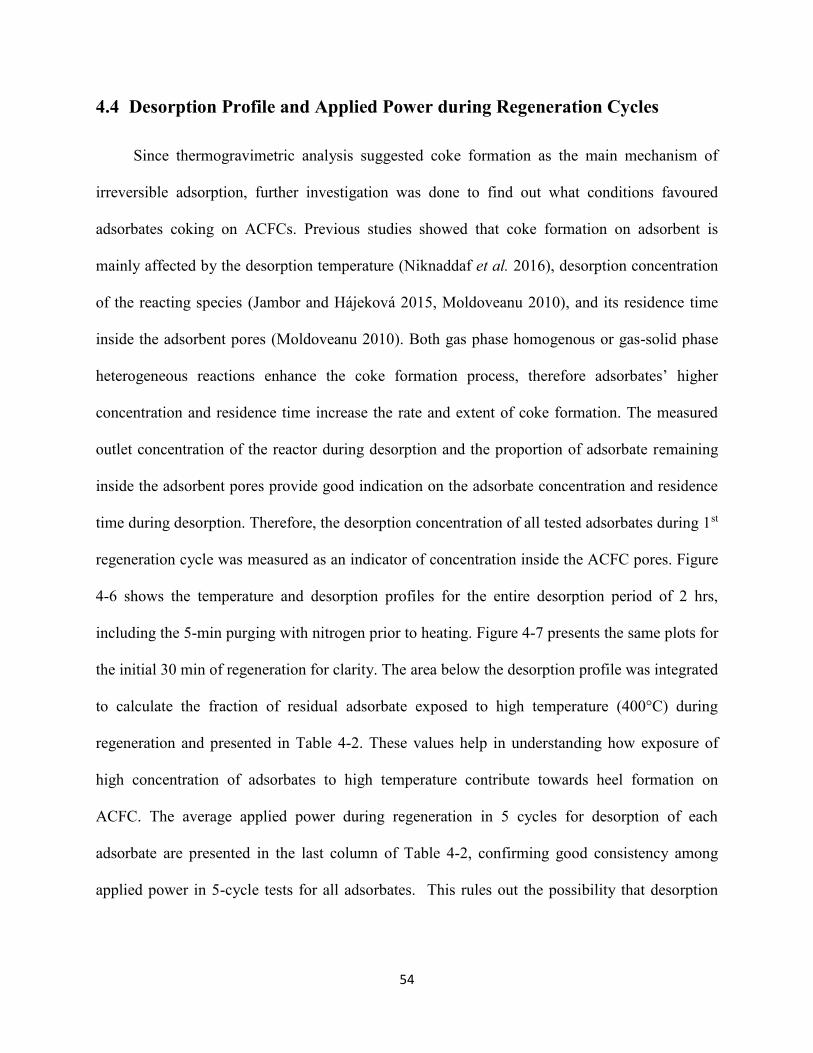
54
4.4 Desorption Profile and Applied Power during Regeneration Cycles
Since thermogravimetric analysis suggested coke formation as the main mechanism of
irreversible adsorption, further investigation was done to find out what conditions favoured
adsorbates coking on ACFCs. Previous studies showed that coke formation on adsorbent is
mainly affected by the desorption temperature (Niknaddaf et al. 2016), desorption concentration
of the reacting species (Jambor and Hájeková 2015, Moldoveanu 2010), and its residence time
inside the adsorbent pores (Moldoveanu 2010). Both gas phase homogenous or gas-solid phase
heterogeneous reactions enhance the coke formation process, therefore adsorbates’ higher
concentration and residence time increase the rate and extent of coke formation. The measured
outlet concentration of the reactor during desorption and the proportion of adsorbate remaining
inside the adsorbent pores provide good indication on the adsorbate concentration and residence
time during desorption. Therefore, the desorption concentration of all tested adsorbates during 1st
regeneration cycle was measured as an indicator of concentration inside the ACFC pores. Figure
4-6 shows the temperature and desorption profiles for the entire desorption period of 2 hrs,
including the 5-min purging with nitrogen prior to heating. Figure 4-7 presents the same plots for
the initial 30 min of regeneration for clarity. The area below the desorption profile was integrated
to calculate the fraction of residual adsorbate exposed to high temperature (400°C) during
regeneration and presented in Table 4-2. These values help in understanding how exposure of
high concentration of adsorbates to high temperature contribute towards heel formation on
ACFC. The average applied power during regeneration in 5 cycles for desorption of each
adsorbate are presented in the last column of Table 4-2, confirming good consistency among
applied power in 5-cycle tests for all adsorbates. This rules out the possibility that desorption
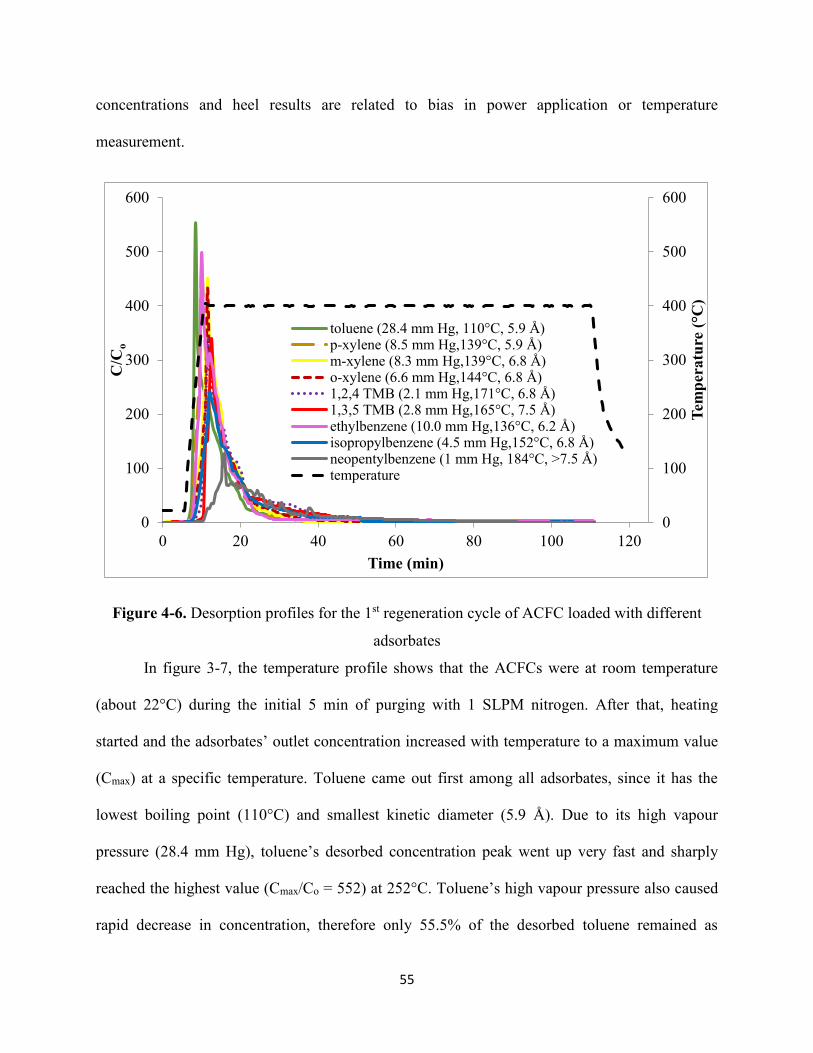
55
concentrations and heel results are related to bias in power application or temperature
measurement.
Figure 4-6. Desorption profiles for the 1st regeneration cycle of ACFC loaded with different
adsorbates
In figure 3-7, the temperature profile shows that the ACFCs were at room temperature
(about 22°C) during the initial 5 min of purging with 1 SLPM nitrogen. After that, heating
started and the adsorbates’ outlet concentration increased with temperature to a maximum value
(Cmax) at a specific temperature. Toluene came out first among all adsorbates, since it has the
lowest boiling point (110°C) and smallest kinetic diameter (5.9 Å). Due to its high vapour
pressure (28.4 mm Hg), toluene’s desorbed concentration peak went up very fast and sharply
reached the highest value (Cmax/Co = 552) at 252°C. Toluene’s high vapour pressure also caused
rapid decrease in concentration, therefore only 55.5% of the desorbed toluene remained as
0
100
200
300
400
500
600
0
100
200
300
400
500
600
0 20 40 60 80 100 120
Tem
per
atu
re (°C
)
C/C
o
Time (min)
toluene (28.4 mm Hg, 110°C, 5.9 Å)p-xylene (8.5 mm Hg,139°C, 5.9 Å)m-xylene (8.3 mm Hg,139°C, 6.8 Å)o-xylene (6.6 mm Hg,144°C, 6.8 Å)1,2,4 TMB (2.1 mm Hg,171°C, 6.8 Å)1,3,5 TMB (2.8 mm Hg,165°C, 7.5 Å)ethylbenzene (10.0 mm Hg,136°C, 6.2 Å)isopropylbenzene (4.5 mm Hg,152°C, 6.8 Å)neopentylbenzene (1 mm Hg, 184°C, >7.5 Å)temperature
56
residual inside ACFC pore when temperature reached 400°C. So, toluene showed the only 3.2%
heel after 1st cycle desorption. The average power applied in each cycle desorption of toluene
was consistent (varying between 180 to 190 W) (Appendix B, Figure B-2), therefore applied
power and regeneration temperature were consistent across the 5 cycles, and the heel formation
mechanism is expected to be similar across the 5 cycles, resulting in a cumulative heel of 8.9%.
Figure 4-7. Desorption profiles for the initial 30 min of the 1st regeneration cycle of ACFC
loaded with different adsorbates
After toluene, p-xylene and ethylbenzene came out almost at same time and reached
maximum concentration (Cmax/Co) of 472 and 495 respectively at around 360°C, since they have
similar boiling point, vapour pressure and kinetic diameter. Fraction of p-xylene and
0
100
200
300
400
500
600
0
100
200
300
400
500
600
0 5 10 15 20 25 30 35T
emp
eratu
re (°C
)
C/C
o
Time (min)
toluene (28.4 mm Hg, 110°C, 5.9 Å)
p-xylene (8.5 mm Hg,139°C, 5.9 Å)
m-xylene (8.3 mm Hg,139°C, 6.8 Å)
o-xylene (6.6 mm Hg,144°C, 6.8 Å)
1,2,4 TMB (2.1 mm Hg,171°C, 6.8 Å)
1,3,5 TMB (2.8 mm Hg,165°C, 7.5 Å)
ethylbenzene (10.0 mm Hg,136°C, 6.2 Å)
isopropylbenzene (4.5 mm Hg,152°C, 6.8 Å)
neopentylbenzene (1 mm Hg, 184°C, >7.5 Å)
Temperature
57
ethylbenzene exposed to 400°C were 70% and 66% respectively, but ethylbenzene showed 15%
higher heel in 1st cycle than p-xylene (Table 4-2), due to 20 times higher conversion rate, which
caused more decomposition and coke formation for ethylbenzene. Not all the decomposed
products of ethylbenzene turned into coke; only the ones with higher molecular weight and
bigger molecular size turned into non-desorbed species. Similar trend is observed for m-xylene
and o-xylene, since their comparable physical properties caused similar exposure of concentrated
desorption stream to high temperature, causing similar heel formation. 1,2,4 TMB has a kinetic
diameter (6.8 Å) similar to m-xylene and o-xylene, but due to its higher boiling point (171°C), it
started desorbing at higher temperature, and reached a maximum concentration (Cmax/Co=336)
after the temperature reached 400°C, therefore residual 1,2,4 TMB exposure to 400°C was about
12% higher than m-xylene and o-xylene, which caused 9% higher heel in 1st cycle, but due to
slightly higher (7%) capacity loss (Appendix F. Table F-1), heel accumulation in consecutive
cycles decreased for 1,2,4 TMB and it ended up with similar 5 cycle cumulative heel as the three
xylenes. Figure 4-7 also shows that 1,3,5 TMB, due to its larger kinetic diameter (7.5 Å)
compared to 1,2,4 TMB, desorbed at a slower rate and therefore reached the maximum
concentration (Cmax/Co=340) later than 1,2,4 TMB causing 9% higher residual adsorbate
exposure to 400°C and 13% higher 1st cycle heel. However, very high capacity loss (60.2%)
(Appendix G) decreased cyclic heel accumulation, resulting in similar cumulative heel for both
TMBs. For isopropylbenzene, 78% of residual adsorbate was exposed to 400°C, which is quite
similar to m-xylene and o-xylene, since these compounds have similar kinetic diameter and
comparable boiling points. However, because of 40 times higher conversion rate than xylenes,
isopropylbenzene went through significant decomposition, reducing its maximum concentration
(Cmax/Co=239). Considerable thermal degradation of isopropylbenzene resulted in 36% higher 1st
58
cycle heel and 27% higher cumulative heel after 5 cycles (Table 4-2) than the three xylenes and
two TMBs. Neopentylbenzene has the highest boiling point (184°C) and the largest kinetic
diameter (>7.5 Å), among the tested adsorbates, therefore it started desorbing significantly late
(Figure 4-7). In addition, its lowest vapour pressure (1 mm Hg) and highest conversion rate
(~90%) decreased its maximum concentration (Cmax/Co=124). Since most of its desorption
occurred after the temperature reached 400°C, therefore about 98% of residual neopentylbenzene
was exposed to 400°C, which caused the highest 1st cycle heel (10.9%) (Table 4-2), but
significantly higher capacity loss (80%) lowered the heel addition in each consecutive cycle,
showing a 5-cycle cumulative heel of 17.2%.
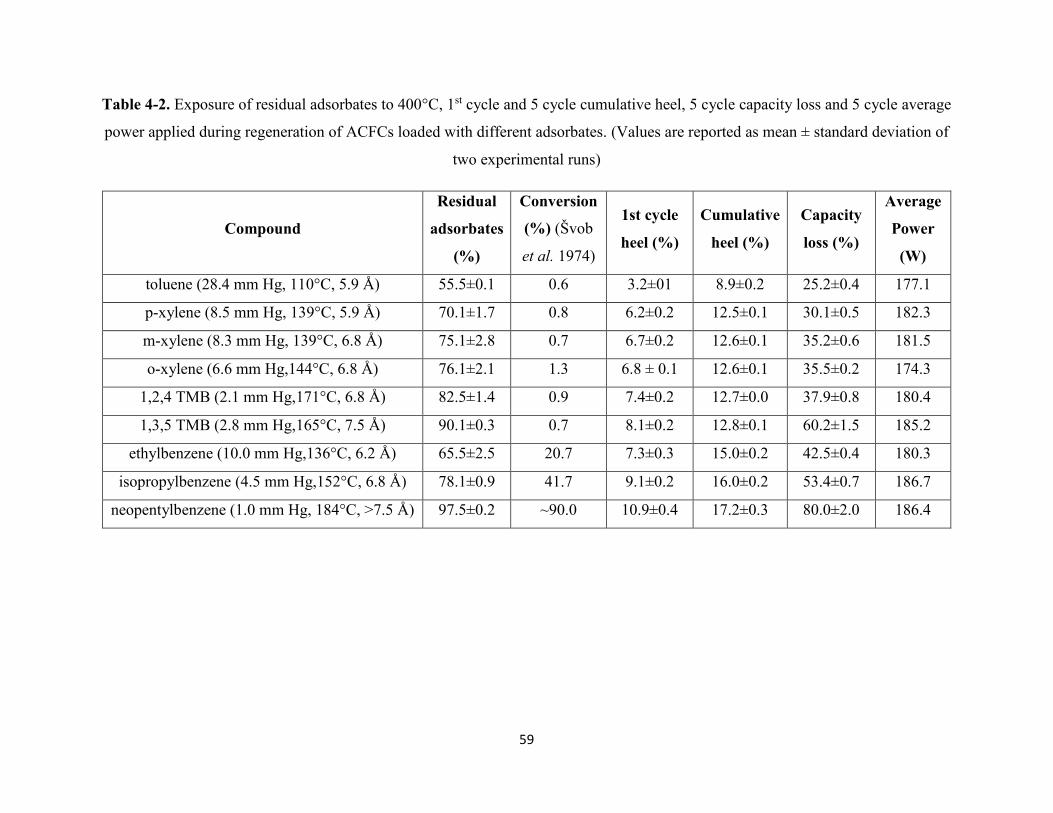
59
Table 4-2. Exposure of residual adsorbates to 400°C, 1st cycle and 5 cycle cumulative heel, 5 cycle capacity loss and 5 cycle average
power applied during regeneration of ACFCs loaded with different adsorbates. (Values are reported as mean ± standard deviation of
two experimental runs)
Compound
Residual
adsorbates
(%)
Conversion
(%) (Švob
et al. 1974)
1st cycle
heel (%)
Cumulative
heel (%)
Capacity
loss (%)
Average
Power
(W)
toluene (28.4 mm Hg, 110°C, 5.9 Å) 55.5±0.1 0.6 3.2±01 8.9±0.2 25.2±0.4 177.1
p-xylene (8.5 mm Hg, 139°C, 5.9 Å) 70.1±1.7 0.8 6.2±0.2 12.5±0.1 30.1±0.5 182.3
m-xylene (8.3 mm Hg, 139°C, 6.8 Å) 75.1±2.8 0.7 6.7±0.2 12.6±0.1 35.2±0.6 181.5
o-xylene (6.6 mm Hg,144°C, 6.8 Å) 76.1±2.1 1.3 6.8 ± 0.1 12.6±0.1 35.5±0.2 174.3
1,2,4 TMB (2.1 mm Hg,171°C, 6.8 Å) 82.5±1.4 0.9 7.4±0.2 12.7±0.0 37.9±0.8 180.4
1,3,5 TMB (2.8 mm Hg,165°C, 7.5 Å) 90.1±0.3 0.7 8.1±0.2 12.8±0.1 60.2±1.5 185.2
ethylbenzene (10.0 mm Hg,136°C, 6.2 Å) 65.5±2.5 20.7 7.3±0.3 15.0±0.2 42.5±0.4 180.3
isopropylbenzene (4.5 mm Hg,152°C, 6.8 Å) 78.1±0.9 41.7 9.1±0.2 16.0±0.2 53.4±0.7 186.7
neopentylbenzene (1.0 mm Hg, 184°C, >7.5 Å) 97.5±0.2 ~90.0 10.9±0.4 17.2±0.3 80.0±2.0 186.4
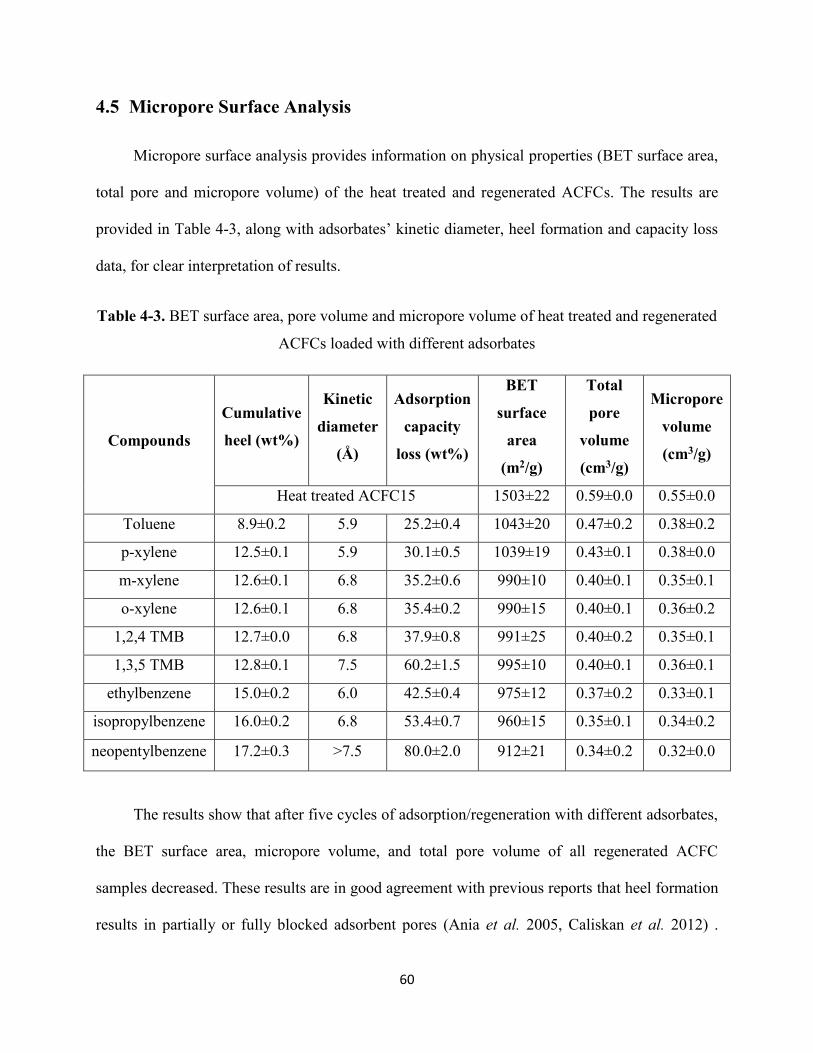
60
4.5 Micropore Surface Analysis
Micropore surface analysis provides information on physical properties (BET surface area,
total pore and micropore volume) of the heat treated and regenerated ACFCs. The results are
provided in Table 4-3, along with adsorbates’ kinetic diameter, heel formation and capacity loss
data, for clear interpretation of results.
Table 4-3. BET surface area, pore volume and micropore volume of heat treated and regenerated
ACFCs loaded with different adsorbates
Compounds
Cumulative
heel (wt%)
Kinetic
diameter
(Å)
Adsorption
capacity
loss (wt%)
BET
surface
area
(m2/g)
Total
pore
volume
(cm3/g)
Micropore
volume
(cm3/g)
Heat treated ACFC15 1503±22 0.59±0.0 0.55±0.0
Toluene 8.9±0.2 5.9 25.2±0.4 1043±20 0.47±0.2 0.38±0.2
p-xylene 12.5±0.1 5.9 30.1±0.5 1039±19 0.43±0.1 0.38±0.0
m-xylene 12.6±0.1 6.8 35.2±0.6 990±10 0.40±0.1 0.35±0.1
o-xylene 12.6±0.1 6.8 35.4±0.2 990±15 0.40±0.1 0.36±0.2
1,2,4 TMB 12.7±0.0 6.8 37.9±0.8 991±25 0.40±0.2 0.35±0.1
1,3,5 TMB 12.8±0.1 7.5 60.2±1.5 995±10 0.40±0.1 0.36±0.1
ethylbenzene 15.0±0.2 6.0 42.5±0.4 975±12 0.37±0.2 0.33±0.1
isopropylbenzene 16.0±0.2 6.8 53.4±0.7 960±15 0.35±0.1 0.34±0.2
neopentylbenzene 17.2±0.3 >7.5 80.0±2.0 912±21 0.34±0.2 0.32±0.0
The results show that after five cycles of adsorption/regeneration with different adsorbates,
the BET surface area, micropore volume, and total pore volume of all regenerated ACFC
samples decreased. These results are in good agreement with previous reports that heel formation
results in partially or fully blocked adsorbent pores (Ania et al. 2005, Caliskan et al. 2012) .
61
There has been a decrease of 30% to 40% in surface area, 20% to 42% in pore volume and 28%
to 40% in micropore volume from toluene (with lowest heel of 8.9%) to neopentylbenzene (with
highest heel of 17.2%) loaded ACFCs. The regenerated ACFC loaded with toluene had highest
BET surface area (1043 m2/g), pore volume (0.47 cm3/g) and micropore volume (0.38 cm3/g),
since toluene caused the lowest heel (8.9%). P-xylene had 40% higher heel than toluene,
therefore regenerated ACFC loaded with p-xylene showed 9% higher reduction in pore volume
than the regenerated ACFC loaded with toluene. The surface area and pore volume obtained for
ACFC samples loaded with m-xylene, o-xylene, 1,2,4 TMB and 1,3,5 TMB were quite similar
because of similar heel formation. The surface area and pore volume results for 1,3,5 TMB also
prove that the significant capacity loss (60.2%) caused by 1,3,5 TMB is mainly due to the partial
pore blockage by its bulkier molecules (7.5 Å). The average pore width of ACFC15 is 7.0 Å
(Niknaddaf et al. 2016), therefore its adsorption capacity for N2 molecules was much higher than
it showed for 1,3,5 TMB. This indicates that the partial occlusion inhibits the accessibility of
ACFC pores to bulkier adsorbates, but allows access for smaller molecules such as N2. The
reduction in surface area and pore volume for ehtylbenzene and isopropylbenzene were mainly
attributed to their higher cumulative heel. Again, ethylbenzene showed 18% higher heel but 32%
less capacity loss than 1,3,5 TMB since ethylbenzene’s molecules (6.2 Å) were smaller than the
average pore width of ACFC15 (7.0 Å) and therefore caused less partial pore blockage. For the
same reason neopentylbenzene with the largest kinetic diameter (>7.5 Å) among all tested
adsorbates, showed highest capacity loss (80%). Compared to isopropylbenzene,
neopentylbenzene exhibited 6% higher heel and 5%, 3% and 6% lower surface area, pore volume
and micropore volume respectively, however, it had a significantly higher capacity loss (80%)
than isopropylbenzene (53.4%). This is mainly due to neopentylbenzene’s large kinetic diameter

62
which facilitated extensive partial pore blockage in ACFC. These results illustrate how the
adsorbate’s kinetic diameter affect its accessibility of the adsorbent pores, therefore bigger
molecules cause higher and faster capacity loss compared to smaller molecules. Similar findings
were also reported in a previous study, where ACFCs regenerated following adsorption of 1,2,4
TMB depicted large loss in adsorption capacity for 1,2,4 TMB, but maintained good adsorption
capacity for acetone which is smaller than 1,2,4 TMB (Niknaddaf et al. 2016).
63
CHAPTER 5. CONCLUSIONS AND RECOMMENDATIONS
5.1 Conclusions
The effects of adsorbate properties (boiling point, kinetic diameter and thermal stability) on
heel build up and adsorption capacity loss of ACFC15 were investigated in this research. For this
purpose, nine different alkylbenzenes were tested as adsorbates in 5-cycle
adsorption/regeneration experiments. Regeneration experiments were conducted using resistive
heating at a regeneration temperature of 400°C, with a heating rate of 70°C /min and in 0.1
SLPM N2 flow. Characterization tests were also completed using thermogravimetric analysis and
micropore surface analysis. Desorption profile for all the adsorbates were obtained in the 1st
regeneration cycle. Major findings from this research are provided below:
Heel formation for different compounds varied between 8.9% to 17.2%, and capacity loss
ranged from 25.2% to 80.0%. The breakthrough curves showed the cyclic adsorption
performance of different adsorbates and the effects of heel formation on capacity loss of
ACFC.
Aadsorbates with lower thermal stability (higher conversion value during pyrolysis)
showed higher heel buildup and vice versa. This is mainly due to adsorbate
decomposition resulting from exposure of residual adsorbate to high regeneration
temperature of 400°C, leading to coke formation.
TGA results showed less than 40% heel recovery at temperature as high as 900°C,
confirming that the heel mainly consists of highly stable coke formation from thermal
decomposition of adsorbates.
64
The 1st cycle desorption profiles of the tested adsorbates showed that adsorbates with
higher boiling points and larger kinetic diameters had higher adsorbate decomposition
and heel formation in that cycle due to exposure of residual adsorbates to the high
regeneration temperature. However, the 5-cycle cumulative heel depends on the amount
of adsorbed compounds during each consecutive cycle and a decrease in the amount
adsorbed reduced the amount of heel formed during that cycle.
Micropore surface analysis showed heel formation reduced BET surface area and pore
volume in regenerated ACFC compared to heat treated ACFC. The kinetic diameter of
the adsorbates affected the pore blockage of ACFC during regeneration and the bulkier
compounds showed significant loss in their adsorption capacity mainly due to the
inaccessibility of blocked ACFC pores.
It can generally be concluded that, heel formation on ACFC samples caused by
different alkylbenzenes was mainly due to thermal decomposition of the adsorbates
resulting from their exposure to high temperature during desorption. Therefore, thermal
stability of the adsorbates is a highly important property that needs to be considered
during high temperature regeneration of activated carbon in cyclic VOC
adsorption/desorption. In addition, the boiling point and kinetic diameter of the
adsorbates also need to be considered since these properties determine how much of the
residual adsorbate is exposed to high temperature. This research helps explaining how
different adsorbate properties contribute to irreversible adsorption on ACFC and will
ultimately help increasing the lifetime of activated carbon adsorbents, and consequently
result in lowering the operation and maintenance cost of the abatement system.
65
5.2 Recommendations
This research has investigated the effects of three main adsorbate properties (i.e. boiling
point, kinetic diameter and thermal stability) on heel formation on ACFC during electrothermal
regeneration. For further understanding of the heel formation mechanism affected by the
adsorbates’ properties, additional investigation should be conducted on the following topics:
Effects of the adsorbates’ functional group should be investigated. The general
understanding from the literature is that adsorbates from different functional groups
may interact differently with ACFC and also will go through different level of
thermal degradation; therefore, the heel formation mechanism might change for
adsorbates from different functional groups.
Multi-component adsorption should to be investigated. Based on related information
in the literature, it is expected that, in case of adsorbates mixture, there is a high
chance that the adsorbates might react with each other and therefore involve different
heel formation mechanism.
66
REFERENCES
Ahmad, A.A., and Idris, A. 2014. Preparation and characterization of activated carbons derived
from bio-solid: a review. Desalination & Water Treatment, 52(25-27): 4848-4862.
Ahmadpour, A., and Do, D.D. 1997. The preparation of activated carbon from macadamia
nutshell by chemical activation. Carbon, 35(12): 1723-1732.
Akta, Ö, and Çeçen, F. 2006. Effect of type of carbon activation on adsorption and its
reversibility. Journal of Chemical Technology & Biotechnology, 81(1): 94-101.
Aktaş, Ö, and Çeçen, F. 2007. Bioregeneration of activated carbon: A review. International
Biodeterioration & Biodegradation, 59(4): 257-272.
Álvarez, P.M., Beltrán, F.J., Gómez-Serrano, V., Jaramillo, J., and Rodrı́guez, E.M. 2004.
Comparison between thermal and ozone regenerations of spent activated carbon
exhausted with phenol. Water Research, 38(8): 2155-2165.
An, H., and Feng, B. 2010. Desorption of CO2 from activated carbon fibre–phenolic resin
composite by electrothermal effect. International Journal of Greenhouse Gas Control,
4(1): 57-63.
Ania, C.O., Menéndez, J.A., Parra, J.B., and Pis, J.J. 2004. Microwave-induced regeneration of
activated carbons polluted with phenol. a comparison with conventional thermal
regeneration. Carbon, 42(7): 1377.
Ania, C.O., Parra, J.B., Menéndez, J.A., and Pis, J.J. 2005. Effect of microwave and
conventional regeneration on the microporous and mesoporous network and on the
adsorptive capacity of activated carbons. Microporous and Mesoporous Materials, 85(1–
2): 7-15.
Atkinson, R. 2000. Atmospheric chemistry of VOCs and NOx. Atmospheric Environment,
34(12–14): 2063-2101.
67
Banerjee, D.K., Laidler, K.J., Nandi, B.N., and Patmore, D.J. 1986. Kinetic studies of coke
formation in hydrocarbon fractions of heavy crudes. Fuel, 65(4): 480-484.
Bansal, R.C. and Goyal, M. 2005. Activated carbon adsorption. Taylor & Francis, Boca Raton.
Bari, M.A., Kindzierski, W.B., and Spink, D. 2016. Twelve-year trends in ambient
concentrations of volatile organic compounds in a community of the Alberta Oil Sands
Region, Canada. Environment International, 91: 40-50.
Basu, P. 2013. Biomass gasification, pyrolysis and torrefaction. Academic Press, Amsterdam.
Berenjian, A., Chan, N., and Hoda, J.M. 2012. Volatile organic compounds removal methods: a
review. American Journal of Biochemistry and Biotechnology,(4): 220.
Bhatnagar, A. 2013. Application of adsorbents for water pollution control. Bentham Science
Publishers, Oak Park.
Boulinguiez, B., and Le Cloirec, P. 2010. Adsorption on activated carbons of five selected
volatile organic compounds present in biogas: comparison of granular and fiber cloth
materials. Energy and Fuels, 24(5): 4756-4765.
Brandt, J.C. and Donahue, W.S. 2009. Pyrolysis : types, processes, and industrial sources and
products. Nova Science Publishers, Inc, New York.
Brenner, R. 1993. Oxidative coupling of phenols on activated carbon. Impact on adsorption
equilibrium. Environmental Science and Technology, 27(10): 2079.
Brunauer, S., Emmett, P.H., and Teller, E. 1938. Adsorption of gases in multimolecular layers.
Journal of the American Chemical Society, 60(2): 309-319.
Burchell, T.D., Judkins, R.R., Rogers, M.R., and Williams, A.M. 1997. A novel process and
material for the separation of carbon dioxide and hydrogen sulfide gas mixtures. Carbon,
35(9): 1279-1294.
68
Caliskan, E., Bermúdez, J.M., Parra, J.B., Menéndez, J.A., Mahramanlıoğlu, M., and Ania, C.O.
2012. Low temperature regeneration of activated carbons using microwaves: Revising
conventional wisdom. Journal of Environmental Management, 102: 134-140.
Canada. 2004. Silicon dioxide and silica gel. Pest Management Regulatory Agency, Ottawa.
Che, M. and Védrine, J.C. 2012. Characterization of solid materials and heterogeneous catalysts.
Wiley-VCH ;Chichester, Weinheim.
Cherbański, R., Komorowska-Durka, M., Stefanidis, G.D., and Stankiewicz, A.I. 2011.
Microwave swing regeneration vs temperature swing regeneration-comparison of
desorption kinetics. Industrial & Engineering Chemistry Research, 50(14): 8632-8644.
Chung-Hwei Su, Sheng-Hung Wu, Sun-Ju Shen, Gong-Yih Shiue, Yih-Weng Wang, and Chi-
Min Shu 2009. Thermal characteristics and regeneration analyses of adsorbents by
differential scanning calorimetry and scanning electron microscope. Journal of Thermal
Analysis & Calorimetry, 96(3): 765-769.
Cooper, C.D. and Alley, F.C. 2011. Air pollution control : a design approach. Waveland Press,
Long Grove, Ill.
Dabrowski, A., Podkoscielny, P., Hubicki, Z., and Barczak, M. 2005. Adsorption of phenolic
compounds by activated carbon—a critical review. Chemosphere, 58(8): 1049-1070.
Davankov, V.A. and Tsyurupa, M. 2011. Hypercrosslinked polymeric networks and adsorbing
materials. Elsevier, Amsterdam ;Oxford.
Davis, M.E. 2002. Ordered porous materials for emerging applications. Nature, 417(6891): 813.
Deosarkar, S.P., and Pangarkar, V.G. 2004. Adsorptive separation and recovery of organics from
PHBA and SA plant effluents. Separation & Purification Technology, 38(3): 241-254.
Do, D.D. 1998. Adsorption analysis. Imperial College Press, London.
69
Dou, J., Qin, W., Ding, A., Xie, E., Zheng, L., and Ding, W. 2015. Engineering application of
activated alumina adsorption dams for emergency treatment of arsenic-contaminated
rivers. Environmental Technology, 36(21): 2755-2762.
Eley, D.D. 1996. Advances in Catalysis. Academic Press, USA.
Emamipour, H., Hashisho, Z., Cevallos, D., Rood, M.J., Thurston, D.L., Hay, K.J., Kim, B.J.,
and Sullivan, P.D. 2007a. Steady-state and dynamic desorption of organic vapor from
activated carbon with electrothermal swing adsorption. Environmental Science &
Technology, 41(14): 5063-5069.
Emamipour, H., Hashisho, Z., Cevallos, D., Rood, M.J., Thurston, D.L., Hay, K.J., Kim, B.J.,
and Sullivan, P.D. 2007b. Steady-state and dynamic desorption of organic vapor from
activated carbon with electrothermal swing adsorption. Environmental Science &
Technology, 41(14): 5063-5069.
Environment and Climate Change Canada. Volatile organic compound (VOC) concentration
limits for automotive refinishing products regulations, Last updated on May 05, 2015,
Accessed on June 16, 2016, available at http://www.ec.gc.ca/cov-
voc/default.asp?lang=En&n=71378DBB-1.
Environment and Climate Change Canada. 2016. Canadian environmental sustainability
indicators: air pollutant emissions., Gatineau, QC, Canada,
http://www.ec.gc.ca/indicateurs-indicators/default.asp?lang=en&n=E79F4C12-1.
Fayaz, M., Niknaddaf, S., Jahandar Lashaki, M., Shariaty, P., Hashisho, Z., Phillips, J.H.,
Anderson, J.E. and Nichols, M. 2015b. The effect of regeneration temperature and
heating rate on heel build-up during microwave regeneration. In Proceedings of the
American Institute of Chemical Engineers’ Annual Meeting, Salt Lake City, UT, 2015.
Fayaz, M., Shariaty, P., Atkinson, J.D., Hashisho, Z., Phillips, J.H., Anderson, J.E., and Nichols,
M. 2015. Using microwave heating to improve the desorption efficiency of high
70
molecular weight VOC from beaded activated carbon. Environmental Science &
Technology, 49(7): 4536-4542.
Fiedler, N., Laumbach, R., Kelly-McNeil, K., Lioy, P., Fan, Z., Zhang, J., Ottenweller, J.,
Ohman-Strickland, P., and Kipen, H. 2005. Health effects of a mixture of indoor air
volatile organics, their ozone oxidation products, and stress. Environmental Health
Perspectives, 113(11): 1542-1548.
Flanigen, E.M., Sand, L.B. and American Chemical Society. 1971. Molecular sieve zeolites.
American Chemical Society, Washington.
Fletcher, A.J., Yüzak, Y., and Thomas, K.M. 2006. Adsorption and desorption kinetics for
hydrophilic and hydrophobic vapors on activated carbon. Carbon, 44(5): 989-1004.
Foo, K.Y., and Hameed, B.H. 2010. Insights into the modeling of adsorption isotherm systems.
Chemical Engineering Journal, 156(1): 2-10.
Fuentes, G.A. and Bartholomew, C.H. 1997. Catalyst Deactivation 1997. Elsevier Science.
Garcia, A.A. 1991. Strategies for the recovery of chemicals from fermentation: a review of the
use of polymeric adsorbents. Biotechnology Progress, 7(1): 33-42.
Gédéon, A., Massiani, P. and Babonneau, F. 2008. Zeolites and related materials. Elsevier,
Amsterdam ;London.
Grant, T.M., and King, C.J. 1990. Mechanism of irreversible adsorption of phenolic compounds
by activated carbons. Industrial & Engineering Chemistry Research, 29(2): 264-271.
Guisnet, M., and Magnoux, P. 2001. Organic chemistry of coke formation. Applied Catalysis A:
General, 212(1–2): 83-96.
Gupta, V.K., and Verma, N. 2002. Removal of volatile organic compounds by cryogenic
condensation followed by adsorption. Chemical Engineering Science, 57(14): 2679-2696.
71
Hashisho, Z., Rood, M., and Botich, L. 2005. Microwave-swing adsorption to capture and
recover vapors from air streams with activated carbon fiber cloth. Environmental Science
& Technology, 39(17): 6851-6859.
Hashisho, Z., Emamipour, H., Rood, M.J., Hay, K.J., Kim, B.J., and Thurston, D. 2008.
Concomitant adsorption and desorption of organic vapor in dry and humid air streams
using microwave and direct electrothermal swing adsorption. Environmental Science &
Technology, 42(24): 9317-9322.
Hashisho, Z., Rood, M.J., Barot, S., and Bernhard, J. 2009. Role of functional groups on the
microwave attenuation and electric resistivity of activated carbon fiber cloth. Carbon,
47(7): 1814-1823.
Hradil, J. 2008. Adsorption properties of polymer adsorbents. In Recent Advances in Adsorption
Processes for Environmental Protection and Security. Edited by J.P. Mota and S.
Lyubchik. Springer Netherlands, Dordrecht. pp. 65-74.
Ince, N.H., and Apikyan, I.G. 2000. Combination of activated carbon adsorption with light-
enhanced chemical oxidation via hydrogen peroxide. Water Research, 34(17): 4169-
4176.
Jahandar Lashaki, M., Atkinson, J.D., Hashisho, Z., Phillips, J.H., Anderson, J.E., and Nichols,
M. 2016a. The role of beaded activated carbon's surface oxygen groups on irreversible
adsorption of organic vapors. Journal of Hazardous Materials, 317: 284-294.
Jahandar Lashaki, M., Atkinson, J.D., Hashisho, Z., Phillips, J.H., Anderson, J.E., Nichols, M.,
and Misovski, T. 2016b. Effect of desorption purge gas oxygen impurity on irreversible
adsorption of organic vapors. Carbon, 99: 310-317.
Jambor, B., and Hájeková, E. 2015. Formation of Coke Deposits and Coke Inhibition Methods
during Steam Cracking. Petroleum & Coal, 57(2): 143-153.
72
Johnsen, D.L., Zhang, Z., Emamipour, H., Yan, Z., and Rood, M.J. 2014. Effect of isobutane
adsorption on the electrical resistivity of activated carbon fiber cloth with select physical
and chemical properties. Carbon, 76: 435-445.
Juan Carratalá-Abril, Maria Angeles Lillo-Ródenas, Angel Linares-Solano, and Diego Cazorla-
Amorós 2009. Activated carbons for the removal of low-concentration gaseous toluene at
the semipilot scale. Industrial & Engineering Chemistry Research, 48(4): 2066-2075.
Kampa, M., and Castanas, E. 2008. Human health effects of air pollution. Environmental
Pollution, 151(2): 362-367.
Karatum, O., and Deshusses, M.A. 2016. A comparative study of dilute VOCs treatment in a
non-thermal plasma reactor. Chemical Engineering Journal, 294: 308-315.
Kawashima, D., Aihara, T., Kobayashi, Y., Kyotani, T., and Tomita, A. 2000. Preparation of
mesoporous carbon from organic polymer/silica nanocomposite. Chemistry of Materials,
12: 3397-3401.
Keller, J.U. and Staudt, R. 2005. Gas adsorption equilibria. Springer, New York.
Kennes, C. and Veiga, M.C. 2013. Air pollution prevention and control: bioreactors and
bioenergy. Wiley, Chichester, West Sussex.
Kesraoui-Ouki, S., Cheeseman, C.R., and Perry, R. 1994. Natural zeolite utilisation in pollution
control: A review of applications to metals' effluents. Journal of Chemical Technology &
Biotechnology, 59(2): 121-126.
Khan, F.I., and Kr. Ghoshal, A. 2000. Removal of volatile organic compounds from polluted air.
Journal of Loss Prevention in the Process Industries, 13(6): 527-545.
Kim, B.R. 2011. VOC emissions from automotive painting and their Control: a review.
Environmental Engineering Research, 16(1): 1-9.
73
Kim, K., Kang, C., You, Y., Chung, M., Woo, M., Jeong, W., Park, N., and Ahn, H. 2006.
Adsorption–desorption characteristics of VOCs over impregnated activated carbons.
Catalysis Today, 111(3–4): 223-228.
Knaebel, K.S. 2016. Adsorbent selection, Dublin, Ohio, USA, http://www.adsorption.com/wp-
content/uploads/2016/04/AdsorbentSel1B.pdf.
Kunin, R. 1977. Polymeric adsorbents for treatment of waste effluents. Polymer Engineering &
Science, 17(1): 58-62.
Kwiatkowski, J.F. 2012. Activated carbon. Nova Science Publishers, New York.
Langmuir, I. 1916. The Constitution and fundamental properties of solids and liquids. part I.
solids. Journal of the American Chemical Society, 38(11): 2221-2295.
Lapkin, A., Joyce, L., and Crittenden, B. 2004. Framework for evaluating the "greenness" of
chemical processes: case studies for a novel VOC recovery technology. Environmental
Science & Technology, 38(21): 5815-5823.
Lashaki, M., Jahandar, Fayaz, M., Niknaddaf, S., and Hashisho, Z. 2012a. Effect of the adsorbate
kinetic diameter on the accuracy of the Dubinin–Radushkevich equation for modeling
adsorption of organic vapors on activated carbon. Journal of Hazardous Materials, 241-
242: 154-163.
Lashaki, M.J., Fayaz, M., Wang, H.(., Hashisho, Z., Philips, J.H., Anderson, J.E., and Nichols,
M. 2012b. Effect of adsorption and regeneration temperature on irreversible adsorption of
organic vapors on beaded activated carbon. Environmental Science & Technology, 46(7):
4083-4090.
Lashaki, M.J., Atkinson, J.D., Hashisho, Z., Phillips, J.H., Anderson, J.E., and Nichols, M. 2016.
The role of beaded activated carbon's pore size distribution on heel formation during
cyclic adsorption/desorption of organic vapors. Journal of Hazardous Materials, 315: 42-
51.
74
Le Cloirec, P. 2012. Adsorption onto activated carbon fiber cloth and electrothermal desorption
of volatile organic compound (VOCs): a specific review. Chinese Journal of Chemical
Engineering, 20(3): 461-468.
Ledesma, B., Román, S., Álvarez-Murillo, A., Sabio, E., and González-García, C. 2014.
Fundamental study on the thermal regeneration stages of exhausted activated carbons:
kinetics. Journal of Thermal Analysis & Calorimetry, 115(1): 537-543.
Leng, C., and Pinto, N.G. 1996. An investigation of the mechanisms of chemical regeneration of
activated carbon. Industrial & Engineering Chemistry Research, 35(6): 2024-2031.
Li, J., Lu, R., Dou, B., Ma, C., Hu, Q., Liang, Y., Wu, F., Qiao, S., and Hao, Z. 2012. Porous
graphitized carbon for adsorptive removal of benzene and the electrothermal
regeneration. Environmental Science & Technology, 46(22): 12648-12654.
Li, L., Liu, S., and Liu, J. 2011. Surface modification of coconut shell based activated carbon for
the improvement of hydrophobic VOC removal. Journal of Hazardous Materials, 192(2):
683-690.
Liu, P.K.T., Feltch, S.M., and Wagner, N.J. 1987. Thermal desorption behavior of aliphatic and
aromatic hydrocarbons loaded on activated carbon. Industrial & Engineering Chemistry
Research, 26(8): 1540-1545.
Liu, W., Vidić, R.D., and Brown, T.D. 1998. Optimization of sulfur impregnation protocol for
fixed-bed application of activated carbon-based sorbents for gas-phase mercury removal.
Environmental Science & Technology, 32(4): 531-538.
Lordgooei, M., Carmichael, K.R., Kelly, T.W., Rood, M.J., and Larson, S.M. 1996. Carbon-
based materials activated carbon cloth adsorption-cryogenic system to recover toxic
volatile organic compounds. Gas Separation & Purification, 10(2): 123-130.
Luo, L., Ramirez, D., Rood, M.J., Grevillot, G., Hay, K.J., and Thurston, D.L. 2006. Adsorption
and electrothermal desorption of organic vapors using activated carbon adsorbents with
novel morphologies. Carbon, 44(13): 2715-2723.
75
Mallouk, K.E., Johnsen, D.L., and Rood, M.J. 2010. Capture and recovery of isobutane by
electrothermal swing adsorption with post-desorption liquefaction. Environmental
Science & Technology, 44(18): 7070-7075.
Marsh, H. and Rodríguez-Reinoso, F. 2006. Activated carbon. Elsevier, Amsterdam ;London.
McLaughlin, H. 1995. Regenerate activated carbon using organic solvents. Chemical
Engineering Progress, 91(7).
Méndez, A., Gascó, G., Freitas, M.M.A., Siebielec, G., Stuczynski, T., and Figueiredo, J.L.
2005. Preparation of carbon-based adsorbents from pyrolysis and air activation of sewage
sludges. Chemical Engineering Journal, 108(1–2): 169-177.
Moldoveanu, S. 2010. Pyrolysis of organic molecules with applications to health and
environmental issues. Elsevier, Amsterdam.
Nabatilan, M.M., Harhad, A., Wolenski, P.R., and Moe, W.M. 2010. Activated carbon load
equalization of transient concentrations of gas-phase toluene: Effect of gas flow rate
during pollutant non-loading intervals. Chemical Engineering Journal, 157(2–3): 339-
347.
Nakhla, G., Abuzaid, N., and Farooq, S. 1994. Activated carbon adsorption of phenolics in oxic
systems: effect of pH and temperature variations. Water Environment Research, 66(6):
842-850.
Niknaddaf, S. 2015. Heel buildup during electrothermal regeneration of Activated Carbon Fiber
Cloth. MSc thesis, University of Alberta.
Niknaddaf, S., Atkinson, J.D., Shariaty, P., Jahandar Lashaki, M., Hashisho, Z., Phillips, J.H.,
Anderson, J.E., and Nichols, M. 2016. Heel formation during volatile organic compound
desorption from activated carbon fiber cloth. Carbon, 96: 131-138.
Okazaki, M. 1996. Desorption characteristics of aromatic compounds in aqueous solution on
solid adsorbents.
76
Olivier, J.P. 1998. Improving the models used for calculating the size distribution of micropore
volume of activated carbons from adsorption data. Carbon, 36(10): 1469-1472.
Pan, B., Pan, B., Zhang, W., Lv, L., Zhang, Q., and Zheng, S. 2009. Development of polymeric
and polymer-based hybrid adsorbents for pollutants removal from waters. Chemical
Engineering Journal, 151(1–3): 19-29.
Pariselli, F., Sacco, M.G., Ponti, J., and Rembges, D. 2009. Effects of toluene and benzene air
mixtures on human lung cells (A549). Experimental and Toxicologic Pathology, 61(4):
381-386.
Parmar, G.R., and Rao, N.N. 2009. Emerging control technologies for volatile organic
compounds. Critical Reviews in Environmental Science & Technology, 39(1): 41-78.
Popescu, M., Joly, J.P., Carré, J., and Danatoiu, C. 2003. Dynamical adsorption and temperature-
programmed desorption of VOCs (toluene, butyl acetate and butanol) on activated
carbons. Carbon, 41(4): 739.
Radecki, P.P. and American Institute of Chemical Engineers. 1999. Emerging separation and
separative reaction technologies for process waste reduction : adsorption and membrane
systems. Center for Waste Reduction Technologies, American Institute of Chemical
Engineers, New York.
Ramírez, N., Cuadras, A., Rovira, E., Borrull, F., and Marcé, R.M. 2010. Comparative study of
solvent extraction and thermal desorption methods for determining a wide range of
volatile organic compounds in ambient air. Talanta, 82(2): 719-727.
Ramirez, D., Emamipour, H., Vidal, E.X., Rood, M.J., and Hay, K.J. 2011. Capture and recovery
of methyl ethyl Ketone with electrothermal-swing adsorption systems. Journal of
Environmental Engineering, 137(9): 826-832.
Ramos, M.E., Bonelli, P.R., Cukierman, A.L., Ribeiro Carrott, M.M.L., and Carrott, P.J.M.
2010. Adsorption of volatile organic compounds onto activated carbon cloths derived
77
from a novel regenerated cellulosic precursor. Journal of Hazardous Materials, 177(1-3):
175-182.
Ratnasamy, C., Wagner, J.P., Spivey, S., and Weston, E. 2012. Removal of sulfur compounds
from natural gas for fuel cell applications using a sequential bed system. Catalysis Today,
198(1): 233-238.
Reuss, J., Bathen, D., and Schmidt-Traub, H. 2002. Desorption by microwaves: mechanisms of
multicomponent mixtures. Chemical Engineering and Technology, 25: 381-384.
Riccardi, E., Jee-Ching Wang, and Liapis, A.I. 2014. Modeling the construction of polymeric
adsorbent media: effects of counter-ions on ligand immobilization and pore structure.
Journal of Chemical Physics, 140(8): 084901-084901; 084901-9.
Robinson, A.L., Donahue, N.M., Shrivastava, M.K., Weitkamp, E.A., Sage, A.M., Grieshop,
A.P., Lane, T.E., Pierce, J.R., and Pandis, S.N. 2007. Rethinking organic aerosols:
semivolatile emissions and photochemical aging. Science, 315(5816): 1259-1262.
Rouquerol, F. 2014. Adsorption by powders and porous solids. Academic Press, Amsterdam
;Boston.
Rudling, J., and Björkholm, E. 1987. Irreversibility effects in liquid desorption of organic
solvents from activated carbon. Journal of Chromatography A, 392: 239-248.
Ruhl, J. 2000. Reducing the pressures of VOC recovery. Pollution Engineering, 32(1): 40.
Ruthven, D.M., Farooq, S. and Knaebel, K.S. 1994. Pressure swing adsorption. VCH Publishers,
New York, N.Y.
Salvador, F., Martin-Sanchez, N., Sanchez-Hernandez, R., Sanchez-Montero, M., and Izquierdo,
C. 2015. Regeneration of carbonaceous adsorbents. Part I: thermal regeneration.
Microporous & Mesoporous Materials, 202: 259-276.
78
Scholz, M., and Martin, R.J. 1998. Control of bio-regenerated granular activated carbon by
spreadsheet modelling. Journal of Chemical Technology & Biotechnology, 71(3): 253-
261.
Schork, J.M., and Fair, J.R. 1988. Steaming of activated carbon beds. Industrial & Engineering
Chemistry Research, 27(8): 1545-1547.
Sheintuch, M., and Matatov-Meytal, Y.I. 1999. Comparison of catalytic processes with other
regeneration methods of activated carbon. Catalysis Today, 53(1): 73-80.
Shonnard, D.R., and Hiew, D.S. 2000. Comparative environmental assessments of VOC
recovery and recycle design alternatives for a gaseous waste stream. Environmental
Science and Technology, 34: 5222-5228.
Slejko, F.L. 1985. Adsorption technology : a step-by-step approach to process evaluation and
application. M. Dekker, New York.
Son, H.K., Sivakumar, S., Rood, M.J., and Kim, B.J. 2016. Electrothermal adsorption and
desorption of volatile organic compounds on activated carbon fiber cloth. Journal of
Hazardous Materials, 301: 27-34.
Strazhesko, D.N. and Barouch, A. 1973. Adsorption and Adsorbents. John Wiley & Sons
Australia, Limited.
Subrenat, A., Baléo, J.N., Le Cloirec, P., and Blanc, P.E. 2001. Electrical behaviour of activated
carbon cloth heated by the joule effect: desorption application. Carbon, 39(5): 707-716.
Subrenat, A., and Le Cloirec, P. 2004. Adsorption onto activated carbon cloths and
electrothermal regeneration: its potential industrial applications. Journal of
Environmental Engineering, 130(3): 249-257.
Suffet, I.H. and McGuire, M.J. 1980. Activated carbon adsorption of organics from the aqueous
phase. Ann Arbor Science, Ann Arbor, Mich.

79
Suidan, M. 1991. Role of dissolved oxygen on the adsorptive capacity of activated carbon for
synthetic and natural organic matter. Environ. Sci. Technol, 25(9): 1612-1618.
Sullivan, P.D., Rood, M.J., Grevillot, G., Wander, J.D., and Hay, K.J. 2004. Activated carbon
fiber cloth electrothermal swing adsorption system. Environmental Science &
Technology, 38(18): 4865-4877.
Suzuki, M., Misic, D.M., Koyama, O., and Kawazoe, K. 1978. Study of thermal regeneration of
spent activated carbons: thermogravimetric measurement of various single component
organics loaded on activated carbons. Chemical Engineering Science, 33(3): 271-279.
Švob, V., Deur-Šiftar, Đ, and Cramers, C.A. 1974. Mechanisms of the thermal degradation of
alkylbenzenes. Journal of Chromatography A, 91: 659-675.
Tamon, H., Saito, T., Kishimura, M., Okazaki, M., and Toei, R. 1990. Solvent regeneration of
spent activated carbon in wastewater treatment. Journal of Chemical Engineering of
Japan, 23(4): 426-432.
Tascón, J.M.D. 2012. Novel carbon adsorbents. Elsevier, Amsterdam ;Waltham, MA.
Terzyk, A.P. 2007. The impact of carbon surface chemical composition on the adsorption of
phenol determined at the real oxic and anoxic conditions. Applied Surface Science,
253(13): 5752-5755.
Tobias, H., and Soffer, A. 1985. Chemisorption of halogen on carbon—II thermal reversibility of
Cl2, HCl and H2 chemisorption. Carbon, 23(3): 291-299.
Torrents, A., Damera, R., and Hao, O.J. 1997. Low-temperature thermal desorption of aromatic
compounds from activated carbon. Journal of Hazardous Materials, 54(3): 141-153.
Towfighi, J., Sadrameli, M., and Niaei, A. 2002. Coke Formation Mechanisms and Coke
Inhibiting Methods in Pyrolysis Furnaces. Journal of Chemical Engineering of Japan,
35(10): 923-937.
80
Tzabar, N., and ter Brake, H. J. M. 2016. Adsorption isotherms and sips models of nitrogen,
methane, ethane, and propane on commercial activated carbons and polyvinylidene
chloride. Adsorption, 22: 901.
US Environmental Protection Agency. 2016. Technical Overview of Volatile Organic
Compounds, https://www.epa.gov/indoor-air-quality-iaq/technical-overview-volatile-
organic-compounds#EPA.
USEPA. 1991. EPA handbook: control technologies for hazardous air pollutants, Washington,
DC.
Valix, M., Cheung, W.H., and McKay, G. 2004. Preparation of activated carbon using low
temperature carbonisation and physical activation of high ash raw bagasse for acid dye
adsorption. Chemosphere, 56(5): 493-501.
Van Speybroeck, V., Hemelsoet, K., Minner, B., Marin, G.B., and Waroquier, M. 2007.
Modeling elementary reactions in coke formation from first principles. Molecular
Simulation, 33(9-10): 879-887.
Vidic, R.D., Tessmer, C.H., and Uranowski, L.J. 1997. Impact of surface properties of activated
carbons on oxidative coupling of phenolic compounds. Carbon, 35(9): 1349-1360.
Wang, H., Lashaki, M.J., Fayaz, M., Hashisho, Z., Philips, J.H., Anderson, J.E., and Nichols, M.
2012. Adsorption and desorption of mixtures of organic vapors on beaded activated
carbon. Environmental Science & Technology, 46(15): 8341-8350.
Wang, J., and Kaskel, S. 2012. KOH activation of carbon-based materials for energy storage.
Journal of Materials Chemistry, 22(45): 23710-23725.
Wang, Q., Liang, X., Zhang, R., Liu, C., Liu, X., Qiao, W., Zhan, L., and Ling, L. 2009.
Preparation of polystyrene-based activated carbon spheres and their adsorption of
dibenzothiophene. New Carbon Materials, 24(1): 55-60.
81
Wu, J. 2004. Modeling adsorption of organic compounds on activated carbon. PhD thesis, Umeå
University, Sweden.
Yan, L., and Sorial, G.A. 2011. Chemical activation of bituminous coal for hampering
oligomerization of organic contaminants. Journal of Hazardous Materials, 197: 311-319.
Yao, M., Zhang, Q., Hand, D.W., Perram, D., and Taylor, R. 2009. Adsorption and regeneration
on activated carbon fiber cloth for volatile organic compounds at indoor concentration
levels. Journal of the Air & Waste Management Association, 59(1): 31-36.
Yapsaklı, K., Çeçen, F., Aktaş, Ö, and Can, Z.S. 2009. Impact of surface properties of granular
activated carbon and preozonation on adsorption and desorption of natural organic
matter. Environmental Engineering Science, 26(3): 489-500.
Yonge, D.R., Zhan, P.J., Poznanska, K., and Keinath, T.M. 1985. Single-solute irreversible
adsorption on granular activated carbon. Environmental Science & Technology, 19(8):
690.
Yu, F.D., Luo, L., and Grevillot, G. 2007. Electrothermal swing adsorption of toluene on an
activated carbon monolith: experiments and parametric theoretical study. Chemical
Engineering and Processing: Process Intensification, 46(1): 70-81.
Zeynali., M.E. 2011. Evaluation of the effect of catalyst pore-size distribution on the
effectiveness factor in ethylbenzene dehydrogenation by orthogonal collocation. Defect
and Diffusion Forum, 316-317: 155-169.
Zhang, K., Zhang, D., and Zhang, K. 2016. Arsenic removal from water using a novel
amorphous adsorbent developed from coal fly ash. Water Science & Technology, 73(8):
1954-1962.
Zhang, T., Walawender, W.P., Fan, L.T., Fan, M., Daugaard, D., and Brown, R.C. 2004.
Preparation of activated carbon from forest and agricultural residues through CO2
activation. Chemical Engineering Journal, 105(1–2): 53-59.
82
Zhao, L., Huang, S., and Wei, Z. 2014. A demonstration of biofiltration for VOC removal in
petrochemical industries. Environmental Science: Processes & Impacts, 16(5): 1001-
1007.
Zheng, Z., Yong, Q., Geoff, X.W., and Xuehai, F. 2013. Numerical description of coalbed
methane desorption stages based on isothermal adsorption experiment. Science China
Earth Sciences, 56(6): 1029-1036.
Zhou, L. 2007. Adsorption. World Scientific, Singapore ;Hackensack, NJ.
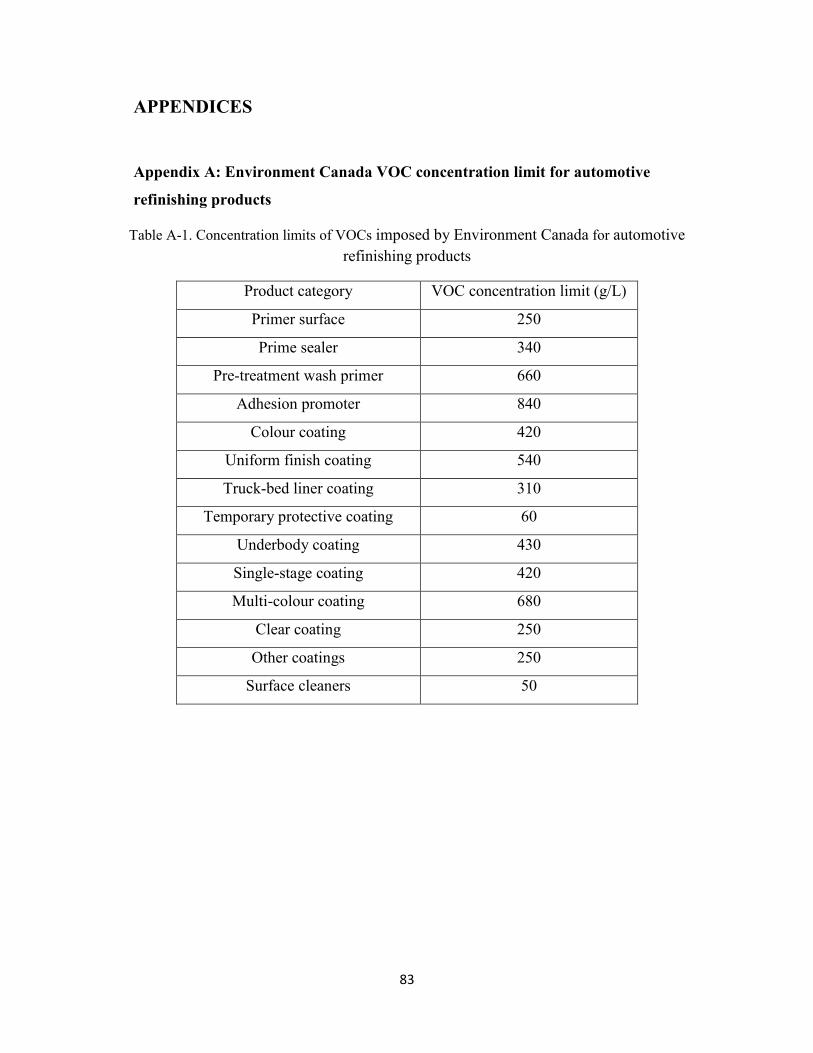
83
APPENDICES
Appendix A: Environment Canada VOC concentration limit for automotive
refinishing products
Table A-1. Concentration limits of VOCs imposed by Environment Canada for automotive
refinishing products
Product category VOC concentration limit (g/L)
Primer surface 250
Prime sealer 340
Pre-treatment wash primer 660
Adhesion promoter 840
Colour coating 420
Uniform finish coating 540
Truck-bed liner coating 310
Temporary protective coating 60
Underbody coating 430
Single-stage coating 420
Multi-colour coating 680
Clear coating 250
Other coatings 250
Surface cleaners 50
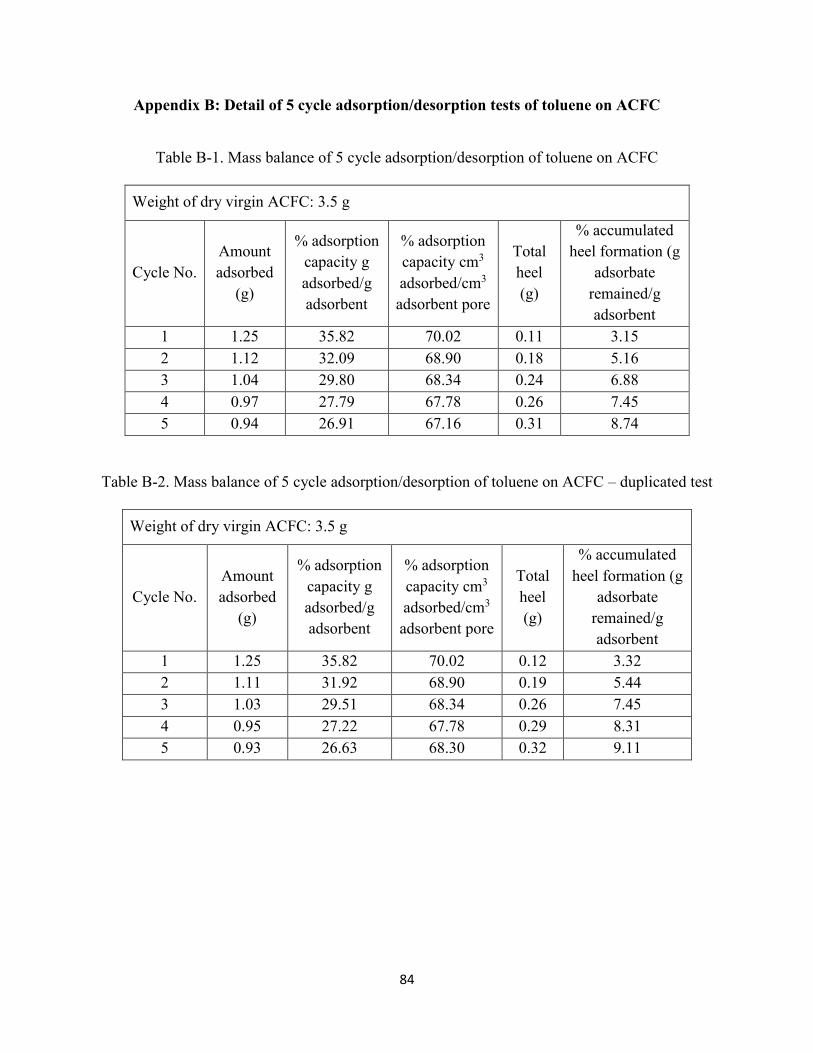
84
Appendix B: Detail of 5 cycle adsorption/desorption tests of toluene on ACFC
Table B-1. Mass balance of 5 cycle adsorption/desorption of toluene on ACFC
Weight of dry virgin ACFC: 3.5 g
Cycle No.
Amount
adsorbed
(g)
% adsorption
capacity g
adsorbed/g
adsorbent
% adsorption
capacity cm3
adsorbed/cm3
adsorbent pore
Total
heel
(g)
% accumulated
heel formation (g
adsorbate
remained/g
adsorbent
1 1.25 35.82 70.02 0.11 3.15
2 1.12 32.09 68.90 0.18 5.16
3 1.04 29.80 68.34 0.24 6.88
4 0.97 27.79 67.78 0.26 7.45
5 0.94 26.91 67.16 0.31 8.74
Table B-2. Mass balance of 5 cycle adsorption/desorption of toluene on ACFC – duplicated test
Weight of dry virgin ACFC: 3.5 g
Cycle No.
Amount
adsorbed
(g)
% adsorption
capacity g
adsorbed/g
adsorbent
% adsorption
capacity cm3
adsorbed/cm3
adsorbent pore
Total
heel
(g)
% accumulated
heel formation (g
adsorbate
remained/g
adsorbent
1 1.25 35.82 70.02 0.12 3.32
2 1.11 31.92 68.90 0.19 5.44
3 1.03 29.51 68.34 0.26 7.45
4 0.95 27.22 67.78 0.29 8.31
5 0.93 26.63 68.30 0.32 9.11
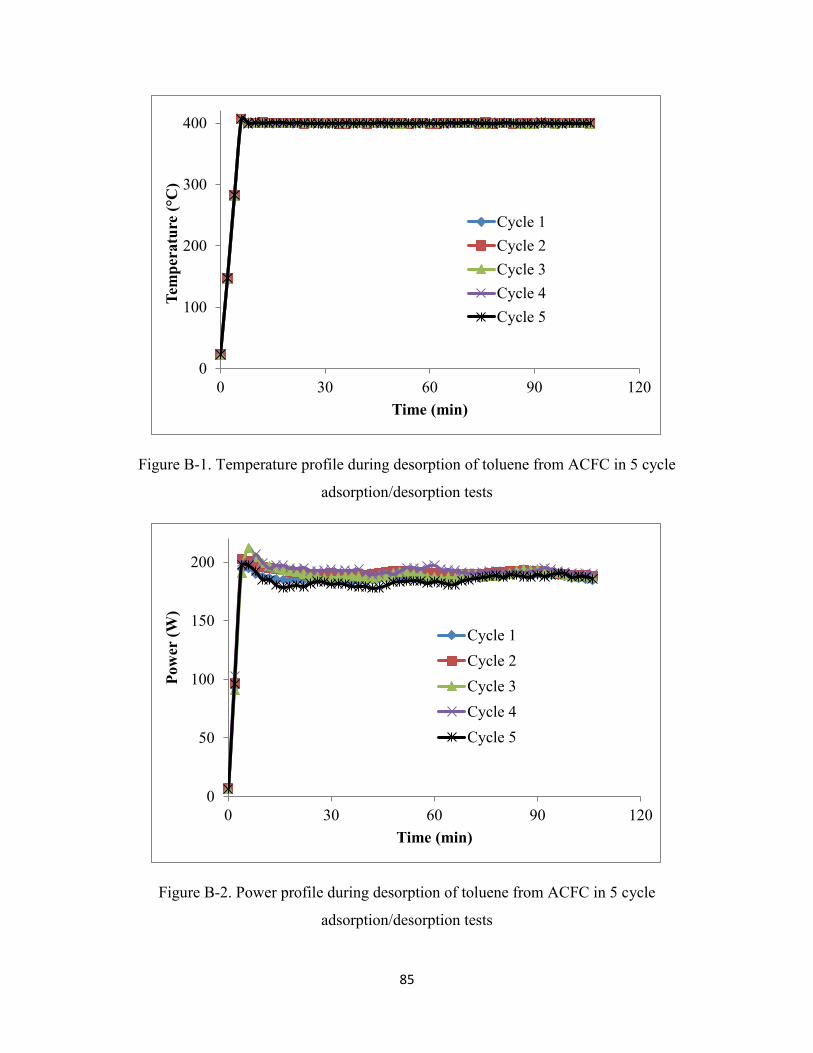
85
Figure B-1. Temperature profile during desorption of toluene from ACFC in 5 cycle
adsorption/desorption tests
Figure B-2. Power profile during desorption of toluene from ACFC in 5 cycle
adsorption/desorption tests
0
100
200
300
400
0 30 60 90 120
Tem
per
atu
re (°C
)
Time (min)
Cycle 1
Cycle 2
Cycle 3
Cycle 4
Cycle 5
0
50
100
150
200
0 30 60 90 120
Pow
er (
W)
Time (min)
Cycle 1
Cycle 2
Cycle 3
Cycle 4
Cycle 5
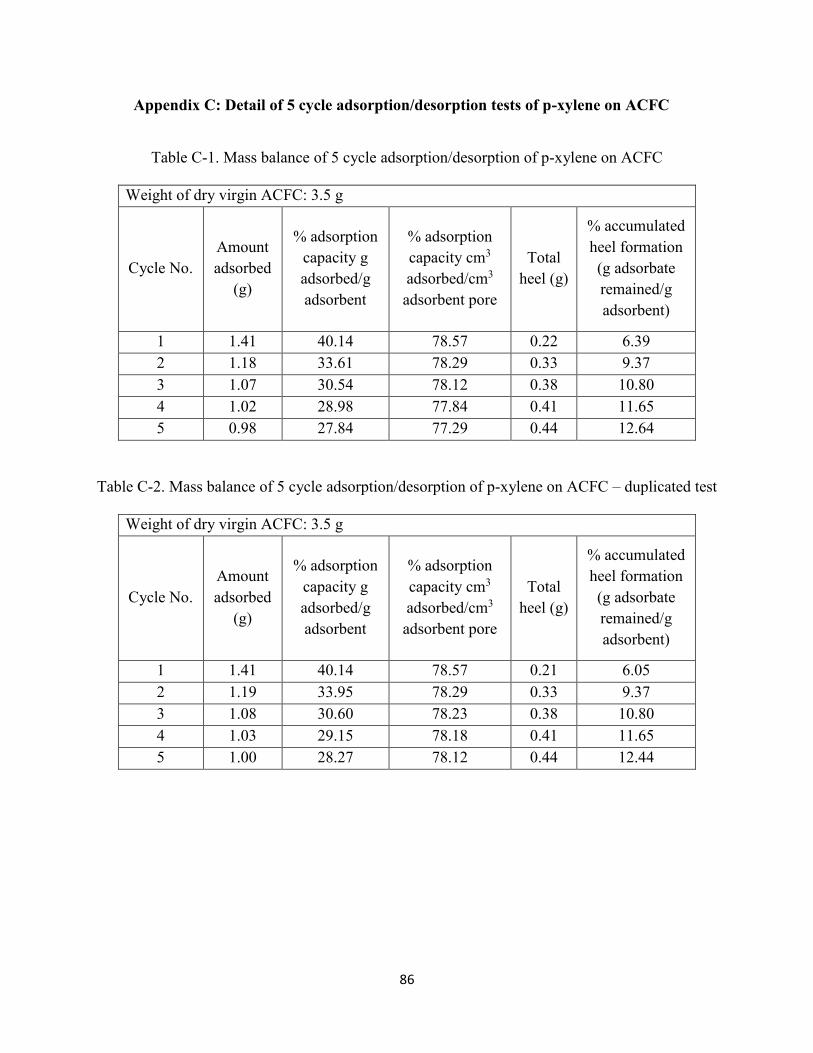
86
Appendix C: Detail of 5 cycle adsorption/desorption tests of p-xylene on ACFC
Table C-1. Mass balance of 5 cycle adsorption/desorption of p-xylene on ACFC
Weight of dry virgin ACFC: 3.5 g
Cycle No.
Amount
adsorbed
(g)
% adsorption
capacity g
adsorbed/g
adsorbent
% adsorption
capacity cm3
adsorbed/cm3
adsorbent pore
Total
heel (g)
% accumulated
heel formation
(g adsorbate
remained/g
adsorbent)
1 1.41 40.14 78.57 0.22 6.39
2 1.18 33.61 78.29 0.33 9.37
3 1.07 30.54 78.12 0.38 10.80
4 1.02 28.98 77.84 0.41 11.65
5 0.98 27.84 77.29 0.44 12.64
Table C-2. Mass balance of 5 cycle adsorption/desorption of p-xylene on ACFC – duplicated test
Weight of dry virgin ACFC: 3.5 g
Cycle No.
Amount
adsorbed
(g)
% adsorption
capacity g
adsorbed/g
adsorbent
% adsorption
capacity cm3
adsorbed/cm3
adsorbent pore
Total
heel (g)
% accumulated
heel formation
(g adsorbate
remained/g
adsorbent)
1 1.41 40.14 78.57 0.21 6.05
2 1.19 33.95 78.29 0.33 9.37
3 1.08 30.60 78.23 0.38 10.80
4 1.03 29.15 78.18 0.41 11.65
5 1.00 28.27 78.12 0.44 12.44
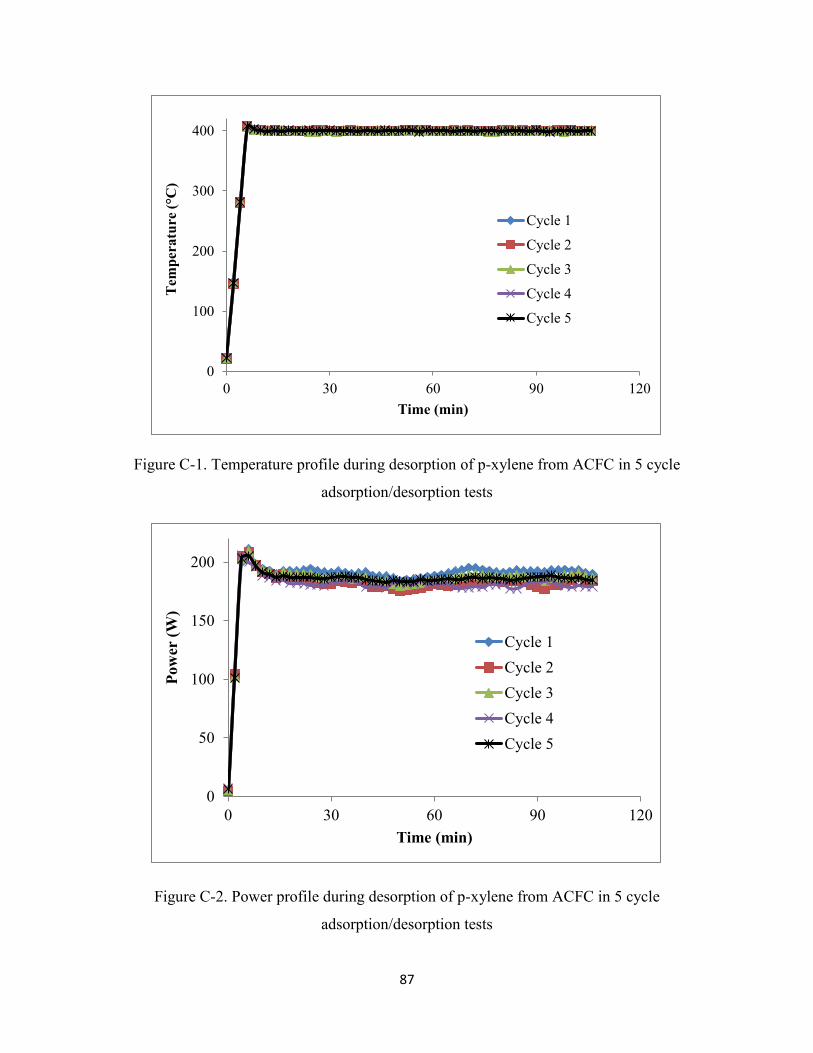
87
Figure C-1. Temperature profile during desorption of p-xylene from ACFC in 5 cycle
adsorption/desorption tests
Figure C-2. Power profile during desorption of p-xylene from ACFC in 5 cycle
adsorption/desorption tests
0
100
200
300
400
0 30 60 90 120
Tem
per
atu
re (°C
)
Time (min)
Cycle 1
Cycle 2
Cycle 3
Cycle 4
Cycle 5
0
50
100
150
200
0 30 60 90 120
Pow
er (
W)
Time (min)
Cycle 1
Cycle 2
Cycle 3
Cycle 4
Cycle 5
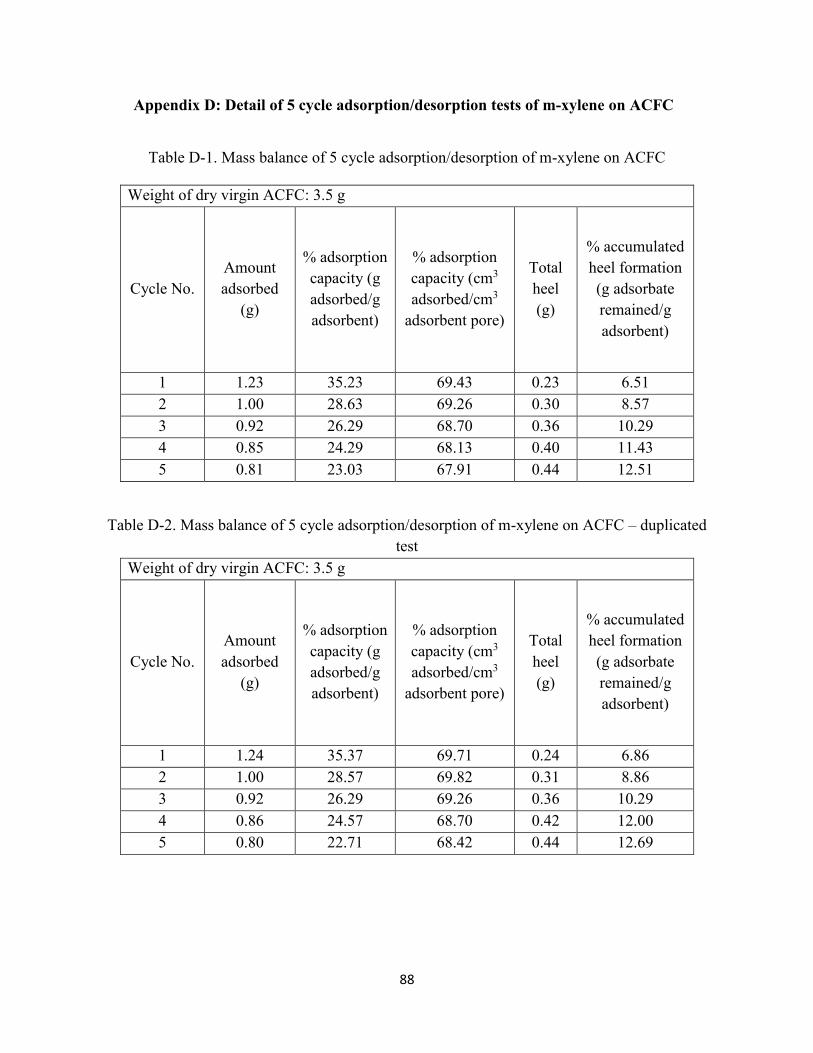
88
Appendix D: Detail of 5 cycle adsorption/desorption tests of m-xylene on ACFC
Table D-1. Mass balance of 5 cycle adsorption/desorption of m-xylene on ACFC
Weight of dry virgin ACFC: 3.5 g
Cycle No.
Amount
adsorbed
(g)
% adsorption
capacity (g
adsorbed/g
adsorbent)
% adsorption
capacity (cm3
adsorbed/cm3
adsorbent pore)
Total
heel
(g)
% accumulated
heel formation
(g adsorbate
remained/g
adsorbent)
1 1.23 35.23 69.43 0.23 6.51
2 1.00 28.63 69.26 0.30 8.57
3 0.92 26.29 68.70 0.36 10.29
4 0.85 24.29 68.13 0.40 11.43
5 0.81 23.03 67.91 0.44 12.51
Table D-2. Mass balance of 5 cycle adsorption/desorption of m-xylene on ACFC – duplicated
test
Weight of dry virgin ACFC: 3.5 g
Cycle No.
Amount
adsorbed
(g)
% adsorption
capacity (g
adsorbed/g
adsorbent)
% adsorption
capacity (cm3
adsorbed/cm3
adsorbent pore)
Total
heel
(g)
% accumulated
heel formation
(g adsorbate
remained/g
adsorbent)
1 1.24 35.37 69.71 0.24 6.86
2 1.00 28.57 69.82 0.31 8.86
3 0.92 26.29 69.26 0.36 10.29
4 0.86 24.57 68.70 0.42 12.00
5 0.80 22.71 68.42 0.44 12.69
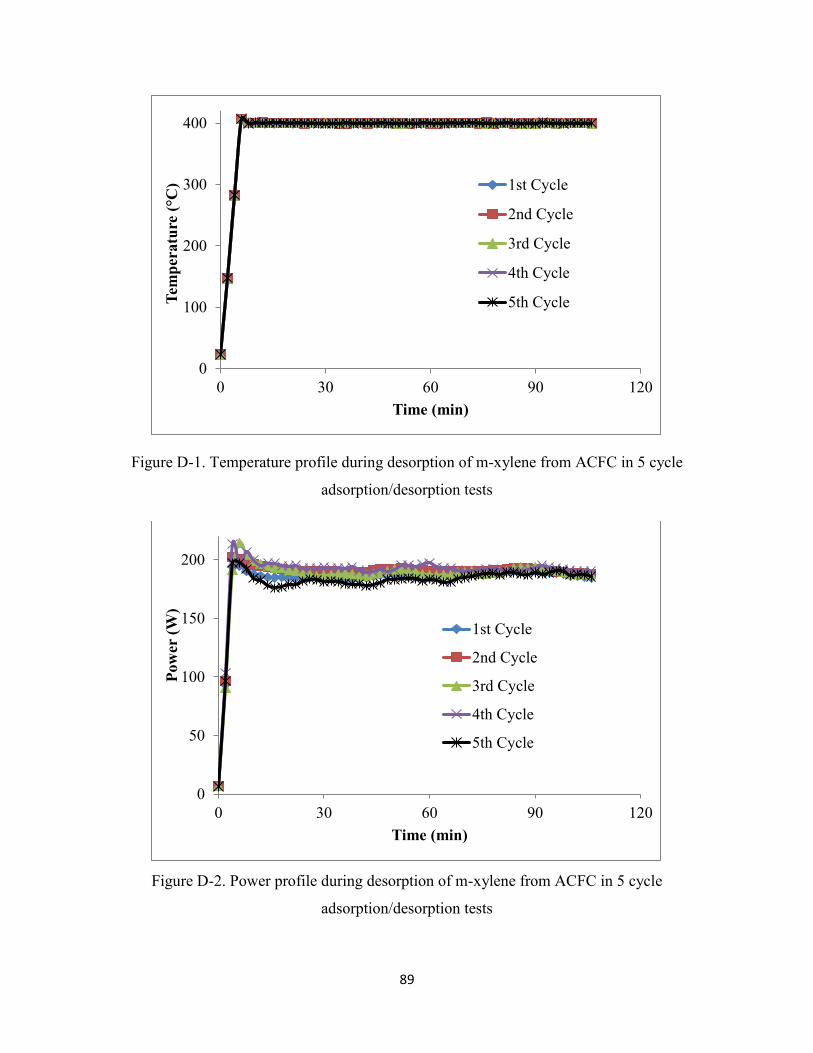
89
Figure D-1. Temperature profile during desorption of m-xylene from ACFC in 5 cycle
adsorption/desorption tests
Figure D-2. Power profile during desorption of m-xylene from ACFC in 5 cycle
adsorption/desorption tests
0
100
200
300
400
0 30 60 90 120
Tem
per
atu
re (°C
)
Time (min)
1st Cycle
2nd Cycle
3rd Cycle
4th Cycle
5th Cycle
0
50
100
150
200
0 30 60 90 120
Pow
er (
W)
Time (min)
1st Cycle
2nd Cycle
3rd Cycle
4th Cycle
5th Cycle
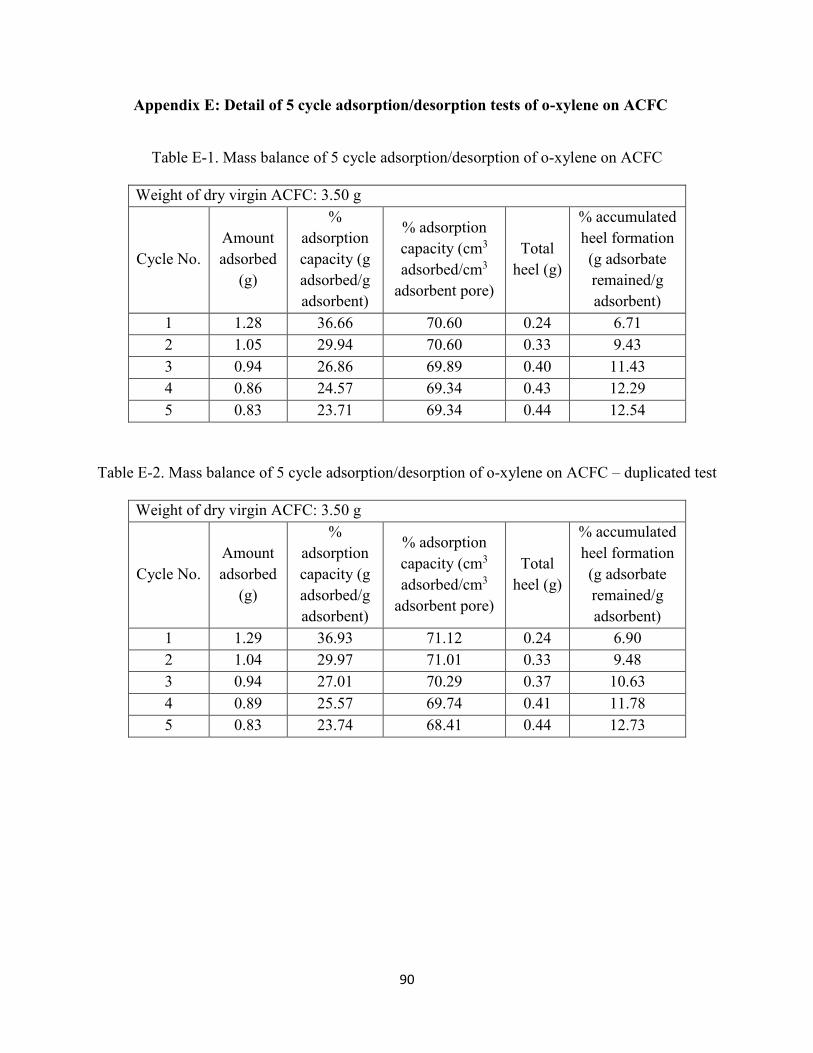
90
Appendix E: Detail of 5 cycle adsorption/desorption tests of o-xylene on ACFC
Table E-1. Mass balance of 5 cycle adsorption/desorption of o-xylene on ACFC
Weight of dry virgin ACFC: 3.50 g
Cycle No.
Amount
adsorbed
(g)
%
adsorption
capacity (g
adsorbed/g
adsorbent)
% adsorption
capacity (cm3
adsorbed/cm3
adsorbent pore)
Total
heel (g)
% accumulated
heel formation
(g adsorbate
remained/g
adsorbent)
1 1.28 36.66 70.60 0.24 6.71
2 1.05 29.94 70.60 0.33 9.43
3 0.94 26.86 69.89 0.40 11.43
4 0.86 24.57 69.34 0.43 12.29
5 0.83 23.71 69.34 0.44 12.54
Table E-2. Mass balance of 5 cycle adsorption/desorption of o-xylene on ACFC – duplicated test
Weight of dry virgin ACFC: 3.50 g
Cycle No.
Amount
adsorbed
(g)
%
adsorption
capacity (g
adsorbed/g
adsorbent)
% adsorption
capacity (cm3
adsorbed/cm3
adsorbent pore)
Total
heel (g)
% accumulated
heel formation
(g adsorbate
remained/g
adsorbent)
1 1.29 36.93 71.12 0.24 6.90
2 1.04 29.97 71.01 0.33 9.48
3 0.94 27.01 70.29 0.37 10.63
4 0.89 25.57 69.74 0.41 11.78
5 0.83 23.74 68.41 0.44 12.73

91
Figure E-1. Temperature profile during desorption of o-xylene from ACFC in 5 cycle
adsorption/desorption tests
Figure E-2. Power profile during desorption of o-xylene from ACFC in 5 cycle
adsorption/desorption tests
0
100
200
300
400
0 30 60 90 120
Tem
per
atu
re (°C
)
Time (min)
Cycle 1
Cycle 2
Cycle 3
Cycle 4
Cycle 5
0
50
100
150
200
0 30 60 90 120
Pow
er (
W)
Time (min)
Cycle 1
Cycle 2
Cycle 3
Cycle 4
Cycle 5
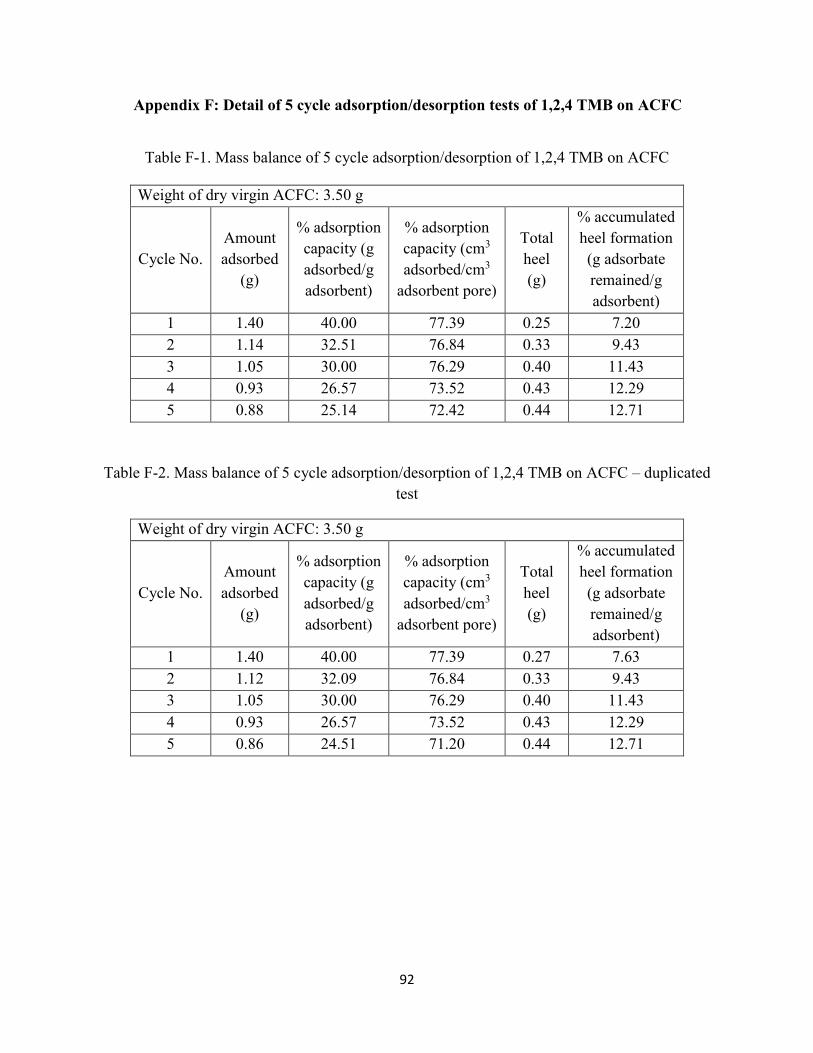
92
Appendix F: Detail of 5 cycle adsorption/desorption tests of 1,2,4 TMB on ACFC
Table F-1. Mass balance of 5 cycle adsorption/desorption of 1,2,4 TMB on ACFC
Weight of dry virgin ACFC: 3.50 g
Cycle No.
Amount
adsorbed
(g)
% adsorption
capacity (g
adsorbed/g
adsorbent)
% adsorption
capacity (cm3
adsorbed/cm3
adsorbent pore)
Total
heel
(g)
% accumulated
heel formation
(g adsorbate
remained/g
adsorbent)
1 1.40 40.00 77.39 0.25 7.20
2 1.14 32.51 76.84 0.33 9.43
3 1.05 30.00 76.29 0.40 11.43
4 0.93 26.57 73.52 0.43 12.29
5 0.88 25.14 72.42 0.44 12.71
Table F-2. Mass balance of 5 cycle adsorption/desorption of 1,2,4 TMB on ACFC – duplicated
test
Weight of dry virgin ACFC: 3.50 g
Cycle No.
Amount
adsorbed
(g)
% adsorption
capacity (g
adsorbed/g
adsorbent)
% adsorption
capacity (cm3
adsorbed/cm3
adsorbent pore)
Total
heel
(g)
% accumulated
heel formation
(g adsorbate
remained/g
adsorbent)
1 1.40 40.00 77.39 0.27 7.63
2 1.12 32.09 76.84 0.33 9.43
3 1.05 30.00 76.29 0.40 11.43
4 0.93 26.57 73.52 0.43 12.29
5 0.86 24.51 71.20 0.44 12.71
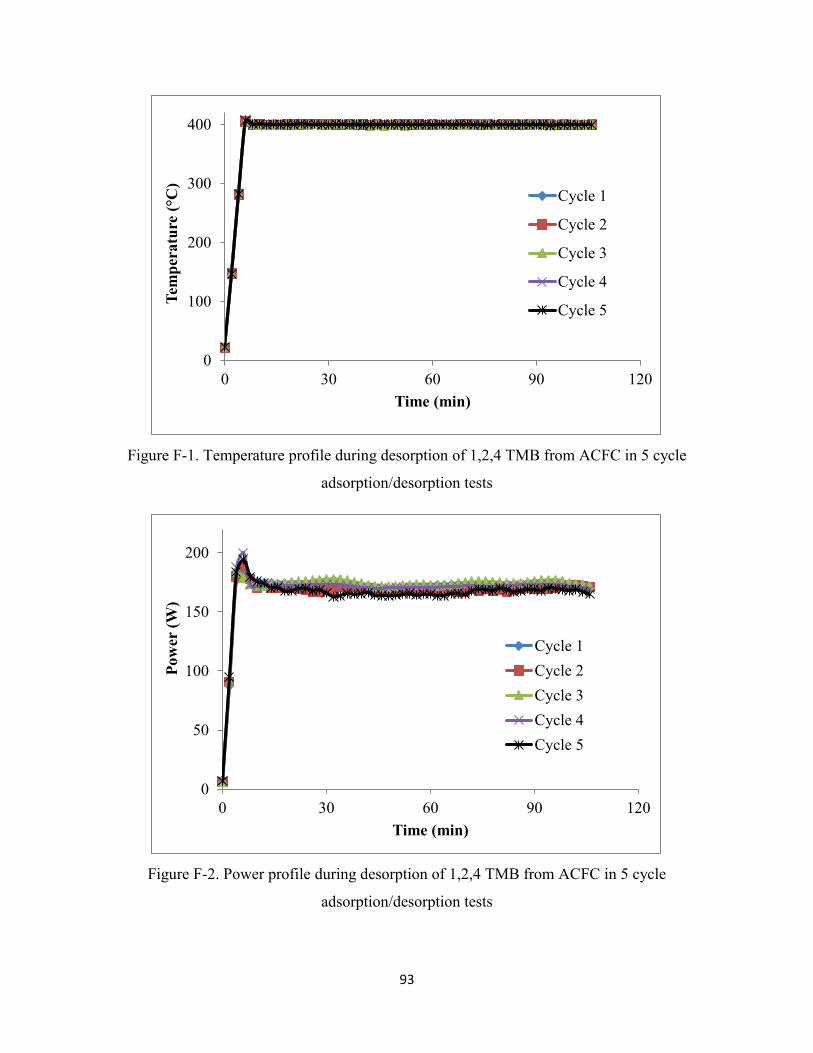
93
Figure F-1. Temperature profile during desorption of 1,2,4 TMB from ACFC in 5 cycle
adsorption/desorption tests
Figure F-2. Power profile during desorption of 1,2,4 TMB from ACFC in 5 cycle
adsorption/desorption tests
0
100
200
300
400
0 30 60 90 120
Tem
per
atu
re (°C
)
Time (min)
Cycle 1
Cycle 2
Cycle 3
Cycle 4
Cycle 5
0
50
100
150
200
0 30 60 90 120
Pow
er (
W)
Time (min)
Cycle 1
Cycle 2
Cycle 3
Cycle 4
Cycle 5
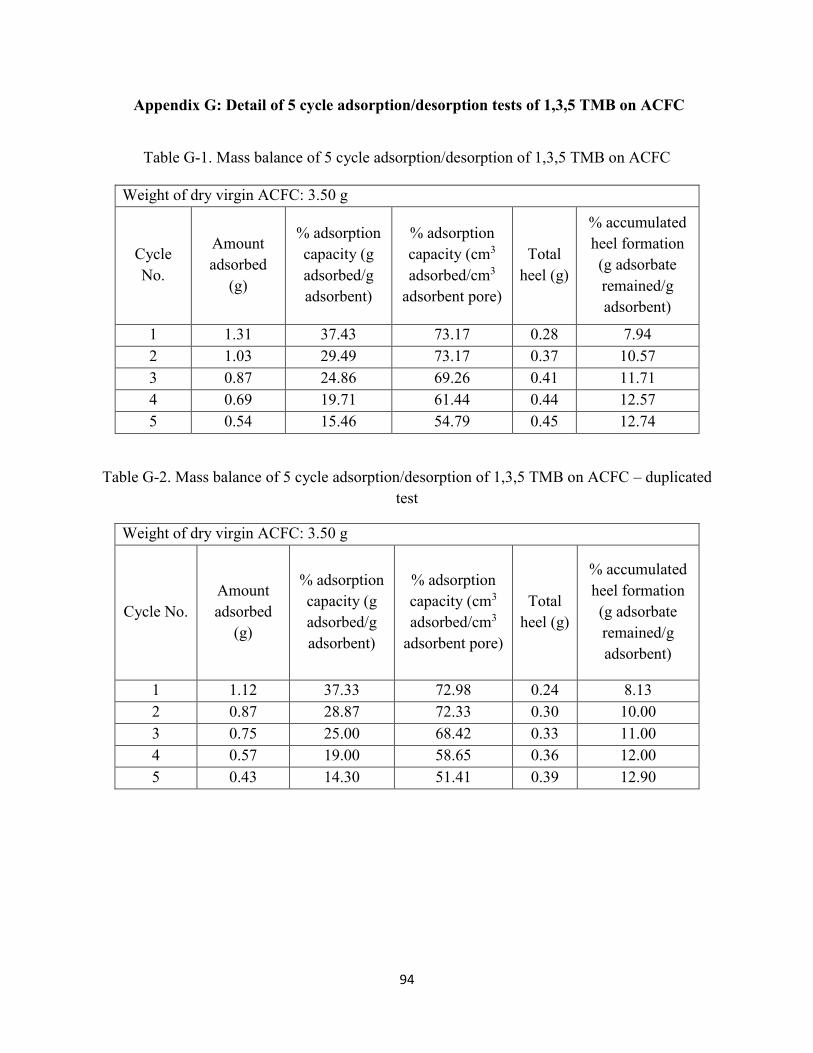
94
Appendix G: Detail of 5 cycle adsorption/desorption tests of 1,3,5 TMB on ACFC
Table G-1. Mass balance of 5 cycle adsorption/desorption of 1,3,5 TMB on ACFC
Weight of dry virgin ACFC: 3.50 g
Cycle
No.
Amount
adsorbed
(g)
% adsorption
capacity (g
adsorbed/g
adsorbent)
% adsorption
capacity (cm3
adsorbed/cm3
adsorbent pore)
Total
heel (g)
% accumulated
heel formation
(g adsorbate
remained/g
adsorbent)
1 1.31 37.43 73.17 0.28 7.94
2 1.03 29.49 73.17 0.37 10.57
3 0.87 24.86 69.26 0.41 11.71
4 0.69 19.71 61.44 0.44 12.57
5 0.54 15.46 54.79 0.45 12.74
Table G-2. Mass balance of 5 cycle adsorption/desorption of 1,3,5 TMB on ACFC – duplicated
test
Weight of dry virgin ACFC: 3.50 g
Cycle No.
Amount
adsorbed
(g)
% adsorption
capacity (g
adsorbed/g
adsorbent)
% adsorption
capacity (cm3
adsorbed/cm3
adsorbent pore)
Total
heel (g)
% accumulated
heel formation
(g adsorbate
remained/g
adsorbent)
1 1.12 37.33 72.98 0.24 8.13
2 0.87 28.87 72.33 0.30 10.00
3 0.75 25.00 68.42 0.33 11.00
4 0.57 19.00 58.65 0.36 12.00
5 0.43 14.30 51.41 0.39 12.90
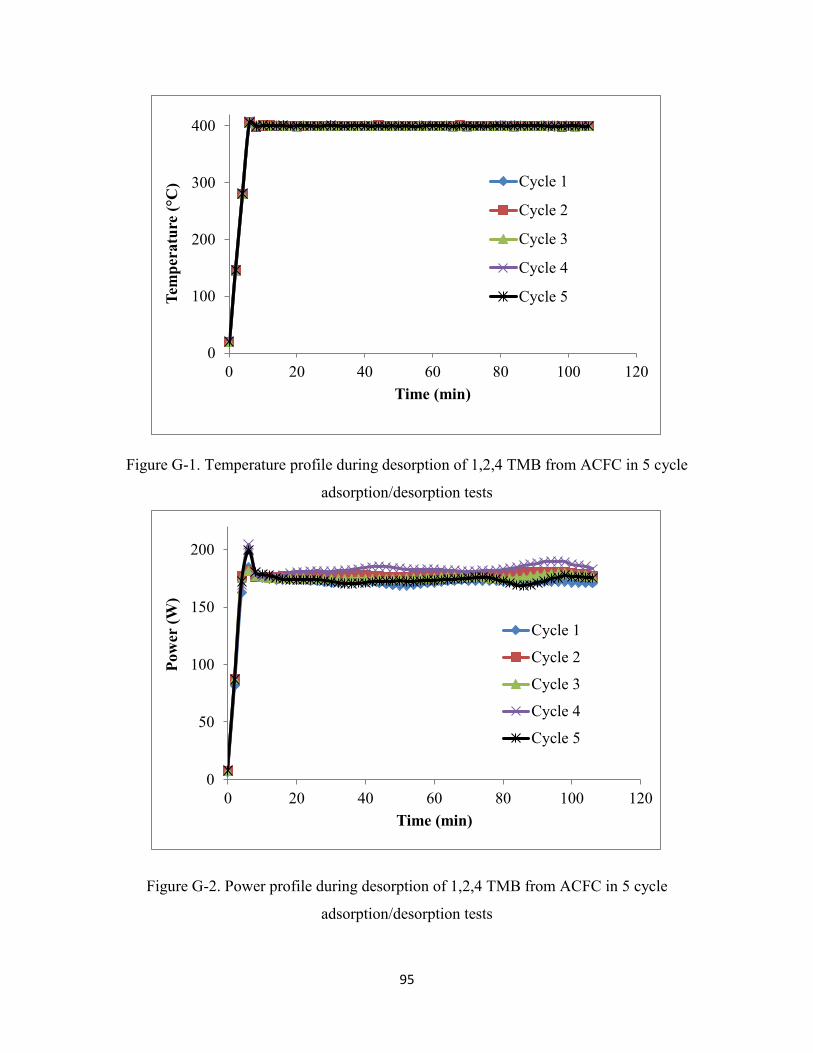
95
Figure G-1. Temperature profile during desorption of 1,2,4 TMB from ACFC in 5 cycle
adsorption/desorption tests
Figure G-2. Power profile during desorption of 1,2,4 TMB from ACFC in 5 cycle
adsorption/desorption tests
0
100
200
300
400
0 20 40 60 80 100 120
Tem
per
atu
re (°C
)
Time (min)
Cycle 1
Cycle 2
Cycle 3
Cycle 4
Cycle 5
0
50
100
150
200
0 20 40 60 80 100 120
Pow
er (
W)
Time (min)
Cycle 1
Cycle 2
Cycle 3
Cycle 4
Cycle 5
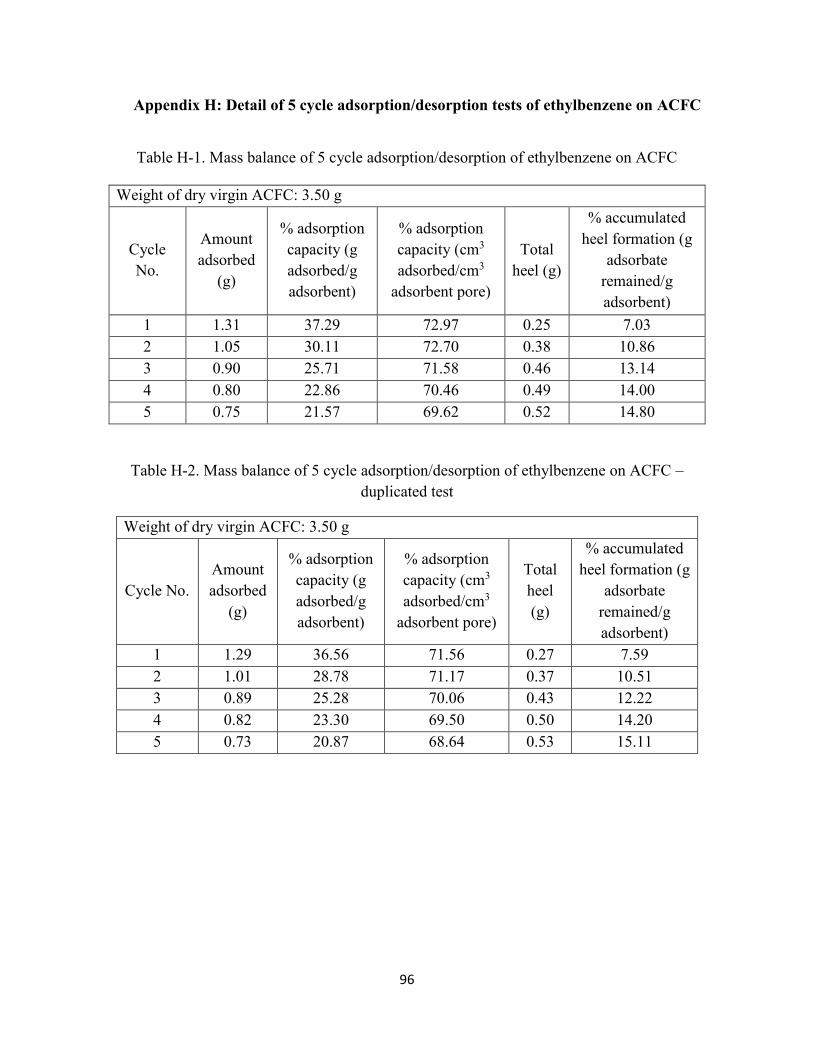
96
Appendix H: Detail of 5 cycle adsorption/desorption tests of ethylbenzene on ACFC
Table H-1. Mass balance of 5 cycle adsorption/desorption of ethylbenzene on ACFC
Weight of dry virgin ACFC: 3.50 g
Cycle
No.
Amount
adsorbed
(g)
% adsorption
capacity (g
adsorbed/g
adsorbent)
% adsorption
capacity (cm3
adsorbed/cm3
adsorbent pore)
Total
heel (g)
% accumulated
heel formation (g
adsorbate
remained/g
adsorbent)
1 1.31 37.29 72.97 0.25 7.03
2 1.05 30.11 72.70 0.38 10.86
3 0.90 25.71 71.58 0.46 13.14
4 0.80 22.86 70.46 0.49 14.00
5 0.75 21.57 69.62 0.52 14.80
Table H-2. Mass balance of 5 cycle adsorption/desorption of ethylbenzene on ACFC –
duplicated test
Weight of dry virgin ACFC: 3.50 g
Cycle No.
Amount
adsorbed
(g)
% adsorption
capacity (g
adsorbed/g
adsorbent)
% adsorption
capacity (cm3
adsorbed/cm3
adsorbent pore)
Total
heel
(g)
% accumulated
heel formation (g
adsorbate
remained/g
adsorbent)
1 1.29 36.56 71.56 0.27 7.59
2 1.01 28.78 71.17 0.37 10.51
3 0.89 25.28 70.06 0.43 12.22
4 0.82 23.30 69.50 0.50 14.20
5 0.73 20.87 68.64 0.53 15.11
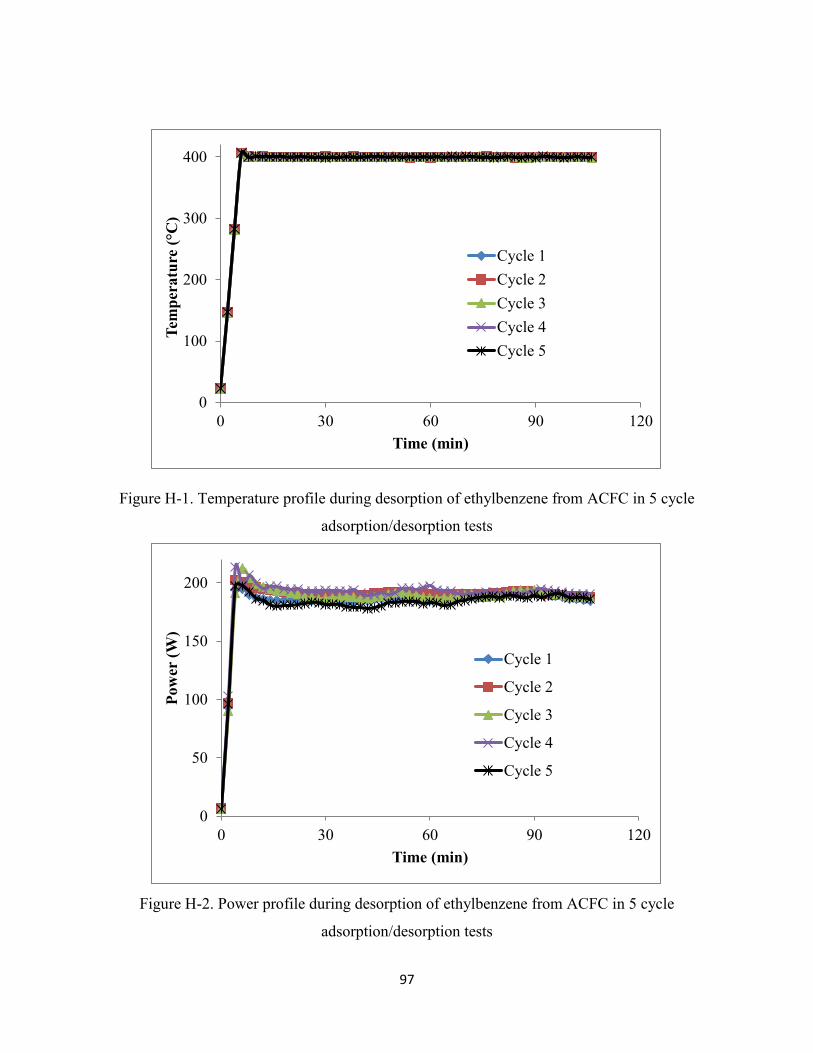
97
Figure H-1. Temperature profile during desorption of ethylbenzene from ACFC in 5 cycle
adsorption/desorption tests
Figure H-2. Power profile during desorption of ethylbenzene from ACFC in 5 cycle
adsorption/desorption tests
0
100
200
300
400
0 30 60 90 120
Tem
per
atu
re (°C
)
Time (min)
Cycle 1
Cycle 2
Cycle 3
Cycle 4
Cycle 5
0
50
100
150
200
0 30 60 90 120
Pow
er (
W)
Time (min)
Cycle 1
Cycle 2
Cycle 3
Cycle 4
Cycle 5
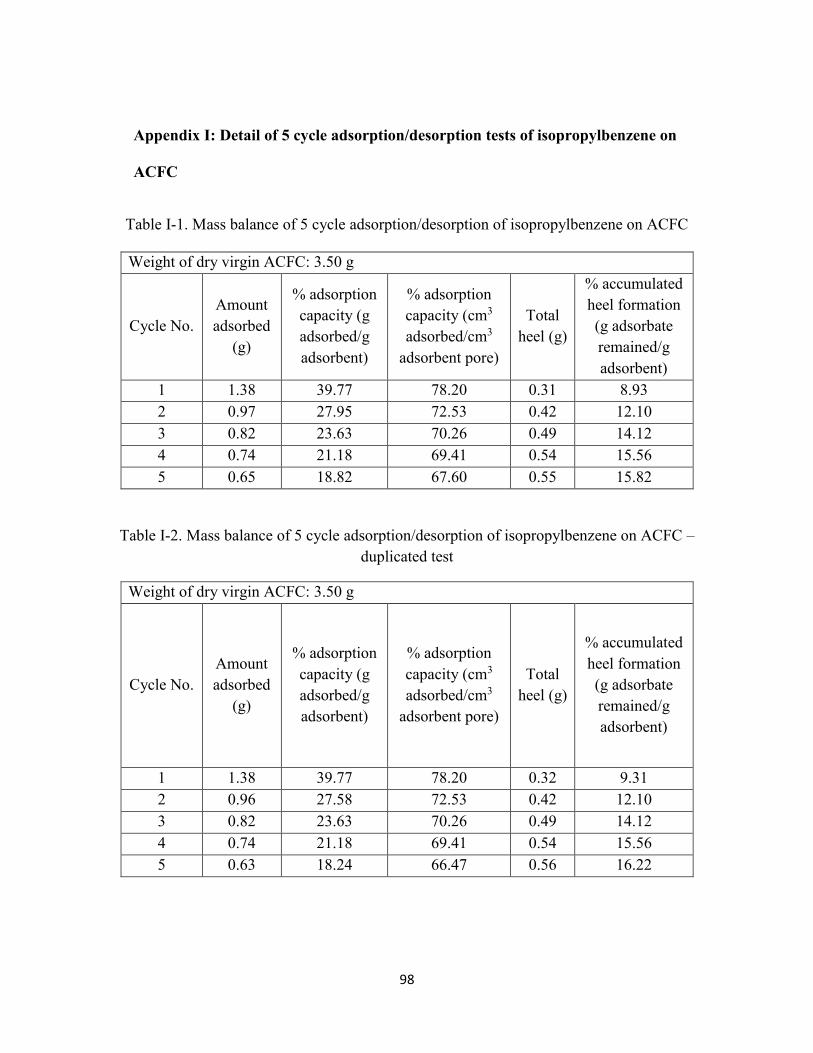
98
Appendix I: Detail of 5 cycle adsorption/desorption tests of isopropylbenzene on
ACFC
Table I-1. Mass balance of 5 cycle adsorption/desorption of isopropylbenzene on ACFC
Weight of dry virgin ACFC: 3.50 g
Cycle No.
Amount
adsorbed
(g)
% adsorption
capacity (g
adsorbed/g
adsorbent)
% adsorption
capacity (cm3
adsorbed/cm3
adsorbent pore)
Total
heel (g)
% accumulated
heel formation
(g adsorbate
remained/g
adsorbent)
1 1.38 39.77 78.20 0.31 8.93
2 0.97 27.95 72.53 0.42 12.10
3 0.82 23.63 70.26 0.49 14.12
4 0.74 21.18 69.41 0.54 15.56
5 0.65 18.82 67.60 0.55 15.82
Table I-2. Mass balance of 5 cycle adsorption/desorption of isopropylbenzene on ACFC –
duplicated test
Weight of dry virgin ACFC: 3.50 g
Cycle No.
Amount
adsorbed
(g)
% adsorption
capacity (g
adsorbed/g
adsorbent)
% adsorption
capacity (cm3
adsorbed/cm3
adsorbent pore)
Total
heel (g)
% accumulated
heel formation
(g adsorbate
remained/g
adsorbent)
1 1.38 39.77 78.20 0.32 9.31
2 0.96 27.58 72.53 0.42 12.10
3 0.82 23.63 70.26 0.49 14.12
4 0.74 21.18 69.41 0.54 15.56
5 0.63 18.24 66.47 0.56 16.22
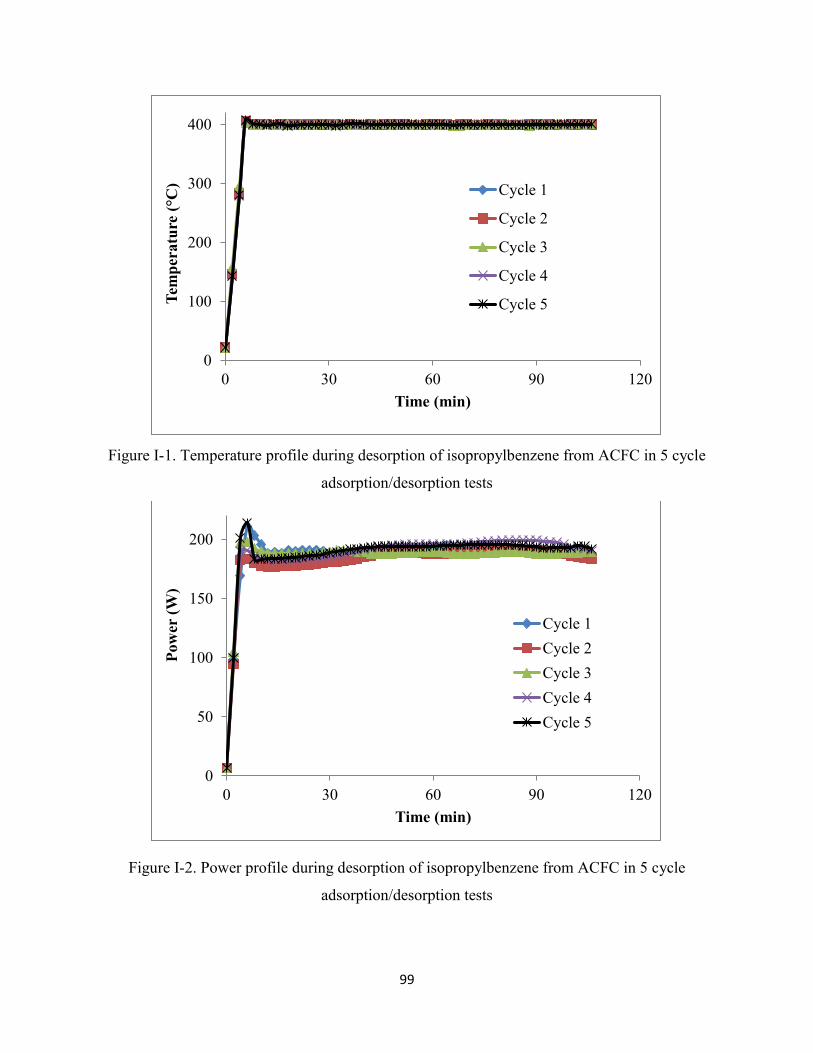
99
Figure I-1. Temperature profile during desorption of isopropylbenzene from ACFC in 5 cycle
adsorption/desorption tests
Figure I-2. Power profile during desorption of isopropylbenzene from ACFC in 5 cycle
adsorption/desorption tests
0
100
200
300
400
0 30 60 90 120
Tem
per
atu
re (°C
)
Time (min)
Cycle 1
Cycle 2
Cycle 3
Cycle 4
Cycle 5
0
50
100
150
200
0 30 60 90 120
Pow
er (
W)
Time (min)
Cycle 1
Cycle 2
Cycle 3
Cycle 4
Cycle 5
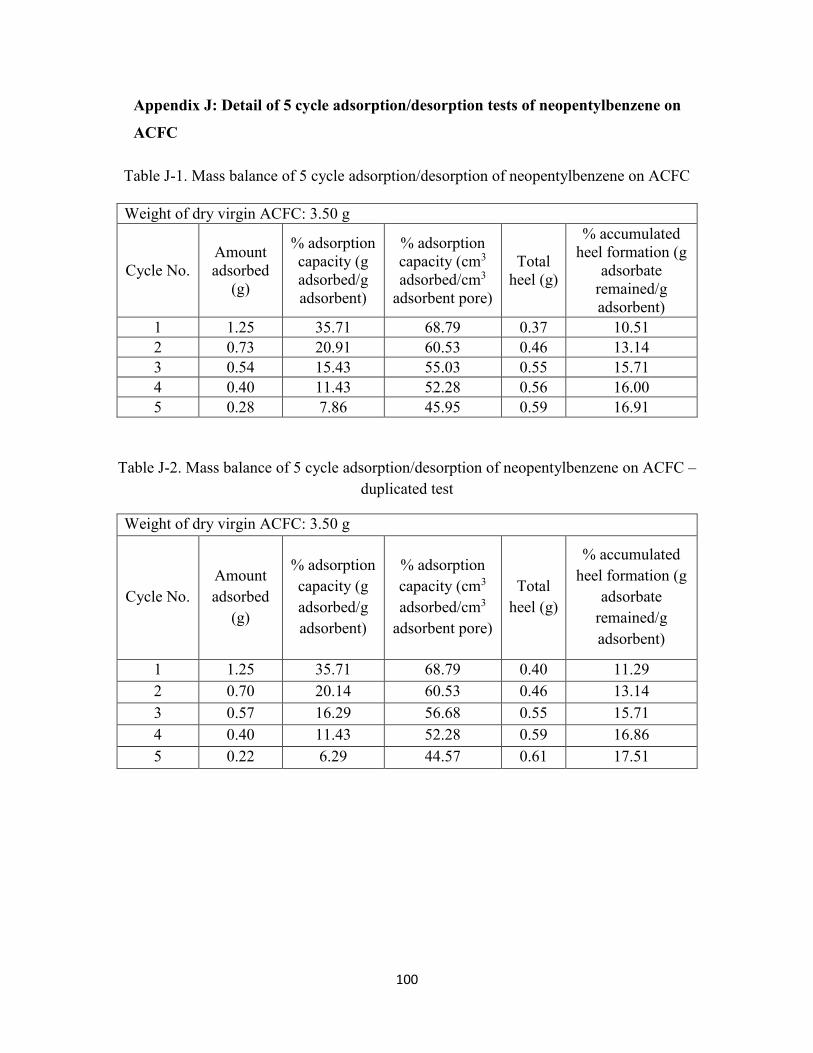
100
Appendix J: Detail of 5 cycle adsorption/desorption tests of neopentylbenzene on
ACFC
Table J-1. Mass balance of 5 cycle adsorption/desorption of neopentylbenzene on ACFC
Weight of dry virgin ACFC: 3.50 g
Cycle No.
Amount
adsorbed
(g)
% adsorption
capacity (g
adsorbed/g
adsorbent)
% adsorption
capacity (cm3
adsorbed/cm3
adsorbent pore)
Total
heel (g)
% accumulated
heel formation (g
adsorbate
remained/g
adsorbent)
1 1.25 35.71 68.79 0.37 10.51
2 0.73 20.91 60.53 0.46 13.14
3 0.54 15.43 55.03 0.55 15.71
4 0.40 11.43 52.28 0.56 16.00
5 0.28 7.86 45.95 0.59 16.91
Table J-2. Mass balance of 5 cycle adsorption/desorption of neopentylbenzene on ACFC –
duplicated test
Weight of dry virgin ACFC: 3.50 g
Cycle No.
Amount
adsorbed
(g)
% adsorption
capacity (g
adsorbed/g
adsorbent)
% adsorption
capacity (cm3
adsorbed/cm3
adsorbent pore)
Total
heel (g)
% accumulated
heel formation (g
adsorbate
remained/g
adsorbent)
1 1.25 35.71 68.79 0.40 11.29
2 0.70 20.14 60.53 0.46 13.14
3 0.57 16.29 56.68 0.55 15.71
4 0.40 11.43 52.28 0.59 16.86
5 0.22 6.29 44.57 0.61 17.51
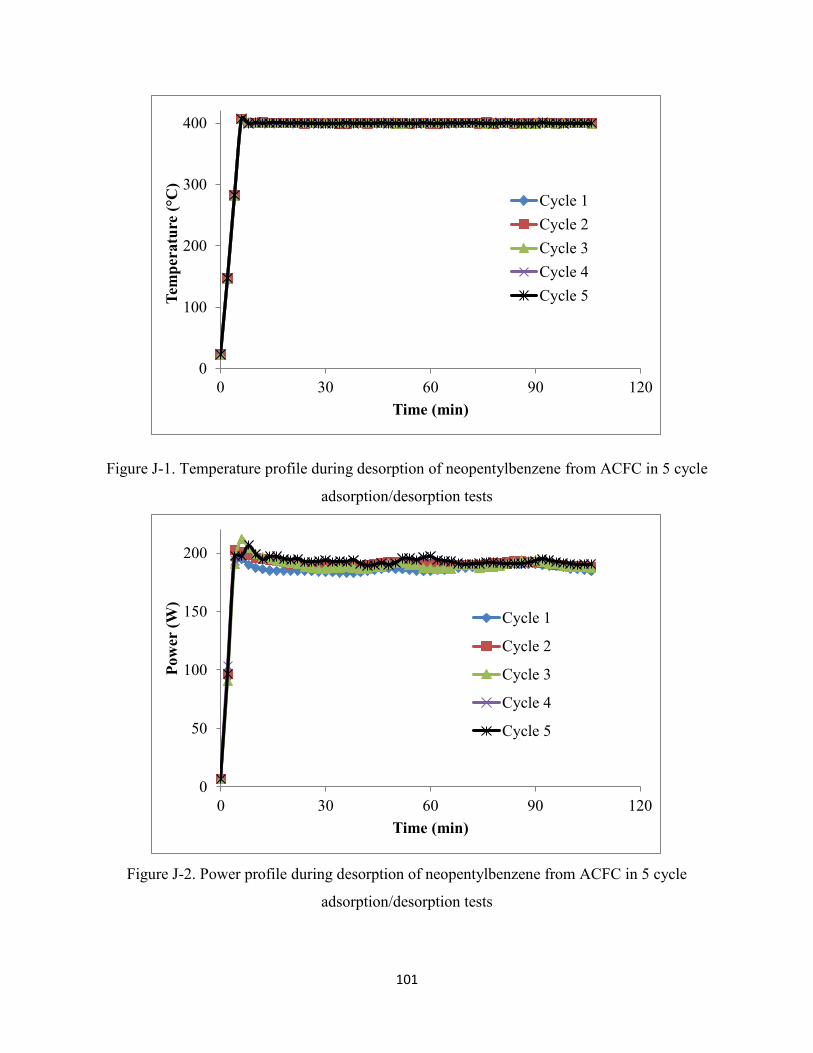
101
Figure J-1. Temperature profile during desorption of neopentylbenzene from ACFC in 5 cycle
adsorption/desorption tests
Figure J-2. Power profile during desorption of neopentylbenzene from ACFC in 5 cycle
adsorption/desorption tests
0
100
200
300
400
0 30 60 90 120
Tem
per
atu
re (°C
)
Time (min)
Cycle 1
Cycle 2
Cycle 3
Cycle 4
Cycle 5
0
50
100
150
200
0 30 60 90 120
Pow
er (
W)
Time (min)
Cycle 1
Cycle 2
Cycle 3
Cycle 4
Cycle 5