Embed Size (px)
Citation preview
This article was downloaded by: [University of Western Ontario]On: 07 October 2014, At: 17:14Publisher: Taylor & FrancisInforma Ltd Registered in England and Wales Registered Number: 1072954 Registered office: MortimerHouse, 37-41 Mortimer Street, London W1T 3JH, UK
Journal of the Air & Waste ManagementAssociationPublication details, including instructions for authors and subscription information:http://www.tandfonline.com/loi/uawm20
Effects of Aerosol Species on Atmospheric Visibilityin Kaohsiung City, TaiwanChang-Gai Lee a , Chung-Shin Yuan a , Jui-Cheng Chang a & Ching Yuan ba Institute of Environmental Engineering, National Sun Yat-Sen University , Taiwan ,Republic of Chinab Department of Civil and Environmental Engineering , National University ofKaohsiung , Taiwan , Republic of ChinaPublished online: 01 Mar 2012.
To cite this article: Chang-Gai Lee , Chung-Shin Yuan , Jui-Cheng Chang & Ching Yuan (2005) Effects of AerosolSpecies on Atmospheric Visibility in Kaohsiung City, Taiwan, Journal of the Air & Waste Management Association, 55:7,1031-1041, DOI: 10.1080/10473289.2005.10464683
To link to this article: http://dx.doi.org/10.1080/10473289.2005.10464683
PLEASE SCROLL DOWN FOR ARTICLE
Taylor & Francis makes every effort to ensure the accuracy of all the information (the “Content”)contained in the publications on our platform. However, Taylor & Francis, our agents, and our licensorsmake no representations or warranties whatsoever as to the accuracy, completeness, or suitability for anypurpose of the Content. Any opinions and views expressed in this publication are the opinions and viewsof the authors, and are not the views of or endorsed by Taylor & Francis. The accuracy of the Contentshould not be relied upon and should be independently verified with primary sources of information.Taylor and Francis shall not be liable for any losses, actions, claims, proceedings, demands, costs,expenses, damages, and other liabilities whatsoever or howsoever caused arising directly or indirectly inconnection with, in relation to or arising out of the use of the Content.
This article may be used for research, teaching, and private study purposes. Any substantial or systematicreproduction, redistribution, reselling, loan, sub-licensing, systematic supply, or distribution in anyform to anyone is expressly forbidden. Terms & Conditions of access and use can be found at http://www.tandfonline.com/page/terms-and-conditions
Effects of Aerosol Species on Atmospheric Visibility inKaohsiung City, Taiwan
Chang-Gai Lee, Chung-Shin Yuan, and Jui-Cheng ChangInstitute of Environmental Engineering, National Sun Yat-Sen University, Taiwan, Republic of China
Ching YuanDepartment of Civil and Environmental Engineering, National University of Kaohsiung, Taiwan,Republic of China
ABSTRACTVisibility data collected from Kaohsiung City, Taiwan, forthe past two decades indicated that the air pollutantshave significantly degraded visibility in recent years. Dur-ing our study period, the seasonal mean visibilities inspring, summer, fall, and winter were only 5.4, 9.1, 8.2,and 3.4 km, respectively. To ascertain how urban aerosolsinfluence the visibility, we conducted concurrent visibil-ity monitoring and aerosol sampling in 1999 to identifythe principal causes of visibility impairments in the re-gion. In this study, ambient aerosols were sampled andanalyzed for 11 constituents, including water-soluble ionsand carbon materials, to investigate the chemical compo-sition of Kaohsiung aerosols. Stepwise regression methodwas used to correlate the impact of aerosol species onvisibility impairments. Both seasonal and diurnal varia-tion patterns were found from the monitoring of visibil-ity. Our results showed that light scattering was attributedprimarily to aerosols with sizes that range from 0.26 to0.90 �m, corresponding with the wavelength region ofvisible light, which accounted for �72% of the light scat-tering coefficient. Sulfate was a dominant componentthat affected both the light scattering coefficient and thevisibility in the region. On average, (NH4)2SO4, NH4NO3,
total carbon, and fine particulate matter (PM2.5)-remain-der contributed 53%, 17%, 16%, and 14% to total lightscattering, respectively. An empirical regression model ofvisibility based on sulfate, elemental carbon, and humiditywas developed, and the comparison indicated that visibilityin an urban area could be properly simulated by the equa-tion derived herein.
INTRODUCTIONVisibility degradation has become a problem of publicconcern in most metropolitan areas in recent years. Visi-bility degradation is not just an amenity problem but alsoa visual indicator of air quality: it is often considered to bea primary and general index of ambient air quality in anurban area.1 Atmospheric visibility is defined as the great-est distance in a given direction at which an object can bevisually identified with unaided eyes. The object could bea dark object positioned prominently against the sky onthe horizon in the daytime or a known, preferably unfo-cused moderately intense light source at nighttime.2 At-mospheric visibility impairment is attributed mainly tothe scattering and absorption of visible light by gaseouspollutants (such as NO2), as well as by suspended fineparticles in the ambient atmosphere.3–5 Among them,particulate light scattering has often been found to be thedominant cause of light extinction in urban areas.6 Pre-vious studies have revealed that the size, chemical com-position, and concentration of airborne particulate mat-ter substantially affect visibility.7,8 Fine particulatematter, generally characterized as particles �2.5 �m indiameter (PM2.5), are believed to be responsible for thedegradation of visibility by aerosols.9 Although the ex-tinction of light from gas species can also impair visibility,such species have been shown to have a much weakerinfluence.6,10 Meanwhile, meteorological factors, espe-cially humidity, also contribute to degrade visibility.11,12
However, the meteorological conditions usually cannot
IMPLICATIONSInformation concerning the contribution of different chem-ical species in Kaohsiung aerosols to visibility impairmentremains sparse. Only a few publications have quantitativelyaddressed this local poor visibility. However, such data areessential to establish limits on ambient PM to protect thevisual air quality in the region. Our work showed that sulfatewas the dominant component that affects both light scat-tering coefficient and atmospheric visibility. The results alsoindicated the need to include nitrate and elemental carbonin policy-making for maintaining and improving visibility inthe region.
TECHNICAL PAPER ISSN 1047-3289 J. Air & Waste Manage. Assoc. 55:1031–1041
Copyright 2005 Air & Waste Management Association
Volume 55 July 2005 Journal of the Air & Waste Management Association 1031
Dow
nloa
ded
by [
Uni
vers
ity o
f W
este
rn O
ntar
io]
at 1
7:14
07
Oct
ober
201
4
be controlled. This study of impaired visibility in theKaohsiung metropolitan area thus focuses only on theimpact of ambient aerosols.
After rapid population growth and increasing industri-alization over the past three decades, poor ambient air qual-ity has become one of the major environmental concerns ofthe general public in Kaohsiung City, Taiwan. Air quality inmetro Kaohsiung is the worst in Taiwan, because �60% ofTaiwan’s heavy industries are located in Kaohsiung Cityitself or in its suburbs. Currently, this region includes�1,228,429 automobiles and motorcycles and a total of1911 factories including Taiwan’s largest oil refinery plant,14 large-scale petrochemical plants, 9 sizable iron and steelplants, 2 cement mills, and 2 fossil power plants. Moreover,the city is surrounded by four heavily polluted industrialparks: namely, Jen-wu, Ta-shei, Lin-yuan, and Ta-fa, locatedin the adjacent Kaohsiung County. The annual proportionof unhealthy days, defined as those days on which thePollutants Standard Index exceeds 100, was 9.34% and10.1% in 1999 and 2000, respectively, in this region.13 Ad-ditionally, a monthly average atmospheric visibility of 7.2km with a range of 2.3–23.1 km, much lower than mostlarge cities,14 was recorded at Kaohsiung Meteorology Sta-tion from 1979 to 1998.15
The increase in complaints by inhabitants about pooratmospheric visibility has motivated research into itsmain causes. Information concerning the contributionsof different chemical components in Kaohsiung aerosolsto the impairment of visibility remains sparse. Only a fewpublications have quantitatively addressed this local poorvisibility.15,16 However, such data are required to establishlimits on particulate air pollutants to protect the visual
quality of the atmosphere in this region. This work aimsnot only to investigate the temporal and spatial variationsof atmospheric visibility in metropolitan Kaohsiung butalso to identify the main causes of impaired visibility bycorrelating atmospheric visibility with the chemical com-position of Kaohsiung aerosols.
METHODS
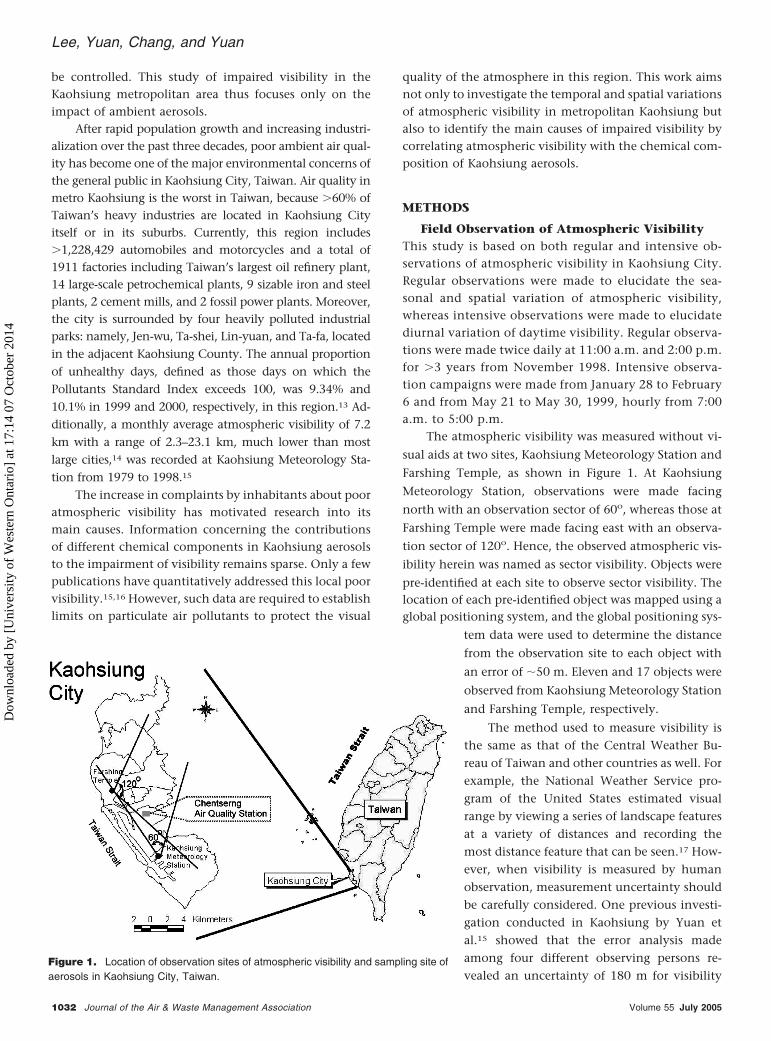
Field Observation of Atmospheric VisibilityThis study is based on both regular and intensive ob-servations of atmospheric visibility in Kaohsiung City.Regular observations were made to elucidate the sea-sonal and spatial variation of atmospheric visibility,whereas intensive observations were made to elucidatediurnal variation of daytime visibility. Regular observa-tions were made twice daily at 11:00 a.m. and 2:00 p.m.for �3 years from November 1998. Intensive observa-tion campaigns were made from January 28 to February6 and from May 21 to May 30, 1999, hourly from 7:00a.m. to 5:00 p.m.
The atmospheric visibility was measured without vi-
sual aids at two sites, Kaohsiung Meteorology Station and
Farshing Temple, as shown in Figure 1. At Kaohsiung
Meteorology Station, observations were made facing
north with an observation sector of 60o, whereas those at
Farshing Temple were made facing east with an observa-
tion sector of 120o. Hence, the observed atmospheric vis-
ibility herein was named as sector visibility. Objects were
pre-identified at each site to observe sector visibility. Thelocation of each pre-identified object was mapped using aglobal positioning system, and the global positioning sys-
tem data were used to determine the distance
from the observation site to each object with
an error of �50 m. Eleven and 17 objects were
observed from Kaohsiung Meteorology Station
and Farshing Temple, respectively.
The method used to measure visibility isthe same as that of the Central Weather Bu-reau of Taiwan and other countries as well. Forexample, the National Weather Service pro-gram of the United States estimated visualrange by viewing a series of landscape featuresat a variety of distances and recording themost distance feature that can be seen.17 How-ever, when visibility is measured by humanobservation, measurement uncertainty shouldbe carefully considered. One previous investi-gation conducted in Kaohsiung by Yuan etal.15 showed that the error analysis madeamong four different observing persons re-vealed an uncertainty of 180 m for visibility
Figure 1. Location of observation sites of atmospheric visibility and sampling site ofaerosols in Kaohsiung City, Taiwan.
Lee, Yuan, Chang, and Yuan
1032 Journal of the Air & Waste Management Association Volume 55 July 2005
Dow
nloa
ded
by [
Uni
vers
ity o
f W
este
rn O
ntar
io]
at 1
7:14
07
Oct
ober
201
4
observation. The observing error is only �2.5% based onan average visibility of 7.2 km during that study period.To minimize the uncertainty, all of the observations weremade by the same person. Therefore, the uncertainty forthis single observer in this study should be �2.5%.
Sampling of Atmospheric AerosolsAerosol particles were simultaneously sampled during in-tensive observation periods to ascertain the influence ofaerosol characteristics on visibility impairment in urbanarea of Kaohsiung. Atmospheric aerosols were collected atChentserng Air Quality Monitoring Station, on the 10–m-high roof of a 3-story building located in the centralmetropolitan Kaohsiung (Figure 1). Both fine and coarseparticles (i.e., PM2.5 and PM2.5–10) were collected on thequartz fiber filters by a dichotomous sampler (AndersonModel 241) with a total flow rate of 16.7 l/min. The37-mm diameter filters were initially conditioned at 23 �
2 °C and 40% � 5% relative humidity for 24 hr beforesampling. Aerosol particles were collected for a consecu-tive 5-hr period in both the morning (7:00 a.m.–12:00p.m.) and afternoon (12:00 p.m.–5:00 p.m.) during theperiods of intensive sampling. After weighing, the sam-ples were stored in a refrigerator at 4 °C before analysis toprevent the loss of semivolatile species, particularly am-monium nitrate and organic carbon (OC).
Additionally, a 31-stage (0.1–10 �m) Aerosol Spec-trometer (PMS Model PCASP-X) was used simultaneouslyto monitor aerosol particles with various size ranges todetermine the theoretical light scattering coefficient. ThisPCASP-X was calibrated before the field campaign. Cali-bration involved cleaning the optics, aligning the laser,maximizing the sensed counts, and adjusting the gainranges so that standard particles of known sizes are sensedin the correct channels. The monodispersed polystyrenelatex particles with a refractive index (m) of 1.58 wereused as the standard particles. Therefore, sizing uncertain-ties resulting from oscillation in the scattering responseare not considered to be major and can be neglected.However, according to the manufacturer’s report, the dif-ference between the refractive index of ambient and cal-ibration particles might cause an error in sizing. Becauseknowledge of the real refractive index of ambient particleswas not available during the field campaign, error analysisshowed that the relative uncertainties could be up to�10% (depending on the size of the particle) from thesizes determined by calibration with polystyrene latexmicrosphere. Moreover, because of the wide collectionangles used in the PCASP-X, asphericity has little effect onparticle sizing, probably �5%. Because the PCASP-X wascalibrated using polystyrene latex, the reported size rangeshould be viewed as a polystyrene latex equivalent sizerange.
Chemical Analysis of Aerosol ParticlesThe chemical composition of aerosol particles collectedon the sampling filters was additionally analyzed. Thequartz fiber filters were cut into three identical parts be-fore analysis. One part of the quartz filter was extractedfor analyzing water-soluble ionic species, whereas the re-maining two parts of the filter were analyzed to determinecarbonaceous contents. Water-soluble ionic species, in-cluding major anions (Cl�, NO3
�, and SO4�2) and cations
(Na�, NH4�, K�, Mg�2, and Ca�2), were determined with
an ion chromatography (Dionex Model DX100). Methoddetection limit was estimated from the repeated analysesof predefined quality control solutions. The detectionlimits of those ion species of Cl�, NO3
�, SO4�2, Na�,
NH4�, K�, Mg�2, and Ca�2 were 0.015, 0.006, 0.036,
0.021, 0.010, 0.030, 0.012, and 0.066 �g/m3, respectively.The average recoveries ranged from a low of 90% for Na�
to a high of 110% for Cl� with an overall average of 97%.The carbonaceous contents of aerosol particles were
measured using an elemental analyzer (Carlo Erba EA,Model 1108). Before the aerosol particles were collected,the quartz fiber filters were preheated at 900 °C for 1.5 hrto remove the impurities. This preheating minimized thebackground carbon in the quartz fiber filters and matrix,which could interfere with the analytical results, leadingto an overestimate of the carbonaceous contents of aero-sol particles. When quartz filters are used to collect ambi-ent particles and to determine the carbon content, sam-pling artifacts can introduce errors.18,19 To avoid thepositive artifacts, a blank filter was treated with the sameprocedure as the sampling filter during the sampling andanalytical processes. The blank filter was exposed to thesame environments as the sampling filter was, except itwas used as particle sampling filter. Then the OC contentof the blank filter was subtracted from that of the sam-pling filter to correct the positive artifacts because ofadsorption of gas-phase organics onto the filter duringand after sampling collection. On the other hand, vola-tilization of particle-phase organics can occur whether asignificant pressure drop develops across the collectionfilter.20 However, because volatilization and adsorptionprocess are inherently coupled, it is extremely difficult todesign sampling program capable of elucidating the rela-tive magnitude of these positive and negative biases.Thus, negative artifacts because of volatilization of parti-cle-phase organics from the particles sample were notquantified in this study and, thus, the OC values obtainedin this study can be considered as the conservative results.
The elemental analyzer was operated using the pro-cedure of oxidation at 1020 °C and reduction at 500 °C,with heating for 15 min. Additionally, one third of thequartz fiber filters were heated in advance by hot nitrogengas (340–345 °C) for 30 min to expel OC fraction, after
Lee, Yuan, Chang, and Yuan
Volume 55 July 2005 Journal of the Air & Waste Management Association 1033
Dow
nloa
ded
by [
Uni
vers
ity o
f W
este
rn O
ntar
io]
at 1
7:14
07
Oct
ober
201
4
which the amount of elemental carbon (EC) was deter-mined. Another third of the quartz fiber filters wereanalyzed without heating, and the carbon thus identi-fied was characterized as total carbon (TC). The amountof OC could then be estimated by subtracting EC fromTC. Although commonly accepted standards and refer-ence materials that can be used to quantify carbonmaterials as it appears in the atmosphere do not exist,21
an Organic Analytical Standard (Elemental Microanal-ysis Limited, B2038) consisting of purified urea wasused as a routine working standard for the determina-tion of carbon content in this study. The method de-tection limit of carbon content was found to be 0.041�g/m3.
Correlation Analysis of Visibility and AerosolParticles
The correlation of the light scattering coefficient withthe chemical composition of the aerosol particles wasdetermined to identify species of aerosol particles thatstrongly degraded visibility. A stepwise multiple regres-sion model developed from the light scattering coeffi-cient and chemical composition [i.e. (NH4)2SO4,NH4NO3 and carbonaceous contents] of aerosol parti-cles was established and validated. Meanwhile, anotherregression model derived from the observed visibilityand the chemical composition of aerosol particles wasalso established and validated. These two regressionmodels were additionally used to examine the contri-bution of major chemical components of aerosol parti-cles to visibility and to the light scattering coefficient inthis study region.
RESULTS ANDDISCUSSIONThe results of this study are dis-cussed in five sections. Sectionone describes the temporal andspatial variation of visibility ob-served in Kaohsiung City. Sec-tion two presents the chemicalcompositions of aerosol parti-cles. Section three estimated thetheoretical light scattering char-acteristics. Section four presentsan empirical model of light scat-tering coefficient derived frommajor aerosol chemical compo-nents. Section five describes anempirical relationship betweenvisibility and the major aerosolchemical components.
Temporal and Spatial Variation of VisibilityRegular observations of daytime visibility at 11:00 a.m.
and 2:00 p.m. in Kaohsiung City ranged from 0.7 to 20.6
km. Forty four percent of observations of visibility ranged
from 2 to 5 km. The regular observations of daytime
visibility at Kaohsiung Meteorology Station yielded an
average visibility at 11:00 a.m. of 6.1 km and at 2:00 p.m.
of 7.2 km. These results were consistent with the previ-
ously reported monthly average visibility of 7.2 km
(1975–1994) with a range of 3.3–13.10 km.16
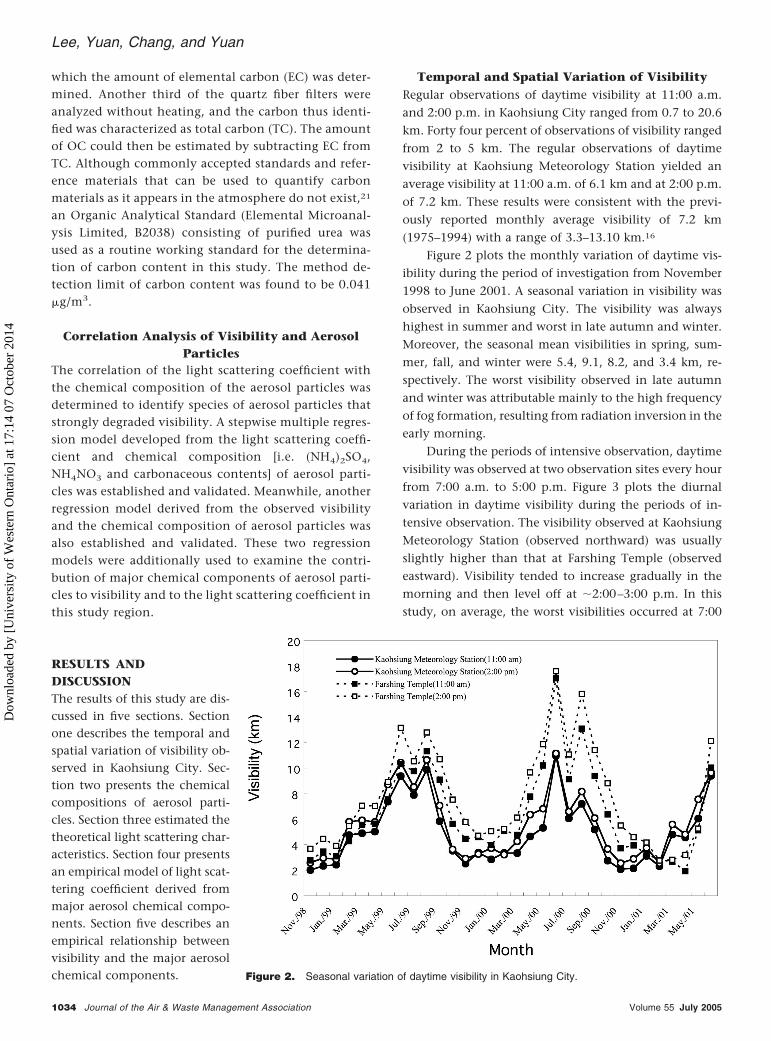
Figure 2 plots the monthly variation of daytime vis-ibility during the period of investigation from November1998 to June 2001. A seasonal variation in visibility wasobserved in Kaohsiung City. The visibility was alwayshighest in summer and worst in late autumn and winter.Moreover, the seasonal mean visibilities in spring, sum-mer, fall, and winter were 5.4, 9.1, 8.2, and 3.4 km, re-spectively. The worst visibility observed in late autumnand winter was attributable mainly to the high frequencyof fog formation, resulting from radiation inversion in theearly morning.
During the periods of intensive observation, daytimevisibility was observed at two observation sites every hourfrom 7:00 a.m. to 5:00 p.m. Figure 3 plots the diurnalvariation in daytime visibility during the periods of in-tensive observation. The visibility observed at KaohsiungMeteorology Station (observed northward) was usuallyslightly higher than that at Farshing Temple (observedeastward). Visibility tended to increase gradually in themorning and then level off at �2:00–3:00 p.m. In thisstudy, on average, the worst visibilities occurred at 7:00
Figure 2. Seasonal variation of daytime visibility in Kaohsiung City.
Lee, Yuan, Chang, and Yuan
1034 Journal of the Air & Waste Management Association Volume 55 July 2005
Dow
nloa
ded
by [
Uni
vers
ity o
f W
este
rn O
ntar
io]
at 1
7:14
07
Oct
ober
201
4
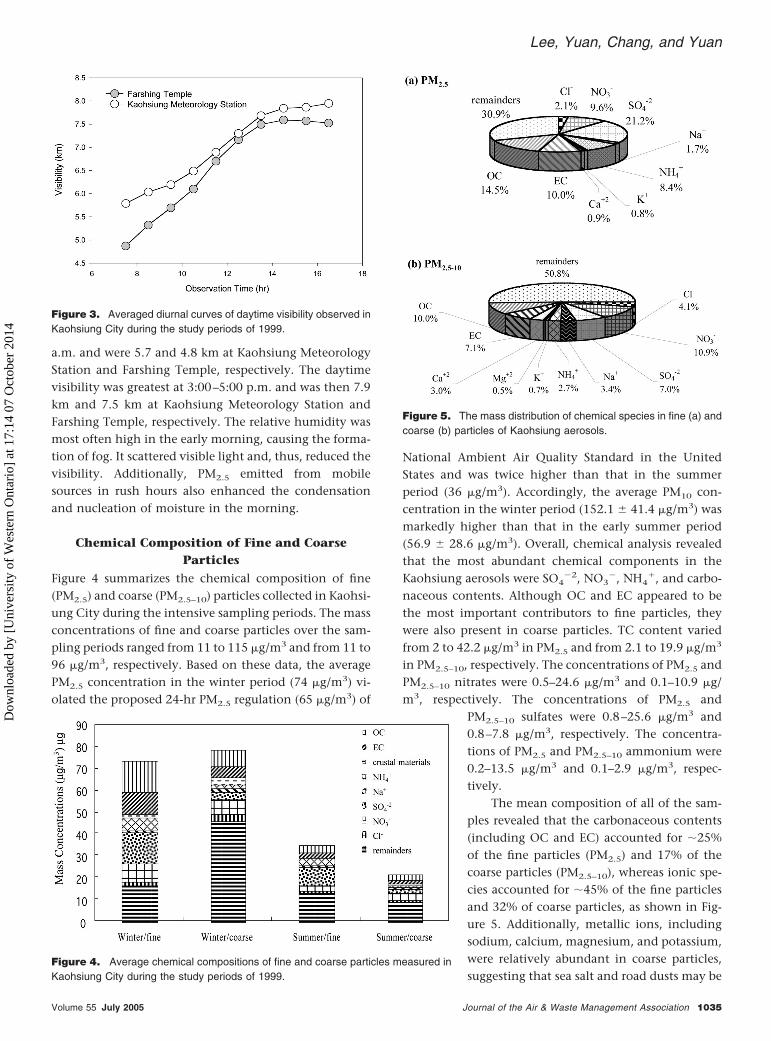
a.m. and were 5.7 and 4.8 km at Kaohsiung MeteorologyStation and Farshing Temple, respectively. The daytimevisibility was greatest at 3:00–5:00 p.m. and was then 7.9km and 7.5 km at Kaohsiung Meteorology Station andFarshing Temple, respectively. The relative humidity wasmost often high in the early morning, causing the forma-tion of fog. It scattered visible light and, thus, reduced thevisibility. Additionally, PM2.5 emitted from mobilesources in rush hours also enhanced the condensationand nucleation of moisture in the morning.
Chemical Composition of Fine and CoarseParticles
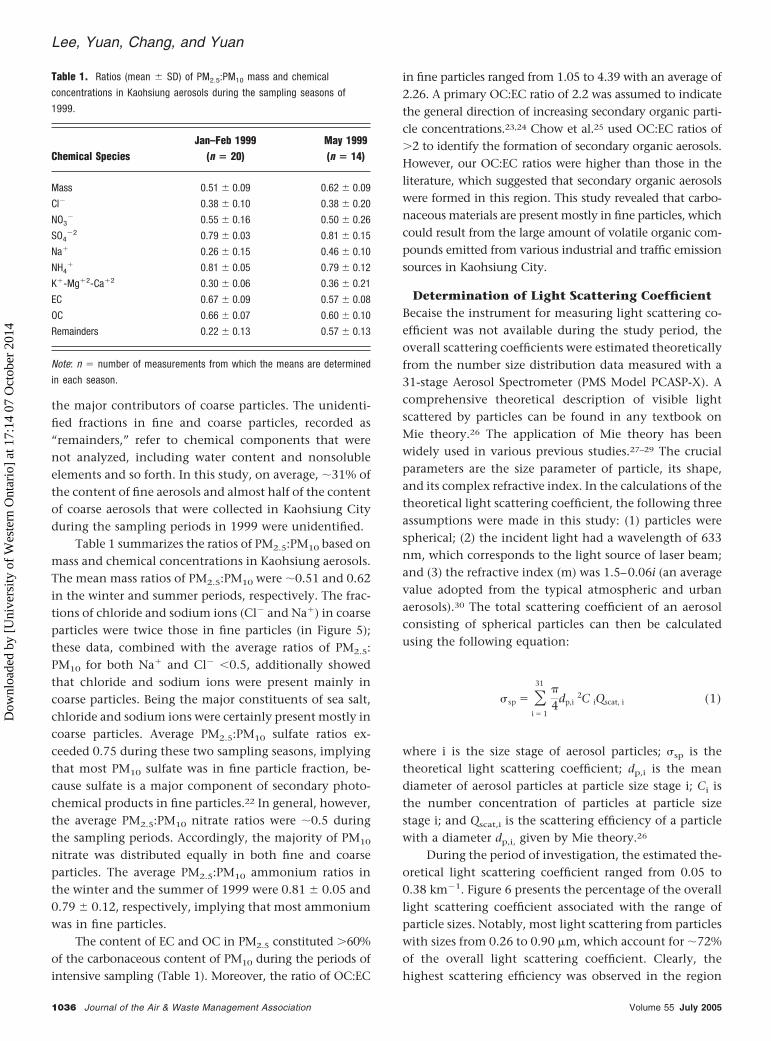
Figure 4 summarizes the chemical composition of fine(PM2.5) and coarse (PM2.5–10) particles collected in Kaohsi-ung City during the intensive sampling periods. The massconcentrations of fine and coarse particles over the sam-pling periods ranged from 11 to 115 �g/m3 and from 11 to96 �g/m3, respectively. Based on these data, the averagePM2.5 concentration in the winter period (74 �g/m3) vi-olated the proposed 24-hr PM2.5 regulation (65 �g/m3) of
National Ambient Air Quality Standard in the UnitedStates and was twice higher than that in the summerperiod (36 �g/m3). Accordingly, the average PM10 con-centration in the winter period (152.1 � 41.4 �g/m3) wasmarkedly higher than that in the early summer period(56.9 � 28.6 �g/m3). Overall, chemical analysis revealedthat the most abundant chemical components in theKaohsiung aerosols were SO4
�2, NO3�, NH4
�, and carbo-naceous contents. Although OC and EC appeared to bethe most important contributors to fine particles, theywere also present in coarse particles. TC content variedfrom 2 to 42.2 �g/m3 in PM2.5 and from 2.1 to 19.9 �g/m3
in PM2.5–10, respectively. The concentrations of PM2.5 andPM2.5–10 nitrates were 0.5–24.6 �g/m3 and 0.1–10.9 �g/m3, respectively. The concentrations of PM2.5 and
PM2.5–10 sulfates were 0.8–25.6 �g/m3 and0.8–7.8 �g/m3, respectively. The concentra-tions of PM2.5 and PM2.5–10 ammonium were0.2–13.5 �g/m3 and 0.1–2.9 �g/m3, respec-tively.
The mean composition of all of the sam-ples revealed that the carbonaceous contents(including OC and EC) accounted for �25%of the fine particles (PM2.5) and 17% of thecoarse particles (PM2.5–10), whereas ionic spe-cies accounted for �45% of the fine particlesand 32% of coarse particles, as shown in Fig-ure 5. Additionally, metallic ions, includingsodium, calcium, magnesium, and potassium,were relatively abundant in coarse particles,suggesting that sea salt and road dusts may be
Figure 3. Averaged diurnal curves of daytime visibility observed inKaohsiung City during the study periods of 1999.
Figure 4. Average chemical compositions of fine and coarse particles measured inKaohsiung City during the study periods of 1999.
Figure 5. The mass distribution of chemical species in fine (a) andcoarse (b) particles of Kaohsiung aerosols.
Lee, Yuan, Chang, and Yuan
Volume 55 July 2005 Journal of the Air & Waste Management Association 1035
Dow
nloa
ded
by [
Uni
vers
ity o
f W
este
rn O
ntar
io]
at 1
7:14
07
Oct
ober
201
4
the major contributors of coarse particles. The unidenti-fied fractions in fine and coarse particles, recorded as“remainders,” refer to chemical components that werenot analyzed, including water content and nonsolubleelements and so forth. In this study, on average, �31% ofthe content of fine aerosols and almost half of the contentof coarse aerosols that were collected in Kaohsiung Cityduring the sampling periods in 1999 were unidentified.
Table 1 summarizes the ratios of PM2.5:PM10 based onmass and chemical concentrations in Kaohsiung aerosols.The mean mass ratios of PM2.5:PM10 were �0.51 and 0.62in the winter and summer periods, respectively. The frac-tions of chloride and sodium ions (Cl� and Na�) in coarseparticles were twice those in fine particles (in Figure 5);these data, combined with the average ratios of PM2.5:PM10 for both Na� and Cl� �0.5, additionally showedthat chloride and sodium ions were present mainly incoarse particles. Being the major constituents of sea salt,chloride and sodium ions were certainly present mostly incoarse particles. Average PM2.5:PM10 sulfate ratios ex-ceeded 0.75 during these two sampling seasons, implyingthat most PM10 sulfate was in fine particle fraction, be-cause sulfate is a major component of secondary photo-chemical products in fine particles.22 In general, however,the average PM2.5:PM10 nitrate ratios were �0.5 duringthe sampling periods. Accordingly, the majority of PM10
nitrate was distributed equally in both fine and coarseparticles. The average PM2.5:PM10 ammonium ratios inthe winter and the summer of 1999 were 0.81 � 0.05 and0.79 � 0.12, respectively, implying that most ammoniumwas in fine particles.
The content of EC and OC in PM2.5 constituted �60%of the carbonaceous content of PM10 during the periods ofintensive sampling (Table 1). Moreover, the ratio of OC:EC
in fine particles ranged from 1.05 to 4.39 with an average of2.26. A primary OC:EC ratio of 2.2 was assumed to indicatethe general direction of increasing secondary organic parti-cle concentrations.23,24 Chow et al.25 used OC:EC ratios of�2 to identify the formation of secondary organic aerosols.However, our OC:EC ratios were higher than those in theliterature, which suggested that secondary organic aerosolswere formed in this region. This study revealed that carbo-naceous materials are present mostly in fine particles, whichcould result from the large amount of volatile organic com-pounds emitted from various industrial and traffic emissionsources in Kaohsiung City.
Determination of Light Scattering CoefficientBecaise the instrument for measuring light scattering co-efficient was not available during the study period, theoverall scattering coefficients were estimated theoreticallyfrom the number size distribution data measured with a31-stage Aerosol Spectrometer (PMS Model PCASP-X). Acomprehensive theoretical description of visible lightscattered by particles can be found in any textbook onMie theory.26 The application of Mie theory has beenwidely used in various previous studies.27–29 The crucialparameters are the size parameter of particle, its shape,and its complex refractive index. In the calculations of thetheoretical light scattering coefficient, the following threeassumptions were made in this study: (1) particles werespherical; (2) the incident light had a wavelength of 633nm, which corresponds to the light source of laser beam;and (3) the refractive index (m) was 1.5–0.06i (an averagevalue adopted from the typical atmospheric and urbanaerosols).30 The total scattering coefficient of an aerosolconsisting of spherical particles can then be calculatedusing the following equation:
�sp � �i � 1
31
4dp,i
2C iQscat, i (1)
where i is the size stage of aerosol particles; �sp is thetheoretical light scattering coefficient; dp,i is the meandiameter of aerosol particles at particle size stage i; Ci isthe number concentration of particles at particle sizestage i; and Qscat,i is the scattering efficiency of a particlewith a diameter dp,i, given by Mie theory.26
During the period of investigation, the estimated the-oretical light scattering coefficient ranged from 0.05 to0.38 km�1. Figure 6 presents the percentage of the overalllight scattering coefficient associated with the range ofparticle sizes. Notably, most light scattering from particleswith sizes from 0.26 to 0.90 �m, which account for �72%of the overall light scattering coefficient. Clearly, thehighest scattering efficiency was observed in the region
Table 1. Ratios (mean � SD) of PM2.5:PM10 mass and chemical
concentrations in Kaohsiung aerosols during the sampling seasons of
1999.
Chemical SpeciesJan–Feb 1999
(n � 20)May 1999(n � 14)
Mass 0.51 � 0.09 0.62 � 0.09
Cl� 0.38 � 0.10 0.38 � 0.20
NO3� 0.55 � 0.16 0.50 � 0.26
SO4�2 0.79 � 0.03 0.81 � 0.15
Na� 0.26 � 0.15 0.46 � 0.10
NH4� 0.81 � 0.05 0.79 � 0.12
K�-Mg�2-Ca�2 0.30 � 0.06 0.36 � 0.21
EC 0.67 � 0.09 0.57 � 0.08
OC 0.66 � 0.07 0.60 � 0.10
Remainders 0.22 � 0.13 0.57 � 0.13
Note: n number of measurements from which the means are determined
in each season.
Lee, Yuan, Chang, and Yuan
1036 Journal of the Air & Waste Management Association Volume 55 July 2005
Dow
nloa
ded
by [
Uni
vers
ity o
f W
este
rn O
ntar
io]
at 1
7:14
07
Oct
ober
201
4
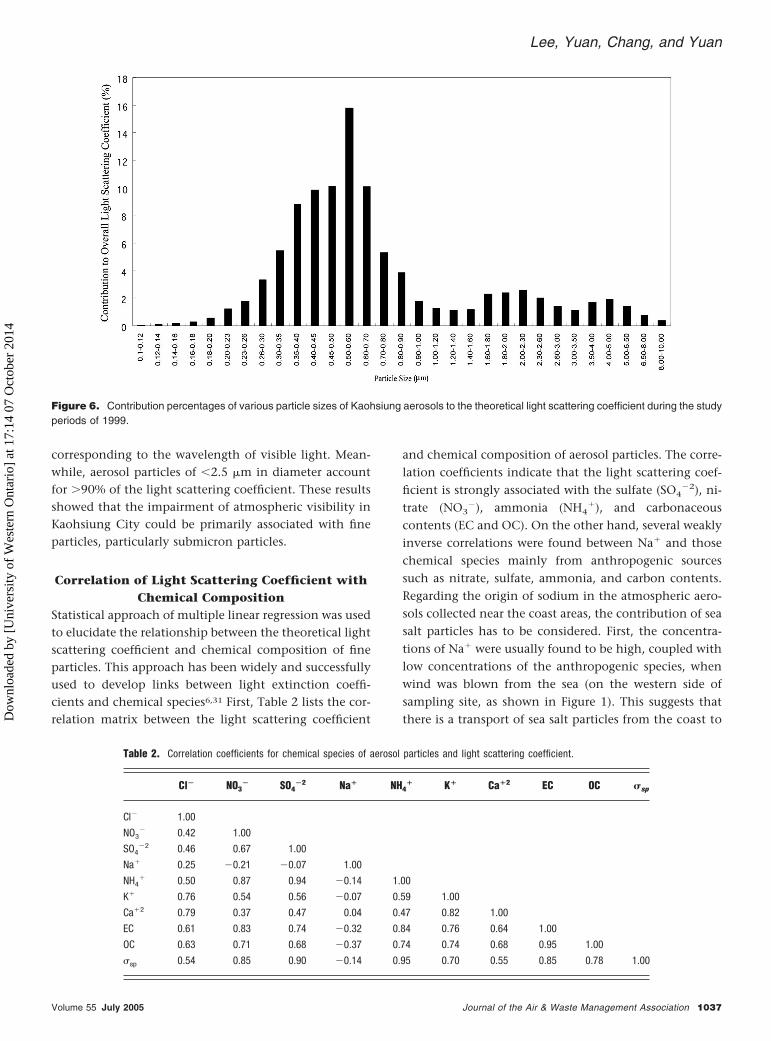
corresponding to the wavelength of visible light. Mean-while, aerosol particles of �2.5 �m in diameter accountfor �90% of the light scattering coefficient. These resultsshowed that the impairment of atmospheric visibility inKaohsiung City could be primarily associated with fineparticles, particularly submicron particles.
Correlation of Light Scattering Coefficient withChemical Composition
Statistical approach of multiple linear regression was usedto elucidate the relationship between the theoretical lightscattering coefficient and chemical composition of fineparticles. This approach has been widely and successfullyused to develop links between light extinction coeffi-cients and chemical species6,31 First, Table 2 lists the cor-relation matrix between the light scattering coefficient
and chemical composition of aerosol particles. The corre-lation coefficients indicate that the light scattering coef-ficient is strongly associated with the sulfate (SO4
�2), ni-trate (NO3
�), ammonia (NH4�), and carbonaceous
contents (EC and OC). On the other hand, several weaklyinverse correlations were found between Na� and thosechemical species mainly from anthropogenic sourcessuch as nitrate, sulfate, ammonia, and carbon contents.Regarding the origin of sodium in the atmospheric aero-sols collected near the coast areas, the contribution of seasalt particles has to be considered. First, the concentra-tions of Na� were usually found to be high, coupled withlow concentrations of the anthropogenic species, whenwind was blown from the sea (on the western side ofsampling site, as shown in Figure 1). This suggests thatthere is a transport of sea salt particles from the coast to
Figure 6. Contribution percentages of various particle sizes of Kaohsiung aerosols to the theoretical light scattering coefficient during the studyperiods of 1999.
Table 2. Correlation coefficients for chemical species of aerosol particles and light scattering coefficient.
Cl� NO3� SO4
�2 Na� NH4� K� Ca�2 EC OC �sp
Cl� 1.00
NO3� 0.42 1.00
SO4�2 0.46 0.67 1.00
Na� 0.25 �0.21 �0.07 1.00
NH4� 0.50 0.87 0.94 �0.14 1.00
K� 0.76 0.54 0.56 �0.07 0.59 1.00
Ca�2 0.79 0.37 0.47 0.04 0.47 0.82 1.00
EC 0.61 0.83 0.74 �0.32 0.84 0.76 0.64 1.00
OC 0.63 0.71 0.68 �0.37 0.74 0.74 0.68 0.95 1.00
�sp 0.54 0.85 0.90 �0.14 0.95 0.70 0.55 0.85 0.78 1.00
Lee, Yuan, Chang, and Yuan
Volume 55 July 2005 Journal of the Air & Waste Management Association 1037
Dow
nloa
ded
by [
Uni
vers
ity o
f W
este
rn O
ntar
io]
at 1
7:14
07
Oct
ober
201
4
the urban area. Considering that the contribution of sea
salt is mainly in the coarse particle fraction (less scat-
tering efficiency), consequently, better visibility and
lower light scattering coefficient are usually both ob-
served under the circumstances of western wind direc-
tion. On the other hand, if the wind was blown from
the urban areas, the anthropogenic species will cer-
tainly dominate the mass of Kaohsiung aerosols,
whereas the contribution of sea salt particles will be
relatively restricted. Consequently, poor visibility and
high light scattering coefficient were always observed
under the circumstances of eastern wind direction.
Thus, based on the correlation coefficient of �0.14, a
relationship of slightly inverse correlation might exist
between Na� and light scattering coefficient.
According to the results of this correlation matrix,
ammonium sulfate, ammonium nitrate, total carbon, and
remainders were selected as the independent variables,
whereas the light scattering coefficient is considered to be
the dependent variable in a stepwise multiple linear re-
gression method. The multiple linear regression model for
light scattering coefficient has the form:
�sp � �i � 1
n
KiMi (2)
where �sp is particle scattering, n is the number of
chemical species, Ki is the scattering efficiency for the
ith species, and Mi represents the mass concentration of
the ith chemical species Among them, [(NH4)2SO4] and
[NH4NO3] are determined by multiplying [SO4�2] and
[NO3�] by 1.3, respectively.32 The following equation
was proposed as the empirical regression model for
estimating the light scattering coefficient herein this
study:
�sp 0.0054 [(NH4)2SO4] � 0.0033 [NH4NO3]
�0.0015[TC] � 0.0012[PM2.5remainder] � 0.0141
(3)
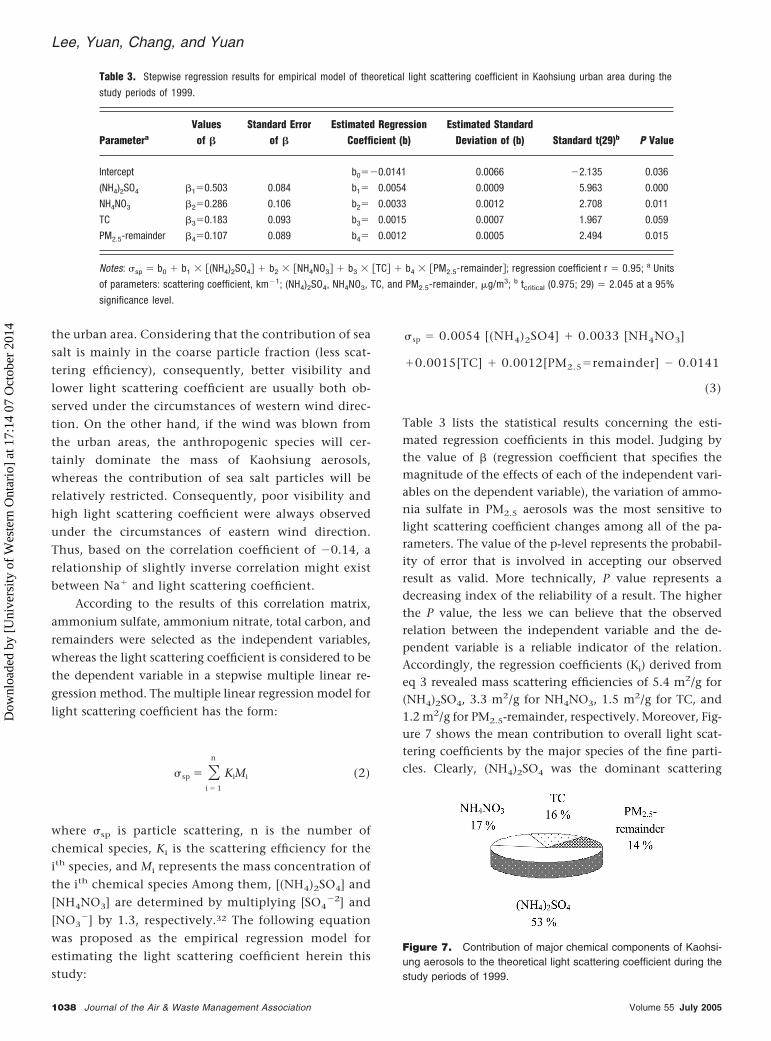
Table 3 lists the statistical results concerning the esti-mated regression coefficients in this model. Judging bythe value of � (regression coefficient that specifies themagnitude of the effects of each of the independent vari-ables on the dependent variable), the variation of ammo-nia sulfate in PM2.5 aerosols was the most sensitive tolight scattering coefficient changes among all of the pa-rameters. The value of the p-level represents the probabil-ity of error that is involved in accepting our observedresult as valid. More technically, P value represents adecreasing index of the reliability of a result. The higherthe P value, the less we can believe that the observedrelation between the independent variable and the de-pendent variable is a reliable indicator of the relation.Accordingly, the regression coefficients (Ki) derived fromeq 3 revealed mass scattering efficiencies of 5.4 m2/g for(NH4)2SO4, 3.3 m2/g for NH4NO3, 1.5 m2/g for TC, and1.2 m2/g for PM2.5-remainder, respectively. Moreover, Fig-ure 7 shows the mean contribution to overall light scat-tering coefficients by the major species of the fine parti-cles. Clearly, (NH4)2SO4 was the dominant scattering
Table 3. Stepwise regression results for empirical model of theoretical light scattering coefficient in Kaohsiung urban area during the
study periods of 1999.
Parametera
Valuesof �
Standard Errorof �
Estimated RegressionCoefficient (b)
Estimated StandardDeviation of (b) Standard t(29)b P Value
Intercept b0�0.0141 0.0066 �2.135 0.036
(NH4)2SO4 �10.503 0.084 b1 0.0054 0.0009 5.963 0.000
NH4NO3 �20.286 0.106 b2 0.0033 0.0012 2.708 0.011
TC �30.183 0.093 b3 0.0015 0.0007 1.967 0.059
PM2.5-remainder �40.107 0.089 b4 0.0012 0.0005 2.494 0.015
Notes: �sp b0 � b1 � (NH4)2SO4� � b2 � NH4NO3� � b3 � TC� � b4 � PM2.5-remainder�; regression coefficient r 0.95; a Units
of parameters: scattering coefficient, km�1; (NH4)2SO4, NH4NO3, TC, and PM2.5-remainder, �g/m3; b tcritical (0.975; 29) 2.045 at a 95%
significance level.
Figure 7. Contribution of major chemical components of Kaohsi-ung aerosols to the theoretical light scattering coefficient during thestudy periods of 1999.
Lee, Yuan, Chang, and Yuan
1038 Journal of the Air & Waste Management Association Volume 55 July 2005
Dow
nloa
ded
by [
Uni
vers
ity o
f W
este
rn O
ntar
io]
at 1
7:14
07
Oct
ober
201
4
species, accounting for �53% of the overall light scatter-ing coefficient, whereas NH4NO3, TC, and PM2.5-remain-der accounted for 17%, 16%, and 14%, respectively.
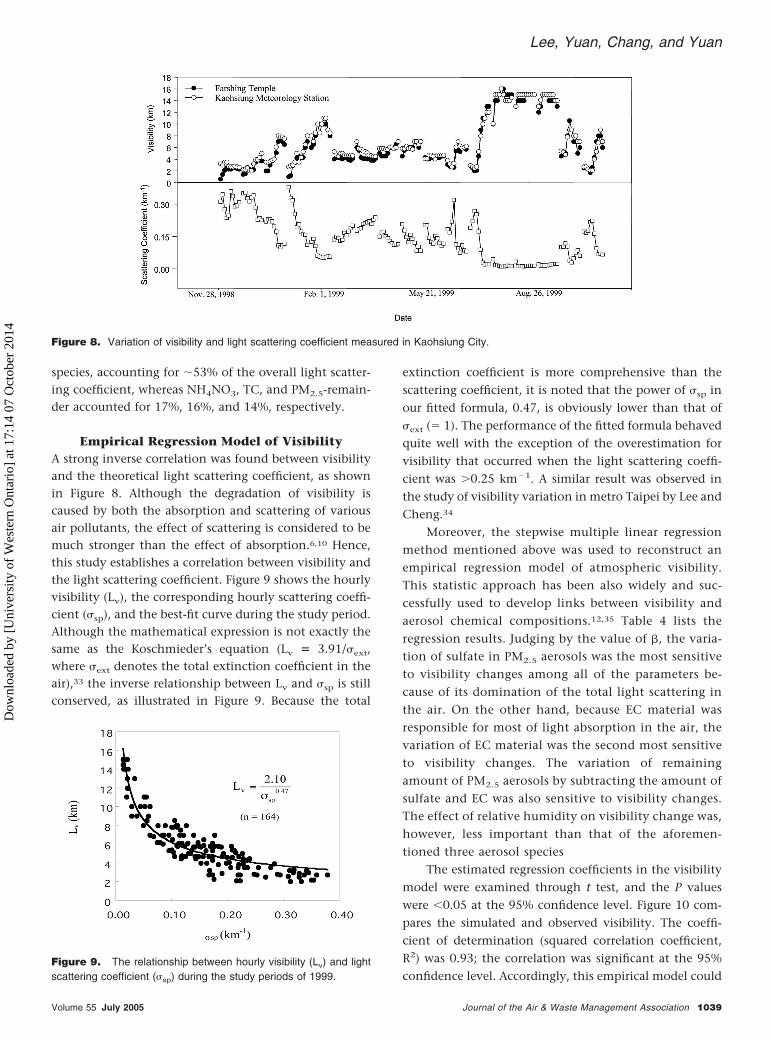
Empirical Regression Model of VisibilityA strong inverse correlation was found between visibilityand the theoretical light scattering coefficient, as shownin Figure 8. Although the degradation of visibility iscaused by both the absorption and scattering of variousair pollutants, the effect of scattering is considered to bemuch stronger than the effect of absorption.6,10 Hence,this study establishes a correlation between visibility andthe light scattering coefficient. Figure 9 shows the hourlyvisibility (Lv), the corresponding hourly scattering coeffi-cient (�sp), and the best-fit curve during the study period.Although the mathematical expression is not exactly thesame as the Koschmieder’s equation (Lv � 3.91/�ext,where �ext denotes the total extinction coefficient in theair),33 the inverse relationship between Lv and �sp is stillconserved, as illustrated in Figure 9. Because the total
extinction coefficient is more comprehensive than thescattering coefficient, it is noted that the power of �sp inour fitted formula, 0.47, is obviously lower than that of�ext ( 1). The performance of the fitted formula behavedquite well with the exception of the overestimation forvisibility that occurred when the light scattering coeffi-cient was �0.25 km�1. A similar result was observed inthe study of visibility variation in metro Taipei by Lee andCheng.34
Moreover, the stepwise multiple linear regressionmethod mentioned above was used to reconstruct anempirical regression model of atmospheric visibility.This statistic approach has been also widely and suc-cessfully used to develop links between visibility andaerosol chemical compositions.12,35 Table 4 lists theregression results. Judging by the value of �, the varia-tion of sulfate in PM2.5 aerosols was the most sensitiveto visibility changes among all of the parameters be-cause of its domination of the total light scattering inthe air. On the other hand, because EC material wasresponsible for most of light absorption in the air, thevariation of EC material was the second most sensitiveto visibility changes. The variation of remainingamount of PM2.5 aerosols by subtracting the amount ofsulfate and EC was also sensitive to visibility changes.The effect of relative humidity on visibility change was,however, less important than that of the aforemen-tioned three aerosol species
The estimated regression coefficients in the visibilitymodel were examined through t test, and the P valueswere �0.05 at the 95% confidence level. Figure 10 com-pares the simulated and observed visibility. The coeffi-cient of determination (squared correlation coefficient,R2) was 0.93; the correlation was significant at the 95%confidence level. Accordingly, this empirical model could
Figure 8. Variation of visibility and light scattering coefficient measured in Kaohsiung City.
Figure 9. The relationship between hourly visibility (Lv) and lightscattering coefficient (�sp) during the study periods of 1999.
Lee, Yuan, Chang, and Yuan
Volume 55 July 2005 Journal of the Air & Waste Management Association 1039
Dow
nloa
ded
by [
Uni
vers
ity o
f W
este
rn O
ntar
io]
at 1
7:14
07
Oct
ober
201
4
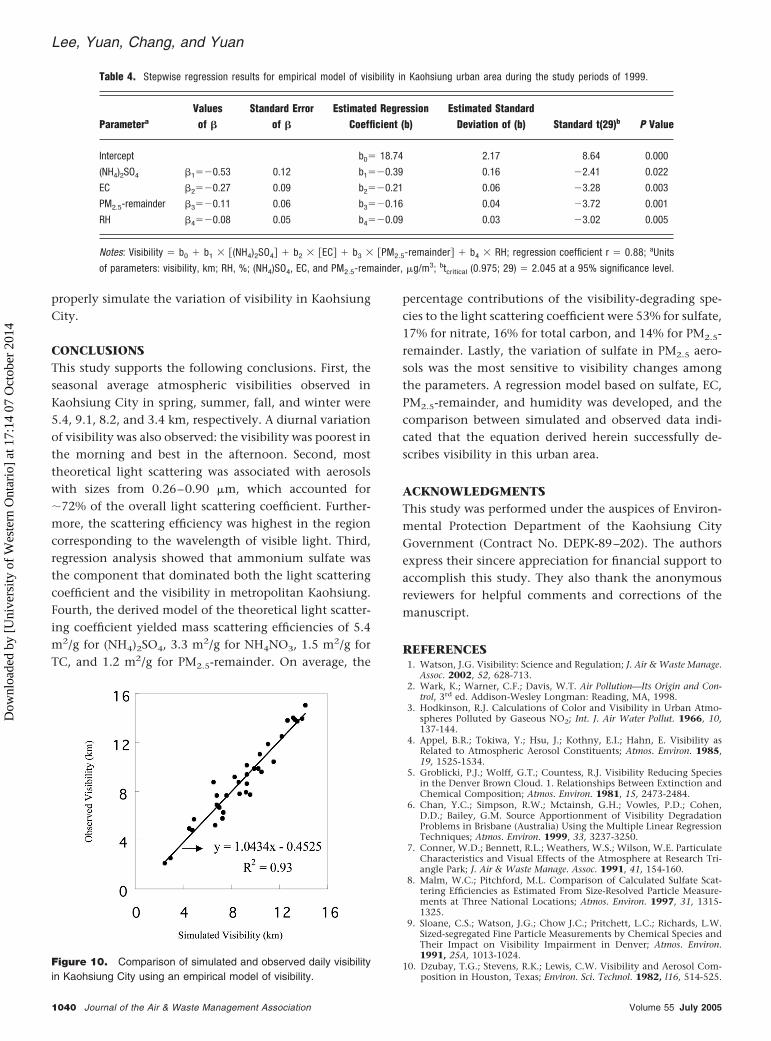
properly simulate the variation of visibility in KaohsiungCity.
CONCLUSIONSThis study supports the following conclusions. First, theseasonal average atmospheric visibilities observed inKaohsiung City in spring, summer, fall, and winter were5.4, 9.1, 8.2, and 3.4 km, respectively. A diurnal variationof visibility was also observed: the visibility was poorest inthe morning and best in the afternoon. Second, mosttheoretical light scattering was associated with aerosolswith sizes from 0.26–0.90 �m, which accounted for�72% of the overall light scattering coefficient. Further-more, the scattering efficiency was highest in the regioncorresponding to the wavelength of visible light. Third,regression analysis showed that ammonium sulfate wasthe component that dominated both the light scatteringcoefficient and the visibility in metropolitan Kaohsiung.Fourth, the derived model of the theoretical light scatter-ing coefficient yielded mass scattering efficiencies of 5.4m2/g for (NH4)2SO4, 3.3 m2/g for NH4NO3, 1.5 m2/g forTC, and 1.2 m2/g for PM2.5-remainder. On average, the
percentage contributions of the visibility-degrading spe-cies to the light scattering coefficient were 53% for sulfate,17% for nitrate, 16% for total carbon, and 14% for PM2.5-remainder. Lastly, the variation of sulfate in PM2.5 aero-sols was the most sensitive to visibility changes amongthe parameters. A regression model based on sulfate, EC,PM2.5-remainder, and humidity was developed, and thecomparison between simulated and observed data indi-cated that the equation derived herein successfully de-scribes visibility in this urban area.
ACKNOWLEDGMENTSThis study was performed under the auspices of Environ-mental Protection Department of the Kaohsiung CityGovernment (Contract No. DEPK-89–202). The authorsexpress their sincere appreciation for financial support toaccomplish this study. They also thank the anonymousreviewers for helpful comments and corrections of themanuscript.
REFERENCES1. Watson, J.G. Visibility: Science and Regulation; J. Air & Waste Manage.
Assoc. 2002, 52, 628-713.2. Wark, K.; Warner, C.F.; Davis, W.T. Air Pollution—Its Origin and Con-
trol, 3rd ed. Addison-Wesley Longman: Reading, MA, 1998.3. Hodkinson, R.J. Calculations of Color and Visibility in Urban Atmo-
spheres Polluted by Gaseous NO2; Int. J. Air Water Pollut. 1966, 10,137-144.
4. Appel, B.R.; Tokiwa, Y.; Hsu, J.; Kothny, E.I.; Hahn, E. Visibility asRelated to Atmospheric Aerosol Constituents; Atmos. Environ. 1985,19, 1525-1534.
5. Groblicki, P.J.; Wolff, G.T.; Countess, R.J. Visibility Reducing Speciesin the Denver Brown Cloud. 1. Relationships Between Extinction andChemical Composition; Atmos. Environ. 1981, 15, 2473-2484.
6. Chan, Y.C.; Simpson, R.W.; Mctainsh, G.H.; Vowles, P.D.; Cohen,D.D.; Bailey, G.M. Source Apportionment of Visibility DegradationProblems in Brisbane (Australia) Using the Multiple Linear RegressionTechniques; Atmos. Environ. 1999, 33, 3237-3250.
7. Conner, W.D.; Bennett, R.L.; Weathers, W.S.; Wilson, W.E. ParticulateCharacteristics and Visual Effects of the Atmosphere at Research Tri-angle Park; J. Air & Waste Manage. Assoc. 1991, 41, 154-160.
8. Malm, W.C.; Pitchford, M.L. Comparison of Calculated Sulfate Scat-tering Efficiencies as Estimated From Size-Resolved Particle Measure-ments at Three National Locations; Atmos. Environ. 1997, 31, 1315-1325.
9. Sloane, C.S.; Watson, J.G.; Chow J.C.; Pritchett, L.C.; Richards, L.W.Sized-segregated Fine Particle Measurements by Chemical Species andTheir Impact on Visibility Impairment in Denver; Atmos. Environ.1991, 25A, 1013-1024.
10. Dzubay, T.G.; Stevens, R.K.; Lewis, C.W. Visibility and Aerosol Com-position in Houston, Texas; Environ. Sci. Technol. 1982, l16, 514-525.
Table 4. Stepwise regression results for empirical model of visibility in Kaohsiung urban area during the study periods of 1999.
Parametera
Valuesof �
Standard Errorof �
Estimated RegressionCoefficient (b)
Estimated StandardDeviation of (b) Standard t(29)b P Value
Intercept b0 18.74 2.17 8.64 0.000
(NH4)2SO4 �1�0.53 0.12 b1�0.39 0.16 �2.41 0.022
EC �2�0.27 0.09 b2�0.21 0.06 �3.28 0.003
PM2.5-remainder �3�0.11 0.06 b3�0.16 0.04 �3.72 0.001
RH �4�0.08 0.05 b4�0.09 0.03 �3.02 0.005
Notes: Visibility b0 � b1 � (NH4)2SO4� � b2 � EC� � b3 � PM2.5-remainder� � b4 � RH; regression coefficient r 0.88; aUnits
of parameters: visibility, km; RH, %; (NH4)SO4, EC, and PM2.5-remainder, �g/m3; btcritical (0.975; 29) 2.045 at a 95% significance level.
Figure 10. Comparison of simulated and observed daily visibilityin Kaohsiung City using an empirical model of visibility.
Lee, Yuan, Chang, and Yuan
1040 Journal of the Air & Waste Management Association Volume 55 July 2005
Dow
nloa
ded
by [
Uni
vers
ity o
f W
este
rn O
ntar
io]
at 1
7:14
07
Oct
ober
201
4
11. Tang, I.N.; Wong, W.T.; Munkelwitz, H.R. The Relative Importance ofAtmospheric Sulfate and Nitrates in Visibility Reduction; Atmos. Envi-ron. 1981, 15, 2463-2471.
12. Tsai, Y.I.; Cheng, M.T. Visibility and Aerosol Chemical CompositionsNear the Coastal Area in Central Taiwan; The Science of the TotalEnvironment 1999, 231, 37-51.
13. U.S. Environment Protection Agency, Republic of China; available athttp://www.epa.gov.tw (accessed May 9, 2005).
14. Horvath, H. Estimation of the Average Visibility in Central Europe;Atmos. Environ. 1995, 29, 241-246.
15. Yuan, C.S.; Lee, C.G.; Liu, S.H.; Yuan, C.; Yang, H.Y.; Chen, C.T.Develpoing Strategies for Improving Urban Visual Air Quality; AerosolAir Quality Res. 2002, 2, 9-22.
16. Yuan, C.S.; Chang, J.C.; Yuan, J.S.; Lin, Z.T.; Yuan, C.; Yang, H.Y. AField Study on the Relationship of Visibility with Suspended Particlesand Meteorological Factors in Kaohsiung. In Proceedings of A&WMA90th Annual Meeting & Exhibition, San Diego, California, 1998; A&WMA:Pittsburgh, PA, 1998.
17. Trijonis, J.C.; Malm, W.C.; Pitchford, M.; White, W.H.; Charlson, R.;Husar, R. Visibility: Existing and Historical Conditions—Causes andEffects. In State-of-Science/Technology, Report 24, Vol. 3 of Natl. AcidPrecip. Assessment Program: Washington, DC, 1990.
18. Kirchstetter, T.W.; Corrigan, C.E.; Novakov, T. Laboratory and FieldInvestigation of the Adsorption of Gaseous Organic Compound OntoQuartz Filters; Atmos. Environ. 2001, 35, 1663-1671.
19. Eatough, D.J.; Eatough D.A.; Lewis, E.A. Fine Particulate ChemicalComposition and Extinction Apportionment at Canyonlands Na-tional Park Using Organic Particulate Material Concentrations Ob-tained with a Multi-System, Multichannel Diffusion Denuder Sampler;J. Geophys. Res. 1996, 101, 19515-19531.
20. Turpin, B.J.; Saxena, P.; Andrews, E. Measuring and Simulating Partic-ulate Organics in the Atmosphere: Problems and Prospects; Atmos.Environ. 2000, 34, 2983-3013.
21. Chow, J.C.; Watson, J.G.; Crow, D.; Lowenthal, D.H.; Merrifield, T.Comparison of IMPROVE and National Institute for OccupationalSafety and Health Carbon Measurements; Aerosol Sci. Technol. 2001,34, 23-34.
22. Sweet, C.W.; Gatz, D.F. Short Communication Summary and Analysisof Available PM2.5 Measurements in Illinois; Atmos. Environ. 1998, 32,1129-1133.
23. Turpin, B.J.; Huntzicker, J.J.; Larson, S.M.; Cass, G.R. los Angeles Sum-mer Midday Particulate Organic Carbon: Primary and Secondary Aero-sol; Environ. Sci. Technol. 1991, 25, 1788-1793.
24. Turpin, B.J.; Huntzicker, J.J. Identification of Secondary Organic Aero-sol Episodes and Quantification of Primary and Secondary OrganicAerosol Concentrations During SCAQR; Atmos. Environ. 1995, 29,3527-3544.
25. Chow, J.C.; Watson, J.G.; Fujita, E.M.; Lu, Z.; Lawson, D.R. Temporaland Spatial Variations of PM2.5 and PM10 Aerosol in Southern Cali-fornia Air Quality Study; Atmos. Environ. 1994, 28, 3773-3785.
26. Bohren, C.F.; Huffman, D.R; Absorption and Scattering of Light by SmallParticles. John Wiley & Sons: New York, 1998.
27. Sloane, C.S.; Rood, M.J.; Rogers, C.F. Measurements of Aerosol ParticleSize: Improved Precision by Simultaneous use of Optical ParticleCounter and Nephelometer; Aerosol Sci. Technol. 1991, 14, 289-301.
28. Baik, N.J.; Kim, Y.P.; Moon, K.C. Visibility Study in Seoul, 1993; Atmos.Environ. 1996, 30, 2319-2328.
29. Lowenthal, D.H.; Watson, J.G.; Saxena, P. Contributions to LightExtinction During Project MOHAVE; Atmos. Environ. 2000, 34, 2351-2359.
30. Reist, P. C; Aerosol Science and Technology; 2nd ed. McGraw-Hill: Singa-pore, 1993, 267.
31. Malm, W.C.; Derek, E.D.; Kreidenweis, S.M. Light Scattering Charac-teristics of Aerosols at Ambient and as a Function of Relative Humid-ity: Part II—A Comparison of Measured Scattering and Aerosol Con-centrations Using Statistical Models; J. Air & Waste Manage. Assoc.2000, 50, 701-709.
32. Cass, G.R. On the Relationship Between Sulfate Air Quality and Visi-bility With Examples in Los Angeles; Atmos. Environ. 1979, 13, 1069-1084.
33. Hinds, W.C; Aerosol Technology-Properties, Behavior, and Measurement ofAirborne Particles. John Willy & Sons: New York, 1982.
34. Lee, C.T.; Cheng, J.P. The Effects of Aerosol Species and MeteorologicalFactors on Visibility in the Taipei Metropolitan Area; J. Chinese Inst.Environ. Eng. 1996, 6, 21–30.
35. Leaderer, B.P.; Holford, T.R.; Stolwijk, J.A.K. Relationship BetweenSulfate Aerosol and Visibility; J. Air Pollut. Control Assoc. 1979, 29,154-157.
About the AuthorsChang-Gai Lee is a doctoral student, Chung-Shin Yuan isan associate professor, and Jui-Cheng Chang received hismaster’s degree at the Institute of Environmental Engineer-ing, National Sun Yat-Sen University, Taiwan, Republic ofChina. Ching Yuan is an associate professor at the Depart-ment of Civil and Environmental Engineering, National Uni-versity of Kaohsiung, Taiwan, Republic of China. Addresscorrespondence to: Chung-Shin Yuan, Institute of Environ-mental Engineering, National Sun Yat-Sen University, 70,Lian-Hai Road, Kaohsiung, Taiwan 804, Republic of China;phone: �1-886-7-5252000, ext.4409; fax: �1-886-7-5254409; e-mail: [email protected].
Lee, Yuan, Chang, and Yuan
Volume 55 July 2005 Journal of the Air & Waste Management Association 1041
Dow
nloa
ded
by [
Uni
vers
ity o
f W
este
rn O
ntar
io]
at 1
7:14
07
Oct
ober
201
4