Embed Size (px)
Citation preview

This content has been downloaded from IOPscience. Please scroll down to see the full text.
Download details:
IP Address: 134.151.40.2
This content was downloaded on 03/10/2014 at 03:39
Please note that terms and conditions apply.
Effects of Antenna Size and Configurations in Large-Area RF Plasma Production with Internal
Low-Inductance Antenna Units
View the table of contents for this issue, or go to the journal homepage for more
2006 Jpn. J. Appl. Phys. 45 8042
(http://iopscience.iop.org/1347-4065/45/10S/8042)
Home Search Collections Journals About Contact us My IOPscience
Effects of Antenna Size and Configurations in Large-Area RF Plasma Production
with Internal Low-Inductance Antenna Units
Hiroshige DEGUCHI, Hitoshi YONEDA, Kenji KATO, Kiyoshi KUBOTA, Tsukasa HAYASHI,Kiyoshi OGATA, Akinori EBE1, Kosuke TAKENAKA2 and Yuichi SETSUHARA2
Nissin Electric Co., Ltd., R&D Laboratories, Ukyo-ku, Kyoto 615-8686, Japan1EMD Corporation, Nishikyou-ku, Kyoto 615-8245, Japan2Joining and Welding Research Institute, Osaka University, Ibaraki, Osaka 567-0047, Japan
(Received February 10, 2006; accepted April 23, 2006; published online October 24, 2006)
Recent trends of liquid crystal display (LCD) fabrication toward a significant enlargement of glass substrates require large-area plasma sources with a scale length exceeding 1m. To meet this requirement, large-area plasma sources with internal low-inductance antenna (LIA) units have been developed for uniform processes, in which design principles for selecting antennasize and configurations in the multiple installation of the LIA units are established. In this study, the effects of antenna sizewere examined in terms of plasma production characteristics indicating small increase in plasma density with a decrease inantenna size (or antenna impedance). Furthermore, plasma density distributions with the LIA units were investigated tounderstand the nature of plasma diffusion, which can be utilized for designing plasma profiles with multiple LIA units. First, itwas shown that the plasma density distributions followed exponential decay as a function of distance from the antenna.Secondly, the measured plasma density profiles with multiple LIA units were shown to agree well with those obtained bysuperposing those described by exponential functions, which can be utilized for prediction. [DOI: 10.1143/JJAP.45.8042]
KEYWORDS: plasma sources, low-inductance internal antenna, antenna size, configuration
1. Introduction
In liquid crystal display (LCD) fabrications, uniformlarge-area plasma sources with a scale length in meters arerequired owing to processing trends toward the LCDenlargement of a mother glass substrate. Furthermore,plasma sources are requested to high-density plasmas inorder to achieve high-throughput processes.
To meet these requirements, the development of the large-area and high-density plasma sources have been attemptedusing various plasmas, such as a capacitively coupledplasma (CCP),1) an inductively coupled plasma (ICP),2) anelectron cyclotron resonance (ECR) plasma,3–6) and asurface wave plasma (SWP).7) However, with increasingsource size, the size of power-coupling devices, such ascapacitive electrodes and inductive antennas, that drive CCPand ICP is equivalent to or as long as the 1/4 wavelength ofa high-frequency power transmission.8,9) Therefore, thestanding wave formed on these power-coupling devicescauses the unavoidable nonuniformity of the power deposi-tion distribution and hence the plasma distribution.
As one of the promising candidates to avoid these issuesassociated with conventional sources, internal-antenna-driven ICPs are attractive. In previous studies on ICPsources with internal-antenna configurations, we revealedthat it is important to suppress the electrostatic coupling ofan RF antenna voltage to a plasma and demonstrated theproduction of a high-density plasma sustained with aninternal antenna using technologies, such as a reduction inantenna inductance and the dielectric isolation of an antennaconductor from plasmas.10–14) Using technologies, we alsodeveloped ICP sources with internal low-inductance antenna(LIA) units, which allow an efficient high-density plasmaproduction and a low-potential operation.
In designing large-area plasma sources with multiple LIAunits, it is important for the production of uniform plasmasto properly arrange the antennas and for the control ofproperties of bulk plasmas to understand the effects of each
antenna shape and/or size on the properties of plasmas nearthe antennas.
In this paper, we report the effects of antenna size andconfigurations on plasma properties in terms of plasmadensity and ion current density. We also discuss issues fordesigning of a meter-sized chamber, which consider theeffects of antenna size and configuration.
2. Experimental
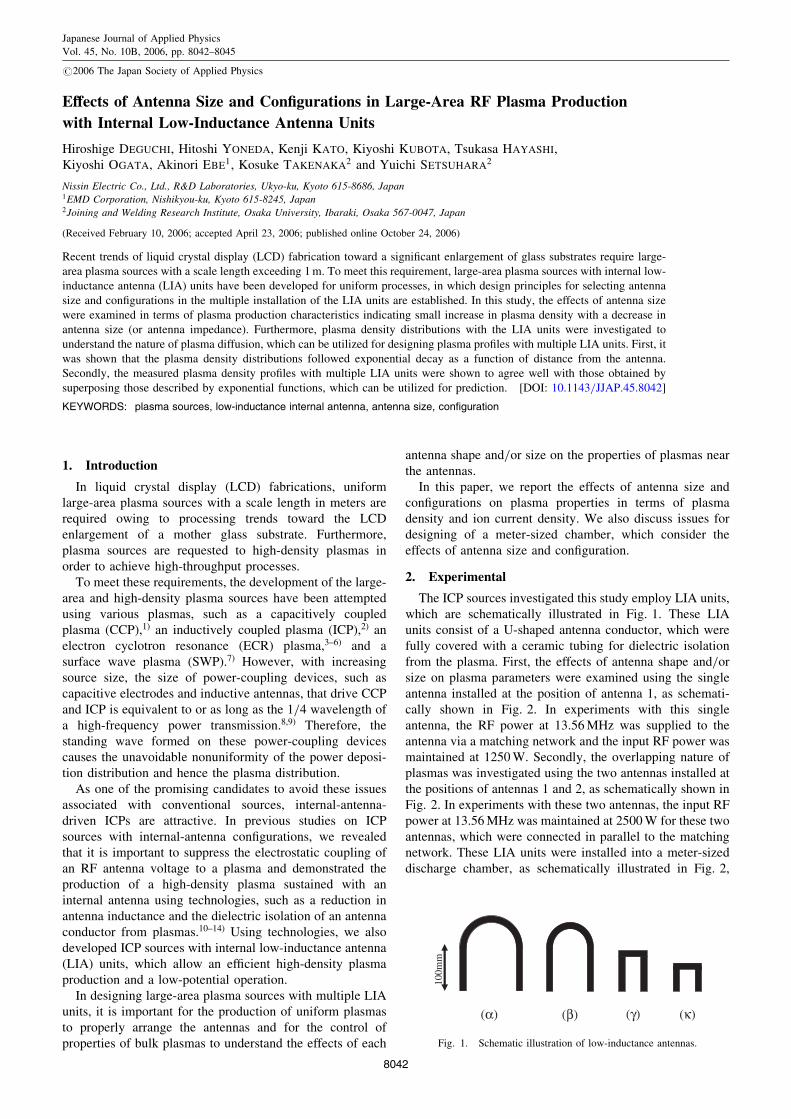
The ICP sources investigated this study employ LIA units,which are schematically illustrated in Fig. 1. These LIAunits consist of a U-shaped antenna conductor, which werefully covered with a ceramic tubing for dielectric isolationfrom the plasma. First, the effects of antenna shape and/orsize on plasma parameters were examined using the singleantenna installed at the position of antenna 1, as schemati-cally shown in Fig. 2. In experiments with this singleantenna, the RF power at 13.56MHz was supplied to theantenna via a matching network and the input RF power wasmaintained at 1250W. Secondly, the overlapping nature ofplasmas was investigated using the two antennas installed atthe positions of antennas 1 and 2, as schematically shown inFig. 2. In experiments with these two antennas, the input RFpower at 13.56MHz was maintained at 2500W for these twoantennas, which were connected in parallel to the matchingnetwork. These LIA units were installed into a meter-sizeddischarge chamber, as schematically illustrated in Fig. 2,
100m
m
(α) (β) (γ) (κ)
Fig. 1. Schematic illustration of low-inductance antennas.
Japanese Journal of Applied Physics
Vol. 45, No. 10B, 2006, pp. 8042–8045
#2006 The Japan Society of Applied Physics
8042
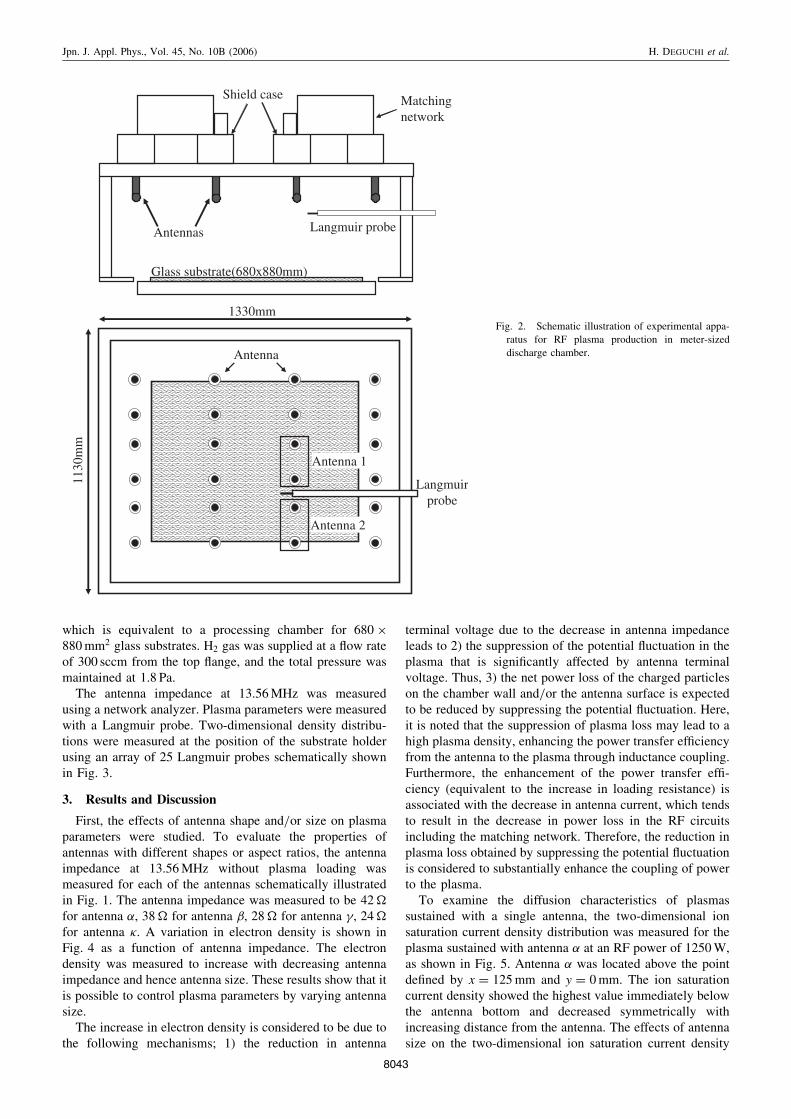
which is equivalent to a processing chamber for 680880mm2 glass substrates. H2 gas was supplied at a flow rateof 300 sccm from the top flange, and the total pressure wasmaintained at 1.8 Pa.
The antenna impedance at 13.56MHz was measuredusing a network analyzer. Plasma parameters were measuredwith a Langmuir probe. Two-dimensional density distribu-tions were measured at the position of the substrate holderusing an array of 25 Langmuir probes schematically shownin Fig. 3.
3. Results and Discussion
First, the effects of antenna shape and/or size on plasmaparameters were studied. To evaluate the properties ofantennas with different shapes or aspect ratios, the antennaimpedance at 13.56MHz without plasma loading wasmeasured for each of the antennas schematically illustratedin Fig. 1. The antenna impedance was measured to be 42for antenna , 38 for antenna , 28 for antenna , 24for antenna . A variation in electron density is shown inFig. 4 as a function of antenna impedance. The electrondensity was measured to increase with decreasing antennaimpedance and hence antenna size. These results show that itis possible to control plasma parameters by varying antennasize.
The increase in electron density is considered to be due tothe following mechanisms; 1) the reduction in antenna
terminal voltage due to the decrease in antenna impedanceleads to 2) the suppression of the potential fluctuation in theplasma that is significantly affected by antenna terminalvoltage. Thus, 3) the net power loss of the charged particleson the chamber wall and/or the antenna surface is expectedto be reduced by suppressing the potential fluctuation. Here,it is noted that the suppression of plasma loss may lead to ahigh plasma density, enhancing the power transfer efficiencyfrom the antenna to the plasma through inductance coupling.Furthermore, the enhancement of the power transfer effi-ciency (equivalent to the increase in loading resistance) isassociated with the decrease in antenna current, which tendsto result in the decrease in power loss in the RF circuitsincluding the matching network. Therefore, the reduction inplasma loss obtained by suppressing the potential fluctuationis considered to substantially enhance the coupling of powerto the plasma.
To examine the diffusion characteristics of plasmassustained with a single antenna, the two-dimensional ionsaturation current density distribution was measured for theplasma sustained with antenna at an RF power of 1250W,as shown in Fig. 5. Antenna was located above the pointdefined by x ¼ 125mm and y ¼ 0mm. The ion saturationcurrent density showed the highest value immediately belowthe antenna bottom and decreased symmetrically withincreasing distance from the antenna. The effects of antennasize on the two-dimensional ion saturation current density
Antenna
1330mm
1130
mm
Langmuirprobe
Antennas
Matchingnetwork
Shield case
Glass substrate(680x880mm)
Antenna 1
Antenna 2
Langmuir probe
Fig. 2. Schematic illustration of experimental appa-
ratus for RF plasma production in meter-sized
discharge chamber.
Jpn. J. Appl. Phys., Vol. 45, No. 10B (2006) H. DEGUCHI et al.
8043
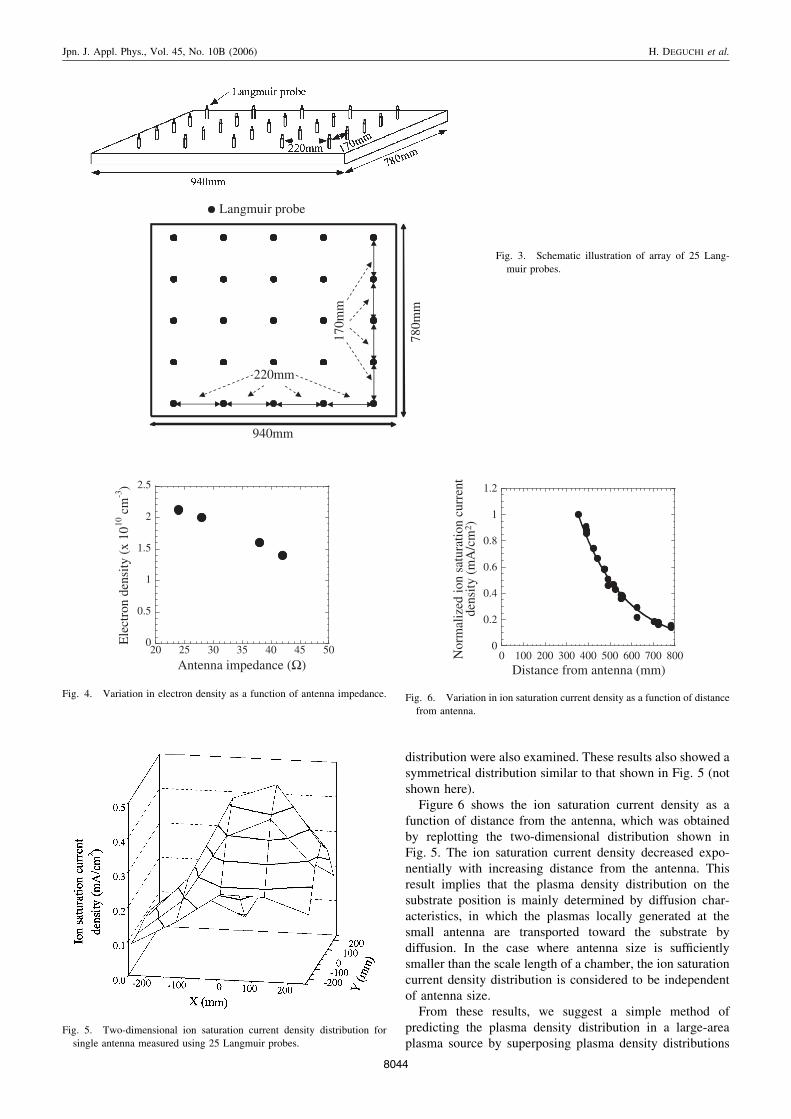
distribution were also examined. These results also showed asymmetrical distribution similar to that shown in Fig. 5 (notshown here).
Figure 6 shows the ion saturation current density as afunction of distance from the antenna, which was obtainedby replotting the two-dimensional distribution shown inFig. 5. The ion saturation current density decreased expo-nentially with increasing distance from the antenna. Thisresult implies that the plasma density distribution on thesubstrate position is mainly determined by diffusion char-acteristics, in which the plasmas locally generated at thesmall antenna are transported toward the substrate bydiffusion. In the case where antenna size is sufficientlysmaller than the scale length of a chamber, the ion saturationcurrent density distribution is considered to be independentof antenna size.
From these results, we suggest a simple method ofpredicting the plasma density distribution in a large-areaplasma source by superposing plasma density distributions
780m
m
940mm
220mm
170m
m
Langmuir probe
Fig. 3. Schematic illustration of array of 25 Lang-
muir probes.
0
0.5
1
1.5
2
2.5
20 25 30 35 40 45 50
Ele
ctro
n de
nsity
(x
1010
cm
-3)
Antenna impedance (Ω)
Fig. 4. Variation in electron density as a function of antenna impedance.
Fig. 5. Two-dimensional ion saturation current density distribution for
single antenna measured using 25 Langmuir probes.
0
0.2
0.4
0.6
0.8
1
1.2
0 100 200 300 400 500 600 700 800Nor
mal
ized
ion
satu
ratio
n cu
rren
t
Distance from antenna (mm)
den
sity
(m
A/c
m2 )
Fig. 6. Variation in ion saturation current density as a function of distance
from antenna.
Jpn. J. Appl. Phys., Vol. 45, No. 10B (2006) H. DEGUCHI et al.
8044
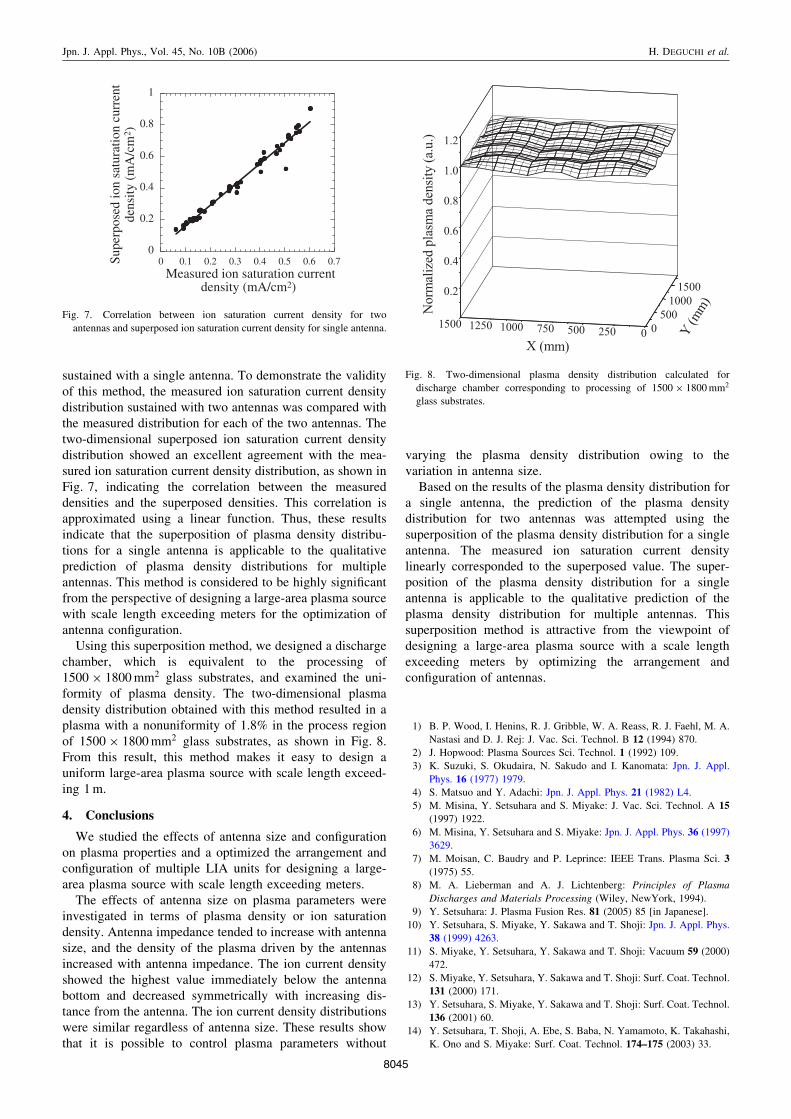
sustained with a single antenna. To demonstrate the validityof this method, the measured ion saturation current densitydistribution sustained with two antennas was compared withthe measured distribution for each of the two antennas. Thetwo-dimensional superposed ion saturation current densitydistribution showed an excellent agreement with the mea-sured ion saturation current density distribution, as shown inFig. 7, indicating the correlation between the measureddensities and the superposed densities. This correlation isapproximated using a linear function. Thus, these resultsindicate that the superposition of plasma density distribu-tions for a single antenna is applicable to the qualitativeprediction of plasma density distributions for multipleantennas. This method is considered to be highly significantfrom the perspective of designing a large-area plasma sourcewith scale length exceeding meters for the optimization ofantenna configuration.
Using this superposition method, we designed a dischargechamber, which is equivalent to the processing of1500 1800mm2 glass substrates, and examined the uni-formity of plasma density. The two-dimensional plasmadensity distribution obtained with this method resulted in aplasma with a nonuniformity of 1.8% in the process regionof 1500 1800mm2 glass substrates, as shown in Fig. 8.From this result, this method makes it easy to design auniform large-area plasma source with scale length exceed-ing 1m.
4. Conclusions
We studied the effects of antenna size and configurationon plasma properties and a optimized the arrangement andconfiguration of multiple LIA units for designing a large-area plasma source with scale length exceeding meters.
The effects of antenna size on plasma parameters wereinvestigated in terms of plasma density or ion saturationdensity. Antenna impedance tended to increase with antennasize, and the density of the plasma driven by the antennasincreased with antenna impedance. The ion current densityshowed the highest value immediately below the antennabottom and decreased symmetrically with increasing dis-tance from the antenna. The ion current density distributionswere similar regardless of antenna size. These results showthat it is possible to control plasma parameters without
varying the plasma density distribution owing to thevariation in antenna size.
Based on the results of the plasma density distribution fora single antenna, the prediction of the plasma densitydistribution for two antennas was attempted using thesuperposition of the plasma density distribution for a singleantenna. The measured ion saturation current densitylinearly corresponded to the superposed value. The super-position of the plasma density distribution for a singleantenna is applicable to the qualitative prediction of theplasma density distribution for multiple antennas. Thissuperposition method is attractive from the viewpoint ofdesigning a large-area plasma source with a scale lengthexceeding meters by optimizing the arrangement andconfiguration of antennas.
1) B. P. Wood, I. Henins, R. J. Gribble, W. A. Reass, R. J. Faehl, M. A.
Nastasi and D. J. Rej: J. Vac. Sci. Technol. B 12 (1994) 870.
2) J. Hopwood: Plasma Sources Sci. Technol. 1 (1992) 109.
3) K. Suzuki, S. Okudaira, N. Sakudo and I. Kanomata: Jpn. J. Appl.
Phys. 16 (1977) 1979.
4) S. Matsuo and Y. Adachi: Jpn. J. Appl. Phys. 21 (1982) L4.
5) M. Misina, Y. Setsuhara and S. Miyake: J. Vac. Sci. Technol. A 15
(1997) 1922.
6) M. Misina, Y. Setsuhara and S. Miyake: Jpn. J. Appl. Phys. 36 (1997)
3629.
7) M. Moisan, C. Baudry and P. Leprince: IEEE Trans. Plasma Sci. 3
(1975) 55.
8) M. A. Lieberman and A. J. Lichtenberg: Principles of Plasma
Discharges and Materials Processing (Wiley, NewYork, 1994).
9) Y. Setsuhara: J. Plasma Fusion Res. 81 (2005) 85 [in Japanese].
10) Y. Setsuhara, S. Miyake, Y. Sakawa and T. Shoji: Jpn. J. Appl. Phys.
38 (1999) 4263.
11) S. Miyake, Y. Setsuhara, Y. Sakawa and T. Shoji: Vacuum 59 (2000)
472.
12) S. Miyake, Y. Setsuhara, Y. Sakawa and T. Shoji: Surf. Coat. Technol.
131 (2000) 171.
13) Y. Setsuhara, S. Miyake, Y. Sakawa and T. Shoji: Surf. Coat. Technol.
136 (2001) 60.
14) Y. Setsuhara, T. Shoji, A. Ebe, S. Baba, N. Yamamoto, K. Takahashi,
K. Ono and S. Miyake: Surf. Coat. Technol. 174–175 (2003) 33.
0
0.2
0.4
0.6
0.8
1
0 0.1 0.2 0.3 0.4 0.5 0.6 0.7Supe
rpos
ed io
n sa
tura
tion
curr
ent
Measured ion saturation current density (mA/cm2)
dens
ity (
mA
/cm
2 )
Fig. 7. Correlation between ion saturation current density for two
antennas and superposed ion saturation current density for single antenna.
Fig. 8. Two-dimensional plasma density distribution calculated for
discharge chamber corresponding to processing of 1500 1800mm2
glass substrates.
Jpn. J. Appl. Phys., Vol. 45, No. 10B (2006) H. DEGUCHI et al.
8045