Embed Size (px)
Citation preview
1
Effects of aqueous soaking on the phytate and mineral contents
and phytate:mineral ratios of wholegrain normal sorghum and
maize and low phytate sorghum
Johanita Krugera, André Oelofseb, John R.N. Taylora*
a Department of Food Science and Institute for Food, Nutrition and Well-being, University of Pretoria,
Private Bag X20, Hatfield 0028, South Africa
bDepartment of Human Nutrition and Institute for Food, Nutrition and Well-being, University of
Pretoria, Private Bag X20, Hatfield 0028, South Africa
*Corresponding author:[email protected], Tel:+27 12 420 4296, Fax:+27 12 420 2839
Abstract
Soaking of cereal grains has been suggested as a method to reduce their phytate
content and hence increase their mineral availability. Whole and milled wholegrain,
normal and low phytate sorghum and normal maize were studied. Soaking of
unmilled sorghum and maize did not result in substantial reductions in phytate or
mineral contents. With milled grains, phytate solubilisation was somewhat greater in
maize than in sorghum after a short (1 hour) soaking period but not after 6-12 hours
of soaking when all phytate had been solubilised. Also, with milled, low phyate
sorghums, phytate solubilisation was not substantially higher than in their null
controls. Soaking milled grain substantially reduced mineral contents and Ca x
2
phytate:zinc molar ratios. However, the loss in soluble minerals could have a greater
negative effect on mineral availability, compared to the positive effect of the phytate
reduction. Thus, soaking does not seem to be a viable household method to
improve sorghum and maize mineral availability.
Keywords:iron, zinc, calcium, magnesium, phosphorus, household method, mineral
availability
Introduction
Mineral deficiencies are highly prevalent in sub-Saharan Africa (WHO, 2006;
Tulchinsky 2010). Sorghum (Sorghum bicolor (L.) Moench) and maize (Zea mays)
(L.) are important staple crops, often grown (FAO, 2007b) and consumed (FAO,
2007a) by subsistence farmers in sub-Saharan Africa. Like other grains, they are
commonly consumed as wholegrain products (Hunt, 2003). The bran contains a
substantial portion of the minerals in the grain (Mahgoub and Elhag, 1998).
However, the bran also contains factors such as phytate and in the case of sorghum
sometimes tannins (Hahn et al., 1984), depending on the cultivar, which inhibit the
availability of essential divalent minerals (Hunt, 2003) such as iron (Fe), zinc (Zn),
calcium (Ca) and magnesium (Mg).
It has been suggested that soaking of milled cereal grains could be a viable
household method to increase the mineral availability by decreasing the phytate
content (Hotz and Gibson, 2007). However, findings on the effects of soaking
3
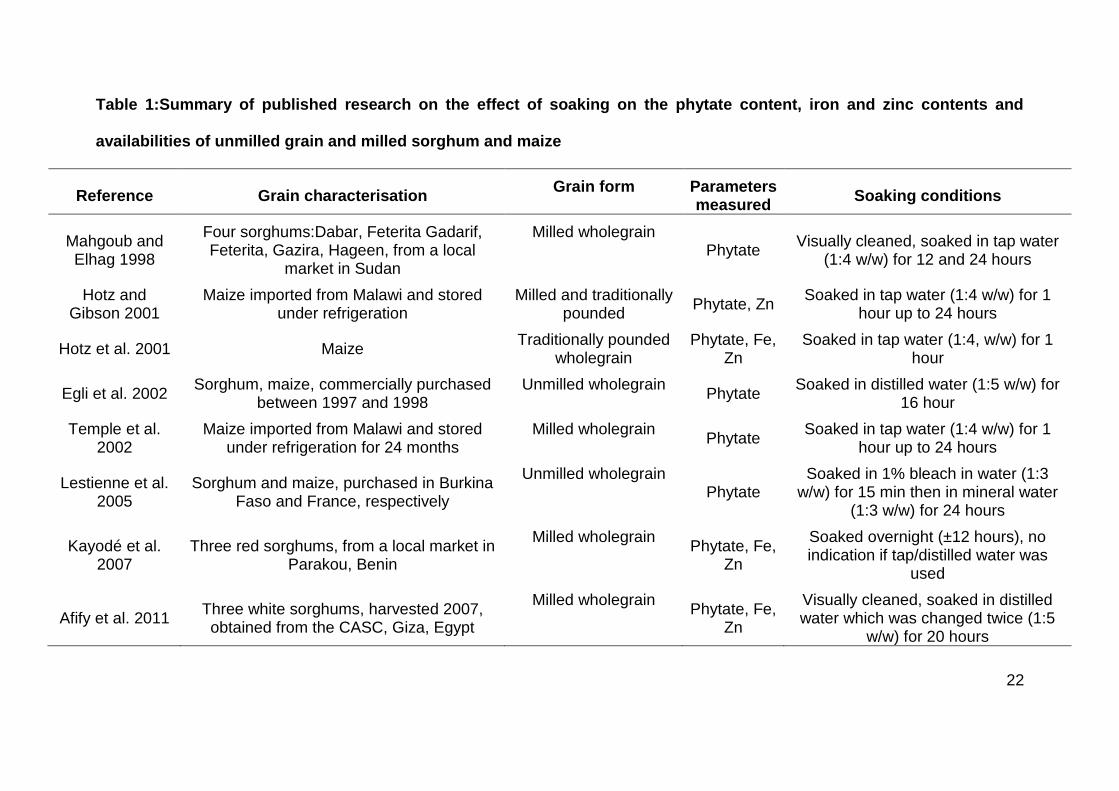
unmilled sorghum and maize on their phytate and mineral contents (Table 1) have
produced mixed results. While some differences between the phytate properties,
e.g. Location of phytate in the grain - O’Dell et al., 1972, phytate profile (Lehrfeld,
1994) and phytate solubility (Egli, 2002) of different cereal grains have been
reported, comparison of data from different authors is difficult. This is because
different grain cleaning and soaking conditions have been used (Table 1).
Differences include volume of soaking liquid, duration of soaking and source of
soaking liquid. Additionally, in general, the grains have been poorly characterized in
terms of origin and characteristics.
The primary objective of this work was to compare the solubilisation of phytate and
minerals in characterised white and red, tannin and non-tannin and low phytate
sorghum and white maize grain types. The effects of grain form and various soaking
durations were also evaluated. The aim was to determine if aqueous soaking is a
viable household method to substantially reduce phytate:mineral molar ratios of
sorghum and maize, and thereby improve their mineral availability for human
nutrition.
Materials and methods
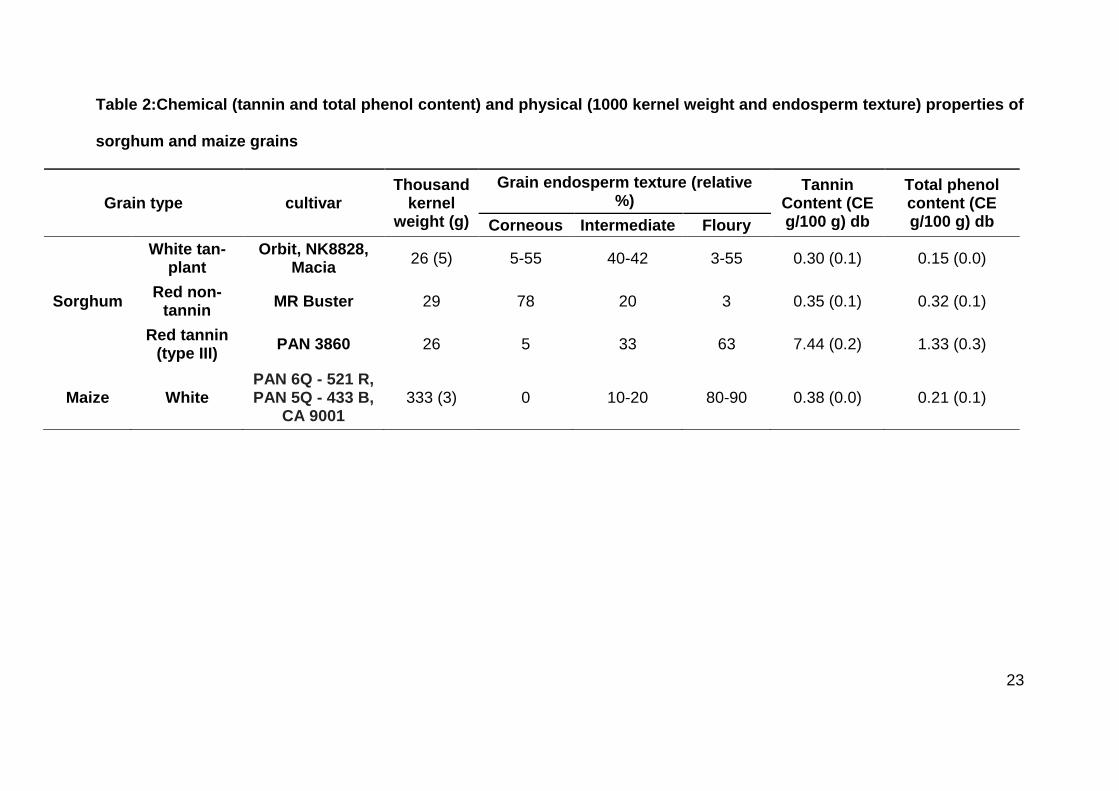
Grains- origin, physical and chemical characteristics
White tan-plant sorghum and white maize were investigated, as these types of
sorghum and maize are the most alike (Rooney and Waniska, 2000). Red
(anthocyanin-rich) non-tannin sorghum (RNTS) and red (anthocyanin and pro-
anthocyanin-rich) tannin sorghums (RTS) were also included as these types are
commonly available in local markets in sub-Saharan Africa, which was a
4
characteristic some researchers used to identify the sorghum type they worked with
(Table 1).
White tan-plant sorghum hybrids; Orbit (WS1) and NK 8828 (WS2) (both cultivated
at the South African Agricultural Research Council, Grain Crops Institute (ARC-GCI),
Potchefstroom) and variety Macia (WS3) (cultivated in Botswana), red tannin (type
III) sorghum hybrid PAN 3860 (RTS) (kindly donated by PANNAR Seeds,
Klerksdorp, South Africa) and red non-tannin sorghum hybrid; MR Buster (RNTS)
(cultivated in Botswana) were used. The low phytate transgenic sorghums (early
generation Africa Biofortified Sorghum lines) (Kruger et al., 2012) used were the
result of backcrossing a transgenic Type II tannin sorghum (parent P898012) into
Macia. The modifications included the suppression of myo-inositol kinase synthesis,
which reduced the phytic acid synthetic capacity of the plant during seed
development (Mendoza, 2002). There were both low phytate white tan-plant (LPWS)
and low phytate white type II tannin (LPWTS) sorghum types and their null controls
(NC). These were cultivated in 2009 at Johnston, Iowa, in summer, in confined field
trials and kindly donated by Pioneer Hi-Bred. Due to regulations all these transgenic
types were received as coarsely crushed grain. Thus, cleaning was not possible and
those analyses requiring unmilled grains could not be performed. The white maize
types used were hybrids; PAN 6Q-521 R (WM1), PAN 5Q- 433 B (WM2), and CA
9001 (WM3) and cultivated at the ARC-GCI. Physical and chemical characteristics
of these grains are given in Table 2.
5
Preparation of milled grains and soaked samples
Milled wholegrain
Before milling or soaking, all grains were quickly (± 30 sec) rinsed with de-ionised
water to remove surface contaminants such as soil minerals or grain dust. The
grains were then spread out in a single layer and air dried at ±20ºC overnight. They
were then milled using a laboratory hammer mill (Falling Number 3100, Huddinge,
Sweden) fitted with a 500 μm opening screen. The resulting flour was stored at 10oC
in air-tight containers in the dark prior to further preparation or analyses.
Soaking
Sound unmilled grains and milled grains were all soaked in de-ionised water at a
grain:liquid ratio of 1:5 (w/w) at 25°C on a mechanical shaker (Grant-Bio POS-300,
Cambridgeshire, England), shaking at a rate of 100 rpm. Unmilled grains were
soaked for 12 hours, while the milled grains were soaked for 45 minutes, 1 hour, 6
hours and 12 hours. After soaking the milled grain, the samples were centrifuged at
4000 x g for 5 minutes and the supernatant discarded. After soaking the unmilled
grain, the supernatant was strained off using a cheese cloth. The grains were then
dried, milled and stored as described.
Analyses
Physical characteristics
Endosperm texture, defined as the proportion of corneous endosperm relative to
floury endosperm in the grain, was determined subjectively by viewing longitudinally
6
sectioned kernels (±20 kernels) using a hand lens (ICC, 2012). Thousand kernel
weight (TKW) was determined by weighing 100 randomly selected sound kernels
and multiplying the weight by 10.
Chemical characteristics
Total phenols were determined using a modified Folin Ciocalteu method (Kaluza et
al., 1980). Tannin content was determined by the modified Vanillin HCl assay (Price
et al., 1978). Reagent blanks that corrected for the colour of the flour extracts were
included.
Phytate content
This was determined through anion exchange chromatography, indirect quantitative
analysis by measuring the organic phytate phosphorus (inositol -1 to 6- phosphate)
(Frubeck et al., 1995). The resin used was Dowex 1; anion-exchange resin-AG 1 x
4, 4% cross-linkage, chloride form, 100-200 mesh (Sigma, Johannesburg, South
Africa). Spectrophotometer used was a Lambda EZ 150 (Perkin Elmer,
Massachusetts, USA)
Mineral analysis
Mineral analysis was performed by Ion Coupled Plasma-Optical Emission
Spectroscopy (ICP-OES) as described by Kruger et al. (2012).
7
Statistical analysis
All data were analysed by single factor ANOVA (significance level p<0.05) using
Statistica 10 (Statsoft, Tulsa, Oklahoma). Linear regression statistics were analysed
using Microsoft, Excel 2010.
Results and Discussion
Effect of aqueous soaking on the phytate contents
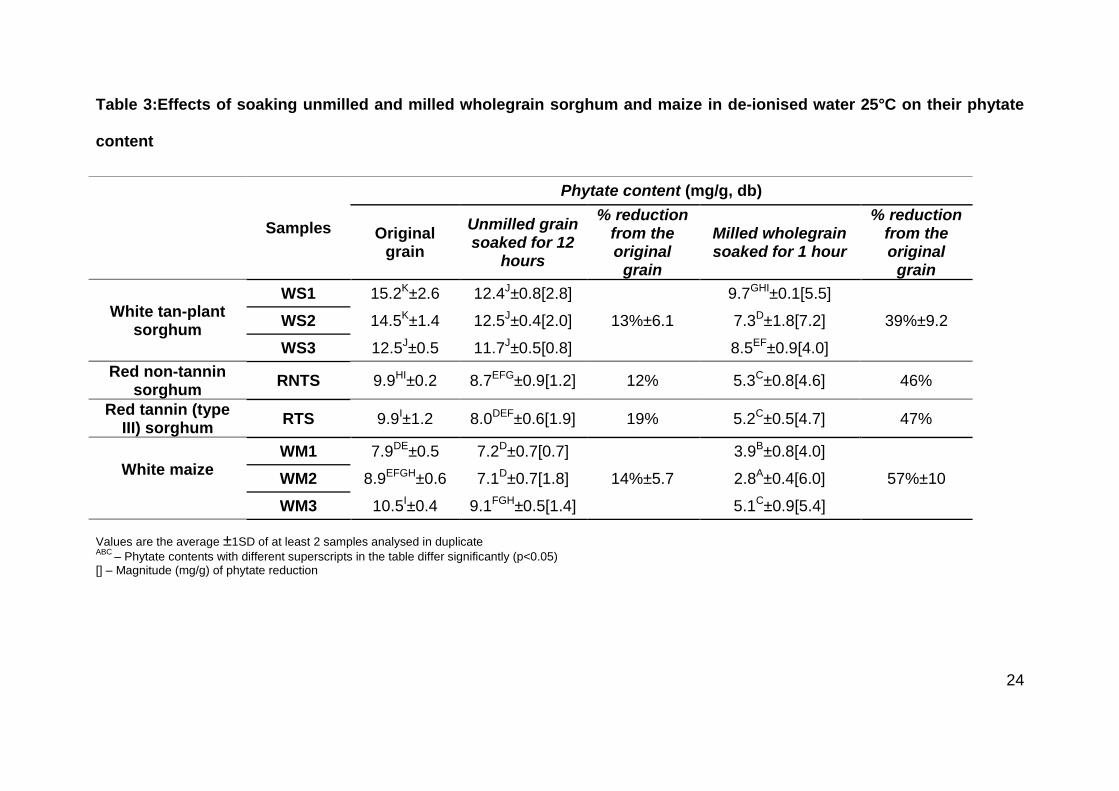
The phytate contents of the normal wholegrain sorghum and maize cultivars varied
between 7.9±0.5 and 15.2±2.6 mg/g (Table 3). The phytate contents of the WS
cultivars were higher than that of the other sorghum types and the WM cultivars.
However, the phytate contents of all the sorghum types were within the range
previously reported for normal sorghum (3-20 mg/g) (Oatway et al., 2001; Kruger et
al., 2012; Kruger et al., 2013), The phytate contents of the WM also fell within the
range previously reported for normal maize (7-14 mg/ g) (Hotz and Gibson, 2001;
Abebe et al., 2007). The phytate contents of the LPWS and LPTWS, while still within
the range reported for normal sorghum, were reduced by 48% and 53% compared to
their respective null controls.
There was only a small reduction in phytate contents when unmilled normal WS
(13%±6.1) and WM (14%±5.7) were soaked, and no difference in the percentage
reduction between WS and WM. The percentage phytate reductions in the RNTS
and RTS were somewhat lower (12%) and higher (19%), respectively, compared to
8
the WS and WM but not substantially different. Other authors who soaked unmilled
sorghum, used lower grain:liquid ratios and found lower percentage reductions (2-
3%) (Mahgoub and Elhag, 1998), while those who did not clean the grains found
similar to slightly higher percentage reductions (approx. 25%) (Kayodé et al., 2007)
(Table 1). When longer soaking duration and changing the soaking liquid was
employed, higher percentage reductions (23-32%) (Afify et al., 2011) were found.
In studies that compared the effect of soaking on the phytate content of unmilled
sorghum and maize grains, the findings contrasted somewhat with that of this
present work. Lestienne et al. (2005) found that soaking sorghum grain reduced its
phytate content by a much lower percentage (4%) compared to maize (21%).
However, no explanation for the difference was provided. There were significant
differences in the soaking conditions and method of phytate analysis compared to
the work reported here., Lestienne et al. (2005) cleaned the grains by soaking them
in 1% bleach and only the inositol hexaphosphate was measured, in contrast to the
phytate phosphorus in the current study. Egli et al. (2002) found that soaking did not
reduce the phytate contents of unmilled sorghum and maize grains. As the article of
Egli et al. (2002) focussed more on germination than soaking, the methodology was
not clear as to if the soaking liquid was removed and if so how it was done.
Soaking milled wholegrain reduced the phytate content substantially more than
soaking the unmilled grains. Also, the phytate reduction of WM (57%±10 reduction)
was proportionally more than that of WS (39%±9.2 reduction) (Table 3). The phytate
reduction of the RNTS (46% reduction) and RTS (47% reduction) was intermediate,
9
but still somewhat lower than the WM. Notably, the phytate present in the low
phytate mutants was not more soluble than that in their normal null controls.
The greater reductions in phytate content when soaking milled grain compared to
unmilled grain are presumably due to the fact that milling increased the surface area
of the grain exposed to the soaking liquid. Similar percentage reductions (57%)
(Hotz and Gibson, 2001) as found in the current study (57±10%) and lower
percentage reductions (50%) (Hotz et al., 2001; Hotz and Gibson, 2001) in phytate
were found when milled and pounded maize, respectively, were soaked in distilled
water. This suggests that even the degree of milling could also affect the phytate
solubilisation during soaking.
It appears that the differences in phytate reduction between milled sorghum and
maize (Table 3) were in fact related to the differences in their original phytate
contents. If the amount by which the phytate contents was reduced is considered,
the range of reductions (4.0 - 7.2 mg/g, values in square brackets) differed only by 3
mg/g between all the grains. However, the range of phytate contents of the milled
grains after soaking (2.8 - 9.7 mg/g) differed by 7 mg/g. It thus appears that under
the particular conditions of soaking (liquid volume, soaking pH, temperature and
time) only a certain quantity of phytate could be solubilised. This could have resulted
in the grains with higher phytate content having smaller percentage reductions in
phytate content, as observed. In fact, it has been found that factors such as higher
volume of soaking liquid, longer soaking times as well as more efficient removal of
the liquid increased the percentage phytate loss (Hotz and Gibson, 2001).
10
Due to the fact that the ratio of grain to soaking liquid (1:5) was already as high or
higher than the other studies (Table 1), the effect of soaking time on the phytate
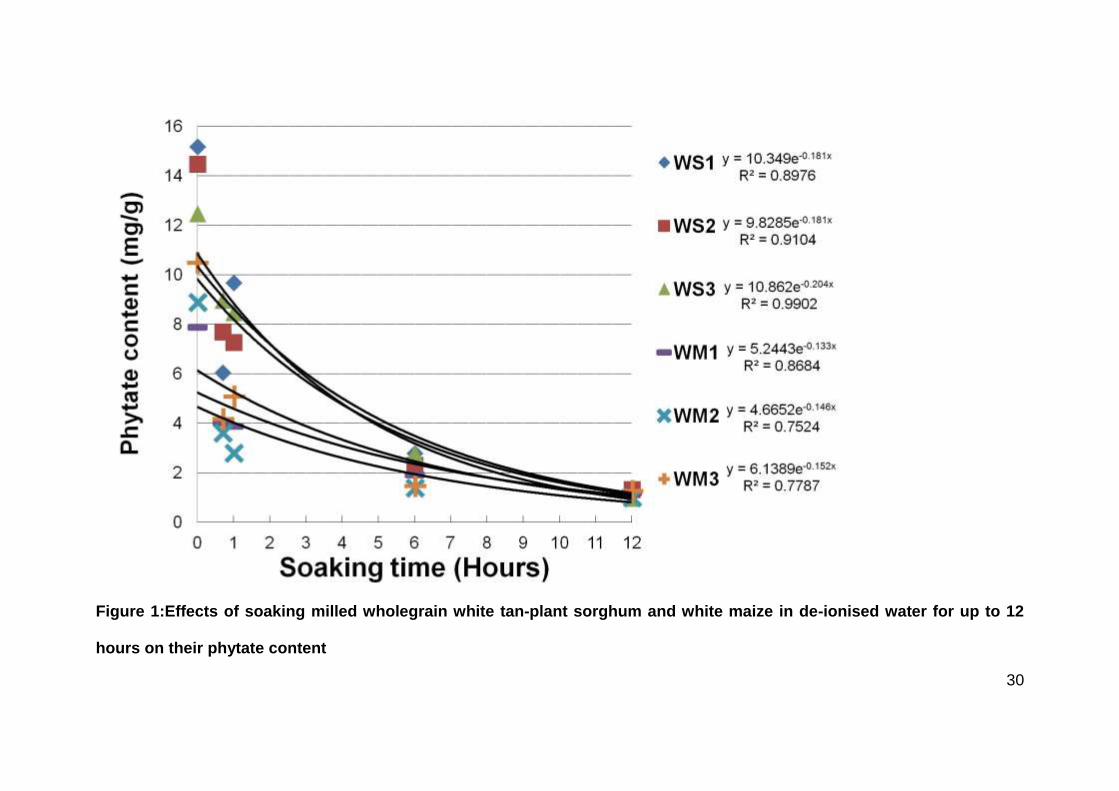
content of milled grain was then investigated (Figure 1). Further substantial
reductions in the phytate contents of sorghum and maize occurred (reduced to 1.4-
2.8 mg/100 g) with longer soaking (6 hours). Both cereals were almost completely
dephytinised after 12 hours of soaking. The effect of soaking duration on sorghum
and maize phytate contents followed exponential curves. The rate of decrease for
WS (0.181-0.204) was higher than WM (0.133-0.152), probably owing to the fact that
after 12 hours of soaking the phytate contents of both grains were extremely low
(1.0-1.4 mg/100 g). This is despite the original phytate contents of the sorghums
being substantially higher than the maize types (Table 3). It has similarly been found
that soaking rice flour for a prolonged period (6 hours) also resulted in the flour being
almost completely dephytinised (Perlas and Gibson, 1998).
A probable reason for the difference in effect of soaking on milled WS, WM and
RNTS and RTS phytate solubilisation was the slight differences in the pH of flours in
the de-ionised water. The pHs of the milled grains when they were soaked for 1
hour were as follows: WS pH 6.2-6.7, RNTS and RTS pH 6.2-6.3 and WM pH 5.9-
6.1. Phytate solubilisation is higher at low pH, where it more easily dissociates from
its complexes (Oatway et al., 2001).
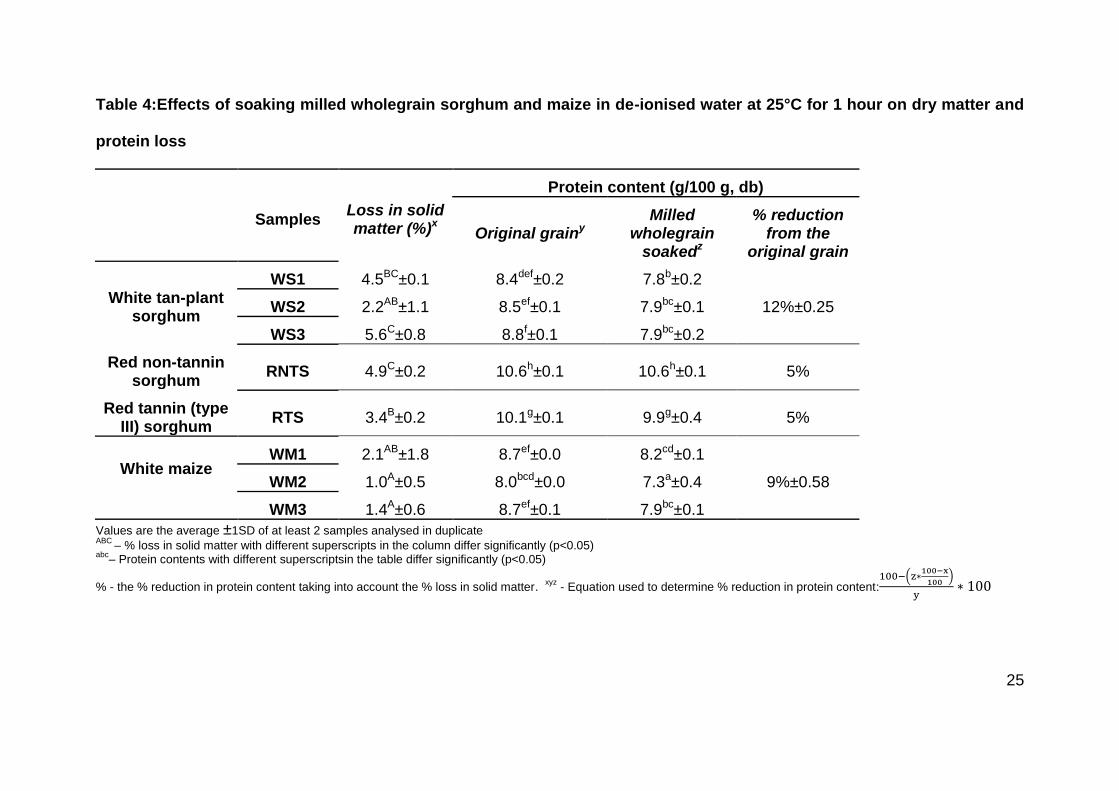
The solubilisation of phytate is strongly affected by the compounds which it is
associated with (De Boland et al., 1975). Protein can form insoluble complexes with
phytate (Feil, 2001), possibly resulting in lower phytate reduction during soaking.
Table 4 shows that soaking resulted in similar protein loss in the milled WS
11
(12%±0.25) and WM (9%±0.58) (taking into account loss in solid matter). It has
been found that during soaking, phytate did not bind with maize albumins and no
insoluble complexes were formed (O’Dell and De Boland, 1976). The authors
concluded that despite their presence in the maize protein, the lysine, arginine and
histidine (amino acids prone to binding phytate), were possibly not accessible to the
phytate and hence it did not bind. The authors found the same result when using
high lysine maize, strengthening their theory.
Regarding the lower phytate solubilisation of WS compared to WM (Table 3); if
phytate-protein complexation in sorghum had instead been higher compared to
maize, smaller losses in protein compared to the WM would have been expected.
This was found In the case of the RNTS and RTS where the loss in protein as a
result of soaking was substantially lower (5%), compared to the WS and WM (Table
4). This lower protein loss, however, is most likely due to the phenolic compounds
present in RTS and RNTS, which bind to proteins (Bravo, 1998), and not to the
phytate.
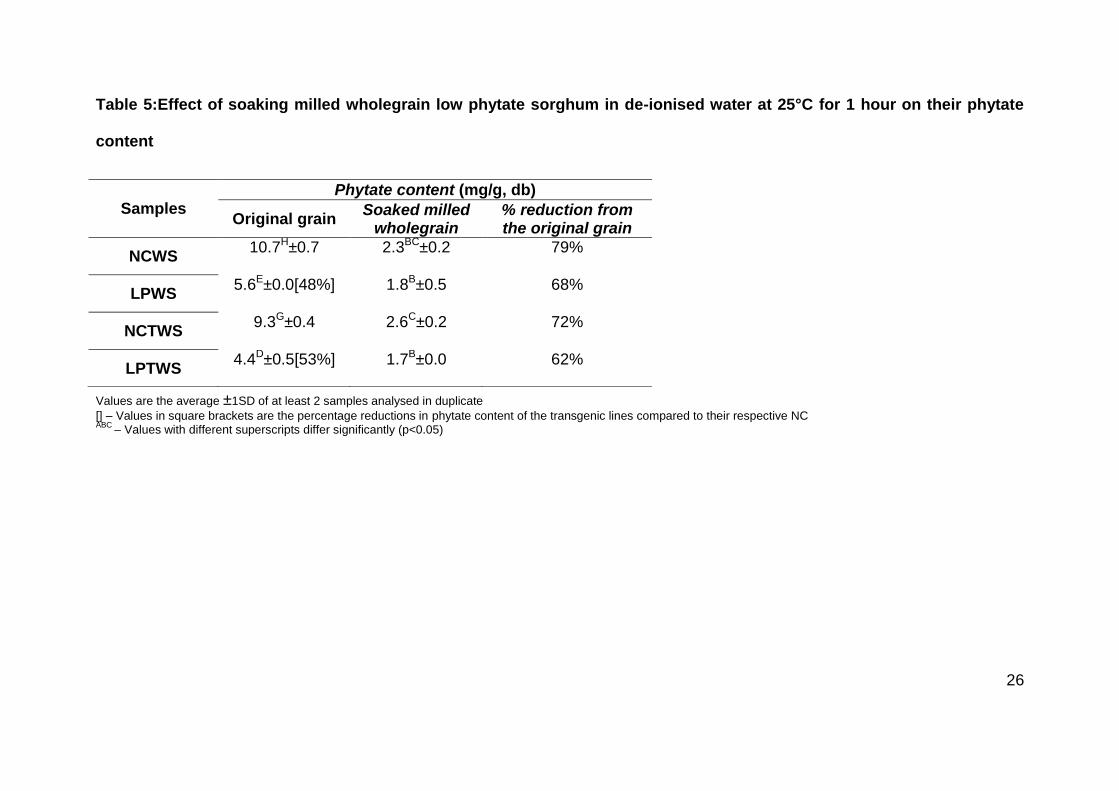
There was no substantial difference in phytate solubilisation between the milled low
phyate sorghum and their Null controls (Table 5). However, soaking milled low
phytate sorghum grains and their NCs resulted in greater percentage reductions in
phytate (62-79%) (Table 5) compared to the normal sorghum and maize grains (39-
57%) (Table 3). This could possibly be due to the fact that the transgenic sorghum
and its null controls were stored in a crushed form, in order to comply with
regulations governing the handling of GM plant material. During prolonged storage,
12
especially in a milled or crushed form, phytate has been found to degrade
(Schlemmer et al. 2009) to lower, more soluble inositol phosphates (Jackman and
Black, 1951).
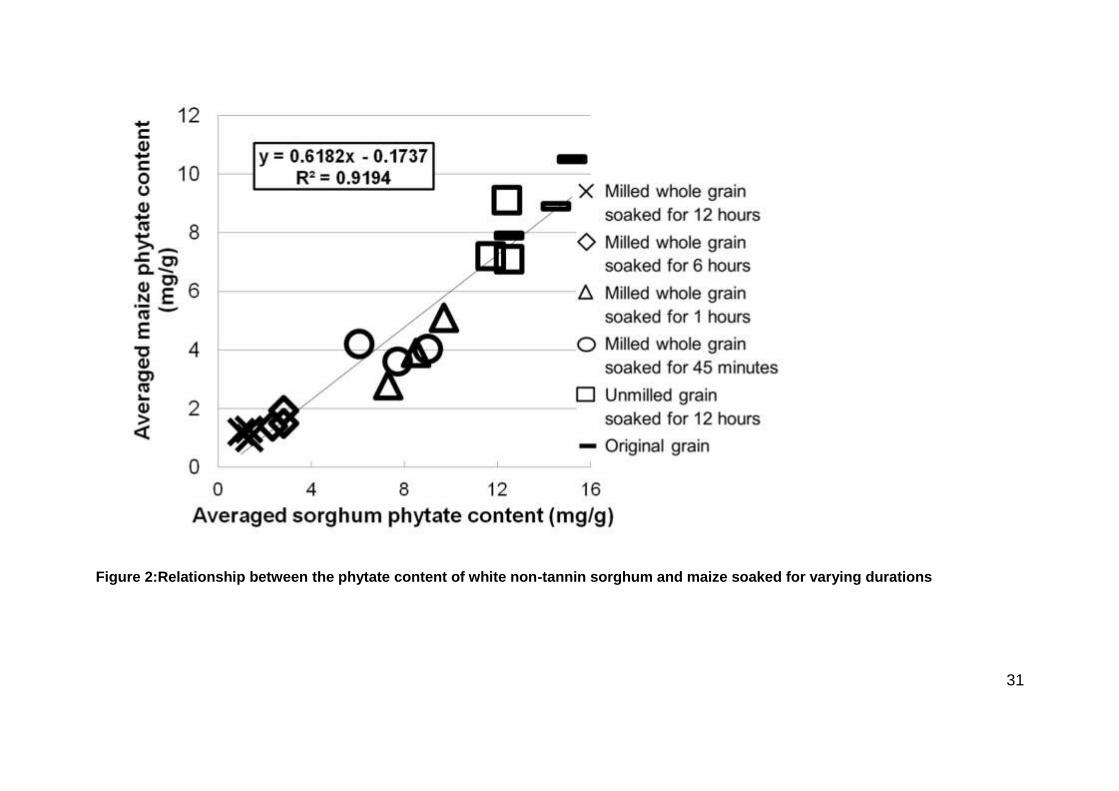
To analyse the relationship between the effects of all the various soaking treatments
on the phytate contents of the white sorghum and maize types, data from Table 3
and Figure 1 were combined and subjected to linear regression analysis (Figure 2).
There was an excellent linear relationship between sorghum and maize with a very
high correlation (r = 0.96) (p < 0.001). This clearly shows that there was no
substantial difference between the solubilisation of phytate in sorghum and maize.
Effect of aqueous soaking on the mineral contents and phytate:mineral molar
ratios
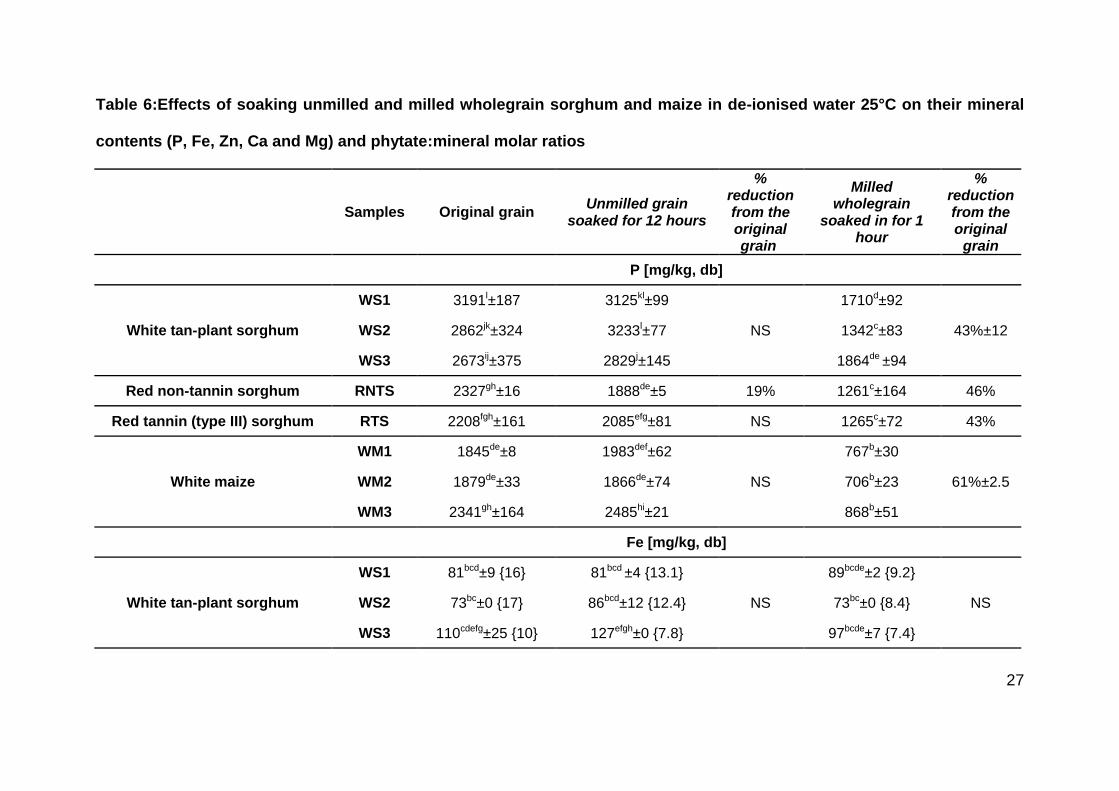
The mineral contents of the WS and WM grains (Table 6) were similar to previously
reported values for sorghum: P (FAO, 1995; Glew et al., 1997), Fe (FAO, 1995;
Matuschek ,t al., 2001), Zn (FAO, 1995), Ca (FAO, 1995; Kruger et al., 2013) and
Mg (FAO, 1995; Glew et al., 1997), and maize: P (FAO, 1992; Spencer et al., 2000),
Fe (FAO, 1992; Umeta et al., 2005), Zn (FAO 1992; Beiseigel et al., 2007; Mendoza
et al., 1998; Hotz et al., 2001), Ca (FAO, 1992; Mendoza et al., 2001; Hotz et al.,
2001) and Mg (FAO, 1992; Mendoza et al., 2001). However, the mineral contents of
the RTS and RNTS were higher than the reported ranges for sorghum. Related to
this, while soaking unmilled WS and WM for 12 hours did not result in significant (p >
0.05) reductions in their mineral contents (Table 6), 12 hours of soaking did reduce
the mineral contents of the RNTS and RTS substantially. These reductions and the
13
high original mineral contents of RNTS and RTS could be due to soil or dust
particulate contamination. This is despite the fact that the grains were rinsed. It has
been found that in some cases up to 70% of the iron in some food crops can be from
soil or dust particulate inclusion by the plant tissue during its growth (Cary et al.,
1994). Such iron could not be removed by washing with chelating agents, or with
dilute acids. It was apparently either tightly bound to the plant tissue or present as
inclusions in the tissue. The RTS and RNTS, could have contained contamination
minerals, which, with prolonged soaking of the unmilled grains, were solubilised.
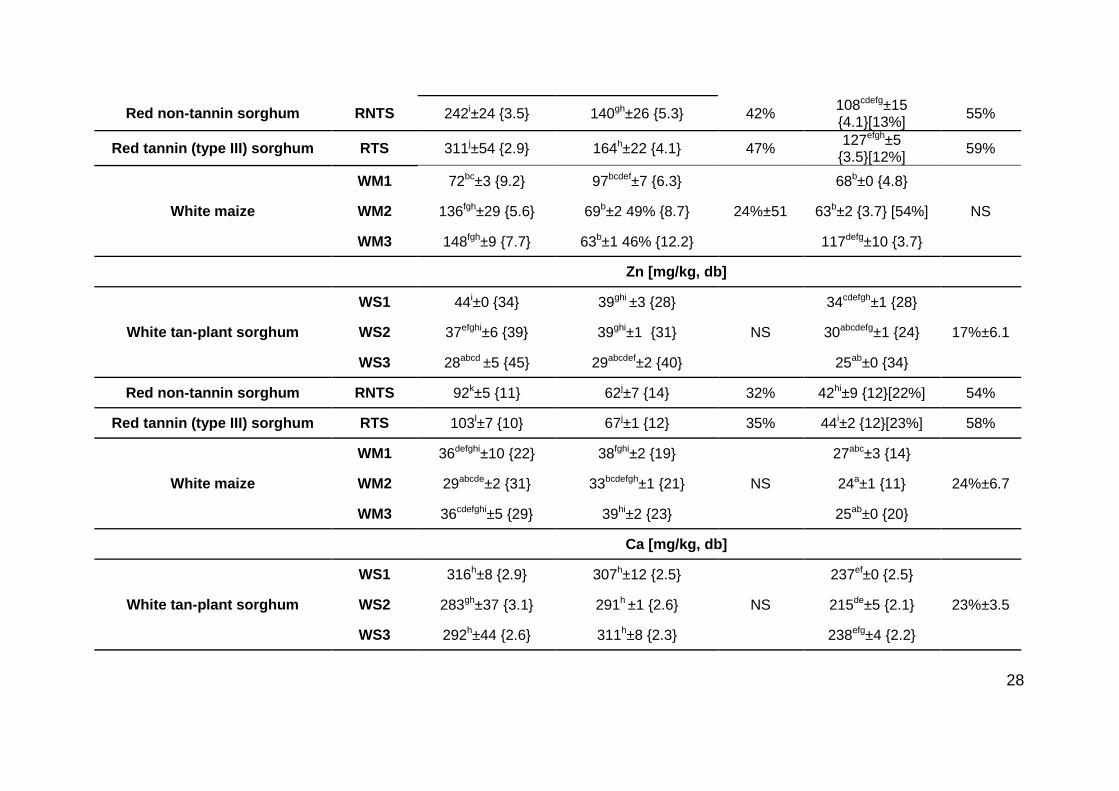
Soaking milled grains resulted in substantial reductions in all the measured minerals
except Fe (Table 6). Again, the percentage reduction in mineral contents of the RTS
and RNTS was substantially higher than that of the WM and WS. For this reason,
the quantity (mg/kg) of mineral solubilised during soaking of the unmilled grain was
subtracted from the quantity of the same mineral solubilised during soaking of the
milled grain. The resulting data were used to calculate the percentage reductions in
mineral contents of the milled RTS and RNTS (Table 6, square brackets), as
compared to the original grains. The reductions were similar to those of the WS and
WM. This supports the theory that contamination minerals in RTS and RNTS were
solubilised when the unmilled grains and milled grains were soaked.
Significantly, WM P contents were reduced more than those of the WS. This
corresponds to the greater percentage reduction in phytate content (Table 3). There
was no difference in the percentage reduction of Fe, Zn, and Ca between the WS
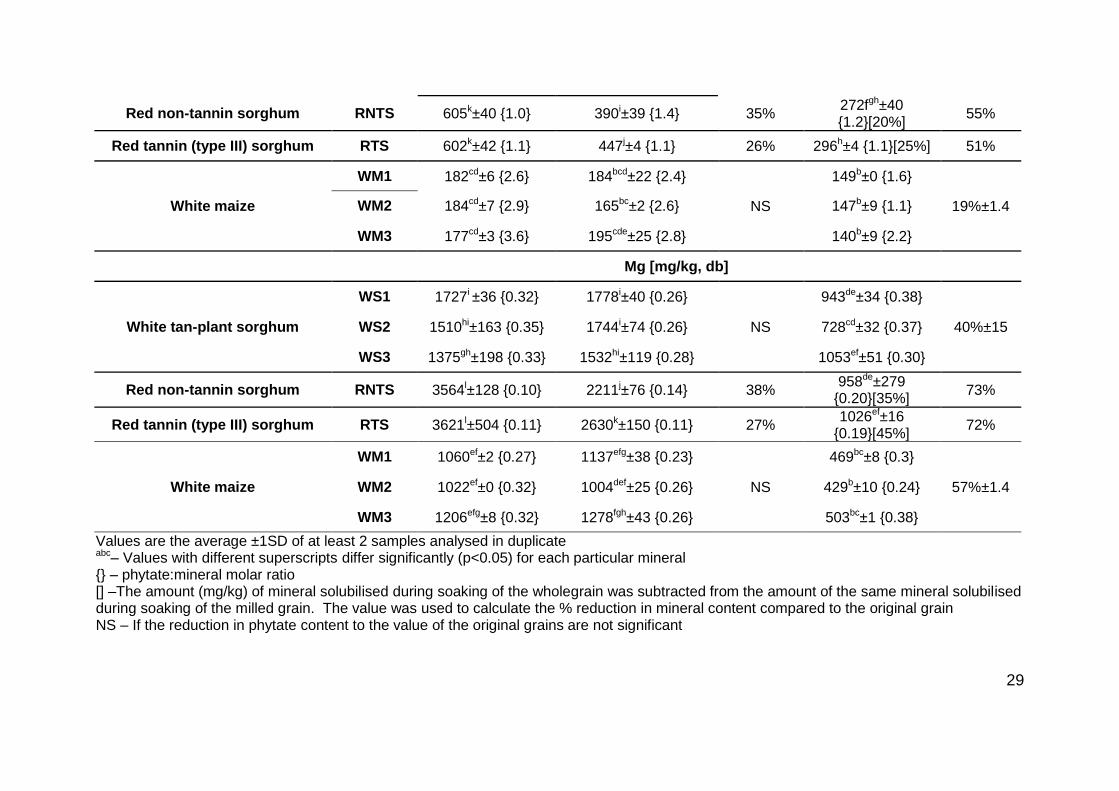
and WM. The percentage reduction in Mg of the WM was somewhat higher
14
compared to the WS. This is probably due to the fact that phytate-Mg complexes are
soluble in aqueous solutions (Hotz and Gibson, 2007). This suggests that the
greater reduction in phytate content of the WM compared to the WS (Table 3) was
due to solubilisation of phytate-Mg complexes. No literature could be found on the
effect of soaking cereals on their Mg content. Importantly, studies that soaked
sorghum and maize in mineral or tap water (Table 2), did not measure the mineral
contents of the water. Fe, Zn, Ca and Mg are found in drinking water in moderate
amounts in some supplies (WHO, 2005). Thus, studies conducted with tap water
cannot be compared to the current study where de-ionised water was used.
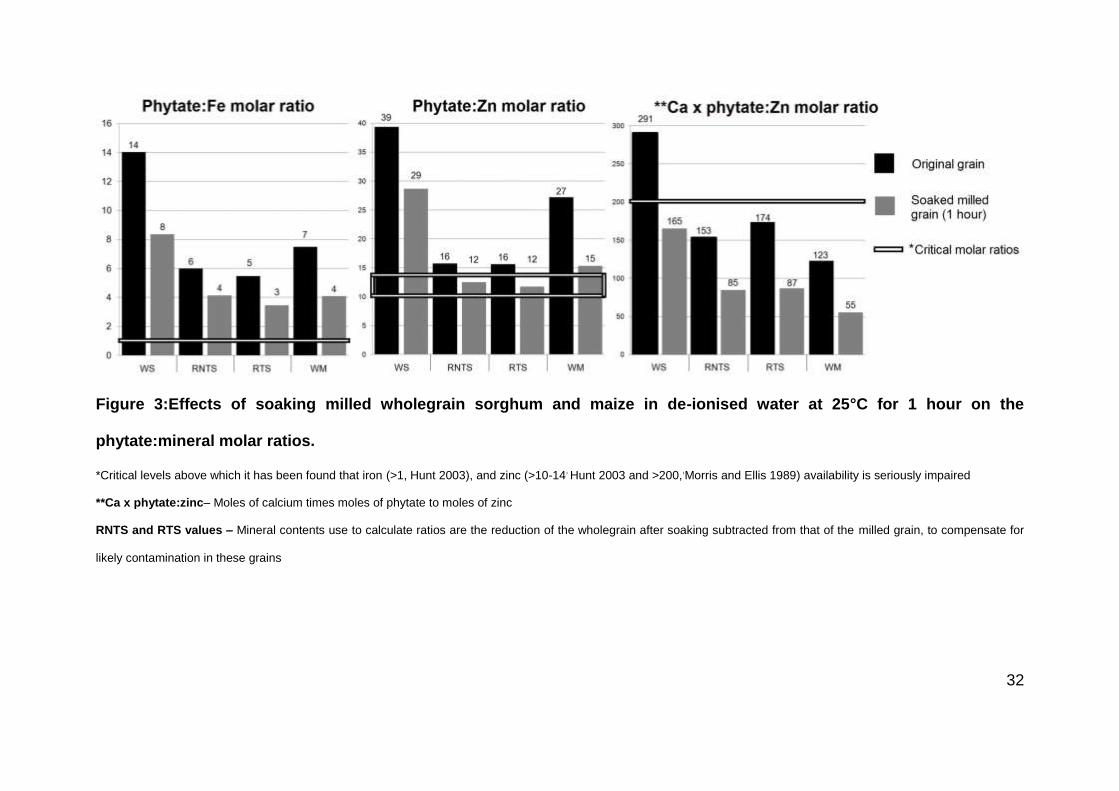
Soaking of milled grain, but not unmilled grain, resulted in reductions in
phytate:mineral ratios (Figure 3; Table 6). However, none of the phytate:Fe molar
ratios were reduced below the proposed critical level of 1 (Hunt, 2003), above which
it has been found that iron availability is seriously impaired. Some of the
phytate:zinc molar ratios were reduced to within the critical range >10-14 (Hunt,
2003) but none of the magnitudes of phytate:zinc ratio reduction were substantial.
The greater reductions in phytate:Fe ratio compared to phytate:Zn ratio was due to
the fact that a minimal amount of Fe was solubilised into the soaking liquid. The
phytate x Ca:Zn ratios of all the samples were substantially reduced. However none
of the original grains had phytate x Ca:Zn molar ratios above the critical level of 200
(Morris and Ellis, 1989), except that of WS. With soaking, the phytate x Ca:Zn molar
ratio of the WS was reduced from 291 to 165.
15
Regarding phytate reduction in tannin type sorghum to increase mineral availability;
the proposed phytate mineral ratios (Hunt, 2003) do not take into account the
inhibitory effect of tannins on mineral availability. Despite large reductions in phytate
content of high tannin sorghums (80%) (Kruger et al., 2012), (100%) (Hurrell et al.,
2003), it has been found iron availability did not improve, due to the inhibitory action
of the tannins.
Soaking of milled sorghum and maize reduced their phytate:mineral ratios because a
larger portion of phytate was solubilised into the soaking liquid compared to the
portion of minerals which were solubilised (Table 6). However, the loss in soluble
minerals from the grain could have a greater negative effect on mineral availability,
compared to the positive effect of phytate reduction. This is because mineral
bioavailability is measured in sequential series of events (stages), the first stage
being mineral solubilisation; when a mineral is released from the food matrix
(Fairweather-Tait et al., 2005). Each stage (solubilisation followed by
bioaccessibility, uptake, absorption, retention, utilization and storage) has to be
achieved for the next stage to be possible. Thus, reducing the quantity of soluble
minerals would most probably reduce the amount of bioaccessible minerals in the
grain and so forth in the following stages.
Also, an important difference when wholegrain flour is soaked at household level,
compared to this study, is that the soaking liquid would not be removed by
centrifugation. It has been found that more effective removal of soaking liquid results
in greater reductions in phytate content (Hotz and Gibson, 2001). It is highly unlikely
16
that any household method would remove the soaking liquid as effectively
centrifugation. Thus, it is probable that household methods might result in higher
loss of solids, decreasing the quantity of food in already food insecure households.
Conclusions
Despite some small differences in percentage reductions between studies, it is clear
that soaking unmilled sorghum and maize in distilled water does not decrease
phytate contents substantially and that there is no difference in phytate solubilisation
between the grains. Phytate solubilisation is substantial with milled sorghum and
maize. The greater solubilisation of phytate in milled maize is probably due to the
higher phytate content of sorghum and the slightly higher pH of the soaking liquid
and not to differences in phytate properties. Soaking milled sorghum and maize for
a prolong period (6-12 hours) practically completely dephytinises in both grains,
indicating that there is no substantial difference phytate solubilisation between them.
At the household level, the loss in soluble minerals which also occurs when milled
wholegrain is soaked, could have a greater negative effect on mineral availability to
the consumer, compared to the positive effect of the phytate reduction. Thus,while it
should still be validated in a human bioavailability trial, soaking does not seem to be
a viable household method to improve sorghum and maize mineral availability.
References
Abebe Y, Bogale A, Hambidge KM, Stoecker BJ, Bailey K, Gibson RS. (2007).
Phytate, zinc, iron and calcium content of selected raw and prepared foods
17
consumed in rural Sidama, Southern Ethiopia, and implications for bioavailability. J
Food Comp Anal 20:161–168.
Afify AEMMR, El-Beltagi HS, Abd El-Salam SM, Omran AA. (2011). Bioavailability of
iron, zinc, phytate and phytase activity during soaking and germination of white
sorghum varieties.
PLoS ONE 6:e25512. Available at:doi:10.1371/journal.pone.0025512. Accessed on
1 June 2013.
Beiseigel JM, Hunt JR, Glahn RP, Welch RM, Menkir A, Maziya-Dixon BB. (2007).
Iron bioavailability from maize and beans:a comparison of human measurements
with Caco-2 cell and algorithm predictions. Am J Clin Nutr 86:388-396.
Bravo L. (1998). Polyphenols: Chemistry, dietary sources, metabolism and nutritional
significance. Nutr Rev 56:317-333.
Cary EE, Grunes DL, Dallyn SL, Pearson A, Peck NH, Hulm RS. (1994). Plant Fe, Al
and Cr concentrations in vegetables as influenced by soil inclusion. J Food Qual
17:467-476.
De Boland AR, Garner GB, O’Dell BL. (1975). Identification and properties of
“phytate” in cereal grains and oilseed products. Food Chem 23:1186-1189.
Egli I, Davidsson L, Juillerat MA, Barclay D, Hurrell RF. (2002). The influence of
soaking and germination on the phytase activity and phytic acid content of grains
and seeds potentially useful for complementary feeding. J Food Sci 67:3484-3488.
Fairweather-Tait S, Lynch S, Hotz C, Hurrell R, Abrahamse A, Beebe S, Bering S,
Bukhave K, Glahn R, Hambridge M, Hunt J, Lonnerdal B, Meller D, Mohktar N,
Nestel P, Reddy M, Sandberg A, Sharp P, Teucher B, Trinidad TP. (2005). The
usefulness of in vitro models to predict the bioavailability of iron and zinc:A
consensus statement from the HarvestPlus expert consultation. Inter J Vit Nutr Res
75:371-374.
FAO. (2007a). Food supply. Available at:
http://faostat.fao.org/site/609/default.aspx#ancor Accessed on 1 March 2013.
FAO. (2007b). Production. Available at:
http://faostat.fao.org/site/567/default.aspx#ancor. Accessed on 1 March 2013.
Feil B. (2001). Phytic acid. J New Seed 3:1-35.
18
Food and Agriculture Organization (FAO). (1992). Maize in Human
Nutrition.http://www.fao.org/docrep/T0395E/T0395E03.htm. Accessed on 1 March,
2013.
Food and Agriculture Organization (FAO).(1995). Sorghum and millets in human
nutrition. http://www.fao.org/DOCREP/T0818e/T0818E0e.htm#Minerals. Accessed
on 1 March, 2013.
Frubeck G, Alonso R, Marzo F, Santidrian S. (1995). A modified method for the
indirect quantitative analysis of phytate in foodstuffs. Anal Biochem 225:206-212.
Glew RH, Van der Jagt DJ, Lockett C, Grivetti LE, Smith GC, Pastuszyn A, Milson M.
(1997). Amino acid, fatty acid and mineral composition of 24 indigenous plants of
Burkina Faso. J Food Comp Anal 10:205-217.
Hahn DH, Rooney LW, Earp CF. (1984). Tannins and phenols of sorghum. Cereal
Foods World 29:776-779.
Hotz C, Gibson RS, Temple L. (2001). A home-based method to reduce phytate
content and increase zinc bioavailability in maize-based complementary diets. Int J
Food Sci Nutr 52:133–142.
Hotz C, Gibson RS. (2001). Assessment of home-based processing methods to
reduce the phytate content and phytate/zinc molar ratio of white maize (Zea mays). J
Agric Food Chem 49:692-698.
Hotz C, Gibson RS. (2007). Traditional food-processing and preparation practices to
enhance the bioavailability of micronutrients in plant-based diets. J Nutr 137:097-
1100.
Hunt JR. (2003). Bioavailability of iron, zinc, and other trace minerals from
vegetarian diets. Am J Clin Nutr 78:633S-639S.
Hurrell RF. (2003). Influence of vegetable protein sources on trace element and
mineral bioavailability. J Nutr 133:2973S-2977S.
International Association for Cereal Science and Technology (ICC). (2012). Standard
Method 176:Estimation of Sorghum Grain Endosperm Texture. Vienna:ICC.
Jackman RH, Black CA. (1951). Solubility of iron, aluminum, calcium, and
magnesium inositol phosphates at different pH values. Soil Sci 72:179-186.
19
Kaluza WZ, McGrath RM, Robberts C, Schroeder HH. (1980). Separation of
phenolics of sorghum bicolor (L.) Moench grain. J Agric Food Chem 28:1191-1196.
Kayodé APP, Hounhouigan JD, Nout MJR. (2007). Impact of brewing process
operations on phytate, phenolic compounds and in vitro solubility of iron and zinc in
opaque sorghum beer. Food Sci Tech 40:834-841.
Kruger J, Taylor JRN, Oelofse A. (2012). Effects of reducing phytate content in
sorghum through genetic modification and fermentation on in vitro iron availability in
wholegrain porridges. Food Chem 131:220-224.
Kruger J, Taylor JRN, Du X, De Moura F.F, Lönnerdal B, Oelofse A. (2013). Effect of
phytate reduction of sorghum, through genetic modification, on iron and zinc
availability as assessed by an in vitro dialysability bioaccessibility assay, Caco-2 cell
uptake assay, and suckling rat pup absorption model. Food Chem. 141:1019-1025.
Lehrfeld J. (1994). HPLC separation and quantitation of phytic acid and some inositol
phosphates in foods:problems and solutions. J Agric Food Chem 42:2726-2731.
Lestienne I, Icard-Vernière C, Mouquet C, Picq C, Treche S. (2005). Effects of
soaking whole cereal and legume seeds on iron, zinc and phytate contents. Food
Chem 89:421-425.
Mahgoub SEO, Elhag SA. (1998). Effect of milling, soaking, malting, heat-treatment
and fermentation of phytate level of four Sudanese sorghum cultivars. Food Chem
61:77-80.
Matuschek E, Towo E, Svanberg U. (2001). Oxidation of polyphenols in phytate-
reduced high-tannin cereals:effect on different phenolic groups and on in vitro
accessible iron. J Agric Food Chem 49:5630-5638.
Mendoza C, Viteri FE, Lönnerdal B, Raboy V, Young KA, Brown KH. (2001).
Absorption of iron from unmodified maize and genetically altered, low-phytate maize
fortified with ferrous sulfate or sodium iron EDTA. Am J Clin Nutr 73:80-85.
Mendoza C, Viteri FE, Lönnerdal B, Young KA, Raboy V, Brown KH.(1998). Effect of
genetically modified, low-phytic acid maize on absorption of iron from tortillas. Am J
Clin Nutr 68:1123-1127.
Mendoza C. (2002).Effect of genetically modified low phytic acid plants on mineral
absorption.Int J Food Sci Tech 37:759–767.
20
Morris ER, Ellis R. (1989). Usefulness of the dietary phytic acid/zinc molar ratio as
an index of zinc bioavailability to rats and humans. Biol Trace Elem Res 19:107-117.
O’Dell BL, de Bowland AR, Koirtyohann SR. (1972). Distribution of phytate and
nutritionally important elements among the morphological components of cereal
grains. J Agric Food Chem 20:718-721.
Oatway L, Vasanthan T, Helm J.H. (2001). Phytic acid. Food Rev Int 17:419-431.
O'Dell BL, De Boland A. (1976). Complexation of phytate with proteins and cations in
corn germ and oil seed meals. J Agric Food Chem 24:804-808.
Perlas LA, Gibson RS.(2002). Use of soaking to enhance the bioavailability of iron
and zinc from rice‐based complementary foods used in the Philippines. J Sci Food
Agric 82:1115-1121.
Price ML, Van Scoyoc S, Butler LG. (1978). A critical evaluation of the vanillin
reaction as an assay for tannin in sorghum grain. J Agric Food Chem 26:1214-1218.
Rooney LW, Waniska RD. (2000).Food and industrial utilization. In:Smith CW,
Frederiksen R.A, eds. Sorghum, Origin, History, Technology and Production. New
York:John Wiley and Sons, 689-729.
Schlemmer U, Frølich W, Prieto RM, Grases F. (2009). Phytate in foods and
significance for humans:food sources, intake, processing, bioavailability, protective
role and analysis. Mol Nutr Food Res 53:S330-S375.
Spencer JD, Allee GL, Sauber TE. (2000). Phosphorus bioavailability and
digestibility of normal and genetically modified low-phytate corn for pigs. J Anim Sci
78:675-681.
Temple L, Gibson RS, Hotz C. (2002).Use of soaking and enrichment for improving
the content and bioavailability of calcium, iron and zinc in complementary foods and
diets of rural Malawian weanlings. J Food Sci 67:1926-1932.
Tulchinsky TH. (2010). Micronutrient deficiency conditions:Global health issues.
Public Health Rev 32:243-255.
Umeta M, West C.E, Fufa H. (2005). Content of zinc, iron, calcium and their
absorption inhibitors in foods commonly consumed in Ethiopia. J Food Comp Anal
18:803–817.
21
World Health Organization (WHO). (2005). Nutrient in drinking water. Geneva,
Switzerland:WHO.
World Health Organization (WHO). (2007). Global database on anaemia. Geneva,
Switzerland:WHO.
Acknowledgements
University of Pretoria post-doctoral fellowship for J Kruger. UIS Analytical services
(Centurion, South Africa) for the ICP-OES analysis
Declaration of Interest
There are no financial, consulting or personal relationships with other people of
organisations that could influence the authors’ work.
22
Table 1:Summary of published research on the effect of soaking on the phytate content, iron and zinc contents and
availabilities of unmilled grain and milled sorghum and maize
Reference Grain characterisation Grain form Parameters
measured Soaking conditions
Mahgoub and Elhag 1998
Four sorghums:Dabar, Feterita Gadarif, Feterita, Gazira, Hageen, from a local
market in Sudan
Milled wholegrain Phytate
Visually cleaned, soaked in tap water (1:4 w/w) for 12 and 24 hours
Hotz and Gibson 2001
Maize imported from Malawi and stored under refrigeration
Milled and traditionally pounded
Phytate, Zn Soaked in tap water (1:4 w/w) for 1
hour up to 24 hours
Hotz et al. 2001 Maize Traditionally pounded
wholegrain Phytate, Fe,
Zn Soaked in tap water (1:4, w/w) for 1
hour
Egli et al. 2002 Sorghum, maize, commercially purchased
between 1997 and 1998 Unmilled wholegrain
Phytate Soaked in distilled water (1:5 w/w) for
16 hour
Temple et al. 2002
Maize imported from Malawi and stored under refrigeration for 24 months
Milled wholegrain Phytate
Soaked in tap water (1:4 w/w) for 1 hour up to 24 hours
Lestienne et al. 2005
Sorghum and maize, purchased in Burkina Faso and France, respectively
Unmilled wholegrain Phytate
Soaked in 1% bleach in water (1:3 w/w) for 15 min then in mineral water
(1:3 w/w) for 24 hours
Kayodé et al. 2007
Three red sorghums, from a local market in Parakou, Benin
Milled wholegrain Phytate, Fe,
Zn
Soaked overnight (±12 hours), no indication if tap/distilled water was
used
Afify et al. 2011 Three white sorghums, harvested 2007, obtained from the CASC, Giza, Egypt
Milled wholegrain Phytate, Fe,
Zn
Visually cleaned, soaked in distilled water which was changed twice (1:5
w/w) for 20 hours
23
Table 2:Chemical (tannin and total phenol content) and physical (1000 kernel weight and endosperm texture) properties of
sorghum and maize grains
Grain type cultivar Thousand
kernel weight (g)
Grain endosperm texture (relative %)
Tannin Content (CE g/100 g) db
Total phenol content (CE g/100 g) db Corneous Intermediate Floury
Sorghum
White tan-plant
Orbit, NK8828, Macia
26 (5) 5-55 40-42 3-55 0.30 (0.1) 0.15 (0.0)
Red non-tannin
MR Buster 29 78 20 3 0.35 (0.1) 0.32 (0.1)
Red tannin (type III)
PAN 3860 26 5 33 63 7.44 (0.2) 1.33 (0.3)
Maize White PAN 6Q - 521 R, PAN 5Q - 433 B,
CA 9001 333 (3) 0 10-20 80-90 0.38 (0.0) 0.21 (0.1)
24
Table 3:Effects of soaking unmilled and milled wholegrain sorghum and maize in de-ionised water 25°C on their phytate
content
Values are the average ±1SD of at least 2 samples analysed in duplicate ABC
– Phytate contents with different superscripts in the table differ significantly (p<0.05) [] – Magnitude (mg/g) of phytate reduction
Samples
Phytate content (mg/g, db)
Original grain
Unmilled grain soaked for 12
hours
% reduction from the original
grain
Milled wholegrain soaked for 1 hour
% reduction from the original
grain
White tan-plant sorghum
WS1 15.2K±2.6 12.4J±0.8[2.8]
13%±6.1
9.7GHI±0.1[5.5]
39%±9.2 WS2 14.5K±1.4 12.5J±0.4[2.0] 7.3D±1.8[7.2]
WS3 12.5J±0.5 11.7J±0.5[0.8] 8.5EF±0.9[4.0]
Red non-tannin sorghum
RNTS 9.9HI±0.2 8.7EFG±0.9[1.2] 12% 5.3C±0.8[4.6] 46%
Red tannin (type III) sorghum
RTS 9.9I±1.2 8.0DEF±0.6[1.9] 19% 5.2C±0.5[4.7] 47%
White maize
WM1 7.9DE±0.5 7.2D±0.7[0.7]
14%±5.7
3.9B±0.8[4.0]
57%±10 WM2 8.9EFGH±0.6 7.1D±0.7[1.8] 2.8A±0.4[6.0]
WM3 10.5I±0.4 9.1FGH±0.5[1.4] 5.1C±0.9[5.4]
25
Table 4:Effects of soaking milled wholegrain sorghum and maize in de-ionised water at 25°C for 1 hour on dry matter and
protein loss
Samples Loss in solid matter (%)x
Protein content (g/100 g, db)
Original grainy Milled
wholegrain soakedz
% reduction from the
original grain
White tan-plant sorghum
WS1 4.5BC±0.1 8.4def±0.2 7.8b±0.2
12%±0.25 WS2 2.2AB±1.1 8.5ef±0.1 7.9bc±0.1
WS3 5.6C±0.8 8.8f±0.1 7.9bc±0.2
Red non-tannin sorghum
RNTS 4.9C±0.2 10.6h±0.1 10.6h±0.1 5%
Red tannin (type III) sorghum
RTS 3.4B±0.2 10.1g±0.1 9.9g±0.4 5%
White maize
WM1 2.1AB±1.8 8.7ef±0.0 8.2cd±0.1
9%±0.58 WM2 1.0A±0.5 8.0bcd±0.0 7.3a±0.4
WM3 1.4A±0.6 8.7ef±0.1 7.9bc±0.1
Values are the average ±1SD of at least 2 samples analysed in duplicate ABC
– % loss in solid matter with different superscripts in the column differ significantly (p<0.05) abc
– Protein contents with different superscriptsin the table differ significantly (p<0.05)
% - the % reduction in protein content taking into account the % loss in solid matter. xyz
- Equation used to determine % reduction in protein content: (
)
26
Table 5:Effect of soaking milled wholegrain low phytate sorghum in de-ionised water at 25°C for 1 hour on their phytate
content
Values are the average ±1SD of at least 2 samples analysed in duplicate
[] – Values in square brackets are the percentage reductions in phytate content of the transgenic lines compared to their respective NC ABC
– Values with different superscripts differ significantly (p<0.05)
Samples Phytate content (mg/g, db)
Original grain Soaked milled
wholegrain % reduction from the original grain
NCWS 10.7H±0.7 2.3BC±0.2 79%
LPWS 5.6E±0.0[48%] 1.8B±0.5 68%
NCTWS 9.3G±0.4 2.6C±0.2 72%
LPTWS 4.4D±0.5[53%] 1.7B±0.0 62%
27
Table 6:Effects of soaking unmilled and milled wholegrain sorghum and maize in de-ionised water 25°C on their mineral
contents (P, Fe, Zn, Ca and Mg) and phytate:mineral molar ratios
Samples Original grain Unmilled grain
soaked for 12 hours
% reduction from the original grain
Milled wholegrain
soaked in for 1 hour
% reduction from the original
grain
P [mg/kg, db]
White tan-plant sorghum
WS1 3191l±187 3125kl±99
NS
1710d±92
43%±12 WS2 2862jk±324 3233l±77 1342c±83
WS3 2673ij±375 2829j±145 1864de ±94
Red non-tannin sorghum RNTS 2327gh±16 1888de±5 19% 1261c±164 46%
Red tannin (type III) sorghum RTS 2208fgh±161 2085efg±81 NS 1265c±72 43%
White maize
WM1 1845de±8 1983def±62
NS
767b±30
61%±2.5 WM2 1879de±33 1866de±74 706b±23
WM3 2341gh±164 2485hi±21 868b±51
Fe [mg/kg, db]
White tan-plant sorghum
WS1 81bcd±9 {16} 81bcd ±4 {13.1}
NS
89bcde±2 {9.2}
NS WS2 73bc±0 {17} 86bcd±12 {12.4} 73bc±0 {8.4}
WS3 110cdefg±25 {10} 127efgh±0 {7.8} 97bcde±7 {7.4}
28
Red non-tannin sorghum RNTS 242i±24 {3.5} 140gh±26 {5.3} 42% 108cdefg±15 {4.1}[13%]
55%
Red tannin (type III) sorghum RTS 311j±54 {2.9} 164h±22 {4.1} 47% 127efgh±5
{3.5}[12%] 59%
White maize
WM1 72bc±3 {9.2} 97bcdef±7 {6.3}
24%±51
68b±0 {4.8}
NS WM2 136fgh±29 {5.6} 69b±2 49% {8.7} 63b±2 {3.7} [54%]
WM3 148fgh±9 {7.7} 63b±1 46% {12.2} 117defg±10 {3.7}
Zn [mg/kg, db]
White tan-plant sorghum
WS1 44i±0 {34} 39ghi ±3 {28}
NS
34cdefgh±1 {28}
17%±6.1 WS2 37efghi±6 {39} 39ghi±1 {31} 30abcdefg±1 {24}
WS3 28abcd ±5 {45} 29abcdef±2 {40} 25ab±0 {34}
Red non-tannin sorghum RNTS 92k±5 {11} 62j±7 {14} 32% 42hi±9 {12}[22%] 54%
Red tannin (type III) sorghum RTS 103l±7 {10} 67j±1 {12} 35% 44i±2 {12}[23%] 58%
White maize
WM1 36defghi±10 {22} 38fghi±2 {19}
NS
27abc±3 {14}
24%±6.7 WM2 29abcde±2 {31} 33bcdefgh±1 {21} 24a±1 {11}
WM3 36cdefghi±5 {29} 39hi±2 {23} 25ab±0 {20}
Ca [mg/kg, db]
WS1 316h±8 {2.9} 307h±12 {2.5}
NS
237ef±0 {2.5}
23%±3.5 White tan-plant sorghum WS2 283gh±37 {3.1} 291h ±1 {2.6} 215de±5 {2.1}
WS3 292h±44 {2.6} 311h±8 {2.3} 238efg±4 {2.2}
29
Red non-tannin sorghum RNTS 605k±40 {1.0} 390i±39 {1.4} 35% 272fgh±40 {1.2}[20%]
55%
Red tannin (type III) sorghum RTS 602k±42 {1.1} 447j±4 {1.1} 26% 296h±4 {1.1}[25%] 51%
White maize
WM1 182cd±6 {2.6} 184bcd±22 {2.4}
NS
149b±0 {1.6}
19%±1.4 WM2 184cd±7 {2.9} 165bc±2 {2.6} 147b±9 {1.1}
WM3 177cd±3 {3.6} 195cde±25 {2.8} 140b±9 {2.2}
Mg [mg/kg, db]
White tan-plant sorghum
WS1 1727i ±36 {0.32} 1778i±40 {0.26}
NS
943de±34 {0.38}
40%±15 WS2 1510hi±163 {0.35} 1744i±74 {0.26} 728cd±32 {0.37}
WS3 1375gh±198 {0.33} 1532hi±119 {0.28} 1053ef±51 {0.30}
Red non-tannin sorghum RNTS 3564l±128 {0.10} 2211j±76 {0.14} 38% 958de±279
{0.20}[35%] 73%
Red tannin (type III) sorghum RTS 3621l±504 {0.11} 2630k±150 {0.11} 27% 1026ef±16
{0.19}[45%] 72%
White maize
WM1 1060ef±2 {0.27} 1137efg±38 {0.23}
NS
469bc±8 {0.3}
57%±1.4 WM2 1022ef±0 {0.32} 1004def±25 {0.26} 429b±10 {0.24}
WM3 1206efg±8 {0.32} 1278fgh±43 {0.26} 503bc±1 {0.38}
Values are the average ±1SD of at least 2 samples analysed in duplicate abc– Values with different superscripts differ significantly (p<0.05) for each particular mineral {} – phytate:mineral molar ratio [] –The amount (mg/kg) of mineral solubilised during soaking of the wholegrain was subtracted from the amount of the same mineral solubilised during soaking of the milled grain. The value was used to calculate the % reduction in mineral content compared to the original grain NS – If the reduction in phytate content to the value of the original grains are not significant
30
Figure 1:Effects of soaking milled wholegrain white tan-plant sorghum and white maize in de-ionised water for up to 12
hours on their phytate content
31
Figure 2:Relationship between the phytate content of white non-tannin sorghum and maize soaked for varying durations
32
Figure 3:Effects of soaking milled wholegrain sorghum and maize in de-ionised water at 25°C for 1 hour on the
phytate:mineral molar ratios.
*Critical levels above which it has been found that iron (>1, Hunt 2003), and zinc (>10-14, Hunt 2003 and >200,
,Morris and Ellis 1989) availability is seriously impaired
**Ca x phytate:zinc– Moles of calcium times moles of phytate to moles of zinc
RNTS and RTS values – Mineral contents use to calculate ratios are the reduction of the wholegrain after soaking subtracted from that of the milled grain, to compensate for
likely contamination in these grains