Embed Size (px)
Citation preview
REPORT NO.
UCB/EERC-83/19
AUGUST 1983
PB84-1S2G20
EARTHQUAKE ENGINEERING RESEARCH CENTER
EFFECTS OF BOND DETERIORATIONON HYSTERETIC BEHAVIOROF REINFORCED CONCRETE JOINTS
by
F.e. FlliPPOU
E.P. POPOV
V.V. BERTERO
Report to the National Science Foundation
COLLEGE OF ENGINEERING
UNIVERSITY OF CALIFORNIA • Berkeley, California
REPRODUCED BY
NATIONAL TECHNICALINFORMAliON SERVICE
u. S. DEPARTMENT OF COMMERCESPRINGFIELD. VA. 22161
For sale by the National Technicallnformation Service, U.S. Departmentof Commerce,Springfield, Virginia 22161.
See back of report for up to date listing ofEERC reports.
DISCLAIMERAny opinions, findings, and conclusions orrecommendations expressed in this publication are those of the authors and do notnecessari Iy reflect the views of the NationalScience Foundation or the Earthquake Engineering Research Center, University ofCalifornia, Berkeley
REPORT DOCUMENTATION 11. REPORT NO.
PAGE NSF/CEE-83032 12. 3. Recipient's Aceeuion No.
Pas 4 1 920204. Title and Subtitle
Effects of Bond Deterioration on Hysteretic Behavior ofReinforced Concrete Joints
7. Author(s)
F.C. Filippou, E.P. POPOV, and V.V. Bertero9. Performln. Orsanization Name and Address
Earthquake Engineering Research CenterUni:versity of California1301 South 46th StreetRichmond, CA 94804
12. Sponsoring Orsanlzation Name and Address
National. Science Foundation1800 IIG II Street, NW·Washington, DC 20550
15. Supplementary Notes
5. Report Date
August 1983
8. Performln. Orsanlzatlon Rept. No.
UCB/EERC-83/1910. Projec:t/Task/Work Unit No.
11. Contract(C) or Grant(G) No.
(C)
(G) CEE81-07217
13. Type of Report & Period Covered
14.
16. Abstract (Umlt: 200 ""'rds)
The work presehted in this report is concerned with developing an analyticalmodel which describes the hysteretic behavior of reinforced ·concrete beam-col umnjoints. The model takes into account the interaction of reinforcing steel andsurrounding concrete through bond and the deteri6ration of such interaction undercyclic deformation reversals. The cyclic deterioration of bond results in relativesl i ppage of reinforcing bars with respect to concrete thusgiviD9 rise to significantconcentrated rotations at the beam-column interface. The model is presented forinterior joints, Hs extension ;to exterior joints and girder inelastic regions isindicated.
17. Ooc:ument Analysis •• Descriptors
b. Identifiers/Open-Ended Terms
Co COSATI Field/Group
18. Availability Stat.......~
Rel ease Un1i.mtted
~ ANSl-239.18)
19. Security Cia" (ThIs Report)
20. Security Class (ThIs Pa.e)
21. No. of Pases205
22. Price
OPTIONAL FORM 212 (4-7n(Formerly NTl5-35)Department of Comme~e

EFFECTS OF BOND DETERIORATION ON HYSTERETIC BEHAVIOR
OF REINFORCED CONCRETE JOINTS
by
Filip C. Filippou
Assistant Professor of Civil EngineeringUniversity of California, Berkeley
Egor P. Popov
Professor of Civil EngineeringUniversity of California, Berkeley
Vitelmo V. Bertero
Professor of Civil EngineeringUniversity of California, Berkeley
A report on research sponsored by theNational Science Foundation
Report No. UCB/EERC-83/19Earthquake Engineering Research Center
College of EngineeringUniversity of California
Berkeley, California
August 1983


EFFECTS OF BOND DETERIORATION ON HYSTERETIC BEHAVIOROF REINFORCED CONCRETE JOINTS
ABSTRACT
The work presented in this report is concerned with developing an analytical model which
describes the hysteretic behavior of reinforced concrete beam-column joints. The model takes
into account the interaction of reinforcing steel and surrounding concrete through bond and the
deterioration of such interaction under cyclic deformation reversals. The cyclic deterioration of
bond results in relative slippage of reinforcing bars with respect to concrete thus giving rise to
significant concentrated rotations at the beam-column interface. The model is presented for
interior joints; its extension to exterior joints and girder inelastic regions is indicated.
In Chapter 2, following the introductory material presented in Chapter 1, the analytical
description of the interaction of reinforcing steel and surrounding concrete along the anchorage
length of the bars is given. The relative slip of reinforcing bars with respect to the surrounding
concrete results in the formation of large cracks which run perpendicular to the axis of the
girder. In order to provide the necessary number of equations describing the hysteretic
moment-rotation relation of a RIC member, the equilibrium of horizontal forces and bending
moments has to be satisfied at the cracked reinforced concrete sections. This necessitates the
development of a new cracked RIC section model which accounts for the effects of bond
deterioration in the vicinity of the crack in establishing the equilibrium of steel and concrete
forces at a cracked section. This model is presented in Chapter 3 along with material models
describing the stress-strain relation of reinforcing steel as well as the bond stress-slip behavior
under arbitrary cyclic excitations.
Details on the numerical solution algorithm are presented in Chapter 4. The algorithm
consists of three nested iteration loops, which arise when the boundary value problem of
Chapter 2 is solved using transfer matrices and a numerical "shooting technique".
Comparison of analytical predictions with experimental evidence from two interior beam
column subassemblages is preseI1ted in Chapter 5. Satisfactory agreement is exhibited by the
proposed model. The reported results allow insight into the physical behavior of RIC beam
column joints which can lead to improvements in the earthquake resistant design of moment
resisting frames.
In Chapter 6 a series of analytical parametric studies on an interior beam-column joint are
reported. Parameters varied include: bond strength along anchorage length in the joint, ratio of
top to bottom reinforcement, yield strength of reinforcing bars, history of loading and effects of
model scale of RIC members.
ACKNOWLEDGEMENTS
The studies reported herein were conducted as part of the research supported by the
National Science Foundation under Grant No. CEE 81-07217. The work described was carried
out by Filip C. Filippou in partial fulfillment of the requirements for the degree of Doctor of
Philosophy in Engineering and was supervised by Professors E. P. Popov and V. V. Bertero.
This report essentially reproduces the first part of the dissertation.
The authors are indebted to Professors Robert L. Taylor and Beresford N. Parlett for their
valuable comments in reviewing the dissertation.
The authors also express their gratitude to Dr. Rolf Eligehausen and Professor Vincenzo
Ciampi for fruitful discussions on the experimental and analytical intricacies of the bond prob
lem.
The first author would like to thank Keith Hjelmstad, Lucia Longhi, Bahram and Shahram
Nour-Omid, Gordon Oliver and Juan Simo for fruitful discussions during the course of this
work.
The figures have been prepared by Gail Feazell.
ii
Table of Contents
ACKNOWLEDGEMENTS .
TABLE OF CONTENTS ii
LIST OF FIGURES v
1. INTRODUCTION 1
1.1.- General 1
1.2.- Review of previous studies 5
1.2.1.- Experimental studies 5
1.2.2.- Analytical studies 7
1.3.- Objectives 10
2. ANALYTICAL MODEL FOR HYSTERETIC BEHAVIOR
OF REINFORCED CONCRETE MEMBERS 12
2.1.- Model of a single reinforcing bar embedded in concrete 14
2.2.- Model of reinforced concrete members 20
2.2.1.- Interior joints 21
2.2.2.- Exterior joints 24
2.2.3.- Beam inelastic regions 25
3. MATERIAL MODELS 29
3.1.- Steel stress-strain relation 29
3.2.- Bond stress-slip model 35
3.3.- Reinforced concrete section model.......................................................................... 42
iii
3.3.1.- Cracked section model 43
3.3.2.- Concrete stress-strain relation 51
4. NUMERICAL SOLUTION PROCEDURE 54
4.1.- General case 54
4.2.- Numerical scheme for exterior joints 60
4.3.- Solution algorithm for a nonlinear equation 62
4.4.- Procedure for establishing initial iteration values 64
4.5.- Some special problems and their solution 66
4.6.- Computer program JOINT 68
5. COMPARISON BETWEEN ANALYTICAL RESULTS
AND EXPERIMENTAL EVIDENCE 69
5.1.- Test specimens 69
5.2.- Comparison and discussion of results 72
5.2.1.- General 72
5.2.2.- Specimen BC4 74
5.2.3.- Specimen BC3 77
6. PARAMETRIC STUDIES ON AN INTERIOR JOINT 84
6.1.- General 85
6.2.- Variation of bond conditions 85
6.3.- Ratio of top to bottom reinforcement 86
6.4.- Variation of yield strength of reinforcement 89
6.5.- Variation in history of loading 90
6.6.- Effects of scale on hysteretic behavior of joints 91
iv
6.7.- Comparison of parametric studies 94
7. SUMMARY, CONCLUSIONS AND RECOMMENDATIONS 98
7.1.- Summary 98
7.2.- Conclusions 99
7.3.- Recommendations for future research 100
REFERENCES 102
FIGURES 108
LIST OF FIGURES
FIGURE 2.1 COMBINATION OF GRAVITY LOADS WITH LATERAL
EARTHQUAKE LOAD EFFECTS IN A TYPICAL
LOWER STORY OF A MOMENT RESISTING FRAME
FIGURE 2.2 BEHAVIOR OF INTERIOR JOINT UNDER MOMENT REVERSALS
FIGURE 2.3 SUBDIVISION OF RIC MEMBER INTO SEVERAL SUBREGIONS
FIGURE 2.4a DEFINITION OF BOUNDARIES OF A SUBREGION
FIGURE 2.4b SINGLE REINFORCING BAR BETWEEN TWO ADJACENT CRACKS
FIGURE 2.5a FORCES ACTING ON INFINITESIMAL BAR ELEMENT
FIGURE 2.5b DISCRETIZATION ALONG A REINFORCING BAR
FIGURE 2.6 ANALYTICAL MODEL FOR INTERIOR BEAM"COLUMN JOINT
FIGURE 2.7a DEFINITION OF RELATIVE SLIP AND CRACK WIDTH
AT A CRACKED RIC SECTION
FIGURE 2.7b COMPUTATION OF CRACK WIDTH AT THE TOP AND
BOTTOM OF A CRACKED RIC SECTION
FIGURE 2.8 UNKNOWN VARIABLES AT JOINT END SECTIONS
FIGURE 2.9a ACTUAL REINFORCEMENT ARRANGEMENT IN EXTERIOR JOINTS
FIGURE 2.9b IDEALIZATION OF 90° HOOK ANCHORAGE AND DEFINITION
OF END SECTIONS 1 AND n IN EXTERIOR JOINTS
v

vi
FIGURE 2.10 DISTRIBUTION OF STEEL, CONCRETE AND BOND STRESS
ALONG BOTTOM REINFORCING BARS IN A GIRDER
FIGURE 2.11 DEFINITION OF END SECTIONS AND BOUNDARY CONDITIONS
IN THE CASE OF A GIRDER SUBREGION
FIGURE 2.12 STRESS TRANSFER BETWEEN REINFORCING BAR
AND SURROUNDING CONCRETE
FIGURE 3.1 MENEGOTTO-PINTO STEEL MODEL
FIGURE 3.2 DEFINITION OF CURVATURE PARAMETER R (0
IN MENEGOTTO-PINTO STEEL MODEL
FIGURE 3.3 DEFINITION OF CURVATURE PARAMETER R (0 IN THE
CASE OF PARTIAL UNLOADING AND RELOADING
FIGURE 3.4a BEHAVIOR OF PROPOSED STEEL MODEL UNDER
TYPICAL STRESS-STRAIN HISTORY
FIGURE 3.4b BEHAVIOR OF PROPOSED STEEL MODEL UNDER
TYPICAL STRESS-STRAIN HISTORY
FIGURE 3.5 EFFECT OF ISOTROPIC STRAIN HARDENING ON THE
STEEL STRAIN IN BOTTOM REINFORCING BARS
. DURING CRACK CLOSURE
FIGURE 3.6 COMPARISON OF ANALYTICAL STEEL STRESS-STRAIN HISTORY
WITH EXPERIMENTAL RESULTS (TOP REINFORCING BAR)
(a) EXPERIMENTAL RESULTS (SPECIMENS 1 AND 2 FROM REF. [31])
FIGURE 3.7
FIGURE 3.8
FIGURE 3.9
FIGURE 3.10
FIGURE 3.11
vii
(b) MENEGOTTO-PINTO MODEL INCLUDING ISOTROPIC STRAIN
HARDENING
(c) MENEGOTTO-PINTO MODEL WITHOUT ISOTROPIC STRAIN
HARDENING
COMPARISON OF ANALYTICAL STEEL STRESS-STRAIN HISTORY
WITH EXPERIMENTAL RESULTS ( BOTTOM REINFORCING BAR)
(a) EXPERIMENTAL RESULTS (SPECIMENS 1 AND 2 FROM REF. [31])
(b) MENEGOTTO-PINTO MODEL INCLUDING ISOTROPIC STRAIN
HARDENING
(c) MENEGOTTO-PINTO MODEL WITHOUT ISOTROPIC STRAIN
HARDENING
PROPOSED BOND STRESS-SLIP RELATION
PROPOSED BOND STRESS-SLIP MODEL
UNDER INCOMPLETE SLIP REVERSALS
COMPARISON OF HYSTERETIC BOND STRESS-SLIP BEHAVIOR
BETWEEN PROPOSED MODEL AND ELIGEHAUSEN'S MODEL
(a) PROPOSED MODEL
(b) ELIGEHAUSEN'S MODEL
COMPARISON OF HYSTERETIC STEEL FORCE-SLIP BEHAVIOR
AT THE FREE END OF AN ANCHORED #8 REINFORCING BAR.
ANCHORAGE LENGTH = 25 db

viii
(a) USING PROPOSED BOND STRESS-SLIP MODEL
(b) USING ELIGEHAUSEN'S MODEL
(c) EXPERIMENTAL RESULTS
FIGURE 3.12 DIFFERENT REGIONS AND CORRESPONDING BOND
STRESS-SLIP ENVELOPE CURVES IN AN INTERIOR JOINT
FIGURE 3.13 TYPICAL END MOMENT-STEEL STRAIN HISTORY OF
BOTTOM REINFORCING BARS
AT A BEAM-COLUMN INTERFACE (FROM REF. [37] )
FIGURE 3.14 MECHANISM OF CRACK CLOSURE AT A CRACKED RIC SECTION
TAKING INTO ACCOUNT CYCLIC BOND DETERIORATION
FIGURE 3.15 HYSTERETIC MOMENT-CURVATURE RELATION (FROM REF. [3 I] )
FIGURE 3.16 HYSTERETIC MOMENT-ROTATION RELATION ASSUMING
STRAIN COMPATIBILITY BETWEEN STEEL AND CONCRETE
FIGURE 3.17 ARCH ACTION DURING CRACK CLOSURE
AT A CRACKED RIC SECTION
FIGURE 3.18 HISTORY OF CONCRETE STRAINS NEAR
A CRACKED RIC SECTION ( FROM REF. [12] )
FIGURE 3.19 RELATION BETWEEN CRACK WIDTH AT CLOSURE a AND
MAXIMUM PREVIOUS CRACK WIDTH Wmax
AT A CRACKED RIC SECTION
FIGURE 3.20
FIGURE 3.21
FIGURE 4.1
FIGURE 4.2
FIGURE 4.3
FIGURE 4.4
FIGURE 4.5
FIGURE 4.6a
FIGURE 4.6b
FIGURE 4.7
FIGURE 4.8
FIGURE 4.9
FIGURE 5.1
CONTACT OF CRACK SURFACES DUE TO SHEAR DISPLACEMENT
CYCLIC CONCRETE STRESS-STRAIN RELATION
FOR CONFINED AND UNCONFINED CONCRETE
IMPOSED BOUNDARY CONDITIONS
IN THE CASE OF INTERIOR JOINTS
MODIFIED GAUSS-SEIDEL ALGORITHM
FOR ITERATION LOOP (A)
NESTED ITERATION LOOPS FOR INTERIOR JOINTS
IMPOSED BOUNDARY CONDITIONS FOR EXTERIOR JOINTS
NESTED ITERATION LOOPS FOR EXTERIOR JOINTS
RESIDUAL FUNCTION f (x) AND PROPOSED
REGULA FALSI ALGORITHM
ACCELERATED REGULA FALSI OR ILLINOIS ALGORITHM
TWO POSSIBLE EQUILIBRIUM POSITIONS A AND B AT NODE i +1
NUMERICAL PROBLEMS ASSOCIATED WITH CRACK CLOSURE
ORGANIZATION OF COMPUTER PROGRAM JOINT
GEOMETRY AND REINFORCING DETAILS
OF TEST SPECIMEN ( REF. [50] )
ix
x
FIGURE S.2a MEASURED STRESS-STRAIN RELATION FOR CONCRETE (REF.[50])
FIGURE 5.2b MEASURED STRESS-STRAIN RELATION
FOR REINFORCING STEEL ( REF. [50] )
FIGURE 5.3 SUBVISION OF BAR ANCHORAGE LENGTH
INTO DIFFERENT BOND REGIONS
FIGURE 5.4 DEFINITION OF EAST AND WEST BEAM FOR TEST SPECIMEN
FIGURE 5.5 SIGN CONVENTION FOR RELATIVE SLIP VALUES
FIGURE 5.6a END MOMENT VERSUS FIXED-END ROTATION.
SPECIMEN BC4. WEST BEAM
FIGURE 5.6b END MOMENT VERSUS FIXED-END ROTATION. SPECIMEN BC4.
EAST BEAM
FIGURE 5.7a END MOMENT VERSUS RELATIVE BAR SLIPPAGE
AT BEAM-COLUMN INTERFACE. SPECIMEN BC4
WEST BEAM, BOTTOM BAR
FIGURE 5.7b END MOMENT VERSUS RELATIVE BAR SLIPPAGE
AT BEAM-COLUMN INTERFACE. SPECIMEN BC4
WEST BEAM, TOP BAR
FIGURE 5.7c END MOMENT VERSUS RELATIVE BAR SLIPPAGE
AT BEAM-COLUMN INTERFACE. SPECIMEN BC4
EAST BEAM, BOTTOM BAR
FIGURE 5.7d
FIGURE 5.8a
FIGURE 5.8b
FIGURE 5.8c
FIGURE 5.8d
FIGURE 5.9a
FIGURE 5.9b
FIGURE 5.9c
END MOMENT VERSUS RELATIVE BAR SLIPPAGE
AT BEAM-COLUMN INTERFACE. SPECIMEN BC4
EAST BEAM, TOP BAR
END MOMENT VERSUS REINFORCING STEEL STRAIN
AT BEAM-COLUMN INTERFACE. SPECIMEN BC4
WEST BEAM, BOTTOM BAR
END MOMENT VERSUS REINFORCING STEEL STRAIN
AT BEAM-COLUMN INTERFACE. SPECIMEN BC4
WEST BEAM, TOP BAR
END MOMENT VERSUS REINFORCING STEEL STRAIN
AT BEAM-COLUMN INTERFACE. SPECIMEN BC4
EAST BEAM, BOTTOM BAR
END MOMENT VERSUS REINFORCING STEEL STRAIN
AT BEAM-COLUMN INTERFACE. SPECIMEN BC4
EAST BEAM, TOP BAR
DISTRIBUTION OF STEEL STRAIN, BAR SLIP, STEEL STRESS AND
BOND STRESS ALONG EMBEDDED BARS AT LOAD POINT A.
COLUMN WIDTH = 430 mm
DISTRIBUTION OF STEEL STRAIN, BAR SLIP, STEEL STRESS AND
BOND STRESS ALONG EMBEDDED BARS AT LOAD POINT B.
COLUMN WIDTH = 430 mm
DISTRIBUTION OF STEEL STRAIN, BAR SLIP, STEEL STRESS AND
BOND STRESS ALONG EMBEDDED BARS AT LOAD POINT C.
xi
xii
COLUMN WIDTH = 430 mm
FIGURE 5.10a END MOMENT VERSUS FIXED-END ROTATION.
SPECIMEN BC3. WEST BEAM
FIGURE 5.lOb END MOMENT VERSUS FIXED-END ROTATION.
SPECIMEN BC3. EAST BEAM
FIGURE 5.11a END MOMENT VERSUS FIXED-END ROTATION.
SPECIMEN BC3. WEST BEAM
FIGURE 5.l1b END MOMENT VERSUS FIXED-END ROTATION.
SPECIMEN BC3. EAST BEAM
FIGURE 5.12a END MOMENT VERSUS FIXED-END ROTATION.
SPECIMEN BC3. WEST BEAM
FIGURE 5.12b END MOMENT VERSUS FIXED-END ROTATION.
SPECIMEN BC3. EAST BEAM
FIGURE 5.13a END MOMENT VERSUS RELATIVE BAR SLIPPAGE
AT BEAM-COLUMN INTERFACE. SPECIMEN BC3
WEST BEAM, BOTTOM BAR
FIGURE 5.13b END MOMENT VERSUS RELATIVE BAR SLIPPAGE
AT BEAM-COLUMN INTERFACE. SPECIMEN BC3
WEST BEAM, TOP BAR
FIGURE 5.l3c END MOMENT VERSUS RELATIVE BAR SLIPPAGE
AT BEAM-COLUMN INTERFACE. SPECIMEN BC3
EAST BEAM, BOTTOM BAR
FIGURE 5.13d END MOMENT VERSUS RELATIVE BAR SLIPPAGE
AT BEAM-COLUMN INTERFACE. SPECIMEN BC3
EAST BEAM, TOP BAR
FIGURE 5.14a END MOMENT VERSUS REINFORCING STEEL STRAIN
AT BEAM-COLUMN INTERFACE. SPECIMEN BC3
WEST BEAM, BOTTOM BAR
FIGURE 5.14b END MOMENT VERSUS REINFORCING STEEL STRAIN
AT BEAM-COLUMN INTERFACE. SPECIMEN BC3
WEST BEAM, TOP BAR
FIGURE 5.l4c END MOMENT VERSUS REINFORCING STEEL STRAIN
AT BEAM-COLUMN INTERFACE. SPECIMEN BC3
EAST BEAM, BOTTOM BAR
FIGURE 5.l4d END MOMENT VERSUS REINFORCING STEEL STRAIN
AT BEAM-COLUMN INTERFACE. SPECIMEN BC3
EAST BEAM, TOP BAR
FIGURE 5.15a STEEL STRESS VERSUS STEEL STRAIN AT
BEAM-COLUMN INTERFACE. SPECIMEN BC3
EAST BEAM, BOTTOM BAR
FIGURE S.lSb STEEL STRESS VERSUS STEEL STRAIN AT
BEAM-COLUMN INTERFACE. SPECIMEN BC3
EAST BEAM, TOP BAR
FIGURE S.16a DISTRIBUTION OF STEEL STRAIN, BAR SLIP, STEEL STRESS AND
BOND STRESS ALONG EMBEDDED BARS AT LOAD POINT K.
xiii
xiv
COLUMN WIDTH = 430 mm
FIGURE 5.16b DISTRIBUTION OF STEEL STRAIN, BAR SLIP, STEEL STRESS AND
BOND STRESS ALONG EMBEDDED BARS AT LOAD POINT L.
COLUMN WIDTH = 430 mm
FIGURE 5.16c DISTRIBUTION OF STEEL STRAIN, BAR SLIP, STEEL STRESS AND
BOND STRESS ALONG EMBEDDED BARS AT LOAD POINT M.
COLUMN WIDTH = 430 mm
FIGURE 5.16d DISTRIBUTION OF STEEL STRAIN, BAR SLIP, STEEL STRESS AND
BOND STRESS ALONG EMBEDDED BARS AT LOAD POINT N.
COLUMN WIDTH = 430 mm
FIGURE 5.17a DISTRIBUTION OF STEEL STRAIN ALONG THE BOTTOM
REINFORCING BARS WITH INCREASING MAGNITUDE OF END SLIP
FIGURE 5.17b DISTRIBUTION OF RELATIVE SLIP ALONG THE BOTTOM
REINFORCING BARS WITH INCREASING MAGNITUDE OF END SLIP
FIGURE 5.17c DISTRIBUTION OF STEEL STRESS ALONG THE BOTTOM
REINFORCING BARS WITH INCREASING MAGNITUDE OF END SLIP
FIGURE 5.17d DISTRIBUTION OF BOND STRESS ALONG THE BOTTOM
REINFORCING BARS WITH INCREASING MAGNITUDE OF END SLIP
FIGURE 5.18a DISTRIBUTION OF STEEL STRAIN ALONG THE BOTTOM
REINFORCING BARS WITH INCREASING MAGNITUDE OF END SLIP
FIGURE 5.18b DISTRIBUTION OF RELATIVE SLIP ALONG THE BOTTOM
REINFORCING BARS WITH INCREASING MAGNITUDE OF END SLIP
xv
FIGURE 5.18c DISTRIBUTION OF STEEL STRESS ALONG THE BOTTOM
REINFORCING BARS WITH INCREASING MAGNITUDE OF END SLIP
FIGURE 5.18d DISTRIBUTION OF BOND STRESS ALONG THE BOTTOM
REINFORCING BARS WITH INCREASING MAGNITUDE OF END SLIP
FIGURE 5.19 COMPARISON OF MONOTONIC AND CYCLIC ENVELOPE CURVES
FIGURE 6.1a END MOMENT VERSUS FIXED-END ROTATION. WEST BEAM
BOND STRENGTH REDUCED BY 15% ALONG REINFORCING BARS
FIGURE 6.1b END MOMENT VERSUS FIXED-END ROTATION. EAST BEAM
BOND STRENGTH REDUCED BY 15% ALONG REINFORCING BARS
FIGURE 6.2a END MOMENT VERSUS FIXED-END ROTATION. WEST BEAM
EQUAL RATIO OF TOP TO BOTTOM REINFORCEMENT
FIGURE 6.2b END MOMENT VERSUS FIXED-END ROTATION. WEST BEAM
EQUAL RATIO OF TOP TO BOTTOM REINFORCEMENT
FIGURE 6.2c END MOMENT VERSUS RELATIVE BAR SLIPPAGE
AT BEAM-COLUMN INTERFACE. WEST BEAM, BOTTOM BAR
EQUAL RATIO OF TOP TO BOTTOM REINFORCEMENT
FIGURE 6.2d END MOMENT VERSUS RELATIVE BAR SLIPPAGE
AT BEAM-COLUMN INTERFACE. WEST BEAM, TOP BAR
EQUAL RATIO OF TOP TO BOTTOM REINFORCEMENT
FIGURE 6.3a END MOMENT VERSUS FIXED-END ROTATION. WEST BEAM
YIELD STRENGTH OF REINFORCEMENT = 326 MPa
xvi
FIGURE 6.3b END MOMENT VERSUS FIXED-END ROTATION. EAST BEAM
YIELD STRENGTH OF REINFORCEMENT = 326 MPa
FIGURE 6.3c END MOMENT VERSUS FIXED-END ROTATION. WEST BEAM
YIELD STRENGTH OF REINFORCEMENT = 326 MPa
FIGURE 6.3d END MOMENT VERSUS FIXED-END ROTATION. EAST BEAM
YIELD STRENGTH OF REINFORCEMENT = 326 MPa
FIGURE 6.4a END MOMENT VERSUS RELATIVE BAR SLIPPAGE
AT BEAM-COLUMN INTERFACE. WEST BEAM, BOTTOM BAR
YIELD STRENGTH OF REINFORCEMENT = 326 MPa
FIGURE 6.4b END MOMENT VERSUS RELATIVE BAR SLIPPAGE
AT BEAM-COLUMN INTERFACE. WEST BEAM, TOP BAR
YIELD STRENGTH OF REINFORCEMENT = 326 MPa
FIGURE 6.5a END MOMENT VERSUS FIXED-END ROTATION. WEST BEAM
VARIATION IN HISTORY OF LOADING
FIGURE 6.5b END MOMENT VERSUS FIXED-END ROTATION. EAST BEAM
VARIATION IN HISTORY OF LOADING
FIGURE 6.6a END MOMENT VERSUS FIXED-END ROTATION. WEST BEAM
FULL-SCALE INTERIOR BEAM-COLUMN JOINT
FIGURE 6.6b END MOMENT VERSUS FIXED-END ROTATION. EAST BEAM
FULL-SCALE INTERIOR BEAM-COLUMN JOINT
FIGURE 6.6c END MOMENT VERSUS FIXED-END ROTATION. WEST BEAM
FULL-SCALE INTERIOR BEAM-COLUMN JOINT
FIGURE 6.6d
FIGURE 6.7
xvii
END MOMENT VERSUS FIXED-END ROTATION. EAST BEAM
FULL-SCALE INTERIOR BEAM-COLUMN JOINT
NORMALIZED TOTAL ENERGY DISSIPATION VERSUS
CUMULATIVE FIXED-END ROTATION DUCTILITY FOR INTERIOR
BEAM-COLUMN JOINT UNDER VARIATION OF PARAMETERS


I
CHAPTER 1
INTRODUCTION
1.1. General
Reinforced concrete structures designed according to present building codes as
moment resisting space frames, shear-walls, coupled shear-walls or any combination thereof
to withstand strong earthquake motions are expected to deform well into the inelastic range
and dissipate the energy input by the base motion through stable hysteretic behavior of
structural components. Since inelastic deformations are typically concentrated at certain
critical regions within the structure [9], the accurate prediction of the mechanical behavior
of the structure during earthquake excitations depends on the development of reliable
analytical models which describe the hysteretic behavior of these regions.
Ideally these models should be based on an accurate representation of material
behavior taking into account the controlling states of stress or strain and identifying the
main parameters which influence the hysteretic behavior of each critical region in order to
predict the behavior up to failure of any structural component during the earthquake
response. Such models will allow the designer to identify weak links in any initial design,
which can then be redesigned to prevent premature loss of strength and stiffness, thus
assuring that the structure will behave satisfactorily under severe seismic excitations by dis
sipating the energy input through stable hysteretic behavior of its components.
Following present earthquake resistant design philosophy the energy input by the base
motion should be dissipated in the largest possible number of inelastic regions within the
structure. Ductile moment resisting space frames as well as coupled wall systems are
designed so that yielding starts to develop at the girder ends. Columns of a ductile moment
resisting space frame should remain elastic during the earthquake response, except at the
2
base of the building, to avoid the formation of a partial sidesway collapse mechanism.
Attention is thus focused on understanding and predicting the hysteretic behavior of critical
regions in girders as well as that of beam-column or girder-wall joints.
Various experimental studies of reinforced concrete structural subassemblages
[9],[13], actual multistory buildings and dynamic tests of model frames have demonstrated
that, when properly designed and detailed critical regions of RIC structures are subjected to
severe cyclic excitations, the major concern is the deterioration of stiffness.
The principal effects of stiffness deterioration are:
(0 an increase in the flexibility and period of vibration of the virgin structure during
large deformation reversals,
(2) a decrease in energy dissipation capacity,
(3) a significant redistribution of internal forces leading to excessive deformations in
some regions.
Since induced seismic forces and deformations are sensitive to structural flexibility,
natural period of vibration and energy dissipation capacity, stiffness deterioration modifies
the overall response of the structure.
In RIC girders and beam-column joints stiffness deterioration under large cyclic exci
tations can be attributed to several factors. Among the most important are:
0) Bauschinger effect of reinforcing steel,
(2) concrete cracking and splitting along reinforcing bars,
(3) cyclic deterioration of bond between reinforcing steel and surrounding concrete,
(4) shear sliding in regions with cracks running through the entire depth of the member.
(5) crushing and spalling of concrete
Except for the Bauschinger effect of reinforcing steel and the crushing of concrete all
other factors are directly or indirectly related to cyclic bond deterioration between
3
reinforcing bars and surrounding concrete.
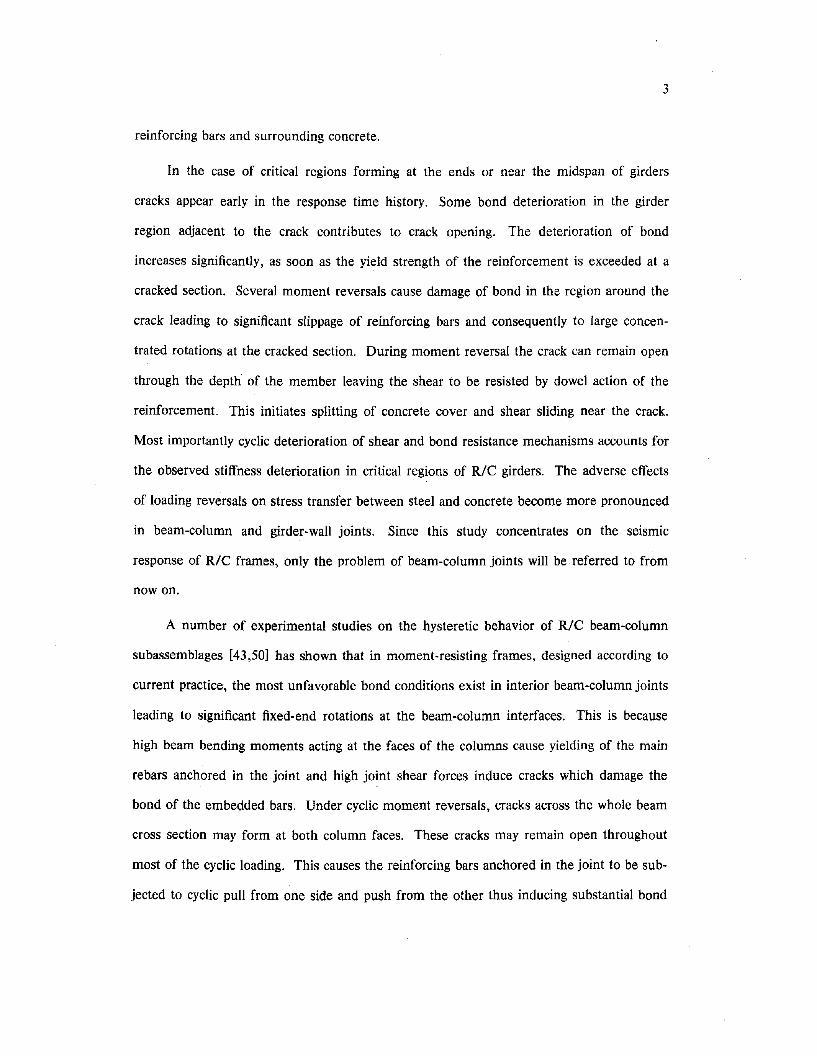
In the case of critical regions forming at the ends or near the midspan of girders
cracks appear early in the response time history. Some bond deterioration in the girder
region adjacent to the crack contributes to crack opening. The deterioration of bond
increases significantly, as soon as the yield strength of the reinforcement is exceeded at a
cracked section. Several moment reversals cause damage of bond in the region around the
crack leading to significant slippage of reinforcing bars and consequently to large concen
trated rotations at the cracked section. During moment reversal the crack can remain open
through the depth of the member leaving the shear to be resisted by dowel action of the
reinforcement. This initiates splitting of concrete cover and shear sliding near the crack.
Most importantly cyclic deterioration of shear and bond resistance mechanisms accounts for
the observed stiffness deterioration in critical regions of RIC girders. The adverse effects
of loading reversals on stress transfer between steel and concrete become more pronounced
in beam-column and girder-wall joints. Since this study concentrates on the seismic
response of RIC frames, only the problem of beam-column joints will be referred to from
now on.
A number of experimental studies on the hysteretic behavior of RIC beam-column
subassemblages [43,50] has shown that in moment-resisting frames, designed according to
current practice, the most unfavorable bond conditions exist in interior beam-column joints
leading to significant fixed-end rotations at the beam-column interfaces. This is because
high beam bending moments acting at the faces of the columns cause yielding of the main
rebars anchored in the joint and high joint shear forces induce cracks which damage the
bond of the embedded bars. Under cyclic moment reversals, cracks across the whole beam
cross section may form at both column faces. These cracks may remain open throughout
most of the cyclic loading. This causes the reinforcing bars anchored in the joint to be sub
jected to cyclic pull from one side and push from the other thus inducing substantial bond
4
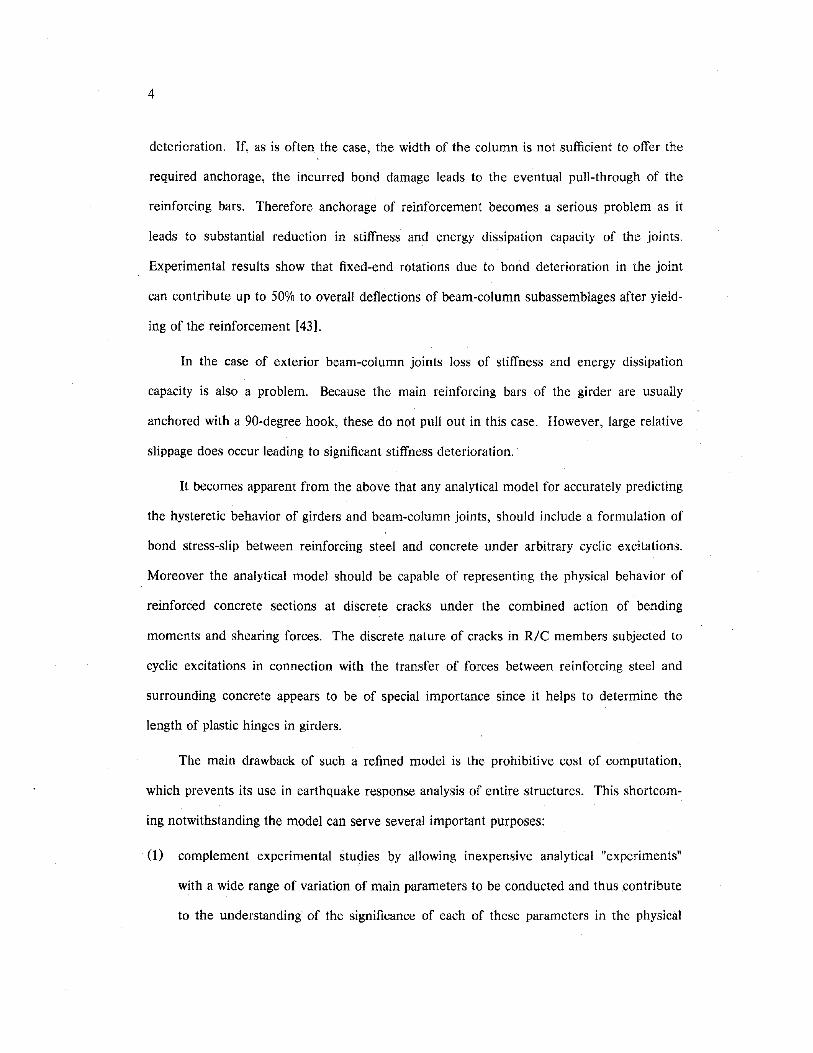
deterioration. If, as is often the case, the width of the column is not sufficient to offer the
required anchorage, the incurred bond damage leads to the eventual pull-through of the
reinforcing bars. Therefore anchorage of reinforcement becomes a serious problem as it
leads to substantial reduction in stiffness and energy dissipation capacity of the joints.
Experimental results show that fixed-end rotations due to bond deterioration in the joint
can contribute up to 50% to overall deflections of beam-column subassemblages after yield
ing of the reinforcement [43].
In the case of exterior beam-column joints loss of stiffness and energy dissipation
capacity is also a problem. Because the main reinforcing bars of the girder are usually
anchored with a 90-degree hook, these do not pull out in this case. However, large relative
slippage does occur leading to significant stiffness deterioration.
It becomes apparent from the above that any analytical model for accurately predicting
the hysteretic behavior of girders and beam-column joints, should include a formulation of
bond stress-slip between reinforcing steel and concrete under arbitrary cyclic excitations.
Moreover the analytical model should be capable of representing the physical behavior of
reinforced concrete sections at discrete cracks under the combined action of bending
moments and shearing forces. The discrete nature of cracks in RIC members subjected to
cyclic excitations in connection with the transfer of forces between reinforcing steel and
surrounding concrete appears to be of special importance since it helps to determine the
length of plastic hinges in girders.
The main drawback of such a refined model is the prohibitive cost of computation,
which prevents its use in earthquake response analysis of entire structures. This shortcom
ing notwithstanding the model can serve several important purposes:
(1) complement experimental studies by allowing inexpensive analytical "experiments"
with a wide range of variation of main parameters to be conducted and thus .contribute
to the understanding of the significance of each of these parameters in the physical
5
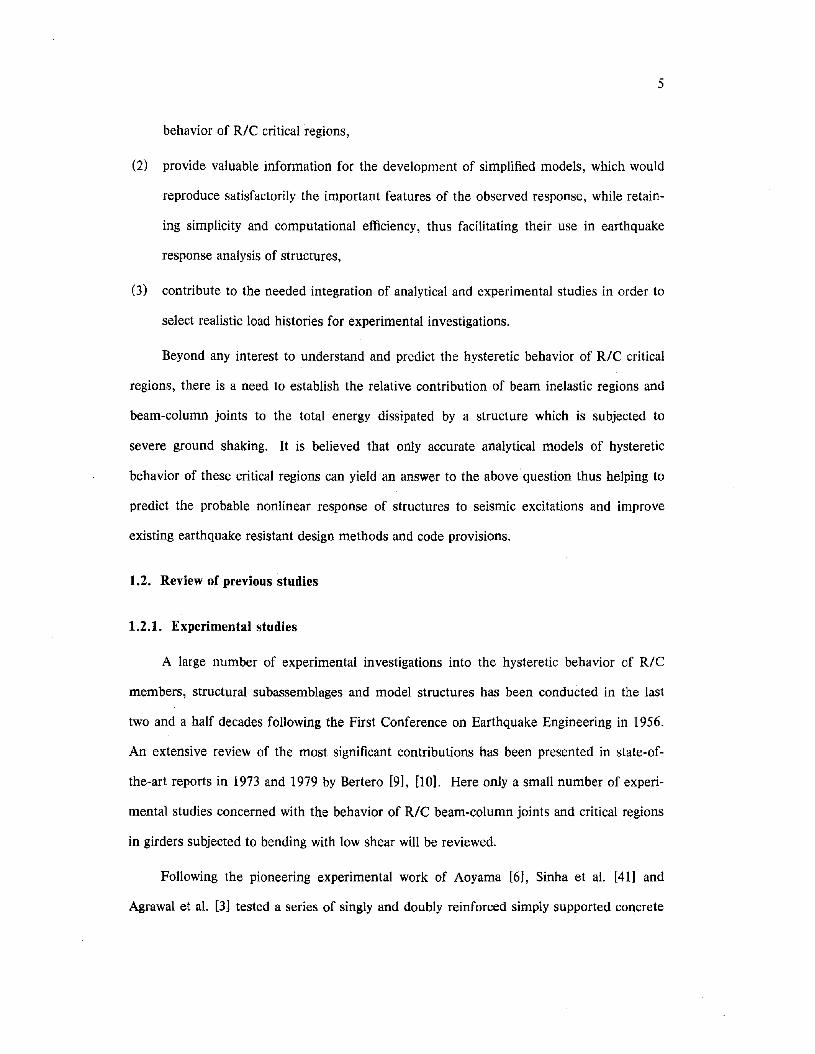
behavior of RIC critical regions,
(2) provide valuable information for the development of simplified models, which would
reproduce satisfactorily the important features of the observed response, while retain
ing simplicity and computational efficiency, thus facilitating their use in earthquake
response analysis of structures,
(3) contribute to the needed integration of analytical and experimental studies in order to
select realistic load histories for experimental investigations.
Beyond any interest to understand and predict the hysteretic behavior of RIC critical
regions, there is a need to establish the relative contribution of beam inelastic regions and
beam-column joints to the total energy dissipated by a structure which is subjected to
severe ground shaking. It is believed that only accurate analytical models of hysteretic
behavior of these critical regions can yield an answer to the above question thus helping to
predict the probable nonlinear response of structures to seismic excitations and improve
existing earthquake resistant design methods and code provisions.
1.2. Review of previous studies
1.2.1. Experimental studies
A large number of experimental investigations into the hysteretic behavior of RIC
members, structural subassemblages and model structures has been conducted in the last
two and a half decades following the First Conference on Earthquake Engineering in 1956.
An extensive review of the most significant contributions has been presented in state-of
the-art reports in 1973 and 1979 by Bertero [9], [10). Here only a small number of experi
mental studies concerned with the behavior of RIC beam-column joints and critical regions
in girders subjected to bending with low shear will be reviewed.
Following the pioneering experimental work of Aoyama [6], Sinha et al. [41] and
Agrawal et al. [3] tested a series of singly and doubly reinforced simply ~upported concrete
6
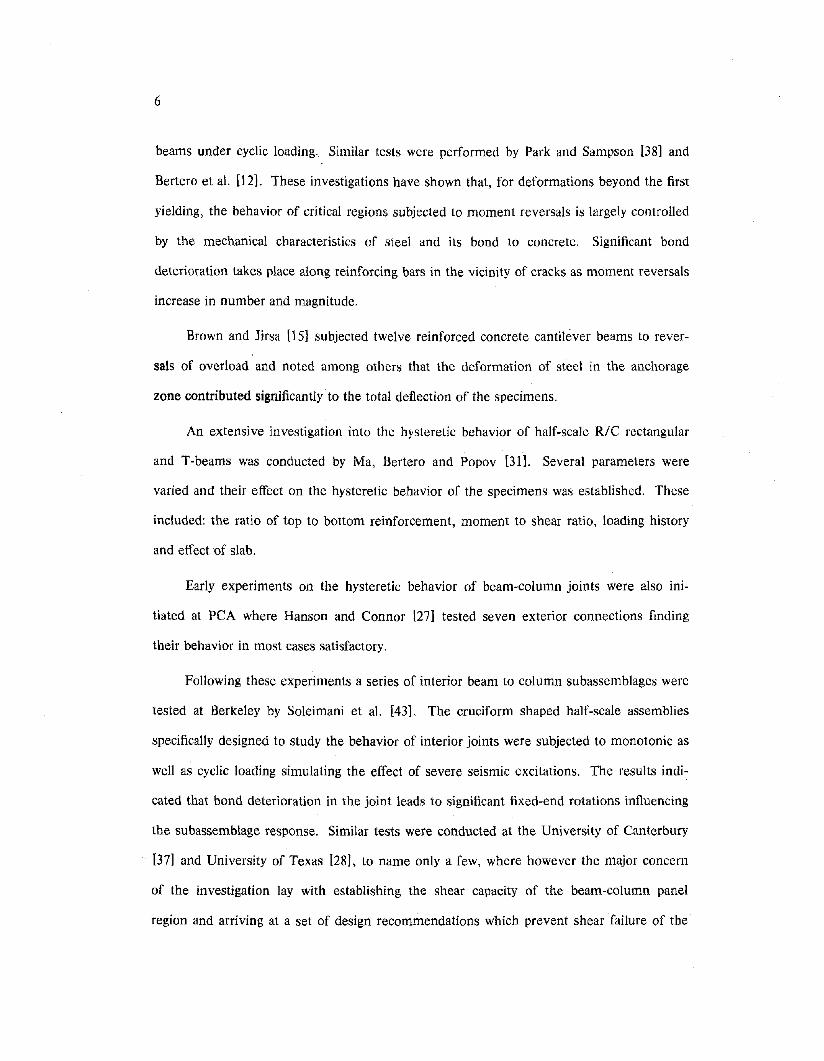
beams under cyclic loading. Similar tests were performed by Park and Sampson [38] and
Bertero et al. [12]. These investigations have shown that, for deformations beyond the first
yielding, the behavior of critical regions subjected to moment reversals is largely controlled
by the mechanical characteristics of steel and its bond to concrete. Significant bond
deterioration takes place along reinforcing bars in the vicinity of cracks as moment reversals
increase in number and magnitude.
Brown and Jirsa [15] subjected twelve reinforced concrete cantilever beams to rever
sals of overload and noted among others that the deformation of steel in the anchorage
zone contributed significantly to the total deflection of the specimens.
An extensive investigation into the hysteretic behavior of half-scale RIC rectangular
and T-beams was conducted by Ma, Bertero and Popov [31]. Several parameters were
varied and their effect on the hysteretic behavior of the specimens was established. These
included: the ratio of top to bottom reinforcement, moment to shear ratio, loading history
and effect of slab.
Early experiments on the hysteretic behavior of beam-column joints were also ini
tiated at PCA where Hanson and Connor [27] tested seven exterior connections finding
their behavior in most cases satisfactory.
Following these experiments a series of interior beam to column subassemblages were
tested at Berkeley by Soleimani et al. [43]. The cruciform shaped half-scale assemblies
specifically designed to study the behavior of interior joints were subjected to monotonic as
well as cyclic loading simulating the effect of severe seismic excitations. The results indi
cated that bond deterioration in the joint leads to significant fixed-end rotations influencing
the subassemblage response. Similar tests were conducted at the University of Canterbury
[37] and University of Texas [28], to name only a few, where however the major concern
of the investigation lay with establishing the shear capacity of the beam-column panel
region and arriving at a set of design recommendations which prevent shear failure of the
7
joint. In these studies the significant contribution of reinforcing bar slippage to the overall
subassemblage deflection was noted and recommendations for alleviating the problem were
offered much along the lines of earlier suggestions by Bertero and Popov [13].
As a result of the knowledge gained from the above studies, further efforts were ini
tiated to establish a bond stress-slip relationship under generalized excitations. A general
review of research conducted on the subject at Berkeley was presented by Popov in Ref.
[39]. A more detailed review of the bond problem is contained in Ref. [23]. Based on the
results from an extensive experimental investigation Eligehausen et al. [23] formulated a
general bond stress-slip relation for deformed bars embedded in well-confined concrete and
subjected to generalized load histories.
1.2.2. Analytical studies
Several attempts to predict analytically the hysteretic behavior of reinforced concrete
girders and beam-column joints subjected to cyclic excitations have been reported.
Early works by Aoyama [6], Agrawal et al. [3], Park and Sampson [38] employed sim
ple beam theory and material models for reinforcing steel and concrete of various degrees
of sophistication in order to predict the hysteretic moment- curvature relationship of rein
forced concrete sections. Bertero and Bresler U1] were the first to discuss the possible
effects of shear and bond forces on the behavior of critical regions adjacent to beam-column
joints. They proposed a more accurate curvature formulation to account for slippage of
reinforcing bars and considered explicitly crack opening and closing. A precise evaluation
was not possible due to lack of experimental data. Brown and Jirsa [15] calculated theoreti
cal load deflection curves for cantilever beams using an assumed curvature distribution
along the span of the cantilever and including the effect of shear forces and anchorage slip
by incorporating measured values.
The cost of computation associated with the above section layer models precludes
their use in earthquake response analysis of structures. This fact led to the development of
8
simplified global models describing the end moment-end rotation relation of structural
members [20], [26] by assuming the inelastic behavior of girder end regions lumped into
plastic point hinges or rotational springs at the ends of the member. To describe the hys
teretic response of plastic hinges in RIC structures Clough [19] proposed a bilinear stiffness
degrading model. Later Takeda et al. [46] introduced a more refined trilinear model accom
panied by a set of sixteen rules for hysteretic behavior.
Mahin and Bertero [32] have discussed several problems which arise when lumped
plasticity models are used in seismic resistant design. In particular, it was noted that such
models are incapable of predicting reliably curvature and rotational ductility demands in
reinforced concrete members. Anagnostopoulos [4] has presented further details on the
inconsistencies of assigning proper strain hardening values to point hinge moment-rotation
relations and the resulting discrepancies in curvature ductility estimates.
With the rapid development of the finite element method many investigators
attempted to gain insight into the hysteretic nonlinear response of reinforced concrete
members by subdividing them into a number of finite elements. The structures analyzed
included simple beams, shear panels and more complicated subassemblages, usually sub
jected to monotonic loading only due to the prohibitive cost of computation. A few studies
under cyclic loading were reported by Darwin and Pecknold [22] and BaZant and Bhat [8].
Due to the complexity of formulation and lack of experimental data, the problem of incor
porating discrete cracks and an accurate bond-slip model remained unresolved. A review of
the progress achieved in the finite element analysis of reinforced concrete structures is
given in Ref. [1] and some recent contributions were presented at the IABSE" Colloquium
in Delft [2].
The attempts to derive models of hysteretic joint behavior and incorporate them in
the nonlinear earthquake response analysis of structures are more recent. The proposed
models can generally be divided in two groups.
9
The first group consists of models arrived at in connection with experiments per
formed on full or reduced scale beam-column joints subjected to cyclic excitations. Town
send and Hanson [49] introduced a set of polynomial expressions which represent the hys
teretic behavior of beam-column connections and account for the observed stiffness
deterioration. Soleimani et al. [44] introduced the concept of effective length by which the
curvature at the beam-column interface is multiplied to yield the fixed-end rotation.
Anderson and Townsend [5] proposed a degrading trilinear joint model whose parameters
are determined to match a series of experimental results from exterior beam-column joint
tests.
In general this group comprises models composed of geometric curves and a set of
rules defining hysteretic behavior. They seem to agree well with the experiments they were
derived from, it appears doubtful however whether they can be generalized to different
configurations and other loading conditions, since the parameters defining hysteretic
behavior are selected to fit obtained experimental results and are not derived from physical
interpretation of the mechanisms contributing to such behavior.
The second group of joint models includes formulations derived in connection with
analytical studies. These models are typically composed of a bilinear or trilinear monotonic
envelope curve and an associated set of hysteretic rules defining behavior under cyclic load
reversals. Otani [36] computed the characteristic points of the bilinear envelope curve by
assuming that bond stresses are constant along the development length of reinforcing bars.
The fixed-end rotation was found to be proportional to the square of the moment acting at
the beam-column interface. Takeda's rule was used as the associated hysteretic rule.
Emori and Schnobrich [25] used the same assumptions along with a trilinear envelope
curve. Banon et a1. [7] employed a bilinear envelope curve in connection with Takeda's
hysteretic rule and included the observed pinching effect due to bond slip and shear sliding.
The model was used to represent the inelastic deformations due to slippage of the rein-
10
forcement.
One inherent shortcoming of all previous models is the fact that the experimentally
observed slip-through of reinforcing bars in interior joints of commonly used dimensions is
not taken into account; this leads to an interaction between the two column ends so that no
unique moment-rotation relationship can be derived for one end, unless the actions at the
other end are accounted for. Moreover they fail to provide an understanding and analytical
description of the mechanisms leading to the observed significant stiffness deterioration in
RIC beam-column joints.
Recently an accurate finite element study has been reported [34]. It seems to model
fairly well the behavior of beam-column subassemblages under monotonic loading with due
account of shear deformations and bond slip between steel and concrete. The computa
tional effort spent for monotonic loading is enormous so that little hope remains for an
efficient description of several cycles of seismic excitation using this approach.
1.3. Objectives
The research described herein was undertaken because of the need for developing
reliable analytical models to predict the hysteretic behavior of reinforced concrete struc
tures. The research has endeavored to study the effects of reinforcing bar slippage on the
hysteretic response of beam-column joints as well as inelastic regions of beams and to
include these effects in earthquake response analyses of RiC moment resisting frames. An
attempt is also made to model the behavior of large cracks in beams under load reversals,
as they influence significantly the response of RiC members.
The objectives of the investigation reported herein can be summarized as follows:
(1) to develop an accurate model describing the behavior of beam-column joints and ine
lastic regions of beams under generalized excitations,
11
(2) to use the model in conducting a series of parametric studies in order to establish the
effect of material behavior, proportioning of members and reinforcement arrangement
on the response of RIC beam-column joints,
(3) to arrive at recommendations regarding the design of RIC joints which enable satisfac
tory hysteretic behavior to be attained,
12
CHAPTER 2
ANALYTICAL MODEL FOR HYSTERETIC BEHAVIOR
OF REINFORCED CONCRETE MEMBERS
When medium or high rise reinforced concrete moment resisting ~rames are subjected
to severe seismic. excitations, the behavior of members in the lower parts of a building is
controlled by lateral forces. In a typical lower story the combined action of high lateral
loads and relatively small gravity forces gives rise to the moment distribution shown in
Fig.2.1d. It is to be particularly noted that the end moments at the beam-column interfaces
of an interior joint act in the same sense. Upon reversal of lateral force direction a com
plete reversal of bending moments takes place at the girder end regions.
In order to gain some insight into the mechanical behavior of RIC members subjected
to moment reversals with low shear stresses and motivate the analytical solution to be
developed in this chapter, an interior beam-column joint is chosen as a representative
example (Fig.2.2). The joint is typical of the ones in the lower stories of a building, so that
the end moments imposed upon it act in the same sense (Fig.2.2a).
When the joint is first loaded beyond yielding to point A (Fig.2.2b), large cracks open
at both beam-column interfaces and bond is damaged along the shaded portions of the rein
forcing bars (Fig.2.2c). Upon reversal of moment to point B (Fig.2.2b) cracks open on the
opposite side of the girder sections indicating bond damage in their vicinity (Fig.2.2d). The
old cracks mayor may not close depending on the magnitude of the reversing moments and
the ratio of top to bottom reinforcement, since the tensile yield force may not be sufficient
to yield the bars under compression. At the beginning of reloading (point C in Fig.2.2b),
previously incurred bond damage causes that only small frictional bond stresses resist rein
forcing bar slip in the shaded portion of the bars (Fig.2.2e). Therefore a certain amount of
13
slip must be overcome in these regions before larger steel stresses can build up. This
phenomenon leads to the characteristic pinching effect in the hysteretic moment-rotation
relation (Fig.2.2b).
In order to formulate an analytical model describing the hysteretic behavior of RIC
members with due account of cyclic bond deterioration between reinforcing steel and con
crete, the region of the member undergoing inelastic action is divided into a number of
subregions at locations where cracks form (Fig.2.3). In members subjected to severe
moment reversals with low shear stresses, cracks run almost vertically through the depth of
the cross-section. The positions where cracks are expected to form are not known· a priori
and can be established in the course of an analysis by determining the sections where the
concrete tensile strength is first exceeded. In the present model for reasons of simplicity
the cracks have been assumed to run vertically across the section and form at predeter
mined locations. This is, strictly speaking, true only at beam-column interfaces of interior
and exterior joints.
The hysteretic response of each subregion is determined by satisfying the equilibrium
of horizontal forces and bending moments at both end sections and by establishing the
stress transfer between steel and concrete within the region. Bond deterioration in both
subregions adjacent to a crack contributes to crack opening and to the associated relative
rotation of crack surfaces and has to be accounted for.
It is apparent that joint and girder regions can be modeled using the same analytical
formulation, the only difference being the imposed boundary conditions.
In the present investigation the shear transfer within each subregion as well as the
shear transfer at a fully cracked section is not considered. Shear transfer at cracks which
remain open through the depth of a member can become an important problem and
deserves a thorough investigation. Moreover moment gradients within the joint region are
often large enough to cause diagonal cracking leading to shear deformations which affect
14
the hysteretic joint behavior. ,Here it is assumed that the joints under consideration are
properly designed and detailed to prevent diagonal cracking and preclude significant shear
deformations. Although not pursued in the present study, it is believed that the inclusion
of shear effects within the framework of the proposed analytical model does not present any
conceptional difficulties.
. As a first step towards formulating an analytical model to describe the hysteretic
behavior of RIC members subdivided by cracks into several subregions, the transfer of
steel stresses along a portion of a single reinforcing bar between two adjacent cracks
(Fig.2.4) subjected to arbitrary load or deformation reversals will be presented. The explicit
solution of the stress transfer problem within each subregion yields a steel force-slip rela
tion at each crack bounding the subregion. The steel force-slip relations for each reinforc-
ing layer are complemented by equations expressing the equilibrium of horizontal forces
and bending moments which are established at the cracked end sections of the subregion.
The resulting set of nonlinear equations describes the hysteretic behavior of the subregion
under consideration and its interaction with neighboring. subregions. In this manner all
subregions can be assembled to yield the response of the entire member for the imposed
global boundary conditions.
2.1. Model of a single reinforcing bar embedded in concrete
A portion of a single reinforcing bar between two adjacent cracks is .depicted in
Fig.2.4. The differential equations of bond are (Fig.2.5a),
AdO's (2.1)---q~dx 0
du (2.2)£ -£ --s c dx
£s-/(O's) (2.3)
q-q(u) (2.4)
15
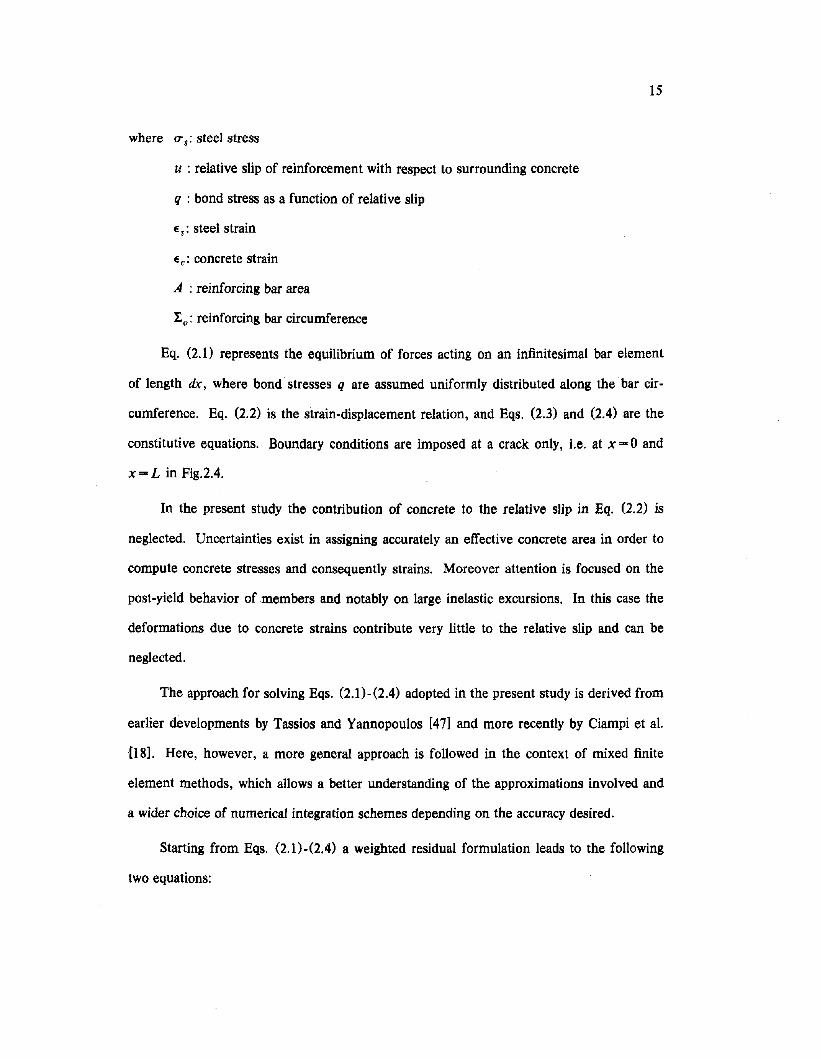
where (J"s: steel stress
u : relative slip of reinforcement with respect to surrounding concrete
q : bond stress as a function of relative slip
E s: steel strain
E c: concrete strain
A : reinforcing bar area
1:0 : reinforcing bar circumference
Eq. (2.1) represents the equilibrium of forces acting on an infinitesimal bar element
of length dx, where bond stresses q are assumed uniformly distributed along the bar cir
cumference. Eq. (2.2) is the strain-displacement relation, and Eqs. (2.3) and (2.4) are the
constitutive equations. Boundary conditions are imposed at a crack only, Le. at x'" 0 and
x .... L in Fig.2.4.
In the present study the contribution of concrete to the relative slip in Eq. (2.2) is
neglected. Uncertainties exist in assigning accurately an effective concrete area in order to
compute concrete stresses and consequently strains. Moreover attention is focused on the
post-yield behavior of members and notably on large inelastic excursions. In this case the
deformations due to concrete strains contribute very little to the relative slip and can be
neglected.
The approach for solving Eqs. (2.1)-(2.4) adopted in the present study is derived from
earlier developments by Tassios and Yannopoulos [47] and more recently by Ciampi et al.
US]. Here, however, a more general approach is followed in the context of mixed finite
element methods, which allows a better understanding of the approximations involved and
a wider choice of numerical integration schemes depending on the accuracy desired.
Starting from Eqs. (2.1)-(2.4) a weighted residual formulation leads to the following
two equations:
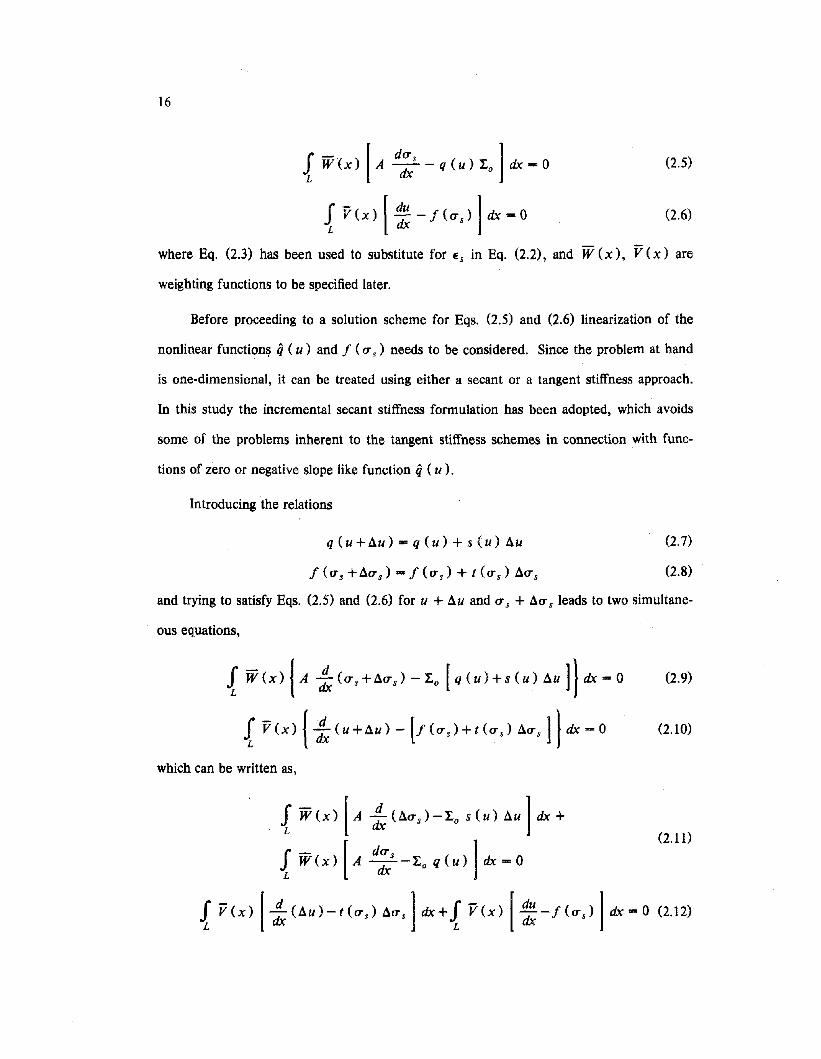
16
f - [ dCT s I ()L W (x ) A ~ - q (u ) I o dx "" 0 2.5
i V(x) [ : - j (CTs)Idx "" 0 (2.6)
where Eq. (2.3) has been used to substitute for Es in Eq. (2.2), and W (x), V(x) are
weighting functions to be specified later.
Before proceeding to a solution scheme for Eqs. (2.5) and (2.6) linearization of the
nonlinear function~ q (u) and j (CTs) needs to be considered. Since the problem at hand
is one-dimensional, it can be treated using either a secant or a tangent stiffness approach.
In this study the incremental secant stiffness formulation has been adopted, which avoids
some of the problems inherent to the tangent stiffness schemes in connection with func-
tions of zero or negative slope like function q (u ).
Introducing the relations
q (u+~u) "" q (u) + s (u) Au (2.7)
(2.8)
and trying to satisfy Eqs. (2.5) and (2.6) for u + Au and CT s + ACTs leads to two simultane-
ous equations,
.f W(x) IA ~ (CTs+ACT s ) - I o [q (u)+s (u) Au l\ dx "" 0
i V(x) I~ (u + Au) - [J (CT s ) + t{ CT s) ACTs 11 dx == 0
which can be written as,
(2.9)
(2.10)
(2.11)
.f W(x) [A ~ (ACTs) - 1:0 s ( u) AuIdx +
f - [dCT S IL W(X) A ~-Io q (u) dx == 0
.f Vex) [ ~ (Au)-t{CT s ) ACTsIdx+.f vex) [ :: -j(CTs ) Idx "" 0 (2.12)
17
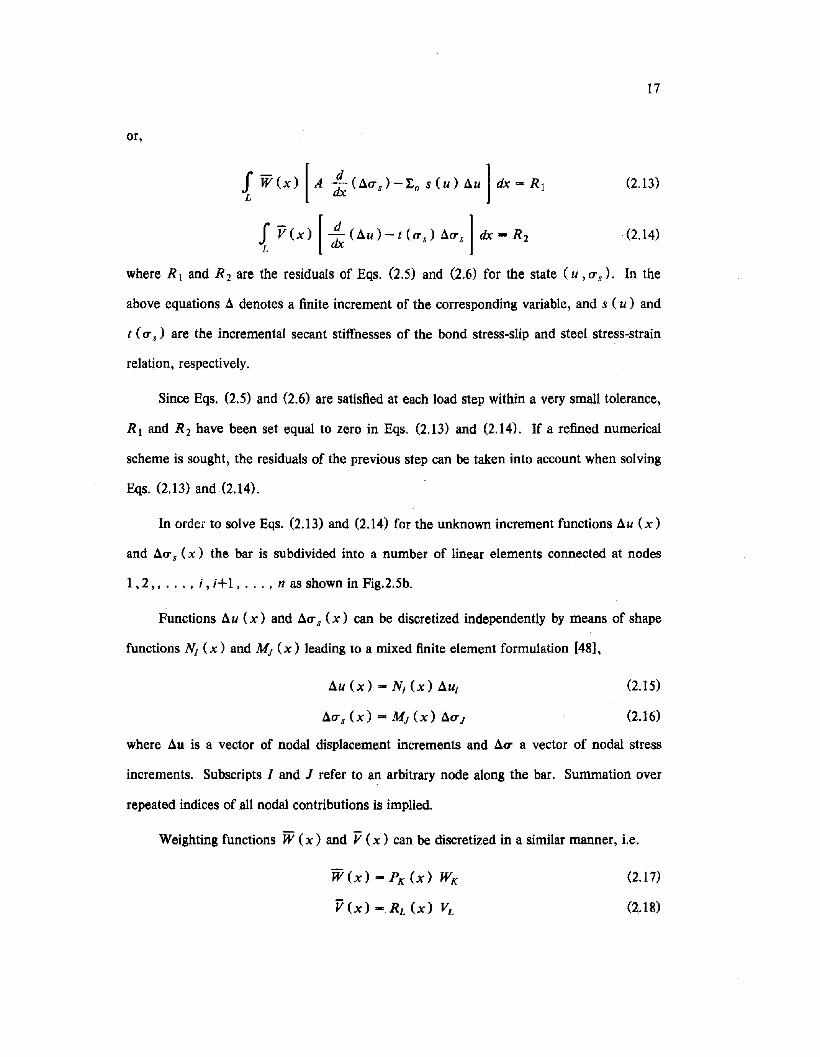
or,
.f W(x) [A ~ (l.1u s )-I:o s (u) l.1uIdx == R j (2.13)
.f V(x) [ ~ (l.1u) - t (us) l.1usIdx == R 2 (2.14)
where R j and R 2 are the residuals of Eqs. (2.5) and (2.6) for the state (u, us), In the
above equations a denotes a finite increment of the corresponding variable, and s ( u) and
t ( us) are the incremental secant stitfnesses of the bond stress-slip and steel stress-strain
relation, respectively.
Since Eqs. (2.5) and (2.6) are satisfied at each load step within a very small tolerance,
R j and R 2 have been set equal to zero in Eqs. (2.13) and (2.14). If a refined numerical
scheme is sought, the residuals of the previous step can be taken into account when solving
Eqs. (2.13) and (2.14).
In order to solve Eqs. (2.13) and (2.14) for the unknown increment functions au (x)
and aus (x) the bar is subdivided into a number of linear elements connected at nodes
1 ,2" ... , i, i+1 , ... , n as shown in Fig.2.5b.
Functions 1.1 u (x) and l.1us (x) can be discretized independently by means of shape
functions Nj (x) and MJ (x) leading to a mixed finite element formulation [48],
au (x) "'" Nj (x) aUj
l.1u s (x) = MJ (x) l.1uJ
(2.15)
(2.16)
where l.1u is a vector of nodal displacement increments and au a vector of nodal stress
increments. Subscripts I and J refer to an arbitrary node along the bar. Summation over
repeated indices of all nodal contributions is implied.
Weighting functions W (x) and V(x ) can be discretized in a similar manner, Le.
W (x) .. PK (x) WK
V(x) .. RL (x) VL
(2.17)
(2.18)
(2.19)
(2.20)
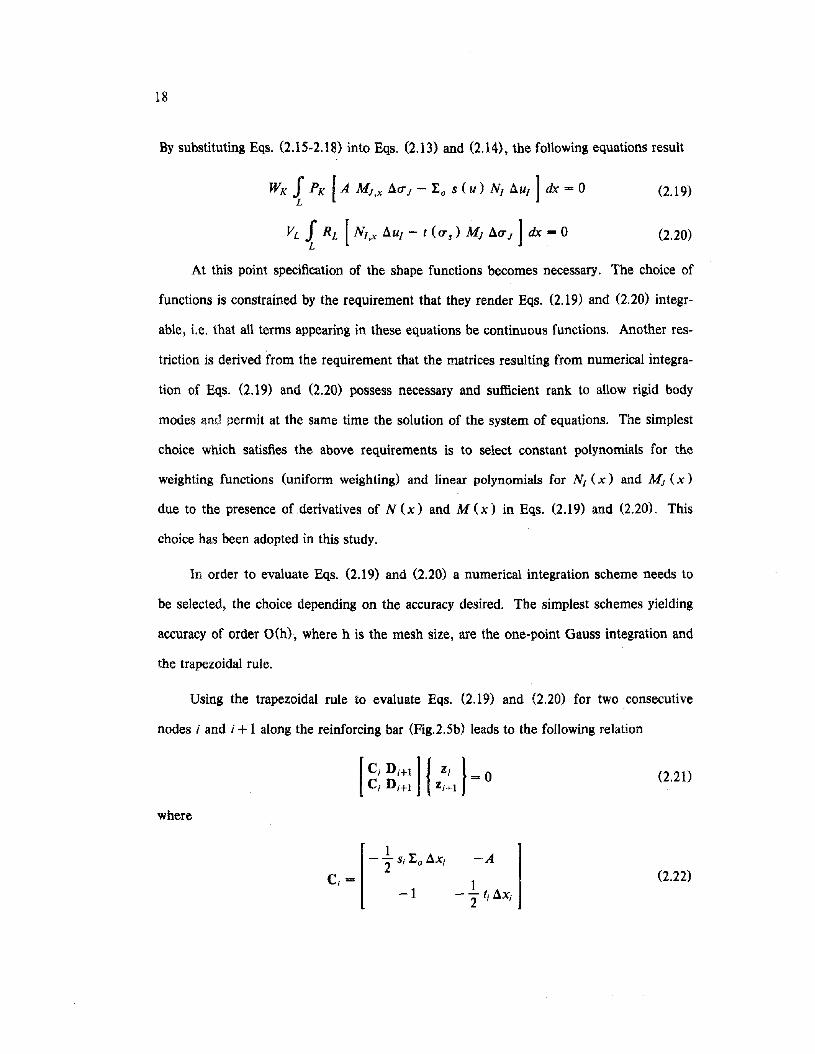
18
By substituting Eqs. (2.15-2.18) into Eqs. (2.13) and (2.14), the following equations result
WK { PK [A MJ,x !1uJ - Iv s ( u) Nj aUj ] dx == 0
VL { RL [ Nj,x !1Uj - t (us) MJ !1uJ ] dx .. 0
At this point specification of the shape functions becomes necessary. The choice of
functions is constrained by the requirement that they render Eqs. (2.19) and (2.20) integr-
able, Le. that all terms appearing in these equations be continuous functions. Another res
triction is derived from the requirement that the matrices resulting from numerical integra-
tion of Eqs. (2.19) and (2.20) possess necessary and sufficient rank to allow rigid body
modes and permit at the same time the solution of the system of equations. The simplest
choice which satisfies the above requirements is to select constant polynomials for the
weighting functions (uniform weighting) and linear polynomials for Nj (x) and MJ (x)
due to the presence of.derivatives of N(x) and M(x) in Eqs. (2.19) and (2.20). This
choice has been adopted in this study.
In order to evaluate Eqs. (2.19) and (2.20) a numerical integration scheme needs to
be selected, the choice depending on the accuracy desired. The simplest schemes yielding
accuracy of order O(h), where h is the mesh size, are the one-point Gauss integration and
the trapezoidal rule.
Using the trapezoidal rule to evaluate Eqs. (2.19) and (2.20) for two consecutive
nodes i and i +1 along the reinforcing bar (Fig.2.5b) leads to the following relation
where
[C; D;+! II Zj I 0C; D;+! Zj+l ==
(2.21)
c;-1- 2 s; I o !1x;
-1
-A
1-2 t; !1x;
(2.22)
19
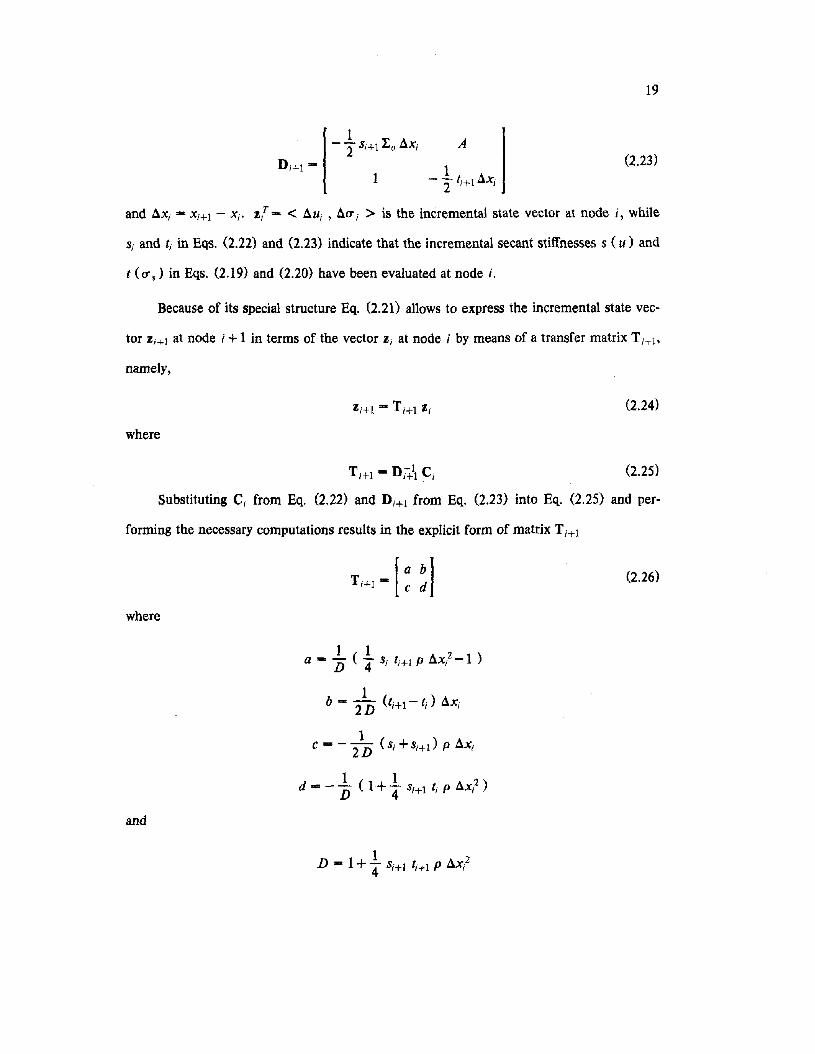
(2.23)A
1 1- "2 fi+lax;
and ax; = X;+l - X;. zr .... < au; , afT; > is the incremental state vector at node i, while
Si and ti in Eqs. (2.22) and (2.23) indicate that the incremental secant stiffnesses s (u) and
t (fTs ) in Eqs. (2.19) and (2.20) have been evaluated at node i.
Because of its special structure Eq. (2.21) allows to express the incremental state vec-
tor Zi+l at node i +1 in terms of the vector Zi at node i by means of a transfer matrix T i+b
namely,
(2.24)
where
(2.25)
Substituting C; from Eq. (2.22) and D;+1 from Eq. (2.23) into Eq. (2.25) and per-
forming the necessary computations results in the explicit form of matrix Ti+l
(2.26)
where
1 1a .... D ("4 s; ti+1 P ax/ - 1 )
and
20
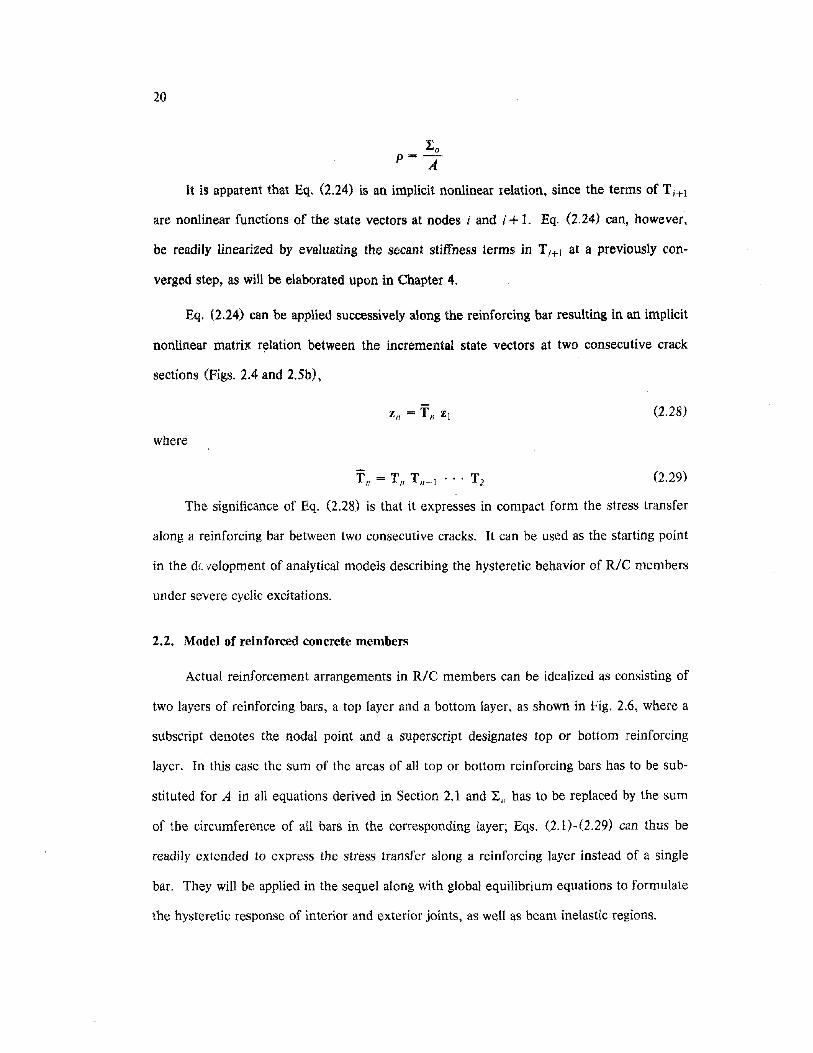
It is apparent that Eq. (2.24) is an implicit nonlinear relation, since the terms of T i+l
are nonlinear functions of the state vectors at nodes i and i + 1. Eq. (2.24) can, however,
be readily linearized by evaluating the secant stiffness terms in T i+1 at a previously con-
verged step, as will be elaborated upon in Chapter 4.
Eq. (2.24) can be applied successively along the reinforcing bar resulting in an implicit
nonlinear matrix r~lation between the incremental state vectors at two consecutive crack
sections (Figs. 2.4 and 2.5b),
(2.28)
where
(2.29)
The significance of Eq. (2.28) is that it expresses in compact form the stress transfer
along a reinforcing bar between two consecutive cracks. It can be used as the starting point
in the de velopment of analytical models describing the hysteretic behavior of RIC members
under severe cyclic excitations.
2.2. Model of reinforced concrete members
Actual reinforcement arrangements in RIC members can be idealized as consisting of
two layers of reinforcing bars, a top layer and a bottom layer, as shown in Fig. 2.6, where a
subscript denotes the nodal point and a superscript designates top or bottom reinforcing
layer. In this case the sum of the areas of all top or bottom reinforcing bars has to be sub-
stituted for A ill all equations derived in Section 2.1 and L o has to be replaced by the sum
of the circumference of all bars in the corresponding layer; Eqs. (2.1)-(2.29) can thus be
readily extended to express the stress transfer along a reinforcing layer instead of a single
bar. They will be applied in the sequel along with global equilibrium equations to formulate
the hysteretic response of interior and exterior joints, as well as beam inelastic regions.
21
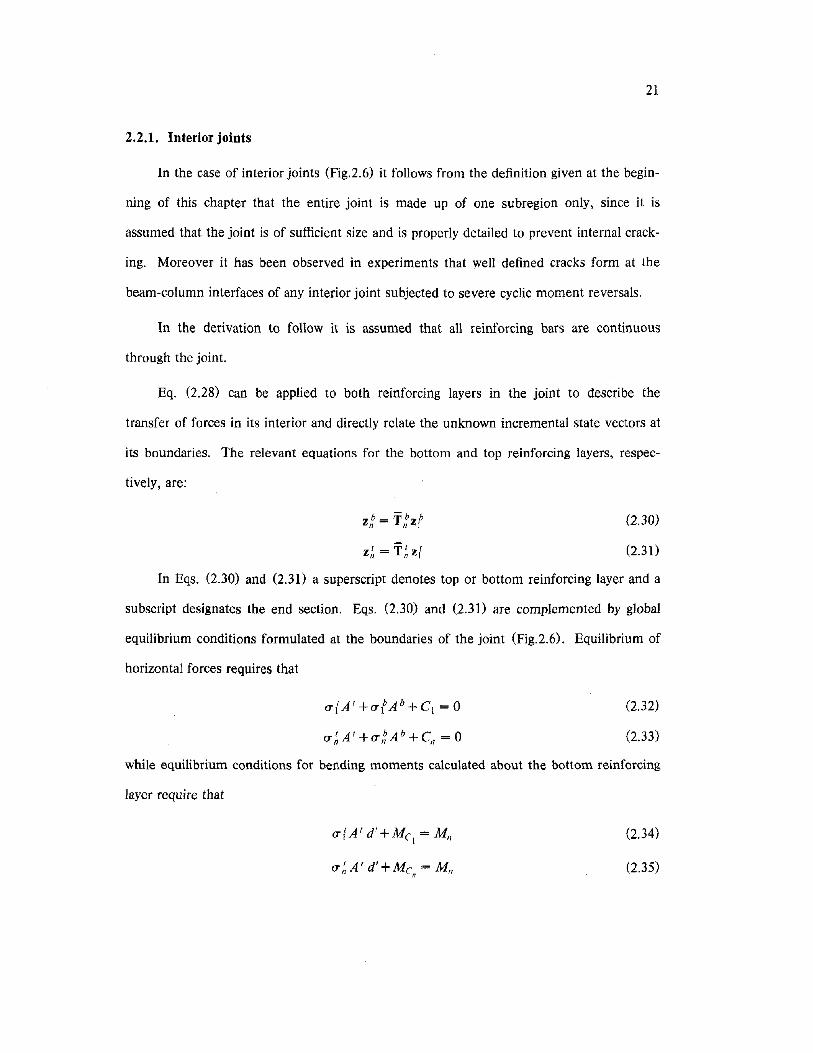
2.2.1. Interior joints
In the case of interior joints (Fig.2.6) it follows from the definition given at the begin-
ning of this chapter that the entire joint is made up of one subregion only, since it is
assumed that the joint is of sufficient size and is properly detailed to prevent internal crack-
ing. Moreover it has been observed in experiments that well defined cracks form at the
beam-column interfaces of any interior joint subjected to severe cyclic moment reversals.
In the derivation to follow it is assumed that all reinforcing bars are continuous
through the joint.
Eq. (2.28) can be applied to both reinforcing layers in the joint to describe the
transfer of forces in its interior and directly relate the unknown incremental state vectors at
its boundaries. The relevant equations for the bottom and top reinforcing layers, respec-
tively, are:
z' = T'z'n n 1
(2.30)
(2.31)
In Eqs. (2.30) and (2.31) a superscript denotes top or bottom reinforcing layer and a
subscript designates the end section. Eqs. (2.30) and (2.31) are complemented by global
equilibrium conditions formulated at the boundaries of the joint (Fig.2.6). Equilibrium of
horizontal forces requires that
u{ A 1+ ufA b + C1 = 0 (2.32)
(2.33)
while equilibrium conditions for bending moments calculated about the bottom reinforcing
layer require that
u'AI d'+M = M1 C1 n (2.34)
(2.35)
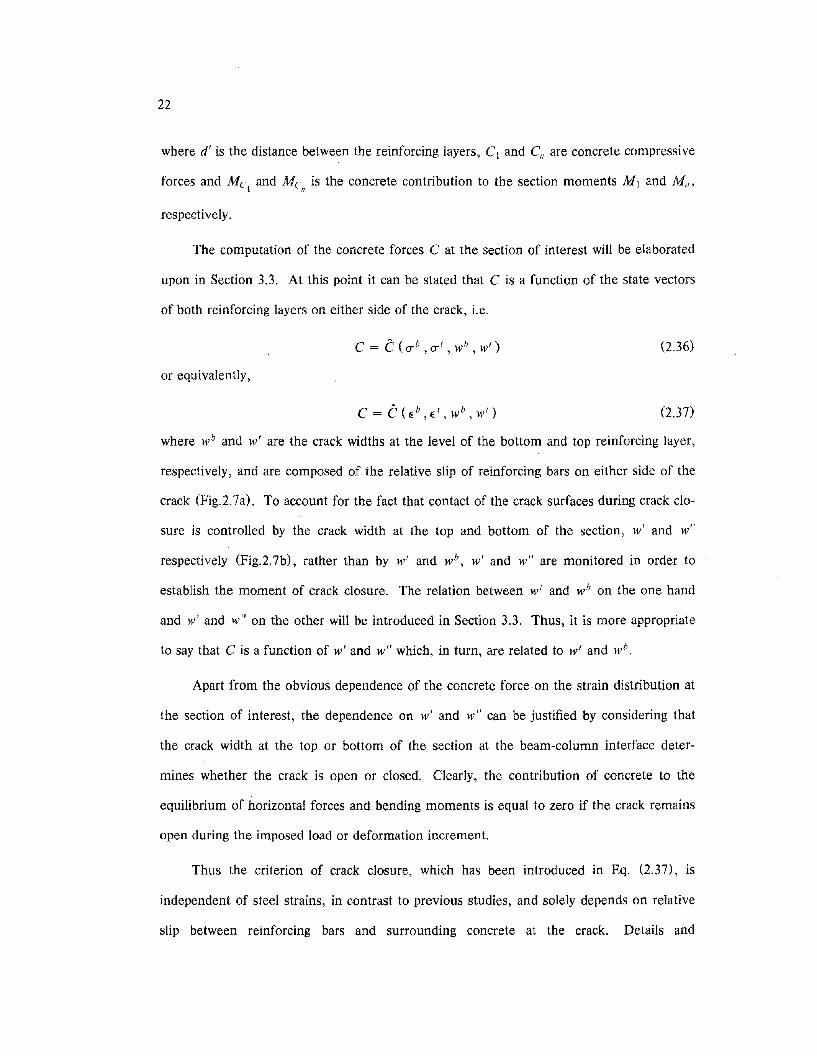
22
where d' is the distance between the reinforcing layers, C j and CII are concrete compressive
forces and Me and Me is the concrete contribution to the section moments M] and M",I n
respectively.
The computation of the concrete forces C at the section of interest will be elaborated
upon in Section 3.3. At this point it can be stated that C is a function of the state vectors
of both reinforcing layers on either side of the crack, i.e.
(2.36)
or equivalently,
(2.37)
where wb and w' are the crack widths at the level of the bottom and top reinforcing layer,
respectively, and are composed of the relative slip of reinforcing bars on either side of the
crack (Fig.2.7a). To account for the fact that contact of the crack surfaces during crack clo-
sure is controlled by the crack width at the top and bottom of the section, w' and wit
respectively (Fig.2.7b), rather than by Wi and wb , w' and wit are monitored in order to
establish the moment of crack closure. The relation between Wi and wb on the one hand
and w' and w" on the other will be introduced in Section 3.3. Thus, it is more appropriate
to say that C is a function of w' and wit Which, in turn, are related to w' and wb•
Apart from the obvious dependence of the concrete force on the strain distribution at
the section of interest, the dependence on w' and wit can be justified by considering that
the crack width at the top or bottom of the section at the beam-column interface deter-
mines whether the crack is open or closed. Clearly, the contribution of concrete to the
equilibrium of horizontal forces and bending moments is equal to zero if the crack remains
open during the imposed load or deformation increment.
Thus the criterion of crack closure, which has been introduced in Eq. (2.37), is
independent of steel strains, in contrast to previous studies, and solely depends on relative
slip between reinforcing bars and surrounding concrete at the crack. Details and
23
experimental evidence of the introduced formulation are deferred until Section 3.3.
Eqs. (2.32)-(2.35) can be rewritten in incremental form by substituting £T + ~£T for £T,
C +aC for C and M +aM for M and considering that the equilibrium at the previous
load step has been satisfied within a very small residual, which is neglected, resulting in
au,:A 1 d'+aMc = ~Mnn
After expanding Eqs. (2.30)-(2.31)
(2.38)
(2.39)
(2.40)
(2.41)
(2.42)
(2.43)
(2.44)
(2.45)
it becomes apparent that the hysteretic response of the joint is described by the time history
of eight increments at the boundaries of the joint, (Fig.2.8), which can be uniquely deter-
mined at each load step from the eight nonlinear equations written above.
The numerical scheme to efficiently solve the above system of nonlinear equations is
presented in Chapter 4.
The form of Eqs. (2.38)-(2.45) seems to suggest that end moment increments aMI
and aMn represent the imposed boundary conditions leading to a numerical loading scheme
with force control. However, due to history dependent strength and stiffness deterioration
associated with reinforcing bar slippage through the joint, numerical tests with deformation
control appear to be a more appropriate choice. This led to a procedure of imposing two
slip increments, one at each boundary of the joint, as the necessary boundary conditions in
the case of interior joints.
24
2.2.2. Exterior joints
Significant differences with respect to reinforcement arrangement exist between inte
rior and exterior joints leading to somewhat different global equilibrium equations and a
different set of boundary conditions in the two cases.
In the case of exterior joints it is common design practice to anchor all reinforcing
bars of the girder framing into the column by means of 90" hooks (Fig.2.9a). An extensive
experimental study into the bond behavior of hooked bars in RIC joints, conducted by Eli
gehausen et al. (24), revealed that the behavior of hooked anchorages in confined concrete
can be described analytically by replacing the hook by an equivalent anchorage length of
I'd = 5 db extending beyond the beginning of the hook (Fig.2.9b), where db is the bar
diameter. In addition, a bond stress-slip relation based on a different monotonic envelope
curve is assigned to the hook-equivalent portion of the bar. Based on the above conclu
sions the actual system (Fig.2.9a) can be considered analytically equivalent to the simplified
system shown in Fig. 2.9b, on which the following derivations are based.
In contrast to interior joints only one girder end moment is applied on exterior joints,
acting at section n as indicated in Fig. 2.9b. The second boundary of the joint region lies
within the joint at section 1, coinciding with the end of reinforcing bars rather than with the
physical boundary of the joint panel region (Fig.2.9b).
It is clear that Eqs. (2.38) and (2.40), representing the global equilibrium of horizon
tal forces and bending moments at section 1 are not applicable in this case. Since the
number of unknown increments at the boundaries of the joint remains the same as in the
case of interior joints, two boundary conditions need to be imposed at section 1 to replace
the global equilibrium equations.
Considering that no end forces can be present at the free end of anchored bars, leads
to two conditions
25
which allows to conclude that
auf = 0
auf = 0
(2.46)
(2.47)
(2.48)
(2.49)
at all times.
Eqs. (2.42)-(2.45) can thus be simplified by setting equal to zero the stress increments
at section 1 yielding four equations,
aui = tfl auf (2.50)
au t = t~l auf (2.50
au~ = t\l au\ (2.52)
au ~ = t~l au\ (2.53)
which are complemented by Eqs. (2.39) and (2.41) expressing the equilibrium of forces and
moments at section n.
For reasons elaborated upon in the previous section a deformation increment at sec
tion n rather than the end mornent increment aM., is chosen to represent the imposed
excitation, leading to six nonlinear equations in six unknown increments. The numerical
scheme to efficiently solve the above system of equations, although very similar to the solu
tion scheme for interior joints, involves some simplifications which will be presented in
Chapter 4.
2.2.3. Beam inelastic regions
Several complications arise when attempting to arrive at a strictly consistent formula
tion of hysteretic behavior of beam inelastic regions. These complications are largely con
nected to the fact that the locations where cracks will form are not known a priori and
therefore a subdivision of the girder inelastic region into several subregions, as described at
26
the beginning of this chapter, is only possible during the course of computations. In addi
tion, the assumption that the cracks form perpendicular to the axis of the girder is only
approximately true.
It is the intention of this section to show that the analytical prediction of hysteretic
behavior of beam inelastic regions can be accomplished within the framework of the pro
posed analytical model, once the position of cracks in the final cracking stage of the girder
is known, and if it can be assumed with sufficient accuracy that the cracks run perpendicular
to the girder axis. Moreover an attempt is made to describe the mechanical behavior of the
cracked girder suggesting the refinements needed to arrive at a better model in future stu
dies.
A part of a beam inelastic region in its final cracking stage is shown in Fig. 2.10a. The
final cracking stage indicates that no additional cracks will form between the existing cracks,
due to the fact that maximum concrete tensile stresses, which may build up between cracks
through bond, remain smaller than the tensile strength of concrete in the ensuing time his
tory analysis (Fig.2.lOc).
Under the assumption that cracks run perpendicular to the axis of the girder in the
inelastic region shown in Fig. 2.10a, a simple comparison between Figs. 2.11 and 2.6
suffices to bring to light the similarities in the behavior of an interior joint and a beam ine
lastic region, the only difference being the sense of moments applied at the boundaries of
the subregions.
Following the above conclusion all formulas derived in Section 2.2.1 can be used to
describe the hysteretic behavior of girders subjected to cyclic moment reversals beyond the
final cracking stage, provided that the initial location of cracks is known. In particular, Eqs.
(2.38)- (2.45) suffice to determine the eight unknown increments, once two load or defor
mation increments, one at each boundary, are specified as boundary conditions.
27
Numerical complications arise in the case of beam inelastic regions due to the fact
that a loading scheme using deformation control, as in the case of joints, is not feasible.
This is attributable to the fact that it is not easily possible to assign rotations along the span
of the girder. By contrast moments can be computed with the aid of simple statics. Thus
AMl and AM" in Eqs. (2.40)-(2.41) represent the imposed excitation in the case of beam
inelastic regions leading to a numerical loading scheme with force control.
The implementation of the inelastic region model described above within the frame-
work of the present study is rather straightforward. The limitation of the model lies in the
fact that the location of cracks within the beam inelastic region has to be known a priori. It
is possible, however, to remove this limitation in future studies and develop an analytical
scheme for predicting the hysteretic behavior of girders up to the final cracking stage, and
determining the location of cracks at that instant. A way of accomplishing this is indicated
below.
Clearly, the final crack position depends on the time history of bond deterioration
along the beam reinforcing bars and can only be approximated beforehand with the use of
empirical expressions based on experimental results. In order that a refined analytical
model be capable to predict the development of cracks along the girder under cyclic
moment reversals, it should follow the transfer of steel stresses into the surrounding con-
crete, thus establishing the distribution of concrete stresses along the reinforcing bars
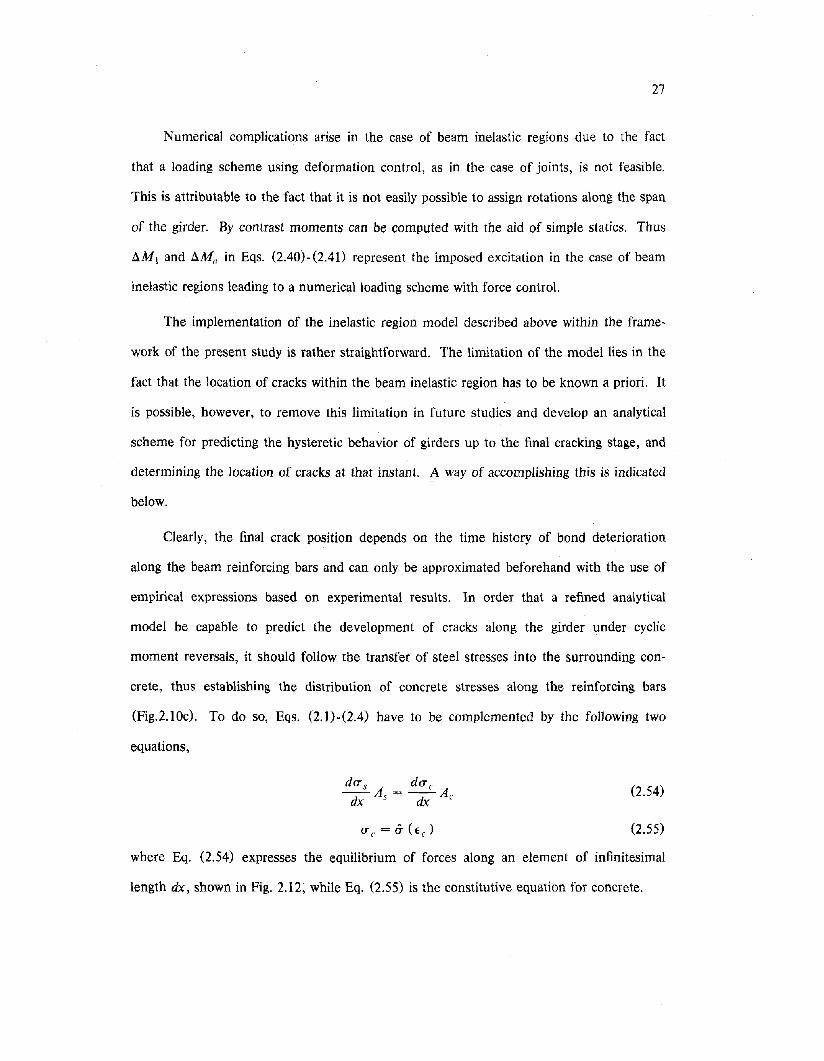
(Fig.2.10c). To do so, Eqs. (2.1).(2.4) have to be complemented by the following two
equations,
(2.54)
(2.55)
where Eq. (2.54) expresses the equilibrium of forces along an element of infinitesimal
length dx, shown in Fig. 2.12, while Eq. (2.55) is the constitutive equation for concrete.

28
Uncertainties arise in choosing an effective concrete area Ac around a layer of rein
forcing bars. Moreover it becomes apparent that the addition of two equations to the initial
set of four increases the computational effort.
Beyond the inclusion of Eqs. (2.54) and (2.55) the analytical model should be capable
of automatically generating a girder subdivision into new subregions as additional cracks
form, creating new boundaries as described in the introduction to this chapter.
Obviously the above refinements to the proposed model do not introduce any concep
tional difficulties. However, they introduce a significant increase in the complexity of the
model resulting in increased computational effort. These refinements will not be pursued
here.
29
CHAPTER 3
MATERIAL MODELS
Before proceeding to the presentation of a numerical scheme for efficiently solving the
nonlinear system of equations pertinent to the case under consideration, it is necessary to
discuss the different models that can be used in Eqs. (2.3) and (2.4) for describing the
material constitutive relations for steel stress-strain and bond stress-slip. In addition, a
model for cracked RIC sections with an appropriate concrete stress-strain relation needs to
be introduced for computing the concrete contribution to the equilibrium of forces and
bending moments in Eqs. (2.38)-(2.41).
3.1. Steel stress-strain relation
Before proposing a material model to describe the hysteretic behavior of reinforcing
bars under generalized strain histories some preliminary remarks are in order.
The range of cyclic strain history, which reinforcing bars are likely to be subjected to,
differs significantly from that of structural steel members in that compressive strains are not
as large as tensile strains. This is caused by an interplay of bond deterioration and crack
closure, which prevents reinforcing bars from excessive yielding in compression before
spalling of concrete cover has occurred. As long as a section is uncracked or the crack pre
viously formed is closed and the concrete cover has not spalled, compressive forces are
largely carried by concrete, while, in case that the crack is open, bond deterioration in the
vicinity of the crack prevents any large force build-up in reinforcing bars. This results in
small negative steel strain increments and consequently in small compressive steel stress
increments. In either case bars under compression hardly ever enter into the compressive
strain range before the concrete cover has spalled. Thus cyclic strain histories of reinforc
ing bars tend to center about an ever increasing tensile plastic strain.
30
Another important consideration in the search for an appropriate model is its numeri-
cal efficiency. As it will become apparent in Chapter 4, a large number of iterations, and
consequently evaluations of any steel stress-strain function, is performed at each load step.
This necessitates the use of a simple material model. Counteracting the need for simplicity
is the requirement of accuracy, which is based on the· observation that cracks running
through the depth of the member can remain open during moment reversals, causing the
hysteretic response of the section to be solely controlled by the behavior of reinforcing
steel. In particular, the Bauschinger effect has to be accounted for. This fact destroys any
hope for successfully using a simple bilinear model in any but a monotonic loading case.
Obviously, the above requirements call for a compromise between simplicity and accuracy.
There is a host of nonlinear analytical models published in the literature. To a large
extent they are devised to represent the cyclic behavior of structural steel thus failing to
take advantage of the special strain history of reinforcing steel in reducing the complexity
of the model. The most successful among them fall in the group of variable parameter
models, with the parameters of the model varying with strain history. Within this group
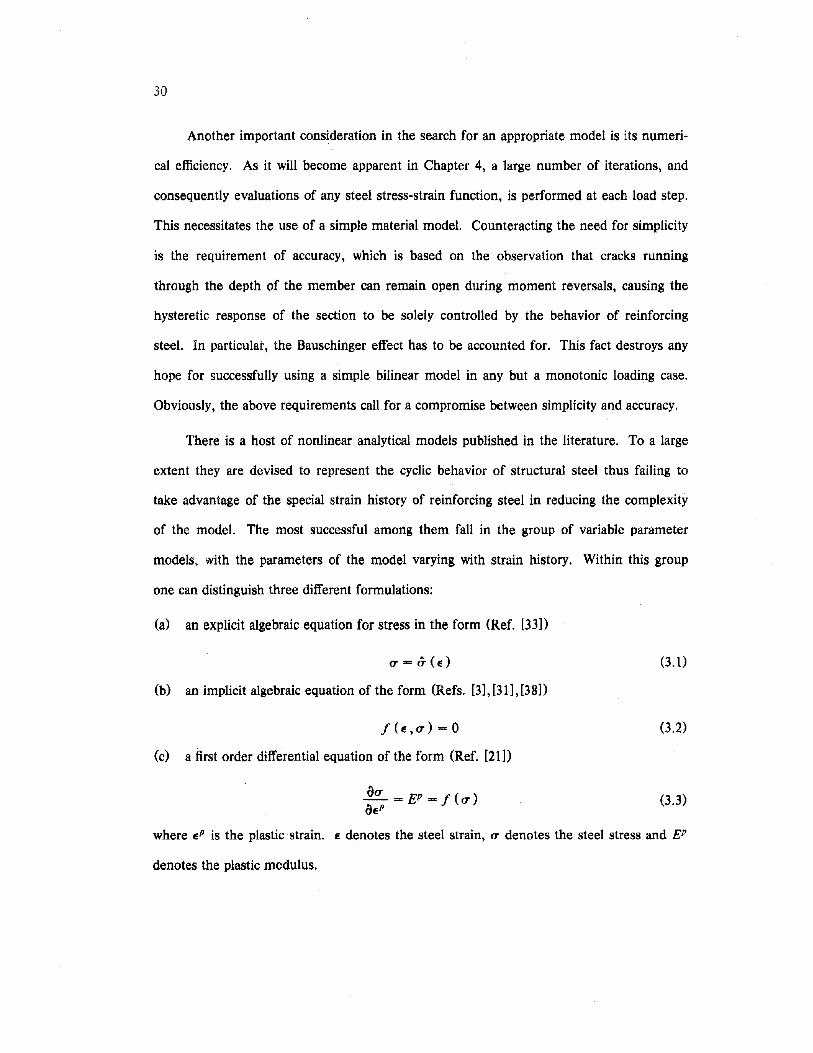
one can distinguish three different formulations:
(a) an explicit algebraic equation for stress in the form (Ref. [33])
<7=0-(£)
(b) an implicit algebraic equation of the form (Refs. [3],[31],[38])
/(£,<7) =0
(c) a first order differential equation of the form (Ref. [21])
(3.0
(3.2)
(3.3)
where EP is the plastic strain. £ denotes the steel strain, <7 denotes the steel stress and EP
denotes the plastic modulus.
31
Option (a) seems to be. the most attractive since it strikes a good balance between
simplicity and accuracy for the problem at hand. Based on results presented in two recent
studies, [18], [45], it was concluded that the explicit formulation originally proposed by
Giuffre and Pinto and later implemented in Ref. [33] offers numerical efficiency, while
agreeing very well with experimental results from cyclic tests on reinforcing steel bars.
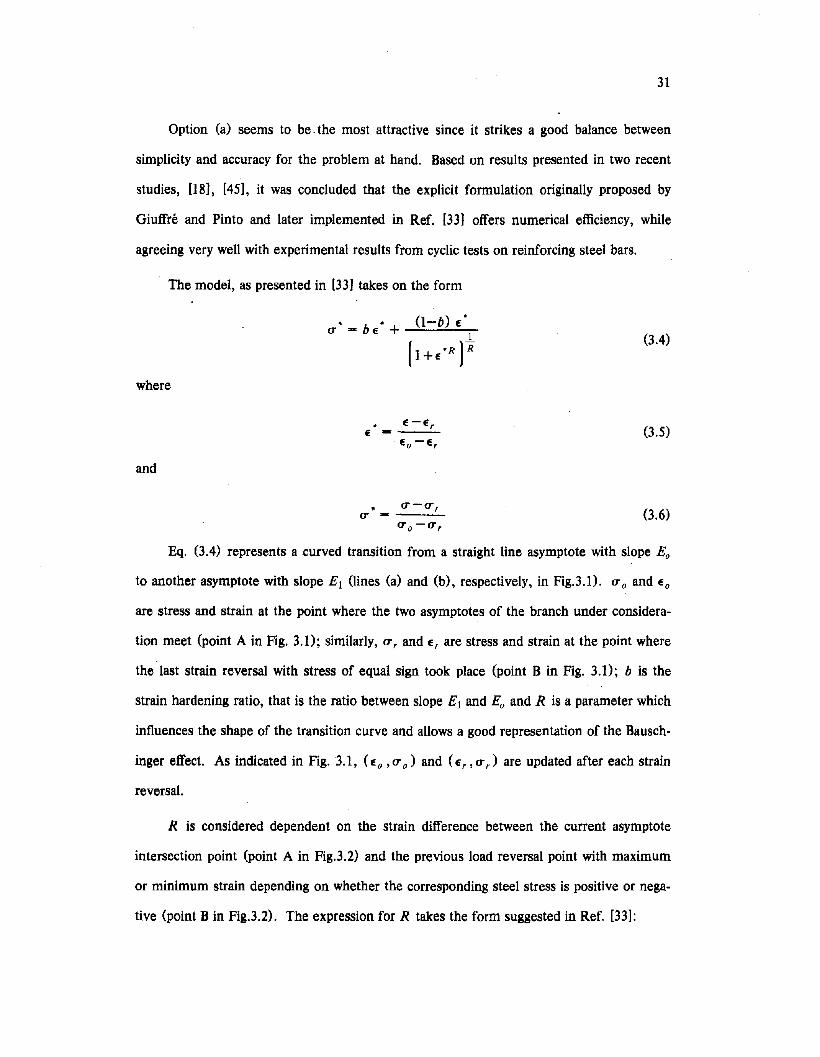
The model, as presented in [33] takes on the form
(l-b) E*1
(1+E*RP~-(3.4)
where
* E -E,E - -----'--
and
* (T-(T,(T - ---'--
(3.5)
(3.6)
Eq. (3.4) represents a curved transition from a straight line asymptote with slope Eo
to another asymptote with slope E1 (lines (a) and (b), respectively, in Fig.3.0. (To and Eo
are stress and strain at the point where the two asymptotes of the branch under considera-
tion meet (point A in Fig. 3.0; similarly, (T, and E, are stress and strain at the point where
the last strain reversal with stress of equal sign took place (point B in Fig. 3.0; b is the
strain hardening ratio, that is the ratio between slope Eland Eo and R is a parameter which
influences the shape of the transition curve and allows a good representation of the Bausch
inger effect. As indicated in Fig. 3.1, (Eo, (T 0) and (E" (T,) are updated after each strain
reversal.
R is considered dependent on the strain difference between the current asymptote
intersection point (point A in Fig.3.2) and the previous load reversal point with maximum
or minimum strain depending on whether the corresponding steel stress is positive or nega-
tive (point B in Fig.3.2). The expression for R takes the form suggested in Ref. [33]:
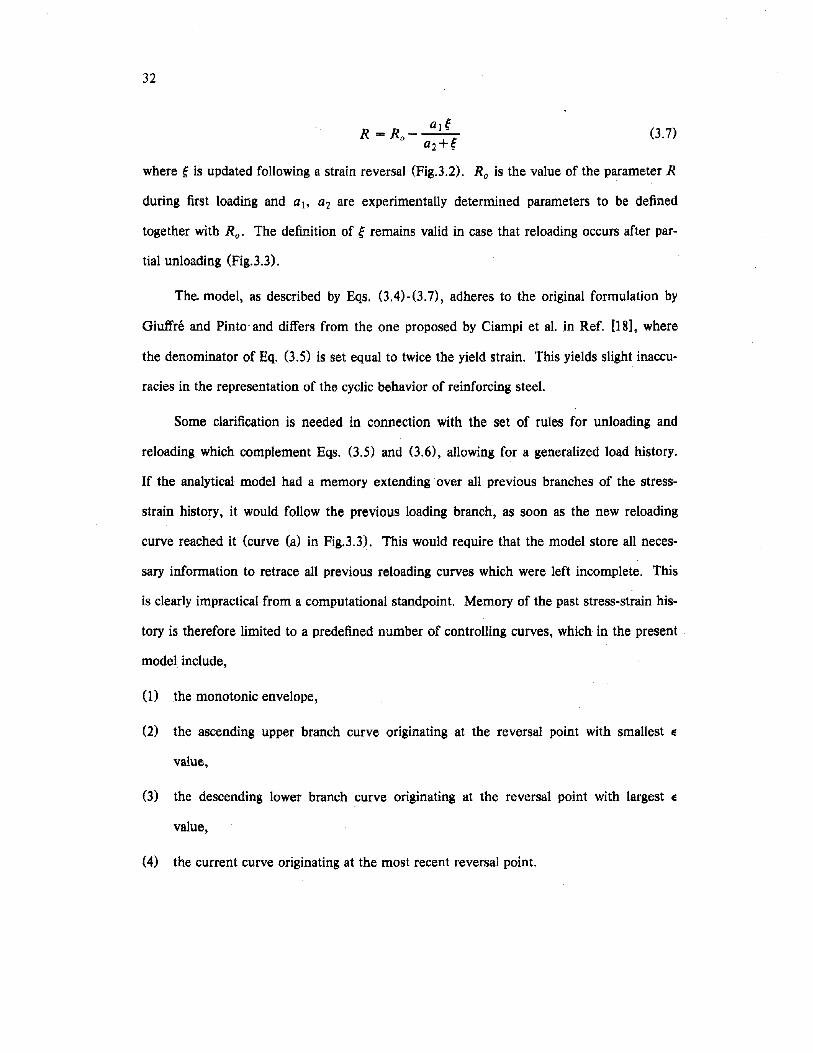
(3.7)
32
R==R -~o a2+e
where eis updated following a strain reversal (Fig.3.2). Ro is the value of the parameter R
during first loading and at. a2 are experimentally determined parameters to be defined
together with Ro • The definition of eremains valid in case that reloading occurs after par-
tial unloading (Fig.3.3).
The. model, as described by Eqs. (3.4)-(3.7), adheres to the original formulation by
Giuffre and Pinto'and differs from the one proposed by Ciampi et al. in Ref. [18], where
the denominator of Eq. (3.5) is set equal to twice the yield strain. This yields slight inaccu-
racies in the representation of the cyclic behavior of reinforcing steel.
Some clarification is needed in connection with the set of rules for unloading and
reloading which complement Eqs. (3.5) and (3.6), allowing for a generalized load history.
If the analytical model had a memory extending over all previous branches of the stress-
strain history, it would follow the previous loading branch, as soon as the new reloading
curve reached it (curve (a) in Fig.3.3). This would require that the model store all neces-
sary information to retrace all previous reloading curves which were left incomplete. This
is clearly impractical from a computational standpoint. Memory of the past stress-strain his-
tory is therefore limited to a predefined number of controlling curves, which in the present
model include,
(1) the monotonic envelope,
(2) the ascending upper branch curve originating at the reversal point with smallest E
value,
(3) the descending lower branch curve originating at the reversal point with largest E
value,
(4) the current curve originating at the most recent reversal point.
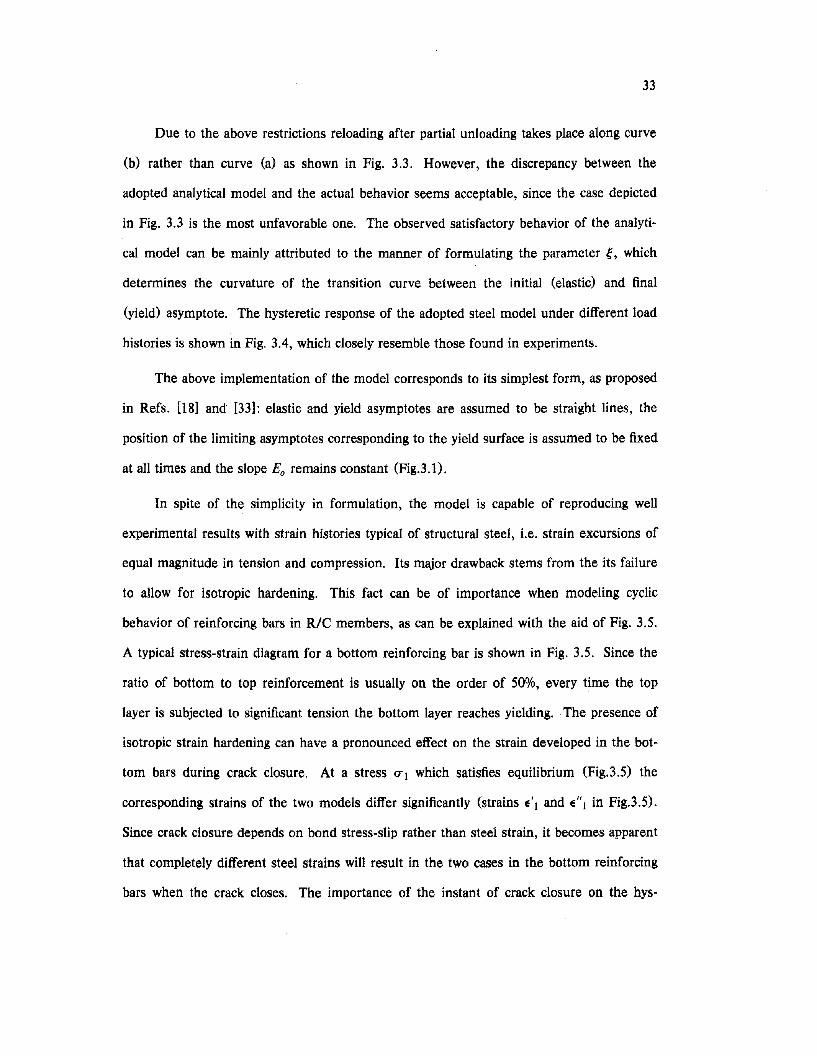
33
Due to the above restrictions reloading after partial unloading takes place along curve
(b) rather than curve (a) as shown in Fig. 3.3. However, the discrepancy between the
adopted analytical model and the actual behavior seems acceptable, since the case depicted
in Fig. 3.3 is the most unfavorable one. The observed satisfactory behavior of the analyti
cal model can be mainly attributed to the manner of formulating the parameter g, which
determines the curvature of the transition curve between the initial (elastic) and final
(yield) asymptote. The hysteretic response of the adopted steel model under different load
histories is shown in Fig. 3.4, which closely resemble those found in experiments.
The above implementation of the model corresponds to its simplest form, as proposed
in Refs. US] and [33]: elastic and yield asymptotes are assumed to be straight lines, the
position of the limiting asymptotes corresponding to the yield surface is assumed to be fixed
at all times and the slope Eo remains constant (Fig.3.l).
In spite of the simplicity in formulation, the model is capable of reproducing well
experimental results with strain histories typical of structural steel, Le. strain excursions of
equal magnitude in tension and compression. Its major drawback stems from the its failure
to allow for isotropic hardening. This fact can be of importance when modeling cyclic
behavior of reinforcing bars in RIC members, as can be explained with the aid of Fig. 3.5.
A typical stress-strain diagram for a bottom reinforcing bar is shown in Fig. 3.5. Since the
ratio of bottom to top reinforcement is usually on the order of 50%, every time the top
layer is subjected to significant tension the bottom layer reaches yielding. The presence of
isotropic strain hardening can have a pronounced effect on the strain developed in the bot
tom bars during crack closure. At a stress <7"1 which satisfies equilibrium (Fig.3.5) the
corresponding strains of the two models differ significantly (strains E'l and E"l in Fig.3.5).
Since crack closure depends on bond stress-slip rather than steel strain, it becomes apparent
that completely different steel strains will result in the two cases in the bottom reinforcing
bars when the crack closes. The importance of the instant of crack closure on the hys-
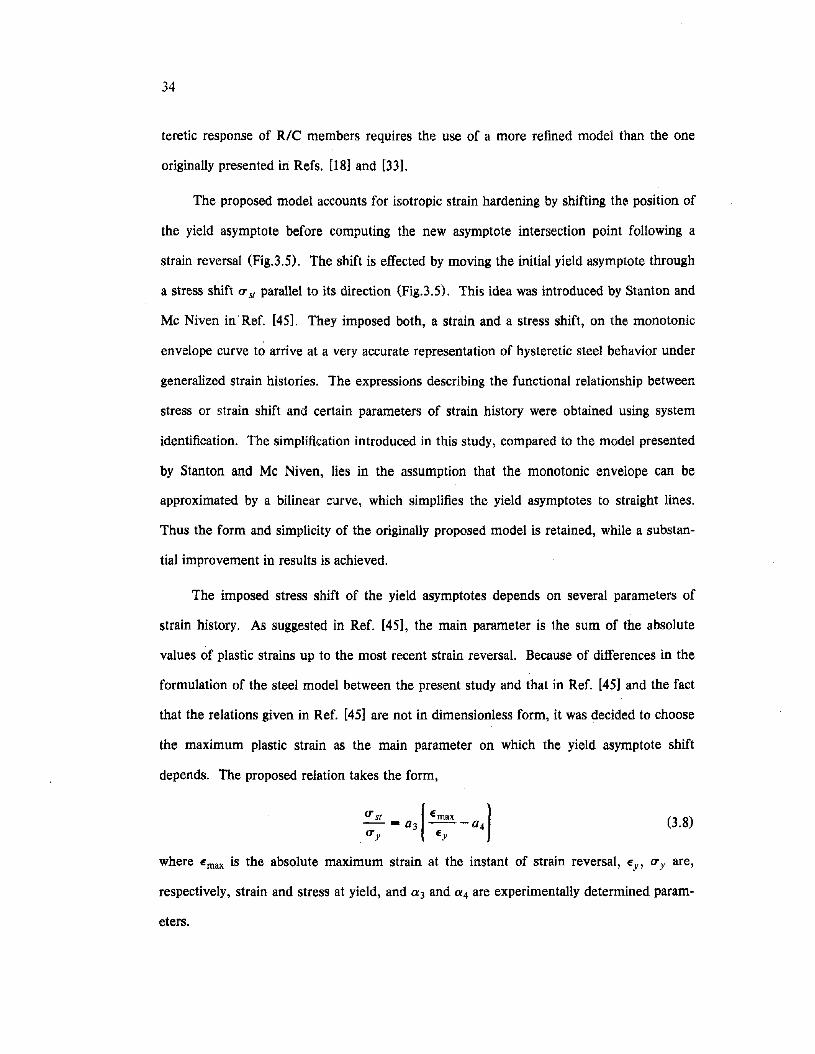
34
teretic response of RIC members requires the use of a more refined model than the one
originally presented in Refs. [18] and [33].
The proposed model accounts for isotropic strain hardening by shifting the position of
the yield asymptote before computing the new asymptote intersection point following a
strain reversal (Fig.3.5). The shift is effected by moving the initial yield asymptote through
a stress shift fT sf parallel to its direction (Fig.3.5). This idea was introduced by Stanton and
Mc Niven in'Ref. [45]. They imposed both, a strain and a stress shift, on the monotonic
envelope curve to arrive at a very accurate representation of hysteretic steel behavior under
generalized strain histories. The expressions describing the functional relationship between
stress or strain shift and certain parameters of strain history were obtained using system
identification. The simplification introduced in this study, compared to the model presented
by Stanton and Mc Niven, lies in the assumption that the monotonic envelope can be
approximated by a bilinear curve, which simplifies the yield asymptotes to straight lines.
Thus the form and simplicity of the originally proposed model is retained, while a substan-
tial improvement in results is achieved.
The imposed stress shift of the yield asymptotes depends on several parameters of
strain history. As suggested in Ref. [45], the main parameter is the sum of the absolute
values of plastic strains up to the most recent strain reversal. Because of differences in the
formulation of the steel model between the present study and that in Ref. [45] and the fact
that the relations given in Ref. [45] are not in dimensionless form, it was decided to choose
the maximum plastic strain as the main parameter on which the yield asymptote shift
depends. The proposed relation takes the form,
(3.8)
where Emax is the absolute maximum strain at the instant of strain reversal, Ey' fTyare,
respectively, strain and stress at yield, and U3 and U4 are experimentally determined param-
eters.
35
The model used in this study was implemented using the following parameter values:
Ro 20
al = 18.5
a2 = 0.15
a3 0.01
a4 7
With the exception of the last two parameters all values were taken from Ref. [33].
Comparison of analytical with experimental results obtained from cyclic tests on rein
forcing bars (Ref.[31]) is shown in Figs. 3.6 and 3.7. Fig. 3.6 depicts a stress-strain history
typical of top reinforcing bars where yielding in compression is very limited. Fig. 3.6a
presents the experimental results, while Figs. 3.6b and 3.6c show the analytical results for a
model with and without isotropic strain hardening respectively. Similar results are
presented in Fig. 3.7 for a stress-strain history typical of bottom reinforcing bars. The accu
racy achieved with the model which includes isotropic strain hardening is seen to be very
satisfactory. At the same time the model is almost as simple and computationally efficient
as the one which does not allow for isotropic strain hardening.
3.2. Bond stress-slip model
An accurate formulation of the bond stress-slip relation between reinforcing bars and
surrounding concrete under random cyclic excitations is of great importance to any analyti
cal model attempting to describe the hysteretic response of reinforced concrete members.
Difficulties facing experimentalists regarding simulation of actual bond conditions in struc
tures, considerable scatter of results and inherent inaccuracies of data reduction delayed the
development of a general model. A thorough experimental investigation on the behavior
of anchored bars subjected to cyclic load reversals was presented by Viwathanatepa et al. in
Ref. [51]. This study was recently complemented by Eligehausen et al. in Ref. [23]. In
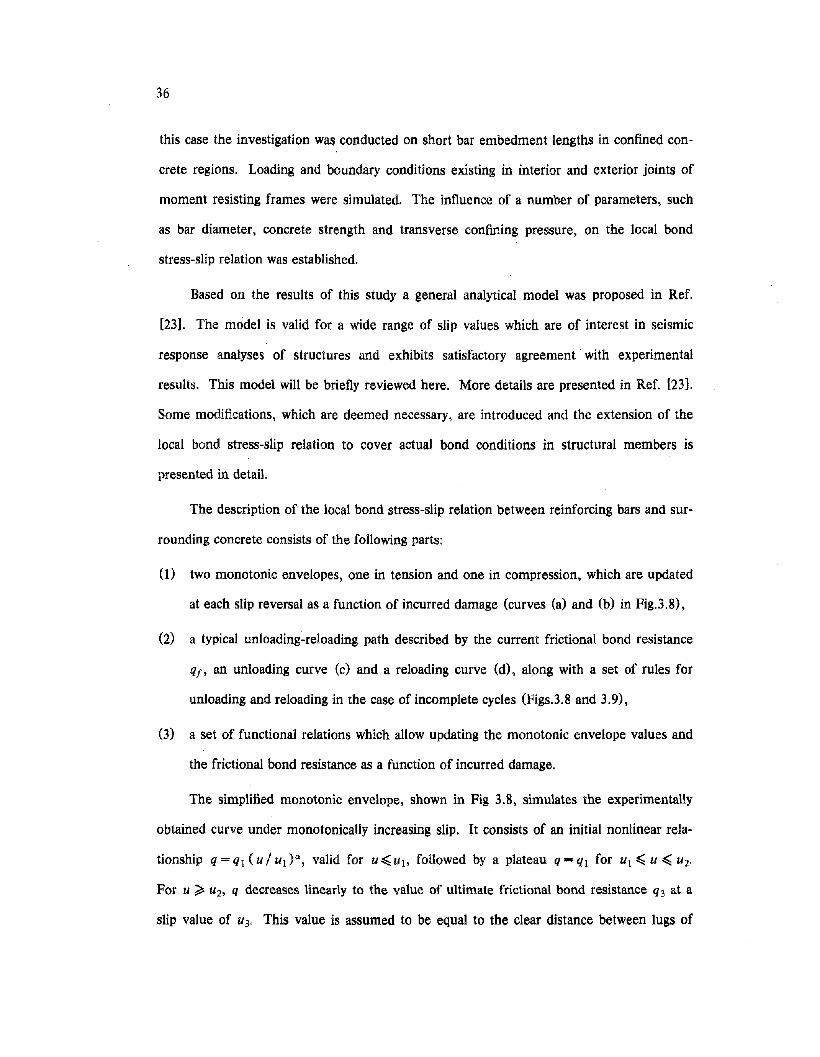
36
this case the investigation was conducted on short bar embedment lengths in confined con
crete regions. Loading and boundary conditions existing in interior and exterior joints of
moment resisting frames were simulated. The influence of a number of parameters, such
as bar diameter, concrete strength and transverse confining pressure, on the local bond
stress-slip relation was established.
Based on the results of this study a general analytical model was proposed in Ref.
[23]. The model is valid for a wide range of slip values which are of interest in seismic
response analyses of structures and exhibits satisfactory agreement with experimental
results. This model will be briefly reviewed here. More details are presented in Ref. [23].
Some modifications, which are deemed necessary, are introduced and the extension of the
local bond stress-slip relation to cover actual bond conditions in structural members is
presented in detail.
The description of the local bond stress-slip relation between reinforcing bars and sur
rounding concrete consists of the following parts:
(I) two monotonic envelopes, one in tension and one in compression, which are updated
at each slip reversal as a function of incurred damage (curves (a) and (b) in Fig.3.8),
(2) a typical unloading~reloading path described by the current frictional bond resistance
qt, an unloading curve (c) and a reloading curve (d), along with a set of rules for
unloading and reloading in the case of incomplete cycles (Figs.3.8 and 3.9),
(3) a set of functional relations which allow updating the monotonic envelope values and
the frictional bond resistance as a function of incurred damage.
The simplified monotonic envelope, shown in Fig 3.8, simulates the experimentally
obtained curve under monotonically increasing slip. It consists of an initial nonlinear rela
tionship q = qi (u / UI )''', valid for U~ Ur. followed by a plateau q = qi for Uj ~ U ~ Uz.
For u ~ Uz, q decreases linearly to the value of ultimate frictional bond resistance q3 at a
slip value of U3' This value is assumed to be equal to the clear distance between lugs of
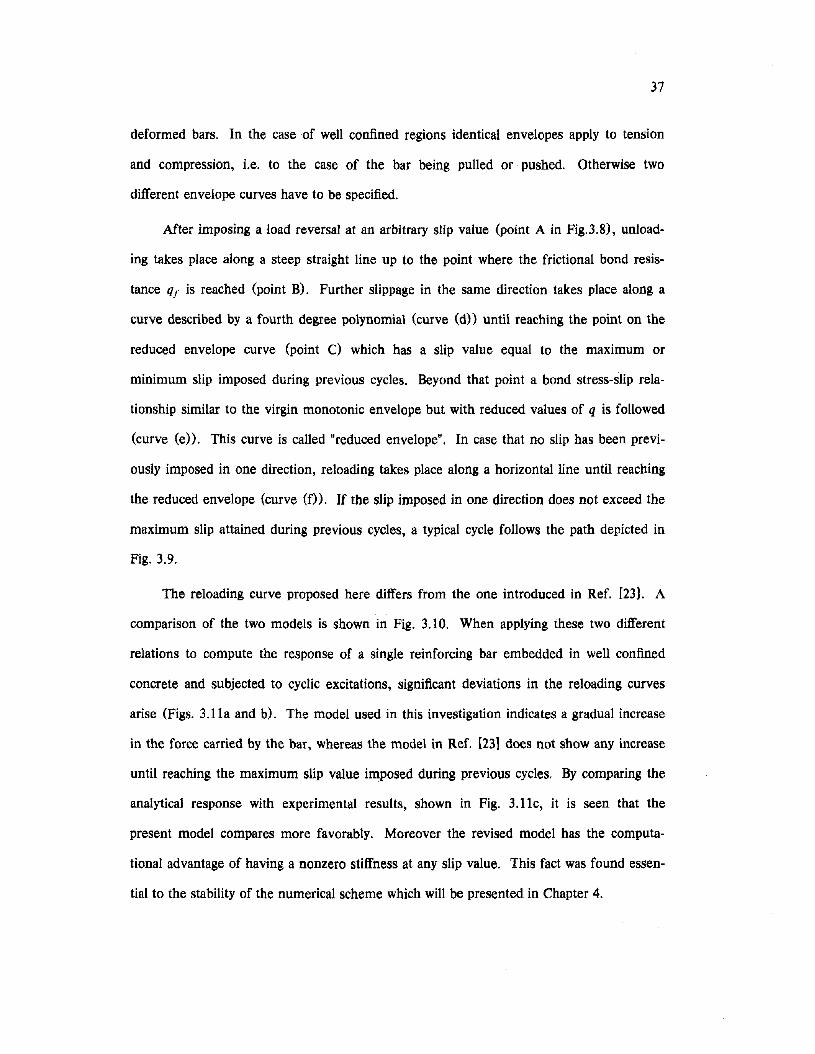
37
deformed bars. In the case of well confined regions identical envelopes apply to tension
and compression, i.e. to the case of the bar being pulled or pushed. Otherwise two
different envelope curves have to be specified.
After imposing a load reversal at an arbitrary slip value (point A in Fig.3.B), unload
ing takes place along a steep straight line up to the point where the frictional bond resis
tance qJ is reached (point B). Further slippage in the same direction takes place along a
curve described by a fourth degree polynomial (curve (d» until reaching the point on the
reduced envelope curve (point C) which has a slip value equal to the maximum or
minimum slip imposed during previous cycles. Beyond that point a bond stress-slip rela
tionship similar to the virgin monotonic envelope but with reduced values of q is followed
(curve (e». This curve is called "reduced envelope". In case that no slip has been previ
ously imposed in one direction, reloading takes place along a horizontal line until reaching
the reduced envelope (curve (0). If the slip imposed in one direction does not exceed the
maximum slip attained during previous cycles, a typical cycle follows the path depicted in
Fig. 3.9.
The reloading curve proposed here differs from the one introduced in Ref. [23]. A
comparison of the two models is shown in Fig. 3.10. When applying these two different
relations to compute the response of a single reinforcing bar embedded in well confined
concrete and subjected to cyclic excitations, significant deviations in the reloading curves
arise (Figs. 3.lla and b). The model used in this investigation indicates a gradual increase
in the force carried by the bar, whereas the model in Ref. [23] does not show any increase
until reaching the maximum slip value imposed during previous cycles. By comparing the
analytical response with experimental results, shown in Fig. 3.11c, it is seen that the
present model compares more favorably. Moreover the revised model has the computa
tional advantage· of having a nonzero stiffness at any slip value. This fact was found essen
tial to the stability of the numerical scheme which will be presented in Chapter 4.
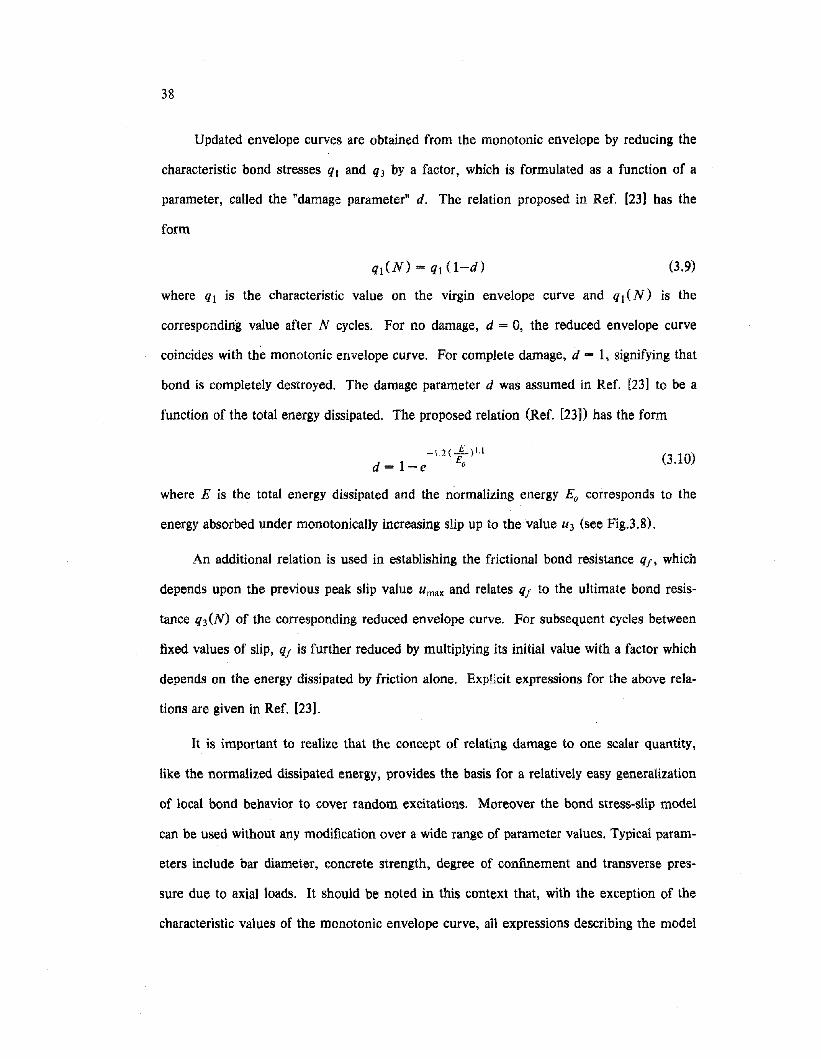
38
Updated envelope curves are obtained from the monotonic envelope by reducing the
characteristic bond stresses ql and q3 by a factor, which is formulated as a function of a
parameter, called the "damage parameter" d. The relation proposed in Ref. [23] has the
form
(3.9)
where q I is the characteristic value on the virgin envelope curve and q I ( N ) is the
corresponding value after N cycles. For no damage, d = 0, the reduced envelope curve
coincides with the monotonic envelope curve. For complete damage, d = 1, signifying that
bond is completely destroyed. The damage parameter d was assumed in Ref. [23] to be a
function of the total energy dissipated. The proposed relation (Ref. [23]) has the form
-l.2(.lL)LlEd=l-e 0
(3.10)
where E is the total energy dissipated and the normalizing energy Eo corresponds to the
energy absorbed under monotonically increasing slip up to the value U3 (see Fig.3.8).
An additional relation is used in establishing the frictional bond resistance qf' which
depends upon the previous peak slip value Umax and relates qf to the ultimate bond resis
tance q3(N) of the corresponding reduced envelope curve. For subsequent cycles between
fixed values of slip, qf is further reduced by multiplying its initial value with a factor which
depends on the energy dissipated by friction alone. Explicit expressions for the above rela-
tions are given in Ref. [23].
It is important to realize that the concept of relating damage to one scalar quantity,
like the normalized dissipated energy, provides the basis for a relatively easy generalization
of local bond behavior to cover random excitations. Moreover the bond stress-slip model
can be used without any modification over a wide range of parameter values. Typical param-
eters include bar diameter, concrete strength, degree of confinement and transverse pres-
sure due to axial loads. It should be noted in this context that, with the exception of the
characteristic values of the monotonic envelope curve, all expressions describing the model
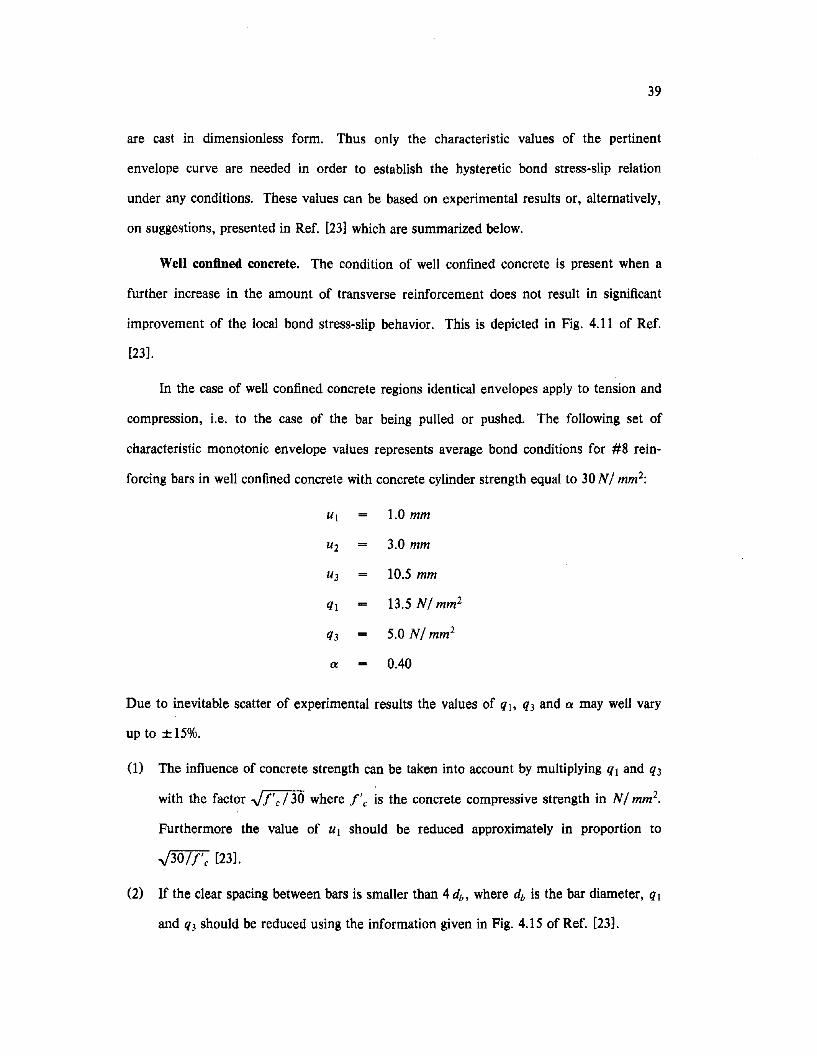
39
are cast in dimensionless form. Thus only the characteristic values of the pertinent
envelope curve are needed in order to establish the hysteretic bond stress-slip relation
under any conditions. These values can be based on experimental results or, alternatively,
on suggestions, presented in Ref. [23] which are summarized below.
Well confined concrete. The condition of well confined concrete is present when a
further increase in the amount of transverse reinforcement does not result in significant
improvement of the local bond stress-slip behavior. This is depicted in Fig. 4.11 of Ref.
[23].
In the case of well confined concrete regions identical envelopes apply to tension and
compression, Le. to the case of the bar being pulled or pushed. The following set of
characteristic monotonic envelope values represents average bond conditions for #8 rein
forcing bars in well confined concrete with concrete cylinder strength equal to 30 N / mm2:
Ul 1.0 mm
U2 3.0 mm
U3 10.5 mm
ql 13.5 N/ mm2
q3 5.0 N/ mm2
a 0.40
Due to inevitable scatter of experimental results the values of qb q3 and a may well vary
up to ±15%.
(1) The influence of concrete strength can be taken into account by multiplying ql and q3
with the factor .Jf' c / 30 where f' c is the concrete compressive strength in N/ mm2•
Furthermore the value of Ul should be reduced approximately in proportion to
.J30/1'c [23].
(2) If the clear spacing between bars is smaller than 4 db, where db is the bar diameter, ql
and q3 should be reduced using the information given in Fig. 4.15 of Ref. [23].
40
(3) The influence of external transverse pressure (e.g. axial compressive column forces)
can be taken into account by increasing ql and q3 according to Fig. 4.17 of Ref. [23].
(4) If #6 or #10 bars are used, it is recommended to increase or decrease, respectively,
ql by 10% [23].
(5) If the related rib area aSR differs from the value 0.065, its influence should be taken
into account by modifying UI and ql using the data given in Fig.2.4 of Ref. [23].
(6) The given values for ul> U2 and U3 should be multiplied with the factor cd 10.5,
where Cl is the clear spacing between lugs, but this modification should not be greater
than ±30%.
(7) The unloading slope is equal to 180 N / mm 2 for #8 bars. It should be modified in the
same way as ql for different conditions.
Unconfined concrete. Unconfined concrete occurs in the column cover region of inte
rior and exterior joints in RiC frames (Fig.3.12). It is possible to generalize the local bond
stress-slip relation for confined concrete to cover conditions in unconfined concrete regions
by introducing following modifications (Fig.3.12):
(1) a different monotonic envelope is specified for positive slip values than for negative
slip values, Le. for the case that the bar is pulled and the case that the bar is pushed,
respectively,
(2) the normalizing energy Eo used in the computation of damage is chosen to be the
largest between E/ and Eo-' which are, respectively, the areas under the monotonic
envelopes for positive and negative slip values up to slip value U3' To take into
account different rates of damage in the two directions of loading, the pertinent total
dissipated energies E, used to compute the reduced envelopes, are multiplied by an
amplification factor {3, which is different for the two cases. Similar rules for comput
ing damage apply to the friction part of the curves.
41
The following envelope values are suggested for #8 bars in unconfined concrete with
cylinder strength equal to 30 N / mm2 (Ref. [23]):
Envelope values for the case that the bar is pulled (Fig.3.12)
Uj 0.3 mm
U2 0.3 mm
U3 1.0 mm
qj 5.0 N/ mm2
q3 0
a 0.40
Envelope values for the case that the bar is pushed (Fig.3.12)
Uj 1.0 mm
U2 3.0 mm
U3 10.5 mm
qj 20.0 N/ mm2
q3 7.5 N/ mm2
a 0.40
The same modifications as in the case of confined concrete apply for different bar
diameter and concrete strength. More details may be found in Ref. [23].
Hooks in confined concrete. Identical envelopes apply in tension and compression.
The following envelope values have been suggested in Ref. [24] for #8 bars in concrete
with cylinder strength equal to 30 N / mm2:
For hooks bent against the direction of casting,
Uj 1.0 mm
U2 3.0 mm
U3 100.0 mm
42
ql 22.0 N/ mm2
q3 4.0 N/ mm2
a 0.20
For hooks bent in the direction of casting the same values can be used, except for
ul=2mm.
3.3. Reinforced concrete section model
By examining Eqs. (2.38)-(2.45) or (2.50)-(2.53) it becomes apparent that, with the
exception of the concrete contribution to the equilibrium of horizontal forces and bending
moments at the end sections of the subregion, all increments describing the hysteretic
response refer to reinforcing steel. This is a consequence of neglecting the influence of
concrete deformations along the reinforcing bar, as was already pointed out in Section 2.1.
Nonetheless the problem of steel and concrete interaction has to be taken into account at
the cracked end sections; some means of relating steel variables to corresponding concrete
variables has to be found in order to compute the concrete compressive forces and concrete
bending moments necessary to satisfy equilibrium.
A way of accurately solving this intricate problem is by means of a three-dimensional
finite element analysis. Two particular aspects of the problem can be tackled in this
manner:
(1) the transfer of bond stresses from the concrete region surrounding the reinforcing
bars into the rest of the reinforced concrete member, and
(2) the contact problem at the crack. Due to bar slippage giving rise to crack opening and
closing, generally only a part of the cracked section is in contact and transfers forces.
On the other hand across an open crack only steel forces act. Tracing the time history
of the contact area during the hysteretic response of a cracked RIC section is a rather
complicated problem requiring the use of contact elements.

43
Solving the problem of steel and concrete interaction by means of finite elements
requires a tremendous amount of computation, rendering the analysis of any RIC member
model prohibitively expensive. For this reason it was decided to adopt a considerably
simpler approach for modeling a cracked concrete section. This approach consists of a layer
section model which explicitly addresses the problems mentioned above and incorporates
their effect into the model.
In any layer model of a reinforced concrete section the relative contribution of steel
and concrete to force and moment resultants is determined in three steps. First, steel
strain increments or total strains at the top or bottom reinforcing layer are related to con
crete strain increments or total strains at the same level. In the next step the distribution
of concrete strain increments or total strains over the height of the cross-section is
assumed. Finally, a concrete stress-strain relation connects concrete strains to stresses in
each layer and allows computation of the concrete contribution to the relevant section
forces and moments. The presentation of a new concrete section model will proceed in
precisely the same order.
3.3.1. Cracked section model
Most analytical investigations dealing with the hysteretic behavior of reinforced con
crete members ([8],[22],[38]) are based on a smeared crack approach and have extended
the assumptions of continuum theory for homogeneous materials to reinforced concrete,
which is a composite material.
As a first step, compatibility of strains between reinforcing steel and surrounding con
crete at the section of interest is assumed, relating steel and concrete strains in a very sim
ple manner. This assumption implies perfect bond between steel and concrete along the
reinforcing bars. For uncracked sections such an assumption agrees sufficiently well with
experimental evidence. For cracked sections however the very occurrence of a crack indi
cates local bond damage in the vicinity of a crack as well as loss of compatibility between
44
steel and concrete strains.
In the next step the distribution of concrete strains over the height of the cross
section is usually taken to be linear, based on Bernoulli's assumption of plane sections
remaining plane after deformation. The validity of this assumption in the case of comput
ing the average curvature along a region of the girder between two consecutive cracks
remains unclear. Experiments and accurate finite element analyses can answer the above
question with confidence.
The assumptions of strain compatibility and linear strain distribution lead to a simple
and straightforward way of computing the concrete forces at the section of interest.
Another problem inherent to all previous studies concerns crack closing and activation
of concrete under cyclic load reversal. Because bond stress-slip between reinforcing bars
and surrounding concrete is not explicitly taken into account, crack widths cannot be
estimated and traced as a function of time. Because of this limitation smeared crack models
employ a strain quantity normal to the crack as a means of controlling the contribution of
concrete to the section forces and moments ([8], [22]). Therefore, the concrete at the level
of a reinforcing layer is assumed to pick up stresses normal to the crack only when the con
crete strain at the same level becomes less than the strain at which the crack has opened
(Ref. [8], [22]). Because of the assumed compatibility between steel and concrete strains,
this requires that the steel be subjected to compressive strains before the crack can close. As
experimental evidence suggests [37], (Fig.3.13) , this is not the case and reinforcing steel
strains hardly enter into the compressive range.
Understanding the mechanical behavior at a cracked RIC section can yield insight into
some of the problems and help in developing a reliable section model.
After the bottom reinforcing bars are subjected to tensile forces of significant magni
tude, bond between steel and concrete in the immediate vicinity of the crack is damaged
and a large crack forms at the lower end of the section (Fig.3.14a). Upon reversing the
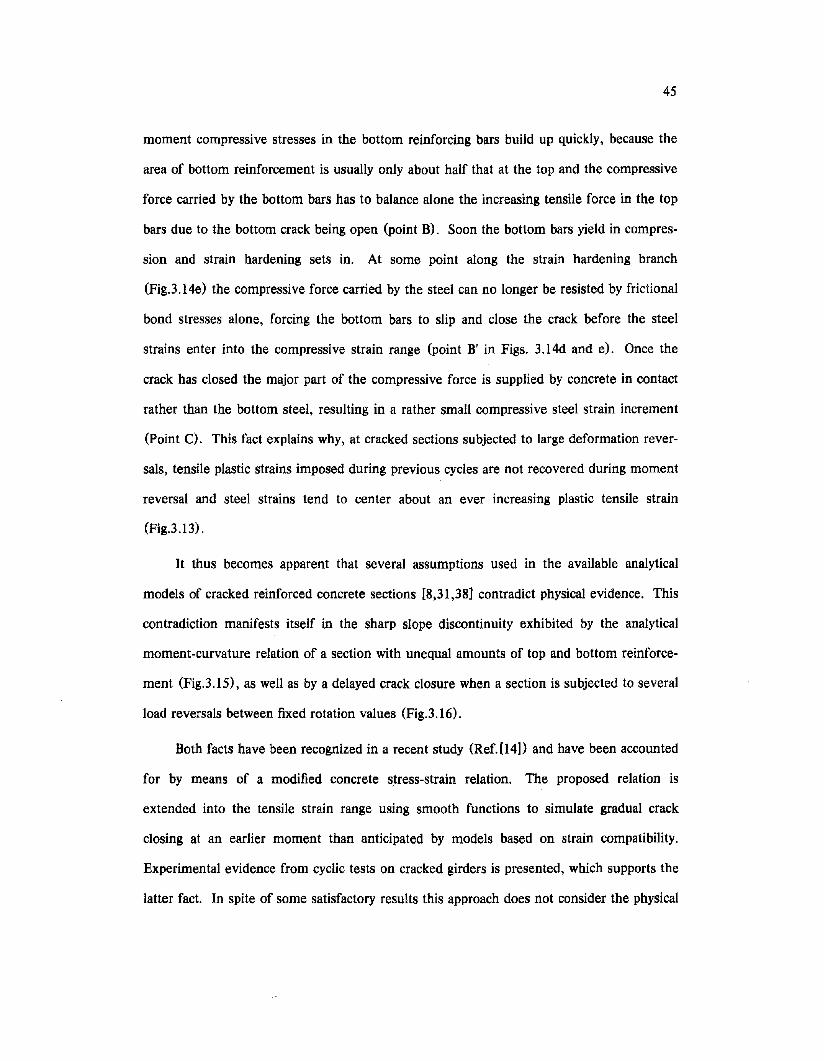
45
moment compressive stresses in the bottom reinforcing bars build up quickly, because the
area of bottom reinforcement is usually only about half that at the top and the compressive
force carried by the bottom bars has to balance alone the increasing tensile force in the top
bars due to the bottom crack being open (point B). Soon the bottom bars yield in compres
sion and strain hardening sets in. At some point along the strain hardening branch
(Fig.3.14e) the compressive force carried by the steel can no longer be resisted by frictional
bond stresses alone, forcing the bottom bars to slip and close the crack before the steel
strains enter into the compressive strain range (point B' in Figs. 3.14d and e). Once the
crack has closed the major part of the compressive force is supplied by concrete in contact
rather than the bottom steel, resulting in a rather small compressive steel strain increment
(Point C). This fact explains why, at cracked sections subjected to large deformation rever
sals, tensile plastic strains imposed during previous cycles are not recovered during moment
reversal and steel strains tend to center about an ever increasing plastic tensile strain
(Fig.3.13).
It thus becomes apparent that several assumptions used in the available analytical
models of cracked reinforced concrete sections [8,31,38] contradict physical evidence. This
contradiction manifests itself in the sharp slope discontinuity exhibited by the analytical
moment-curvature relation of a section with unequal amounts of top and bottom reinforce
ment (Fig.3.15), as well as by a delayed crack closure when a section is subjected to several
load reversals between fixed rotation values (Fig.3.16).
Both facts have been recognized in a recent study (Ref.[l4]) and have been accounted
for by means of a modified concrete stress-strain relation. The proposed relation is
extended into the· tensile strain range using smooth functions to simulate gradual crack
closing at an earlier moment than anticipated by models based on strain compatibility.
Experimental evidence from cyclic tests on cracked girders is presented, which supports the
latter fact. In spite of some satisfactory results this approach does not consider the physical
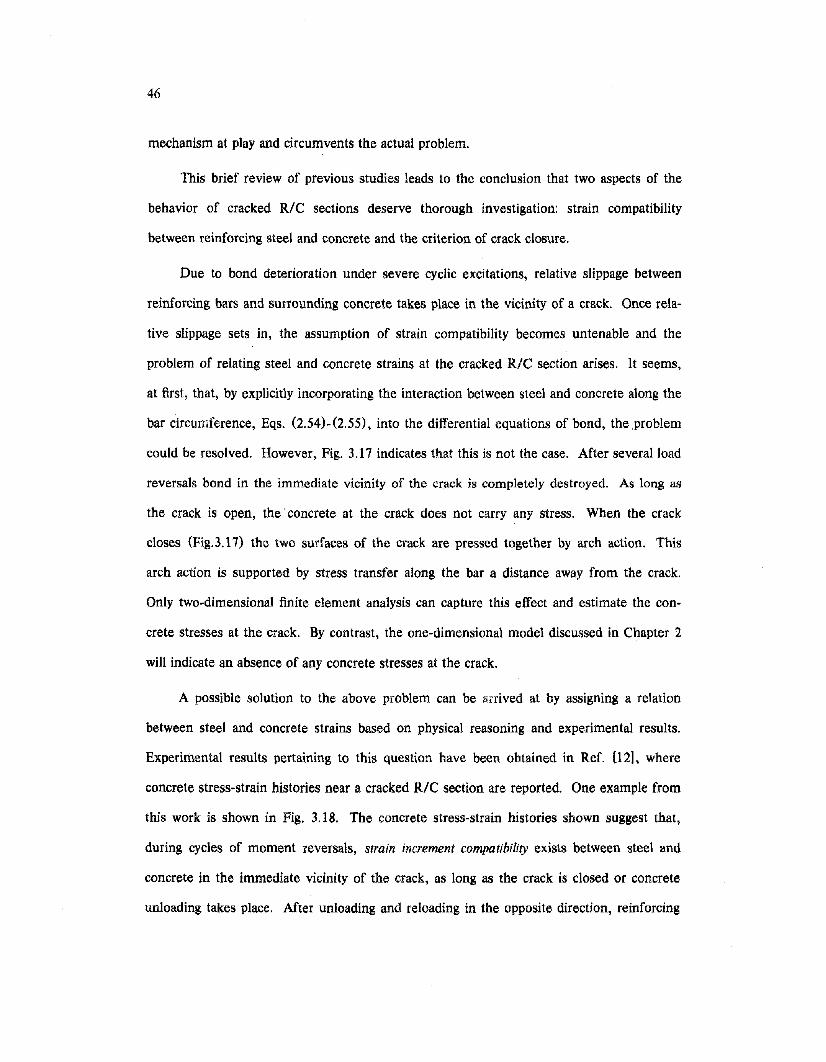
46
mechanism at play and circumvents the actual problem.
This brief review of previous studies leads to the conclusion that two aspects of the
behavior of cracked RIC sections deserve thorough investigation: strain compatibility
between reinforcing steel and concrete and the criterion of crack closure.
Due to bond deterioration under severe cyclic excitations, relative slippage between
reinforcing bars and surrounding concrete takes place in the vicinity of a crack. Once rela
tive slippage sets in, the assumption of strain compatibility becomes untenable and the
problem of relating steel and concrete strains at the cracked RIC section arises. It seems,
at first, that, by explicitly incorporating the interaction between steel and concrete along the
bar circumference, Eqs. (2.54)-(2.55), into the differential equations of bond, the problem
could be resolved. However, Fig. 3.17 indicates that this is not the case. After several load
reversals bond in the immediate vicinity of the crack is completely destroyed. As long as
the crack is open, the concrete at the crack does not carry any stress. When the crack
closes (Fig.3.17) the two surfaces of the crack are pressed together by arch action. This
arch action is supported by stress transfer along the bar a distance away from the crack.
Only two-dimensional finite element analysis can capture this effect and estimate the con
crete stresses at the crack. By contrast, the one-dimensional model discussed in Chapter 2
will indicate an absence of any concrete stresses at the crack.
A possible solution to the above problem can be arrived at by assigning a relation
between steel and concrete strains based on physical reasoning and experimental results.
Experimental results pertaining to this question have been obtained in Ref. [I21, where
concrete stress-strain histories near a cracked RIC section are reported. One example from
this work is shown in Fig. 3.18. The concrete stress-strain histories shown suggest that,
during cycles of moment reversals, strain increment compatibility exists between steel and
concrete in the immediate vicinity of the crack, as long as the crack is closed or concrete
unloading takes place. After unloading and reloading in the opposite direction, reinforcing

47
bars are subjected to tensile strain increments while concrete strains around the crack
remain "frozen". Upon moment reversal, stress transfer between steel and concrete is rees-
tablished only after the crack has closed again.
These findings can be readily explained on the basis of cyclic bond deterioration in the
vicinity of the crack. After imposing several load reversals in the post-yield range, bond is
completely destroyed near the crack. As long as the crack is open, no stress transfer takes
place and the concrete at the crack remains "frozen" in a state that corresponds to complete
unloading of concrete stresses in all section layers. Once the crack closes again, arch action
supported by stress transfer between steel and concrete a certain distance away from the
crack where bond is still intact activates the concrete at the crack (Fig.3.17).
The question of crack closure is rather simple, in spite of the fact that no analytical
model can properly capture the gradual closing of a rough cracked surface.
Since relative slippage of reinforcing bars with respect to concrete is explicitly
included in the model presented in Chapter 2, it is possible to estimate the crack width at
the level of the top and bottom reinforcing layer by adding up the slip of the reinforcement
on either side of the crack. Based on the estimate of crack width at the level of the top and
bottom reinforcing layer it is then possible to approximately determine the crack width at
the top and bottom of the cross section by assuming some simple extrapolation rule
(Fig.2.7b). In this study a linear extrapolation rule was used which results in the following
relations:
w'= WId'+d1 b d2 (3.11)
d'-w -
d'
w" = wbd'+d2 d l (3.12)
d'-WI-
d'
where
wb = u/+u} (3.13)
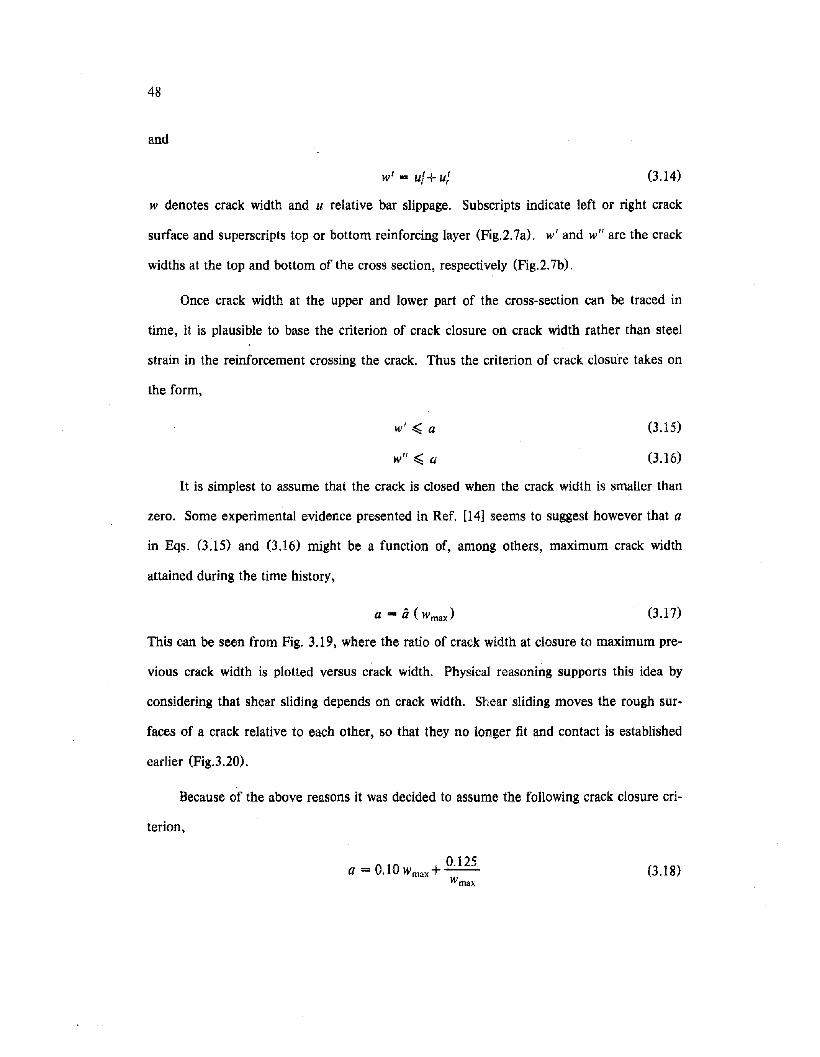
48
and
Wi = uf+ u; (3.14)
W denotes crack width and u relative bar slippage. Subscripts indicate left or right crack
surface and superscripts top or bottom reinforcing layer (Fig.2.7a). w' and w" are the crack
widths at the top and bottom of the cross section, respectively (Fig.2.7b).
Once crack width at the upper and lower part of the cross-section can be traced in
time, it is plausible to base the criterion of crack closure on crack width rather than steel
strain in the reinforcement crossing the crack. Thus the criterion of crack closure takes on
the form,
W' ~ a
w" ~ a
(3.15)
(3.16)
It is simplest to assume that the crack is closed when the crack width is smaller than
zero. Some experimental evidence presented in Ref. [14] seems to suggest however that a
in Eqs. (3.15) and (3.16) might be a function of, among others, maximum crack width
attained during the time history,
a = a(wmax ) (3.17)
This can be seen from Fig. 3.19, where the ratio of crack width at closure to maximum pre-
vious crack width is plotted versus crack width. Physical reasoning supports this idea by
considering that shear sliding depends on crack width. Shear sliding moves the rough sur-
faces of a crack relative to each other, so that they no longer fit and contact is established
earlier (Fig.3.20).
Because of the above reasons it was decided to assume the following crack closure cri-
terion,
0.125a = 0.10 wmax+-wmax
(3.18)

49
which compares reasonably well with sparse experimental data available (Fig.3.19). More
experimental studies on the subject are needed.
The above discussion and experimental findings motivated the proposed concrete sec
tion model which consists of the following steps:
(1) A concrete section is subdivided into a number of layers. The number of layers, as
pointed out by Stanton and Mc Niven in Ref. [45], should be large enough to minim
ize any numerical inaccuracies when using the midpoint rule to evaluate the sum of
layer forces and moments. The subdivision is performed such that the top and bot
tom reinforcing bars lie in the middle of a concrete layer. These two concrete layers
will be called in the following top and bottom concrete layers, respectively, although
they are not the outermost layers. Different material laws can be assigned to each
layer, taking into account the distinct behavior of concrete cover and that of concrete
confined by stirrup-ties.
(2) At the end of each iteration of the nonlinear system of equations presented in
Chapter 2, the increments of steel strain and stress as well as the increments of slip of
reinforcing bars relative to concrete are known at each crack.
(3) The current value of crack width at the top and bottom reinforcing layer is determined
based on Eqs. (3.13) and (3.14).
(4) The crack closure criterion, Eqs. (3.15)-(3.18), establishes whether the crack is open
or closed at the top and bottom of the cross-section.
(5) If the crack at, say, the bottom of the cross-section is open, no compatibility of strain
increments between reinforcing steel and surrounding concrete is assumed at the bot
tom reinforcing layer. In this case the concrete strain increment at the bottom con
crete layer is assumed to be equal to zero. If the crack is found closed at the bottom
of the cross-section, complete compatibility of strain increments between reinforcing
steel and surrounding concrete is assumed at the bottom reinforcing layer. Similar
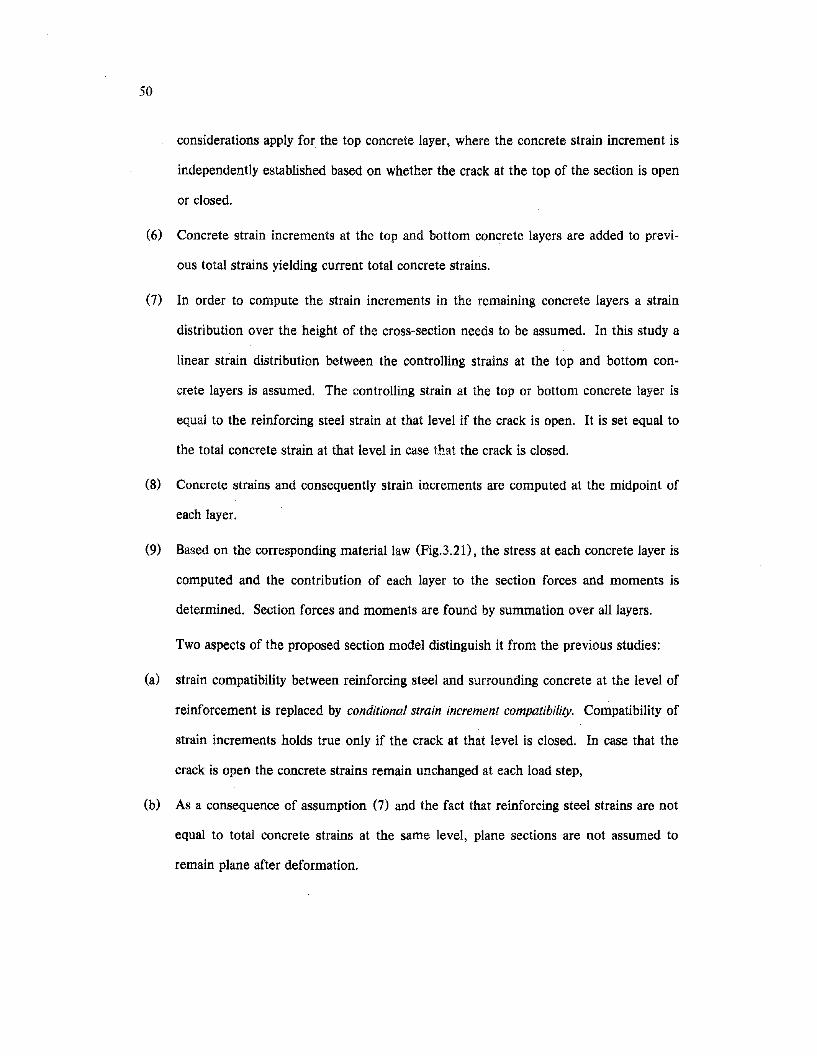
50
considerations apply for the top concrete layer, where the concrete strain increment is
independently established based on whether the crack at the top of the section is open
or closed.
(6) Concrete strain increments at the top and bottom concrete layers are added to previ
ous total strains yielding current total concrete strains.
(7) In order to compute the strain increments in the remaining concrete layers a strain
distribution over the height of the cross-section needs to be assumed. In this study a
linear strain distribution between the controlling strains at the top and bottom con
crete layers is assumed. The controlling strain at the top or bottom concrete layer is
equal to the reinforcing steel strain at that level if the crack is open. It is set equal to
the total concrete strain at that level in case that the crack is closed.
(8) Concrete strains and consequently strain increments are computed at the midpoint of
each layer.
(9) Based on the corresponding material law (Fig.3.2l), the stress at each concrete layer is
computed and the contribution of each layer to the section forces and moments is
determined. Section forces and moments are found by summation over all layers.
Two aspects of the proposed section model distinguish it from the previous studies:
(a) strain compatibility between reinforcing steel and surrounding concrete at the level of
reinforcement is replaced by conditional strain increment compatibility. Compatibility of
strain increments holds true only if the crack at that level is closed. In case that the
crack is open the concrete strains remain unchanged at each load step,
(b) As a consequence of assumption (7) and the fact that reinforcing steel strains are not
equal to total concrete strains at the same level, plane sections are not assumed to
remain plane after deformation.
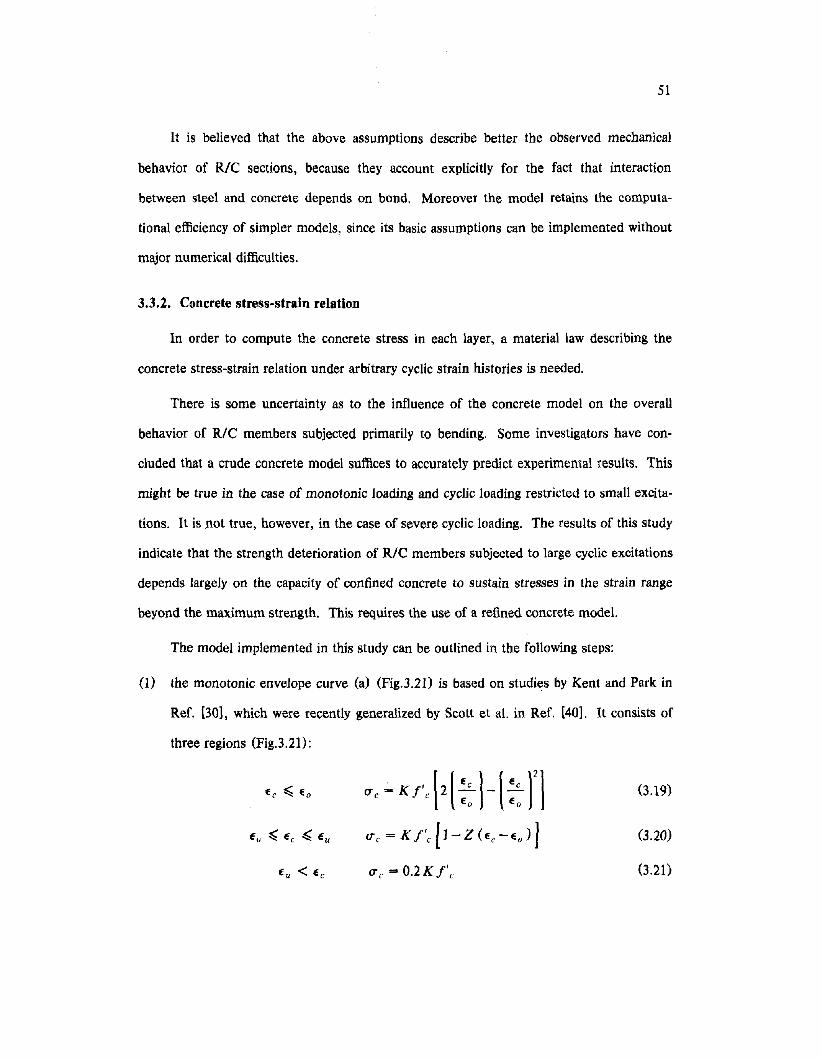
51
It is believed that the above assumptions describe better the observed mechanical
behavior of RIC sections, because they account explicitly for the fact that interaction
between steel and concrete depends on bond. Moreover the model retains the computa
tional efficiency of simpler models, since its basic assumptions can be implemented without
major numerical difficulties.
3.3.2. Concrete stress-strain relation
In order to compute the concrete stress in each layer, a material law describing the
concrete stress-strain relation under arbitrary cyclic strain histories is needed.
There is some uncertainty as to the influence of the concrete model on the overall
behavior of RIC members subjected primarily to bending. Some investigators have con
cluded that a crude concrete model suffices to accurately predict experimental results. This
might be true in the case of monotonic loading and cyclic loading restricted to small excita
tions. It is not true, however, in the case of severe cyclic loading. The results of this study
indicate that the strength deterioration of RIC members subjected to large cyclic excitations
depends largely on the capacity of confined concrete to sustain stresses in the strain range
beyond the maximum strength. This requires the use of a refined concrete model.
The model implemented in this study can be outlined in the following steps:
(I) the monotonic envelope curve (a) (Fig.3.2I) is based on studies by Kent and Park in
Ref. [30], which were recently generalized by Scott et al. in Ref. [40]. It consists of
three regions (Fig.3.2l):
(T c = 0.2 K f' c
(3.19)
(3.20)
(3.21)
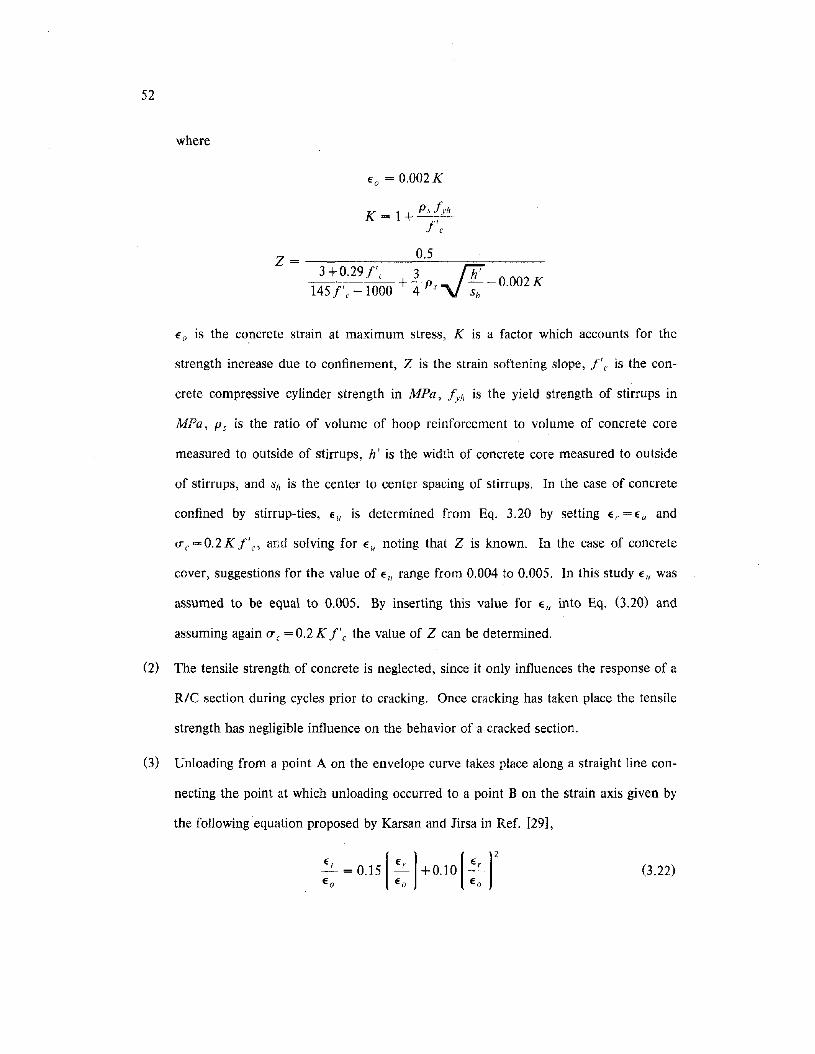
52
where
Eo = 0.002K
K = 1+ PslyhI'e
z = 0_.5.,-----.----:=,----__3+0.29/'e 3· R
145/'('-1000 +ti;Ps V ~-0.002K
Eo is the concrete strain at maximum stress, K is a factor which accounts for the
strength increase due to confinement, Z is the strain softening slope, I'e is the con-
crete compressive cylinder strength in MPa, Iyh is the yield strength of stirrups in
MPa, Ps is the ratio of volume of hoop reinforcement to volume of concrete core
measured to outside of stirrups, h' is the width of concrete core measured to outside
of stirrups, and Sh is the center to center spacing of stirrups. In the case of concrete
confined by stirrup-ties, E u is determined from Eq. 3.20 by setting E c =Eu and
(J" c = 0.2 K I'c' and solving for E u noting that Z is known. In the case of concrete
cover, suggestions for the value of E u range from 0.004 to 0.005. In this study E u was
assumed to be equal to 0.005. By inserting this value for E u into Eq. (3.20) and
assuming again (J" e = 0.2 K f' e the value of Z can be determined.
(2) The tensile strength of concrete is neglected, since it only influences the response of a
RIC section during cycles prior to cracking. Once cracking has taken place the tensile
strength has negligible influence on the behavior of a cracked section.
(3) Unloading from a point A on the envelope curve takes place along a straight line con-
necting the point at which unloading occurred to a point B on the strain axis given by
the following equation proposed by Karsan and Jirsa in Ref. [29],
2. = 0.15[2.1+ 0.10 [2.12
Eo Eo Eo0.22)
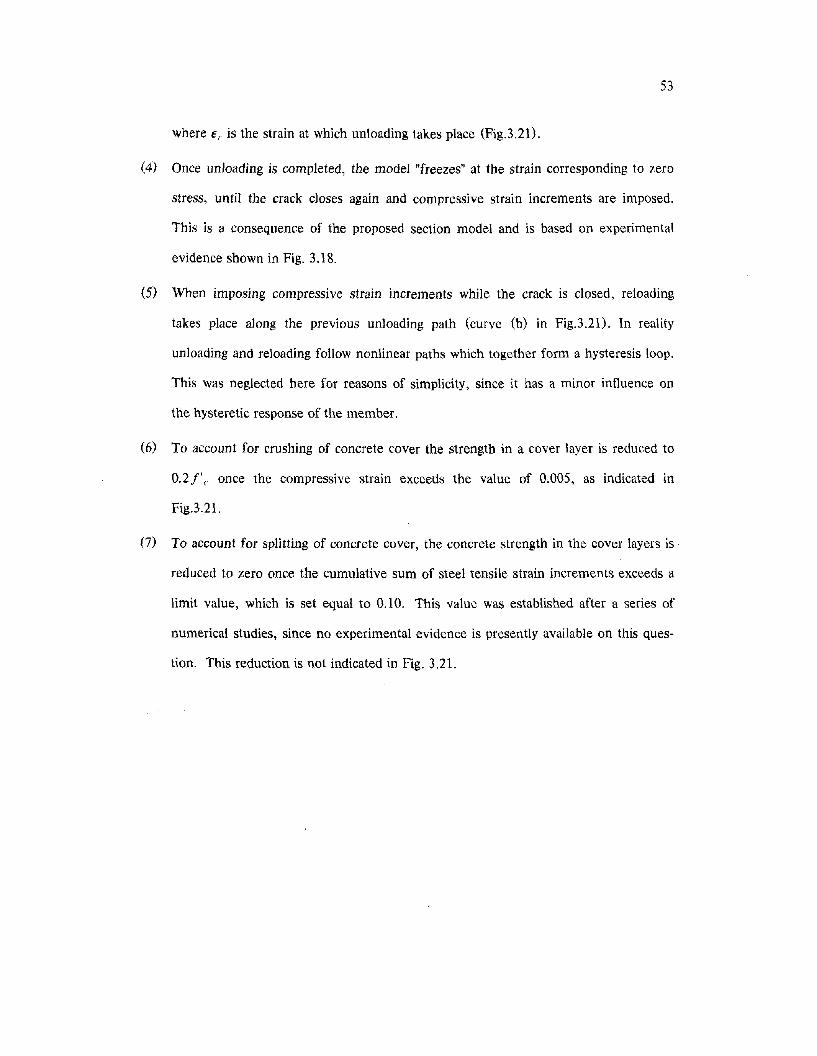
53
where Er is the strain at which unloading takes place (Fig.3.2D.
(4) Once unloading is completed, the model "freezes" at the strain corresponding to zero
stress, until the crack closes again and compressive strain increments are imposed.
This is a consequence of the proposed section model and is based on experimental
evidence shown in Fig. 3.18.
(5) When imposing compressive strain increments while the crack is closed, reloading
takes place along the previous unloading path (curve (b) in Fig.3.2D. In reality
unloading and reloading follow nonlinear paths which together form a hysteresis loop.
This was neglected here for reasons of simplicity, since it has a minor influence on
the hysteretic response of the member.
(6) To account for crushing of concrete cover the strength in a cover layer is reduced to
0.21',. once the compressive strain exceeds the value of 0.005, as indicated in
Fig.3.21.
(7) To account for splitting of concrete cover, the concrete strength in the cover layers is
reduced to zero once the cumulative sum of steel tensile strain increments exceeds a
limit value, which is set equal to 0.10. This value was established after a series of
numerical studies, since no experimental evidence is presently available on this ques
tion. This reduction is not indicated in Fig. 3.21.
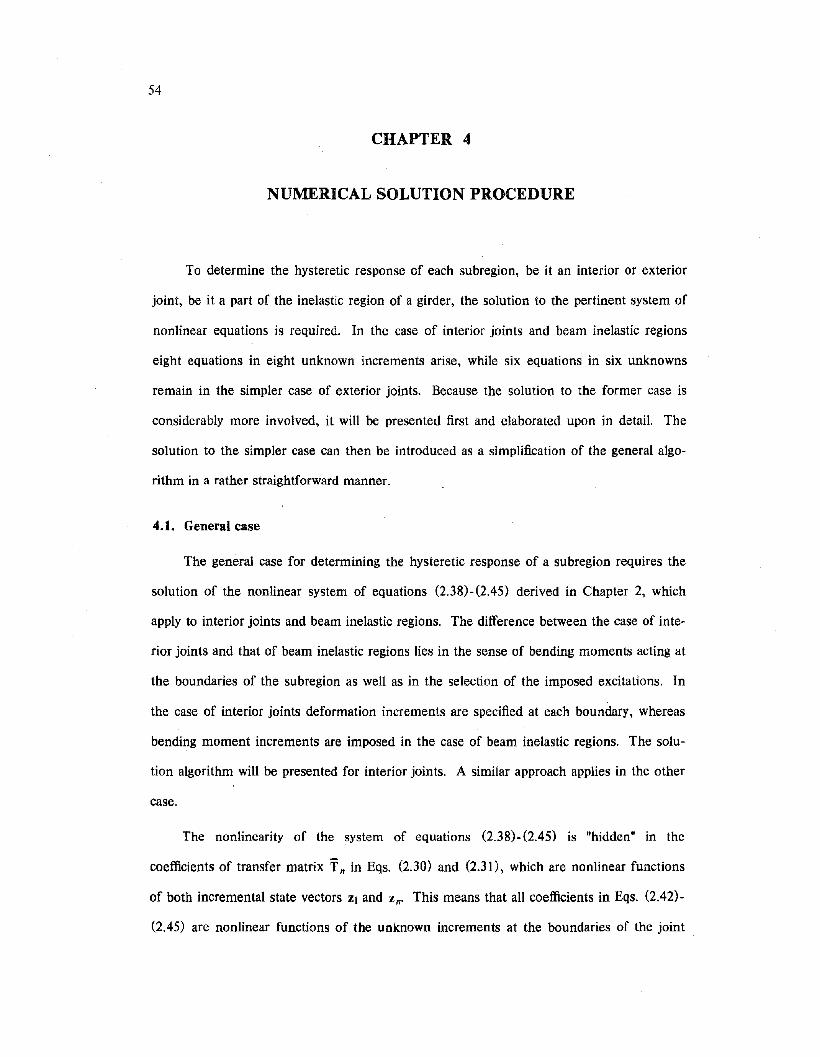
54
CHAPTER 4
NUMERICAL SOLUTION PROCEDURE
To determine the hysteretic response of each subregion, be it an interior or exterior
joint, be it a part of the inelastic region of a girder, the solution to the pertinent system of
nonlinear equations is required. In the case of interior joints and beam inelastic regions
eight equations in eight unknown increments arise, while six equations in six unknowns
remain in the simpler case of exterior joints. Because the solution to the former case is
considerably more involved, it will be presented first and elaborated upon in detail. The
solution to the simpler case can then be introduced as a simplification of the general algo
rithm in a rather straightforward manner.
4.1. General case
The general case for determining the hysteretic response of a subregion requires the
solution of the nonlinear system of equations (2.38)-(2.45) derived in Chapter 2, which
apply to interior joints and beam inelastic regions. The difference between the case of inte
rior joints and that of beam inelastic regions lies in the sense of bending moments acting at
the boundaries of the subregion as well as in the selection of the imposed excitations. In
the case of interior joints deformation increments are specified at each boundary, whereas
bending moment increments are imposed in the case of beam inelastic regions. The solu
tion algorithm will be presented for interior joints. A similar approach applies in the other
case.
The nonlinearity of the system of equations (2.38)-(2.45) is "hidden" in the
coefficients of transfer matrix 1\ in Eqs. (2.30) and (2.30, which are nonlinear functions
of both incremental state vectors Zl and Zn' This means that all coefficients in Eqs. (2.42)
(2.45) are nonlinear functions of the unknown increments at the boundaries of the joint
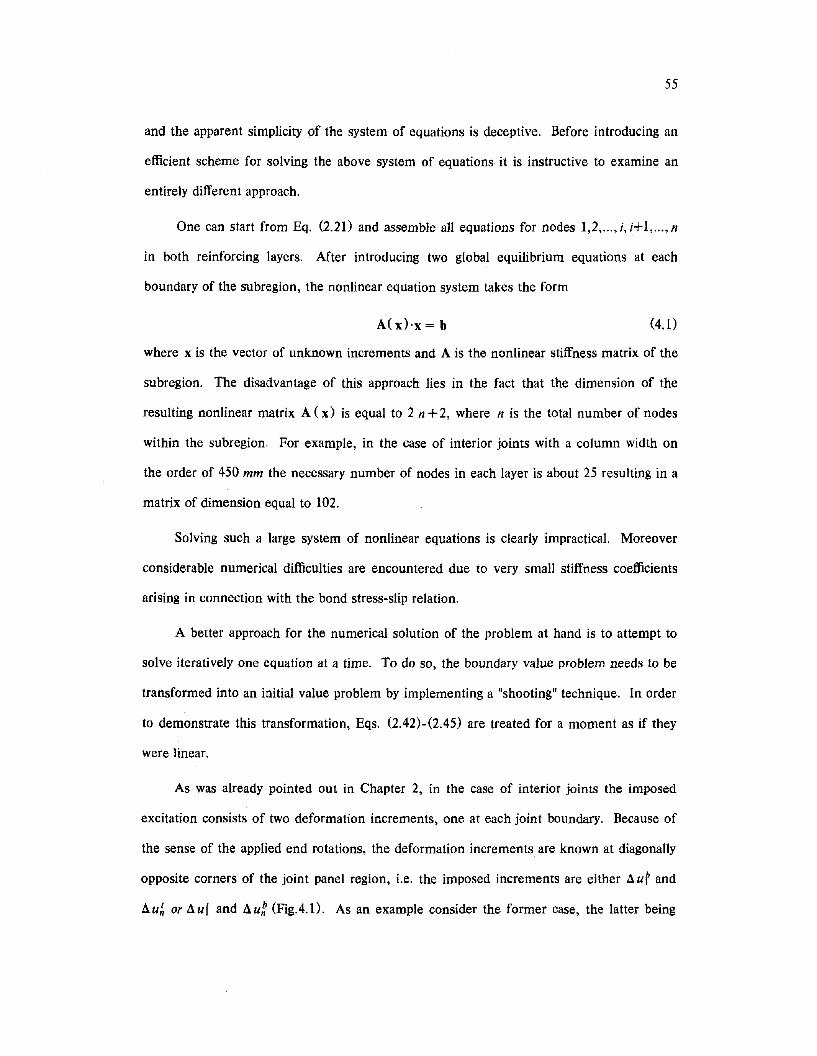
55
and the apparent simplicity of the system of equations is deceptive. Before introducing an
efficient scheme for solving the above system of equations it is instructive to examine an
entirely different approach.
One can start from Eq. (2.21) and assemble all equations for nodes 1,2, ... ,i,i+l, ... ,n
in both reinforcing layers. After introducing two global equilibrium equations at each
boundary of the subregion, the nonlinear equation system takes the form
A(x)'x=b (4.1)
where x is the vector of unknown increments and A is the nonlinear stiffness matrix of the
subregion. The disadvantage of this approach lies in the fact that the dimension of the
resulting nonlinear matrix A ( x) is equal to 2 n + 2, where n is the total number of nodes
within the subregion. For example, in the case of interior joints with a column width on
the order of 450 mm the necessary number of nodes in each layer is about 25 resulting in a
matrix of dimension equal to 102.
Solving such a large system of nonlinear equations is clearly impractical. Moreover
considerable numerical difficulties are encountered due to very small stiffness coefficients
arising in connection with the bond stress-slip relation.
A better approach for the numerical solution of the problem at hand is to attempt to
solve iteratively one equation at a time. To do so, the boundary value problem needs to be
transformed into an initial value problem by implementing a "shooting" technique. In order
to demonstrate this transformation, Eqs. (2.42)-(2.45) are treated for a moment as if they
were linear.
As was already pointed out in Chapter 2, in the case of interior joints the imposed
excitation consists of two deformation increments, one at each joint boundary. Because of
the sense of the applied end rotations, the deformation increments are known at diagonally
opposite corners of the joint panel region, Le. the imposed increments are either ~uf and
~u~ or ~uf and ~ug (Fig.4.1). As an example consider the former case, the latter being
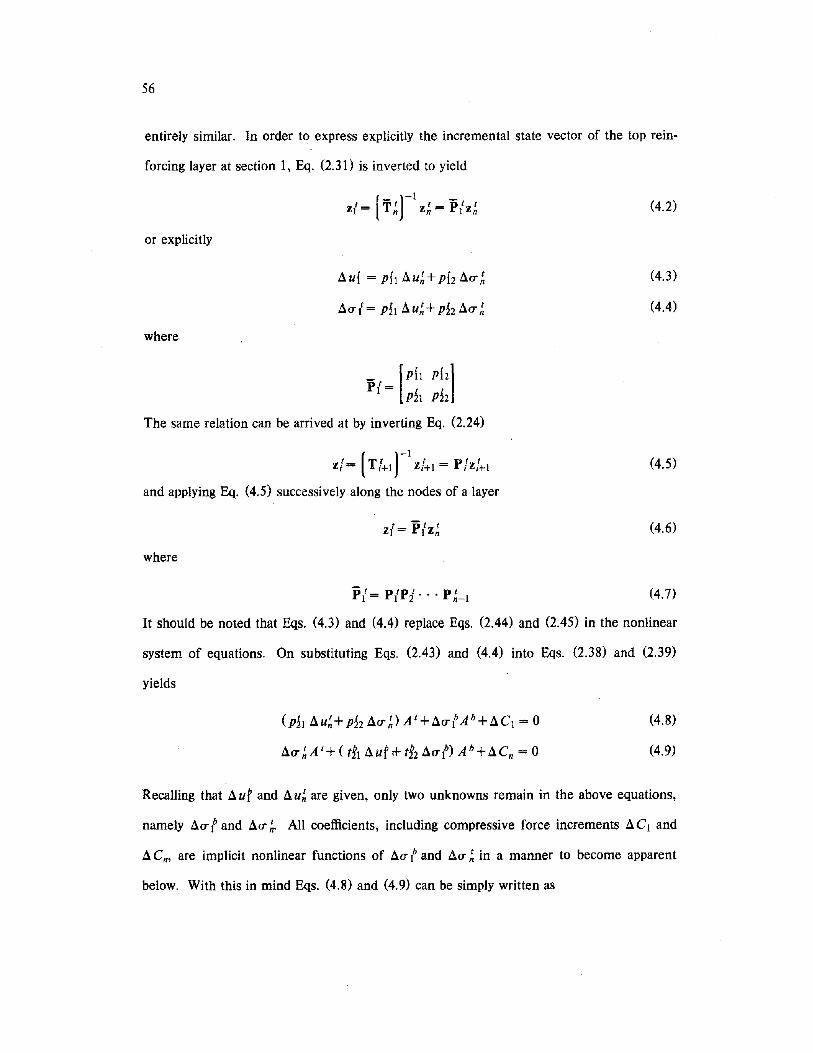
56
entirely similar. In order to express explicitly the incremental state vector of the top rein-
forcing layer at section 1, Eq. (2.30 is inverted to yield
Zl= (TI)-t zl = Pt'ZIt n n n
or explicitly
where
_ [Ph Ph]pI_t - P1t ph
The same relation can be arrived at by inverting Eq. (2.24)
z/ = (T /+1rtz/+t = P/z/+1
and applying Eq. (4.5) successively along the nodes of a layer
z{ = P{z~
where
PI = P{PI· .. P ~-t
(4.2)
(4.3)
(4.4)
(4.5)
(4.6)
(4.7)
It should be noted that Eqs. (4.3) and (4.4) replace Eqs. (2.44) and (2.45) in the nonlinear
system of equations. On substituting Eqs. (2.43) and (4.4) into Eqs. (2.38) and (2.39)
yields
(ph au~+P12 aCT DA I +J1CTlAb+ac t = 0
aCT ~A '+( tft auf;f- tf2 aCTl) Ab+acn = 0
(4.8)
(4.9)
Recalling that auf and a u~ are given, only two unknowns remain in the above equations,
namely aCTl and aCT~. All coefficients, including compressive force increments aC t and
a Cm are implicit nonlinear functions of aCT l and aCT ~ in a manner to become apparent
below. With this in mind Eqs. (4.8) and (4.9) can be simply written as
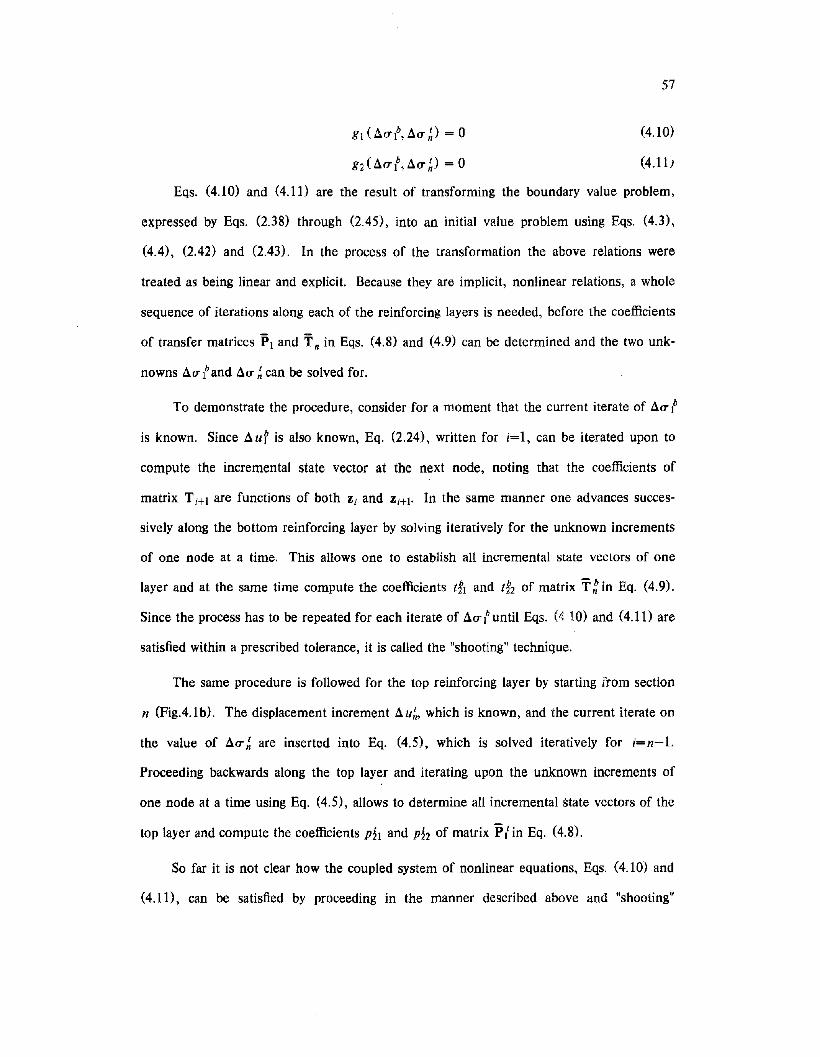
57
gj U"Ujb, Jiu~) = 0 (4.10)
g2(Jiul,Jiu~) =0 (4.11)
Eqs. (4.10) and (4.11) are the result of transforming the boundary value problem,
expressed by Eqs. (2.38) through (2.45), into an initial value problem using Eqs. (4.3),
(4.4), (2.42) and (2.43). In the process of the transformation the above relations were
treated as being linear and explicit. Because they are implicit, nonlinear relations, a whole
sequence of iterations along each of the reinforcing layers is needed, before the coefficients
of transfer matrices Pj and Tn in Eqs. (4.8) and (4.9) can be determined and the two unk
nowns Jiuland Jiu ~ can be solved for.
To demonstrate the procedure, consider for a moment that the current iterate of Jiul
is known. Since Jiut is also known, Eq. (2.24), written for i=l, can be iterated upon to
compute the incremental state vector at the next node, noting that the coefficients of
matrix T;+1 are functions of both z; and Z;+]o In the same manner one advances succes
sively along the bottom reinforcing layer by solving iteratively for the unknown increments
of one node at a time. This allows one to establish all incremental state vectors of one
layer and at the same time compute the coefficients tfj and tf2 of matrix T~ in Eq. (4.9).
Since the process has to be repeated for each iterate of Jiuluntil Eqs. (4 10) and (4.11) are
satisfied within a prescribed tolerance, it is called the "shooting" technique.
The same procedure is followed for the top reinforcing layer by starting from section
n (Fig.4.1 b). The displacement increment Ji u~, which is known, and the current iterate on
the value of Jiu~ are inserted into Eq. (4.5), which is solved iteratively for i=n-l.
Proceeding backwards along the top layer and iterating upon the unknown increments of
one node at a time using Eq. (4.5), allows to determine all incremental state vectors of the
top layer and compute the coefficients P~l and ph of matrix Pl in Eq. (4.8).
So far it is not clear how the coupled system of nonlinear equations, Eqs. (4.10) and
(4.11), can be satisfied by proceeding in the manner described above and "shooting"
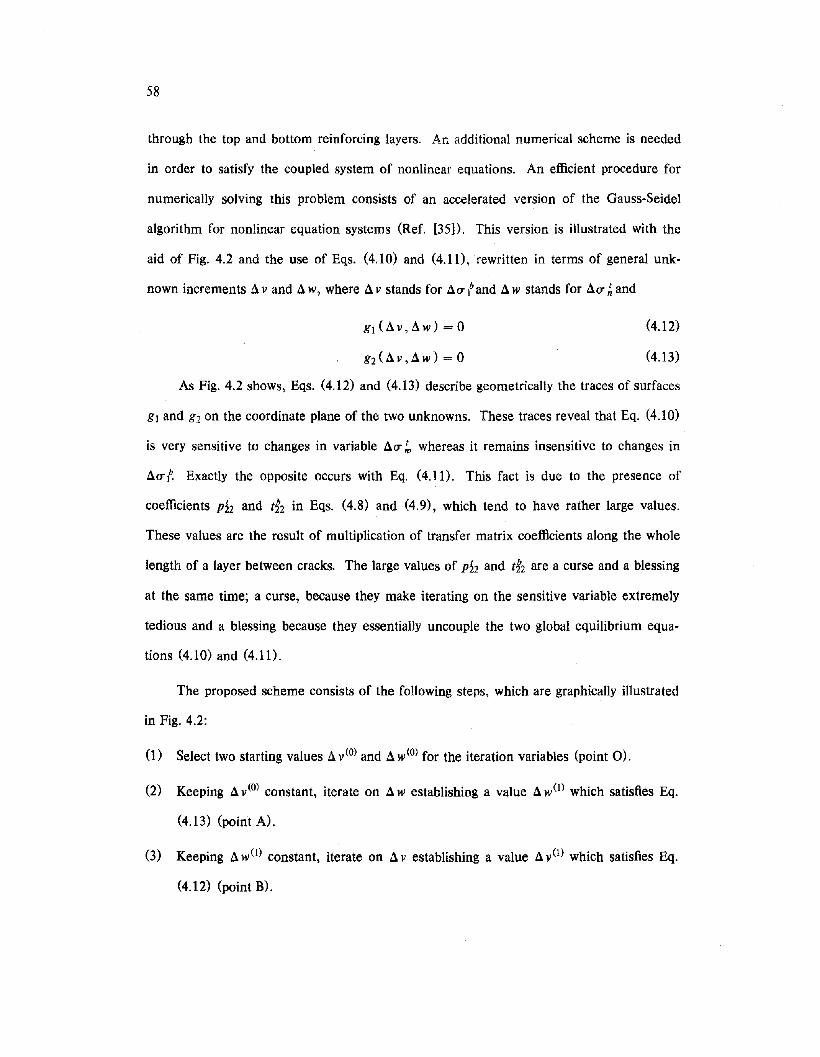
58
through the top and bottom reinforcing layers. An additional numerical scheme is needed
in order to satisfy the coupled system of nonlinear equations. An efficient procedure for
numerically solving this problem consists of an accelerated version of the Gauss-Seidel
algorithm for nonlinear equation systems (Ref. [35]). This version is illustrated with the
aid of Fig. 4.2 and the use of Eqs. (4.10) and (4.10, rewritten in terms of general unk
nown increments d v and d W, where d v stands for dO'tand d W stands for dO' hand
gl (dV,dW) = 0 (4.12)
g2(dV,dW) = 0 (4.13)
As Fig. 4.2 shows, Eqs. (4.12) and (4.13) describe geometrically the traces of surfaces
gl and g2 on the coordinate plane of the two unknowns. These traces reveal that Eq. (4.10)
is very sensitive to changes in variable dO' h, whereas it remains insensitive to changes in
dO'l~ Exactly the opposite occurs with Eq. (4.10. This fact is due to the presence of
coefficients ph and t~2 in Eqs. (4.8) and (4.9), which tend to have rather large values.
These values are the result of multiplication of transfer matrix coefficients along the whole
length of a layer between cracks. The large values of ph and tf2 are a curse and a blessing
at the same time; a curse, because they make iterating on the sensitive variable extremely
tedious and a blessing because they essentially uncouple the two global equilibrium equa
tions (4.10) and (4.10.
The proposed scheme consists of the following steps, which are graphically illustrated
in Fig. 4.2:
(0 Select two starting values d v(0) and d w(O) for the iteration variables (point 0).
(2) Keeping· d v(O) constant, iterate on d W establishing a value d w(l) which satisfies Eq.
(4.13) (point A).
(3) Keeping d w(l) constant, iterate on d v establishing a value d v(l) which satisfies Eq.
(4.12) (point B).
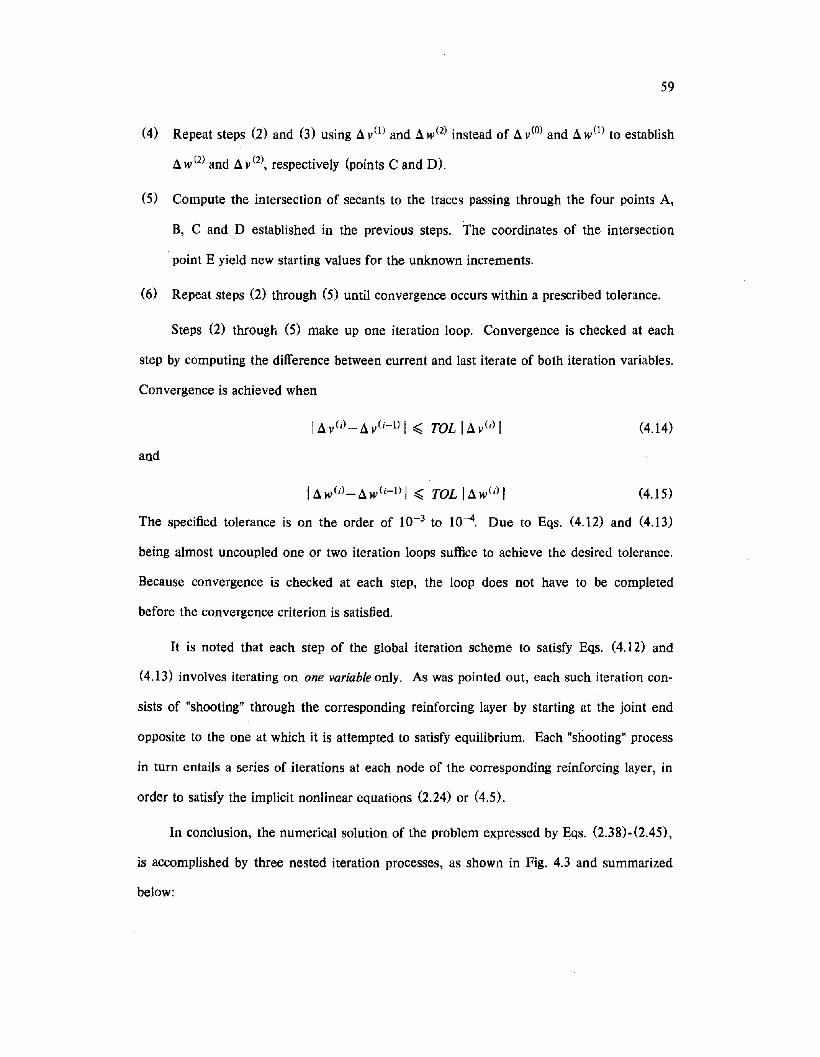
59
(4) Repeat steps (2) and (3) using a v(l) and a w(2) instead of a v(O) and a w(l) to establish
aw(2) and av(2), respectively (points C and D).
(5) Compute the intersection of secants to the traces passing through the four points A,
B, C and D established in the previous steps. The coordinates of the intersection
point E yield new starting values for the unknown increments.
(6) Repeat steps (2) through (5) until convergence occurs within a prescribed tolerance.
Steps (2) through (5) make up one iteration loop. Convergence is checked at each
step by computing the difference between current and last iterate of both iteration variables.
Convergence is achieved when
(4.14)
and
Ia w(iL a w(i-!) I ~ TOL Ia w(;) I (4.15)
The specified tolerance is on the order of 10-3 to 10-4. Due to Eqs. (4.12) and (4.13)
being almost uncoupled one or two iteration loops suffice to achieve the desired tolerance.
Because convergence is checked at each step, the loop does not have to be completed
before the convergence criterion is satisfied.
It is noted that each step of the global iteration scheme to satisfy Eqs. (4.12) and
(4.13) involves iterating on one variable only. As was pointed out, each such iteration con
sists of "shooting" through the corresponding reinforcing layer by starting at the joint end
opposite to the one at which it is attempted to satisfy equilibrium. Each "shooting" process
in turn entails a series of iterations at each node of the corresponding reinforcing layer, in
order to satisfy the implicit nonlinear equations (2.24) or (4.5).
In conclusion, the numerical solution of the problem expressed by Eqs. (2.38)-(2.45),
is accomplished by three nested iteration processes, as shown in Fig. 4.3 and summarized
below:
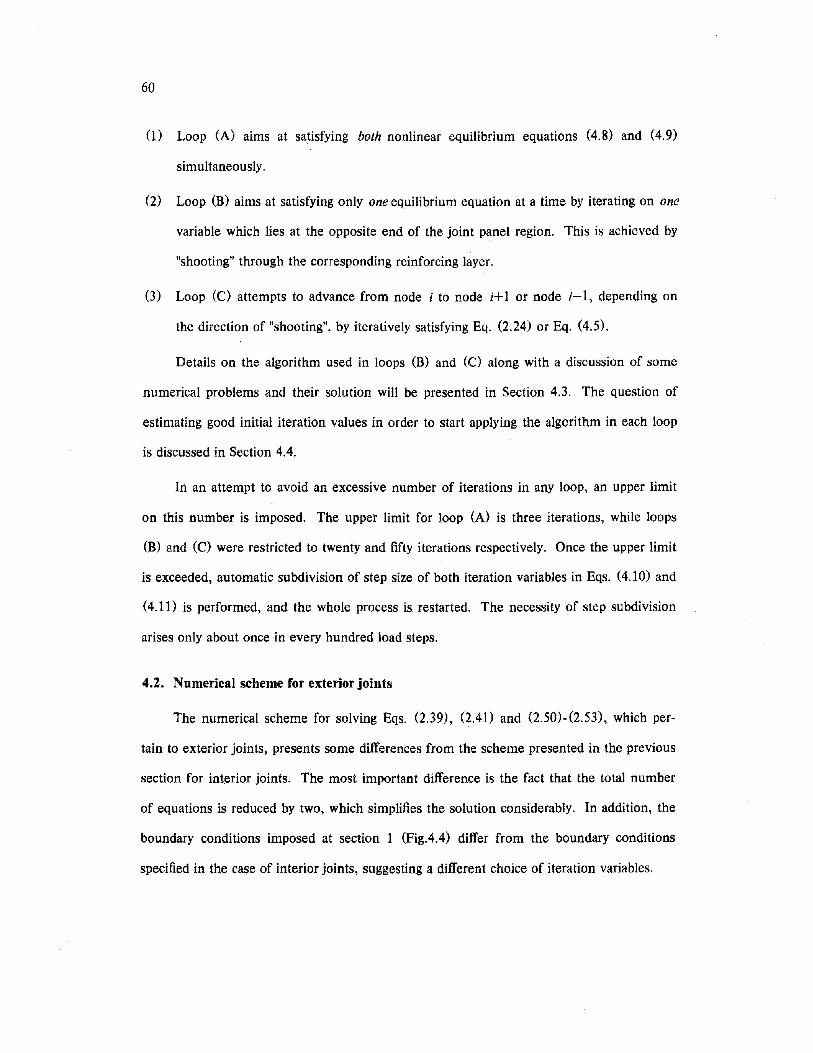
60
0) Loop (A) aims at satisfying both nonlinear equilibrium equations (4.8) and (4.9)
simultaneously.
(2) Loop (B) aims at satisfying only one equilibrium equation at a time by iterating on one
variable which lies at the opposite end of the joint panel region. This is achieved by
"shooting" through the corresponding reinforcing layer.
(3) Loop (C) attempts to advance from node; to node i+l or node ;-1, depending on
the direction of "shooting", by iteratively satisfying Eq. (2.24) or Eq. (4.5).
Details on the algorithm used in loops (B) and (C) along with a discussion of some
numerical problems and their solution will be presented in Section 4.3. The question of
estimating good initial iteration values in order to start applying the algorithm in each loop
is discussed in Section 4.4.
In an attempt to avoid an excessive number of iterations in any loop, an upper limit
on this number is imposed. The upper limit for loop (A) is three iterations, while loops
(B) and (C) were restricted to twenty and fifty iterations respectively. Once the upper limit
is exceeded, automatic subdivision of step size of both iteration variables in Eqs. (4.10) and
(4.11) is performed, and the whole process is restarted. The necessity of step subdivision
arises only about once in every hundred load steps.
4.2. Numerical scheme for exterior joints
The numerical scheme for solving Eqs. (2.39), (2.41) and (2.50)-(2.53), which per
tain to exterior joints, presents some differences from the scheme presented in the previous
section for int.erior joints. The most important difference is the fact that the total number
of equations is reduced by two, which simplifies the solution considerably. In addition, the
boundary conditions imposed at section 1 (Fig.4.4) differ from the boundary conditions
specified in the case of interior joints, suggesting a different choice of iteration variables.
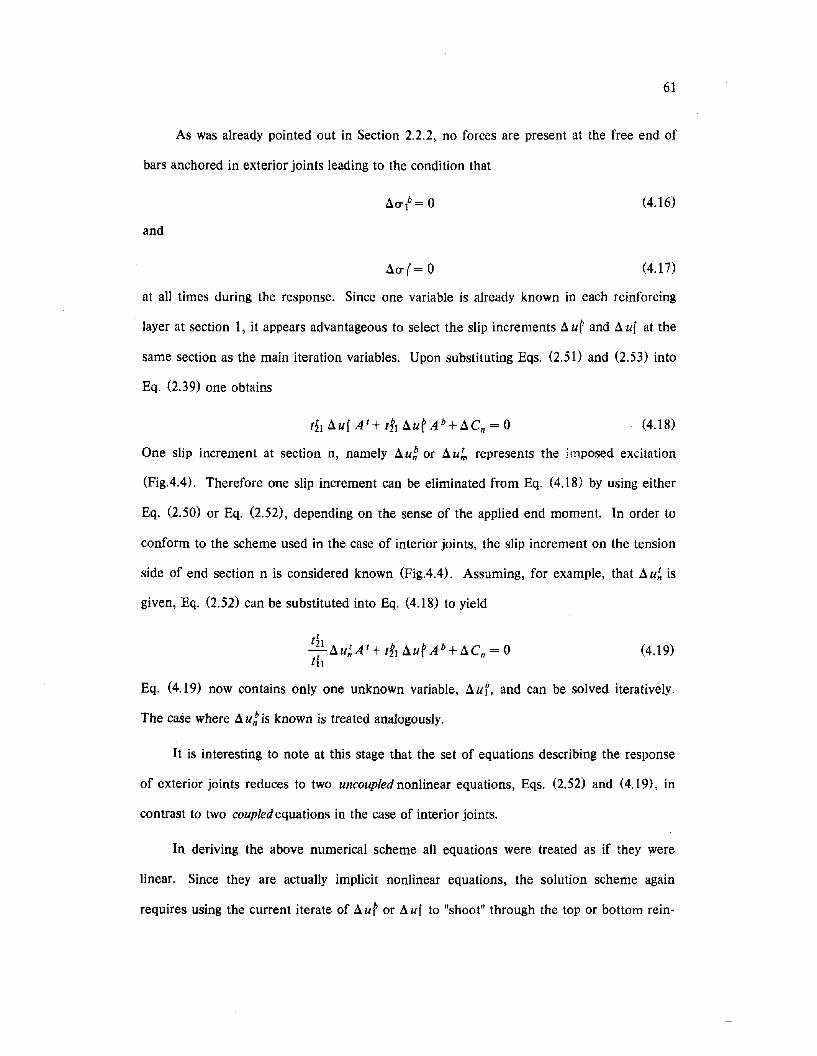
61
As was already pointed out in Section 2.2.2, no forces are present at the free end of
bars anchored in exterior joints leading to the condition that
(4.16)
and
(4.17)
at all times during the response. Since one variable is already known in each reinforcing
layer at section 1, it appears advantageous to select the slip increments a uf and a uf at the
same section as the main iteration variables. Upon substituting Eqs. (2.51) and (2.53) into
Eq. (2.39) one obtains
(4.18)
One slip increment at section n, namely a ug or a u;" represents the imposed excitation
(Fig.4.4). Therefore one slip increment can be eliminated from Eq. (4.18) by using either
Eq. (2.50) or Eq. (2.52), depending on the sense of the applied end moment. In order to
conform to the scheme used in the case of interior joints, the slip increment on the tension
side of end section n is considered known (Fig.4.4). Assuming, for example, that au;' is
given, Eq. (2.52) can be substituted into Eq. (4.18) to yield
(4.19)
Eq. (4.19) now contains only one unknown variable, auf, and can be solved iteratively.
The case where augis known is treated analogously.
It is interesting to note at this stage that the set of equations describing the response
of exterior joints reduces to two uncoupled nonlinear equations, Eqs. (2.52) and (4.19), in
contrast to two coupledequations in the case of interior joints.
In deriving the above numerical scheme all equations were treated as if they were
linear. Since they are actually implicit nonlinear equations, the solution scheme again
requires using the current iterate of a uf or a uf to "shoot" through the top or bottom rein-
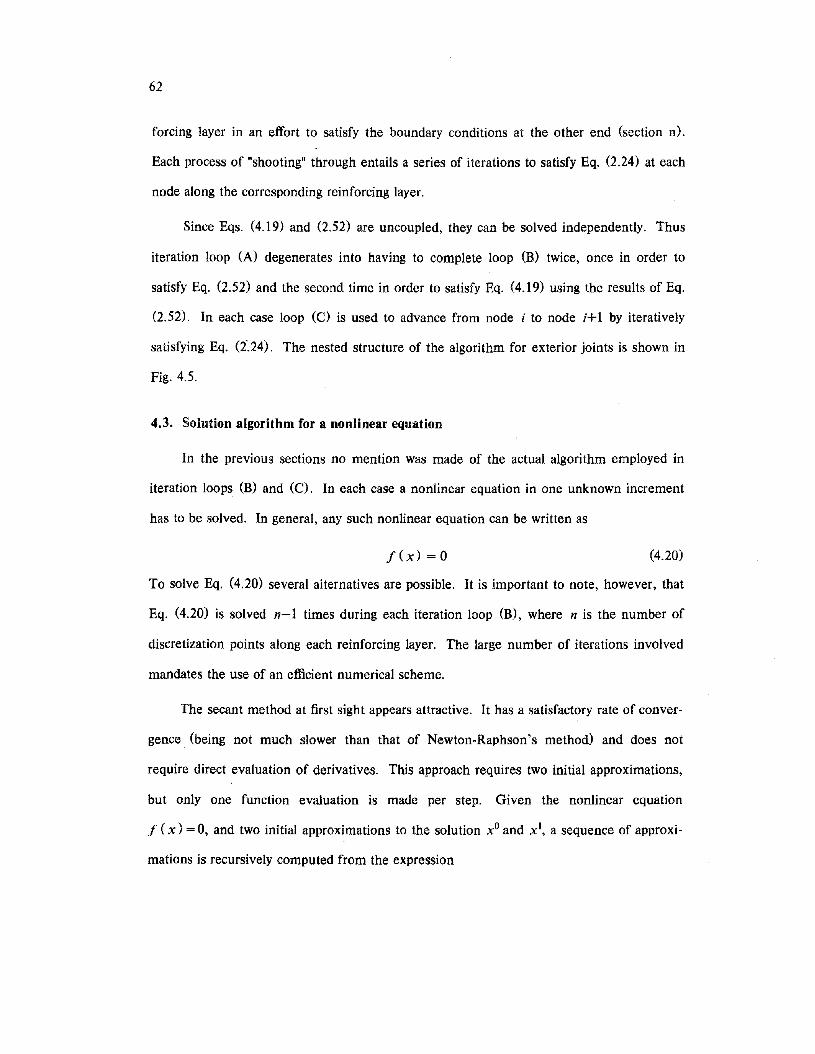
62
forcing layer in an effort to satisfy the boundary conditions at the other end (section n).
Each process of "shooting" through entails a series of iterations to satisfy Eq. (2.24) at each
node along the corresponding reinforcing layer.
Since Eqs. (4.19) and (2.52) are uncoupled, they can be solved independently. Thus
iteration loop (A) degenerates into having to complete loop (B) twice, once in order to
satisfy Eq. (2.52) and the second time in order to satisfy Eq. (4.19) using the results of Eq.
(2.52). In each case loop (C) is used to advance from node i to node i+1 by iteratively
satisfying Eq. (2'.24). The nested structure of the algorithm for exterior joints is shown in
Fig. 4.5.
4.3. Solution algorithm for a nonlinear equation
In the previous sections no mention was made of the actual algorithm employed in
iteration loops (B) and (C). In each case a nonlinear equation in one unknown increment
has to be solved. In general, any such nonlinear equation can be written as
f (x) = 0 (4.20)
To solve Eq. (4.20) several alternatives are possible. It is important to note, however, that
Eq. (4.20) is solved n-1 times during each iteration loop (B), where n is the number of
discretization points along each reinforcing layer. The large number of iterations involved
mandates the use of an efficient numerical scheme.
The secant method at first sight appears attractive. It has a satisfactory rate of conver
gence (being not much slower than that of Newton-Raphson's method) and does not
require direct evaluation of derivatives. This approach requires two initial approximations,
but only one function evaluation is made per step. Given the nonlinear equation
f ( x ) = 0, and two initial approximations to the solution xO and xl, a sequence of approxi
mations is recursively computed from the expression
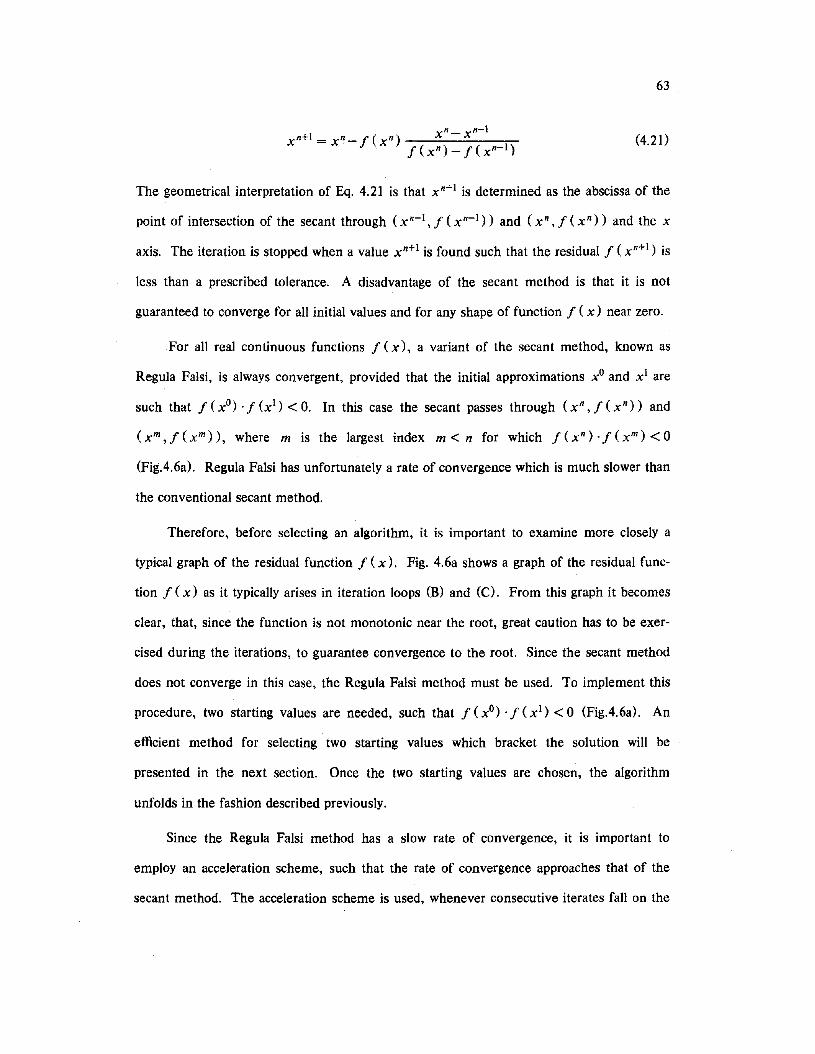
63
(4.20
The geometrical interpretation of Eq. 4.21 is that x n+1 is determined as the abscissa of the
point of intersection of the secant through (x n- l , f (x n- l )) and (x n , f (x n )) and the x
axis. The iteration is stopped when a value x n+1 is found such that the residual f (x n+l) is
less than a prescribed tolerance. A disadvantage of the secant method is that it is not
guaranteed to converge for all initial values and for any shape of function f ( x) near zero.
For all real continuous functions f (x), a variant of the secant method, known as
Regula Falsi, is always convergent, provided that the initial approximations xO and Xl are
such that f ( XO) . f (Xl) < O. In this case the secant passes through (x n , f ( x n )) and
(x m , f (xm )), where m is the largest index m < n for which f (x n ) • f (x m ) < 0
(Fig.4.6a). Regula Falsi has unfortunately a rate of convergence which is much slower than
the conventional secant method.
Therefore, before selecting an algorithm, it is important to examine more closely a
typical graph of the residual function f (x). Fig. 4.6a shows a graph of the residual func
tion f (x) as it typically arises in iteration loops (B) and (C). From this graph it becomes
clear, that, since the function is not monotonic near the root, great caution has to be exer-
cised during the iterations, to guarantee convergence to the root. Since the secant method
does not converge in this case, the Regula Falsi method must be used. To implement this
procedure, two starting values are needed, such that f (XO) . f (Xl) < 0 (Fig.4.6a). An
efficient method for selecting two starting values which bracket the solution will be
presented in the next section. Once the two starting values are chosen, the algorithm
unfolds in the fashion described previously.
Since the Regula Falsi method has a slow rate of convergence, it is important to
employ an acceleration scheme, such that the rate of convergence approaches that of the
secant method. The acceleration scheme is used, whenever consecutive iterates fall on the
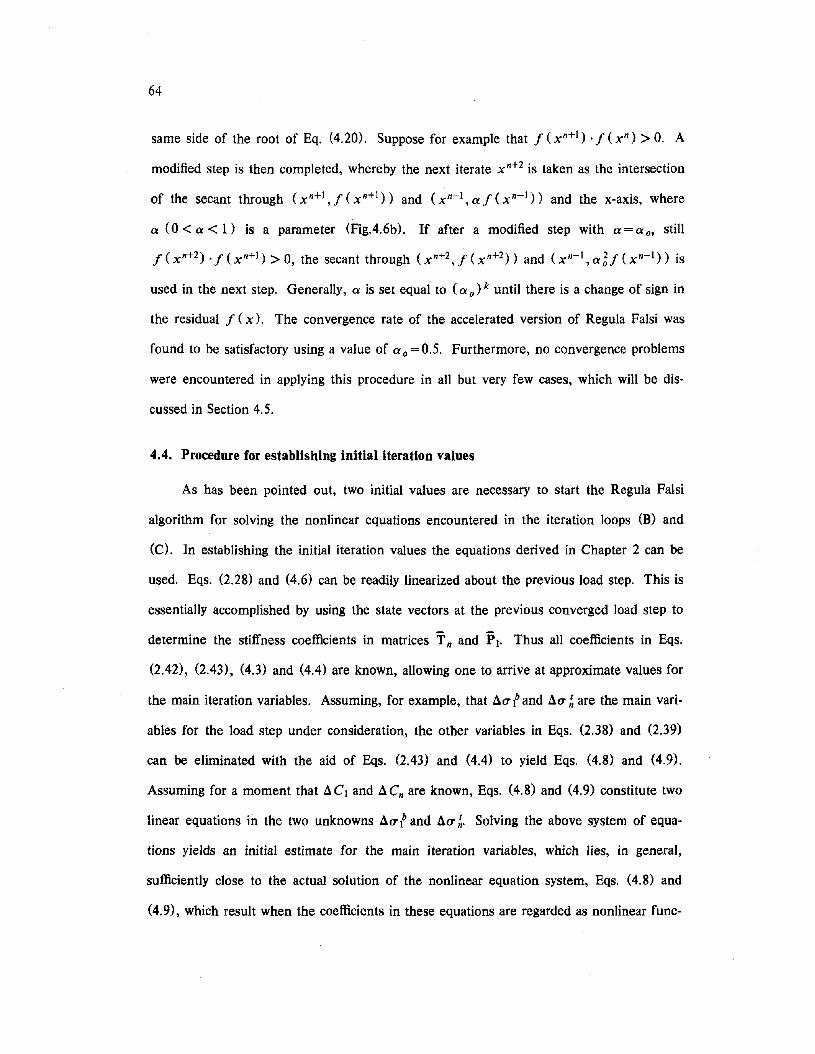
64
same side of the root of Eq. (4.20). Suppose for example that f (xn+l) . f (xn) > O. A
modified step is then completed, whereby the next iterate x n+2 is taken as the intersection
of the secant through (xn+l, f (xn+l » and (xn- l , ex f (x n- l » and the x-axis, where
ex (0 < ex < 1) is a parameter (Fig.4.6b). If after a modified step with ex = ex 0' still
f (xn+2) • f (x n+l ) > 0, the secant through (xn+2 , f (x n+2» and (x n- l , ex ~f (x n- l » is
used in the next step. Generally, ex is set equal to (ex 0 ) k until there is a change of sign in
the residual f ( x). The convergence rate of the accelerated version of Regula Falsi was
found to be satisfactory using a value of ex 0 = 0.5. Furthermore, no convergence problems
were encountered in applying this procedure in all but very few cases, which will be dis
cussed in Section 4.5.
4.4. Procedure for establishing initial iteration values
As has been pointed out, two initial values are necessary to start the Regula Falsi
algorithm for solving the nonlinear equations encountered in the iteration loops (B) and
(C). In establishing the initial iteration values the equations derived in Chapter 2 can be
used. Eqs. (2.28) and (4.6) can be readily linearized about the previous load step. This is
essentially accomplished by using the state vectors at the previous converged load step to
determine the stiffness coefficients in matrices Tn and Pl. Thus all coefficients in Eqs.
(2.42), (2.43), (4.3) and (4.4) are known, allowing one to arrive at approximate values for
the main iteration variables. Assuming, for example, that !i.u t and !i.u hare the main vari
ables for the load step under consideration, the other variables in Eqs. (2.38) and (2.39)
can be eliminated with the aid of Eqs. (2.43) and (4.4) to yield Eqs. (4.8) and (4.9).
Assuming for a moment that !i.Cl and !i.Cn are known, Eqs. (4.8) and (4.9) constitute two
linear equations in the two unknowns !i.ut and !i.u h. Solving the above system of equa
tions yields an initial estimate for the main iteration variables, which lies, in general,
sufficiently close to the actual solution of the nonlinear equation system, Eqs. (4.8) and
(4.9), which result when the coefficients in these equations are regarded as nonlinear func-
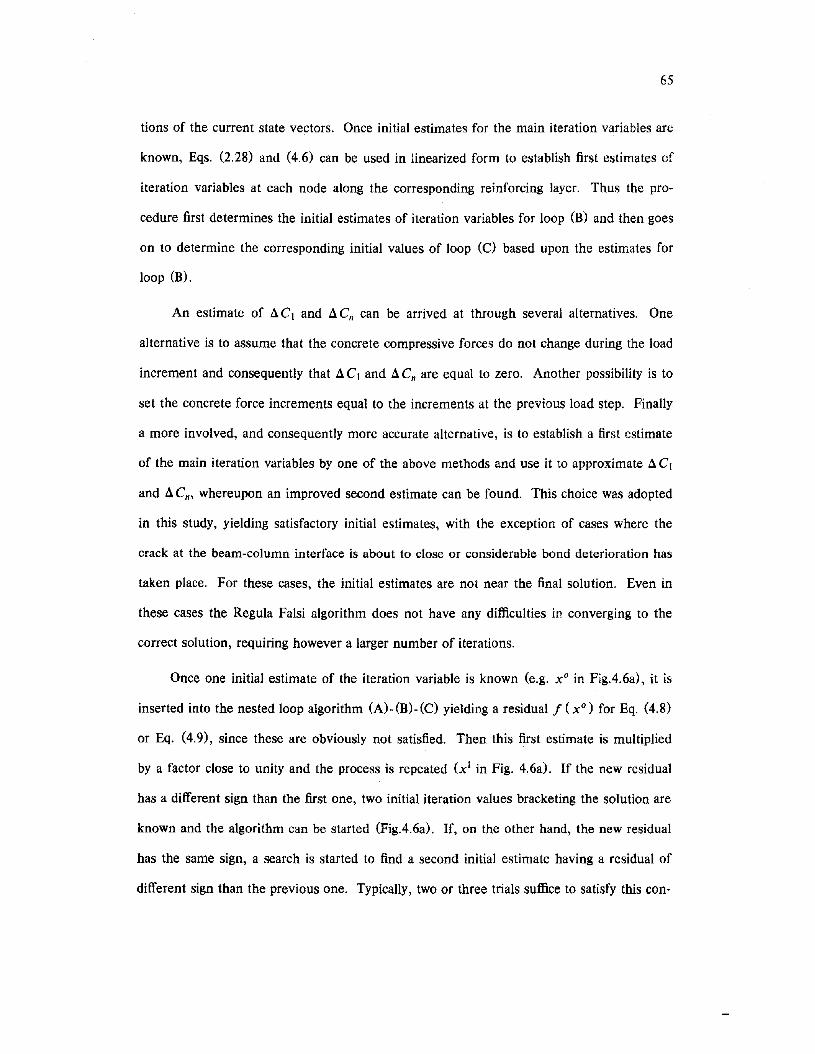
65
tions of the current state vectors. Once initial estimates for the main iteration variables are
known, Eqs. (2.28) and (4.6) can be used in linearized form to establish first estimates of
iteration variables at each node along the corresponding reinforcing layer. Thus the pro
cedure first determines the initial estimates of iteration variables for loop (B) and then goes
on to determine the corresponding initial values of loop (C) based upon the estimates for
loop (B).
An estimate of AC1 and ACn can be arrived at through several alternatives. One
alternative is to assume that the concrete compressive forces do not change during the load
increment and consequently that ACl and ACn are equal to zero. Another possibility is to
set the concrete force increments equal to the increments at the previous load step. Finally
a more involved, and consequently more accurate alternative, is to establish a first estimate
of the main iteration variables by one of the above methods and use it to approximate AC l
and ACm whereupon an improved second estimate can be found. This choice was adopted
in this study, yielding satisfactory initial estimates, with the exception of cases where the
crack at the beam-column interface is about to close or considerable bond deterioration has
taken place. For these cases, the initial estimates are not near the final solution. Even in
these cases the Regula Falsi algorithm does not have any difficulties in converging to the
correct solution, requiring however a larger number of iterations.
Once one initial estimate of the iteration variable is known (e.g. XO in Fig.4.6a), it is
inserted into the nested loop algorithm (A)-(B)-(C) yielding a residual f (XO) for Eq. (4.8)
or Eq. (4.9), since these are obviously not satisfied. Then this first estimate is multiplied
by a factor close to unity and the process is repeated (Xl in Fig. 4.6a). If the new residual
has a different sign than the first one, two initial iteration values bracketing the solution are
known and the algorithm can be started (Fig.4.6a). If, on the other hand, the new residual
has the same sign, a search is started to find a second initial estimate having a residual of
different sign than the previous one. Typically, two or three trials suffice to satisfy this con-
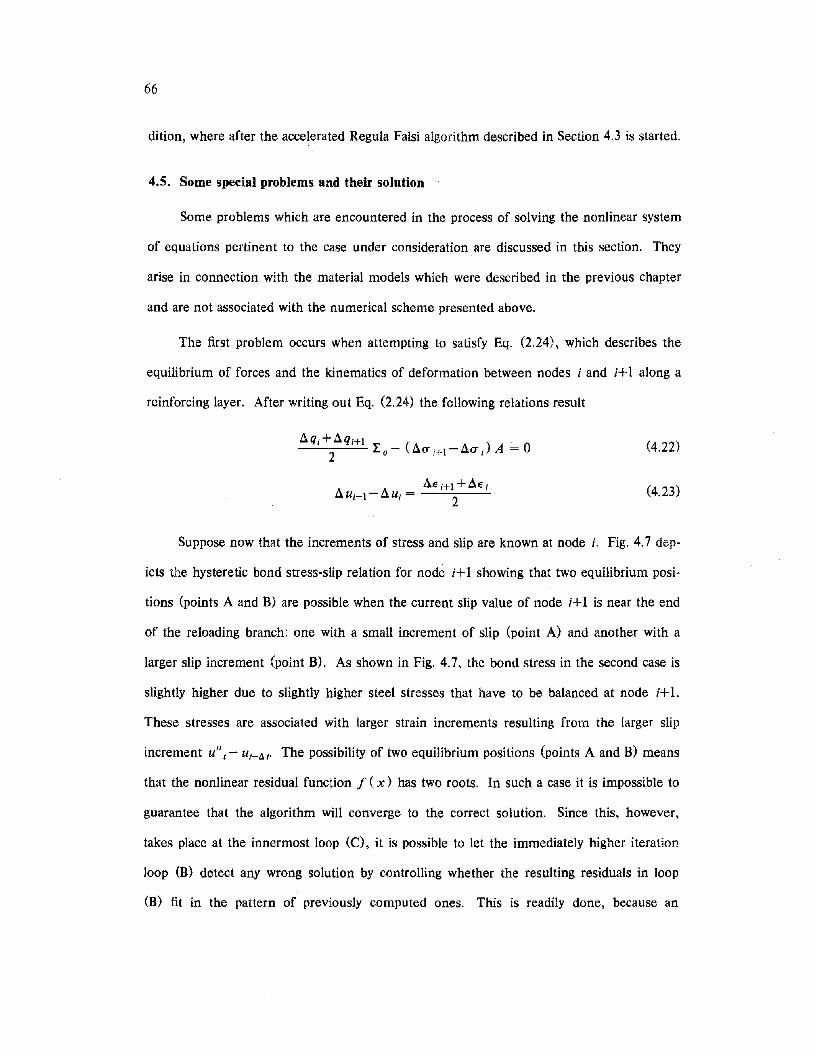
66
dition, where after the accelerated Regula Falsi algorithm described in Section 4.3 is started.
4.5. Some special problems and their solution
Some problems which are encountered in the process of solving the nonlinear system
of equations pertinent to the case under consideration are discussed in this section. They
arise in connection with the material models which were described in the previous chapter
and are not associated with the numerical scheme presented above.
The first problem occurs when attempting to satisfy Eq. (2.24), which describes the
equilibrium of forces and the kinematics of deformation between nodes i and i+1 along a
reinforcing layer. After writing out Eq. (2.24) the following relations result
(4.22)
(4.23)
Suppose now that the increments of stress and slip are known at node i. Fig. 4.7 dep-
icts the hysteretic bond stress-slip relation for node i+1 showing that two equilibrium posi-
tions (points A and B) are possible when the current slip value of node i+1 is near the end
of the reloading branch: one with a small increment of slip (point A) and another with a
larger slip increment (point B). As shown in Fig. 4.7, the bond stress in the second case is
slightly higher due to slightly higher steel stresses that have to be balanced at node i+1.
These stresses are associated with larger strain increments resulting from the larger slip
increment utI t- Ut-lit. The possibility of two equilibrium positions (points A and B) means
that· the nonlinear residual function f ( x) has two roots. In such a case it is impossible to
guarantee that the algorithm will converge to the correct solution. Since this, however,
takes place at the innermost loop (C), it is possible to let the immediately higher iteration
loop (B) detect any wrong solution by controlling whether the resulting residuals in loop
(B) fit in the pattern of previously computed ones. This is readily done, because an
67
incorrect solution at some node along the reinforcing layer produces extremely large residu
als in loop (B). In any case a good initial estimate of the iteration variable usually prevents
the algorithm from converging to the wrong root in all but a few cases.
The second problem is associated with the concrete section model and the instant of
crack closure at the joint end sections. As was elaborated upon in Section 3.3, concrete
strain increments are added to the previous total concrete strains only after the crack has
closed. This fact implies compatibility of strain increments between reinforcing steel and
surrounding concrete after crack closure.
Assume now that the crack is open at some load step and closes during the next load
or deformation increment. This means that the crack is closed only during part of the
deformation increment (Fig.4.8a). If steel strain increments associated with the imposed
deformation increment were considered compatible to the corresponding concrete strain
increments during the entire step, a discontinuity in the residual function f (x) would
result, as depicted in Fig. 4.8b. It is therefore important that the exact moment of crack
closure be determined when iterating on the global equilibrium equations, and that strain
increment compatibility be established only for that portion of the entire step for which the
crack is closed.
This is automatically accomplished during iteration loop (B) by storing the maximum
steel strain increment for which the crack remains open and subtracting it from all steel
strain increments for which the crack is closed before computing the resulting concrete
strain increments. This essentially means that the residual function f ( x) automatically
adjusts itself during the course of iterations to accommodate the fact that concrete strain
increments necessary for computing aC in Eqs. (4.8) and (4.9) have to be referred to the
deformation state at crack closure (Fig. 4.8a).
The described method proved very efficient in preventing any convergence problems
during crack closure, while retaining computational simplicity.

68
4.6. Computer program JOINT
A computer program called JOINT which determines the hysteretic response of inte
rior or exterior joints and beam inelastic regions was developed. The program implements
the analytical model presented in Chapter 2 along with models of hysteretic material
behavior as elaborated upon in Chapter 3. The nested loop algorithm described above is
used to solve the resulting system of nonlinear equations.
The program is divided into independent units which are schematically shown in Fig.
4.9. Each unit is in turn divided into subroutines. This systematic structure facilitates
modification of material models without interfering with the input-output subroutines or
the solution algorithm of the program.
Following information is used as input to the program:
(1) topology of the subassemblage along the longitudinal axis,
(2) load history data,
(3) material parameters for steel stress-strain, bond stress-slip and concrete stress-strain
models,
(4) section dimensions, top and bottom reinforcement data (area and bar circumference),
position of reinforcing layers,
(5) material-element correspondence along reinforcing layers,
(6) maximum allowable number of iterations in each loop,
(7) name of file which contains the output data and can be processed to obtain a graphic
representation of results,
The output consists of time histories of steel strain, bar slip, steel and bond stress
along the top and bottom reinforcing layer of the subregion, as well as time histories of
concrete strain and stress, crack width, moment, and concentrated rotation at cracked sec
tions.
69
CHAPTER 5
COMPARISON BETWEEN ANALYTICAL RESULTS
AND EXPERIMENTAL EVIDENCE
In this chapter a comparison of analytical predictions based on the proposed model
with experimental evidence will be presented and commented upon. The experimental evi
dence stems from a series of tests on half-scale beam-column subassemblages specifically
designed to study the behavior of interior joints under severe cyclic excitations. The cruci
form shaped assemblages (Fig.5.l) were proportioned and detailed so as to minimize diago
nal shear cracking and preclude significant shear deformations in the joint panel region.
Moreover the shear-span ratio of the girders limited the development of significant shear
stresses in the beam inelastic regions. Since the design of the subassemblages was based on
a strong column-weak beam design philosophy, the columns remained essentially elastic
during the entire load history and all inelastic action was concentrated in the interior joint
and in the beam inelastic regions. Because of the above considerations, the design of the
specimens satisfied the assumptions of the analytical model stated in the introduction to
Chapter 2. Thus the experimental evidence derived from these tests offers an ideal oppor
tunity to establish the validity of the proposed model.
5.1. Test specimens
In the series of tests reported in Refs. [42], [43] and [50], the specimens referred to
in the following, carried the names BC3 and BC4. The cruciform shaped half-scale beam
column subassemblages, shown in Fig. 5.1, modeled a part of a 20-story reinforced concrete
ductile moment-resisting frame at the third floor level. Both specimens had identical
configuration and dimensions consisting of two 9 in. by 16 in. girders and a 17 in. by 17 in.
70
square column. In both specimens the main longitudinal reinforcement of the girders con
sisted of four #6 bars at the top and three #5 bars at the bottom. Thus the area of rein
forcement at the bottom was about half that at the top following common design practice.
The mechanical properties of concrete used in casting the specimens were established on
the basis of standard concrete cylinder tests and are depicted in Fig. 5.2a. The mechanical
characteristics of reinforcing bars were determined from machined test specimens and are
shown in Fig. 5.2b. The two subassemblages were subjected to entirely different load his
tories: specimen BC4 was subjected to a single large displacement reversal simulating the
effect of a very severe pulse-like seismic excitation; this kind of load history can also be
used in establishing the monotonic moment-rotation envelope curve for the joint end sec
tions; specimen BC3 was subjected to a large number of deformation reversals of gradually
increasing magnitude.
Strains in the reinforcement were measured by weldable gages. The gages on the
beam longitudinal reinforcement were placed in the girder end region just outside the
column faces, so that their presence would not disturb the bond condition of the reinforc
ing bars anchored in the joint. Four precision linear potentiometers were used to measure
bar slippage at the four corners of the joint panel region. These were rigidly connected to
steel pins soldered to the reinforcing bars adjacent to the beam-column interfaces. Four
additional potentiometers were used to measure the sizes of the large beam-column inter
face cracks. As pointed out in Ref. [50], measurements at the interface crack were neces
sary, first, in order to compute the slippage of reinforcing bars relative to the surrounding
concrete at the beam-column interface, and secondly, in order to provide an alternative
determination of fixed-end rotations due to slippage of the bars in the connection.
The question of determining the fixed-end rotation at the beam-column interface
requires a thorough discussion. It is possible to compute the fixed-end rotation based on
the end slip of reinforcing bars which results due to bond deterioration within the joint
71
only. In this case the contribution of the relative slip between reinforcing bars and girder
end region is not included in the fixed-end rotation, but is taken into account when com-
puting the inelastic rotations in the girder end region. The fixed-end rotation is then based
on the following relation:
(5.l)
where u is the relative slip between reinforcing bars and surrounding concrete at the
beam-column interface resulting from bond deterioration in the joint only. A superscript
denotes top or bottom reinforcing layer and d' is the distance between the top and bottom
reinforcing bars.
Alternatively, the contribution of relative slip between reinforcing bars and surround-
ing concrete in the girder end region to the rotation at the beam-column interface can be
taken into account by determining the fixed-end rotation on the basis of the relation
Wi - wb
e FE = --d-'-'---
where w is the crack width at the top or bottom reinforcing layer (Fig.2.7).
(5.2)
In Ref. {50) fixed-end rotations were measured on the basis of Eq. (5.0 and the con-
tribution of the relative slip which arises in the girder inelastic region was included in the
girder rotations. In order to be able to directly compare analytical with experimental results
the same formulation was used in the following studies. The advantage of this approach
lies in the fact that attention is confined to the interaction between reinforcing steel and
concrete in the joint only leading to considerable simplification in the computations. The
disadvantage is that Eq. (5.0 yields erroneous results as soon as bond is completely dam
aged within the joint region and the bars start slipping through the joint. In this case the
bars can still be anchored in the girder end region adjacent to the joint. Because bond is
completely damaged in the joint, the crack at the beam-column interface on the push-in
side of the bars quickly closes during reloading. This process gives rise to large end slip

72
values on the pull side of the bars, which are underestimated by Eq. (5.l), where the rela
tive slip between reinforcing bars and surrounding concrete in the girder end region is not
taken into account. Neglecting the influence of the girder end region usually leads to a
sharp drop in the strength of the joint as soon as bond is completely damaged in the joint.
This decrease in strength is due to spalling of concrete cover in the girder end region and is
in reality much more gradual.
For the above reasons the results to be presented in the next two chapters remain
valid only as long as bond is not completely damaged in the joint. As soon as anchorage
failure initiates in the joint, the fixed-end rotations are underestimated and the decrease in
strength is overestimated. The instant of complete bond damage along the bars anchored in
the joint will be called in the following "joint anchorage failure". It should be kept in mind,
however, that 'Joint anchorage failure" does not imply complete anchorage failure and col
lapse of the subassemblage.
5.2. Comparison and discussion of results
5.2.1. General
Before proceeding with the discussion of results, it is necessary to consider the data
which are needed as input to the computer program JOINT. Apart from the imposed
deformation time history, the material mechanical characteristics for reinforcing steel and
confined and unconfined concrete, as well as bond stress-slip envelopes along the top and
bottom reinforcing bars anchored in the joint have to be specified.
The specification of material mechanical characteristics for steel and concrete is based
on the information given in Chapter 3 and on the data given in Fig. 5.2. The descending
slope Z of the concrete stress-strain relation in the strain softening range (Eq.3.20) and the
strength increase factor K in Eqs. (3.19)·(3.21) are determined from the amount of
confinement supplied by stirrup-ties in the girder end region. The beam stirrup-ties con-
73
sisted of #2 bars spaced at 3.5 in. center-to-center.
The specification of bond stress-slip envelope curves along the bars anchored in the
joint requires some clarification. As was pointed out in Section 3.2, the characteristic
values of the monotonic envelope curves can be based on suggestions presented in Ref.
[23]. For the sake of completeness these suggestions were summarized at the end of Sec
tion 3.2, where two different envelope curves were presented in the case of interior joints:
one pertaining to well confined concrete in the joint core region and the other pertaining to
unconfined concrete in the column cover (see also Fig.3 .12). The dividing line between
the two cases can not be sharply defined in a joint panel region. Therefore it is suggested
to assume a gradual transition between the region of well confined concrete and the region
of unconfined concrete. In summary, the following regions have been assumed in this
study (Fig.5.3):
(I) unconfined concrete extends 1 db into the column cover region on both ends of the
joint, where db is the reinforcing bar diameter,
(2) transition region between unconfined and confined concrete extends 2 db from the end
of the unconfined region on both ends of the joint,
(3) the remaining column core region is considered as confined concrete region.
The above recommendations regarding the extent of the unconfined concrete region
as well as the transition region are derived from the dimensions of the pull-out cone. More
details are presented in Refs. [23] and [SOl. Due to the limited number of tests on single
reinforcing bars embedded along the entire width of the column and subjected to cyclic
excitations, the above suggestions are tentative and need to be confirmed by further experi
mental evidence.
74
5.2.2. Specimen BC4
Experimental and analytical results for specimen BC4 are presented first. To avoid
ambiguity, the beam on the left of the column is referred to as "west beam". Similarly, the
beam to the right of the column is referred to as "east beam" (Fig.SA). For reasons of con
sistency, relative slip values are defined as positive if the reinforcing bars move in the posi
tive x-direction relative to the surrounding concrete (Fig.S.S). This implies that bar pull
out on the west beam side is associated with negative slip values, while positive slip values
represent bar pull-out on the east beam side. As noted previously, the fixed-end rotations
predicted by the analytical model are determined on the basis of Eq. (5.1) in order to facili
tate a comparison with experimental results.
Analytical and experimental results for specimen BC4 are presented in Figs. 5.6-5.9.
First, the global behavior of the beam-column joint is exhibited by means of the moment
rotation relation at the two end sections of the joint. The results of two analytical solutions
are compared with experimental evidence: the first analytical solution is based on a bilinear
steel stress-strain model while the second is based on Menegotto-Pinto's steel model which
accounts for the Bauschinger effect. Then the local behavior of the joint is investigated
more closely by studying the hysteretic relation between end moment and relative slip as
well as the relation between end moment and reinforcing steel strain at the two end sec
tions of the joint. In addition, the distribution of steel strain, steel stress, relative slip and
bond stress along the top and bottom reinforcing layers in the joint panel region is
presented at the end of each deformation excursion. Regarding the analytical predictions
on the local behavior, only the results which are based on the nonlinear steel model are
presented. In order to be able to relate the results pertaining to the local behavior of the
interior joint, shown in Figs. 5.7-5.9, to those on the global behavior depicted in Figs. 5.6a
and b, corresponding load points are identified by capital Roman letters. Joint end
moments are considered as positive when acting counterclockwise. This sign convention is
75
also shown on all figures where the fixed-end rotation is denoted by e F.
Figures 5.6a and b show the hysteretic moment-fixed-end rotation relation for the
west and east beam sides of the joint of specimen BC4" respectively. Since there is very lit
tle difference between the results of the two analytical models in the case of the west beam,
only the analytical predictions which are based on the nonlinear steel model are presented
in Fig.5.6a. It is noted that the analytical model represents satisfactorily the experimentally
observed behavior. In the case of Fig. 5.6b, which depicts the moment-rotation relation at
the east beam-column interface, noticeable deviations appear between the results of the two
analytical models during reloading after the first unloading. By contrast, no difference
exists in the behavior of the two models during the reloading phase following the second
unloading. In the case of the first reloading, the damage of bond in the joint panel region
is limited and the behavior of the joint end section during reloading is controlled by the
hysteretic behavior of steel. This happens because the crack at the beam-column interface
is open through the whole depth of the beam section. Clearly, neglecting the Bauschinger
effect in this case causes significant deviations between predicted and actual response. In
the case of the second reloading, the previously inflicted bond damage is quite substantial
causing the bars to slip freely through the joint. In this case the behavior of the joint end
section is controlled by the hysteretic behavior of bond and the inclusion of the Bausch
inger effect does not affect the results very much. The substantial loss of strength of the
joint after two severe deformation reversals is evident in Fig. 5.6b (point C). This is due to
complete bond damage in the joint panel region which leads to joint anchorage failure.
Figure 5.7 depicts analytical and experimental results of the end moment-relative slip
relation at the four corners of the joint panel region. As pointed out in Chapter 4 the
boundary conditions in the case of interior joints are imposed by specifying slip increments
dUf and dU/~ or dui and dU/~ depending on the sense of the applied end moments. This
explains why the analytical pull-out values at the instant of load reversal coincide with
76
experimental data (Fig.5.7). By contrast, the push-in values in Fig. 5.7 are determined by
the analytical joint model and, therefore, only approximate the experimental results. This
fact accounts for the small deviations between analytical and experimental fixed-end rota
tions at the instant of load reversal (Fig.5.6). As can be seen in Fig. 5.7, the experimental
moment-slip history is well represented by the analytical model. In particular the closing
process of the bottom crack, Fig. 5.7a, characterized by the abrupt change of stiffness in the
moment-slip curve, is satisfactorily predicted. Clearly, no analytical model can possibly
describe the gradual crack closing process, which is due to the presence of concrete rubble
and the effects of shear sliding at the crack interface. Nonetheless it is important that the
model predicts accurately the instant of crack closure. This seems to be the case with the
proposed model.
It is to be noted that the upper crack on the east beam side remains open at load point
B (Fig.5.7d). At the same time the bottom crack opens to a width of 8 mm (Fig.5.7c).
This fact is explained in detail later in connection with results for specimen BC3. It is
important to note at this stage, however, that, while the crack at the beam-column interface
remains open across the whole depth of the beam section, the shear is transferred across
the interface only by dowel action of the beam reinforcing bars. This can lead to significant
shear sliding and inflict additional bond damage in the vicinity of the crack.
Fig. 5.8 shows the moment-strain relation at the four corners of the joint panel
region. In this case the experimental results can only be compared qualitatively, since, as
reported in Ref. [50], the steel strains have been measured by 9 in. long strain gages. The
measured strains thus represent average strains over the length of 9 in. and cannot be
directly compared to analytically predicted strains which are computed at the location of the
beam-column interface. As the distribution of steel strains along reinforcing bars in
cracked RIC members clearly indicate, steel strains decrease very quickly away from the
location of a crack. Analytical predictions compare nonetheless satisfactorily with experi-
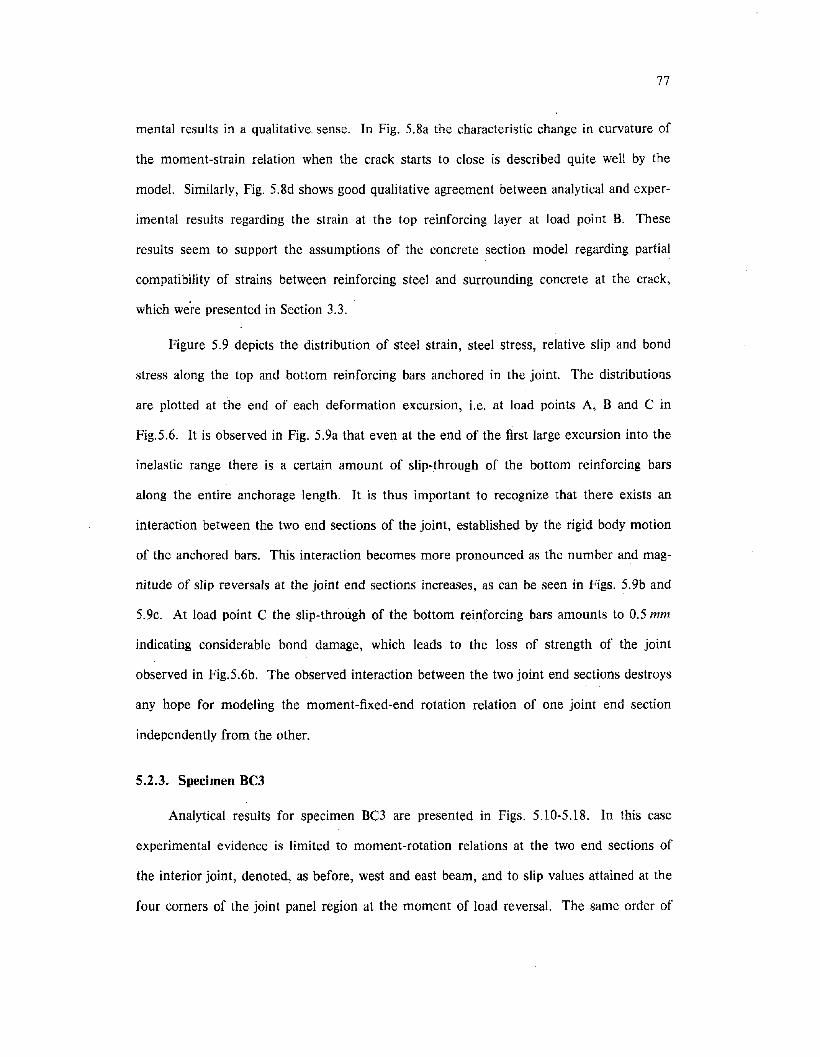
77
mental results in a qualitative. sense. In Fig. 5.8a the characteristic change in curvature of
the moment-strain relation when the crack starts to close is described quite well by the
model. Similarly, Fig. 5.8d shows good qualitative agreement between analytical and exper
imental results regarding the strain at the top reinforcing layer at load point B. These
results seem to support the assumptions of the concrete section model regarding partial
compatibility of strains between reinforcing steel and surrounding concrete at the crack,
which we're presented in Section 3.3.
Figure 5.9 depicts the distribution of steel strain, steel stress, relative slip and bond
stress along the top and bottom reinforcing bars anchored in the joint. The distributions
are plotted at the end of each deformation excursion, Le. at load points A, Band C in
Fig.5.6. It is observed in Fig. 5.9a that even at the end of the first large excursion into the
inelastic range there is a certain amount of slip-through of the bottom reinforcing bars
along the entire anchorage length. It is thus important to recognize that there exists an
interaction between the two end sections of the joint, established by the rigid body motion
of the anchored bars. This interaction becomes more pronounced as the number and mag
nitude of slip reversals at the joint end sections increases, as can be seen in Figs. 5.9b and
5.9c. At load point C the slip-through of the bottom reinforcing bars amounts to 0.5 mm
indicating considerable bond damage, which leads to the loss of strength of the joint
observed in Fig.5.6b. The observed interaction between the two joint end sections destroys
any hope for modeling the moment-fixed-end rotation relation of one joint end section
independently from the other.
5.2.3. Specimen BC3
Analytical results for specimen BC3 are presented in Figs. 5.10-5.18. In this case
experimental evidence is limited to moment-rotation relations at the two end sections of
the interior joint, denoted, as before, west and east beam, and to slip values attained at the
four corners of the joint panel region at the moment of load reversal. The same order of

78
presentation as in the case of specimen BC4 is followed. Only the analytical results which
are based on the nonlinear steel model are discussed. In the case of several cycles of defor
mation reversals the use of a bilinear steel model leads to inaccuracies and should be
avoided.
First, the global behavior of the interior joint is presented by means of the hysteretiG
moment-rotation relation at the two beam-column interfaces, shown in Figs. 5.10-5.12.
Fig. 5.10 depicts the analytically predicted moment-fixed-end rotation relation of the joint
end sections up to rotation values of 0.01 rad. Fig. 5.11 on the other hand shows the
moment-fixed-end rotation relation until the moment that, due to pull-out of the bars in
the bottom reinforcing layer, "joint anchorage failure" is initiated. At the same time, as
shown in Fig. 5.11 b, considerable loss of strength of the joint takes place due to complete
damage of bond along the bottom reinforcing layer. In order to facilitate a comparison of
analytical results with experimental evidence, single moment-rotation loops are selected
from Fig. 5.10 and plotted individually in Fig. 5.12.
The local behavior of the interior joint is studied by means of the relation between
end moment and relative slip as well as the relation between end moment and reinforcing
steel strain at the beam-column interfaces, shown in Figs. 5.13-5.14. Also, the steel stress
strain time history in the top and bottom reinforcing bars is depicted in Fig.5.15. The dis
tribution of steel strain, steel stress, relative slip and bond stress along the top and bottom
reinforcing layers in the joint panel region is presented at the end of the four last deforma
tion excursions before anchorage failure. In order to be able to associate the results per
taining to the local behavior of the interior joint, shown in Figs. 5.13-5.16, to those on the
global behavior depicted in Figs. 5.10-5.12, corresponding load points are identified by capi
tal Roman letters ( K,L,M and N ). Joint end moments are considered as positive when
acting counterclockwise. This sign convention is also shown on all figures.
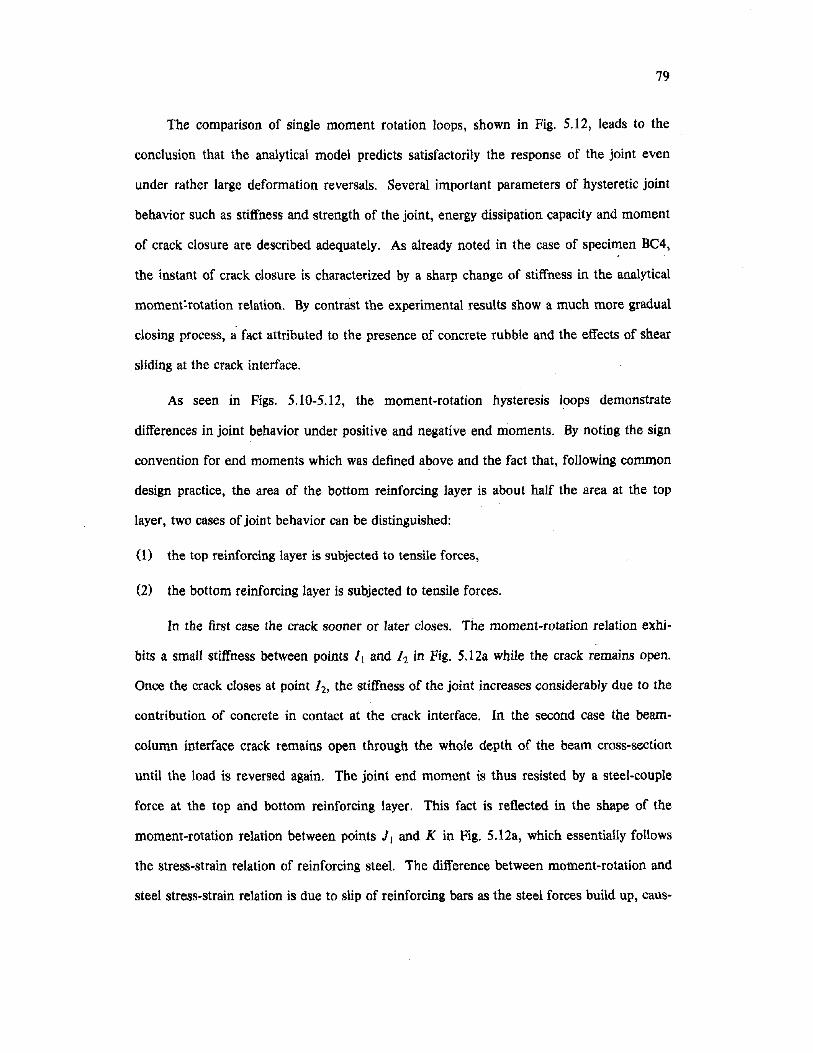
79
The comparison of single moment rotation loops, shown in Fig. 5.12, leads to the
conclusion that the analytical model predicts satisfactorily the response of the joint even
under rather large deformation reversals. Several important parameters of hysteretic joint
behavior such as stiffness and strength of the joint, energy dissipation capacity and moment
of crack closure are described adequately. As already noted in the case of specimen BC4,
the instant of crack closure is characterized by a sharp change of stiffness in the analytical
moment:rotation relation. By contrast the experimental results show a much more gradual
closing process, a fact attributed to the presence of concrete rubble and the effects of shear
sliding at the crack interface.
As seen in Figs. 5.10-5.12, the moment-rotation hysteresis loops demonstrate
differences in joint behavior under positive and negative end moments. By noting the sign
convention for end moments which was defined above and the fact that, following common
design practice, the area of the bottom reinforcing layer is about half the area at the top
layer, two cases of joint behavior can be distinguished:
(1) the top reinforcing layer is subjected to tensile forces,
(2) the bottom reinforcing layer is subjected to tensile forces.
In the first case the crack sooner or later closes. The moment-rotation relation exhi
bits a small stiffness between points /1 and /2 in Fig. 5.12a while the crack remains open.
Once the crack closes at point h. the stiffness of the joint increases considerably due to the
contribution of concrete in contact at the crack: interface. In the second case the beam
column interface crack: remains open through the whole depth of the beam cross-section
until the load is reversed again. The joint end moment is thus resisted by a steel-couple
force at the top and bottom reinforcing layer. This fact is reflected in the shape of the
moment-rotation relation between points J1 and K in Fig. 5.12a, which essentially follows
the stress-strain relation of reinforcing steel. The difference between moment-rotation and
steel stress-strain relation is due to slip of reinforcing bars as the steel forces build up, caus-
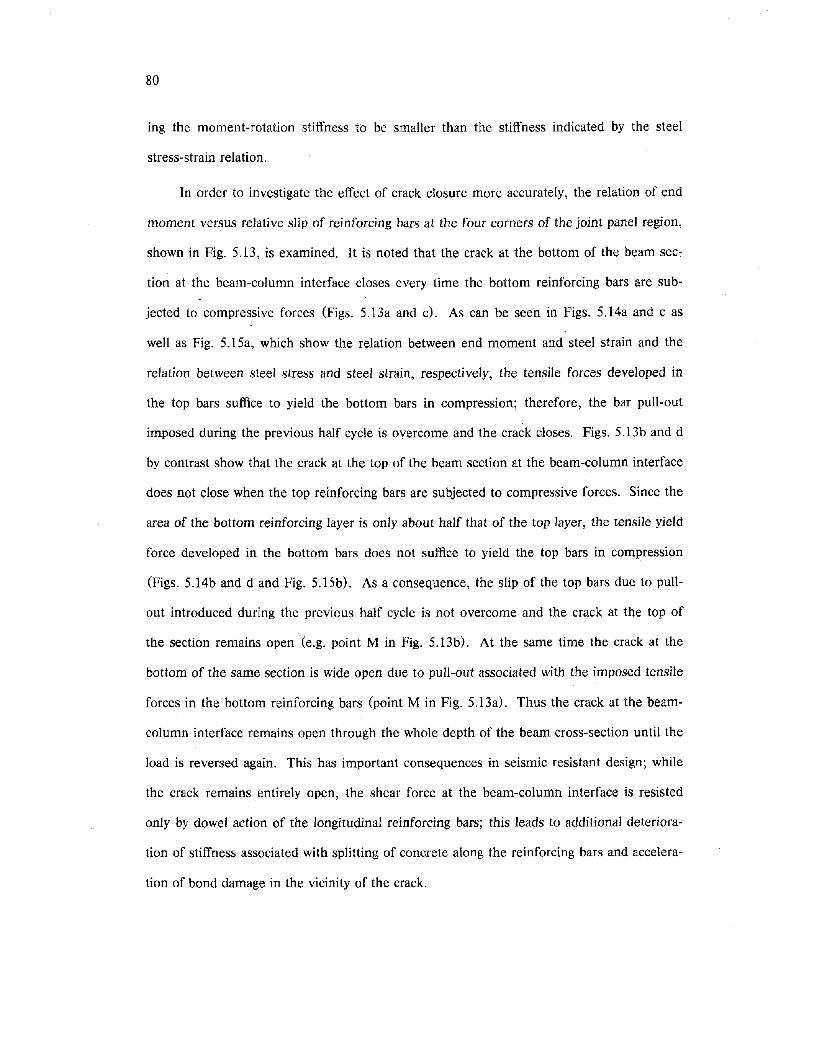
80
ing the moment-rotation stiffness tb be smaller than the stiffness indicated by the steel
stress-strain relation.
In order to investigate the effect of crack closure more accurately, the relation of end
moment versus relative slip of reinforcing bars at the four corners of the joint panel region,
shown in Fig. 5.13, is examined. It is noted that the crack at the bottom of the beam sec
tion at the beam-column interface closes every time the bottom reinforcing bars are sub
jected to compressive forces (Figs. 5.13a and c). As can be seen in Figs. 5.14a and c as
well as Fig. 5.15a, which show the relation between end moment and steel strain and the
relation between steel stress and steel strain, respectively, the tensile forces developed in
the top bars suffice to yield the bottom bars in compression; therefore, the bar pull-out
imposed during the previous half cycle is overcome and the crack closes. Figs. 5.13b and d
by contrast show that the crack at the top of the beam section at the beam-column interface
does not close when the top reinforcing bars are subjected to compressive forces. Since the
area of the bottom reinforcing layer is only about half that of the top layer, the tensile yield
force developed in the bottom bars does not suffice to yield the top bars in compression
(Figs. 5.14b and d and Fig. 5.15b). As a consequence, the slip of the top bars due to pull
out introduced during the previous half cycle is not overcome and the crack at the top of
the section remains open (e.g. point M in Fig. 5.13b). At the same time the crack at the
bottom of the same section is wide open due to pull-out associated with the imposed tensile
forces in the bottom reinforcing bars (point M in Fig. 5.13a). Thus the crack at the beam
column interface remains open through the whole depth of the beam cross-section until the
load is reversed again. This has important consequences in seismic resistant design; while
the crack remains entirely open, the shear force at the beam-column interface is resisted
only by dowel action of the longitudinal reinforcing bars; this leads to additional deteriora
tion of stiffness associated with splitting of concrete along the reinforcing bars and accelera
tion of bond damage in the vicinity of the crack.
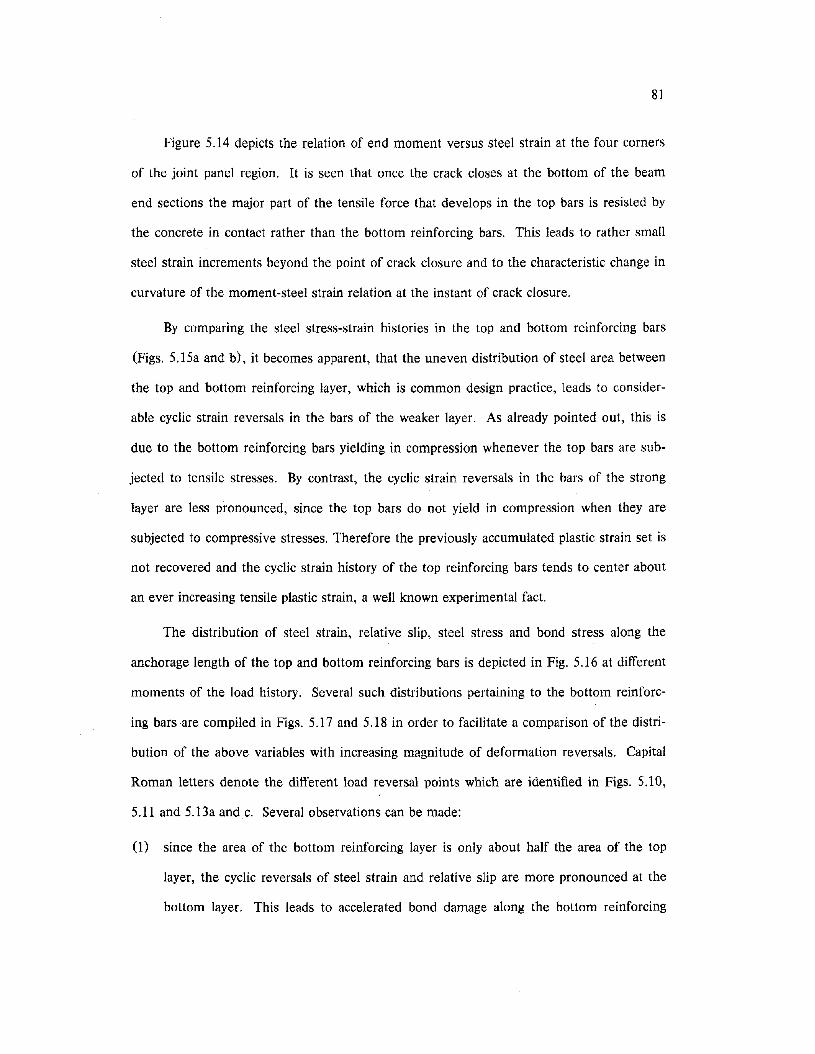
81
Figure 5.14 depicts the relation of end moment versus steel strain at the four corners
of the joint panel region. It is seen that once the crack closes at the bottom of the beam
end sections the major part of the tensile force that develops in the top bars is resisted by
the concrete in contact rather than the bottom reinforcing bars. This leads to rather small
steel strain increments beyond the point of crack closure and to the characteristic change in
curvature of the moment-steel strain relation at the instant of crack closure.
By comparing the steel stress-strain histories in the top and bottom reinforcing bars
(Figs. 5.15a and b), it becomes apparent, that the uneven distribution of steel area between
the top and bottom reinforcing layer, which is common design practice, leads to consider
able cyclic strain reversals in the bars of the weaker layer. As already pointed out, this is
due to the bottom reinforcing bars yielding in compression whenever the top bars are sub
jected to tensile stresses. By contrast, the cyclic strain reversals in the bars of the strong
layer are less pronounced, since the top bars do not yield in compression when they are
subjected to compressive stresses. Therefore the previously accumulated plastic strain set is
not recovered and the cyclic strain history of the top reinforcing bars tends to center about
an ever increasing tensile plastic strain, a well known experimental fact.
The distribution of steel strain, relative slip, steel stress and bond stress along the
anchorage length of the top and bottom reinforcing bars is depicted in Fig. 5.16 at different
moments of the load history. Several such distributions pertaining to the bottom reinforc
ing bars are compiled in Figs. 5.17 and 5.18 in order to facilitate a comparison of the distri
bution of the above variables with increasing magnitude of deformation reversals. Capital
Roman letters denote the different load reversal points which are identified in Figs. 5.10,
5.11 and 5.13a and c. Several observations can be made:
(1) since the area of the bottom reinforcing layer is only about half the area of the top
layer, the cyclic reversals of steel strain and relative slip are more pronounced at the
bottom layer. This leads to accelerated bond damage along the bottom reinforcing
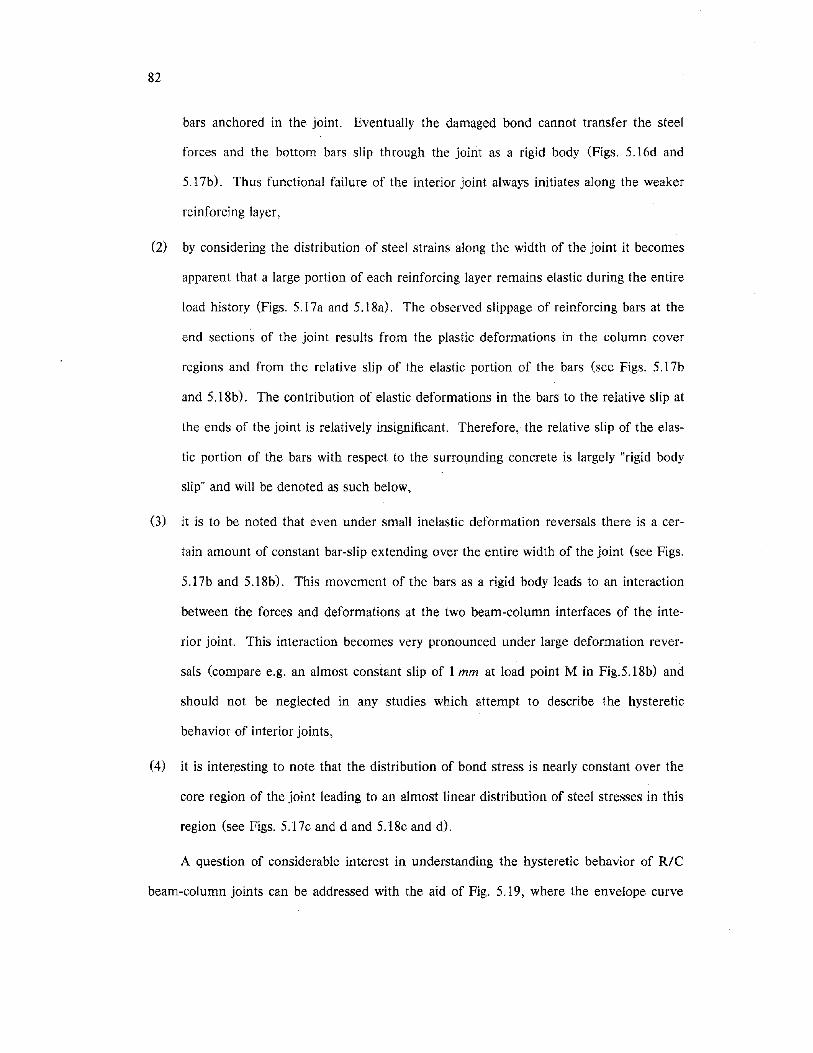
82
bars anchored in the joint. Eventually the damaged bond cannot transfer the steel
forces and the bottom bars slip through the joint as a rigid body (Figs. 5.16d and
5.17b). Thus functional failure of the interior joint always initiates along the weaker
reinforcing layer,
(2) by considering the distribution of steel strains along the width of the joint it becomes
apparent that a large portion of each reinforcing layer remains elastic during the entire
load history (Figs. 5.17a and 5.18a). The observed slippage of reinforcing bars at the
end sections of the joint results from the plastic deformations in the column cover
regions and from the relative slip of the elastic portion of the bars (see Figs. 5.17b
and 5.18b). The contribution of elastic deformations in the bars to the relative slip at
the ends of the joint is relatively insignificant. Therefore, the relative slip of the elas
tic portion of the bars with respect to the surrounding concrete is largely "rigid body
slip" and will be denoted as such below,
(3) it is to be noted that even under small inelastic deformation reversals there is a cer
tain amount of constant bar-slip extending over the entire width of the joint (see Figs.
5.17b and 5.18b). This movement of the bars as a rigid body leads to an interaction
between the forces and deformations at the two beam-column interfaces of the inte
rior joint. This interaction becomes very pronounced under large deformation rever
sals (compare e.g. an almost constant slip of 1 mm at load point M in Fig.5.18b) and
should not be neglected in any studies which attempt to describe the hysteretic
behavior of interior joints,
(4) it is interesting to note that the distribution of bond stress is nearly constant over the
core region of the joint leading to an almost linear distribution of steel stresses in this
region (see Figs. 5.1 7c and d and 5.18c and d).
A question of considerable interest in understanding the hysteretic behavior of RIC
beam-column joints can be addressed with the aid of Fig. 5.19, where the envelope curve
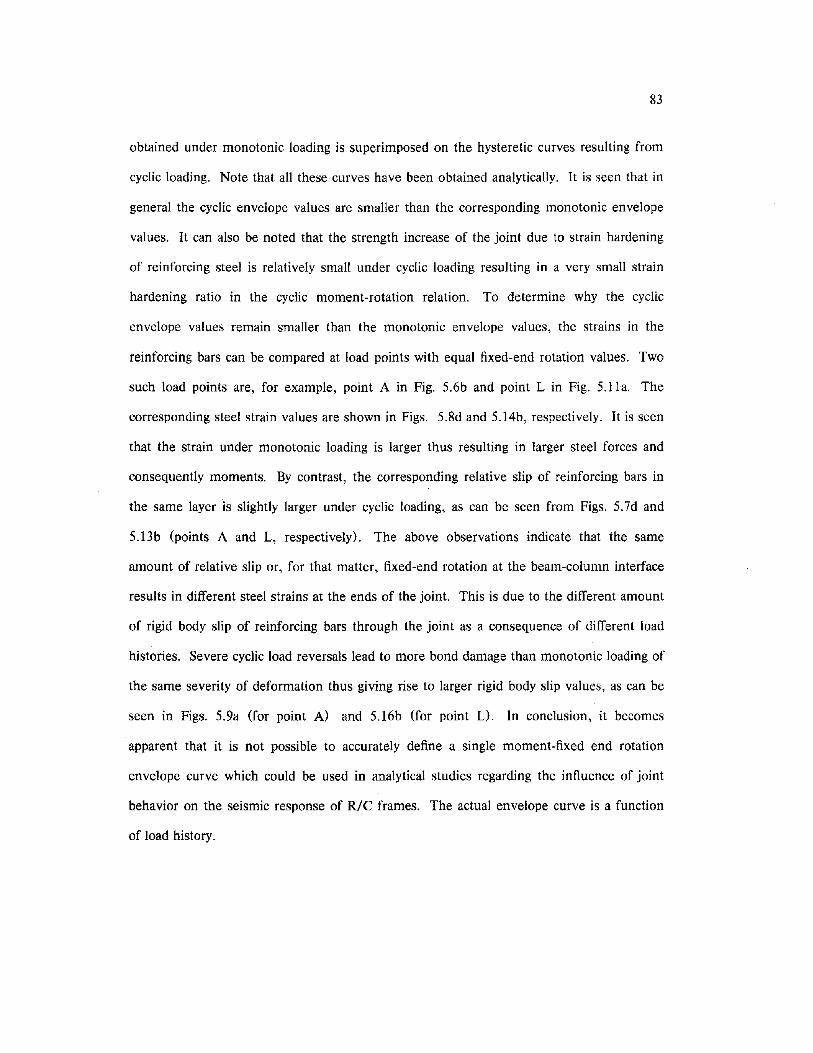
83
obtained under monotonic loading is superimposed on the hysteretic curves resulting from
cyclic loading. Note that all these curves have been obtained analytically. It is seen that in
general the cyclic envelope values are smaller than the corresponding monotonic envelope
values. It can also be noted that the strength increase of the joint due to strain hardening
of reinforcing steel is relatively small under cyclic loading resulting in a very small strain
hardening ratio in the cyclic moment-rotation relation. To determine why the cyclic
envelope values remain smaller than the monotonic envelope values, the strains in the
reinforcing bars can be compared at load points with equal fixed-end rotation values. Two
such load points are, for example, point A in Fig. 5.6b and point L in Fig. 5.11a. The
corresponding steel strain values are shown in Figs. 5.8d and 5.14b, respectively. It is seen
that the strain under monotonic loading is larger thus resulting in larger steel forces and
consequently moments. By contrast, the corresponding relative slip of reinforcing bars in
the same layer is slightly larger under cyclic loading, as can be seen from Figs. 5.7d and
5.13b (points A and L, respectively). The above observations indicate that the same
amount of relative slip or, for that matter, fixed-end rotation at the beam-column interface
results in different steel strains at the ends of the joint. This is due to the different amount
of rigid body slip of reinforcing bars through the joint as a consequence of different load
histories. Severe cyclic load reversals lead to more bond damage than monotonic loading of
the same severity of deformation thus giving rise to larger rigid body slip values, as can be
seen in Figs. 5.9a (for point A) and 5.16b (for point 0. In conclusion, it becomes
apparent that it is not possible to accurately define a single moment-fixed end rotation
envelope curve which could be used in analytical studies regarding the influence of joint
behavior on the seismic response of RIC frames. The actual envelope curve is a function
of load history.
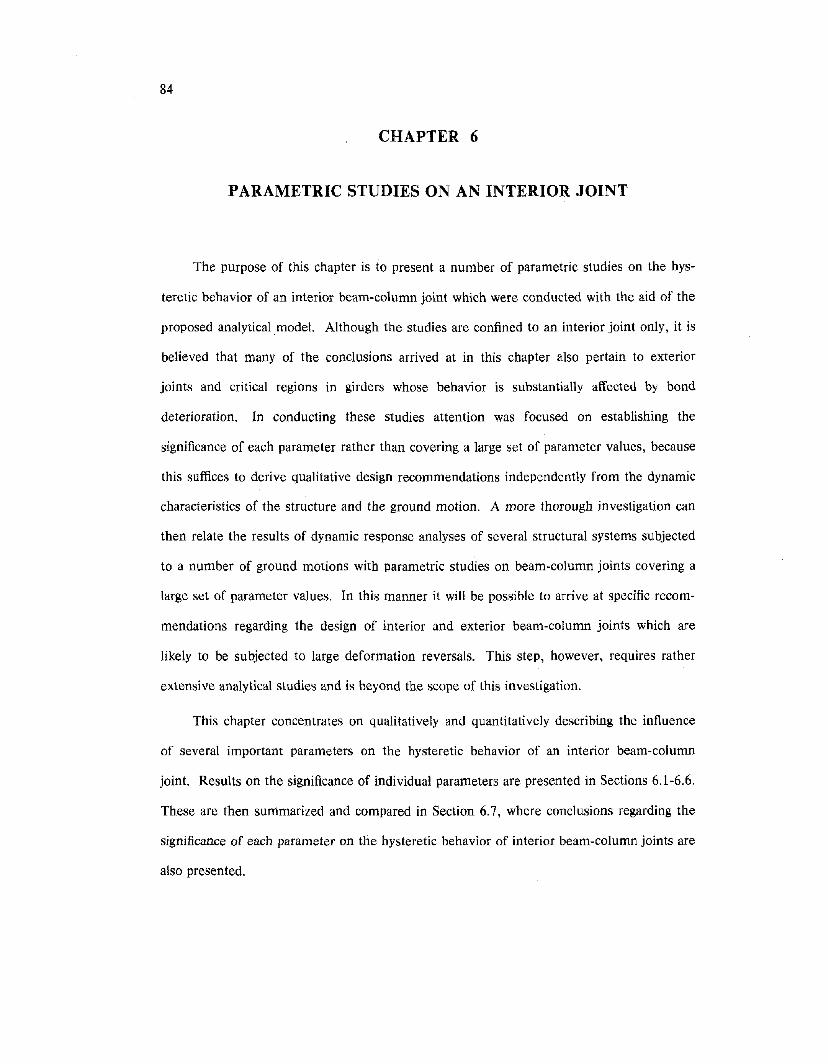
84
CHAPTER 6
PARAMETRIC STUDIES ON AN INTERIOR JOINT
The purpose of this chapter is to present a number of parametric studies on the hys
teretic behavior of an interior beam-column joint which were conducted with the aid of the
proposed analytical model. Although the studies are confined to an interior joint only, it is
believed that many of the conclusions arrived at in this chapter also pertain to exterior
joints and critical regions in girders whose behavior is substantially affected by bond
deterioration. In conducting these studies attention was focused on establishing the
significance of each parameter rather than covering a large set of parameter values, because
this suffices to derive qualitative design recommendations independently from the dynamic
characteristics of the structure and the ground motion. A more thorough investigation can
then relate the results of dynamic response analyses of several structural systems subjected
to a number of ground motions with parametric studies on beam-column joints covering a
large set of parameter values. In this manner it will be possible to arrive at specific recom
mendations regarding the design of interior and exterior beam-column joints which are
likely to be subjected to large deformation reversals. This step, however, requires rather
extensive analytical studies and is beyond the scope of this investigation.
This chapter concentrates on qualitatively and quantitatively describing the influence
of several important parameters on the hysteretic behavior of an interior beam-column
joint. Results oil the significance of individual parameters are presented in Sections 6.1-6.6.
These are then summarized and compared in Section 6.7, where conclusions regarding the
significance of each parameter on the hysteretic behavior of interior beam-column joints are
also presented.
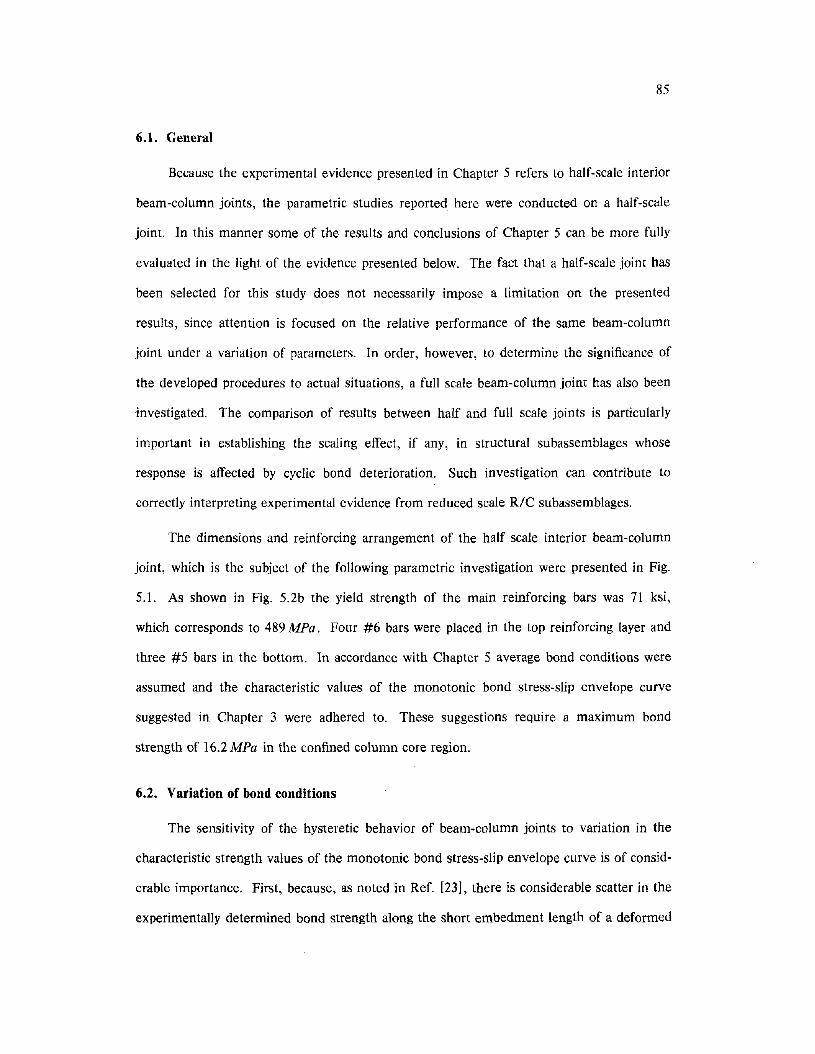
85
6.1. General
Because the experimental evidence presented in Chapter 5 refers to half-scale interior
beam-column joints, the parametric studies reported here were conducted on a half-scale
joint. In this manner some of the results and conclusions of Chapter 5 can be more fully
evaluated in the light of the evidence presented below. The fact that a half-scale joint has
been selected for this study does not necessarily impose a limitation on the presented
results, since attention is focused on the relative performance of the same beam-column
joint under a variation of parameters. In order, however, to determine the significance of
the developed procedures to actual situations, a full scale beam-column joint has also been
investigated. The comparison of results between half and full scale joints is particularly
important in establishing the scaling effect, if any, in structural subassemblages whose
response is affected by cyclic bond deterioration. Such investigation can contribute to
correctly interpreting experimental evidence from reduced scale RiC subassemblages.
The dimensions and reinforcing arrangement of the half scale interior beam-column
joint, which is the subject of the following parametric investigation were presented in Fig.
5.1. As shown in Fig. 5.2b the yield strength of the main reinforcing bars was 71 ksi,
which corresponds to 489 MPa. Four #6 bars were placed in the top reinforcing layer and
three #5 bars in the bottom. In accordance with Chapter 5 average bond conditions were
assumed and the characteristic values of the monotonic bond stress-slip envelope curve
suggested in Chapter 3 were adhered to. These suggestions require a maximum bond
strength of 16.2 MPa in the confined column core region.
6.2. Variation of bond conditions
The sensitivity of the hysteretic behavior of beam-column joints to variation in the
characteristic strength values of the monotonic bond stress-slip envelope curve is of consid
erable importance. First, because, as noted in Ref. [23], there is considerable scatter in the
experimentally determined bond strength along the short embedment length of a deformed
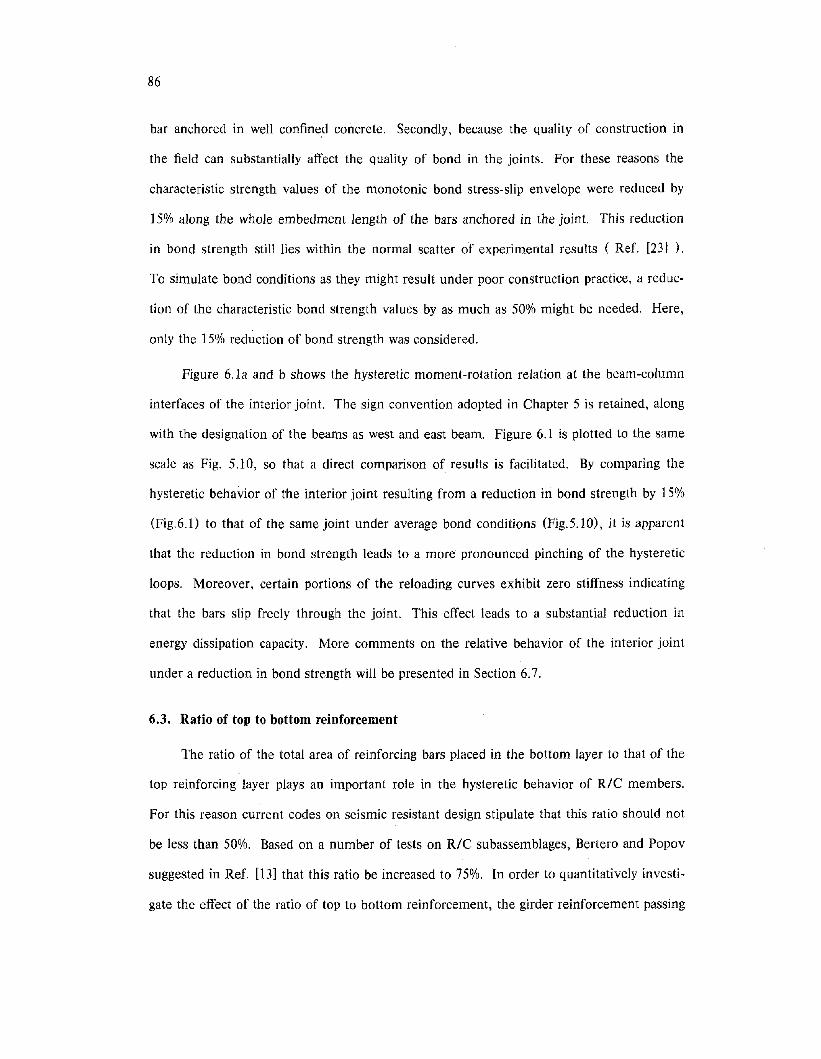
86
bar anchored in well confined concrete. Secondly, because the quality of construction in
the field can substantially affect the quality of bond in the joints. For these reasons the
characteristic strength values of the monotonic bond stress-slip envelope were reduced by
15% along the whole embedment length of the bars anchored in the joint. This reduction
in bond strength still lies within the normal scatter of experimental results ( Ref. [23] ).
To simulate bond conditions as they might result under poor construction practice, a reduc
tion of the characteristic bond strength values by as much as 50% might be needed. Here,
only the 15% reduction of bond strength was considered.
Figure 6.1a and b shows the hysteretic moment-rotation relation at the beam-column
interfaces of the interior joint. The sign convention adopted in Chapter 5 is retained, along
with the designation of the beams as west and east beam. Figure 6.1 is plotted to the same
scale as Fig. 5.10, so that a direct comparison of results is facilitated. By comparing the
hysteretic behavior of the interior joint resulting from a reduction in bond strength by 15%
(Fig.6.D to that of the same joint under average bond conditions (Fig.S.10), it is apparent
that the reduction in bond strength leads to a more pronounced pinching of the hysteretic
loops. Moreover, certain portions of the reloading curves exhibit zero stiffness indicating
that the bars slip freely through the joint. This effect leads to a substantial reduction in
energy dissipation capacity. More comments on the relative behavior of the interior joint
under a reduction in bond strength will be presented in Section 6.7.
6.3. Ratio of top to bottom reinforcement
The ratio of the total area of reinforcing bars placed in the bottom layer to that of the
top reinforcing layer plays an important role in the hysteretic behavior of RIC members.
For this reason current codes on seismic resistant design stipulate that this ratio should not
be less than 50%. Based on a number of tests on RIC subassemblages, Bertero and Popov
suggested in Ref. [13] that this ratio be increased to 75%. In order to quantitatively investi
gate the effect of the ratio of top to bottom reinforcement, the girder reinforcement passing
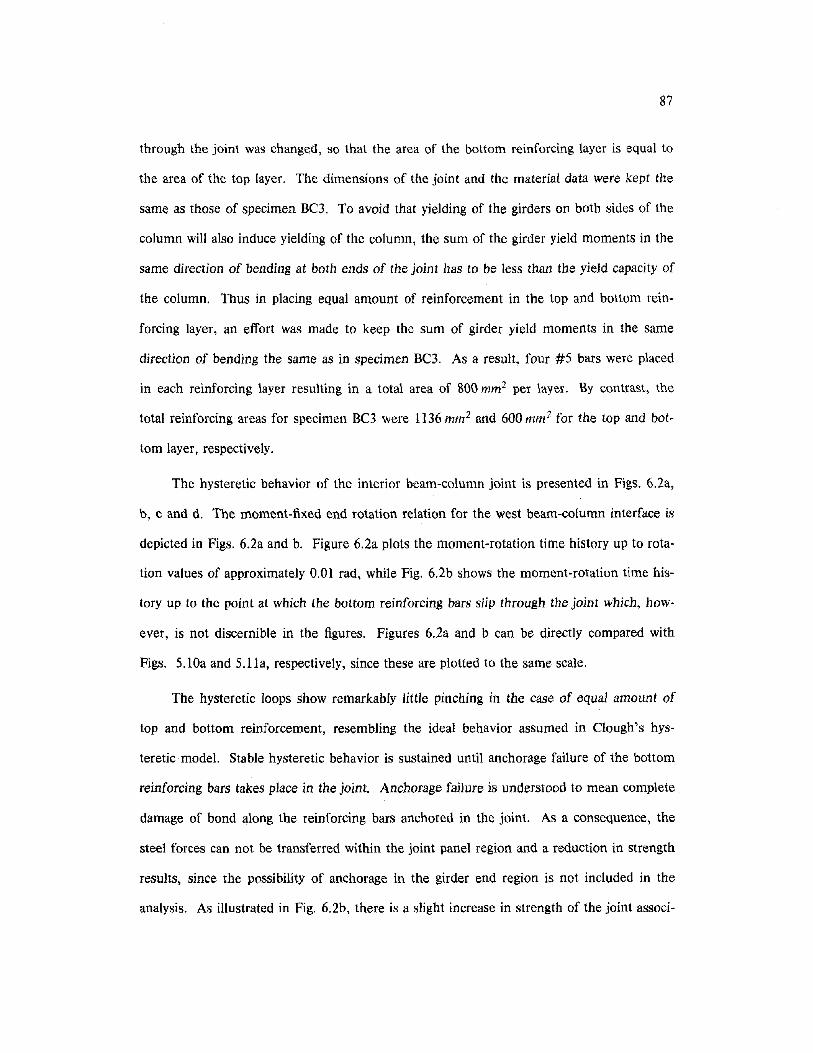
87
through the joint was changed, so that the area of the bottom reinforcing layer is equal to
the area of the top layer. The dimensions of the joint and the material data were kept the
same as those of specimen BC3. To avoid that yielding of the girders on both sides of the
column will also induce yielding of the column, the sum of the girder yield moments in the
same direction of bending at both ends of the joint has to be less than the yield capacity of
the column. Thus in placing equal amount of reinforcement in the top and bottom rein
forcing layer, an effort was made to keep the sum of girder yield moments in the same
direction of bending the same as in specimen BC3. As a result, four #5 bars were placed
in each reinforcing layer resulting in a total area of 800 mm2 per layer. By contrast, the
total reinforcing areas for specimen BC3 were 1136 mm2 and 600 mm 2 for the top and bot
tom layer, respectively.
The hysteretic behavior of the interior beam-column joint is presented in Figs. 6.2a,
b, c and d. The moment-fixed end rotation relation for the west beam-column interface is
depicted in Figs. 6.2a and b. Figure 6.2a plots the moment-rotation time history up to rota
tion values of approximately 0.01 rad, while Fig. 6.2b shows the moment-rotation time his
tory up to the point at which the bottom reinforcing bars slip through the joint which, how
ever, is not discernible in the figures. Figures 6.2a and b can be directly compared with
Figs. 5.lOa and 5.11a, respectively, since these are plotted to the same scale.
The hysteretic loops show remarkably little pinching in the case of equal amount of
top and bottom reinforcement, resembling the ideal behavior assumed in Clough's hys
teretic· model. Stable hysteretic behavior is sustained until anchorage failure of the bottom
reinforcing bars takes place in the joint. Anchorage failure is understood to mean complete
damage of bond along the reinforcing bars anchored in the joint. As a consequence, the
steel forces can not be transferred within the joint panel region and a reduction in strength
results, since the possibility of anchorage in the girder end region is not included in the
analysis. As illustrated in Fig. 6.2b, there is a slight increase in strength of the joint associ-
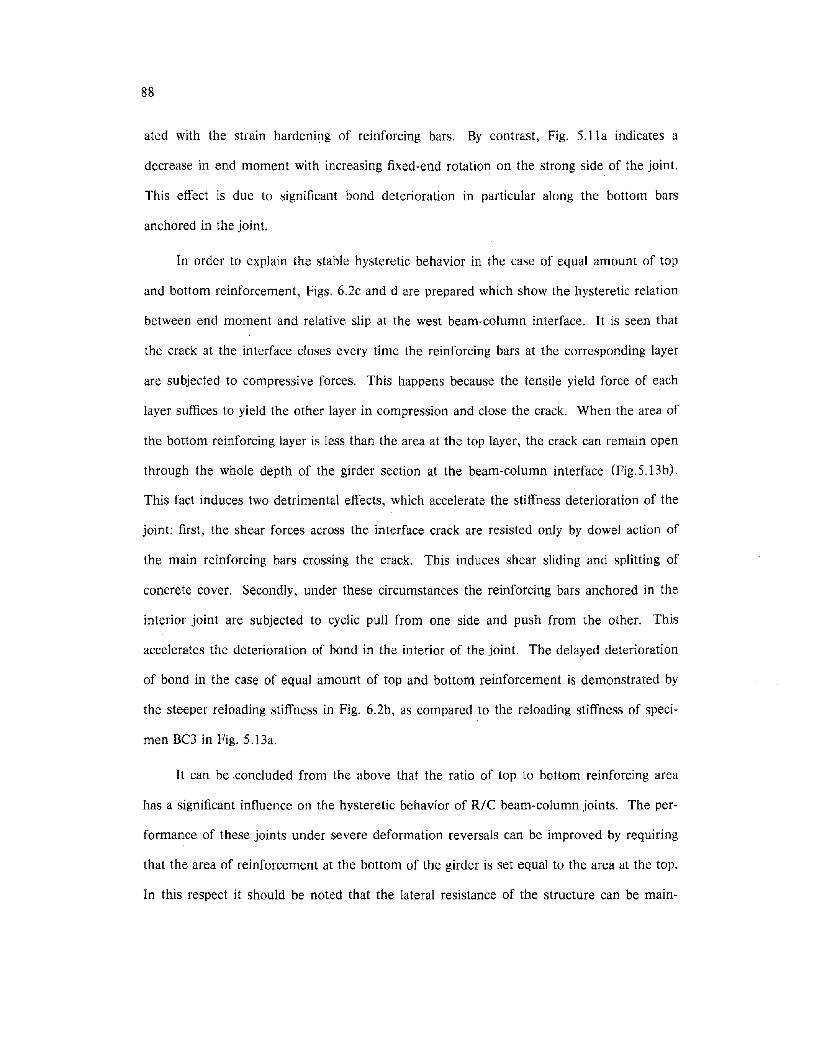
88
ated with the strain hardeniJ)g of reinforcing bars. By contrast, Fig. 5.11a indicates a
decrease in end moment with increasing fixed-end rotation on the strong side of the joint.
This effect is due to significant bond deterioration in particular along the bottom bars
anchored in the joint.
In order to explain the stable hysteretic behavior in the case of equal amount of top
and bottom reinforcement, Figs. 6.2c and d are prepared which show the hysteretic relation
between end moment and relative slip at the west beam-column interface. It is seen that
the crack at the interface closes every time the reinforcing bars at the corresponding layer
are subjected to compressive forces. This happens because the tensile yield force of each
layer suffices to yield the other layer in compression and close the crack. When the area of
the bottom reinforcing layer is less than the area at the top layer, the crack can remain open
through the whole depth of the girder section at the beam-column interface (Fig.5.13b).
This fact induces two detrimental effects, which accelerate the stiffness deterioration of the
joint: first, the shear forces across the interface crack are resisted only by dowel action of
the main reinforcing bars crossing the crack. This induces shear sliding and splitting of
concrete cover. Secondly, under these circumstances the reinforcing bars anchored in the
interior joint are subjected to cyclic pull from one side and push from the other. This
accelerates the deterioration of bond in the interior of the joint. The delayed deterioration
of bond in the case of equal amount of top and bottom reinforcement is demonstrated by
the steeper reloading stiffness in Fig. 6.2b, as compared to the reloading stiffness of speci
men BC3 in Fig. 5.13a.
It can be concluded from the above that the ratio of top to bottom reinforcing area
has a significant influence on the hysteretic behavior of RIC beam-column joints. The per
formance of these joints under severe deformation reversals can be improved by requiring
that the area of reinforcement at the bottom of the girder is set equal to the area at the top.
In this respect it should be noted that the lateral resistance of the structure can be main-
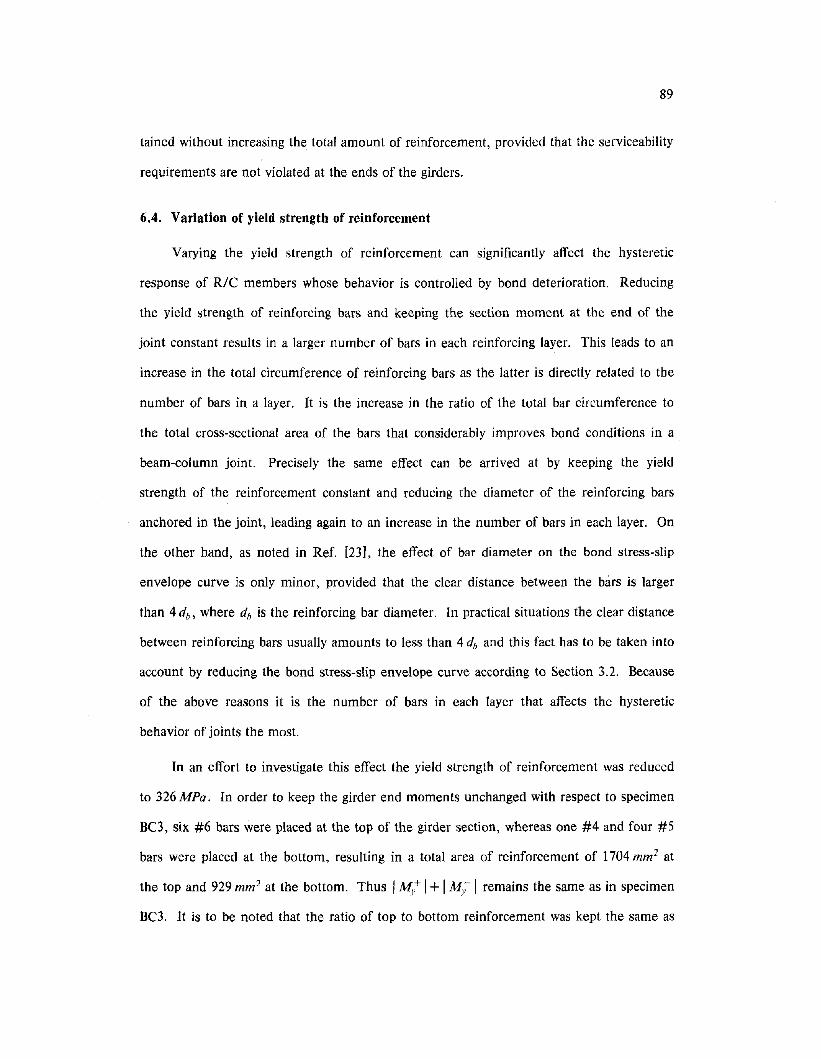
89
tained without increasing the total amount of reinforcement, provided that the serviceability
requirements are not violated at the ends of the girders.
6.4. Variation of yield strength of reinforcement
Varying the yield strength of reinforcement can significantly affect the hysteretic
response of RIC members whose behavior is controlled by bond deterioration. Reducing
the yield strength of reinforcing bars and keeping the section moment at the end of the
joint constant results in a larger number of bars in each reinforcing layer. This leads to an
increase in the total circumference of reinforcing bars as the latter is directly related to the
number of bars in a layer. It is the increase in the ratio of the total bar circumference to
the total cross-sectional area of the bars that considerably improves bond conditions in a
beam-column joint. Precisely the same effect can be arrived at by keeping the yield
strength of the reinforcement constant and reducing the diameter of the reinforcing bars
anchored in the joint, leading again to an increase in the number of bars in each layer. On
the other hand, as noted in Ref. [23], the effect of bar diameter on the bond stress-slip
envelope curve is only minor, provided that the clear distance between the bars is larger
than 4 db, where db is the reinforcing bar diameter. In practical situations the clear distance
between reinforcing bars usually amounts to less than 4 db and this fact has to be taken into
account by reducing the bond stress-slip envelope curve according to Section 3.2. Because
of the above reasons it is the number of bars in each layer that affects the hysteretic
behavior of joints the most.
In an effort to investigate this effect the yield strength of reinforcement was reduced
to 326 MPa. In order to keep the girder end moments unchanged with respect to specimen
BC3, six #6 bars were placed at the top of the girder section, whereas one #4 and four #5
bars were placed at the bottom, resulting in a total area of reinforcement of 1704 mm2 at
the top and 929 mm2 at the bottom. Thus IM/ I+ IM; I remains the same as in specimen
BC3. It is to be noted that the ratio of top to bottom reinforcement was kept the same as
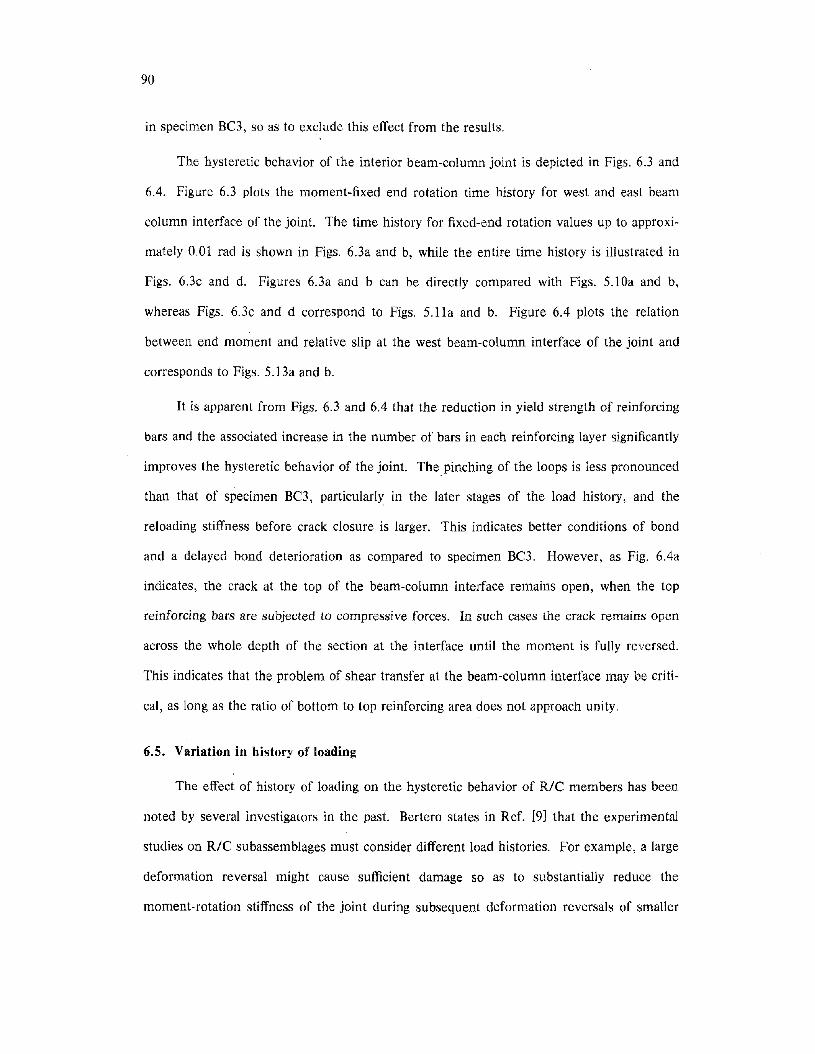
90
in specimen BC3, so as to exclude this effect from the results.
The hysteretic behavior of the interior beam-column joint is depicted in Figs. 6.3 and
6.4. Figure 6.3 plots the moment-fixed end rotation time history for west and east beam
column interface of the joint. The time history for fixed-end rotation values up to approxi
mately 0.01 rad is shown in Figs. 6.3a and b, while the entire time history is illustrated in
Figs. 6.3c and d. Figures 6.3a and b can be directly compared with Figs. 5.10a and b,
whereas Figs. 6.3c and d correspond to Figs. 5.11a and b. Figure 6.4 plots the relation
between end moment and relative slip at the west beam-column interface of the joint and
corresponds to Figs. 5.13a and b.
It is apparent from Figs. 6.3 and 6.4 that the reduction in yield strength of reinforcing
bars and the associated increase in the number of bars in each reinforcing layer significantly
improves the hysteretic behavior of the joint. Thepinching of the loops is less pronounced
than that of specimen BC3, particularly in the later stages of the load history, and the
reloading stiffness before crack closure is larger. This indicates better conditions of bond
and a delayed bond deterioration as compared to specimen BC3. However, as Fig. 6.4a
indicates, the crack at the top of the beam-column interface remains open, when the top
reinforcing bars are subjected to compressive forces. In such cases the crack remains open
across the whole depth of the section at the interface until the moment is fully reversed.
This indicates that the problem of shear transfer at the beam-column interface may be criti
cal, as long as the ratio of bottom to top reinforcing area does not approach unity.
6.5. Variation in history of loading
The effect of history of loading on the hysteretic behavior of RiC members has been
noted by several investigators in the past. Bertero states in Ref. [9) that the experimental
studies on RIC subassemblages must consider different load histories. For example, a large
deformation reversal might cause sufficient damage so as to substantially reduce the
moment-rotation stiffness of the joint during subsequent deformation reversals of smaller
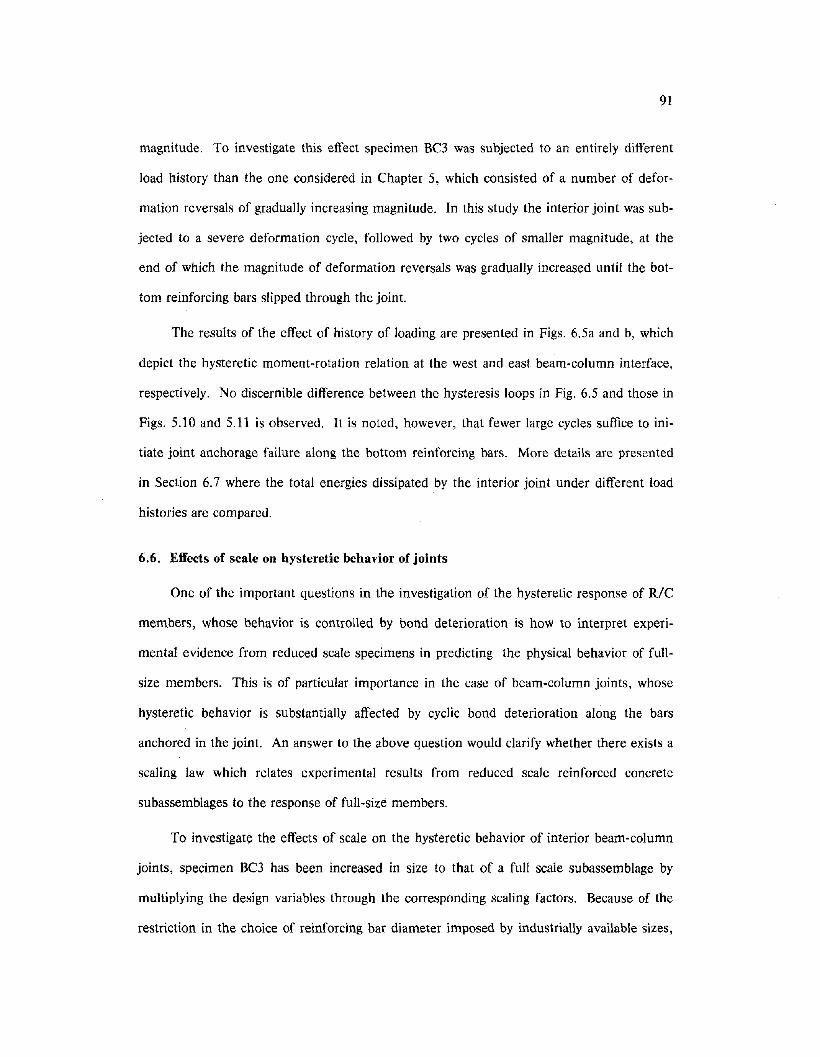
91
magnitude. To investigate this effect specimen BC3 was subjected to an entirely different
load history than the one considered in Chapter 5, which consisted of a number of defor
mation reversals of gradually increasing magnitude. In this study the interior joint was sub
jected to a severe deformation cycle, followed by two cycles of smaller magnitude, at the
end of which the magnitude of deformation reversals was gradually increased until the bot
tom reinforcing bars slipped through the joint.
The results of the effect of history of loading are presented in Figs. 6.5a and b, which
depict the hysteretic moment-rotation relation at the west and east beam-column interface,
respectively. No discernible difference between the hysteresis loops in Fig. 6.5 and those in
Figs. 5.10 and 5.11 is observed. It is noted, however, that fewer large cycles suffice to ini
tiate joint anchorage failure along the bottom reinforcing bars. More details are presented
in Section 6.7 where the total energies dissipated by the interior joint under different load
histories are compared.
6.6. Effects of scale on hysteretic behavior of joints
One of the important questions in the investigation of the hysteretic response of RiC
members, whose behavior is controlled by bond deterioration is how to interpret experi
mental evidence from reduced scale specimens in predicting the physical behavior of full
size members. This is of particular importance in the case of beam-column joints, whose
hysteretic behavior is substantially affected by cyclic bond deterioration along the bars
anchored in the joint. An answer to the above question would clarify whether there exists a
scaling law which relates experimental results from reduced scale reinforced concrete
subassemblages to the response of full-size members.
To investigaty the effects of scale on the hysteretic behavior of interior beam-column
joints, specimen BC3 has been increased in size to that of a full scale subassemblage by
multiplying the design variables through the corresponding scaling factors. Because of the
restriction in the choice of reinforcing bar diameter imposed by industrially available sizes,
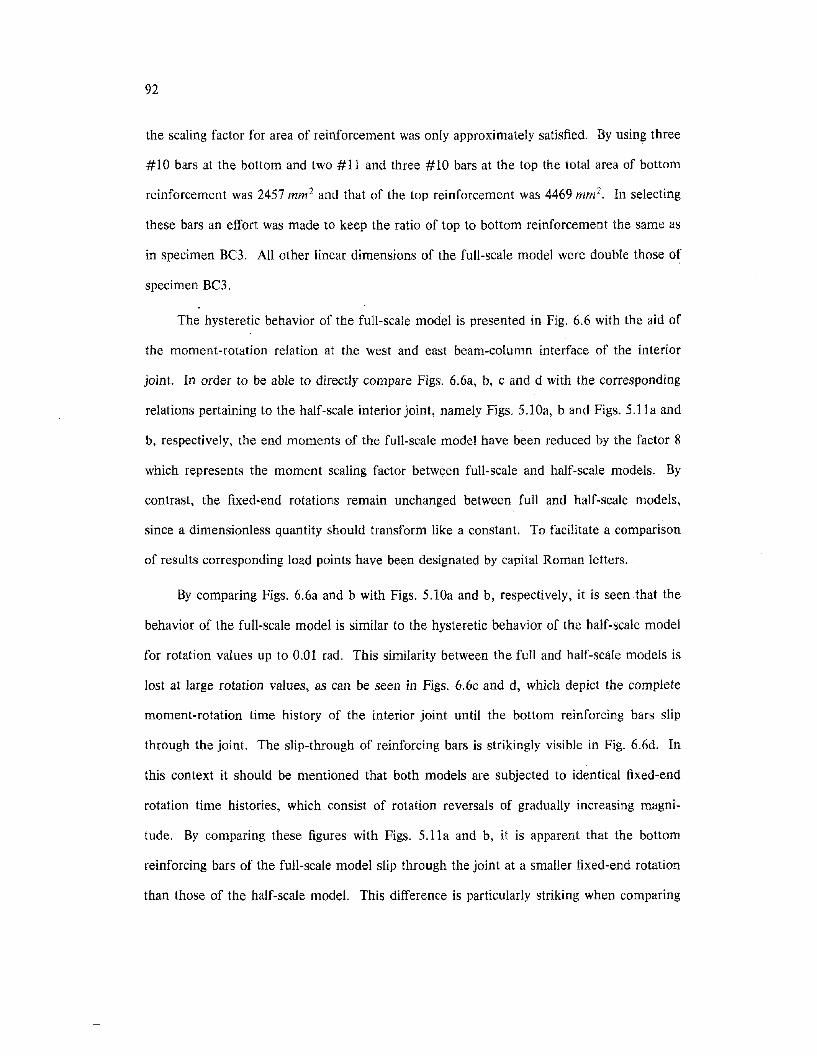
92
the scaling factor for area of reinforcement was only approximately satisfied. By using three
#10 bars at the bottom and two #11 and three #10 bars at the top the total area of bottom
reinforcement was 2457 mm 2 and that of the top reinforcement was 4469 mm 2• In selecting
these bars an effort was made to keep the ratio of top to bottom reinforcement the same as
in specimen BC3. All other linear dimensions of the full-scale model were double those of
specimen BC3.
The hysteretic behavior of the full-scale model is presented in Fig. 6.6 with the aid of
the moment-rotation relation at the west and east beam-column interface of the interior
joint. In order to be able to directly compare Figs. 6.6a, b, c and d with the corresponding
relations pertaining to the half-scale interior joint, namely Figs. 5.10a, b and Figs. 5.11a and
b, respectively, the end moments of the full-scale model have been reduced by the factor 8
which represents the moment scaling factor between full-scale and half-scale models. By
contrast, the fixed-end rotations remain unchanged between full and half-scale models,
since a dimensionless quantity should transform like a constant. To facilitate a comparison
of results corresponding load points have been designated by capital Roman letters.
By comparing Figs. 6.6a and b with Figs. 5.10a and b, respectively, it is seen that the
behavior of the full-scale model is similar to the hysteretic behavior of the half-scale model
for rotation values up to 0.01 rad. This similarity between the full and half-scale models is
lost at large rotation values, as can be seen in Figs. 6.6c and d, which depict the complete
moment-rotation time history of the interior joint until the bottom reinforcing bars slip
through the joint. The slip-through of reinforcing bars is strikingly visible in Fig. 6.6d. In
this context it should be mentioned that both models are subjected to identical fixed-end
rotation time histories, which consist of rotation reversals of gradually increasing magni
tude. By comparing these figures with Figs. 5.11a and b, it is apparent that the bottom
reinforcing bars of the full-scale model slip through the joint at a smaller fixed-end rotation
than those of the half-scale model. This difference is particularly striking when comparing

93
Fig. 6.6d with Fig. 5.11 b, which show that the slip-through of the bottom bars of the full
scale model takes place at a rotation of 0.012 rad, whereas the half-scale model withstands
one more large deformation cycle before the bottom bars slip through the joint at a rotation
of 0.017 rad.
The observed difference regarding the instant of slip-through of bottom reinforcing
bars between full and half-scale models can be readily explained by investigating the bond
stress-slip behavior in the two cases. Since fixed-end rotations are defined by Eq. (5.1) as a
ratio of distances, such quantities being dimensionless variables do not change with scale.
Thus a rotation of, say, 0.01 rad in the full-scale model should correspond to a rotation of
exactly the same magnitude in the half scale model. Since, however, the distance between
top and bottom reinforcing layer in the half-scale model is only half the respective distance
in the full-scale model, for the same amount of end slip the fixed-end rotation in the half
scale model is twice that in the full-scale model. This is one of the reasons for the
observed differences in hysteretic behavior. Assume, for example, that the distance
between top and bottom reinforcing layer is 322 mm in the half-scale model and, conse
quently, 644 mm in the full-scale model. These values correspond to the values used in the
examples studied. In this case a fixed-end rotation of 0.01 rad is associated with a pull-out
slip of approximately 3.2 mm in the half-scale and 6.4 mm in the full-scale model, respec
tively. In spite of the fact that the bond strength of the bond stress-slip envelope curves
for the reinforcing bars of the full- and half scale model differ by as much as 20%, Fig. 3.8
indicates that the discrepancy in the observed hysteretic behavior between full- and half
scale model derives from the different degree of bond damage which results from a relative
slip of 8 mm in the full-scale model as compared to the damage associated with a slip of
4 mm in the half-scale model assuming that the fixed-end rotation is the same in both
models. It should be noted at this stage that the question of dependence of the bond
stress-slip envelope curve on the diameter of reinforcing bars is the source of some contro
versy among researchers in the field. The conclusions of this study are based on

94
experimental evidence presented in Ref. [23]. According to these results it seems that the
slip value u3 at which the descending portion of the bond stress-slip envelope curve reaches
the frictional bond resistance depends only on the lug distance of reinforcing bars. The lug
distance however does not necessarily increase linearly with increasing bar diameter. This
fact in connection with the bond stress-slip model presented in Section 3.2 leads to the
observed discrepancies in the hysteretic load-deformation behavior between full- and half
scale models, unless special care is taken to scale the bond stress-slip behavior appropri
ately.
The results presented in Fig. 6.6 seem to indicate that reduced scale models of RIC
subassemblages whose hysteretic behavior is controlled by bond deterioration, can overesti
mate the energy dissipation capacity of the subassemblage. In the case of beam-column
joints which are subjected to severe deformation reversals, fixed-end rotations derived from
tests on reduced scale specimens should be judged with caution. In this respect it might be
wiser to compare relative slip values instead of fixed-end rotations between reduced and
full-scale models. In spite of the fact that relative slip has the dimension of length and
should be scaled proportionately to the scale of the models, the bond damage introduced
along the bars anchored in the joint directly depends on the value of relative slip imposed at
the ends of the joint. Because results should be compared on the basis of equal amount of
induced damage, relative slip values should be kept constant between reduced and full-scale
models. This, in turn, implies that fixed-end rotations cannot be directly compared between
reduced and fUll-scale models.
6.7. Comparison of parametric studies
In order to be able to compare the hysteretic behavior of ali cases presented in the
previous sections, some means of evaluating the performance of the interior beam-column
joint in each case has to be found. This performance function must be expressed in dimen
sionless form, so that cases with various strength and stiffness can be directly compared. In
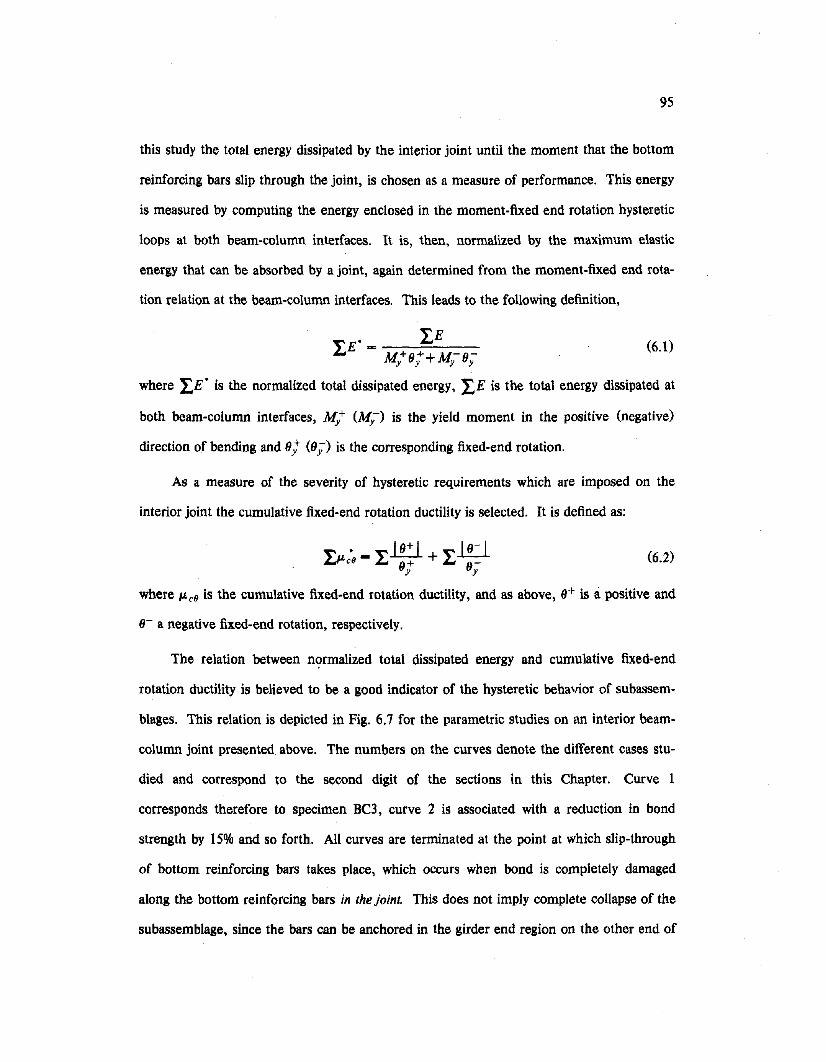
95
this study the total energy dissipated by the interior joint until the moment that the bottom
reinforcing bars slip through the joint, is chosen as a measure of performance. This energy
is measured by computing the energy enclosed in the moment-fixed end rotation hysteretic
loops at both beam-column interfaces. It is, then, normalized by the maximum elastic
energy that can be absorbed by a joint, again determined from the moment-fixed end rota-
tion relation at the beam-column interfaces. This leads to the following definition,
(6.0
where 1:E' is the normalized total dissipated energy, 1:E is the total energy dissipated at
both beam-column interfaces, M/ (M;.-) is the yield moment in the positive (negative)
direction of bending and OJ (0;) is the corresponding fixed-end rotation.
As a measure of the severity of hysteretic requirements which are imposed on the
interior joint the cumulative fixed-end rotation ductility is selected. It is defined as:
~ .. ' _~~+~kl.~c9 ~ 9+ ~ 9-
y y(6.2)
where ILc9 is the cumulative fixed-end rotation ductility, and as above, 0+ is a positive and
0- a negative fixed-end rotation, respectively.
The relation between nC?rmalized total dissipated energy and cumulative fixed-end
rotation ductility is believed to be a good indicator of the hysteretic behavior of subassem-
blages. This relation is depicted in Fig. 6.7 for the parametric studies on an interior beam-
column joint presented above. The numbers on the curves denote the different cases stu-
died and correspond to the second digit of the sections in this Chapter. Curve 1
corresponds therefore to specimen BC3, curve 2 is associated with a reduction in bond
strength by 15% and so forth. All curves are terminated at the point at which slip-through
of bottom reinforcing bars takes place, which occurs when bond is completely damaged
along the bottom reinforcing bars in the joint. This does not imply complete collapse of the
subassemblage, since the bars can be anchored in the girder end region on the other end of
96
the joint, provided that no instability due to P-ll effect occurs. As already noted, the
influence of the girder end region is not included in this investigation.
It is seen in Fig. 6.7 that the instant of slip··through of the bottom reinforcing bars
greatly varies between the different cases. Particularly striking is the difference between
half-scale model under average bond conditions (curve 1) and half-scale model under a
reduction in bond strength of 15% (curve 2). It is concluded that the quality of bond and,
consequently, the quality of workmanship and construction can substantially affect the total
energy dissipation capacity of a beam-column joint. On the other hand it seems that a vari
ation in the history of loading (curve 5) in the range studied here does not affect much the
total energy dissipated up to the moment of slip-through of the bottom reinforcing bars.
This, however, does not allow any general conclusions, since the effect of the history of
loading might be important in another range of cyclic excitations.
As already noted in Section 6.6, the full-scale model of the interior joint (curve 6)
behaves almost identically to the half-scale model under the same conditions (curve 1), as
long as bond is not severely damaged. However, under large deformation reversals the
slip-through of bottom reinforcing bars is initiated at a much earlier stage in the case of the
full-scale model and, consequently, the total energy dissipation differs substantially between
half and full-scale models. It is therefore important to realize that the results from experi
ments on reduced scale subassemblages whose behavior is controlled by bond deterioration
may have to be interpreted with caution when attempting to predict the behavior of full
scale members.
With respect to improving the seismic resistant design of beam-column joints, Fig. 6.7
indicates that equal amount of top and bottom reinforcement (curve 3) and reinforcing bars
of lower yield strength or smaller bar diameter (curve 4) can offer considerable advantage.
It should be noted in this context that the higher is the ratio between cumulative energy
dissipation and cumulative fixed-end rotation ductility, the better is the hysteretic behavior

97
of the members under consideration. It is therefore recommended to use equal amount of
top and bottom reinforcement and a lower yield strength of reinforcing bars as a means of
improving the hysteretic behavior of beam-column joints.
98
CHAPTER 7
SUMMARY, CONCLUSIONS AND RECOMMENDATIONS
7.1. Summary
The study presented herein has endeavored to develop an analytical model which
describes the hysteretic behavior of reinforced concrete members under severe cyclic exci
tations. Special attention was devoted to the interaction of reinforcing steel and surround
ing concrete through bond and the deterioration of such interaction under deformation
reversals. The effects of cyclic bond deterioration on the hysteretic behavior of interior
beam-column joints have been investigated and conclusions regarding the main factors
affecting the hysteretic behavior of joints will be summarized in the following.
In developing an analytical model to describe the hysteretic behavior of RIC members
special attention was devoted to material models describing the stress-strain relation of rein
forcing steel and the bond stress-slip behavior along the anchorage length of reinforcing
bars under arbitrary cyclic excitations.
The relative slip between reinforcing steel and surrounding concrete increases the size
of cracks that have previously formed perpendicular to the axis of the member. The equili
brium of horizontal forces and bending moments must be introduced at the cracked RiC
sections to complement the equations which describe the interaction of reinforcing steel
and surroundin~ concrete. This necessitates the development of a new layer section model
which takes into account the bond deterioration in the vicinity of the crack when establish
ing the contribution of reinforcing steel and concrete to the equilibrium of horizontal forces
and bending moments at a cracked RIC section.

99
The developed model shows excellent agreement with available experimental evidence
on the hysteretic behavior of interior RiC beam-column subassemblages.
7.2. Conclusions
After analyzing the results of the study presented herein the following conclusions can
be drawn:
(1) The bond stress-slip behavior of reinforcing steel substantially affects the hysteretic
behavior of reinforced concrete joints subjected to severe cyclic deformation reversals.
An accurate bond stress-slip relation is the cornerstone of any attempt to accurately
describe the hysteretic behavior of RiC joints.
(2) The relative contribution of reinforcing steel and concrete to the equilibrium of hor
izontal forces and bending moments at a cracked RIC section is not only controlled by
the strains but also by the crack width at the top and bottom of the cross-section of
interest. Any model of the hysteretic behavior of a cracked RiC section has to
account for the effect of bond deterioration in the vicinity of the crack. This effect
leads to an incompatibility of strains between reinforcing steel and surrounding concrete
at a crack.
(3) From a series of analytical parametric studies on the hysteretic behavior of an interior
joint the following conclusions were reached regarding the influence of different
parameters:
(a) the ratio of top to bottom reinforcement influences substantially the hysteretic behavior of
interior joints. If the area of the top and bottom reinforcing layers is equal, very stable
hysteretic behavior is observed. In conformity with experiments, reducing the area of
the bottom reinforcing layer with respect to that of the top, more pronounced pinch
ing of hysteretic loops is observed resulting in a substantial reduction in energy dissi
pation capacity,

100
(b) the hysteretic behavior ofjoints is very sensitive to the bond strength along the anchorage
length of reinforcing bars. For example, a mere 15% reduction in bond strength along a
bar results in a 30% reduction in total energy dissipation capacity. This fact has important
consequences in practice. Poor construction quality and poor workmanship can lead
to diminished energy dissipation capacity of the joint,
(c) increasing the number of anchored bars, reducing the bar diameter and reducing the yield
strength of reinforcement improves the hysteretic behavior ofjoints,
(d) the time history of imposed deformations affects the hysteretic behavior of interior joints. A
small number of large deformation reversals inflicts more damage of bond along the
anchorage length of reinforcing bars than a large number of small deformation rever
sals,
(e) the scale of specimens influences the hysteretic behavior of interior joints. By compar
ing the results of identical full and half scale interior joints it is concluded that the full
scale joint exhibits complete bond damage earlier than the half scale model. This is
due to the fact that bond damage in the joint directly depends on the slip imposed at
the beam-column interface. The value of end slip transforms proportionately to the
scale of the specimen between specimens of different scale. This can have important
consequences regarding the interpretation of experimental results from reduced scale
reinforced concrete models whose behavior is substantially affected by bond deteriora
tion,
7.3. Recommendations for future research
The proposed model can be used in conducting additional investigations which go
beyond the studies presented within the framework of this report. In this sense it is recom
mended:
101
(i) to extend the model for predicting the hysteretic behavior of critical regions of rein
forced concrete columns, shear-walls and coupling beams in coupled shear-walls. The
hysteretic behavior of critical regions in girders should also be investigated. These
studies can help in developing analytical models which improve upon existing ones
which are based on point plastic hinges or on distribution of curvatures along the
empirically estimated length of the plastic hinges,
(ii) to derive simple analytical models which account for the effects of bond deterioration
in the seismic response of moment resisting frames,
(iii) to use the proposed model in connection with cyclic shear models at a cracked rein
forced concrete section, since it allows computation and tracing of crack width in time.
As it is well established, the crack width is the main parameter which affects the con
tribution of aggregate interlock and of the dowel action of reinforcing bars to the
shear resistance at crack interfaces,
(iv) to include the effect of joint shear and diagonal cracking in the hysteretic behavior of
interior and exterior joints. In many cases the transfer of shear stresses in the joint
can significantly affect the overall behavior of the member.
102
REFERENCES
[1] "Finite Element Analysis of Reinforced Concrete", State-of-the-Art Report published
by ASCE, New York, NY, 1982.
[2] "Advanced Mechanics of Reinforced Concrete", IABSE Colloquium, Final Report,
Delft, June 1981.
[3] Agrawal, G.L., Tulin, L.G., and Gerstle, K.H. "Response of Doubly Reinforced Con
crete Beams to Cyclic Loading", Journal of the American Concrete Institute, Vo1.62, No
7, July 1965.
[4] Anagnostopoulos, S.A., "Inelastic Beams for Inelastic Analyses of Structures", ASCE,
Journal of the Structural Division, VoLl07, No ST7, July 1981.
[5] Anderson, J.e. and Townsend, W.H., "Models for RC Frames with Degrading
Stiffness", ASCE, Journal of the Structural Division, VoLl03, No STl2, Dec. 1977.
[6] Aoyama, H., "Moment-Curvature Characteristics of Reinforced Concrete Members
Subjected to Axial Load and Reversal of Bending", Proceedings International Symposium
on Flexural Mechanics ofReinforced Concrete, ASCE-ACI, Florida 1964.
[7] Banon, H., Biggs, 1.M. and Irvine, H.M., "Seismic Damage in Reinforced Concrete
Frames", ASCE, Journal of the Structural Division, Vo1.107, No ST9, Sept. 1981.
[8] Bazant, Z.P., and Bhat, P.D., "Prediction of Hysteresis of Reinforced Concrete
Members'\ ASCE, Journal of the Structural Division, VoLl03, No STl, Jan. 1977.
[9] Bertero, V.V., "Experimental Studies Concerning Reinforced, Prestressed and Partially
Prestressed Concrete Structures and their Elements", IABSE Symposium on Resistance
and Ultimate Deformability ofStructures Acted on by Well Defined Repeated Loads, Intro
ductory Report, Lisbon 1973.
103
[10] Bertero, V.V., "Seismic Behavior of Structural Concrete Linear Elements (Beams,
Columns) and Their Connections", AICAP-CEB Symposium, Structural Concrete Under
Seismic Actions, Introductory Report to Theme II, Comite Euro-International Du
Beton, Bulletin D' Information No 131, VoU, pp.125-212, Rome 1979.
[1ll Bertero, V.V., Bresler, B., "Seismic Behavior of Reinforced Concrete Framed Struc
tures", Proceedings Fourth World Conference on Earthquake Engineering, VoU, B-3,
pp.l 09-124, Chile 1969.
[12] Bertero, V.V., Bresler, B., and Liao, H., "Stiffness Degradation of Reinforced Con
crete Members Subjected to Cyclic Flexural Moments", Earthquake Engineering
Research Center, University of California, Berkeley, Report No EERC 69-12, Dec.
1969.
[13] Bertero, V.V. and Popov, E.P., "Hysteretic Behavior of Ductile Moment-Resisting
Reinforced Concrete Frame Components", Earthquake Engineering Research Center,
University of California, Berkeley, Report No EERC 75-16, April 1975.
[14] Bohong, Z., Mingshun, W. and Kunlian, Z., "A Study of Hysteretic Curve of Rein
forced Concrete Members under Cyclic Loading", Seventh World Conference on Earth
quake Engineering, Vo1.6, Istanbul 1981.
[15] Brown, R.H. and Jirsa, J.O., "Reinforced Concrete Beams under Load Reversals", ACI
Journal, Vo1.68, May 1971.
[16] Capecchi, D., Ciampi, V. and Vestroni, "Numerical Studies on the Behavior of a
Reinforced Concrete Beam Element under Repeated Loadings", Bulletin D' Information
No 132, Comife Euro-International Ou Beton, Paris, April 1979.
[17] Ciampi, V., Eligehausen, R., Bertero, V. and Popov, E., "Analytical Model for
Deformed Bar Bond under Generalized Excitations", IABSE Colloqium, Advanced
Mechanics ofReinforced Concrete, Final Report, Delft, June 1981.
104
[I8] Ciampi, V., Eligehausen, R., Bertero, V.V. and Popov, E.P., "Analytical Model for
Concrete Anchorages of Reinforcing Bars under Generalized Excitations", Earthquake
Engineering Research Center, University of California, Berkeley, Report No EERC 82
23, Dec. 1982.
[19] Clough, R.W., "Effect of Stiffness Degradation on Earthquake Ductility Require
ments", Report No 66-16, Structural Engineering Laboratory, University of California,
Oct. 1966.
[20] Clough, R.W., Benuska, K.L. and Wilson, E.L., "Inelastic Earthquake Response of
Tall Buildings", Proceedings of the Third World Conference on Earthquake Engineering,
Vol. II , Session II, Wellington, New Zealand, 1965.
[21] Dafalias, Y.K. and Popov, E.P., "A Model for Nonlinearly Hardening Materials for
Complex Loadings", Acta Mechanica, Vol.21,1975.
[22] Darwin, D., and Pecknold, D.A., "Analysis of RC Shear Panels under Cyclic Load
ing", ASCE, Journal of the Structural Division, Vol.l02, No ST2, Feb. 1976.
[23] Eligehausen, R., Bertero, V.V. and Popov, E.P., "Local Bond Stress-Slip Relationships
of Deformed Bars under General Excitations- Tests and Analytical Model", UCB
Report 1983, University of California, Berkeley (to be published).
[24] Eligehausen, R., Bertero, V.V. and Popov, E.P., "Hysteretic Behavior of Reinforcing
Deformed Hooked Bars in RIC Joints", 7th European Conference on Earthquake
Engineering, Athens, Sept. 1982.
[25] Emori, K. and Scnobrich, W.c., "Inelastic Behavior of Concrete Frame-Wall Struc
tures", ASCE, Journal of the Structural Division, Vol.107, No STl, Jan.1981.
[26] Giberson, "The Response of Nonlinear Multistory Structures Subjected to Earthquake
Excitation", Ph.D. Dissertation, California Institute of Technology, Pasadena, 1967.
105
[27] Hanson, N.W., and Connor, H.W., "Seismic Resistance of Reinforced Concrete
Beam-Column Joints", ASCE, Journal of the Structural Division, Vo1.93, No ST5, Oct.
1967.
[28] Jirsa, J.O., "Behavior of Elements and Subassemblages-RC Frames", Workshop on
Earthquake Resistant Reinforced Concrete Building Construction, Berkeley CA, July
1977.
[29] Karsan, 1.0., and Jirsa, J.O., "Behavior of Concrete under Compressive Loadings",
ASCE, Journal of the Structural Division, Vol.95, No ST12, Dec. 1969.
[30] Kent, D.C., and Park, R., "Flexural Members with Confined Concrete", ASCE, Jour
nal of the Structural Division, Vol.97, No ST7, July 1971.
[31] Ma, S.Y.M, Bertero, V.V. and Popov, E.P., "Experimental and Analytical Studies on
the Behavior of Reinforced Concrete Rectangular and T-Beams", Earthquake Engineer
ing Research Center, Report No EERC 76-2, Univ. of California, Berkeley, May 1976.
[32] Mahin, S.A., and Bertero, V.V., "Problems in Establishing and Predicting Ductility in
Aseismic Design", Proceedings International Symposium on Earthquake Structural
Engineering, St. Louis, MO, Aug. 1976.
[33] Menegotto, M. and Pinto, P., "Method of Analysis for Cyclically Loaded Reinforced
Concrete Plane Frames Including Changes in Geometry and Nonelastic Behavior of
Elements under Combined Normal Force and Bending", IABSE Symposium on ResIs
tance and Ultimate Deformability of Structures Acted on by Well-Defined Repeated Loads,
Final Report, Lisbon, 1973.
[34] Noguchi, H., "Nonlinear Finite Element Analysis of Reinforced Concrete Beam
Column Joints", IABSE Colloqium, Advanced Mechanics of Reinforced Concrete, Final
Report, Delft, June 1981.
106
[35] Ortega, lM. and Rheinbold, W.e., "Iterative Solution of Nonlinear Equations in
Several Variables", Academic Press, 1970.
[36] Otani, S., "Inelastic Analysis of RIC Frame Structures", ASCE, Journal of the Structural
Division, Vol.lOO, No ST7, July 1974.
[37] Park, R., Gaerty, L. and Stevenson, E.C., "Tests on an Interior Reinforced Concrete
Beam-Column Joint", Bulletin of the New Zealand National Society for Earthquake
Engineering, Vo1.14, No 2, June 1981.
[38J Park, R., Kent, D.C., and Sampson, R.A., "Reinforced Concrete Members with Cyclic
Loading", ASCE, Journal of the Structural Division, Vo1.98, No ST7, July 1972.
(39J Popov, E.P., "Berkeley Re-Bar Bond Tests", SEAOC Conference, Sacramento CA, Oct.
1982.
[40] Scott, B.D., Park, R. and Priestley, M.J.N., "Stress-Strain Behavior of Concrete
Confined by Overlapping Hoops at Low and High Strain Rates", ACI Journal, V.79,
No 1, Jan-Feb. 1982.
[4I] Sinha, B.P., Gerstle, K.H. and Tulin, L.G., "Response of Singly-Reinforced Beams to
Cyclic Loading", ACI Journal, Proceedings, Vo1.61 , No 8, Aug. 1964.
[42] Soleimani, D., "Reinforced Concrete Ductile Frames under Earthquake Loadings with
Stiffness Degradation", Ph.D. Dissertation, University of California, Berkeley, Dec.
1978.
[43] Soleimani, D., Popov, E.P. and Bertero, V.V., "Hysteretic Behavior of Reinforced
Concrete Beam-Column Subassemblages", ACI Journal, Vo1.76, No 11, Nov. 1979.
[44] Soleimani, D., Popov, E.P. and Bertero, V.V., "Nonlinear Beam Model for RIC
Frame Analysis", 7th ASCE Conference on Electronic Computation, 51. Louis, MO, Aug.
1979.
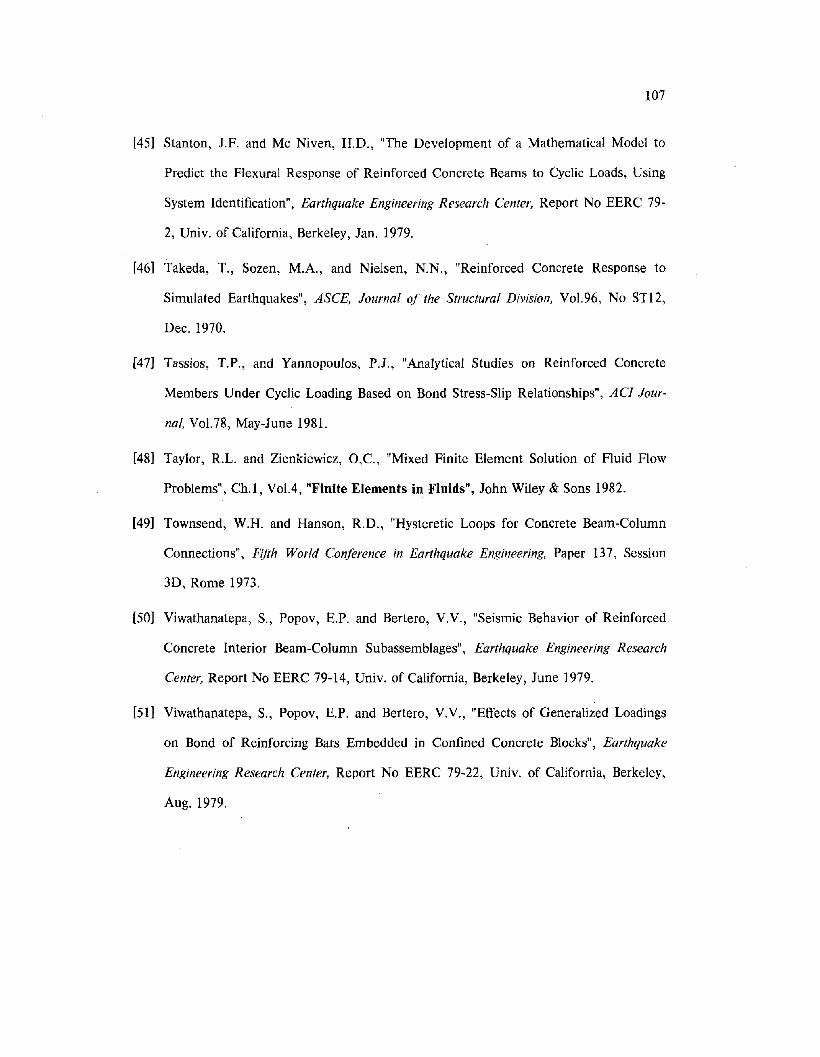
107
[45] Stanton, J.F. and Mc Niven, H.D., "The Development of a Mathematical Model to
Predict the Flexural Response of Reinforced Concrete Beams to Cyclic Loads, Using
System Identification", Earthquake Engineering Research Center, Report No EERC 79
2, Univ. of California, Berkeley, Jan. 1979.
[46] Takeda, T., Sozen, M.A., and Nielsen, N.N., "Reinforced Concrete Response to
Simulated Earthquakes", ASCE, Journal of the Structural Division, Vol.96, No STl2,
Dec. 1970.
[47] Tassios, T.P., and Yannopoulos, P.J., "Analytical Studies on Reinforced Concrete
Members Under Cyclic Loading Based on Bond Stress-Slip Relationships", ACI Jour
nal, Vo1.78, May-June 1981.
[48] Taylor, R.L. and Zienkiewicz, O,C., "Mixed Finite Element Solution of Fluid Flow
Problems", Ch.1, VolA, "Finite Elements in Fluids", John Wiley & Sons 1982.
[49] Townsend, W.H. and Hanson, R.D., "Hysteretic Loops for Concrete Beam-Column
Connections", Fifth World Conference in Earthquake Engineering, Paper 137, Session
3D, Rome 1973.
[50] Viwathanatepa, S., Popov, E.P. and Bertero, V.V., "Seismic Behavior of Reinforced
Concrete Interior Beam-Column Subassemblages", Earthquake Engineering Research
Center, Report No EERC 79-14, Univ. of California, Berkeley, June 1979.
[51] Viwathanatepa, S., Popov, E.P. and Bertero, V.V., "Effects of Generalized Loadings
on Bond of Reinforcing Bars Embedded in Confined Concrete Blocks", Earthquake
Engineering Research Center, Report No EERC 79-22, Univ. of California, Berkeley,
Aug. 1979.


FIGURES

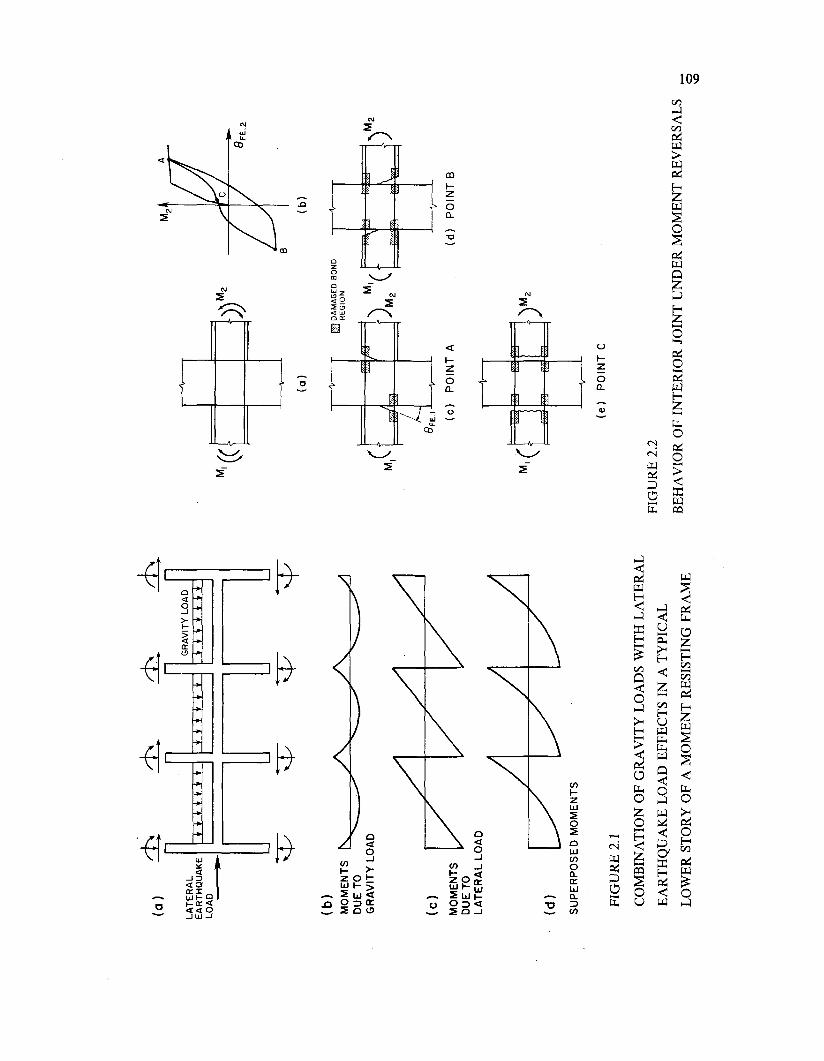
BFE
,2
A
(b
)
B
(a)
M'(C
DD
))M
2
& ~
± w
± w
~ ~
.......
--
RA
L'H
QU
AK
E••
~w
**"
TU-ttt~.
GR
AV
ITY
LO
AD
)
t~
~w
*~.
•I
I
I L.....
J'-
'W
LJ
(a)
LA
TE
AR
LO
A
SU
PE
RP
OS
ED
MO
ME
NT
S
(b)
MO
ME
NT
St'--
./\
../\
..L1
DU
ETO~~~
GR
AV
ITY
LOA
D
47
4r
~~~ENT
SVD
UE
TOL
AT
ER
AL
LOA
D
J:])M
2
(d)
PO
INT
B
I---
oD
AM
AG
ED
BO
ND
RE
GIO
N'V
8FE,I~
(e)
PO
INT
A
M1C
U-U
)M2M
\L:J:
M1(U
LJU
)M2
~471
(d) FIG
UR
E2.
1
CO
MB
INA
TIO
NO
FG
RA
VIT
YL
OA
DS
WIT
HL
AT
ER
AL
EA
RT
HQ
UA
KE
LO
AD
EF
FE
CT
SIN
AT
YP
ICA
L
LO
WE
RST
OR
YO
FA
MO
ME
NT
RE
SIS
TIN
GF
RA
ME
(e)
PO
INT
C
FIG
UR
E2.
2
BE
HA
VIO
RO
FIN
TE
RIO
RJO
INT
UN
DE
RM
OM
EN
TR
EV
ER
SA
LS
_ o \C
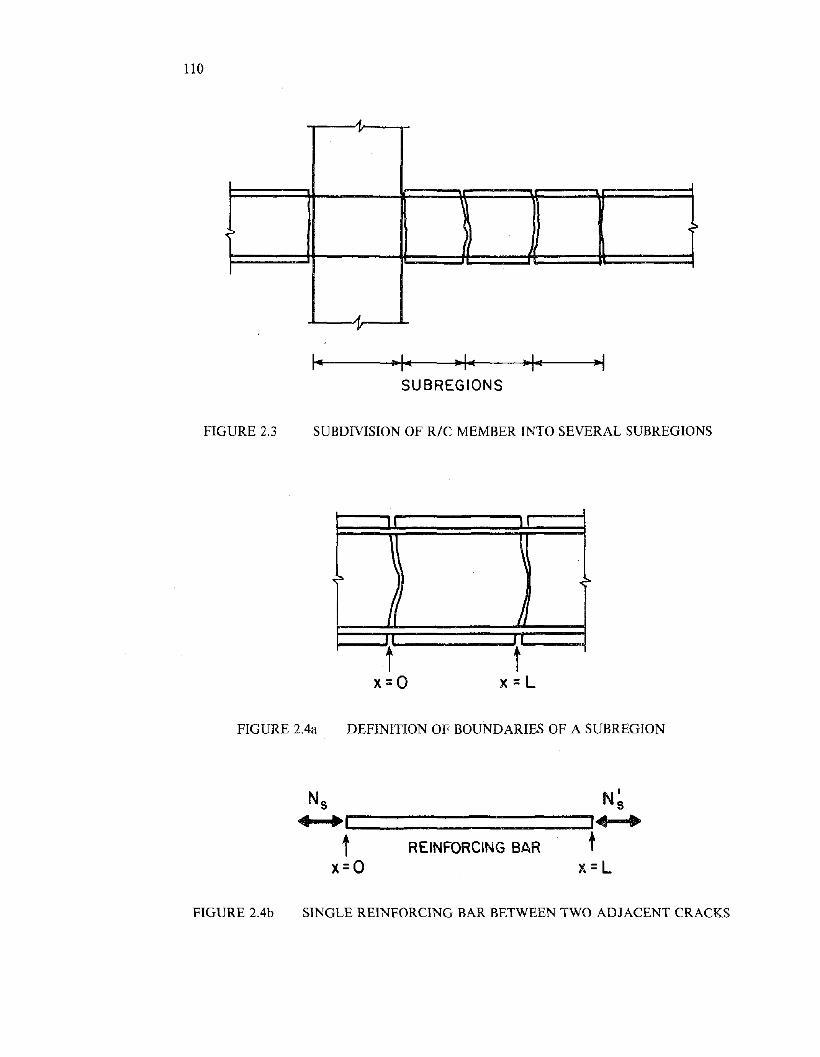
110
If
"
",>~,
AI'
~f----"Ja~ Ja I... .1"SUBREGIONS
FIGURE 2.3 SUBDIVISION OF RIC MEMBER INTO SEVERAL SUBREGIONS
'I I'
\ \:> } :>
Ii ~II ,t
x=ot
x=L
FIGURE 2.4a DEFINITION OF BOUNDARIES OF A SUBREGION
t REINFORCING BAR tX=O x=L
Ns N~4 .....1 ~,.. •
FIGURE 2.4b SINGLE REINFORCING BAR BETWEEN TWO ADJACENT CRACKS
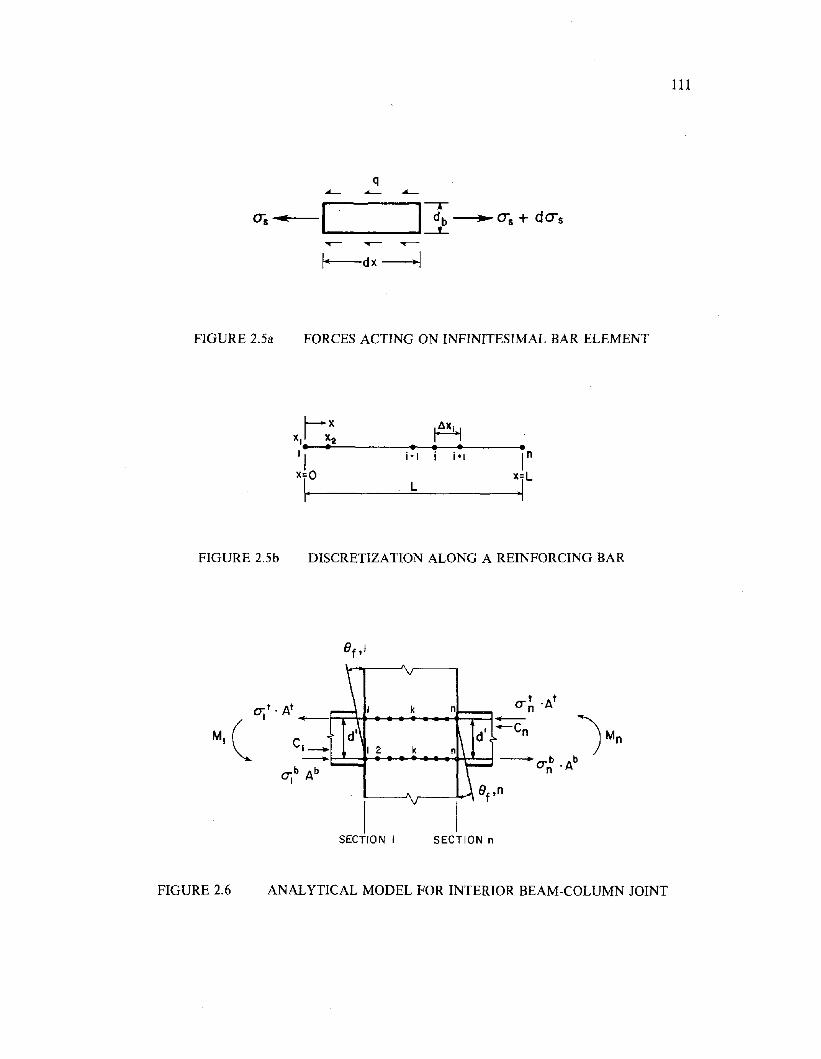
q-- "'-- --os -•.-- ""'- 13~ CTs + dCTs
I--dx ---.j
FIGURE 2.5a FORCES ACTING ON INFINITESIMAL BAR ELEMENT
xJ-x: A• • • • • •II i-I i i -, /n
x=Q x=LI· L
·1
FIGURE 2.5b DISCRETIZATION ALONG A REINFORCING BAR
111
ISECTION I SECTION n
FIGURE 2.6 ANALYTICAL MODEL FOR INTERIOR BEAM-COLUMN JOINT
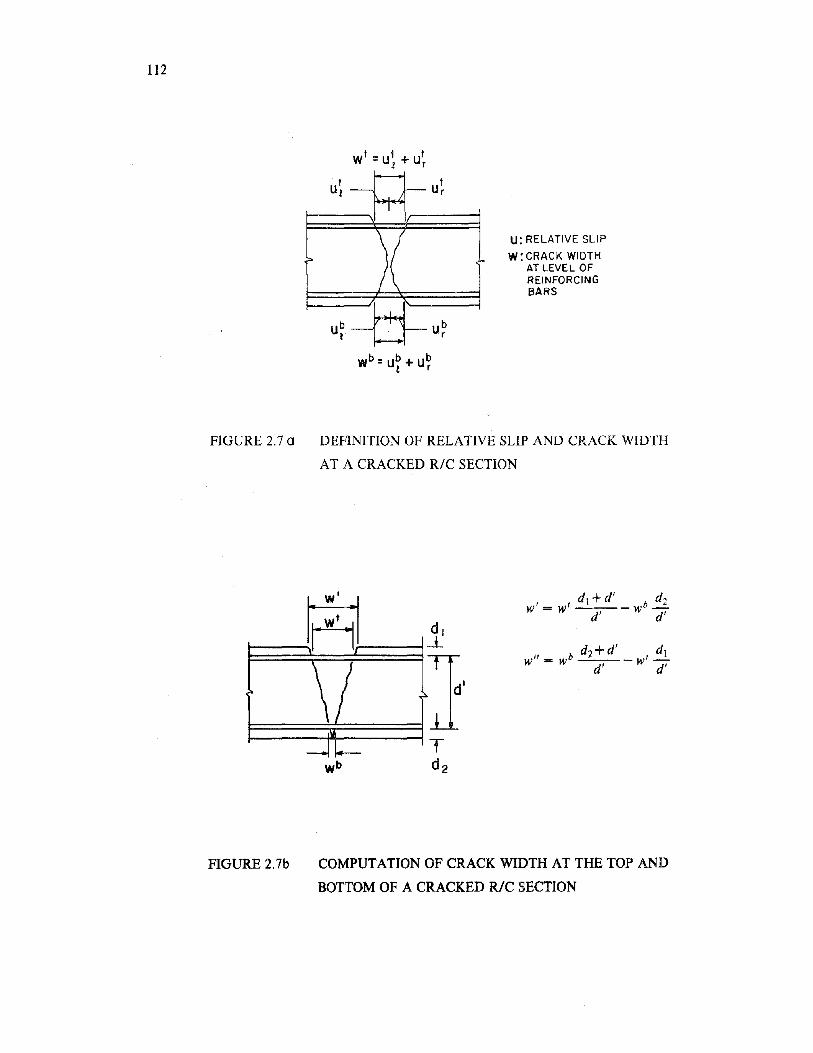
112
U: RELATIVE SLIP
W: CRACK WIDTHAT LEVEL OFREINFORCINGBARS
FIGURE 2.7 a DEFINITION OF RELATIVE SLIP AND CRACK WIDTH
AT A CRACKED RIC SECTION
, t d j +d' b d2w = W d' -W"7
/I _ b d2+ d' _ t!!.lW - W d' W d'
FIGURE 2.7b COMPUTATION OF CRACK WIDTH AT THE TOP AND
BOTTOM OF A CRACKED RIC SECTION
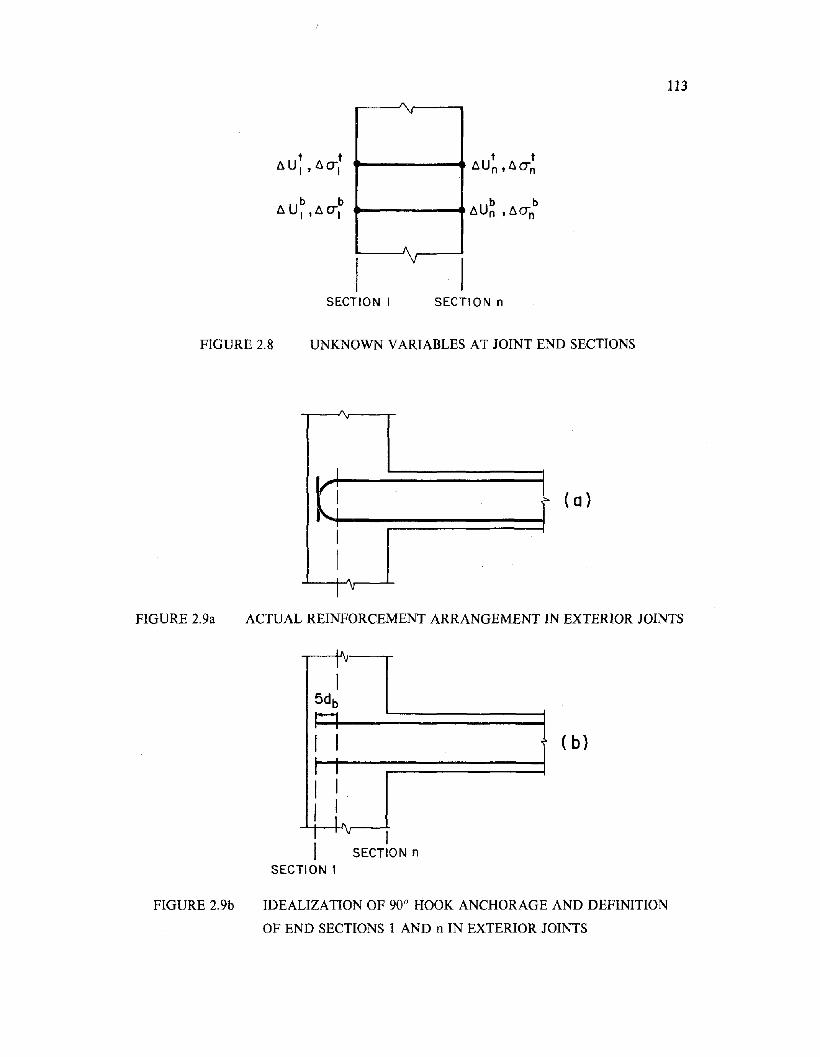
113"
b bf-----.. 6Un ,60'"n
SECTION I SECTION n
FIGURE 2.8 UNKNOWN VARIABLES AT JOINT END SECTIONS
A
I
II I
III V
(a)
FIGURE 2.9a ACTUAL REINFORCEMENT ARRANGEMENT IN EXTERIOR JOINTS
( b)
ISECTION n
II v
I5db,.........,
I II I
I I
I lI v
ISECTION 1
FIGURE 2.9b IDEALIZATION OF 90° HOOK ANCHORAGE AND DEFINITION
OF END SECTIONS 1 AND n IN EXTERIOR JOINTS
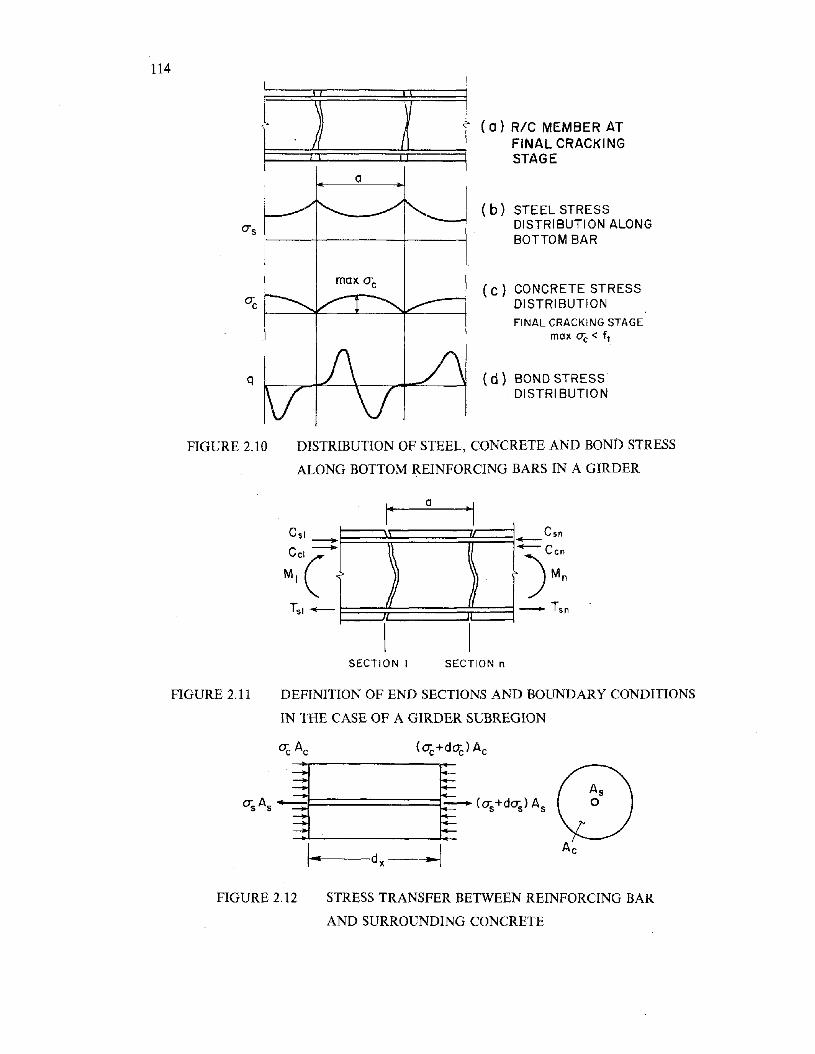
114
<2" (a) RIC MEMBER ATFINAL CRACKINGSTAGE
o-s1---+-----+-----1
( b) STEEL STRESSDISTRIBUTION ALONGBOTTOM BAR
(c) CONCRETE STRESSDISTRIBUTION
FINAL CRACKING STAGEmax 0(; < f t
q ( d) BOND STRESSDISTRI BUTION
~1-----:::>j<'---I.--~---1
max o-c
FIGURE 2.10 DISTRIBUTION OF STEEL, CONCRETE AND BOND STRESS
ALONG BOTTOM REINFORCING BARS IN A GIRDER
,. a·1
Csi Csn- -C"( ~) ~))C,"
M1 Mn
Ts1
-A fJ _Tsn
I ISECTION I SECTION n
FIGURE 2.11 DEFINITION OF END SECTIONS AND BOUNDARY CONDITIONS
IN THE CASE OF A GIRDER SUBREGION
oAc
FIGURE 2.12 STRESS TRANSFER BETWEEN REINFORCING BAR
AND SURROUNDING CONCRETE
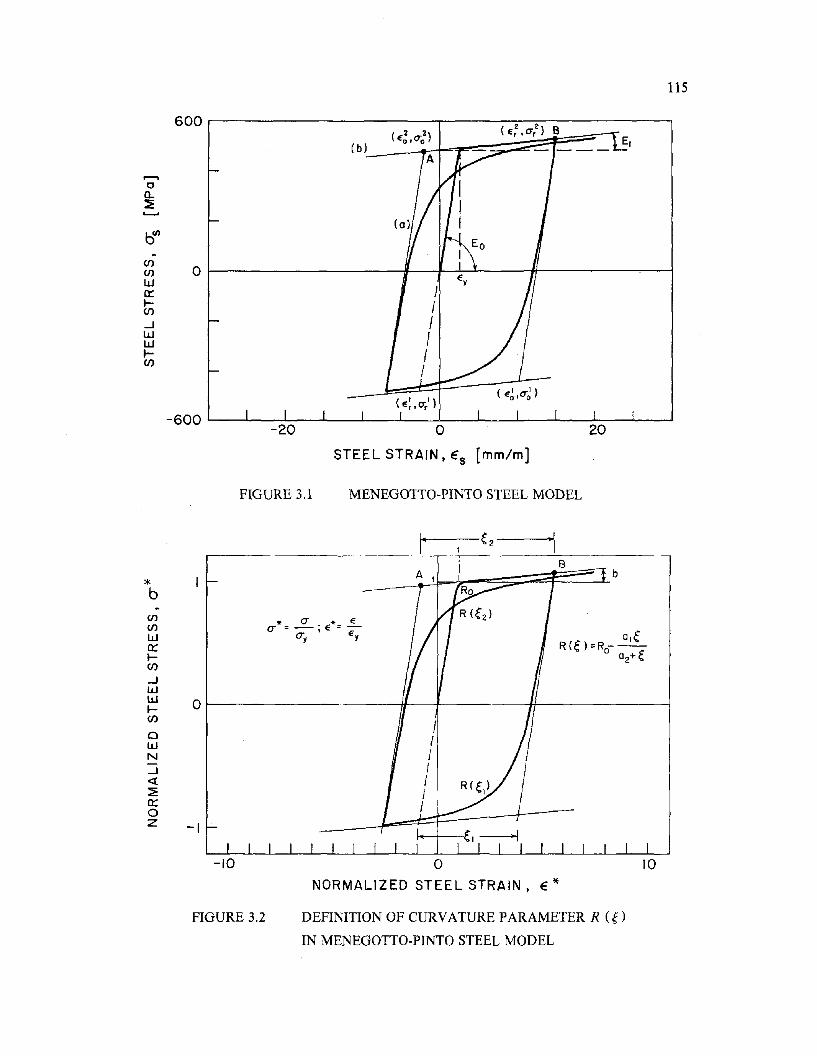
115
600 .------------,----:--:---------,
~~(~2~2)+=r~i{:::E=~1~~~r2)~B~~:I~,~ E(b) I
........ca..~
~
~ 0 1--------------/f.--I----l.......L----li------~___iW0::....(f)
-JWW....C/)
-600 L...----JL---_....J2-0-.....l----l--...L--..L0---l---.L.-----l---2L..0-~--J
STEEL STRAIN t €s [mm/m]
FIGURE 3.1 MENEGOTTO-PINTO STEEL MODEL
10
1----~2-~'1
oNORMALIZED STEEL STRAIN t € *
DEFINITION OF CURVATURE PARAMETER R (0IN MENEGOTTO-PINTO STEEL MODEL
Ot-----------------/l---f-------If-----------j
-10
FIGURE 3.2
-I
(f)C/)
W0::....(f)
-JWW....C/)
oWN-J«~0::oZ
*b
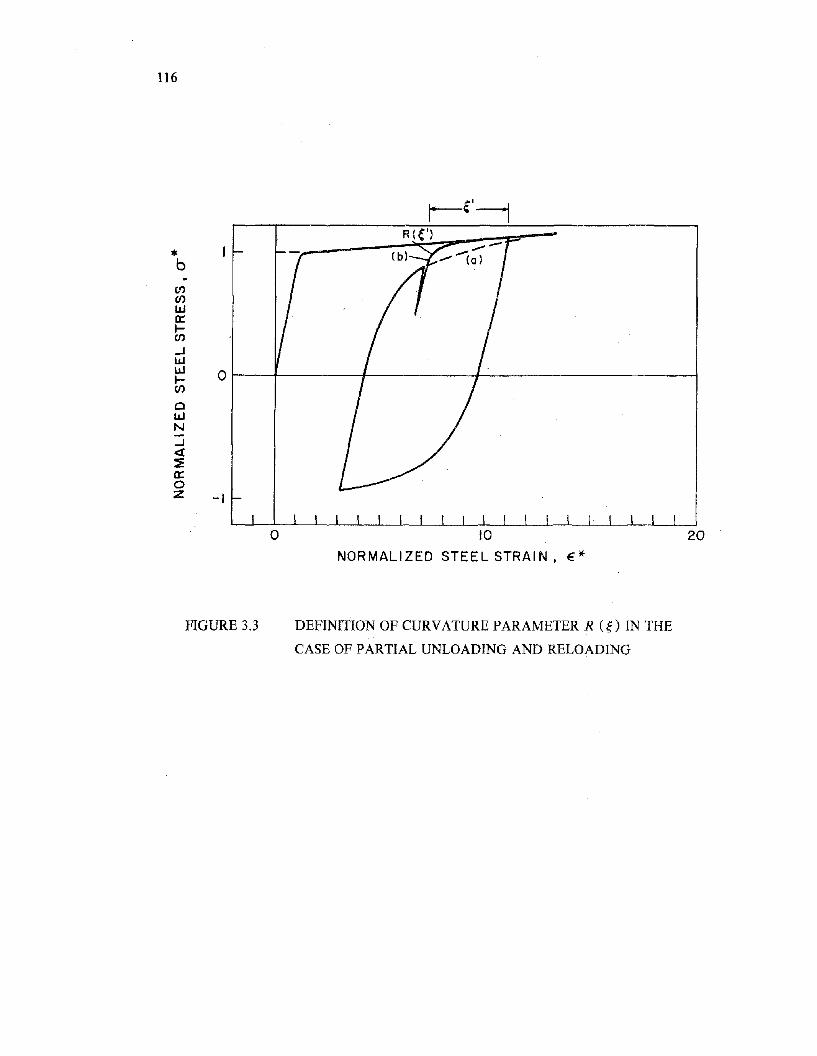
116
R(!')
( b)
Ol----f-------jl-------l------------l
-I
Cf)Cf)
lJJa::ICf)
...JlJJWICf)
olJJN...J<t~a::oz
*b
o 10
NORMALIZED STEEL STRAIN, E*
20
FIGURE 3.3 DEFINITION OF CURVATURE PARAMETER R en IN THE
CASE OF PARTIAL UNLOADING AND RELOADING
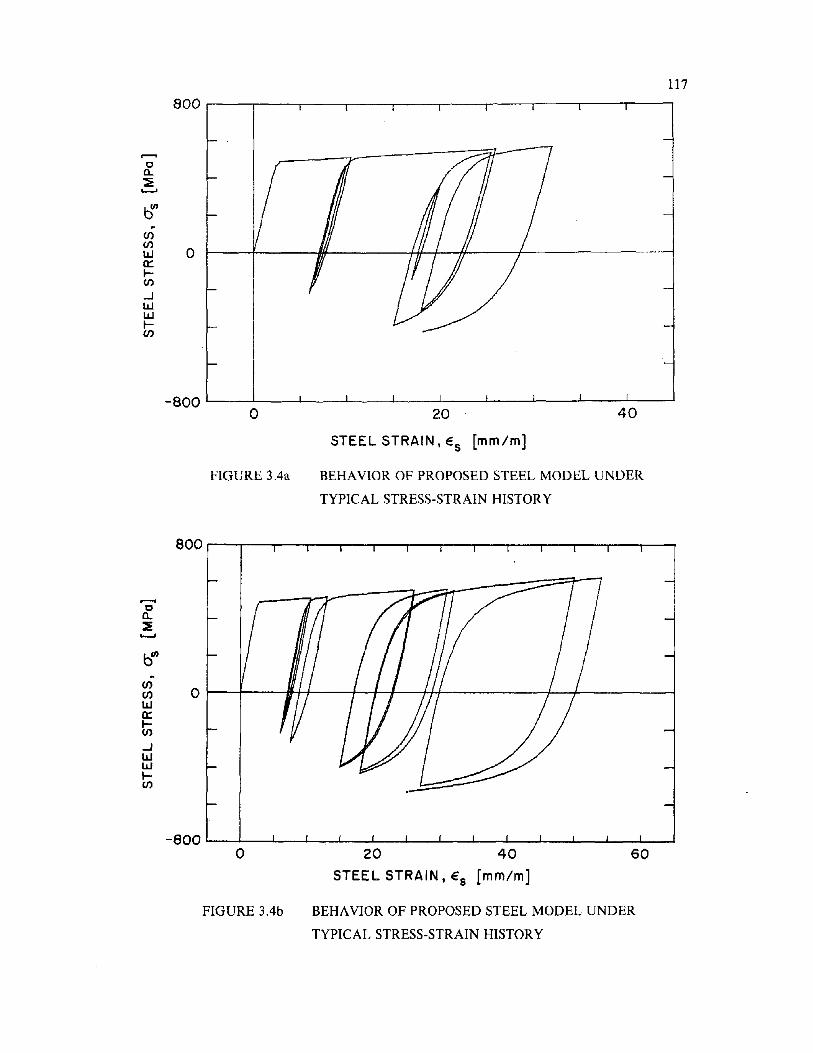
117800 ~--.------.----.----,---.-----r---.---'----'---'
......ca..~........
b'"~
enen
0wa:::r-oo.....IWWr-en
-800 L...-_-l-_--1__....L-_----L.__...L-_--l--__.L--_-k-_----'L----_~
o 20
STEEL STRAIN I Es [mm/m]
40
......ca.:E........
ben~
en0en
wa:::r-en.....Iwwr-en
FIGURE 3.4a BEHAVIOR OF PROPOSED STEEL MODEL UNDER
TYPICAL STRESS-STRAIN HISTORY
o 20 40STEEL STRAIN I Es [mm/m]
60
FIGURE 3Ab BEHAVIOR OF PROPOSED STEEL MODEL UNDER
TYPICAL STRESS-STRAIN HISTORY
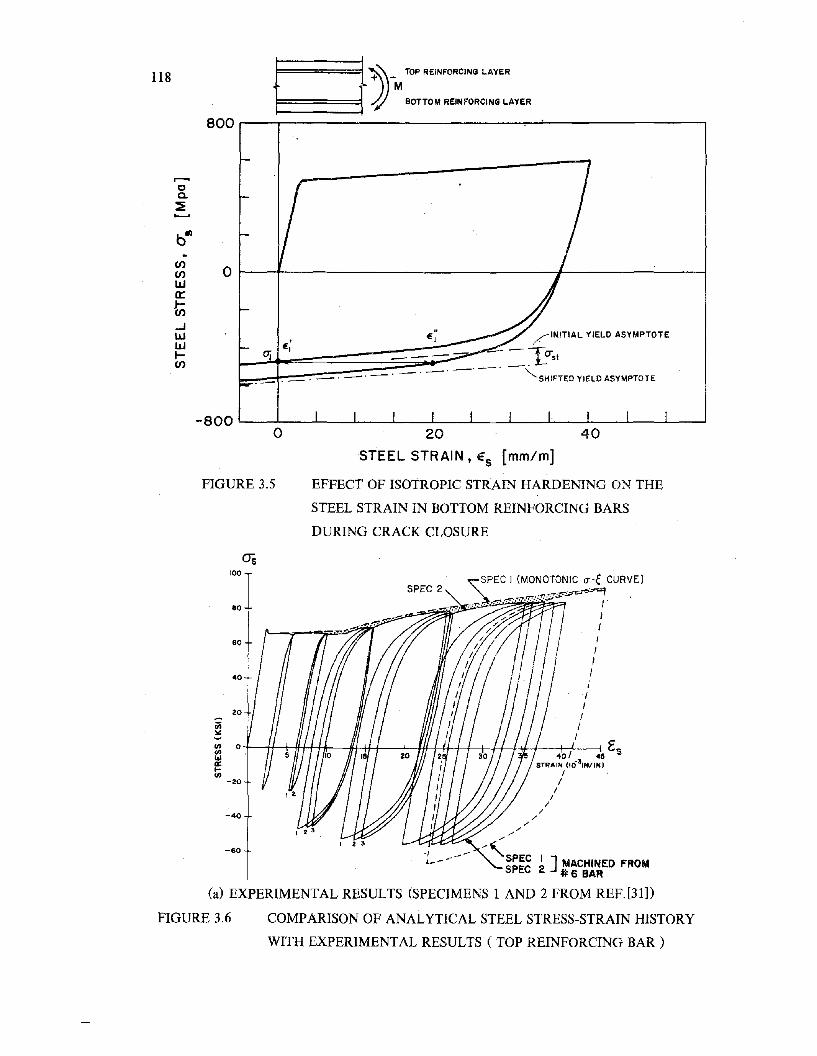
118 ~~_ TOP REINFORCING LAYER
~ .J.J M BOTTOM REINFORCING LAYER
800 r---,--------------.,~-------___,
,......,CQ.
~.......bill
00000
wa::t;..JIJJWt-oo
~;' /INITIAL YIELD ASYMPTOTE
,::a::lf~I:'~~~~~~§~?: ~ - To"SI[ _. _ . -' -' - . - . -' -' -' -"'SHIFTED YIELD ASYMPTOTE
o
FIGURE 3.5
20 40
STEEL STRAIN. Es [mm/m]
EFFECT OF ISOTROPIC STRAIN HARDENING ON THE
STEEL STRAIN IN BOTTOM REINFORCING BARS
DURING CRACK CLOSURE
os100
80
60
40
20
iii~UI 0UI1&1a:l-UI
-20
-40
-60
401 45 EsSTRAIN (I0'SINIINl
I/
II
I/
//
-'-</SPEC I ] MACHINED FROMSPEC 2 #6 BAR
(a) EXPERIMENTAL RESULTS (SPECIMENS 1 AND 2 FROM REF. [31])
FIGURE 3.6 COMPARISON OF ANALYTICAL STEEL STRESS-STRAIN HISTORY
WITH EXPERIMENTAL RESULTS ( TOP REINFORCING BAR)
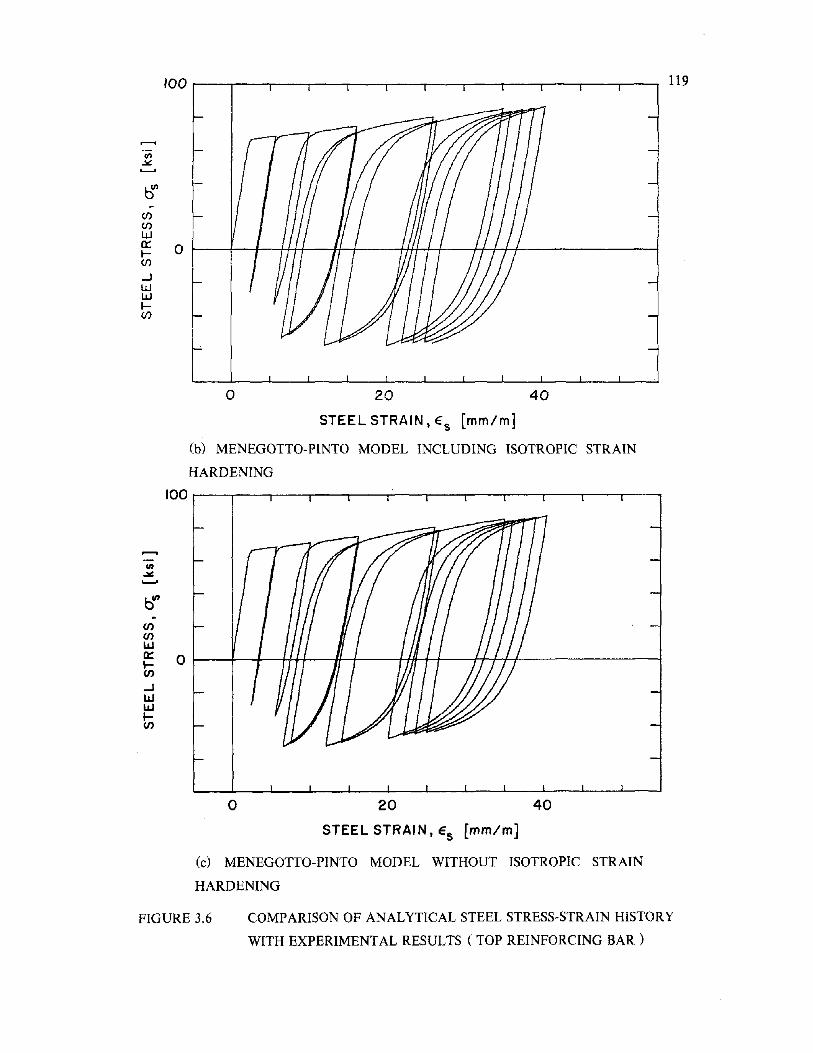
100 r--,.---r---,--..---,---r----y----..,...---r---r-----,--_
...-.III~..........
tf~
enenwa:: 0r-en-lwwr-(J)
119
o 20 40
STEEL STRAIN, E"s [mm/m]
(b) MENEGOTTO-PINTO MODEL INCLUDING ISOTROPIC STRAIN
HARDENING
100 .....--,.---,.---or--..---.,----,----r--....----,---.......-----r----.
...-.III~..........
bill~
enenwa:: 0r-oo-lWwt-en
40o 20
STEEL STRAIN, E"s [mm/m]
(c) MENEGOTTO-PINTO MODEL WITHOUT ISOTROPIC STRAIN
HARDENING
FIGURE 3.6 COMPARISON OF ANALYTICAL STEEL STRESS-STRAIN HISTORY
WITH EXPERIMENTAL RESULTS (TOP REINFORCING BAR)
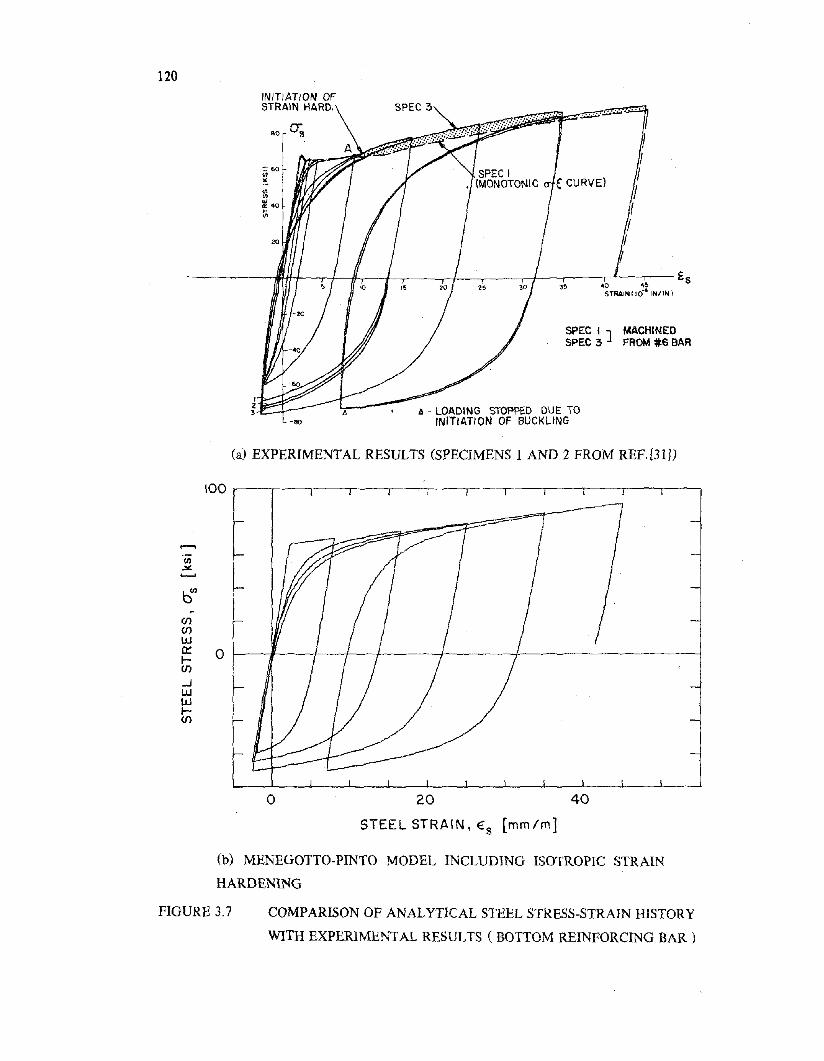
120
~.~.
SPEC I] MACHINEDSPEC 3 FAOM #6 BAR
A - LOADING STOPPED DUE TOINITIATION OF BUCKLING-so
20
80 0;
INITIATION OFSTRAIN HARD.
-= 60.."g:~ 40
Iii
~-~--IIW-+----r+--/h--J..-....-,.-------r-I-----r--~+-,------r<-----r- ES40 4~
STRAIN 110-' IN/IN)
(a) EXPERIMENTAL RESULTS (SPECIMENS 1 AND 2FROM REF.l31J)
,......,en.x'--'
ben~
(f)(f)
W0::: 0I-(J)
...JIJ.JWI-(f)
o 20 40
STEEL STRAIN, Es [mm/m]
(b) MENEGOTTO-PINTO MODEL INCLUDING ISOTROPIC STRAIN
HARDENING
FIGURE 3.7 COMPARISON OF ANALYTICAL STEEL STRESS-STRAIN HISTORY
WITH EXPERIMENTAL RESULTS ( BOTTOM REINFORCING BAR)
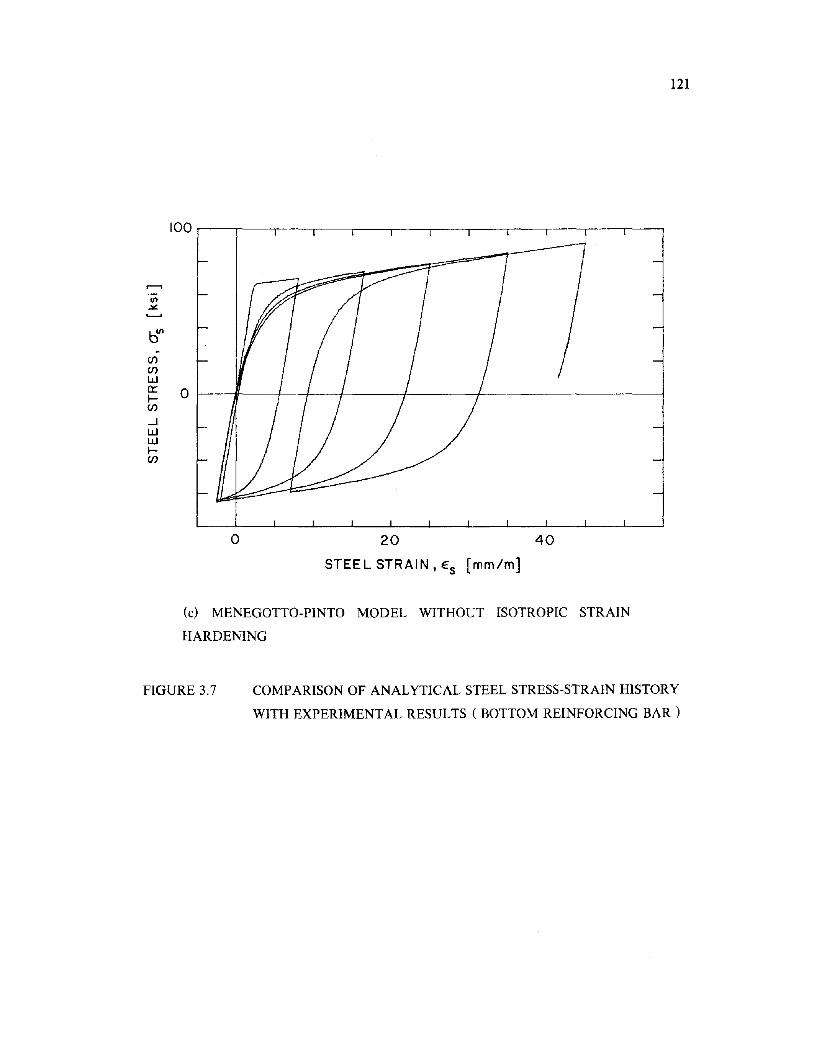
,........,If)
oX
t)~
(f)(f)
wa::: 0~(f)
-lWW~(f)
o 20 40
STEEL STRAIN I ES [mm/m]
121
(c) MENEGOTTO-PINTO MODEL WITHOUT ISOTROPIC STRAIN
HARDENING
FIGURE 3.7 COMPARISON OF ANALYTICAL STEEL STRESS-STRAIN HISTORY
WITH EXPERIMENTAL RESULTS ( BOTTOM REINFORCING BAR)
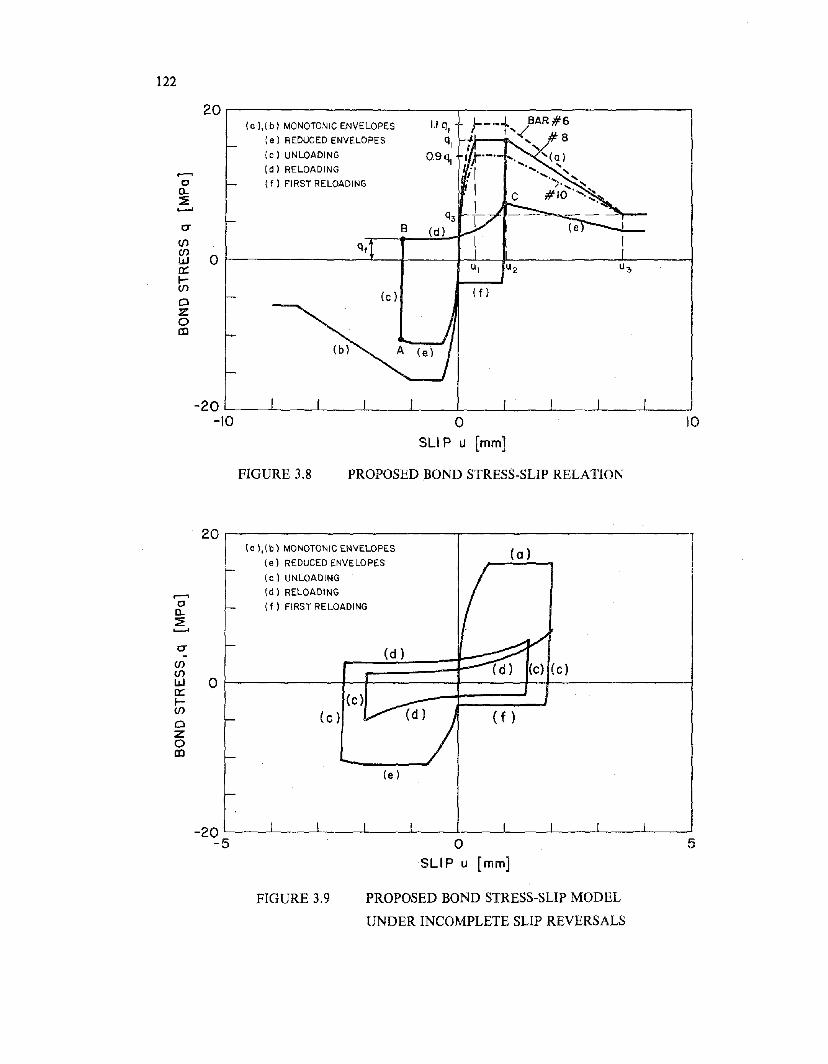
122
20(0 l,( bl MONOTONIC ENVELOPES 1.1 Q,
(e 1 REDUCED ENVELOPES ql(c 1 UNLOADING O.9Q.
.......... (d 1 RELOADING
0 (f 1 FIRST RELOADINGa..~.......
Q3a- S (d)
(/) Qf(/)W 0 u1 u2 u3a::l-(/)
(c) (tlDz0(I)
FIGURE 3.8
-20 '___----'-__l.-_----'-__l.-_--L...__.l.-_--L__...l..-_--l.._-...J
-10 0 10
SLI P lJ [mm]
PROPOSED BOND STRESS-SLIP RELATION
20(0 l,(b) MONOTONIC ENVELOPES (a)
(e 1 REDUCED ENVELOPES
(c 1 UNLOADING
.--. (d) RELOADING0 (f 1 FIRST RELOADINGa..~.......a- (d)~
(/)enw 0a::I-enClZ0(I)
(e)
5oSLIP u [mm]
-20 '--_---'-__--'---__.L...-_---l__~___'__ __''___ __'___--'---_ ___'
-5
FIGURE 3.9 PROPOSED BOND STRESS-SLIP MODEL
UNDER INCOMPLETE SLIP REVERSALS
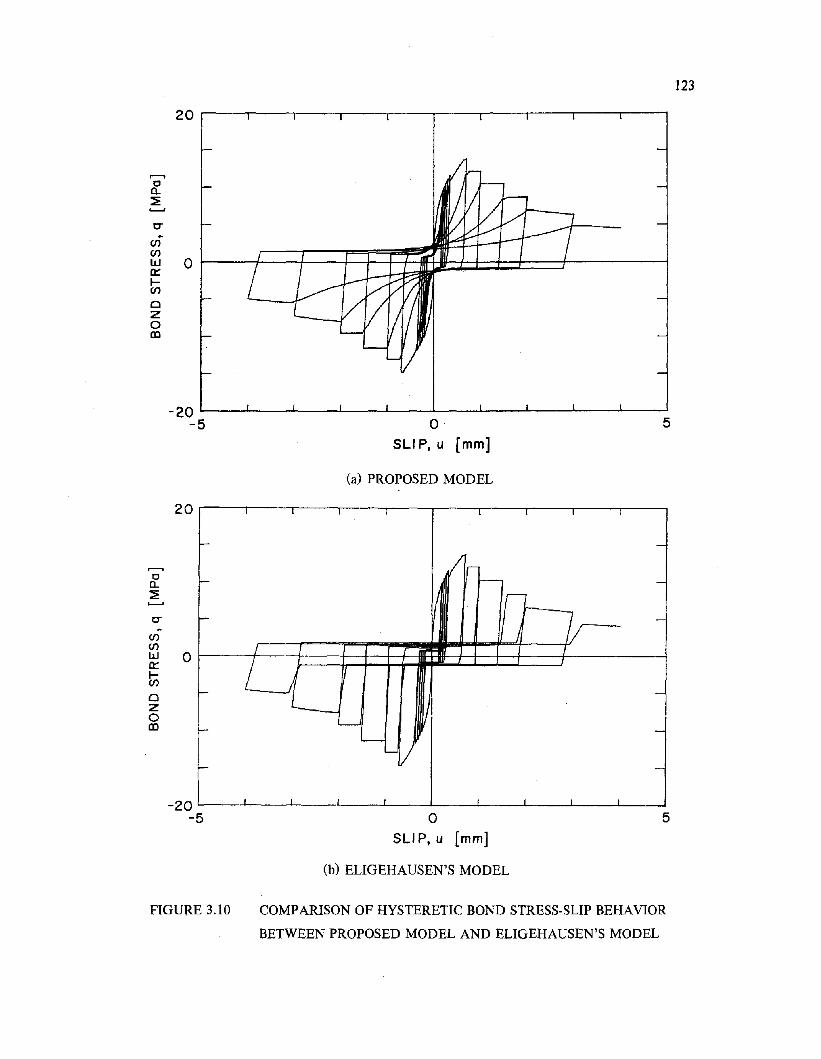
123
20 ,----,---,---,---,---,----.,----,---,----r-----,
,.......,ca..~........t:r
(J)(J)
w 00:::I-(J)
ClZ0CD
- 20 L--_-'-_---'__-I.-_---L.__...L-_--l-__.l-..-_--'-_--''--_--'
-5 0 5SLlP,u [mm]
(a) PROPOSED MODEL
5oSLlP,u [mmJ
(b) ELIGEHAUSEN'S MODEL
I I I I I I I
-- -
/r-- I-- -
If fl-~ 7 -
I I I
~L j
-~ 1/
I----' -
'--
)--'
'- -
, I , r
20
-20-5
........ca..~........t:r~
(J)(J)W 00:::I-(J)
ClZ0CD
FIGURE 3.10 COMPARISON OF HYSTERETIC BOND STRESS-SLIP BEHAVIOR
BETWEEN PROPOSED MODEL AND ELIGEHAUSEN'S MODEL
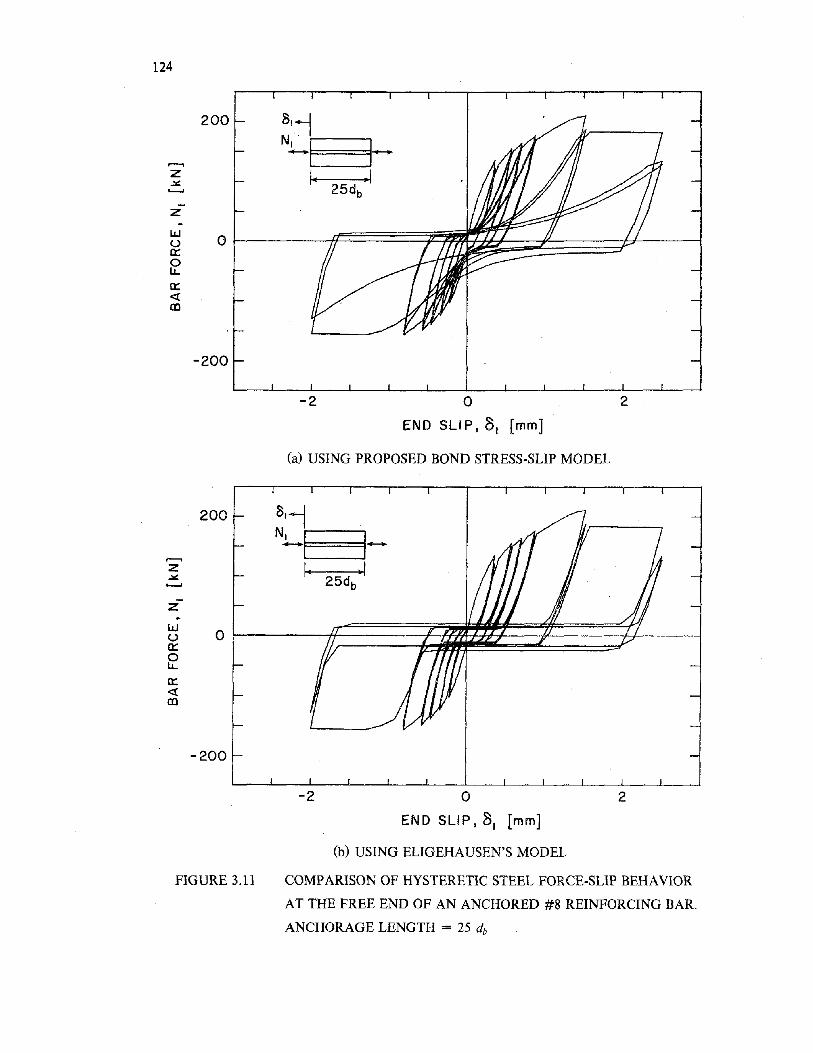
124
-z
200 81~
N~I----'I_
I.. .1
~ 0 ~----:f===~~~~~~~~====-)L--~olJ..
a::«CD
-200
-2 oEND SLlP,8, [mm]
(a) USING PROPOSED BOND STRESS-SLIP MODEL
2
200
z
81-1Nl-Ir----l_
I.. .1
-200
2-2 oEND SLIP, 81 [mm]
(b) USING ELIGEHAUSEN'S MODEL
COMPARISON OF HYSTERETIC STEEL FORCE-SLIP BEHAVIOR
AT THE FREE END OF AN ANCHORED #8 REINFORCING BAR.
ANCHORAGE LENGTH = 25 db
FIGURE 3.11
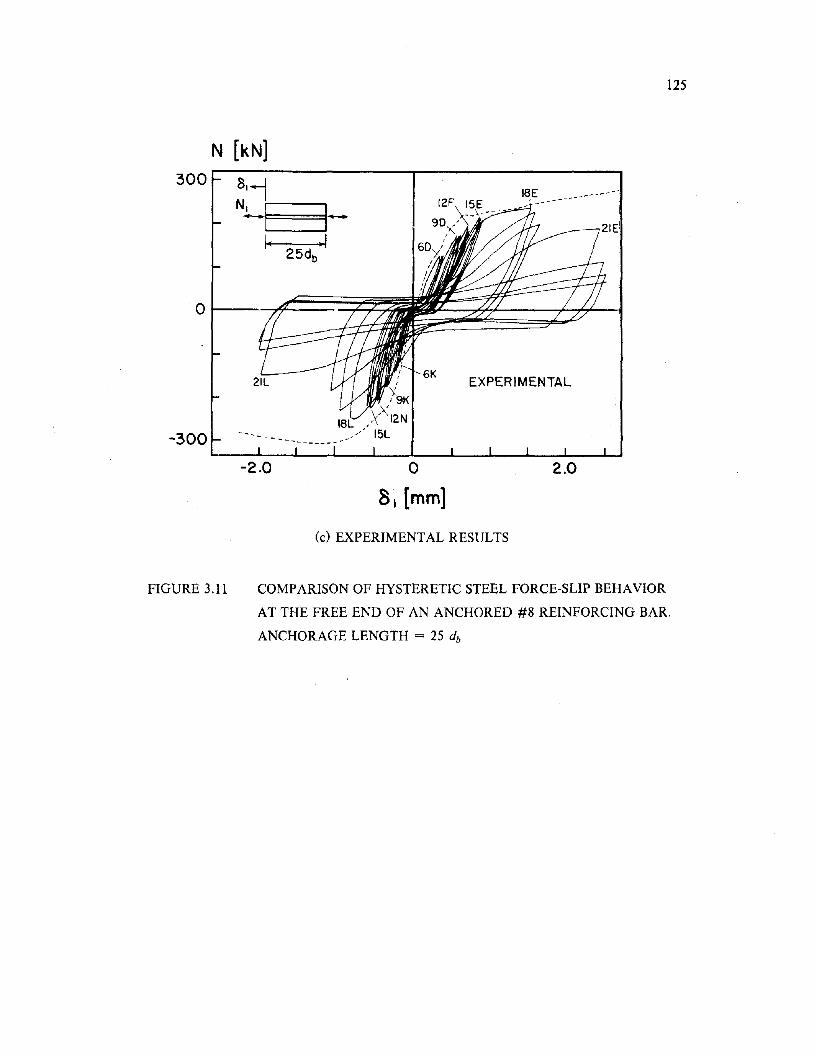
125
N [kN]300 81-l
N~I"'----I-'
/. -/
EXPERIMENTAL6K
18E12F 15E ,~-------
-_\------90~'
/60)'/I
II
I
J
II
I
"Y19K
>\18L ,X' 12N,/' 15L
-------------300
-2.0 o8 1 [mm]
2.0
(c) EXPERIMENTAL RESULTS
FIGURE 3.11 COMPARISON OF HYSTERETIC STEEL FORCE-SLIP BEHAVIOR
AT THE FREE END OF AN ANCHORED #8 REINFORCING BAR.
ANCHORAGE LENGTH = 25 db
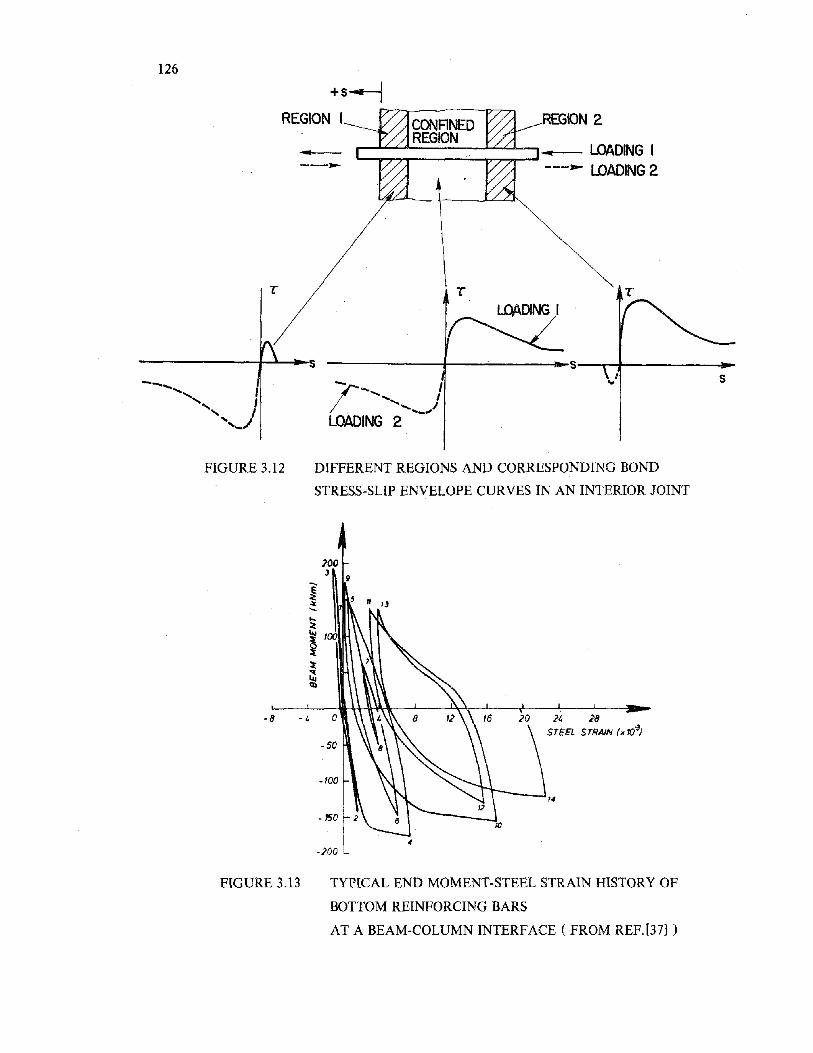
REGION 2
c:::~:===:;;~]_..- LOADING I---- LOADING 2
...----
+s------iREGION I
126
T
7- -, I...., I
. ..... .._.,1LOADING 2
-------t---~----,lI-S-_,__t_----___tl-
~DINGI
-------f--l.~-s
FIGURE 3.12 DIFFERENT REGIONS AND CORRESPONDING BOND
STRESS-SLIP ENVELOPE CURVES IN AN INTERIOR JOINT
- 8 - 4
-50
24 28SrEEL SrRAlN (.10.3;
-}OO
FIGURE 3.13 TYPICAL END MOMENT-STEEL STRAIN RISTORY OF
BOTTOM REINFORCING BARS
AT A BEAM-COLUMN INTERFACE (FROM REF.[37] )
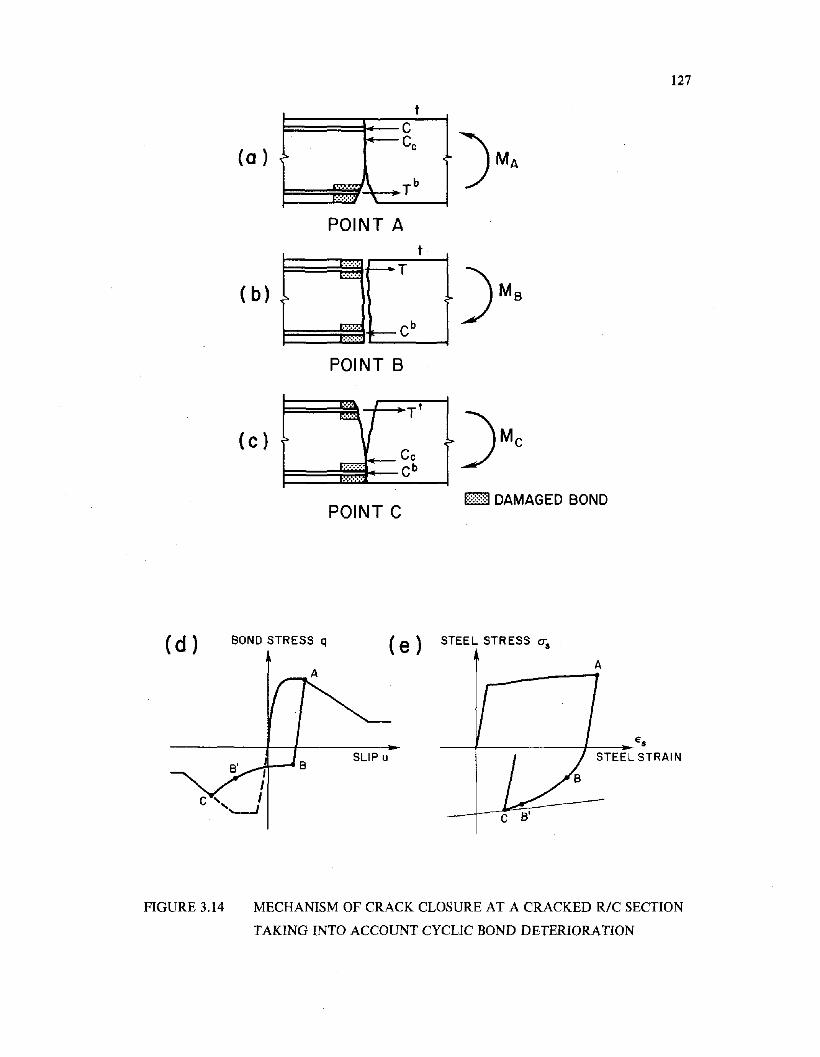
127
tC
·)MA(0 )~CC
~
~\ T b......... '\
POINT At
.......T
~ )MB( b) ~
mm cb......•...
POINT 8
":010. I r t
if> )Mc(c)
~cc1:'••••••••• cb
POINT C1:::::::::::1 DAMAGED BOND
(d ) . BOND STRESS q ( e) STEEL STRESS o"s
A
_---f- +--------i_ES
STEEL STRAI N
FIGURE 3.14 MECHANISM OF CRACK CLOSURE AT A CRACKED RiC SECTION
TAKING INTO ACCOUNT CYCLIC BOND DETERIORATION
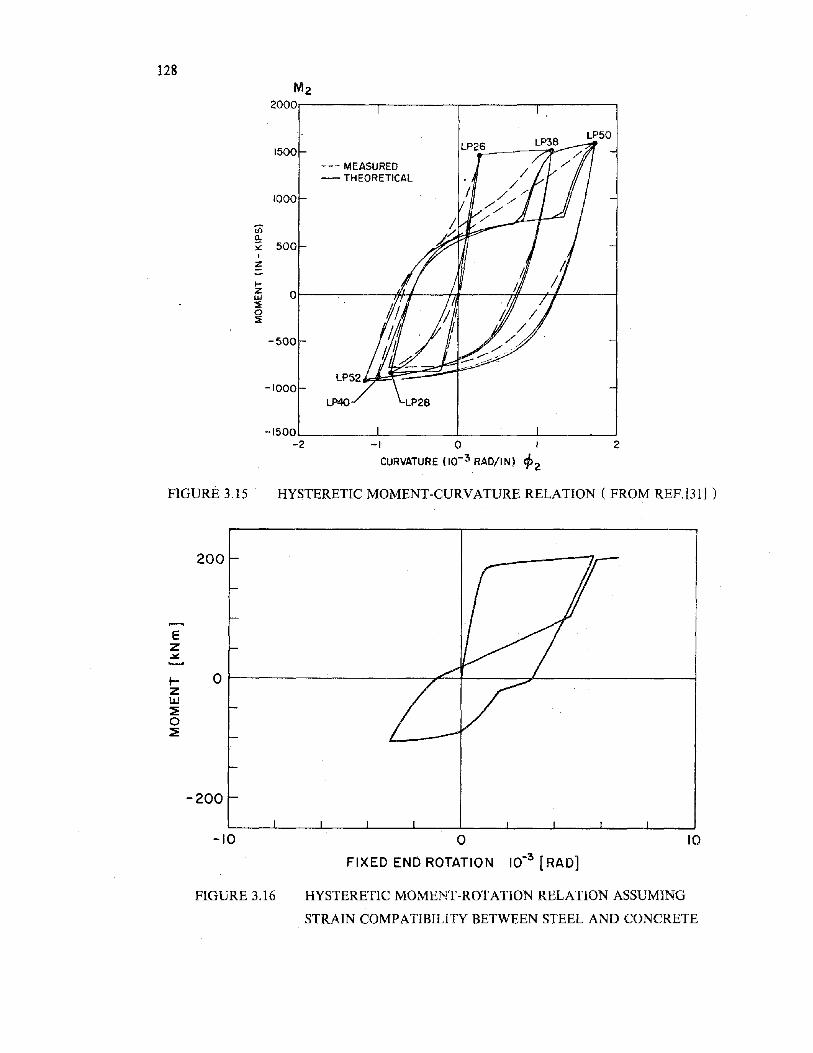
128
FIGURE 3.15
M22000
LP50
1500--- MEASURED- THEORETICAL
1000
(i)!!:
500y;I
~
I-Z 0U!::ii0::ii
-500
-1000LP40
-1500-2 -I 0 I 2
CURVATURE (10-3 RAO/IN) ep2
HYSTERETIC MOMENT-CURVATURE RELATION (FROM REF.[3l] )
200
Ez~
I- Ot-------'------~"--f----___::;;'-'--------__I
ZW:!:o:!:
-200
-10 oFIXED END ROTATION 10-3 [RAD]
10
FIGURE 3.16 HYSTERETIC MOMENT-ROTATION RELATION ASSUMING
STRAIN COMPATIBILITY BETWEEN STEEL AND CONCRETE
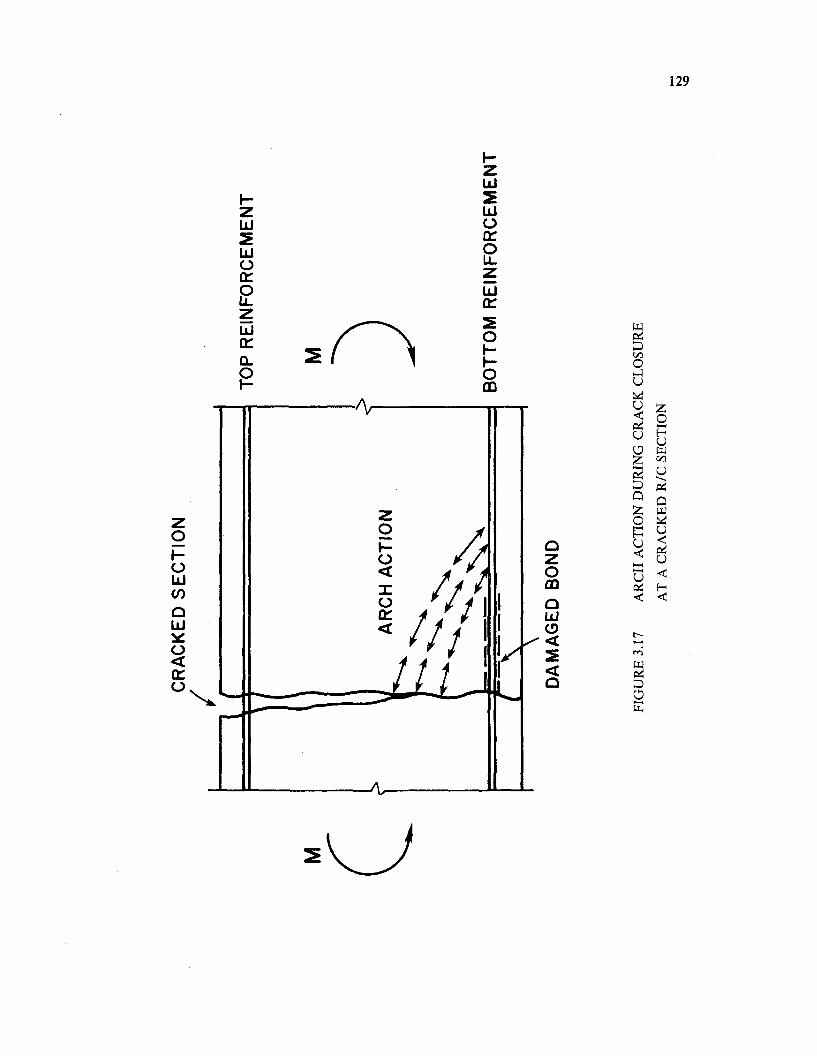
M
CR
AC
KE
DS
EC
TIO
N
(I
,•
I
TOP
RE
INF
OR
CE
ME
NT
M
AR
CH
AC
TIO
N
BO
TT
OM
RE
INF
OR
CE
ME
NT
DA
MA
GE
DB
ON
D
FIG
UR
E3.
17A
RC
HA
CT
ION
DU
RIN
GC
RA
CK
CL
OSU
RE
AT
AC
RA
CK
ED
RIC
SEC
TIO
N..... I>
.)
\0
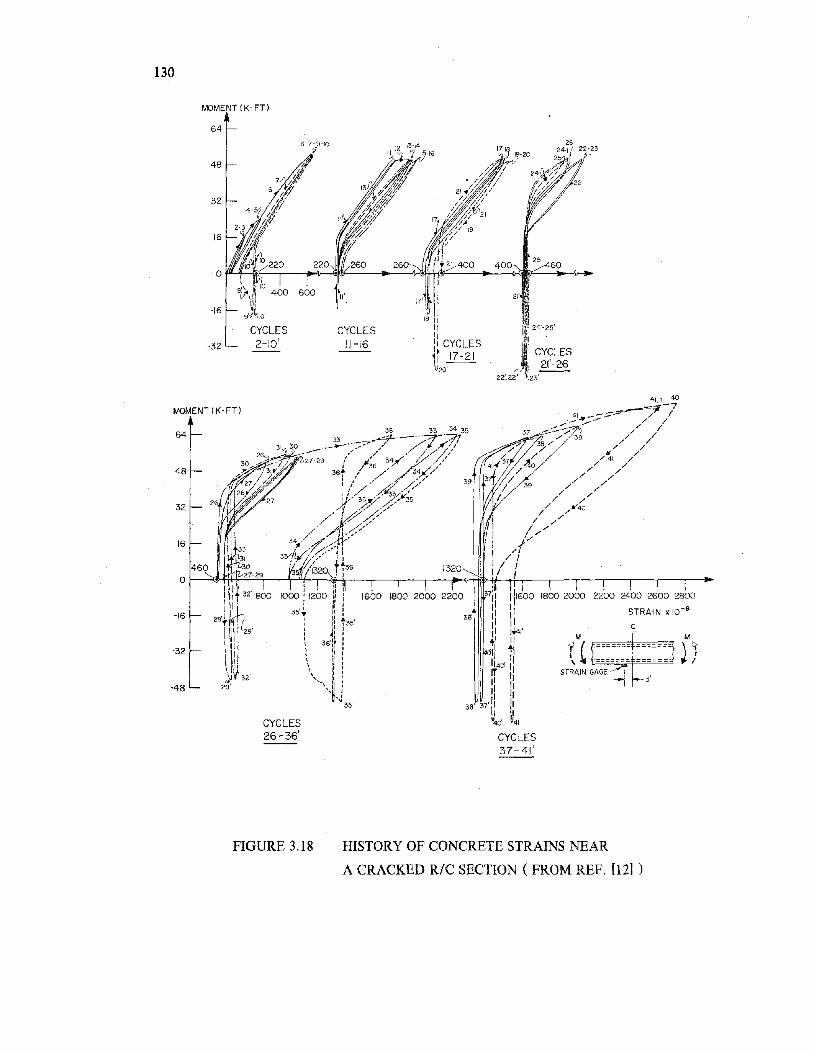
130
MOMENT (K-FT)
64
6-7-9-10'fi
48
32
16
0
600 II'
-16
CYCLES CYCLES-32 2-10' 11-16
400
II
17' :
IS' IiII\1:~ CYCLES
1, 17-21U20'
I
400 i 25 460
III,
2)' ,I:I'
I..til 24'-25'i! .[ CYCLESI 21'-26
A/~ -22',22" \23'
it.
(I rccooo~=====~ \M1\ ~ ======= ====== oJ I
STRAIN GAGE------T~ 3"
CYCLES37-41'
CYCLES26-36'
460
36 33 34 3533 .---._-4---'--:;::r'7J
31"1 30 ~---.,.-- ,/ / l//./26 _;; --- , ~ • /. I
30....-:: OJ / ,/l-27-29 / It' 34/ .//. ,/'" • ,,36 -'''/;;-:/'
/.)'; 31 36~ / / 3~../
: / ' /;/ ~/:1/ A3'/
j,r"3w.7"35" '>::'/'V./
/i A~:?/34, ,~-d!-
33/,(.(,' ·1'- ::'3'5~(320 Tt36
,I ,Ot-----":M-m-=--=,----'o--";t-r--(!l-Ir--.,..__--,---.--,II~+tliI>_J,I__?7_r_-_._-.,..__-_,_-__,-_r-___,-.....
1 11\ , 1 I} \I It 32 800 1000: 1200 :' i1
1
"1' ," ,I'fu 3501 I: I29' l II T I: ~35'
TI~I, ", I
I \1\ I 29' : J::[III '\ 36',":
UII' \,' ,II \1 ,,' ,
\ \ ,I I
~ jj! \:1 :,JJ'( 32' \. '::
29' "'~\, 1: l'~, :
'" "35'
16
64
48
32
-16
MOMENT (K-FT)
-32
-48
FIGURE 3.18 HISTORY OF CONCRETE STRAINS NEAR
A CRACKED RIC SECTION ( FROM REF. [12] )
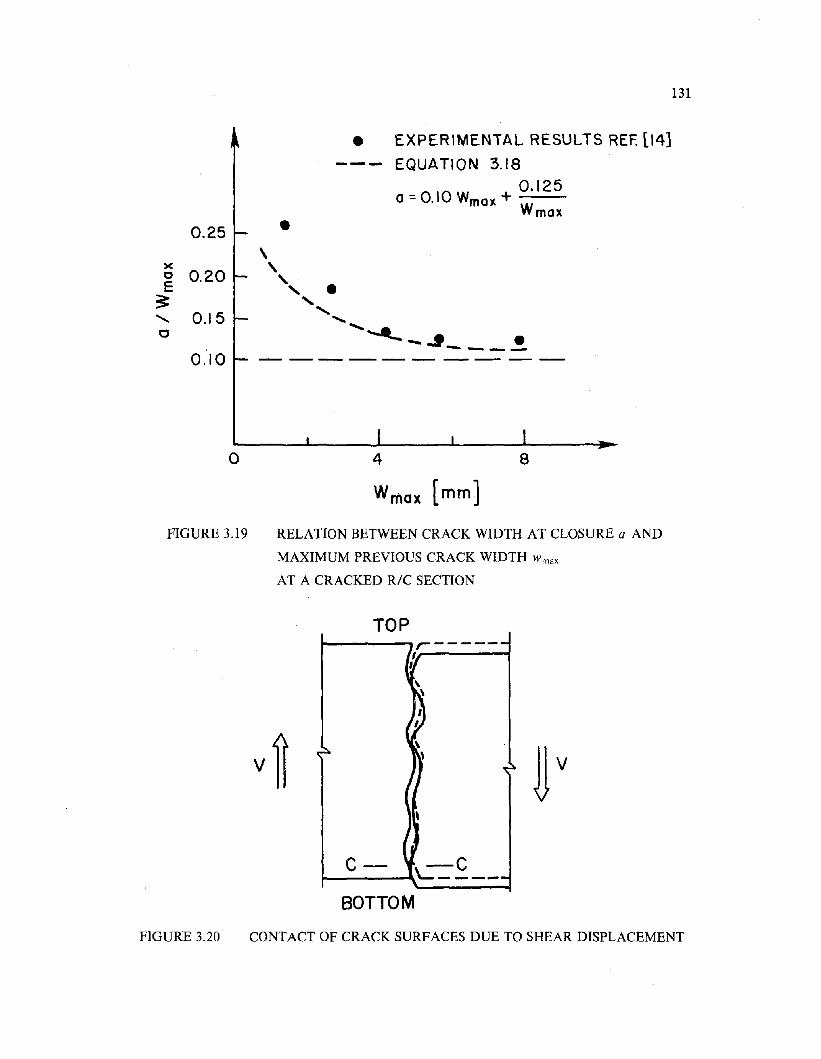
0.25
)(
0 0.20E~"- 0.150
0.10
131
• EXPERIMENTAL RESULTS REF. [14]
--- EQUATION 3.180.125
0= 0.10 Wmax + --Wmax
•\ ,,
" .""- ...............----..t •-. ----
o 4
Wmax [mm]8
FIGURE 3.19 RELATION BETWEEN CRACK WIDTH AT CLOSURE a AND
MAXIMUM PREVIOUS CRACK WIDTH W max
AT A CRACKED RIC SECTION
TOP
c-
~v
BOTTOM
FIGURE 3.20 CONTACT OF CRACK SURFACES DUE TO SHEAR DISPLACEMENT
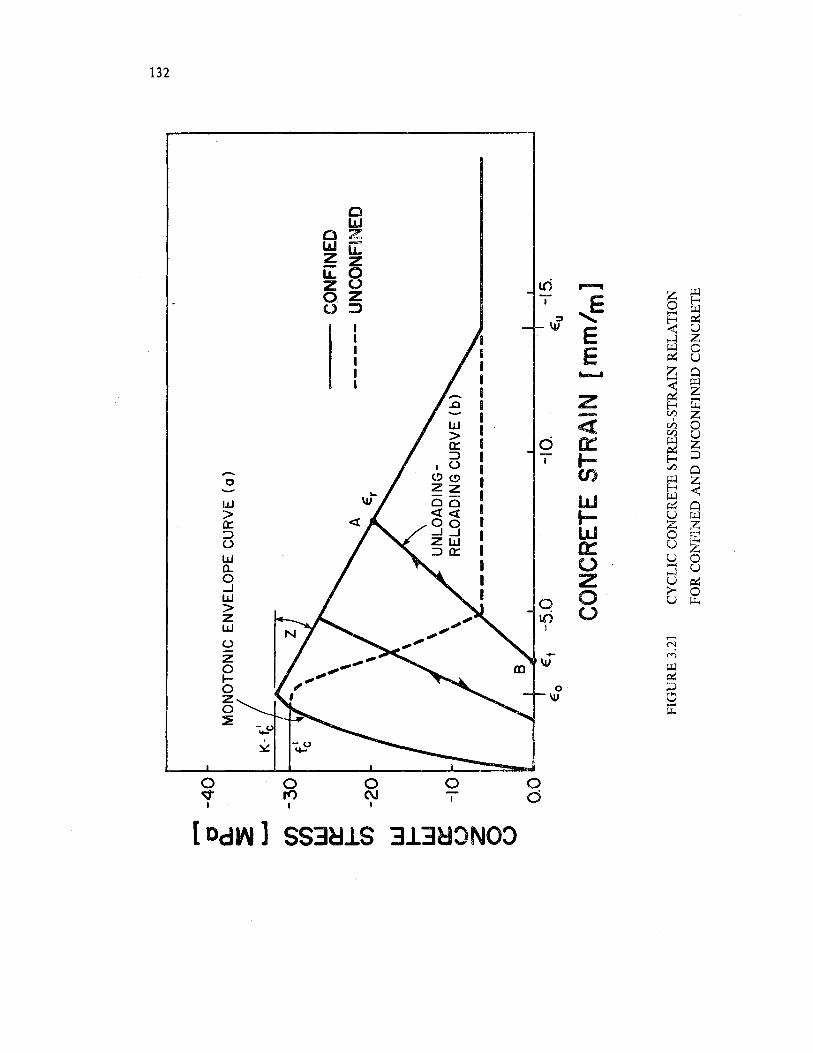
c...> N
--
CO
NFI
NE
D------
UN
CO
NFI
NED
UN
LO
AD
ING
-~
RE
LO
AD
ING
CU
RV
E(b
)
MO
NO
TO
NIC
EN
VE
LO
PE
CU
RV
E(a
)
~
II
°II.,
,I
~I
I.I
-15
O.€
t"5
.0-1
0.E
u'
Eo
en-3
0/
fltt
(J)
cIL
l a::: I (J)
-20
ILl ~ a:::
-10
U Z o Ur-"I
o-4
0Q
.:E
CO
NC
RET
ES
TRA
IN[m
m/m
l
FIG
UR
E3.
21C
YC
LIC
CO
NC
RE
TE
ST
RE
SS
-ST
RA
INR
EL
AT
ION
FO
RC
ON
FIN
ED
AN
DU
NC
ON
FIN
ED
CO
NC
RE
TE
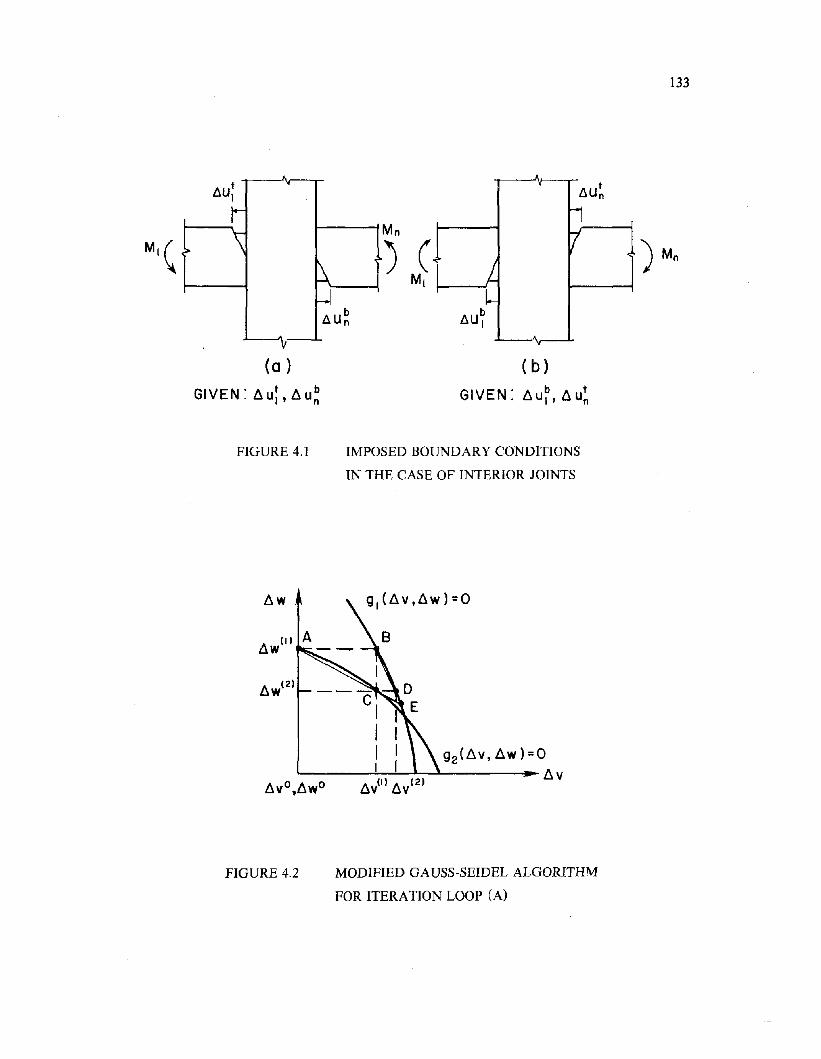
133
(0 )
GIVEN: 6 ur '6 u~
FIGURE 4.1
(b)
GIVEN:6u~,6u~
IMPOSED BOUNDARY CONDITIONS
IN THE CASE OF INTERIOR JOINTS
c,I! I g2(6v,6w)=Q
L.- ..:..-..:..-....L-~ __.,_ 6 v6vo,6wo 6v(l) 6V(2)
FIGURE 4.2 MODIFIED GAUSS-SEIDEL ALGORITHM
FOR ITERATION LOOP (A)
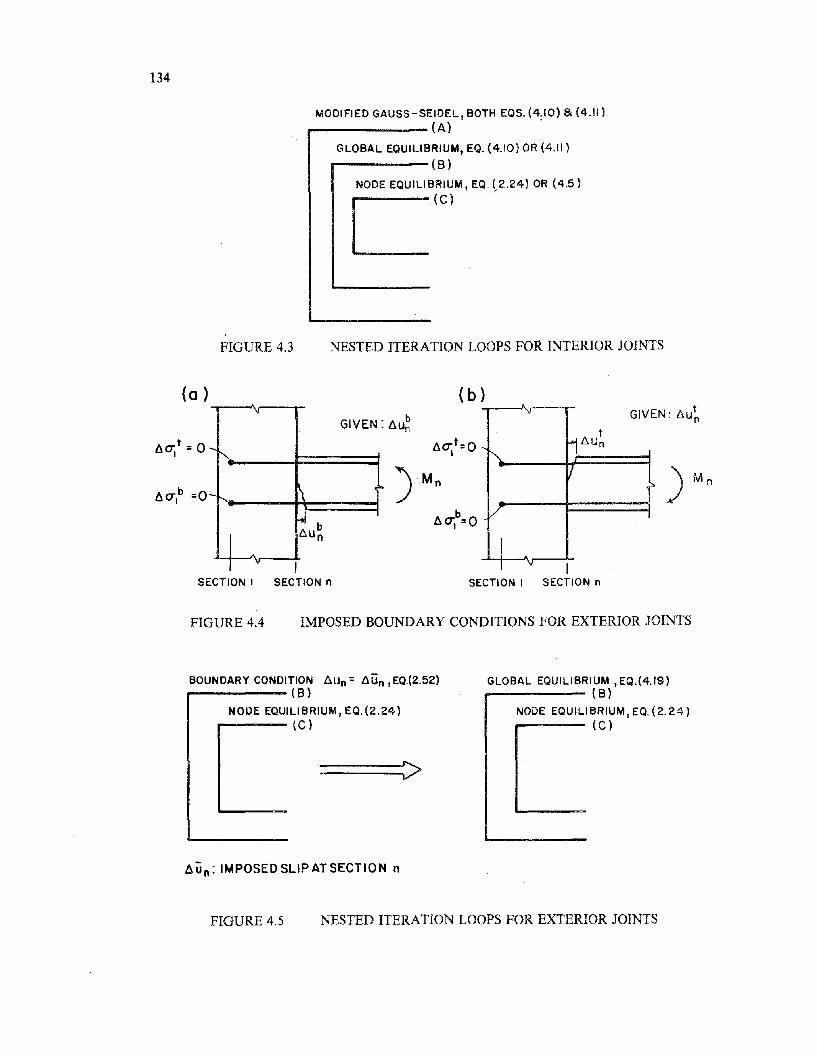
134
MODIFIED GAUSS-SEIDEL, BOTH EQS. (4.10) a (4.11),..--- (A) .
GLOBAL EQUILIBRIUM, EQ. (4.10) OR (4.11)
r------(B)
NODE EQUILI BRI UM, EQ. (2.24) OR (4.5 )c(e) ,
FIGURE 4.3 NESTED ITERATION LOOPS FOR INTERIOR JOINTS
" GIVE
t
""H6Un
If.f>
/
II v I
SECTION I SECTION n
b60j =0
\I
GIVEN:
-",
- ~~ ...
~
I6.u b
n
T v-I
SECTION I SECTION n
(0 ) (b)6ub N: 6U~
n
60: t = 0 6Ut =0I I
FIGURE 4.4 IMPOSED BOUNDARY CONDITIONS FOR EXTERIOR JOINTS
BOUNDARY CONDITION 6un:: 6Un , EQ.(2.52)-----(8)
NODE EQUILIBRIUM, EQ.(2.24)...---- ec)
GLOBAL EQUILIBRIUM ,EQ.(4.19)_----(8)
NODE EQUILIBRIUM, EQ. (2.24)
---- (C)
6u n : IMPOSEDSL\PATSECTION n
FIGURE 4.5 NESTED ITERATION LOOPS FOR EXTERIOR JOINTS
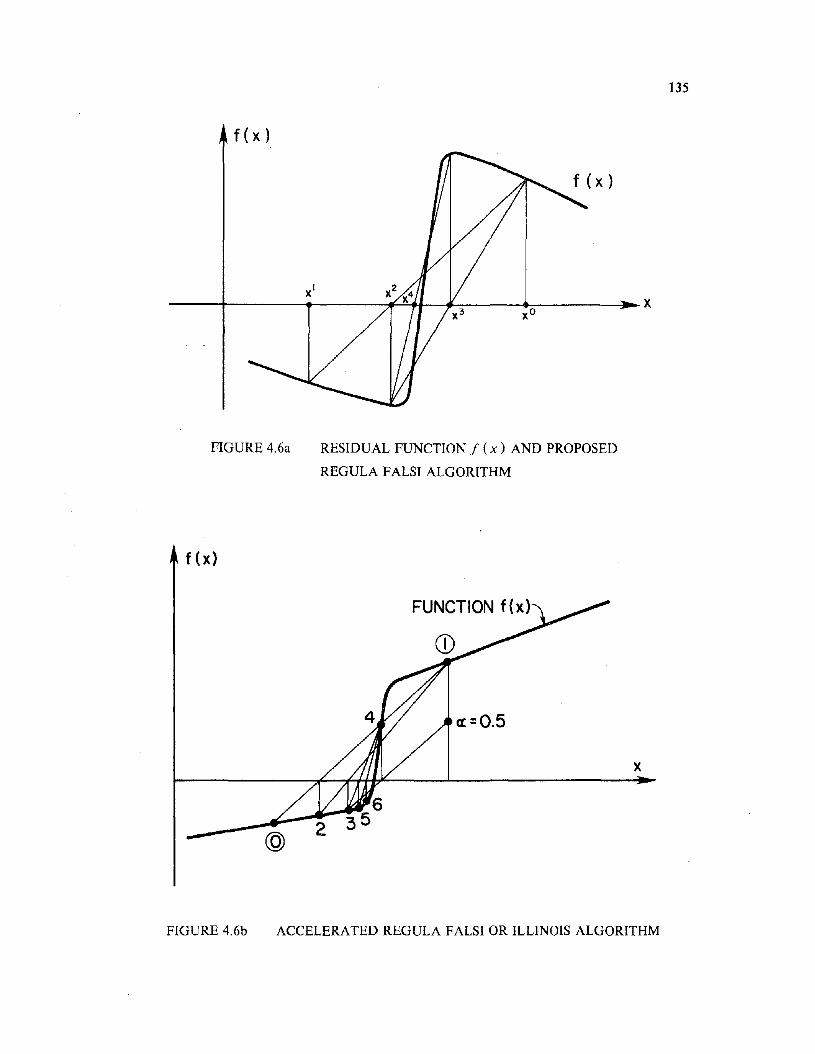
f ( x )
---+-------.---~~~_fJ. --_4_:_----~X
FIGURE 4.6a RESIDUAL FUNCTION f (x) AND PROPOSED
REGULA FALSI ALGORITHM
f(x)
135
FUNCTION f (x)
x
FIGURE 4.6b ACCELERATED REGULA FALSI OR ILLINOIS ALGORITHM
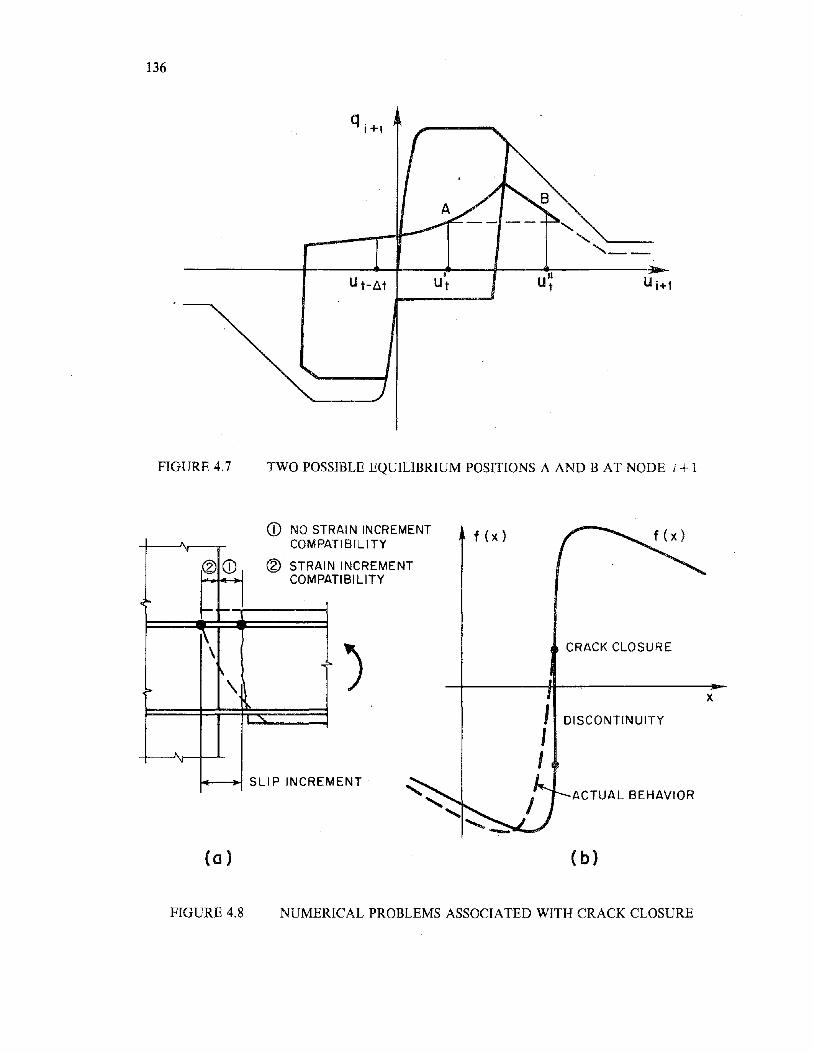
136
Ut-LltI
Ut
FIGURE 4.7 TWO POSSIBLE EQUILIBRIUM POSITIONS A AND B AT NODE i + 1
f (x)
)CRACK CLOSURE
X
I DISCONTINUITY
II
ENTACTUAL BEHAVIOR
CD NO STRAI N INCREMENTTIBILITY
INCREMENTTIBILITY
v COMPA
® CD ® STRAINCOMPA
~
~\
1\:.. \
"
,
SLI P INCREM
(0 ) (b)
FIGURE 4.8 NUMERICAL PROBLEMS ASSOCIATED WITH CRACK CLOSURE
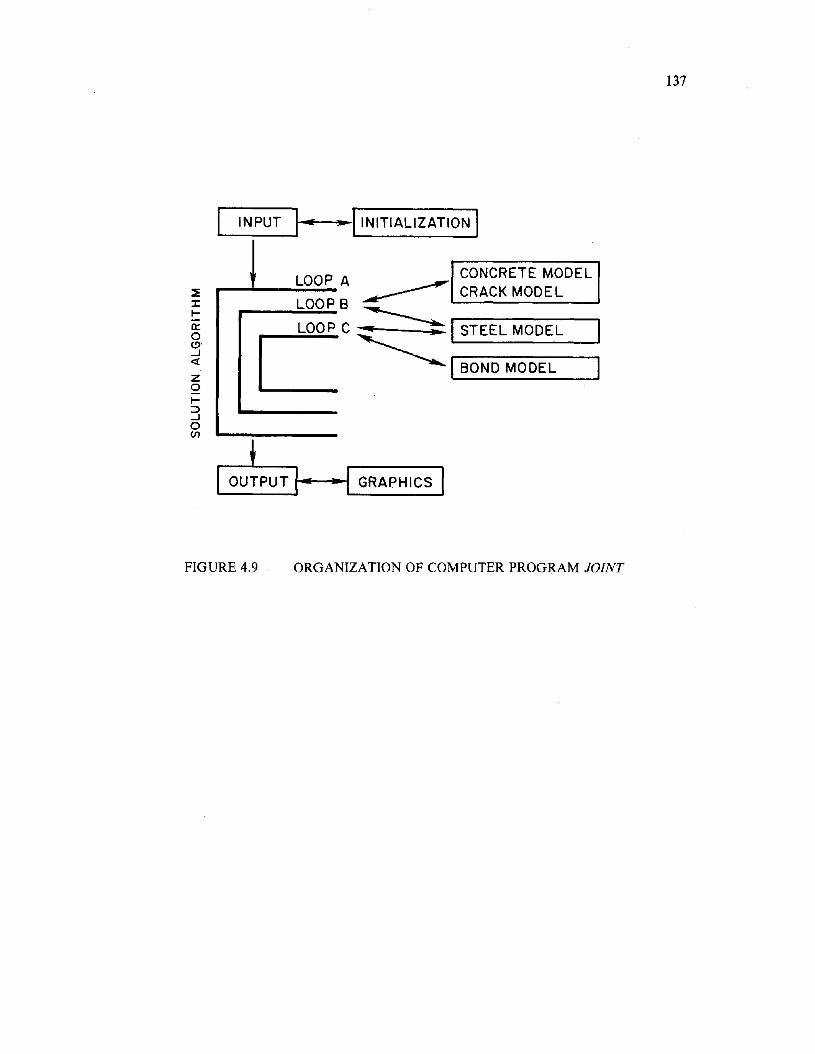
I INPUT I.. ..!INITIALIZATION ILOOP A CONCRETE MODEL
:! ...-------- ~ CRACK MODELx LOOP Bi LOOP C~ ISTEEL MODEL: C ~IBONDMODELto:::J-'oen
rootPUT I.. -I GRAPHICS I
137
FIGURE 4.9 ORGANIZATION OF COMPUTER PROGRAM JOINT
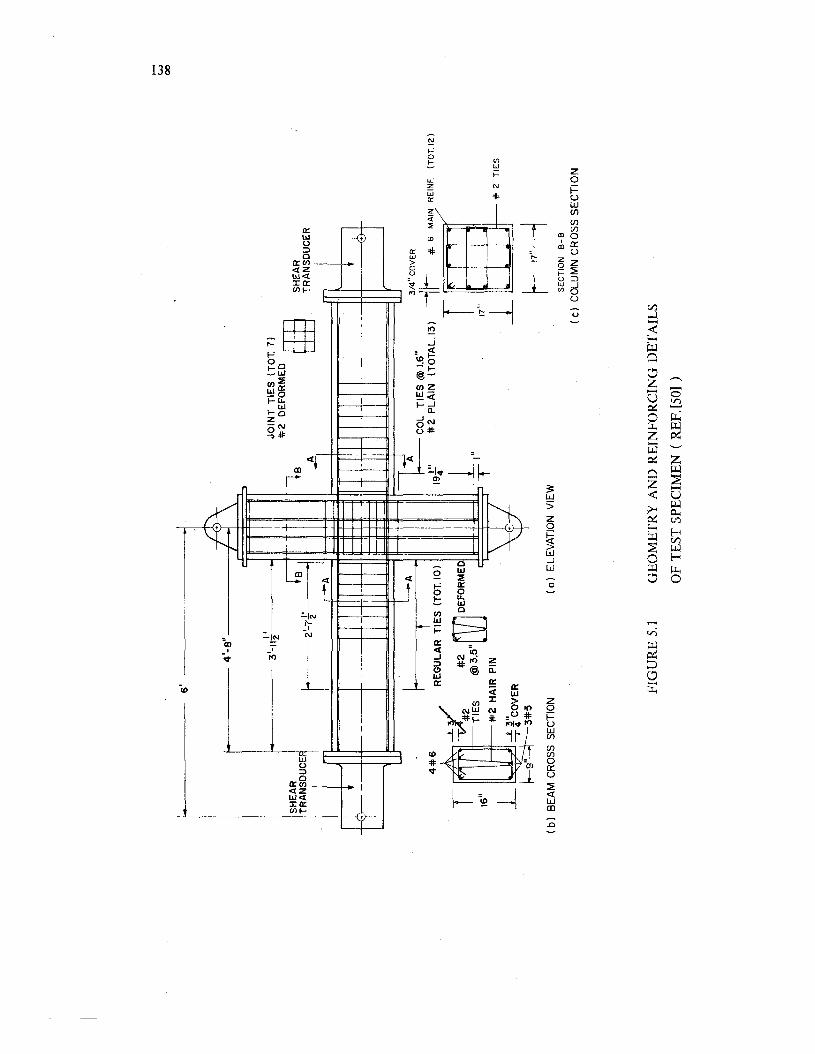
.......
w 00
6'
I-4
'-8
"t:f
\S
HE
AR
TRA
NS
DU
CE
R
i3
'"r,"
E2
-7'2
_~.
Ir-
A
1a-l
JOIN
TT
IES
(TO
T.
71
*2D
EF
OR
ME
D€EB
SH
EA
RT
RA
NS
DU
CE
R
#--2
TIE
S
r-,7"4
(a)
ELE
VA
TIO
NV
IEW
(b
)B
EA
MC
RO
SS
SE
CT
ION
'It
IIrr
IJl[
Lit
---
-:-Ii
.-
III.It
tI'
LAI~
"r
ti--
-=-C
OL
TIE
S(ij
)1.
6"3
/4C
OV
ER
416---
L?/
RE
GU
LAR
TIE
S(T
OT.
10
)1
9f'
*2
PL
AIN
(TO
TA
L,1
3)
-1r
4F6
MA
INR
EIN
F.(T
OT
,12
)
I~~
2*2
~2lIn
nDE
FOR
ME
DI
IT
ItDJr
16"
TIE
S@
3,5
U1J
.--L
I"_
I--
#'2
HA
IRP
IN\
II
T17
"
L~
7={:
fCO
VE
R+0
-+--
~1
-9"
3*
5
SE
CT
ION
B-B
(C)
CO
LUM
NC
RO
SS
SE
CT
ION
FIG
UR
E5.
1G
EO
ME
TR
YA
ND
RE
INF
OR
CIN
GD
ET
AIL
S
OF
TE
ST
SP
EC
IME
N(
RE
F.[
50]
)
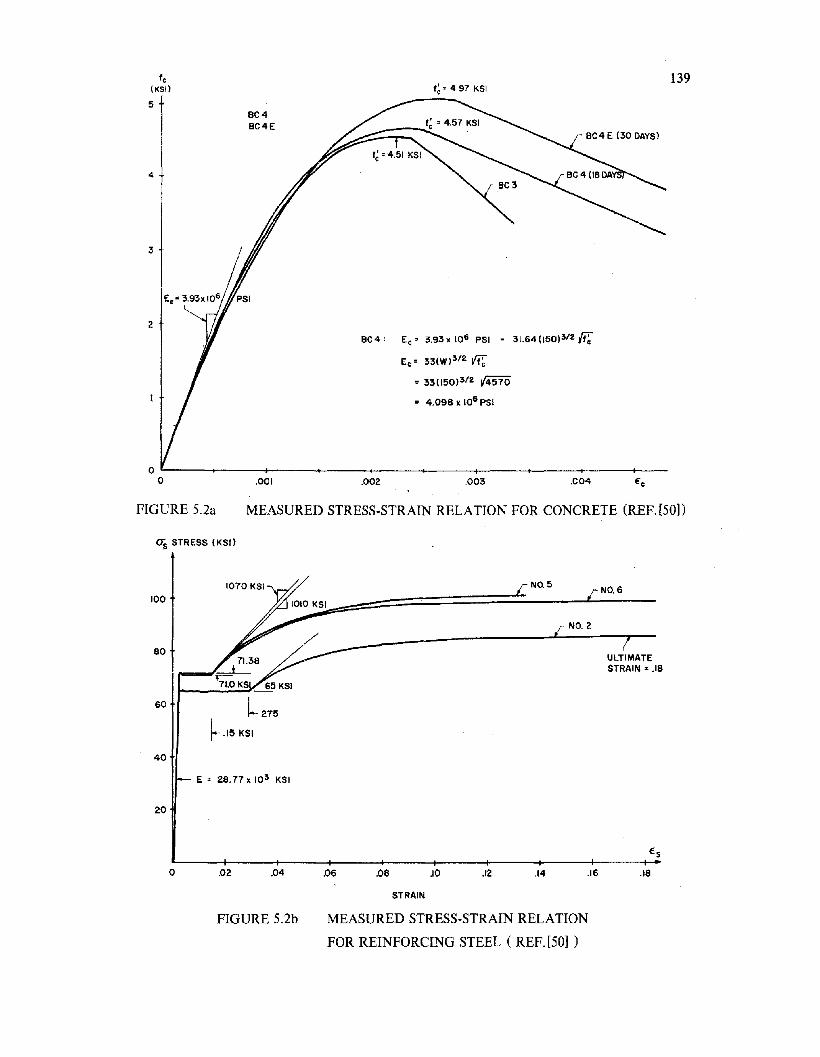
fc(Ksll
')4
3
2
BC4BC4E
f~: 4.97 KSI
BC 4 : Ec = 3.93 x 10⁶ PSI = 31.6411501 3/2 {f;
Ec : 33(W)3/2 ~
= 33(150)3/2 V4570
= 4.098 x 10⁶ PSI
139
.C04.003.002.001OL-----<------lf----_+_----+----t-----t----+----<------lf--
o
FIGURE 5.2a MEASURED STRESS-STRAIN RELATION FOR CONCRETE (REF.[50])
os STRESS (KSI)
100
80
60
NO.6
ULTIMATESTRAIN = .18
40
E = 28.77 x 10³ KSI
20
o .02 .04 .06 .08 .10 .12 .14 .16 .18
STRAIN
FIGURE 5.2b MEASURED STRESS-STRAIN RELATION
FOR REINFORCING STEEL ( REF. [50] )
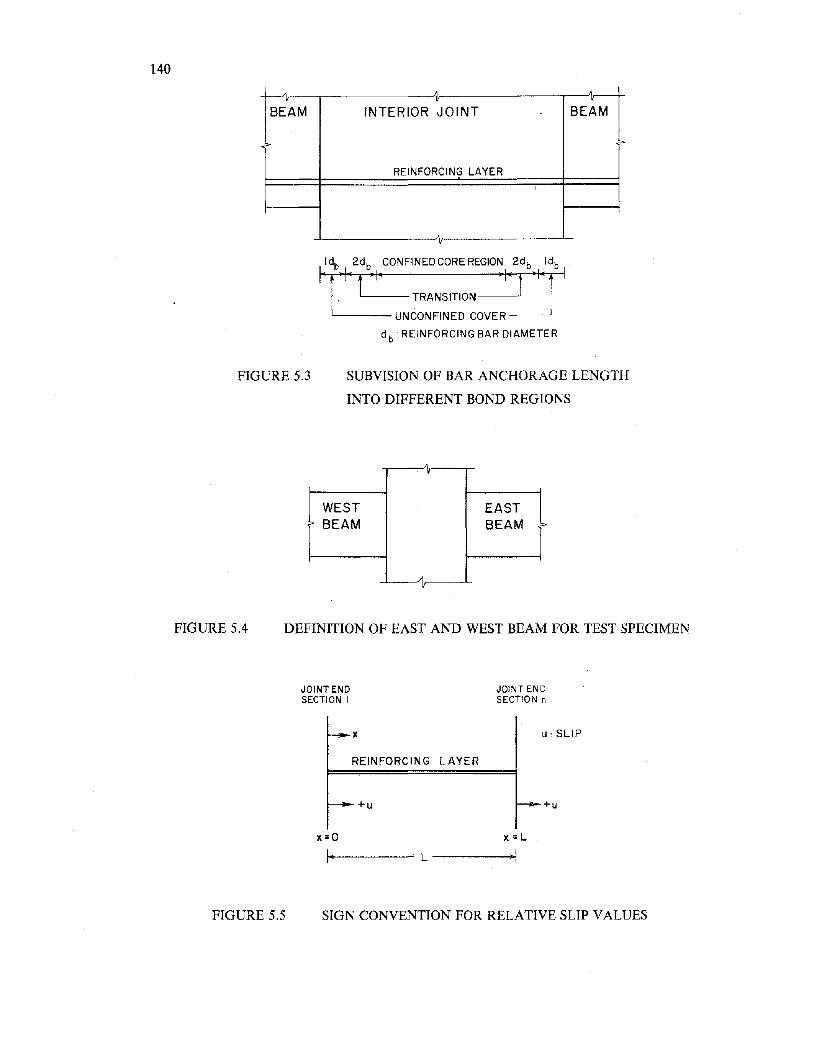
140
A
BEAM INTERIOR JOINT BEAM
REINFORCING LAYER
~b_I_CONFINEDCOREREGIO~ I_2~
' TRANSITION
. UNCONFINED COVER ~db: REINFORCING BAR DIAMETER
FIGURE 5.3 SUBVISION OF BAR ANCHORAGE LENGTH
INTO DIFFERENT BOND REGIONS
FIGURE 5.4
- .WEST EASTBEAM BEAM >
AV
DEFINITION OF EAST AND WEST BEAM FOR TEST SPECIMEN
JOINT ENDSECTION I
x=O
x
REINFORCING LAYER
+u
JOINT ENDSECTION n
u: SLIP
+u
x=L
FIGURE 5.5
II-~---~ L -------.---..j.!
SIGN CONVENTION FOR RELATIVE SLIP VALUES
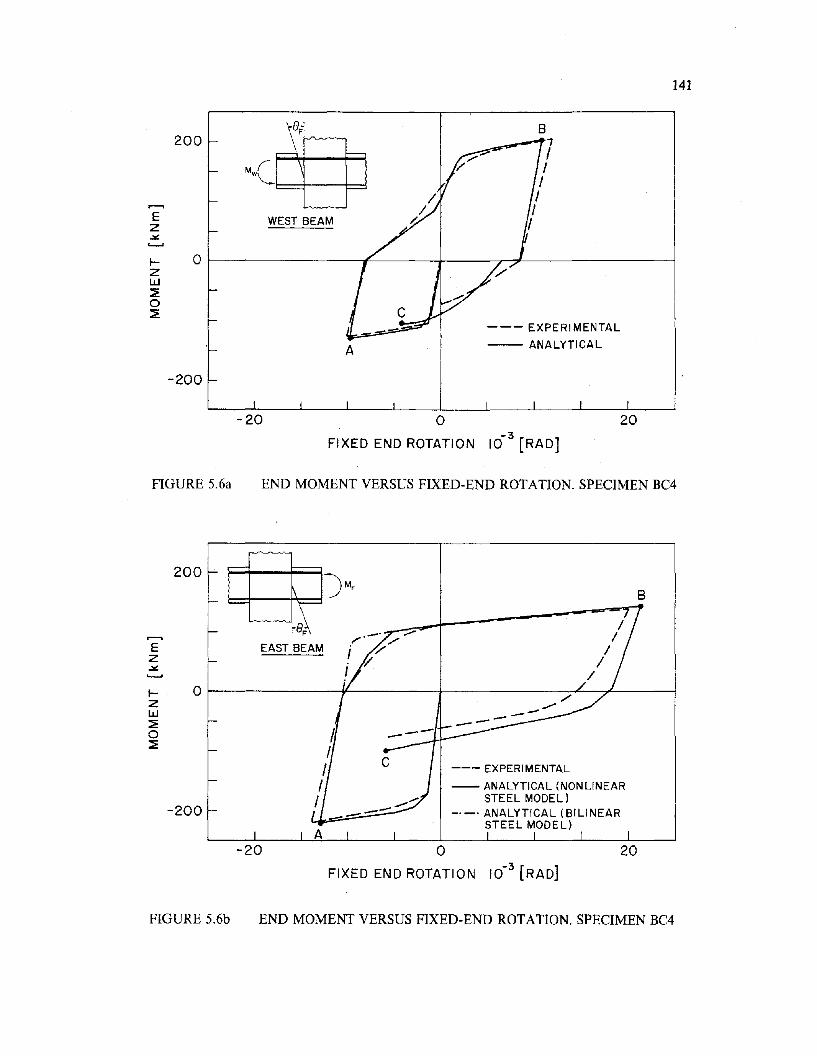
141
--- EXPERIMENTAL
- ANALYTICALA
200
I- Ol--------------.l~--____,.I__--__r__,l_-------____I
ZW~o~
~ WEST BEAM..¥:.........
-200
-20 oFIXED END ROTATION 10-
3[RAD]
20
FIGURE 5.6a END MOMENT VERSUS FIXED-END ROTATION. SPECIMEN BC4
200
B
--- EXPERIMENTAL
-- ANALYTICAL (NONLINEARSTEEL MODEL)
_._. ANALYTICAL (BILINEARSTEEL MODEL)
---c
_. ;,/'
;,' ,;-. ~
! VI
L-.--~r~EAST BEAM
O~----------¥------~-------oC----r-------I
-200
Ez..¥:
-20 oFIXED END ROTATION 10-
3[RAD]
20
FIGURE 5.6b END MOMENT VERSUS FIXED-END ROTATION. SPECIMEN BC4
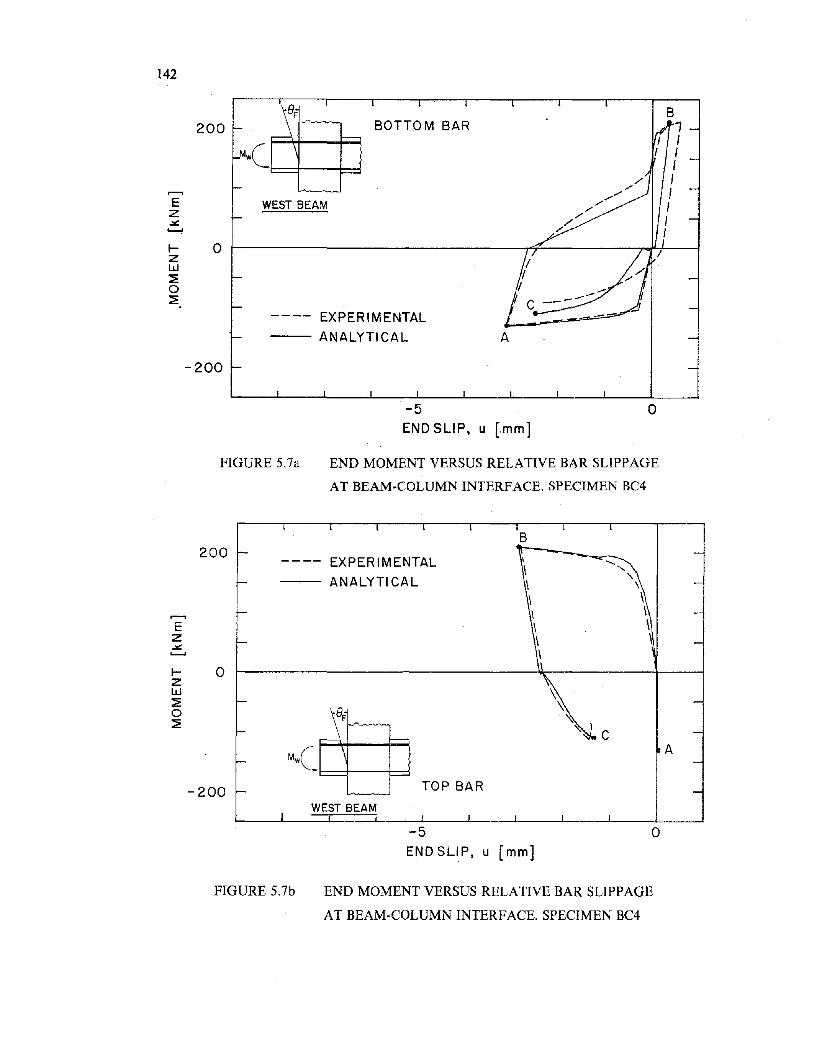
142
200 \~ BOTTOM BAR
~(@E WEST BEAMz~
'--'
f- 0zw:E0:E
---- EXPERIMENTAL
ANALYTICAL A
-200
-5END SLIP, u [mm]
o
FIGURE 5.7a END MOMENT VERSUS RELATIVE BAR SLIPPAGE
AT BEAM-COLUMN INTERFACE. SPECIMEN BC4
200
~
Ez~
'--'
f- 0zw:Eo:E
-200
B
EXPERIMENTAL
ANALYTICAL
\~
~(~~ TOP BAR
WEST BEAM
-5ENDSLlP, u [mm]
o
A
FIGURE 5.7b END MOMENT VERSUS RELATIVE BAR SLIPPAGE
AT BEAM-COLUMN INTERFACE. SPECIMEN BC4
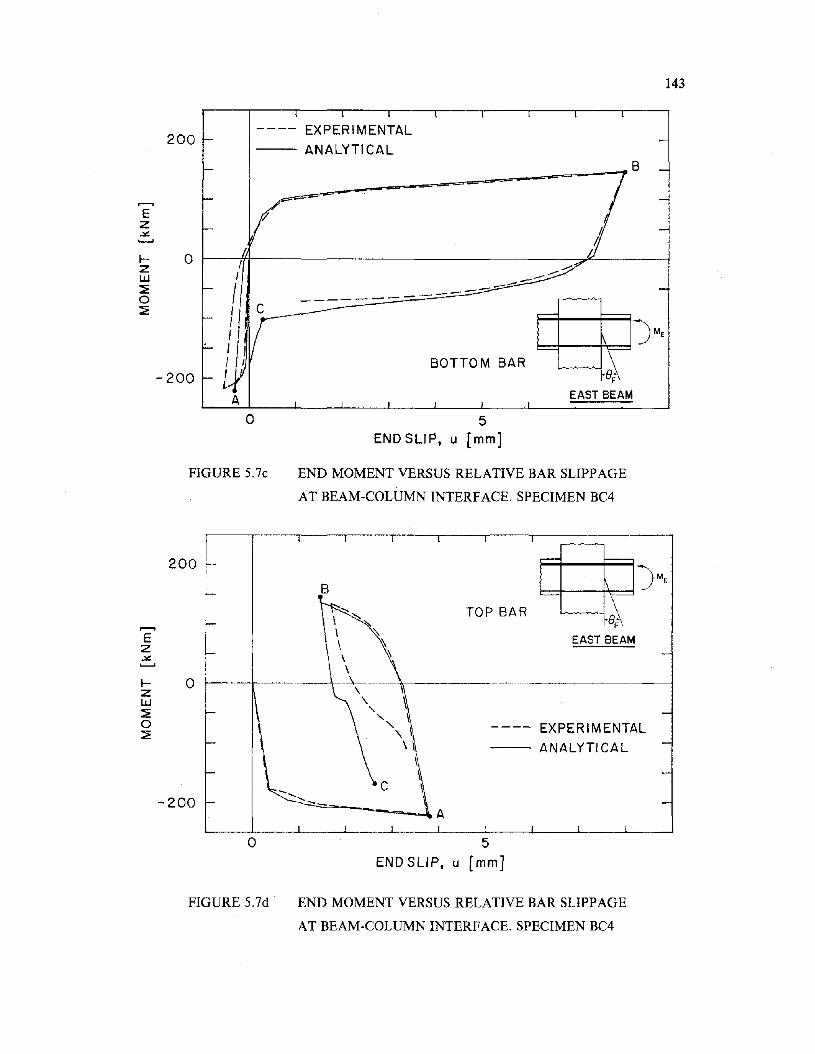
143
200---- EXPERIMENTAL
_.- ANALYTICAL
---------
~~r~EAST BEAM
BOTTOM BAR
5ENDSLlP, u [mm]
o
IIIIIIIII III.....
A
o
-200
fZW~o~
EzoX'--'
FIGURE 5.7c END MOMENT VERSUS RELATIVE BAR SLIPPAGE
AT BEAM-COLUMN INTERFACE. SPECIMEN BC4
200
B
---- EXPERIMENTAL
-- ANALYTICAL
EzoX'--'
fZW~o~
o
-200
TOP BAR ~~r~EAST BEAM
o 5ENDSLlP, u [mm]
FIGURE 5.7d END MOMENT VERSUS RELATIVE BAR SLIPPAGE
AT BEAM-COLUMN INTERFACE. SPECIMEN BC4
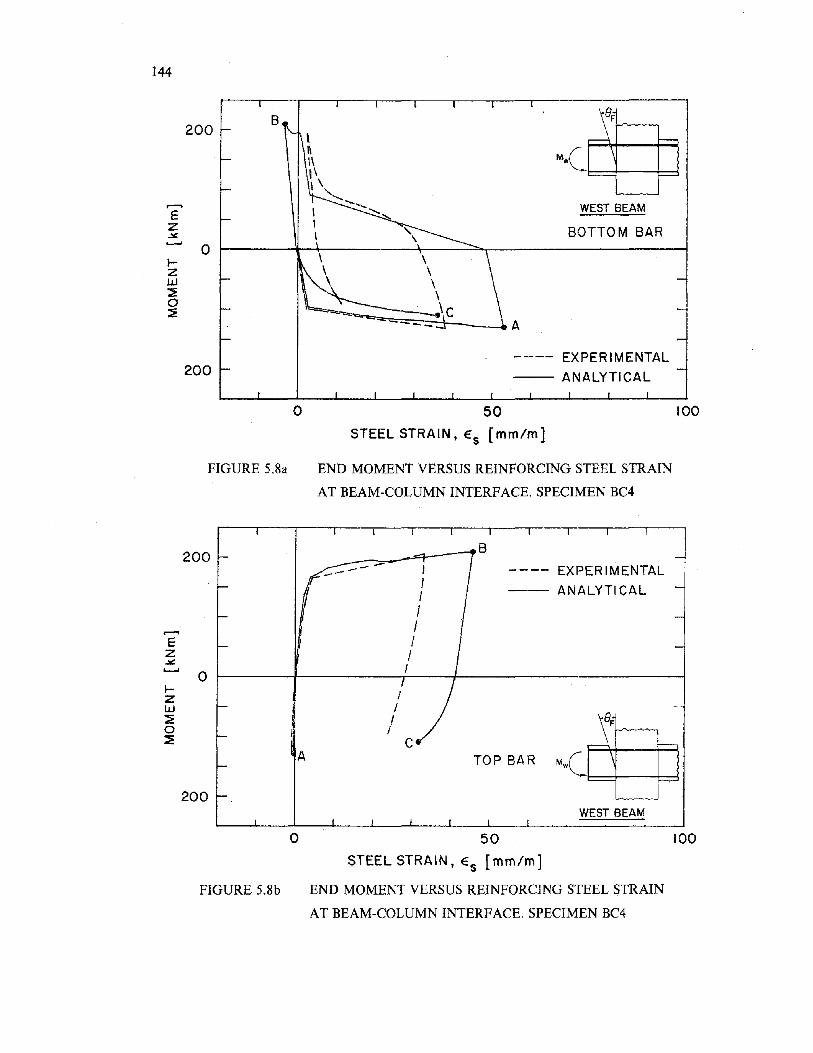
144
,.......,Ez.:JJ:~
IZW~o~
200
o
B
WEST BEAM
BOTTOM BAR
200EXPERIMENTAL
-- ANALYTICAL
FIGURE 5.8a
o 50
STEEL STRAIN. Es [mm/m]
END MOMENT VERSUS REINFORCING STEEL STRAIN
AT BEAM-COLUMN INTERFACE. SPECIMEN BC4
100
50 100
STEEL STRAIN. Es [mm/m]
END MOMENT VERSUS REINFORCING STEEL STRAIN
AT BEAM-COLUMN INTERFACE. SPECIMEN BC4
---- EXPERIMENTAL
-- ANALYTI CAL
\~TOPBAR M_c@
WEST BEAM
IIIIII/I
III/
__-""""__~_IB
FIGURE 5.8b
200
,.......,Ez.:JJ:~
0I-ZW~0~
A
200
a
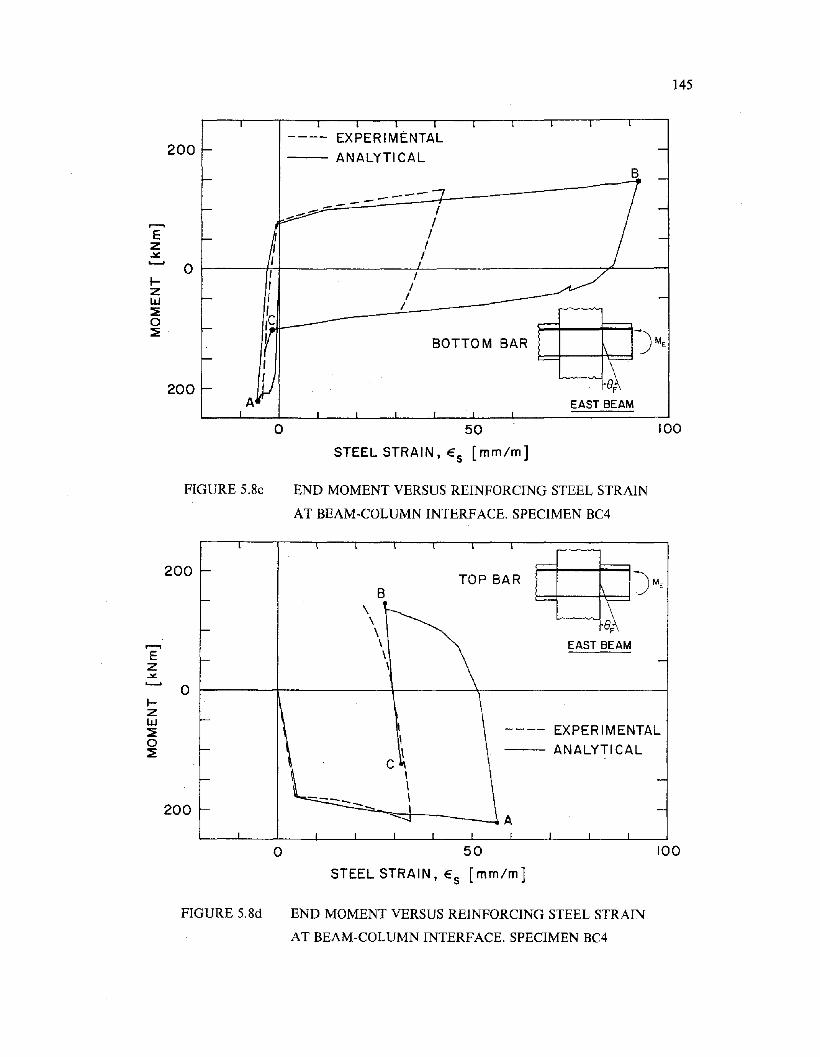
145
200---- EXPERIMENTAL
-- ANALYTICAL
L---o.-~r~EAST BEAM
BOTTOM BAR
II
II
I
_--"7------
A
o ~---fT+--------!-I---------~,4--I
I/
200
.....ZlLJ~o~
o 50
STEEL STRAIN, Es [mm/m]
100
FIGURE 5.8c END MOMENT VERSUS REINFORCING STEEL STRAIN
AT BEAM-COLUMN INTERFACE. SPECIMEN BC4
'----"-~r~EAST BEAM
A
EXPERIMENTAL
-- ANALYTICAL
TOP BAR
\\II
B\
\\\\\
o
200
200
.....ZlLJ~o~
a 50
STEEL STRAIN, Es [mm/m]
100
FIGURE 5.8d END MOMENT VERSUS REINFORCING STEEL STRAIN
AT BEAM-COLUMN INTERFACE. SPECIMEN BC4
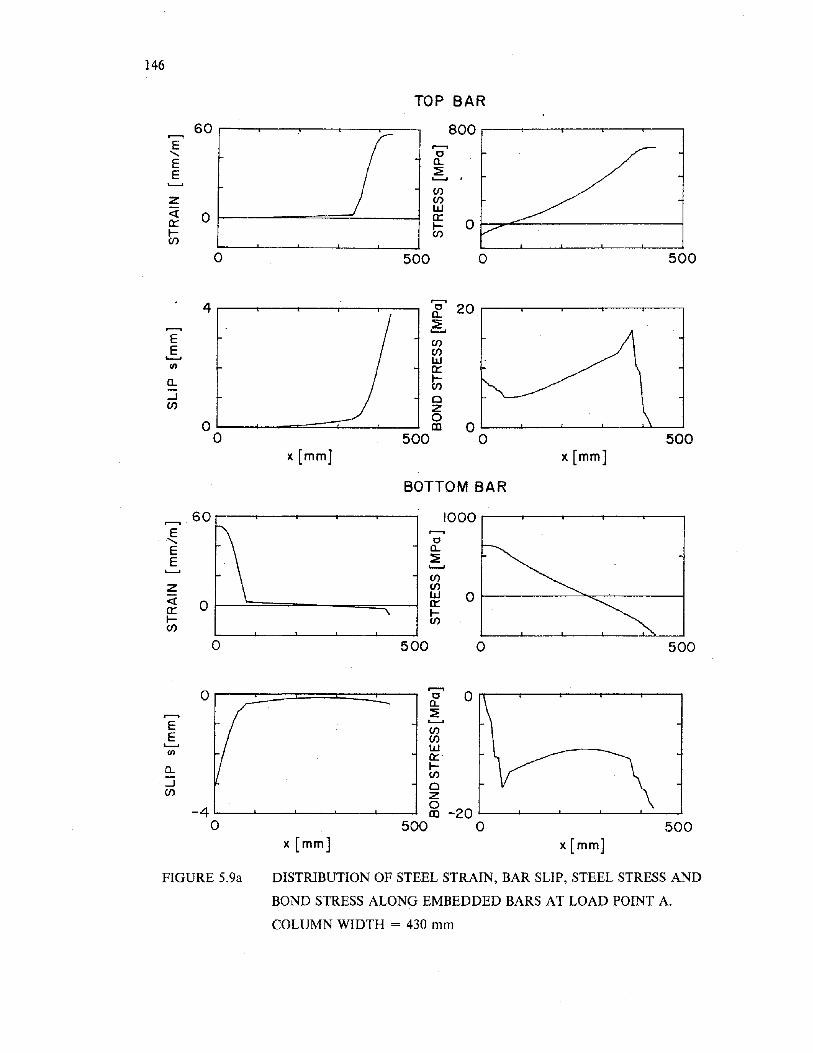
146
TOP BAR
60 800.........,
rE ......." 0E £l.
E ~.......CI)
z CI)
<[ wa:: 0 a::
0~~ (f)CI)
0 500 0 500
4.......
200£l.
....... ~.......E (f)E CI)....... wlI) a::£l. ~
CI)
....J ClCI) Z
00CD 0
0 500 0 500x [mm] x [mm]
BOTTOM BAR
60 1000E
\.......
" 0E £l.
E ~.......CI)
z CI)
<[ w 00 a::a:: ~
~ CI)CI)
0 500 0 500
0,.......,
00£l.~
E CI)E CI)....... wlI) a::£l. ~
:JCI)
ClCI) z
-4 0-20CD
0 500 0 500x [mm] x[mm]
FIGURE 5.9a DISTRIBUTION OF STEEL STRAIN, BAR SLIP, STEEL STRESS AND
BOND STRESS ALONG EMBEDDED BARS AT LOAD POINT A.
COLUMN WIDTH = 430 mm
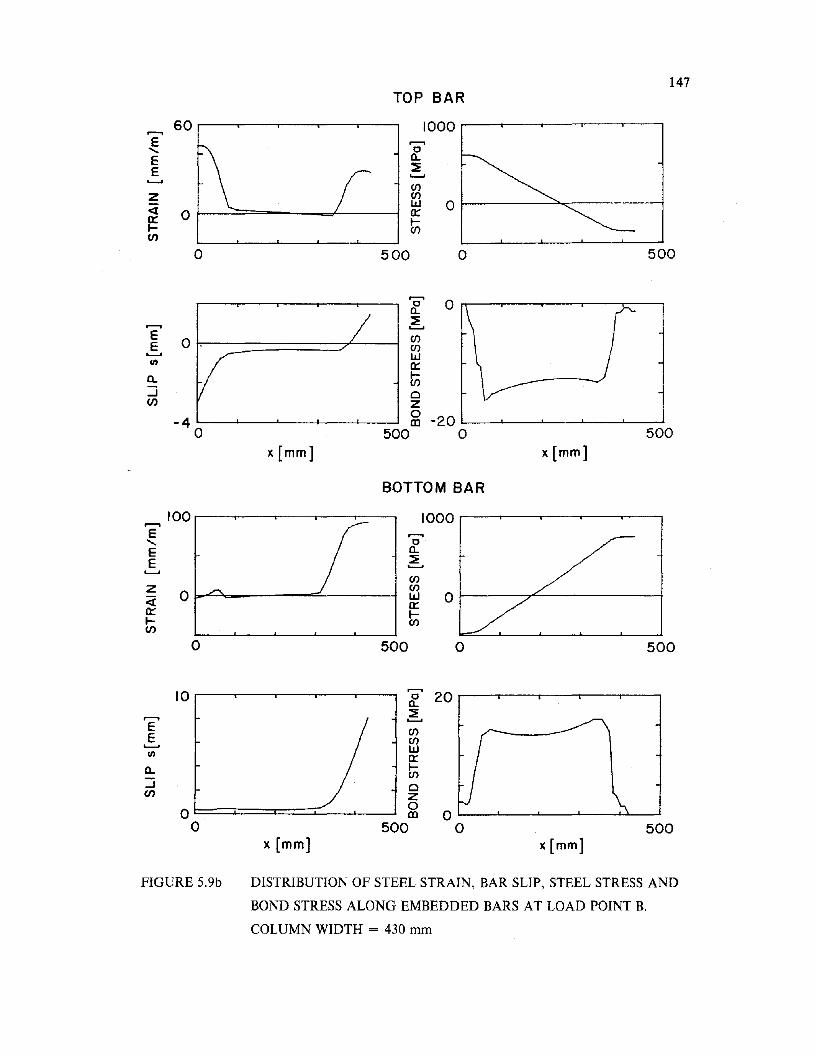
147TOP BAR
60 1000.......~
.......c
E Cl..
E ::E.......
(f)
Z (f)
<i w 00 a::a:: ~
~ (f)(f)
0 500 0 500
.......0c
/Cl..
....... ::E.......E
O. (f)E (f).......
Vw
I/) a::£l. til...J CU) Z
0 -20-4 CDa 500 0 500x[mm] x[mm]
BOTTOM BAR
100 1000.......
rE ............... cE £l.
E ::E..............(f)
z0 /"\,
(f)
<i w 0a::a:: ~~ (f)en
0 500 0 500
10 0' 20£l........ ::E.......E (f)E (f)....... wI/) a::
£l. ~(f)
::i c(J) z
00CD 0
0 500 0 500x [mm] x[mm]
FIGURE 5.9b DISTRIBUTION OF STEEL STRAIN, BAR SLIP, STEEL STRESS AND
BOND STRESS ALONG EMBEDDED BARS AT LOAD POINT B.
COLUMN WIDTH = 430 mm
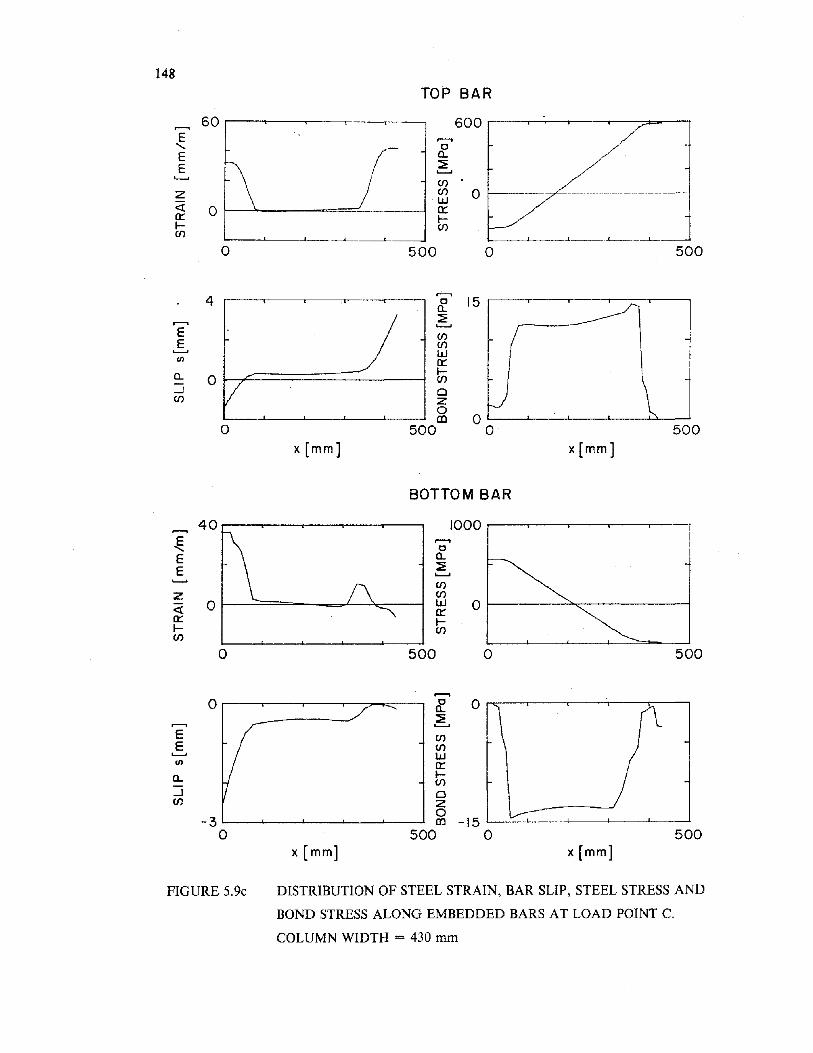
148TOP BAR
60 600.........E ,......,
/" r cE a..E f\
~I ........
(f)
z (f) 0•__wo____._.____
« w0 -_._- 0:::
0::: r-r- (f)(f) ._J...--...L-___...1--__ -.---l.-
0 500 0 500
4,......,
15ca..
,......, ~
E........(f)
E (f)........ WIII 0::
a.. 0 ~::J V 0(f) z
0co 0
0 500 0 500x [mm] x[mm]
BOTTOM BAR
40 1000
~,......,c
E a..E ~
........(f)
z (f)
« 0 w 00:::0::: r-r- (f)(f)
0 500 0 500
,......,0 c 0a..
~........E (f)E (f)........ WIII 0:::a.. r-
(f)
..J 0(/) z
-3000 -15
0 500 0 500x [mm] x[mm]
FIGURE 5.9c DISTRIBUTION OF STEEL STRAIN, BAR SLIP, STEEL STRESS AND
BOND STRESS ALONG EMBEDDED BARS AT LOAD POINT C.
COLUMN WIDTH = 430 mm
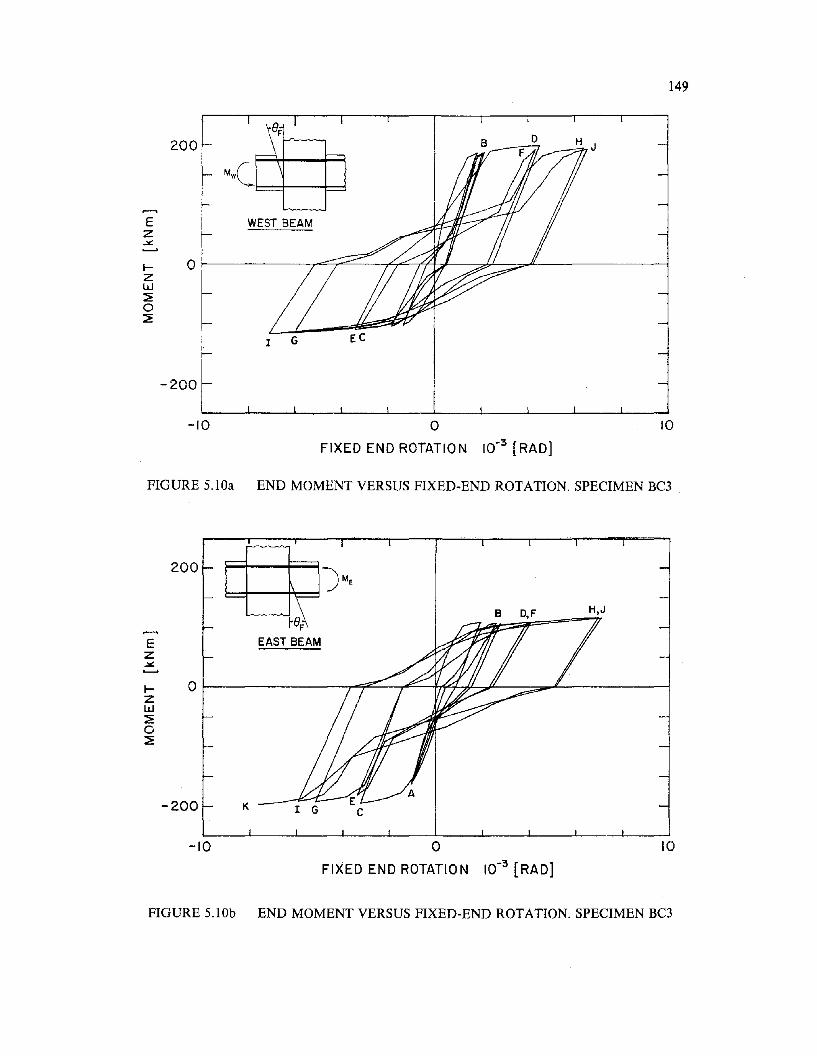
149
H J
I G
~ 0f-------~7_"::::....--~~"A_:~-7f,J_____:~'-------_i
ZW~o~
E WEST BEAMz~
200
-200
-10 oFIXED END ROTATION 10-3 [RAD]
10
FIGURE 5.10a END MOMENT VERSUS FIXED-END ROTATION. SPECIMEN BC3
B D,F H,J
I GK
200
-200
E EAST BEAMZ~
'--'
~ Of------------,r-=7'=-----,.t::---fr¥i--#-7P------::::;;;;II""'"IL-----_iZW~o~
-10 oFIXED END ROTATION 10-3 [RAD]
10
FIGURE 5.10b END MOMENT VERSUS FIXED-END ROTATION. SPECIMEN BC3
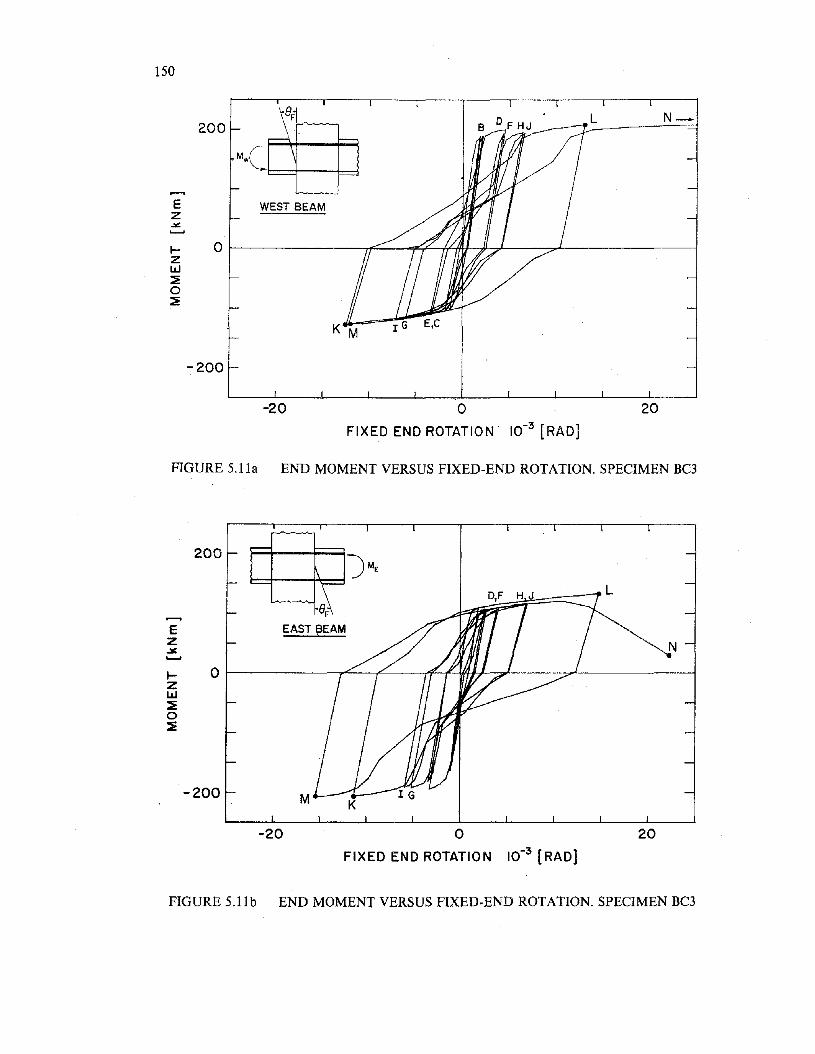
N-
150
200 \~ L
~@E WEST BEAMZ.¥:'--'
~ 0ZW~0~
K M
-200
-20 0 20
FIXED END ROTATION· 10-3 [RAD]
FIGURE 5.11a END MOMENT VERSUS FIXED-END ROTATION. SPECIMEN BC3
M-200
200 )ME
~~E EAST f3EAMZ N.¥:'--'
~ 0ZW::;E0::;E
-20 oFIXED END ROTATION 10-3 [RAD]
20
FIGURE 5.l1b END MOMENT VERSUS FIXED-END ROTATION. SPECIMEN BC3
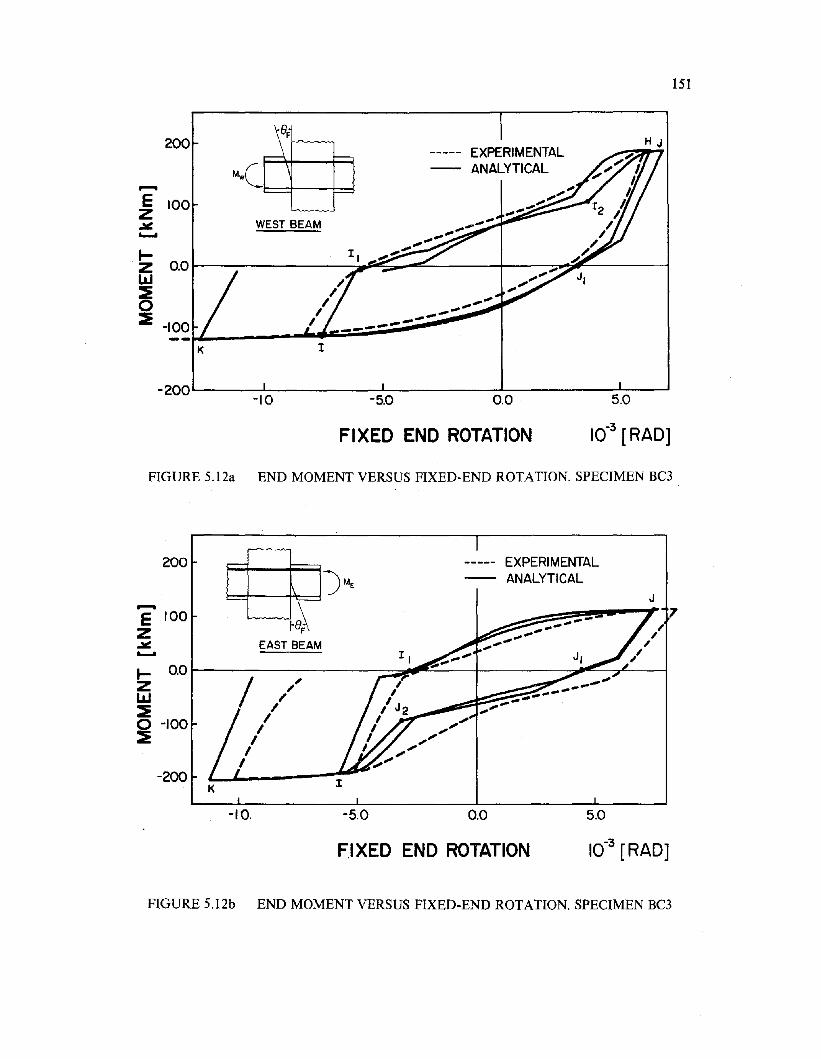
151
200
---E 100Z.:Je......t-
0.0ZL&.J~0::E
K
-200
WEST BEAM
I
-10 -5.0
EXPERIMENTALANALYTICAL
0.0 5.0
FIXED END ROTATION
FIGURE 5.12a END MOMENT VERSUS FIXED-END ROTATION. SPECIMEN BC3
J
----- EXPERIMENTALANALYTICAL
:I
'---"-~r~EAST BEAM
K-200
200
t- 0.0 t-----------:::::::;;;;;;;~IIIt..::....-_+---_____:::;~=---_r_-_i
~ J' /~~~ Io -100 I~ /
II
---E 100Z.:Je......
-10. -5.0 0.0 5.0
FIXED END ROTATION
FIGURE 5.12b END MOMENT VERSUS FIXED-END ROTATION. SPECIMEN BC3
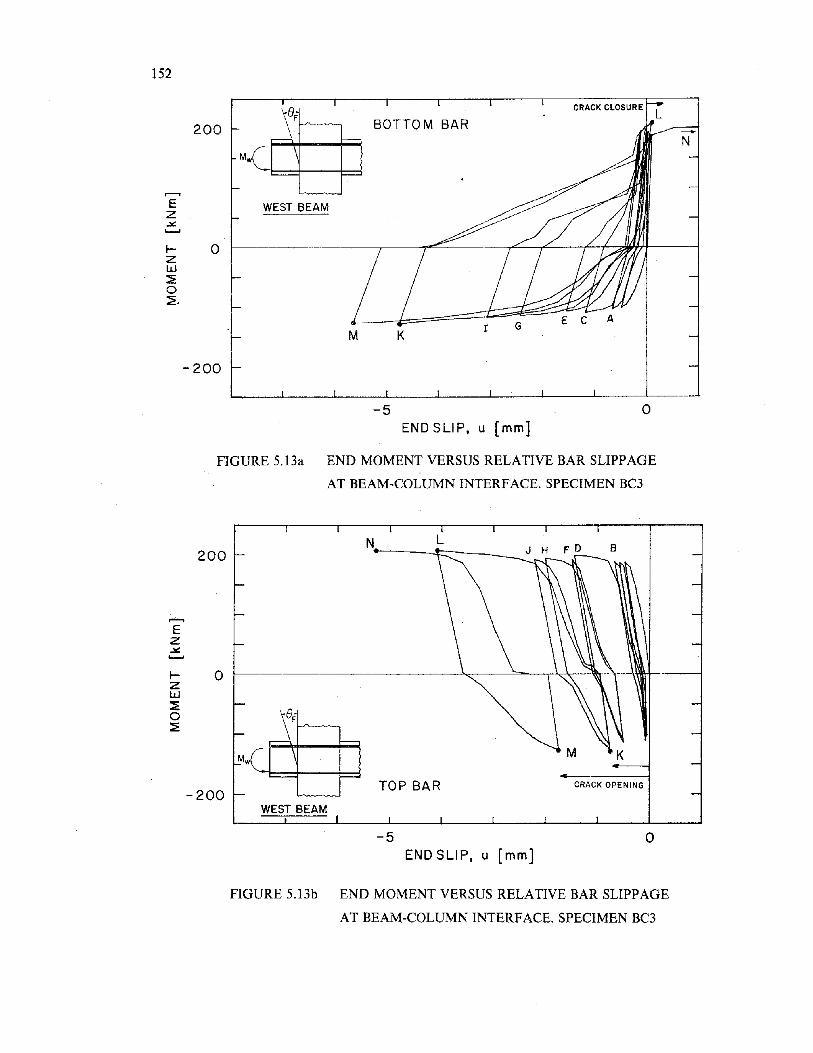
152
200 \~ BOTTOM BAR..c@ N
~
E WEST BEAMZ..:.c:........I- 0Zw:20:2.
M K
-200
-5 0ENDSLIP. u [mm]
FIGURE 5.13a END MOMENT VERSUS RELATIVE BAR SLIPPAGE
AT BEAM-COLUMN INTERFACE. SPECIMEN BC3
N L200
I- 0Zw:2o:2
-200WEST BEAM
TOP BAR CRACK OPENING
-5ENDSLIP. u [mm]
o
FIGURE 5.13b END MOMENT VERSUS RELATIVE BAR SLIPPAGE
AT BEAM-COLUMN INTERFACE. SPECIMEN BC3
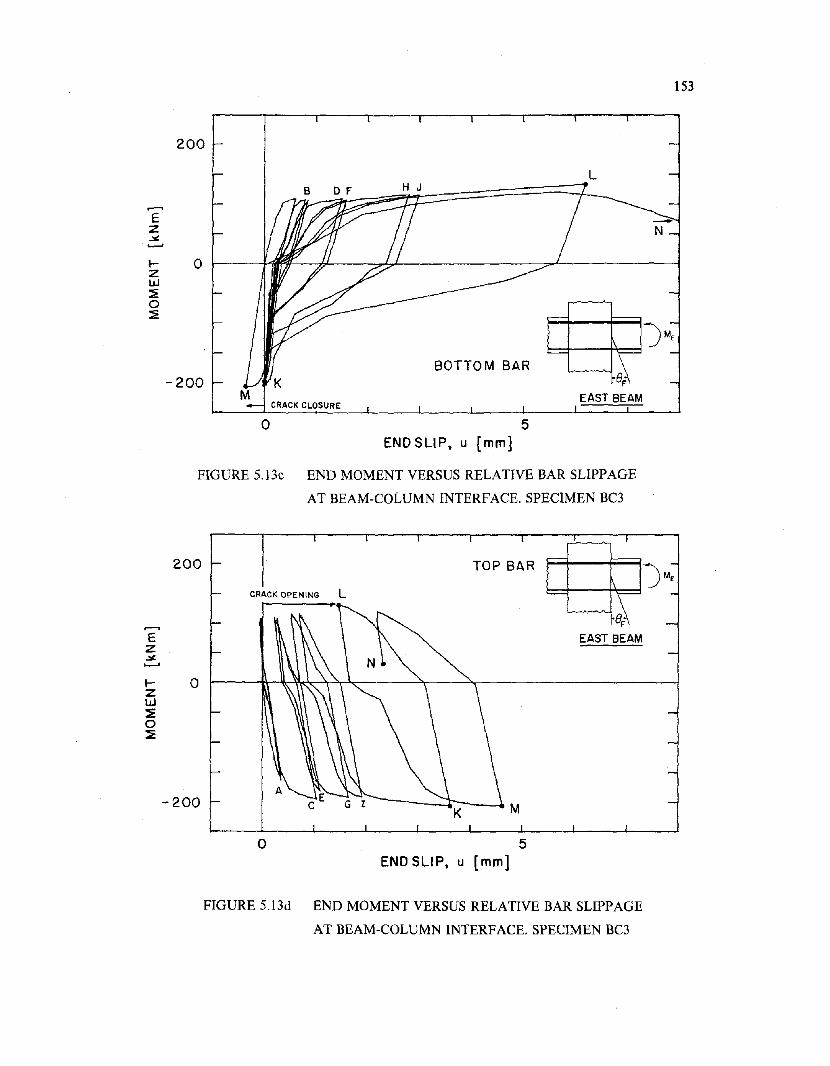
200
153
L
,.......,Ez.::t:~
I-ZlJJ~o~
o
-200
oCRACK CLOSURE
H J
BOTTOM BAR
5
e.--.---~r~EAST BEAM
-N
END SLIP, u [mm]
FIGURE 5.13c END MOMENT VERSUS RELATIVE BAR SLIPPAGE
AT BEAM-COLUMN INTERFACE. SPECIMEN BC3
200
I-- 0zw~o~
-200
CRACK OPENING L
o
TOP BAR
M
5END SLIP, u [mm]
~~r~EAST BEAM
FIGURE 5.13d END MOMENT VERSUS RELATIVE BAR SLIPPAGE
AT BEAM-COLUMN INTERFACE. SPECIMEN BC3
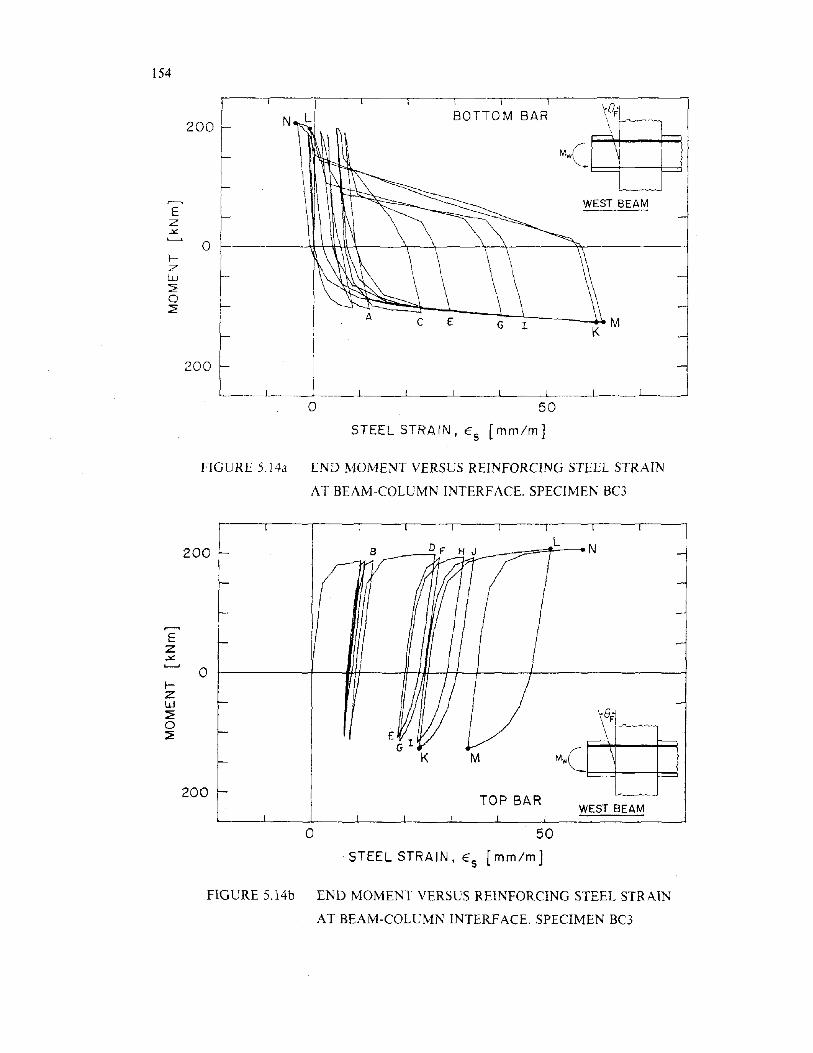
154
K M
WEST BEAM
BOTTOM BAR
200 ~
I
EI
z I-'s:
0 Il- I
Z Iw I~0~ ~
200
o 50
STEEL STRAIN, E s [mm/m]
FIGURE 5.14a END MOMENT VERSUS REINFORCING STEEL STRAIN
AT BEAM-COLUMN INTERFACE. SPECIMEN BC3
WEST BEAM
L___-::::==f-- N
TOP BAR
MK
200
o
200
I;Zw~o~
E;z.¥..........
o 50
STEEL STRAIN, Es [mm/m]
FIGURE 5.14b END MOMENT VERSUS REINFORCING STEEL STRAIN
AT BEAM-COLUMN INTERFACE. SPECIMEN BC3
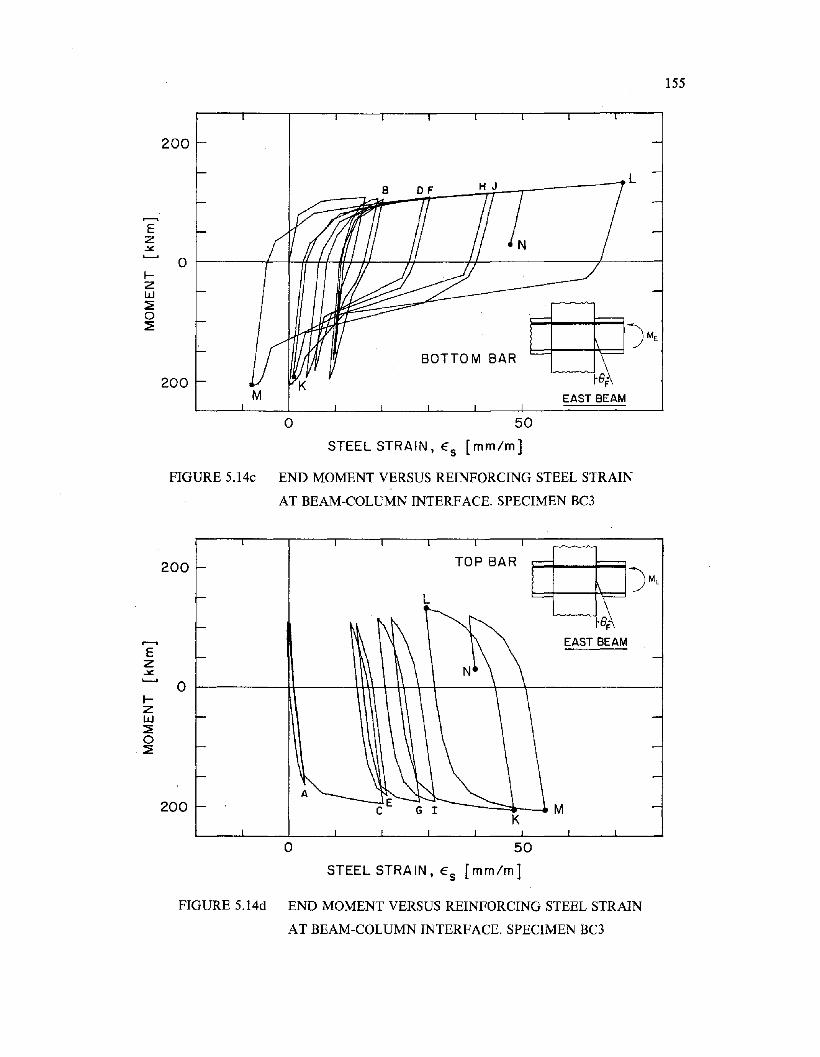
155
200
BOTTOM BAR~r~
M EAST BEAM
Of-----+-f-H----H-*f--+.I---H-----H------------;f------j
200
Ez..¥:
Izw~o~
o 50
STEEL STRAIN, Es [mm/m]
FIGURE 5.14c END MOMENT VERSUS REINFORCING STEEL STRAIN
AT BEAM-COLUMN INTERFACE. SPECIMEN BC3
,...-,
Ez..¥:~
Izw~o~
200
o
200A
L
TOP BAR
..............~r~EAST BEAM
--~-"'MK
o 50
STEEL STRAIN, Es [mm/m]
FIGURE 5.14d END MOMENT VERSUS REINFORCING STEEL STRAIN
AT BEAM-COLUMN INTERFACE. SPECIMEN BC3
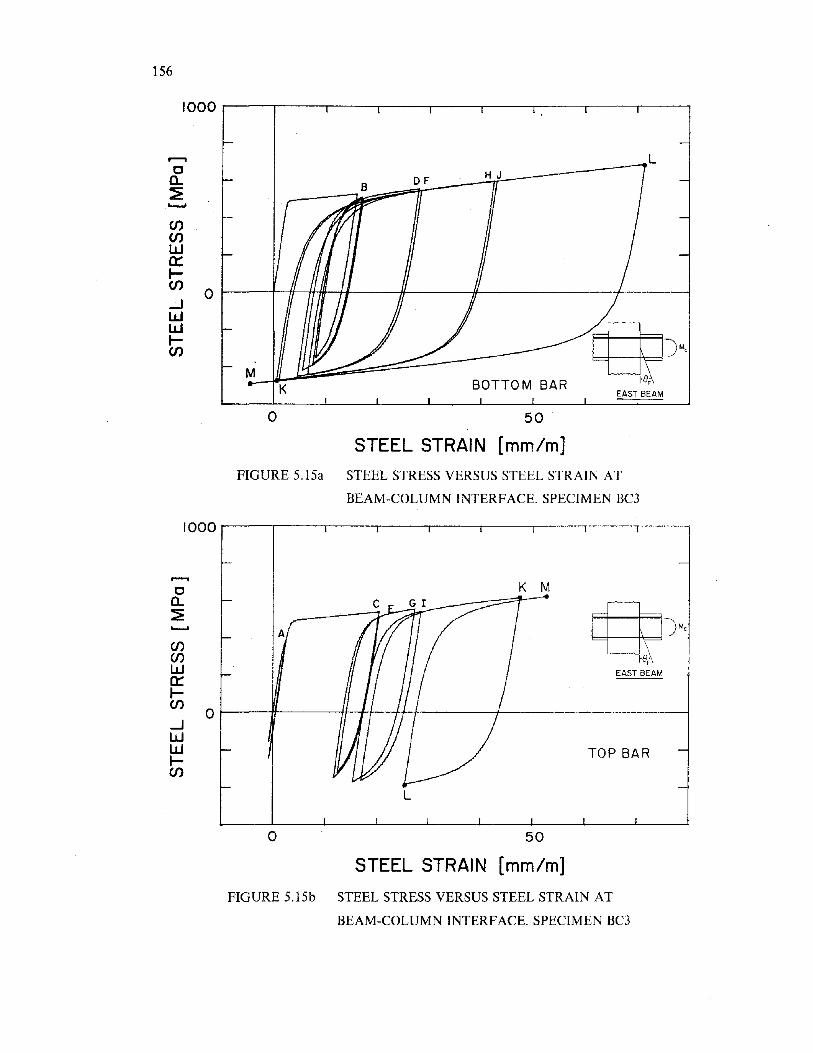
156
I000 r----,---.---~--_r_--..___-____.--_.__-__,r__-__,
........0a.~~
(f)(f)wa::~(f)
0..JWW~(f)
MK
0
L
BOTTOM BAREAST BEAM
50
STEEL STRAIN [mm/m]
FIGURE 5.15a STEEL STRESS VERSUS STEEL STRAIN AT
BEAM-COLUMN INTERFACE. SPECIMEN BC3
1000 r----,---.---~--_r_--.____-____r--_._--r_-__;
K M.......0a.~.......(f)(f)wa::~(f)
0..JWW~(f)
L
TOP BAR
o 50
STEEL STRAIN [mm/m]
FIGURE 5.15b STEEL STRESS VERSUS STEEL STRAIN AT
BEAM-COLUMN INTERFACE. SPECIMEN BC3
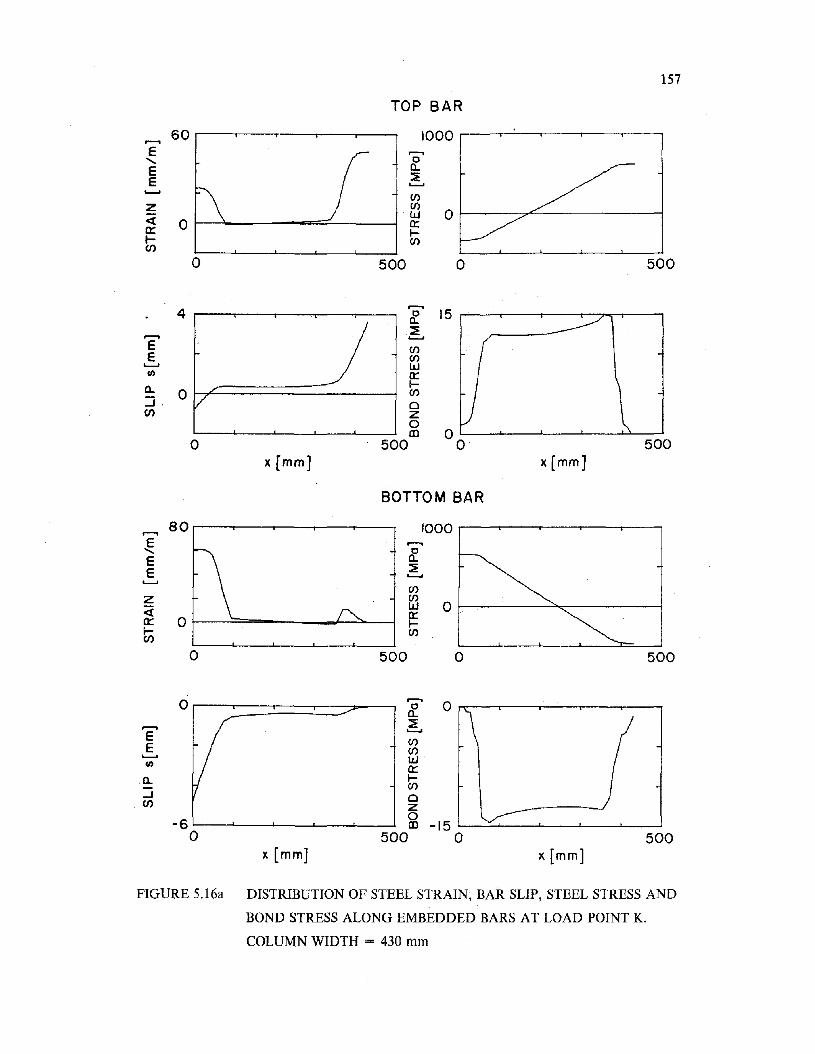
157
TOP BAR
60 1000,......,E ,......,"- cE a..E ~........
V)
Z V)
0« w0 a::a:: f-t- V)
V)
0 500 0 500
4,......,
15ca..~,......, ........
E V)E V)........ wI/) a::a. J'
f-a V)
:J. Y aC/) z
0m 0
0 500 0 500x[mm] x[mm]
BOTTOM BAR
80 1000,......,E ,......,"- cE a.E ~................
V)
z V)
0« wa::a:: 0 f-.... V)
V)
0 500 0 500
0,......,
0C./ a.,......,
V~
E........V)
E V)........ wI/) a::.a. f-
V)...J aV) z
-60m -15
0 500 0 500x [mm] x [mm]
FIGURE 5.16a DISTRIBUTION OF STEEL STRAIN, BAR SLIP, STEEL STRESS AND
BOND STRESS ALONG EMBEDDED BARS AT LOAD POINT K.
COLUMN WIDTH = 430 mm
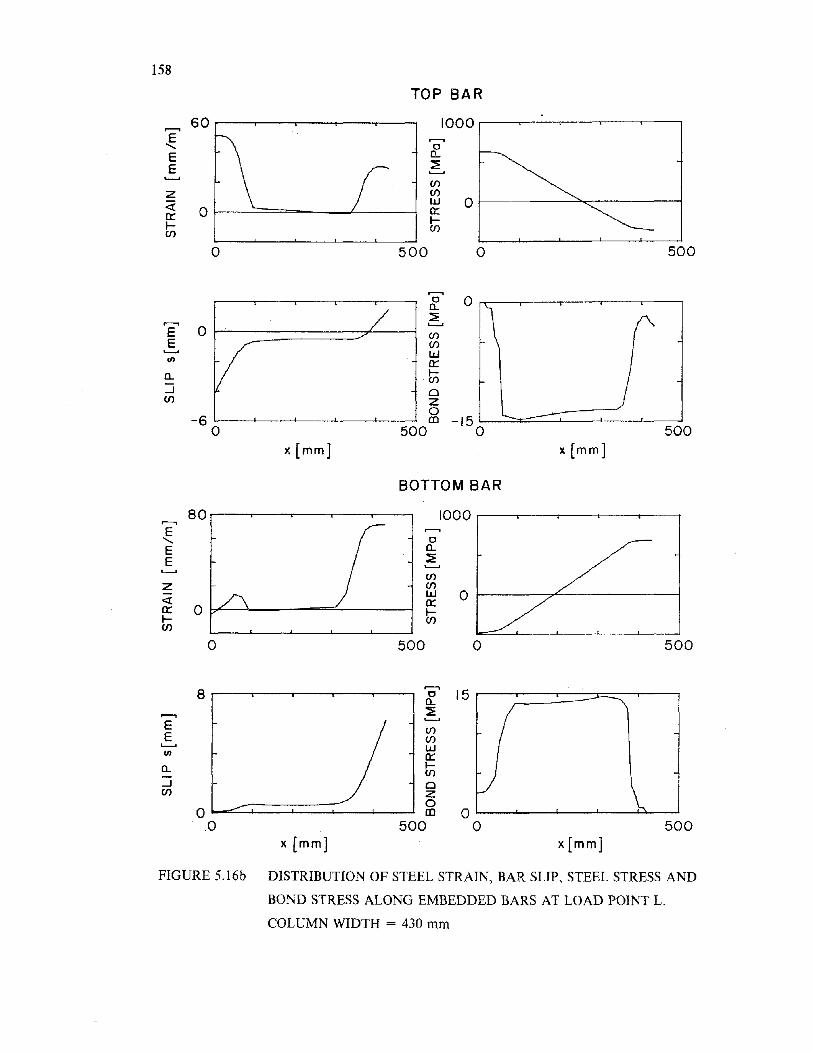
158
TOP BAR
Of------.....:::...:::---------j
1000 ...---...---....----.----.-----,
(f)(f)W0::I(f)
Ol---==~--J.---_j
z<!0::I(f)
60 ,..---...---....----.----.---,..........E
........EE
o 500 o 500
a..:J(f)
..........f1.. 0....----.-----.----.-----,.-__~L.....o
(f)(f)W0::
t1ozo-6 L..-_...L--_-L-_-'-_---L_-"' CD -15 L--=::::=:::::::..-L-_-'-_---L_---...l
o 500 0 500x [mm] x [mm]
BOTTOM BAR
1000 .....--...----.----.----.----,
oa..~
(f)(f)W 01------,7"'----------"1ct:I(f)
80 ,-----.-----.----..-----,.---,
z«ct: O~-~--~~:...--------jI(f)
..........E
........EE
o 500 o 500
500x [mm]x [mm]
(f)(f)W0::
t1oz
oL-:::::::::::::;:=:==:::i::::=:;:::---l-_..J~ OL..--..L..---I---'-----'--"---'o 500 0
8,..---...--....----.----.-----,
a......J(f)
EE
L.....o
III
FIGURE 5.16b DISTRIBUTION OF STEEL STRAIN, BAR SLIP, STEEL STRESS AND
BOND STRESS ALONG EMBEDDED BARS AT LOAD POINT L.
COLUMN WIDTH = 430 mm
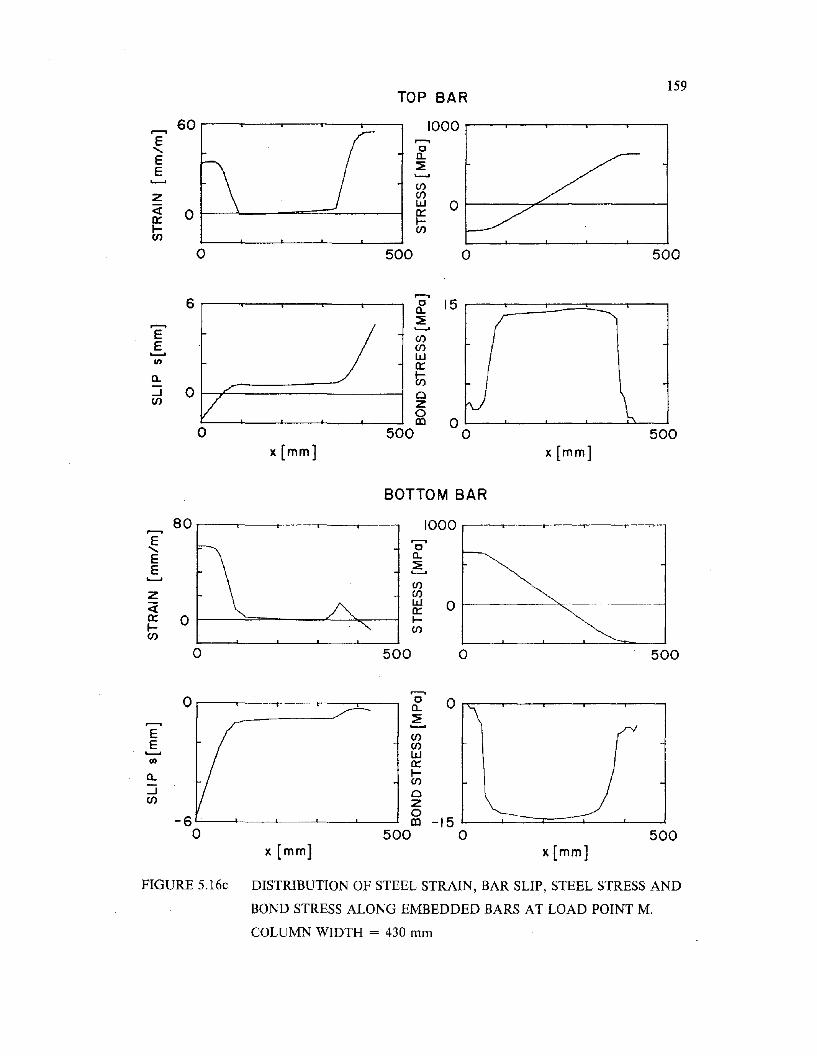
159TOP BAR
60 1000.--.E .--.
....... cE a..
~E ........'--' C/)
z C/)
<i w 00 0:::
0::: l-I- C/)C/)
0 500 0 500
6.--.c 15a..~.--. ........
E C/)E C/)
'--' wCIl 0:::a.. ti::J 0 ./
VCl
C/) Z0III 0
0 500 0 500x [mm] x [mm]
BOTTOM BAR
80 1000.--.E .......,
....... cE a..
~E '--''--'
C/)
z C/)
<i w 00:::0::: 0 l-I- C/)(J)
0 500 0 500
.......,0 c 0a..
::?:........E C/)E C/)
'--' wCIl 0:::a.. I-
C/)
::J ClC/) z
-60III -15
0 500 0 500x [mm] x[mm]
FIGURE 5.16c DISTRIBUTION OF STEEL STRAIN, BAR SLIP, STEEL STRESS AND
BOND STRESS ALONG EMBEDDED BARS AT LOAD POINT M.
COLUMN WIDTH = 430 mm
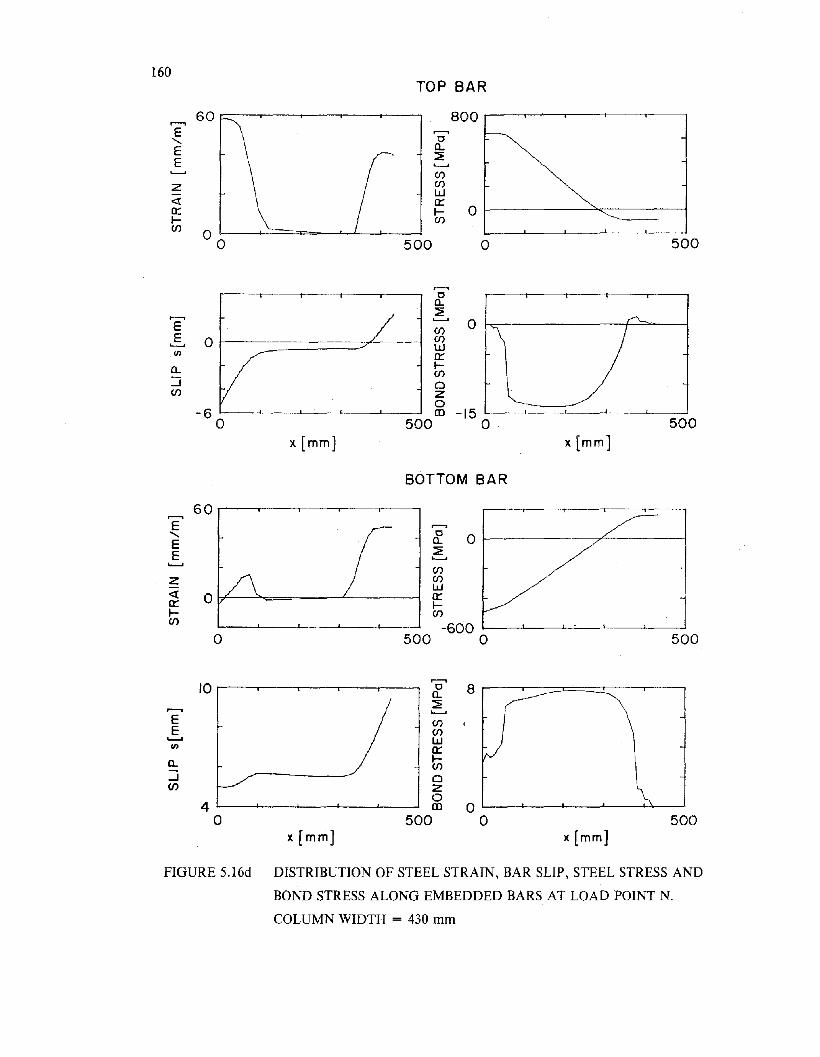
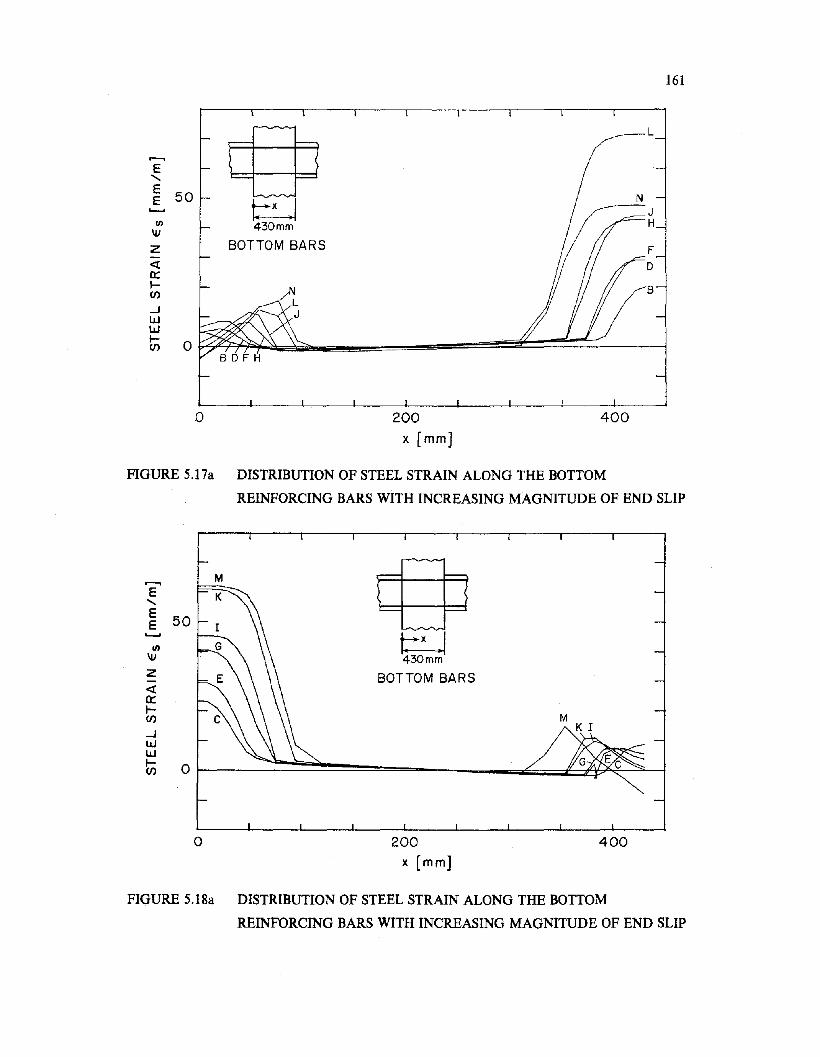
161
@L
.--.E
.......E 50E
~"--'
VI 430mm\iJ
Z BOTTOM BARS F« Da:::l- sen-.JI.rJI.rJI- 0en
SDFH
o 200x [mm]
400
FIGURE 5.17a DISTRIBUTION OF STEEL STRAIN ALONG THE BOTTOM
REINFORCING BARS wiTH INCREASING MAGNITUDE OF END SLIP
.--. @E.......E
50E"--'
~VI\iJ 430mmZ BOTTOM BARS-«a:::-ן
Men-.JI.rJI.rJI- 0en
o 200x [mm]
400
FIGURE 5.18a DISTRIBUTION OF STEEL STRAIN ALONG THE aOTTOM
REINFORCING BARS WITH INCREASING MAGNITUDE OF END SLIP
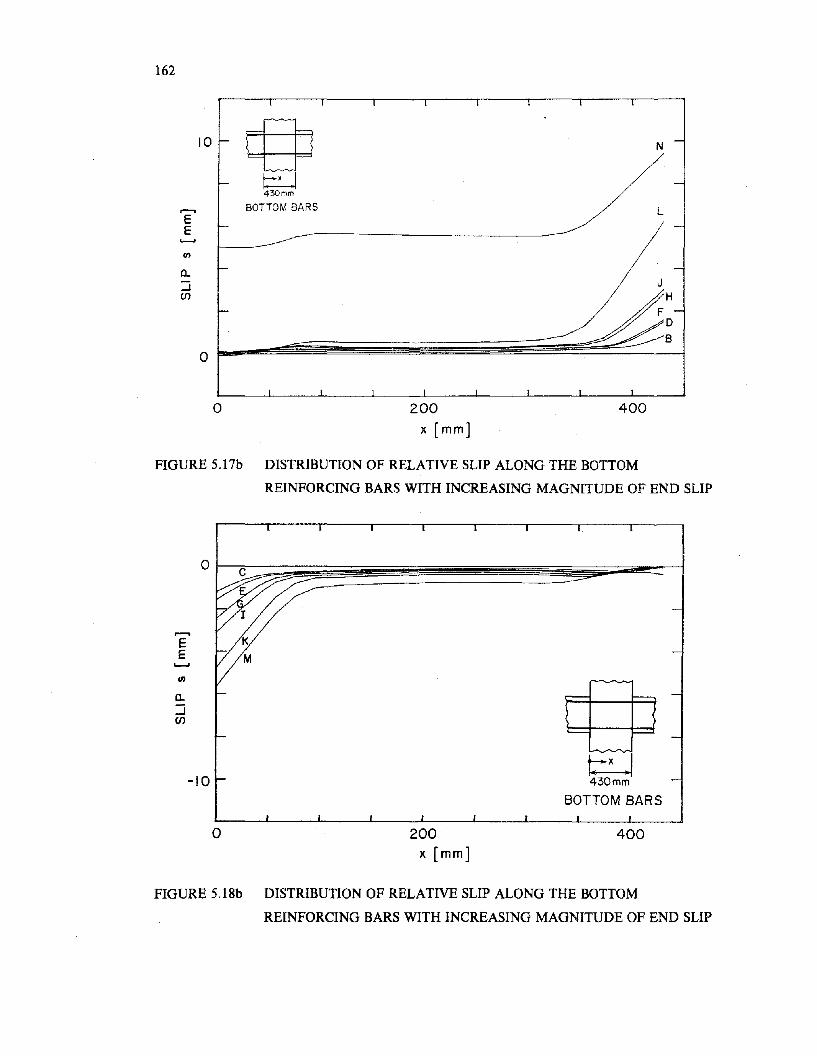
162
EE........111
10 @t:::J430mm
BOTTOM BARS
N
L
0::J(J)
o 200x [mm]
400
FIGURE 5.l7b DISTRIBUTION OF RELATIVE SLIP ALONG THE BOTTOM
REINFORCING BARS WITH INCREASING MAGNITUDE OF END SLIP
EE........111
a.:J(J)
-10
o 200x [mm]
~430mm
BOTTOM BARS
400
FIGURE 5.18b DISTRIBUTION OF RELATIVE SLIP ALONG THE BOTTOM
REINFORCING BARS WITH INCREASING MAGNITUDE OF END SLIP
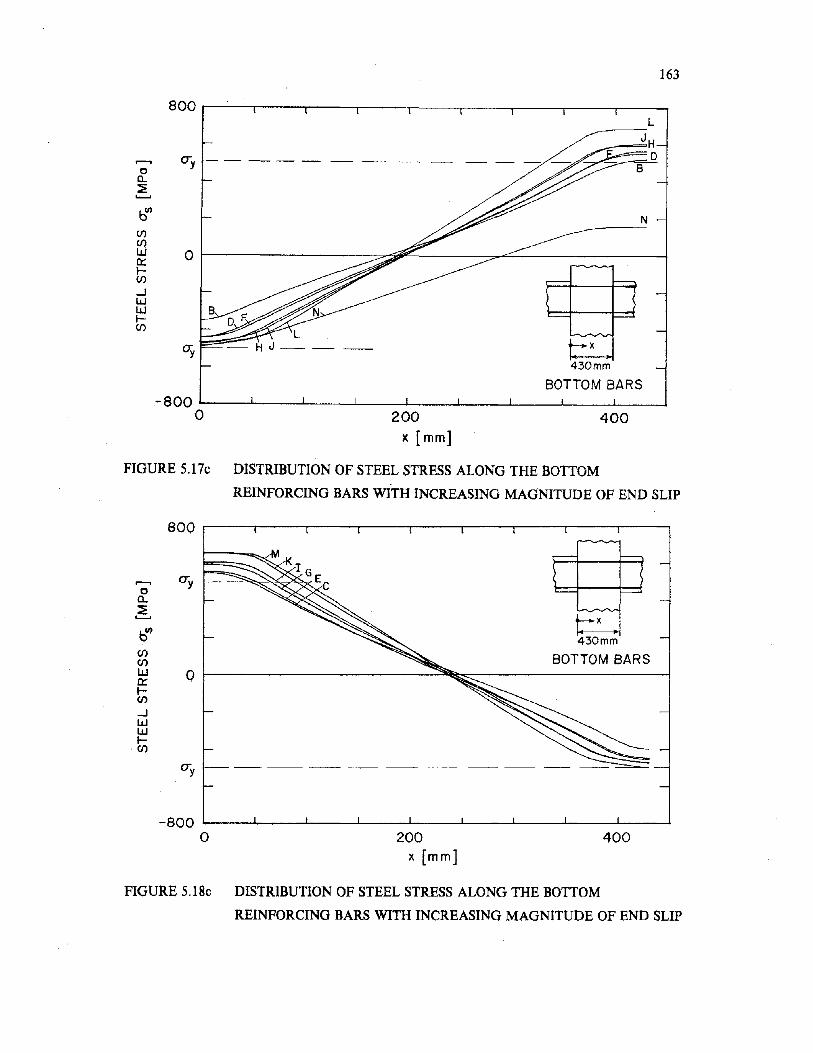
163
800 r------r----,.---T-'----..----,---.....------.---....-----,
N
L----~_~JH~-D
~
@~430mm
BOTTOM BARS
Ol-----------."..-~~---~=:::::..-------____I
CTy - - --. - -. - - -.-
billCI)CI)wa::ICI)
-JWWICI)
400- 800 L------'---~-_ _I_.__---I.__--!-__-!.-_---'~_---L.___l
o 200x [mm]
FIGURE 5.17c DISTRIBUTION OF STEEL STRESS ALONG THE BOTTOM
REINFORCING BARS WITH INCREASING MAGNITUDE OF END SLIP
CTy ---------- -- ---- ----
800
@,......,0a..~'--'
~bill430mm
CI)BOTTOM BARSCI)
w 0a::I-CI)
-JWWI-
.CI)
400200x [mm]
-800 L-----l,_--l--_ _I_.__---I.__--!-__-!.-__'--_---'-__......
o
FIGURE 5.18c DISTRIBUTION OF STEEL STRESS ALONG THE BOTTOM
REINFORCING BARS WITH INCREASING MAGNITUDE OF END SLIP
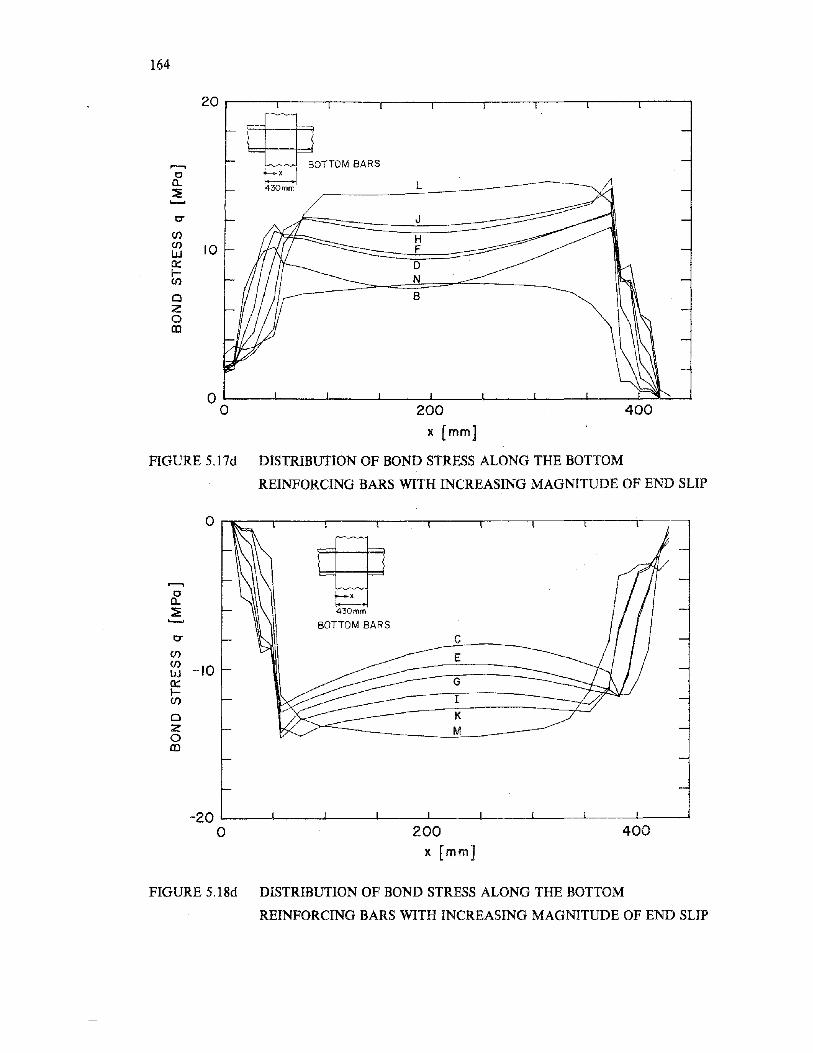
164
20 ,----r--...,.---,-----r---,---...--------.---,-------,
400
L
J
HF
8
oN
o L-_--l.__--I-__-I-__-I--__.l.--__--l.__--I-__----I--3-~
o
10
0
enenwa::I(I)
Q
Zom
,......,oa..~
200
x (mm]
FIGURE 5.l7d DISTRIBUTION OF BOND STRESS ALONG THE BOTTOM
REINFORCING BARS WITH INCREASING MAGNITUDE OF END SLIP
0
,......, @0 t:.'-Ja..~ 430mm........
BOTTOM BARS0- C
en Een -10wa:: Gl-
IenQ KZ M0CD
400200x (mm]
-20 L...-_-l-__....l-.._----l__-L.__..L--_---L__-i-__L.-_-..:
o
FIGURE 5.18d DISTRIBUTION OF BOND STRESS ALONG THE BOTTOM
REINFORCING BARS WITH INCREASING MAGNITUDE OF END SLIP
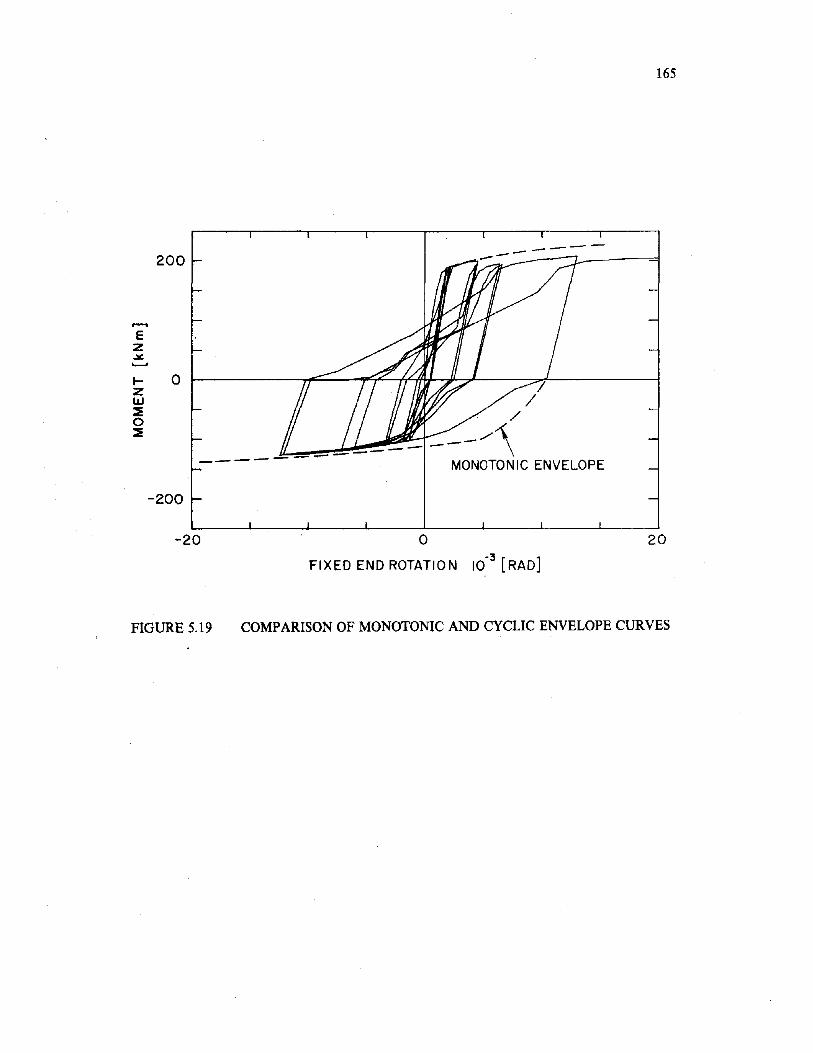
165
----
"I/
/
-/\----- -------~----- MONOTONIC ENVELOPE
200
.......Ez.¥......~ 0ZI.LJ~0~
-200
-20 ofiXED END ROTATION 10-
3[RAD]
20
FIGURE 5.19 COMPARISON OF MONOTONIC AND CYCLIC ENVELOPE CURVES
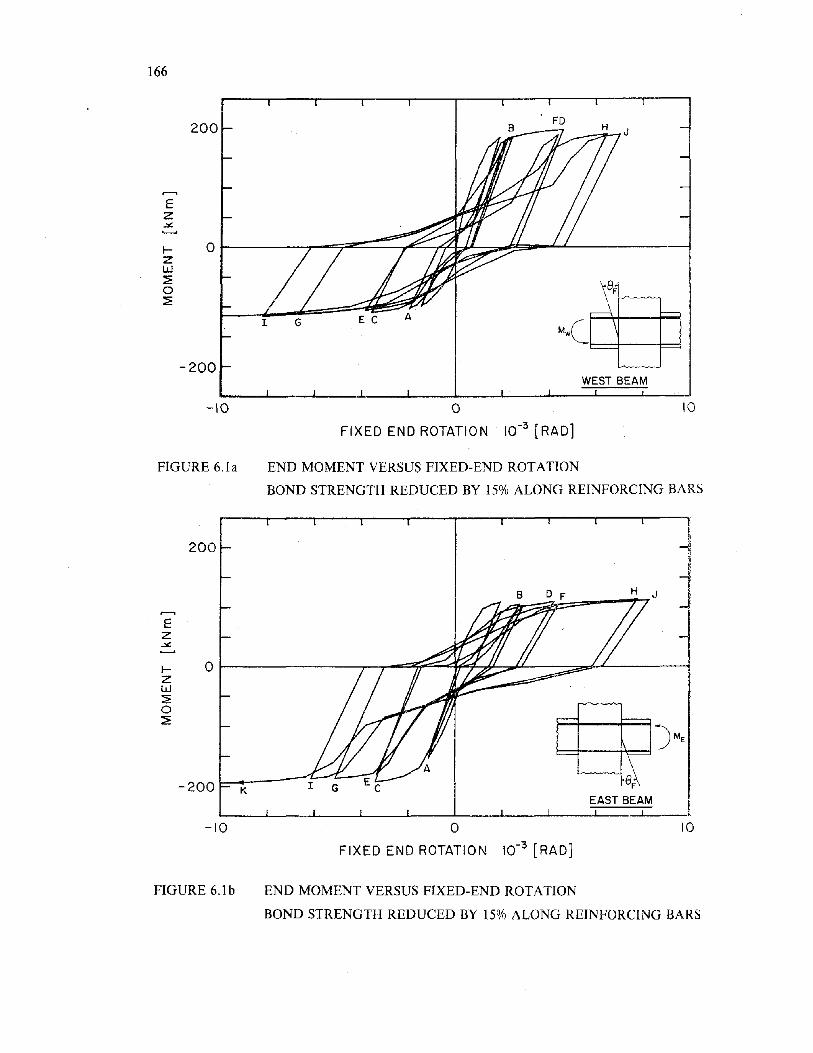
166
-200WEST BEAM
-\0 oFIXED END ROTATION 10-3 [RAD]
\0
FIGURE 6.1a END MOMENT VERSUS FIXED-END ROTATION
BOND STRENGTH REDUCED BY 15% ALONG REINFORCING BARS
200
IZW~o~
-200 K
-10
G
oFIXED END ROTATION 10-3 [RAD]
~~r~EAST BEAM
10
FIGURE 6.1b END MOMENT VERSUS FIXED-END ROTATION
BOND STRENGTH REDUCED BY 15% ALONG REINFORCING BARS
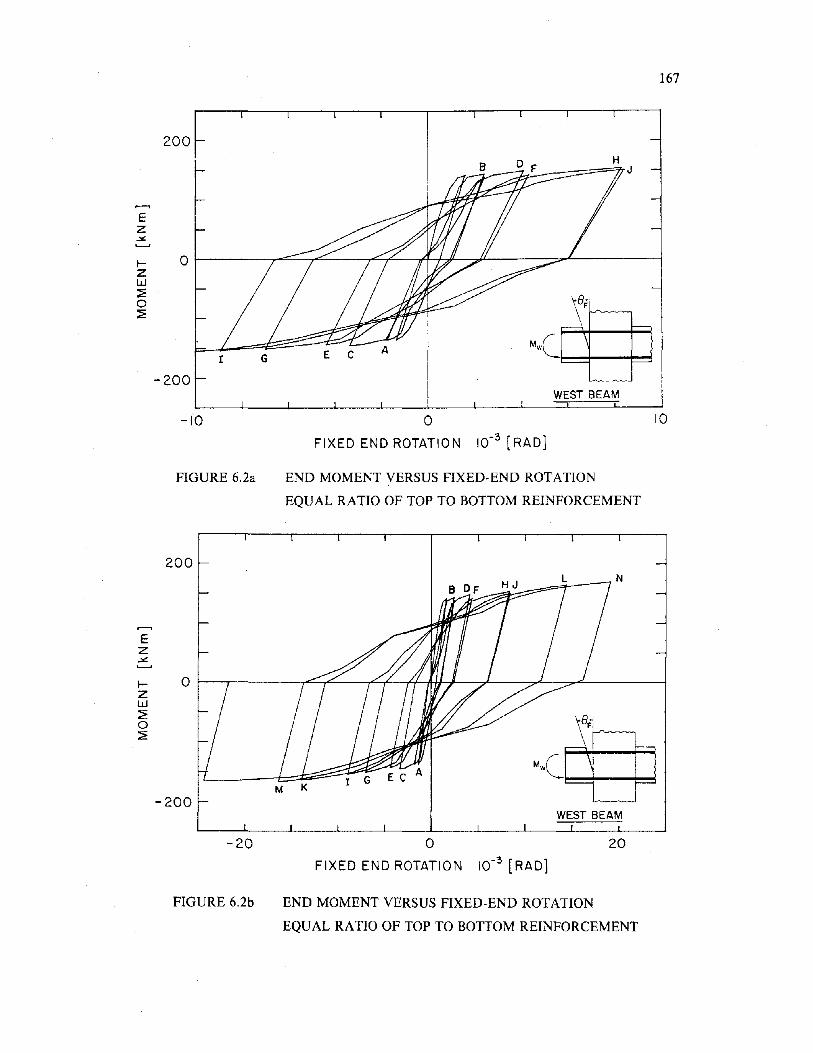
167
200H
J
Ez~
0f-ZW~
\~0~ M.C@r G
-200WEST BEAM
-fo 0 10
FIXED END ROTATION 10-3 [RAD]
FIGURE 6.2a END MOMENT VERSUS FIXED-END ROTATION
EQUAL RATIO OF TOP TO BOTTOM REINFORCEMENT
200N
Ez~
f- Or--,------r"=-,L.--....,..,:=-+--H--M~-_+-_____,~__:~---___l
zw~o~
M K-200
WEST BEAM
-20 oFIXED END ROTATION 10-3 [RAD]
20
FIGURE 6.2b END MOMENT VERSUS FIXED-END ROTATION
EQUAL RATIO OF TOP TO BOTTOM REINFORCEMENT
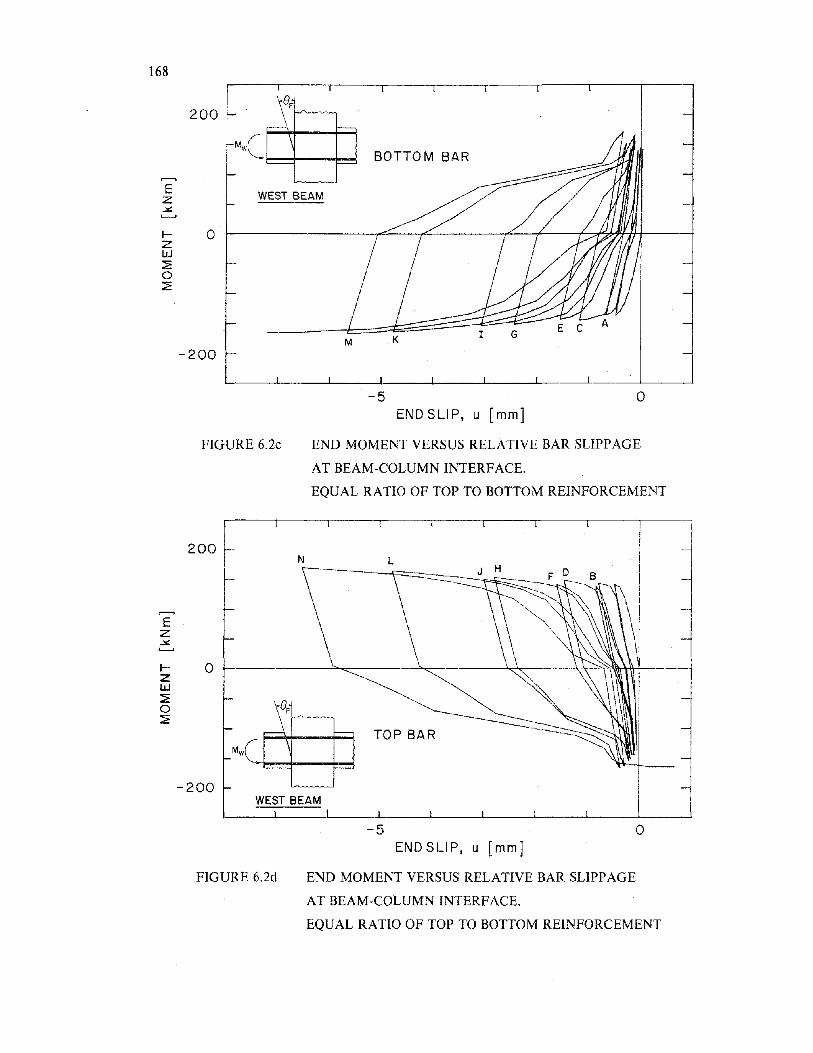
168
M K
200
BOTTOM BAR
WEST BEAM
oIZW~o~
-200
-5 o
FIGURE 6.2c
ENDSLlP, u [mm]
END MOMENT VERSUS RELATIVE BAR SLIPPAGE
AT BEAM-COLUMN INTERFACE.
EQUAL RATIO OF TOP TO BOTTOM REINFORCEMENT
200 ~
Ez.:>!:.'--'
I- 0zw~o~
-200
N LD
WEST BEAM
-5 o
FIGURE 6.2d
END SLIP, u [mm]
END MOMENT VERSUS RELATIVE BAR SLIPPAGE
AT BEAM-COLUMN INTERFACE.
EQUAL RATIO OF TOP TO BOTTOM REINFORCEMENT
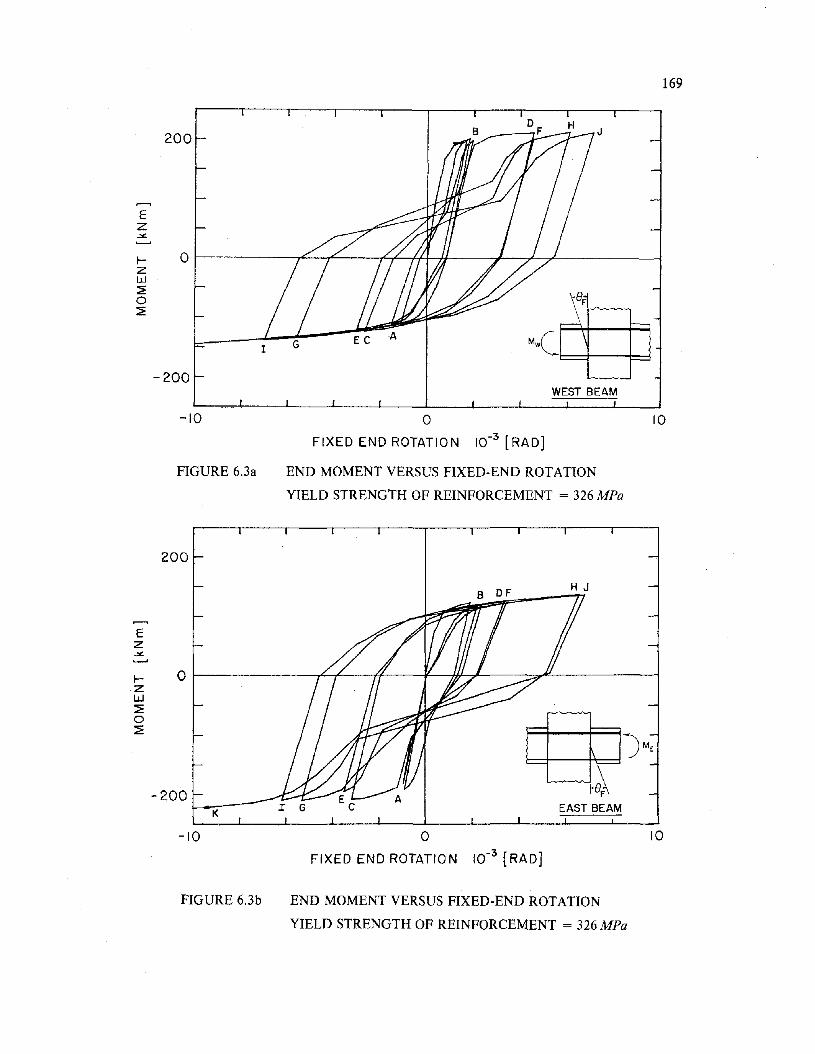
169
J200
-200
I
Ez.::eo
.... 0t--------,.::....--r---..,e.-,.C-.j'+f--H----+-----:"L-~----_____1
ZW~o~
WEST BEAM
-10
FIGURE 6.3a
oFIXED END ROTATION 10-3 [RAD]
END MOMENT VERSUS FIXED-END ROTATION
YIELD STRENGTH OF REINFORCEMENT = 326 MPa
10
200
H J
o 10
FIXED END ROTATION 10-3 [RAD]
'----"-~r~I G EAST BEAMK
-10
OI--------.,L:.-+---If:....-...-¥-------llJ~---=,.M------___i
-200
Ez.::eo'--'
FIGURE 6.3b END MOMENT VERSUS FIXED-END ROTATION
YIELD STRENGTH OF REINFORCEMENT = 326 MPa
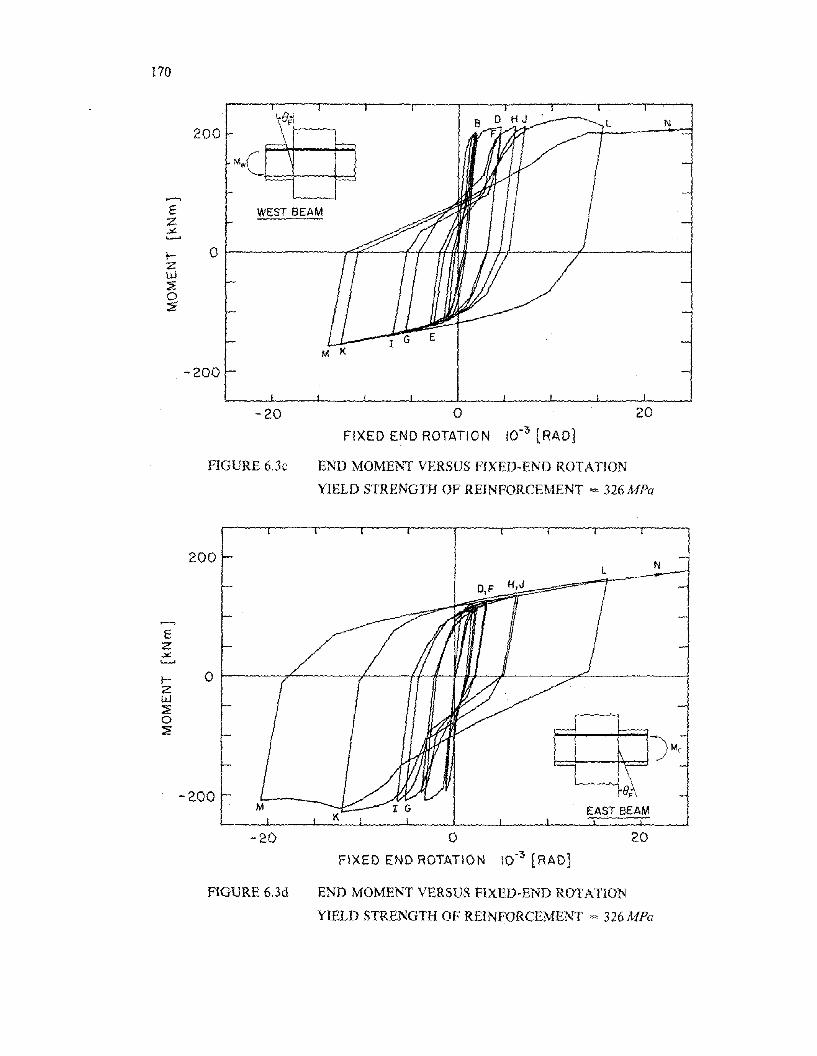
170
200
,.......,E WEST BEAMZ.::'.......t- OZw202
M K
-200
L N
20-20
FIGURE 6.3c
oFIXED END ROTATION 10-5 (RADl
END MOMENT VERSUS FIXED-END ROTATION
YIELD STRENGTH OF REINFORCEMENT = 326 MPa
20
lZW:;Eo~
200
-2.00
-20
FIGURE 6.3d
<...-...---.A....!r~EAST BEAM
oFIXED END ROTATION \0-3 {RAD}
END MOMENT VERSUS FIXED-END ROTATION
YIELD STRENGTH OF REINFORCEMENT = 326 MFa
N
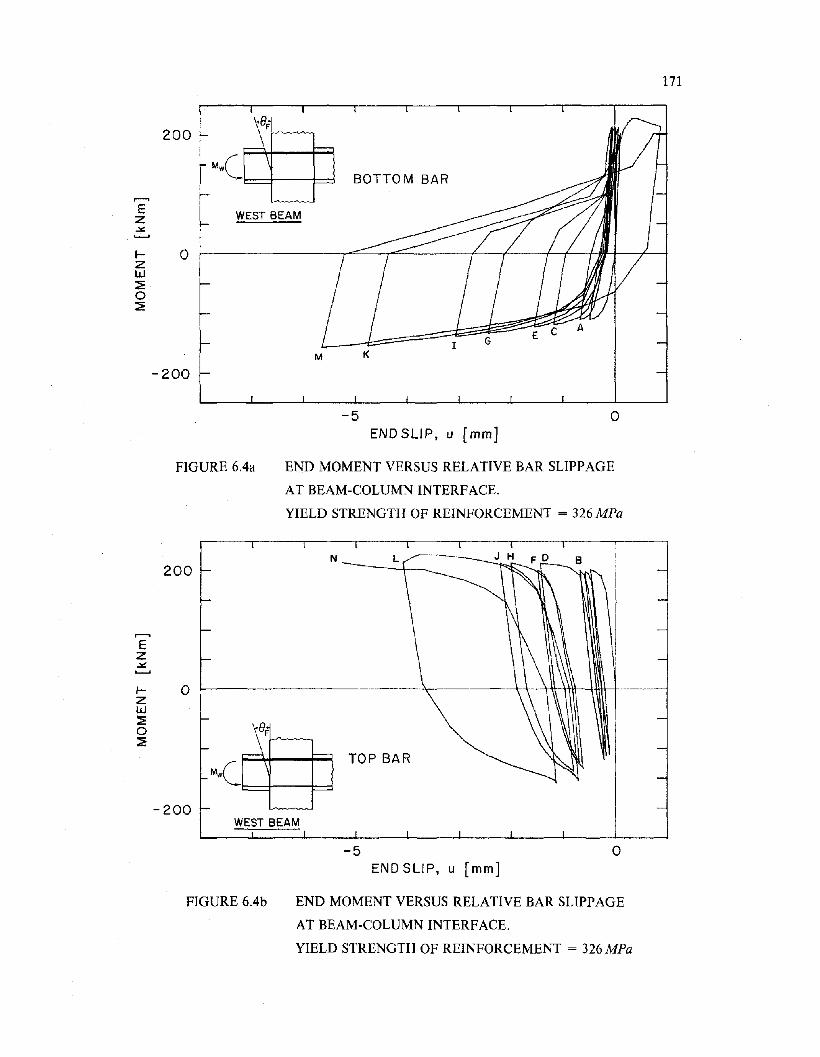
171
200 \~M.c@ BOTTOM BAR,........E WEST BEAMZ~'-'--'
r- 0zw:E0:E
I G
M K
-200
-5 0ENDSLlP, u [mm]
FIGURE 6.4a END MOMENT VERSUS RELATIVE BAR SLIPPAGE
AT BEAM-COLUMN INTERFACE.
YIELD STRENGTH OF REINFORCEMENT = 326 MPa
200
,........Ez~........r- 0zw:Eo:E
-200WEST BEAM
TOP BAR
-5 o
FIGURE 6.4b
ENDSlIP, u [mm]
END MOMENT VERSUS RELATIVE BAR SLIPPAGE
AT BEAM-COLUMN INTERFACE.
YIELD STRENGTH OF REINFORCEMENT = 326 MPa
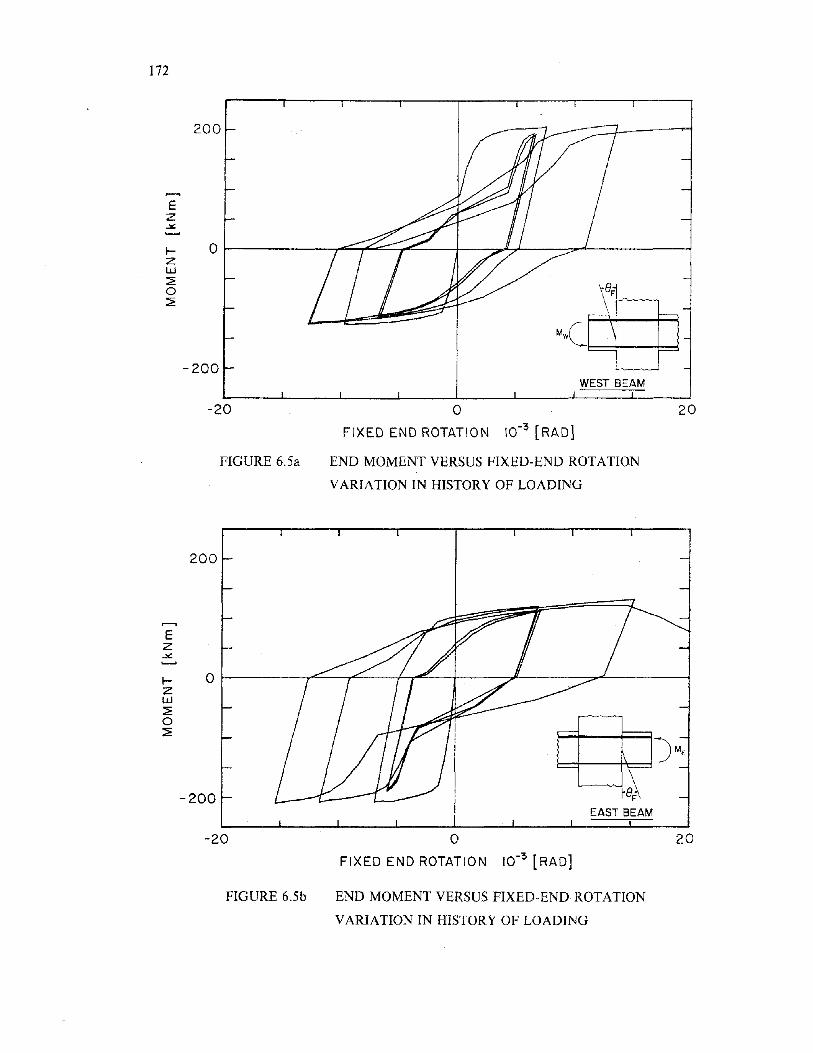
172
200
Ez~
I- Ot-------.,,-:;-.....,...-=:::::.-,..=---+--~~'---___::::'-'-----__f
ZW~o~
-200WEST BEAM
-20
FIGURE 6.5a
oFIXED END ROTATION 10-3 (RAD]
END MOMENT VERSUS FIXED-END ROTATION
VARIATION IN HISTORY OF LOADING
20
2001
L----.----~r~EAST BEAM
-200
Ez~
I- Of-------r''''-----r~--+--.-~-+---~'---__::",........---__f
ZW~o~
-20 oFIXED END ROTATION 10-3 [RAD]
20
FIGURE 6.5b END MOMENT VERSUS FIXED-END ROTATION
VARIATION IN HISTORY OF LOADING
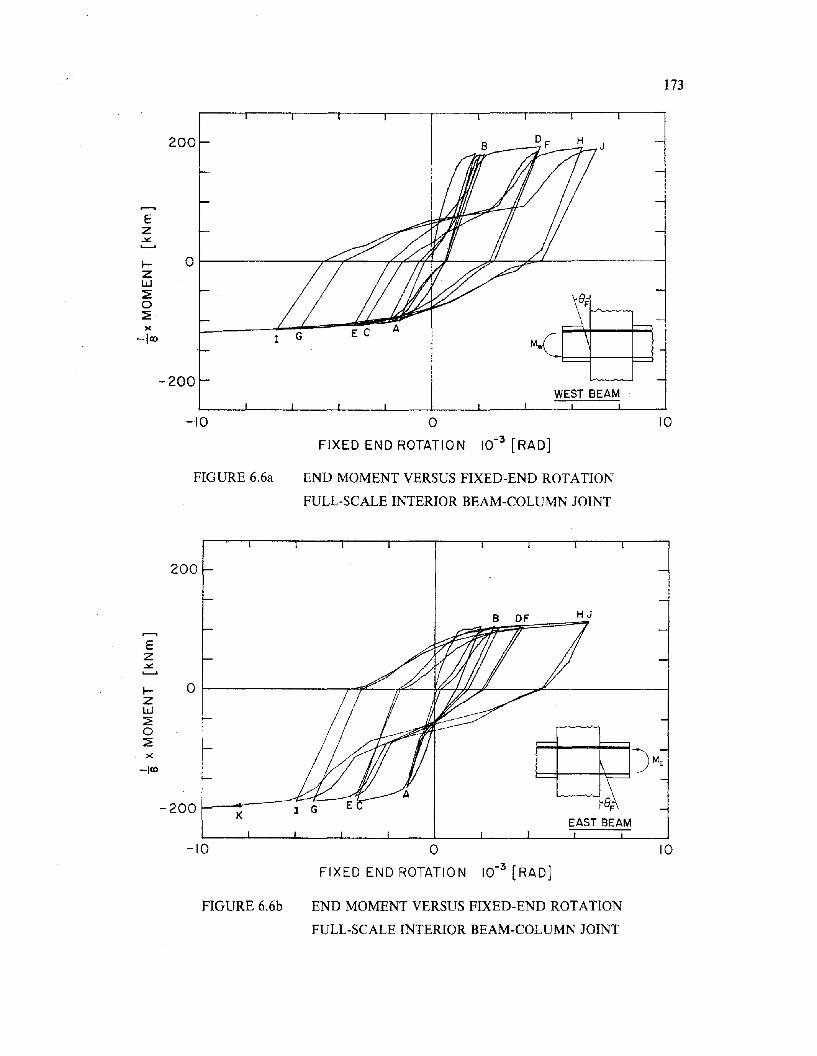
173
Ez~
Izw~o~)(
-IIX)
200 H J
-200WEST BEAM
-10 oFIXED END ROTATION 10-3 [RAD]
10
FIGURE 6.6a END MOMENT VERSUS FIXED-END ROTATION
FULL-SCALE INTERIOR BEAM-COLUMN JOINT
200
10
HJ
~~r~EAST BEAM
oFIXED END ROTATION 10-3 [RAD]
Ez~
'--'
I- 0ZW~0~)(
-IIX)
-200K
-10
FIGURE 6.6b END MOMENT VERSUS FIXED-END ROTATION
FULL-SCALE INTERIOR BEAM-COLUMN JOINT
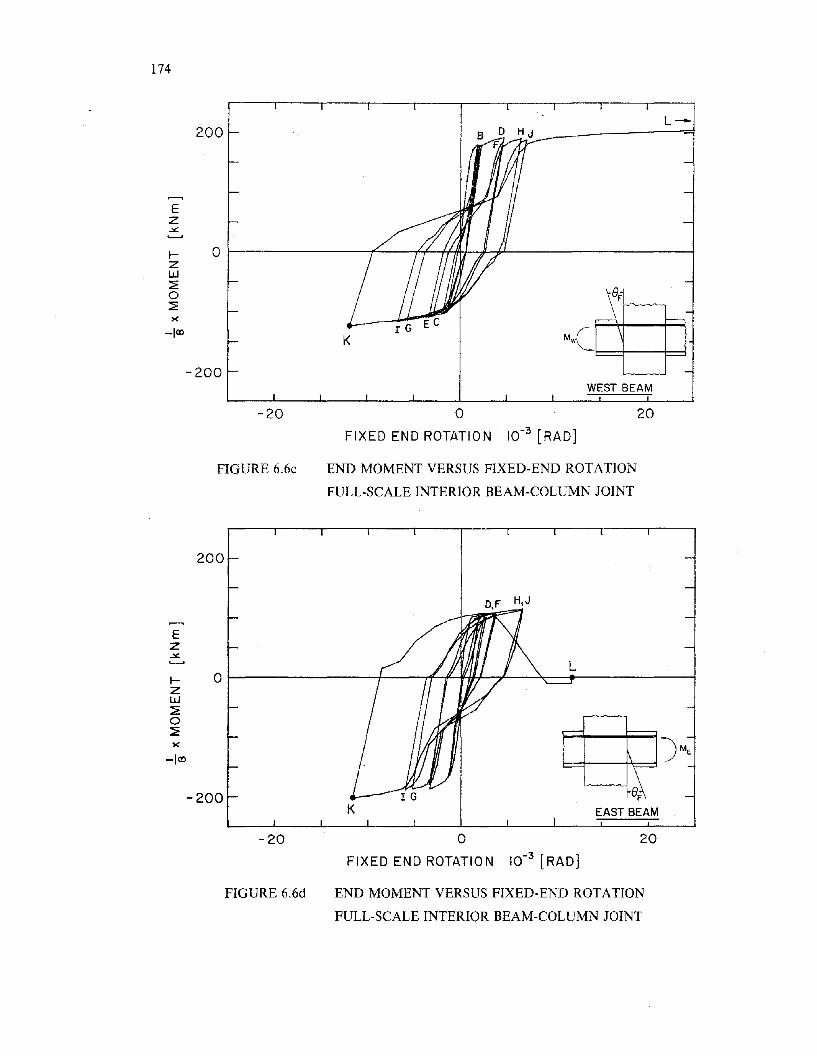
174
200
Ez.>£
f- 0zw~0~
><-ICD
K
-200WEST BEAM
-20 oFIXED END ROTATION 10-3 [RAD]
20
FIGURE 6.6c END MOMENT VERSUS FIXED-END ROTATION
FULL-SCALE INTERIOR BEAM-COLUMN JOINT
200
Ez.>£
f- 0ZW~0~
><-ICD
-200
-20
FIGURE 6.6d
D,F H,J
~.........wr~K EAST BEAM
o 20
FIXED END ROTATION 10-3 [RAD]
END MOMENT VERSUS FIXED-END ROTATION
FULL-SCALE INTERIOR BEAM-COLUMN JOINT
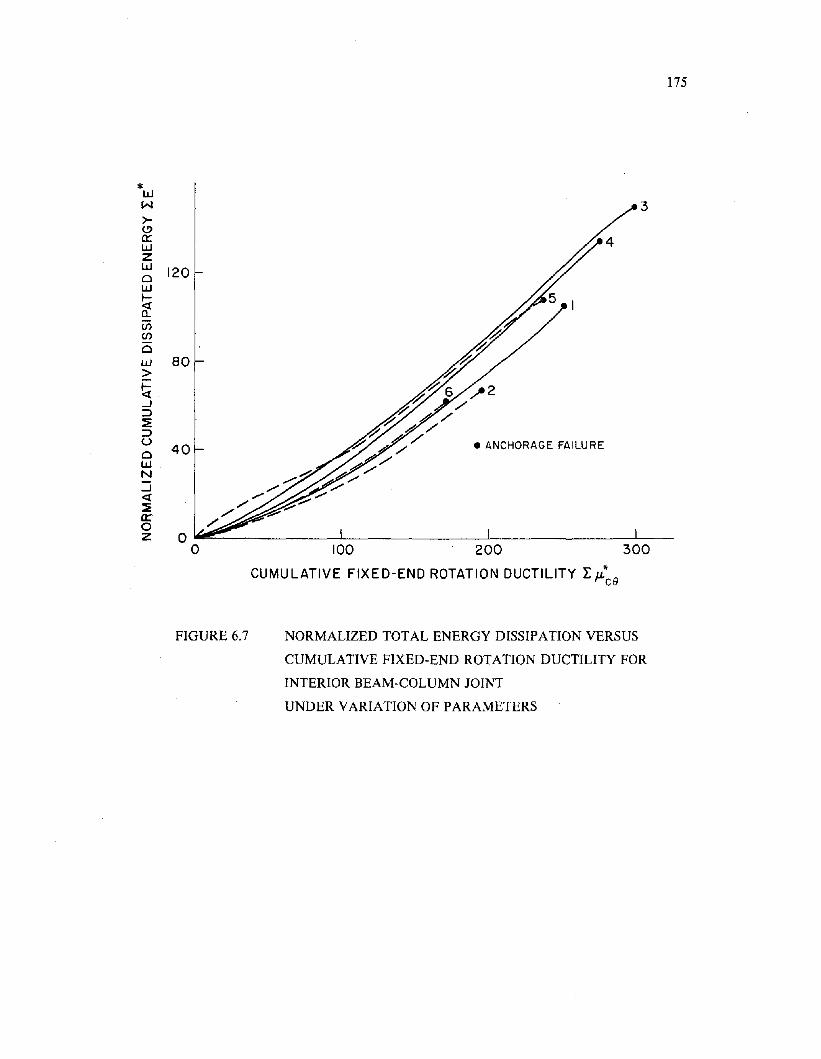
175
100 200 300
CUMU LATIVE FIXED-END ROTATION DUCTILITY r. j.L*ce
3
• ANCHORAGE FAILURE
*ww>C>0::WZw 120ow
~v;C/)
ow 80>~-J:::>~:::>u 40oWN:Jc:r~croZ 0-='--------'---------1-----------'---o
FIGURE 6.7 NORMALIZED TOTAL ENERGY DISSIPATION VERSUS
CUMULATIVE FIXED-END ROTATION DUCTILITY FOR
INTERIOR BEAM-COLUMN JOINT
UNDER VARIATION OF PARAMETERS

177
EARTHQUAKE ENGINEERING RESEARCH CENTER REPORTS
NOTE: Numbers in parentheses are Accession Numbers assigned by the National Technical Information Service; these arefollowed by a price code. Copies of the reports may be ordered from the National Technical Information Service, 5285Port Royal Road, Springfield, Virginia, 22161. Accession Numbers should be quoted on orders for reports (PB --- ---)and remittance must accompany each order. Reports without this information were not available at time of printing.The complete list of EERC reports (from EERC 67-1) is available upon request from the Earthquake Engineering ResearchCenter, University of California, Berkeley, 47th Street and Hoffman Boulevard, Richmond, California 94804.
UCB/EERC-77/01 "PLUSH - A Computer Program for Probabilistic Finite Element Analysis of Seismic Soil-Structure Interaction," by M.P. Romo Organista, J. Lysmer and H.B. Seed - 1977 (PBSl 177 65l)A05
UCB/EERC-77/02 "Soil-Structure Interaction Effects at the Humboldt Bay Power Plant in the Ferndale Earthquake of June7, 1975," by J.E. Valera, H.B. Seed, C.F. Tsai and J. Lysmer - 1977 (PB 265 795)A04
UCB/EERC-77/03 "Influence of Sample Disturbance on Sand Response to Cyclic Loading," by K. Mori, H.B. Seed and C.K.Chan - 1977 (PB 267 352)A04
UCB/EERC-77/04 "Seismological Studies of Strong Motion Records," by J. Shoja-Taheri - 1977 (PB 269 655)AIO
UCB/EERC-77/05 Unassigned
UCB/EERC-77/06 "Developing Methodologies for Evaluating the Earthquake Safety of Existing Buildings," by No.1 -B. Bresler; No.2 - B. Bresler, T. Okada and D. Zisling; No.3 - T. Okada and B. Bresler; No.4 - V.V.Bertero and B. Bresler - 1977 (PB 267 354)A08
UCB/EERC-77/07 "A Literature Survey - Transverse Strength of Masonry Walls," by Y. ornote, R.L. Mayes, S.W. Chen andR.W. Clough - 1977 (PB 277 933)A07
UCB/EERC-77/08 "DRAIN-TABS: A Computer Program for Inelastic Earthquake Response of Three Dimensional Buildings," byR. Guendelman-!srael and G.H. Powell - 1977 (PB 270 693)A07
UCB/EEP.c-77/09 "SUBWALL:· A Special Purpose Finite Element Computer Program for Practical Elastic Analysis and Desig:1of Structural Walls with Substructure Option," by D.Q. Le, H. Peterson and E.P. Popov - 1977(PB 270 567)AOs
UCB/EERC-77/10 "Experimental Evaluation of Seismic Design Methods for Broad Cyli:1drical Tanks," by D.P. Clough(PB 272 280)A13
UCB/EERC-77/ll "Earthquake Engineering Research at Berkeley'- 1976," - 1977 (PB 273 s07)A09
UCB/EERC-77/12 "Automated Design of Earthquake Resistant Multistory Steel Building Frames," by N.D. Walker, Jr. - 1977(PB 276 526) A09
UCB/EERC-77/13 "Concrete Confined by Rectangular Hoops Subjected to Axial Loads," by J. Vallenas, V.V. Bertero andE.P. Popov - 1977 (PB 275 l65)A06
UCB/EERC-77/14 "Seismic Strain Induced in the Ground During Earthquakes," by Y. Sugimura - 1977 (PB 284 201)A04
UCB/EERC-77/l5 Unassigned
UCB/EERC-77/l6 "Computer Aided Optimum Design of Ductile Reinforced Concrete Moment Resisting Frames," by S.W.Zagajeski and V.V. Bertero - 1977 (PB 280 137)A07
UCB/EERC-77/17 "Earthquake Simulation Testing of a Stepping Frame with Energy-Absorbing Devices," by J.M. Kelly andD.F. Tsztoo - 1977 (PB 273 506)A04
UCB/EERC-77/18 "Inelastic Behavior of Eccentrically Braced Steel Frames under Cyclic Loadings," by C. ~'/. Roeder andE.P. Popov - 1977 (PB 275 s261Als
UCB/EERC-77/19 "A Simplified Procedure for Estimating Earthquake- Induced Deformations in Dams and Embankments," by F. 1.Makdisi and H.B. Seed - 1977 (PB 276 820)A04
UCB/EERC-77/20 "The Performance of Earth Dams during Earthquakes," by H.B. Seed, F.I. Makdisi and P. de Alba - 1977(PB 276 821)A04
UCB/EER<;:-77/21 "Dynamic Plastic Analysis Using Stress Resultant Finite Element Formulation," by p. Lukkunapvasit andJ.M. Kelly - 1977 (PB 275 453)A04
UCB/EERC-77/22 "Preliminary Experimental Study of Seismic Uplift of a Steel Frame," by R.W. Clough and A.A. Huckelbridge1977 (PB 278 769)A08
UCB/EERC-77/23 "Earthquake Simulator Tests of a Nine-Story Steel Frame with Columns Allowed to Uplift," by A.."..Huckelbridge - 1977 (PB 277 944)A09
UCB/EERC-77/24 "Nonlinear Soil-Structure Interaction of Skew Highway Bridges," by M.-C. Chen and J. Penzien - 1977(PB 276 176)A07
UCB/EERC-77/25 "Seismic Analysis of an Offshore Structure Supported on Pile Foundations," by D.D.-N. Liou and J. Penzien1977 (PB 283 180)A06
UCB/EERC-77/26 "Dynamic Stiffness Matrices for Homogeneous Viscoelastic Half-Planes," by G. Dasgupta and A.K. Chopra 1977 (PB 279 554)A06
Preceding page blank
178
UCB/EERC-77 /27 "A Practical Soft Story Earthquake Isolation System," by J. M. Kelly, J. 01. Eidinger and C. J. Derham _1977 (PB 276 814)A07
CCB/EERC-77/28 "Seismic Safety of Existing Buildings and Incentives for Hazard Mitigation in San Francisoo: AnExploratory Study," by A.J. Meltsner - 1977 (PB 281 970)A05
VCB/EERC-,7/29 "Dynamic Analysis of Electrohydraulic Shaking Tables," by D. Rea, S. Abedi-Hayati and Y. Takahashl1977 (PB 282 569)A04
UCBjEERC-77/30 "An Approach for Improving Seismic - Resistant Behavior of Reinforced Concrete Interior Joints,1i byB. Galunic, V.V. Bertero and E.P. Popov - 1977 (PB 290 870)A06
UCE/EERC-78/01 "The Development of Energy-Absorbing Devices for Aseismic Base Isolation Systems," by .: .M. Kelly andD.F. Tsztoo - 1978 (PB 284 978)A04
UCB/EERC-78/02 IlEffect of Tensile Prestrain on the Cyclic Response of Structural Steel Connections I by J .G. Bouwkampand A. Mukhopadhyay - 1978
VCE/EERC-78/03 "Experimental Results of an Earthquake Isolation System using Natural Rubber Searings," by J.M.Eidinger and J.M. Kelly - 1978 (PB 281 686)A04
UCB/EERC-78/05
UCE/EERC-78/06
VCB/EERC-78/07
UCB/EERC-7S/08
UCB/EERC-78/09
UCB/EERC-78/10
UCB/EERC-78/ll
VCB/EERC-78/l2
TJCB/EERC-78/13
UCB/EERC-78/14
UCB/EERC-78/15
UCB/EERC-78/16
UCB/EERC-78/17
UCB/EERC-78/18
UCB/EERC-7 8/ 19
UCE/EERC-7 8/2 0
UCB/EERC-78/21
UCS/EERC-78/22
tiCB/EERC-78/23
UCB/EERC-78/24
UCB/EERC-78/25
"Seismic Behavior of Tall Liquid Storage Tanks," by A. Niwa - 1978 (PB 284 017)A14
lIHysteretic Behavior of Reinforced Concrete Colwnns Subjected t.o High Axial and Cyclic Shear ?o:cces, II
by S.W. Zagajeski, V.V. Bertero and J.G. Bouwkamp - 1978 (P8 283 858)A13
"Three Dimensional Inelastic Frame Elements for the ANSR-I Program, II by .n.. Riahi, D.G. Sow andG.H. Powell - 1978 (PB 295 755)A04
"Studies of Structural Res90nse to Earthquake Ground '·lotion," by O.A. Lopez and A.K. Chopra - 1978(P8 282 790)A05
"A Laboratory Study of the Fluid-Structure !nteractio:l of Submerged Tanks and Caissons in 'Sart::quakes,llby R.C. Byrd - 1978 (P8 234 957)A08
Unassigned
II·Seismic Performance of Nonstructural and Secondary Structural Elements," by I. Sai<.amoto - 1978(PB81 154 593)A05
I'~athematical t10delling of Hysteresis Loops :tor Reinforced Concrete Columns," by S. >lakata, T. Sprouland J. Penzien - 1978 (PB 298 274)A05
"Damageability in Existing Buildings," by T. BleJwas and B. Bresler - 1978 (PB 80 166 978)AOS
"Dynamic Behavior of a Pedestal Base Multistory Building, II by R.M. Stephen-, S.L. 1,'1i150n, J.G. Bou·.....kampand "I. Button - 1978 (P8 286 650) A08
"Seismic Response of Bridges - Case Studies," by R.A. Imbsen, V. Nutt and J. Penzien - 1978(PB 286 503)AIO
"A Substructure Technique for Nonlinear Static and Dynamic Analysis," by D.G. Rowand G.B. Powell 1978 (PS 288 077)AIO
IlSe ismic Risk Studies for San Francisco and for the Greater San Francisco Bay Area," by C.S. Oliveira 1978 {PB 81 120 115)A07
"Strength of Timber Roo f Connections Subj ected to Cyclic Loads," by P. Gulkan, R. L. :4ayes and R. fN.Clough - 1978 {HUD-OOO 1491)A07
"Response of K-Braced Steel Frame Models to Lateral Loads," by J.G. Bouwkamp, R.M. Stephen andE.P. Popov - 1978
"Rational Design MethrJds for Light Equipment in Structures Subjected to Ground Motion." byJ.L. Sackman and J.M. Kelly - 1978 (PB 292 357)A04
"Testing of a Wind Restraint for Aseismic Base Isolation," by J.M. Kelly and D.E. Chitty - 1978(PB 292 833) A03
"APOLLO - A Computer Program for the Analysis of Pore Pressure Ge!leration and Dissipation in HorizontalSand Layers During Cyclic or Earthquake Loading," by P.P. Martin and H.B. Seed - 1978 (PB 292 835)A04
"Optimal Design of an :::arthquake Isolation System," by M.A. Bhatti, K.S. Pister and E. Polak - 1978(PB 294 735)A06
"MASH - A Computer Program for the Non-Linear Analysis of Vertically Propagating Shear Waves inHorizontally Layered Deposits," by P.P. Martin and H.B. Seed - 1978 (PB 293 101)A05
"Investigation of the Elastic Characteristics of a Three Story Steel Frame Using System Identification,"by I. Kaya and H.D. McNiven - 1978 (PB 296 225)A06
"Investigation of the Nonlinear Characteristics of a Three-Storv Steel Frame Using SystemIdentification," by 1. Kaya and H.D. McNiven - 1978 (PB 301 363)A05
179
UCB/EERC-78/26 "Studies of Strong Ground Motion in Taiwan," by Y.M. Hsiung, B.A. Bolt and J. Penzien - 1978(PB 298 436)A06
UCB/EERC-78/27 "Cyclic Loading Tests of Masonry Single Piers: Volume 1 - Height to Width Ratio of 2," by P.A. Hidalgo,R.L. Mayes, H.D. McNiven and R.W. Clough - 1978 (PB 296 211)A07
UCB/EERC-78/28 "CyclLc Loading Tests of Masonry Single Piers: 'Iolume 2 - Height to Width Ratio of 1," by S.-W.J. Chen,P.A. Hidalgo, R.L. r~ayes, R.\'1. Clough and H.D. McNiven - 1978 (PB 296 212)A09
UCB/EERC-78/29 ".;nalytical ?rocedures in Soil Dynamics," by J. Lysmer - 1978 (PB 298 445)A06
UCB/EERC-79/0l "Hysteretic Behavior 0 f Lightweight Reinforced Concrete Beam-Col umn Subassernblages, " by B. Forzani,E.P. Popov and V.V. Bertero - April 1979(PB 298 267)~06
UCB/EERC-79/02 "The Development of a Mathematical Model to Predict the Flexural Response of Reinforced Concrete Beamsto Cyclic Loads, Using System Identification," by J. Stanton & H. McNiven - Jan. 1979(PB 295 875)AIO
UCB/EERC-79/03 "Linear and Nonlinear Earthquake Response of Simple Torsionally Coupled Systems," by C.L. Kan andA.K. Chopra - Feb. 1979(PB 298 262)A06
UCB/EERC-79/04 "A Mathematical Model of Masonry for Predicting its Linear Seismic Response Characteristics," byY. Mengi and H.D. McNiven - Feb. 1979(PB 298 266)A06
UCB/EERC-79/05 "Mechanical Behavior of Lightweight Concrete Confined by Different Types of Lateral Reinforcement,"by M.A. Manrique, V.V. Bertero and E.P. Popov - May 1979(PB 301 114)A06
UCB/EERC-79/06 "Static Tilt Tests of a Tall Cylindrical Liquid Storage Tank," by R.W. Clough and A. Niwa - Feb. 1979(PB 301 167) A06
UCB/EERC-79/07 "The Design of Steel Energy Absorbing Restrainers and Their Incorporation into Nuclear Power Plantsfor Enhanced Safety: Volume 1 - Summary Report," by P.N. Spenoer, V.F. Zackay, and E.R. Parker Feb. 1979(UCB/EERC-79/07)A09
UCB/EERC-79/08 "The Desig.n of Steel Energy Absorbing Restrainers and Their Inoorporation into Nuclear Power Plan,:sfor Enhanced Safety: Volume 2 - The Development of ?nalyses for Reactor System Piping, 1I"5ir:\ple SystemsJl
by roLe. Lee, J. Penzien, A.K. Chopra and K, Suzuki "Complex Systems" by G.H. Powell, E.L. Wilson,R.W. Clough and D.G. Row - Feb. 1979(UCB/EERC-79/08)~10
UCB/EERC-79/09 liThe Design of Steel Energy Absorbing Restrainers and Their IncorPJration into Nuclear Pcwer Plantsfor Enhanced Safety: Volume 3 - Evaluation of Commercial Steels," by 'N.S. Owen, R.M.N. Pelloux,R.O. Ritchie, M. Faral, T. Ohhashi, J. ToploSKY, S.J. Hartman, V.F. Zackay and E.R. Parker -Feb. 1979 (UCB/EERC-79/09) A04
UCB/EERC-79/10 "The Design of Steel Energy Absorbing Restrainers and Their Incorporation into Nuclear Power Plantsfor Enhanced Safety: Volume 4 - .". Review of Energy-Absorbing Devices," by J .M. Kelly andM.S. Skinner - Feb. 1979(UCB/EERC-79/10)A04
OCB/EERC-79/11 "Conservatism In Summation Rules for Closely Spaced Modes," by J. M. Kelly and J. L. Sackman - May1979(PB 301 328)A03
UCB/EERC-79/12 "Cyclic Loading Tests of ~lasonry Single Piers; Volume 3 - Height to Width Ratio of 0.5," byP.A. Hidalgo, R.L. Mayes, H.D. McNiven and R.W. Clough - May 1979(PB 301 321)A08
UCB/EERC-79/13 "Cyclic Behavior 0 f Dense Course-Grained Materials in Relation to the Seismic S tabili ty of Dams," byN.G. Banerjee, H.B. Seed and C.K. Chan - June 1979(PB 301 373)A13
UCB/EERC-79/14 "Seismic Behavior of Reinforced Concrete Interior Beam-Column Subassernblages," by S. Viwathanatepa,E.P. Popov and V.V. Sertero - June 1979(PB 301 326)AIO
OCB/EERC-79/15 "Optimal Design of Localized Nonlinear Systems '''ith Dual Performance Criteria Under EarthquakeExcitations," by M.A. Bhatti - July 1979 (PB 80 167 109) A06
UCB/EERC-79/16 "OPTDYN - A General Purpose Optimization Proqram for Problems wi th or wi. thout Dynamic Constraints,"by M.A. Bhatti, E. Polak and K.S. Pister - July 1979(PB 80 167 091)A05
UCB/EERC-79/17 "ANSR-II, Analysis of Nonlinear Structural Response, Users Manual," by D.P. Mondkar and G.H. PowellJuly 1979(PB 80 113 301)A05
UCB/EERC-79/18 "Soil Structure Interaction in Different Seismic Environments," A. Gomez-Masso, J. Lysmer, J. -C. Chenand H.B. Seed - August 1979(PB 80 101 520)A04
UCB/EERC-79/19 "ARMA M::ldels for Earthquake Ground Motions," by M.K. Chang, J.W. Kwiatkowski, R.F. Nau, R.M. Oliverand K.S. Pister - July 1979(PB 301 166)A05
UCB/EERC-79/20 "Hysteretic Behavior of Reinforced Concrete Structural Walls," by J.M. Vallenas, V.V. Bertero andE.P. Popov - August 1979(PB 80 165 905)Al2
UCB/EERC-79/21 "Studies on High-Frequency Vibrations of Buildings - 1: The Column Effect," by J. Lubliner - August 1979(PB 80 158 553)A03
UCB/EERC-79/22 "Effects of Generalized Loadings on Bond Reinforcing Bars Embedded in Confined COncrete Blocks," byS. Viwathanatepa, E.P. Popov and V.V. Bertero - August 1979(PB 81 124 018)A14
UCB/BERC-79/23 "Shaking Table Study of Single-Story Masonry Houses, Volume 1 : Test Structures 1 and 2, " by P. Gclkan,R.L. Mayes and R.W. Clough - Sep~. 1979 (HUD-OOO 1763)1'.12
UCB/EERC-79/24 "Shaking Table Study of Single-Story Masonry Houses, Volume 2 : Test Structures 3 and 4, " by P. GUlkan,R.L. Mayes and R.W. Clough - Sept. 1979 (HUD-OOO 1836) A12
UCB/EERC-79/25 "Shaking Table Study of Single-Story Masonry Houses, Volume 3: Summary, Conclusions and Recommendations,"by R.W. Clough, R.L. Mayes and P. Gulkan - Sept. 1979 (HOD-OOO 1837)A06
180
UCB/EERC-79/26 "Recommendations tor a U.S. -Japan Cooperative Research Program Utilizing Large-Scale Testing Facilities ,"by U.S.-Japan Planning Group - Sept. 1979(PB 301 407)A06
UCB/EERC-79/27 "Earthquake-Induced Liquefaction Near Lake Amatitlan, Guatemala," by H.B. Seed, I. Arango, C.K. Chan,A. Gomez-Masso and R. Grant de .~co1i - Sept. 1979(NUREG-CR1341)A03
UCB/EERC-79/28 "Intil1 Panels: Their Influence on Seismic Response of Buildings," by J. W. Axley and V. V. BerteroSept. 1979(PB 80 163 37l)AlO
UCB/EERC-79/29 "3D Truss Bar Element (Type 1) for the i\NSR-II Program," by D.P. Mondkar and G.H. Powell - Nov. 1979(PB 80 169 709)A02
"2D Beam-Column Element (Type 5 - Parallel Element Theory) for the ANSR-II Program, " by D.G. Row I
G.H. Powell and D.P. Mondkar - Dec. 1979(PB 80 167 224) A03
"3D Beam-Column Element (Type 2 - Parallel Element Theory) for the ANSR-II Program, " by A. :liahi,G.H. Powell and D.P. Mondkar - Dec. 1979(PB 80 167 216) A03liOn Response of Structures to Stationary Excitation, II by A. Der Kiureghian - Dec. 1979 (PB 80166 929) A03UCB/EERC-79/32
UCB/EERC-79/33 "Undisturbed Sampling and Cyclic Load Testing of Sands," by S. Singh, H.B. Seed and C.K. C:'anDec. 1979(ADA 087 298)A07
UCB/EERC-79/30
UCB/EERC-79/31
UCB/EERC-79/34 "Interaction Effects of Simultaneous Torsional and Compress ional Cyclic Loading 0 f Sand," byP.M. Griffin and W.N. Houston - Dec. 1979(ADA 092 352)A15
UCS/EEF.C-80/01 "Earthquake Response of Concrete Gravity Dams Including Hydrodynamic and Foundation InteractionEffects," ~y A.K. Chopra, P. Chakrabarti and S. Gupta - Jan. 1980IAD-A087297)A10
UCB/EERC-80/02 "Rocking Response of Rigid Blocks to Earthquakes," by C.S. Yim, A.K. Chopra and J. Penzien - Jan. 1980IPB80 166 002)A04
l'CB/EERC-80/03 "Optimum Inelastic Design 0 f Seismic-Resistant Reinforced Concrete Frame Structures," by S. 'N. Zagaj eskiand V.V. Bertero - Jan. 1980(PB80 164 635)A06
UCB/EERC-80/04 "Effects of Amount and Arrangement of \;all-Panel Reinforcement on Hysteretic Behavior of ReinforcedConcrete Walls," by R. Iliya and V.V. Bertero - Feb. 1980(PB81 122 5251A09
UCB/EERC-80/05 "Shaking Table Research On concrete Darn ~'lodels," by A. Niwa and R.\;. Clough - Sept. 1980(PB81122 368)A06
UCB/EERC-80/06 "The Design of Steel Energy-Absorbing Restrainers and their Incorporation into Nuclear Power Plants forEnhanced Safety (VoilA): Piping with Energy Absorbing Restrainers: Parameter Study on Small Systems,"by G.H. Powell, C. Oughourlian and J. Simons.- June 1980
UCB/EERC-80/07 "Inelastic Torsional Response of Structures Subjected to Earthquake Ground Motions," by Y. YamazakiApril 1980(PB8l 122 327)A08
UCB/EERC-80/08 "Study of X-Braced Steel Frame Structures Under Earthquake Simulation," by Y. Ghanaat - April 1980(PB81 122 335)All
UCB/EERC-80/09 "Hybrid Modelling of Soil-Structure Interaction," by S. Gupta, T.W. Lin, J. Penzien and C.S. YehMay 1980(PB81 122 319)A07
UCB/EERC-80/10 "General Applicability of a Nonlinear Model of a One Story Steel Frame," by B.1. Sveinsson andH.D. McNiven - 11ay 1980(PB81 124 877)A06
UCB/EERC-80/1l "A Green-Function Method for Wave Interaction with a Submerged Body," by 'N. Kioka - April 1980IPB81 122 269)A07
UCB/EERC-80/12 "Hydrodynamic Pressure and Added ~1ass for Axisynunetric Bodies," by F. Nilrat - 11ay 1980lPB81 122 343)1'.08
UCB/EERC-80/l3 "Treatment of Non-Linear Drag Forces Acting on Offshore Platforms," by B.V. Dao and J. PenzienMay 1980(PB81 153 413)A07
UCB/EERC-80/14 "2D Plane/Axisynunetric Solid Element (Type 3 - Elastic or Elastic-?erfectly Plastic) for the ANSR-IIProgram," by D.P. Mondkar and G.H. Powell - July 1980(PB81 122 350)A03
UCB/EERC-80/15 "A Response Spectrum Method for Random Vibrations," by A. Der Kiureghian - June 1980 (PB81122 301) A03
UCB/EERC-80/16 "Cyclic Inelastic Buckling of Tubular Steel Braces," by V..n.. Zayas, E.P. Popov and S .A. l1ahinJune 1980(PB81 124 885)AIO
UCB/EERC-80/17 "Dynamic Response of Simple Arch Dams Including Hydrodynamic Interaction," by C.S. Porter andA.K. Chopra - July 1980(PB81 124 000)A13
UCB/EERC-80/18 "Experimental Testing of a Friction Damped Aseismic Base Isolation System with Fail-SafeCharacteristics," by J.M. Kelly, K.E. Beucke and M.S. Skinner - July 1980(PB81 148 595)A04
UCB/EERC-80/19 "The Design of Steel Energy-Absorbing Restrainers and their Incorporation into Nuclear Power Plants forEnhanced safety (Vol IB): Stochastic Seismic Analyses of Nuclear Power Plant Structures and PipingSystems Subjected to Multiple Support Excitations," by M.C. Lee and J. Penzien - June 1980
UCB/EERC-80/20 "The Design of Steel Energy~.'<bsorbing Restrainers and their Incorporation into Nuclear Power Plantsfor Enhanced Safety (Vol lC): Numerical Method for Dynamic Substructure Analysis," by J.M. Dickensand E.L. Wilson - June 1980
UCB/EERC-80/2l "The Design of Steel Energy-Absorbing Restrainers and their Incorporation into Nuclear Power Plantsfor Enhanced Safety (Vol 2): Development and Testing of Restraints for Nuclear Piping Systems," byJ.M. Kelly and M.S. Skinner - June 1980
UCB/EERC-80/22 "3D Solid Element (Type 4-Elastic or E1astic-perfectly-Plastic) for the ANSR-II Program," byD.P. Mondkar and C.H. Powell - July 1980(P881 123 242)A03
UCB/EERC-80/23 "Gap-Friction Element (Type 5) for the ANSR-II Program," by D.P. !'londkar and G.H. Powell - July ISBO(PB81 122 285)A03
181
UCB/EERC-80/24 "U-Bar Restraint Element (Type 11) for the ANSR-II Program," by C. Oughourlian and G.H. PowellJuly 1980(PB81 122 293)A03
UCB/EERC-80/25 "Testing of a Natural Rubber Base Isolation System by an Explosively Simulated Earthquake," byJ.M. Kelly - August 1980(PB81 201 360)A04
UCB/EERC-80/26 "Input Identification from Structural Vibrational Response," by Y. Hu - August 1980(PB8l 152 308)A05
UCB/EERC-80/27 "Cyclic Inelastic Behavior of Steel Offshore Structures," by V.A. Zayas, S.A. Mahin and E.P. PopovAugust 1980(PB81 196 180)A15
UCB/EERC-80/28 "Shaking Table Testing of a Reinforced Concrete Frame '"ith Biaxial Response," by M. G. OlivaOctober 1980(PB81 154 304)AIO
UCB/EERC-80/29 "Dynamic Properties of a Twelve-Story Prefabricated Panel Building," by J.G. Bouwkamp, J.P. Kolleggerand R.M. Stephen - October 1980(PB82 117 128)A06
UCB/EERC-80/30 "Dynamic Properties of an Eight-Story Prefabricated Panel Building," by J.G. Bouwkamp, J.P. Kolleggerand R.M. Stephen - October 1980(PB81 200 313)A05
UCB/EERC-80/31 "Predictive Dynamic Response of Panel Type Structures Under Earthquakes," by J.P. Kollegger andJ.G. Bouwkamp - OCtober 1980(PB81 152 316)A04
UCB/EERC-80/32 "The Design of Steel Energy-Absorbing Restrainers and their Incorporation into Nuclear Power Plantsfor Enhanced Safety (Vol 3): Testing of Commercial Steels in Low-Cycle Torsional Fatigue." byP. ~~r~r.~r, E.R. Parker, E. Jongewaard and M. Drory
UCB/l::ERC-80/33 "Th" Design of Steel Energy-Absorbing Restrainers and their Incorporation into Nuclear Power Plantsfor Enhanqed Safety (Vol 4): Shaking Table Tests of Piping Systems with Energy-Absorbing Restrainers,"by S.F. Stiemer and W.G. Godden - Sept. 1980
UCB/EERC-80/34 "The Design of Steel Energy-Absorbing Restrainers and their Incorporation into Nuclear Power Plantsror Enhanced Safety (Vol 5): Summary Report," by P. Spencer
UC3/EERC-80/35 "Experimental Testing of an Energy-Absorbing Base Isolation System," by J.I·\. Kelly, 11.5. Skinner andK.E. Beucke - October 1980(PB81 154 072)A04
UCB/EERC-80/36 "Simulating and Analyzing Artificial Non-Stationary Earthquake Ground Motions," by R.F. Nau, R.M. Oliverand K.S. Pister - October 1980(PB81 153 397)A04
UCB/EERC-80/37 "Earthquake Engineering at Berkeley - 1980," - Sept. 1980(PB81 205 874)A09
UCB/EERC-80/38 "Inelastic seismic Analysis of Large Panel Buildings," by V. Schricker and G. H_ Powell - Sept. 1980(PB81 154 338)A13
UCB/EERC-80/39 "Dynamic Response of Embankment, Concrete-Gravity and Arch Dams Including Hydrodynamic Interaction,"by J.F. Hall and A.K. Chopra - October 1980(PB81 152 324)All
UCB/EERC-80/40 "Inelastic Buckling of Steel struts Under Cyclic IDad Reversal," by R.G. Black, W.A. Wenger andE.P. Popov - October 1980(PB81 154 312)A08
UCB/EERC-80/41 "Influence of Site Characteristics on Building Damage During the October 3, 1974 Lima Earthquake," byP. Repetto, I. Arango and H.B. Seed - Sept. 1980(PB8l 161 739)A05
UCB/EERC-80/42 "Evaluation of a Shaking Table Test Program on Response Behavior of a ~"o Story Reinforced ConcreeeFrame," by J.M. Blondet, R.W. Clough and S.A. Mahin
UCB/E,ERC-aO/43 "11odelling of Soil-Structure Interaction by Finite and Infinite Elements." by F. !1edina December 1980(PB81 229 270)A04
UCB/EERC-81/01 "Control of Seismic Response of Piping Systems and Other Structures by Base Isolation," edited by J.M.Kelly - January 1981 (PB81 200 735)A05
UCB/EERC-81/02 "OPTNSR - An Interactive Software System for Optimal Design of Statically and Dynamically LoadedStructures with Nonlinear Response," by M.A. Bhatti, V. Ciampi and K.S. Pister - January 1981(PB81 218 851)A09
UCB/EERC-81/03 "Analysis of IDeal Variations in Free Field Seismic Ground Motions," by J.-C. Chen, J. Lysmer and H.B.Seed - January 1981 (AD-A099508)A13
UCB/EERC-81/04 "Inelastic Structural Modeling of Braced Offshore Platforms for Seismic Loading," by V.A. Zayas,P.-S.B. Shing, S.A. Mahin and E.P. Popov - January 1981(PB82 138 777)A07
UCB/EERC-81/05 "Dynamic Response of Light Equipment in Structures," by A. Der Kiureghian, J.L. Sackman and B. NourOmid - April 1981 (PB81 218 497)A04
UCB/EERC-81/06 "Preliminary Experimental Investigation of a Broad Base Liquid Storage Tank," by J.G. Bouwkamp, J.P.Kollegger and R.M. Stephen - May 1981(PB82 140 385)A03
UCB/EERC-81/07 "The Seismic Resistant Design of Reinforced Concrete Coupled Structural Walls," by A.E. Aktan and V.V.Bertero - June 1981(PB82 113 358)All
UCB/EERC-81/08 "The Undrained Shearing Resistance of Cohesive Soils at Large Deformations," by M.R. Pyles and H.B.Seed - kugust 1981
UCB/EERC-81/09 "Experimental Behavior of a Spatial Piping System with Steel Energy Absorbers Subjected to a SimulatedDifferential Seismic Input," by S.F. Stiemer, \'I.G. Godden and J.M. Kelly - July 1981
182
UCB!EERC-81!10 "Evaluation of Seismic Design Provisions for Masonry in the United States," by B.I. Sveinsson, R.L.Mayes and H.D. McNiven - August 19S1
UCB!EERC-81!11 "Two-Dimensional Hybrid Modelling of Soil-Structure Interaction," by T.-J. Tzong, S. Gupta and J.Penzien - August 1981(PB82 142 118)A04
UCB!EERC-81!12 "Studies on Effects of Infills in Seismic Resistant R!C Construction," by S. Brokken and V. 'I. 3ertero September 1981
UCB/EERC-81/13 "Linear Models to Predict the Nonlinear Seismic Behavior of a One-Story Steel Frame," by H. Valdimarsson,A.H. Shah and H.D. McNiven - September 1981(PB82 138 793)A07
UCB/EERC-81/14 "TLUSH: A Computer Program for the Three-Dimensional Dynamic Analysis of Earth Dams," by T. Kagawa,L.H. Mejia, H.B. Seed and J. Lysmer - September 1981(PB82 139 940)A06
UCB/EERC-Sl/15 "Three Dimensional Dynamic Response Analysis of Earth Dams," by L.H. Mejia and H.B. Seed - September 1981(PBS2 137 274)A12
UCB/EERC-81/l6 "Experimental Study of Lead and Elastomeric Dampers for Base Isolation Systems," by J.M. Kelly andS.B. Hodder - October 1981 (PBS2 166 l82)A05
UCB/EERC-81/17 "The Influence of Base Isolation on the Seismic Response of Light secondary Equipment," by J.M. Kelly April 1981 (PB82 255 266)A04
UCB/EERC-81/18 "Studies on Evaluation of Shaking Table Response Analysis Procedures," by J. Marcial Blondet - November1981 (PB82' 197 278)AlO
UCB/EERC-81/19 "DELIGHT.STRUCT: A Computer-Aided Design Environment for Structural Engineering," by R.J. Balling,K.S. Pister and E. Polak - December 1981 {PB82 218 496)A07
UCB/EERC-Sl/20 "Optimal Design of Seismic-Resistant Planar Steel Frames," by R.J. Balling, V. Ciampi, K.S. Pister andE. Polak - December 1981 {PB82 220 l79)A07
UCB/EERC-82/0l "Dynamic Behavior of Ground for Seismic Analysis of Lifeline systems," by T. Sato and A. Der KiureqhianJanuary 1982 {PB82 218 926)AOS
UCB/EERC-82/02 "Shaking Table Tests of a Tubular steel Frame Model,~ by Y. Ghanaat and R. W. Clough - January 1982{PB82 220 l6l)A07
UCB/EERC-82/03 "Experimental Behavior of a Spatial Piping System with Shock Arrestors and Energy Absorbers underSeismic Excitation," by S. schneider, H.-M. Lee and G. W. Godden - May 1982
UCB/EERC-82/04 "New Approaches for the Dynamic Analysis of Large Structural systems," by E. L. Wilson - June 1982{PB83 148 080)AOS
UCB/EERC-82/05 "Model Study of Effects of Damage on the Vibration Properties of Steel Offshore Platforms," byP. Shahrivar and J. G. Bouwkamp - June 1982
UCB/EERC-82/06 "States of the Art and Practice in the optimum Seismic Design and Analytical Response Prediction ofRiC Frame-Wall Structures," by A. E. Aktan and V. V. Bertero - July 1982 {PB83 147 736)A05
UCB/EERC-82/07 "Further Study of the Earthquake Response of a Broad Cylindrical Liquid-Storage Tank Model," byG. C. Manos and R. W. Clough - July 1982 (PB83 -147 744) All
UCB/EERC-82/08 "An Evaluation of the Design and Analytical Seismic Response of a Seven Story Reinforced ConcreteFrame - Wall Structure," by F. A. Charney and V. V. Bertero - July 1982
UCB/EERC-82/09 "Fluid-Structure Interactions: Added Mass Computations for Incompressible Fluid," by J. S.-H. Kuo August 1982
UCB/EERC-82/l0 "Joint-opening Nonlinear Mechanism: Interface Smeared Crack Model," by J. S.-H. Kuo August 1982 (PB83 149 195)A05
UCB/EERC-82/l1 "Dyna-~c Response Analysis of Techi Dam," by R. W. Clough, R. M. Stephen and J. S.-H. Kuo August 19S2 (PB83 147 496)A06
UCB/EERC-82/l2 "Prediction of the Seismic Responses of P~C Frame-Coupled Wall Structures," by A. E. Aktan, V. V.Bertero and M. Piazza - August 1982 (PBS3 149 203~09
UCB/EERC-82/l3 "Preliminary Report on the SMART 1 Strong Motion Array in Taiwan," by B. A. Bolt, C. H. Loh, J.Penzien, Y. 8. Tsai and Y. T. Yeh - August 1982
UCB/EERC-82/14 "Shaking-Table Studies of an Eccentrically X-Braced Steel Structure," by M. S. Yang - September1982
UCB/EERC-82/l5 "The Performance of Stairways in Earthquakes," by C. Roha, J. W. Axley and V. V. Bertero - September1982
UCB!EERC-82/l6 "The Behavior of Submerged Multiple Bodies in Earthquakes," by W.-G. Liao - september 1982
183
UCB!EERC-82!17 "Effects of Concrete Types and Loading Conditions on Local Bond-Slip Relationships," by A. D. Cowell,E. P. Popov and V. V. Bertero - September 1982 (PB83 153 577)A04
UCB!EERC-82/18 "Mechanical Behavior of Shear Wall Vertical Boundary Members: An Experimental Investigation," byM. T. Wagner and V. V. Bertero - October 1982 (PB83 159 764)A05
UCB!EERC-82/19 "Experimental Studies of Multi-support Seismic Loading on Piping Systems," by J. M. Kelly andA. D. Cowell - November 1982
UCB/EERC-82/20 "Generalized Plastic Hinge Concepts for 3D Beam-ColUlt1I\ Elements." by P. F.-S. Chen and G. H. Powell November 1982
UCB/EERC-82/21 "ANSR-III: General Purpose Computer Program for Nonlinear Structural Analysis," by C. V. Oughourlianand G. H. Powell - November 1982
UCB/EERC-82/22 "Solution Strategies for Statically Loaded Nonlinear Structures," by J. W. Simons and G. H. Powell November 1982
UCB/EERC-82/23 "Analytical Model of Deformed Bar Anchorages under Generalized Excitations," by V. Ciampi, R.Eligehausen, V. V. Bertero and E. P. Popov - November 1982 (PB83 169 532)A06
UCB/EERC-82/24 "A Mathematical Model for the Response of Masonry Walls to Dynamic Excitations," by H. Sucuoglu,Y. Mengi and H. D. McNiven - November 1982 (PB83 169 Oll)A07
UCB/EERC-82/25 "Earthquake Response Considerations of Broad Liquid Storage Tanks," by F. J. Cambra - November 1982
UCB/EERC-82/26 "Computational Models for Cyclic Plasticity, Rate Dependence and Creep," by B. Mosaddad and G. H.Powell - November 1982
UCB/EERC-82/27 "Inelastic Analysis of Piping and Tubular Structures," by M. Mahasuverachai and G. H. Powell - November1982
UCB/EERC-83/0l "The Economic Feasibility of Seismic Rehabilitation of Buildings by Base Isolation," by J. M. Kelly January 1983
UCB/EERC-83/02 "Seismic Moment Connections for Moment-Resisting Steel Frames," by E. P. Popov - January 1983
UCB/EERC-83/03 "Design of Links and Beam-to-Column Connections for Eccentrically Braced Steel Frames," by E. P. Popovand J. O. Malley - January 1983
UCB/EERC-83/04 "Numerical Techniques for the Evaluation of Soil-Structure Interaction Effects in the Time Domain,"by E. Bayo and E. L. Wilson - February 1983
- UCB/EERC-83/0S "A Transducer for Measuring the Internal Forces in the Columns of a Frame-Wall Reinforced ConcreteStructure," by R. Sause and V. V. Bertero - May 1983
UCB/EERC-83/06 "Dynamic Interactions between Floating Ice and Offshore Structures," by P. Croteau - May 1983
UCB/EERC-83/07 "Dynamic Analysis of Multiply Tunnelled and Arbitrarily Eupported Secondary Systems;" by T. Igusaand A. Der Kiureghian - June 1983
UCB/EERC-83/01'l "A Laboratory study of SUbmerged Multi-body systems in Earthquakes," by G. R. Ansari - June 1983
UCB/EERC-83/09 "Effects of Transient Foundation Uplift on Earthquake Response of Structures," by C.-S. Yim andA. K. Chopra - June 1983
UCB/EERC-83/10 "Optimal Design of Friction-Braced Frames under Seismic Loading," by M, A. Austin and K, S. Pister June 1983
UCB/EERC-83/11 "Shaking Table study of Single-story Masonry Houses: Earthquake Performance under Three ComponentSimulated seismic Input and Recommendations," by G. C. Manos, R. w. Clough and R. L. Mayes -June 1983
UCB/EERC-83/12 "Experimental Error Propagation in Pseudodynamic Testing," by P. B. Shing and S. A. Mahin - June 1983
UCB!EERC-83/13 "Experimental and Analytical Predictions of the Mechanical Characteristics of a liS-scale Model of a7-story RIC Frame-Wall Building Structure," by A. E. Aktan, V. V. Bertero, A. A. Chowdhury andT. Nagashima - August 1983
UCB!EERC-83/14 "Shaking Table Tests of Large-Panel Precast Concrete Building System Assemblages." by M. G. Oliva andR. W. Clough - August 1983
UCB/EERC-83/15 "seismic Behavior of Active Beam Links in Eccentrically Braced Frames," by K. D. Hjelmstad and E. P.Popov - July 1983
184
UCB/EERC-83/16 "System Identification of Structures with Joint Rotation," byJ. S. Dimsdale and H. D. McNiven - July 1983
UCB/EERC-83/17 "Cons truction of Inel as ti c Response Spectra for Si ngl e-Degree-ofFreedom Systems", by S. Mahin and J. Lin -. July 1983
UCB/EERC-83/18 "Interactive Computer Analysis Methods for Predicting the InelasticCyclic Behavior of Sections," by S. Kaba and S. Mahin - July 1983
UCB/EERC-83/19 "Effects of Bond Deterioration on Hysteretic Behavior of ReinforcedConcrete Joints," by F. C. Filippou, E. P. Popov ,and V. V. BerteroAugust 1983